Zip Codes with the Highest Percentage of Population Employed in Architecture & Engineering in Olympia, WA
RELATED REPORTS & OPTIONS
Architecture & Engineering
Olympia
Compare Zip Codes
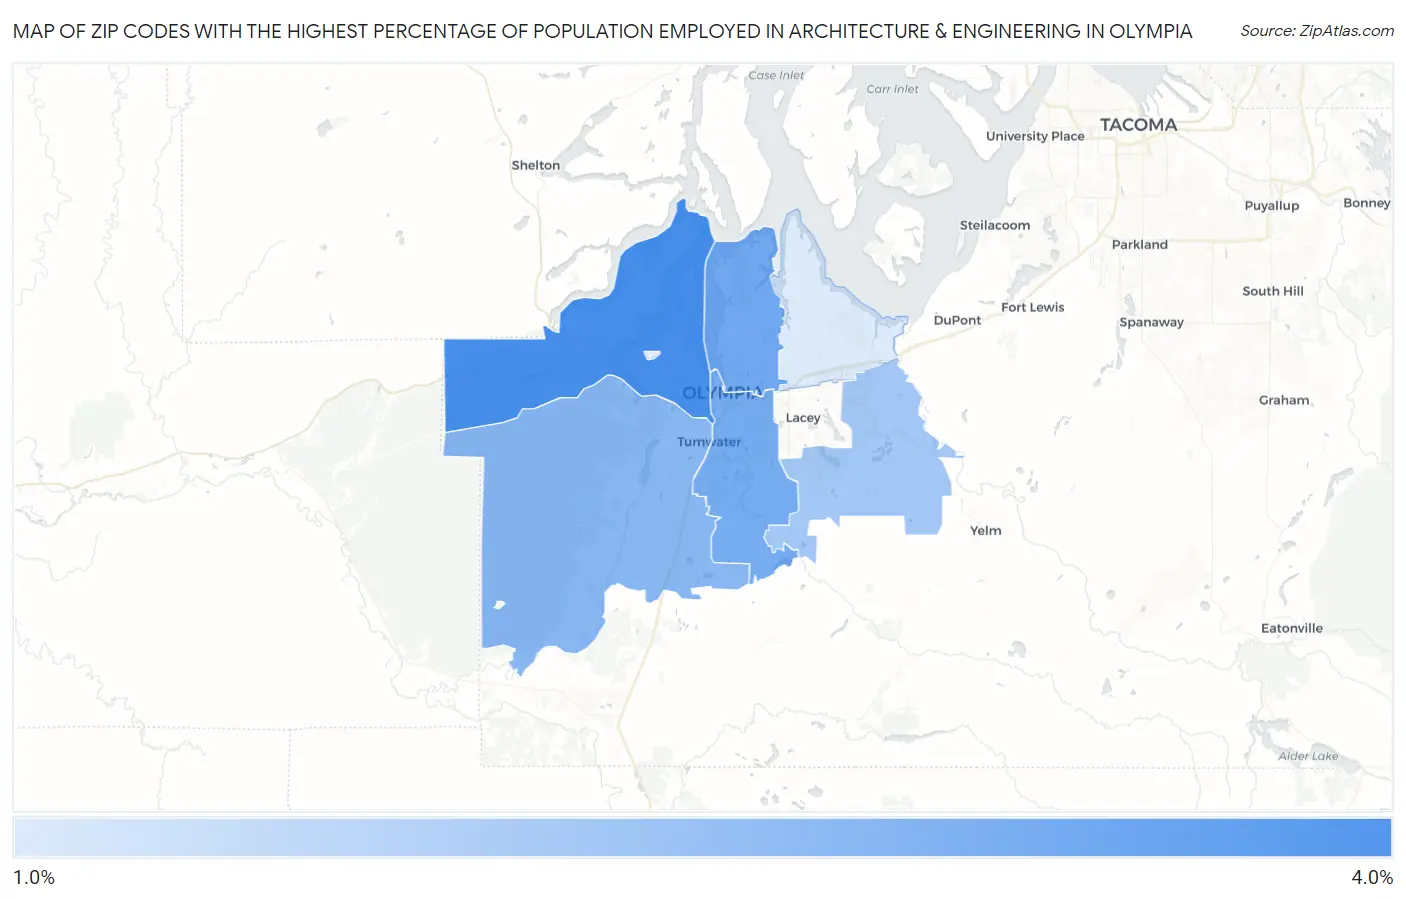
Map of Zip Codes with the Highest Percentage of Population Employed in Architecture & Engineering in Olympia
1.1%
3.4%
Zip Codes with the Highest Percentage of Population Employed in Architecture & Engineering in Olympia, WA
| Zip Code | % Employed | vs State | vs National | |
| 1. | 98502 | 3.4% | 2.8%(+0.575)#116 | 2.1%(+1.22)#4,026 |
| 2. | 98506 | 2.7% | 2.8%(-0.049)#161 | 2.1%(+0.593)#5,994 |
| 3. | 98501 | 2.7% | 2.8%(-0.138)#169 | 2.1%(+0.504)#6,351 |
| 4. | 98512 | 2.4% | 2.8%(-0.401)#189 | 2.1%(+0.241)#7,522 |
| 5. | 98513 | 2.0% | 2.8%(-0.819)#243 | 2.1%(-0.177)#9,784 |
| 6. | 98516 | 1.1% | 2.8%(-1.71)#333 | 2.1%(-1.06)#15,995 |
1
Common Questions
What are the Top 5 Zip Codes with the Highest Percentage of Population Employed in Architecture & Engineering in Olympia, WA?
Top 5 Zip Codes with the Highest Percentage of Population Employed in Architecture & Engineering in Olympia, WA are:
What zip code has the Highest Percentage of Population Employed in Architecture & Engineering in Olympia, WA?
98502 has the Highest Percentage of Population Employed in Architecture & Engineering in Olympia, WA with 3.4%.
What is the Percentage of Population Employed in Architecture & Engineering in Olympia, WA?
Percentage of Population Employed in Architecture & Engineering in Olympia is 2.8%.
What is the Percentage of Population Employed in Architecture & Engineering in Washington?
Percentage of Population Employed in Architecture & Engineering in Washington is 2.8%.
What is the Percentage of Population Employed in Architecture & Engineering in the United States?
Percentage of Population Employed in Architecture & Engineering in the United States is 2.1%.