Bethel, WA Map & Demographics
Bethel Map
Bethel Overview
$38,764
PER CAPITA INCOME
$80,865
AVG FAMILY INCOME
$80,897
AVG HOUSEHOLD INCOME
43.9%
WAGE / INCOME GAP [ % ]
56.1¢/ $1
WAGE / INCOME GAP [ $ ]
$14,426
FAMILY INCOME DEFICIT
0.36
INEQUALITY / GINI INDEX
4,220
TOTAL POPULATION
2,127
MALE POPULATION
2,093
FEMALE POPULATION
101.62
MALES / 100 FEMALES
98.40
FEMALES / 100 MALES
42.1
MEDIAN AGE
3.0
AVG FAMILY SIZE
2.7
AVG HOUSEHOLD SIZE
2,070
LABOR FORCE [ PEOPLE ]
58.4%
PERCENT IN LABOR FORCE
13.2%
UNEMPLOYMENT RATE
Income in Bethel
Income Overview in Bethel
Per Capita Income in Bethel is $38,764, while median incomes of families and households are $80,865 and $80,897 respectively.
| Characteristic | Number | Measure |
| Per Capita Income | 4,220 | $38,764 |
| Median Family Income | 1,233 | $80,865 |
| Mean Family Income | 1,233 | $93,283 |
| Median Household Income | 1,572 | $80,897 |
| Mean Household Income | 1,572 | $102,300 |
| Income Deficit | 1,233 | $14,426 |
| Wage / Income Gap (%) | 4,220 | 43.87% |
| Wage / Income Gap ($) | 4,220 | 56.13¢ per $1 |
| Gini / Inequality Index | 4,220 | 0.36 |
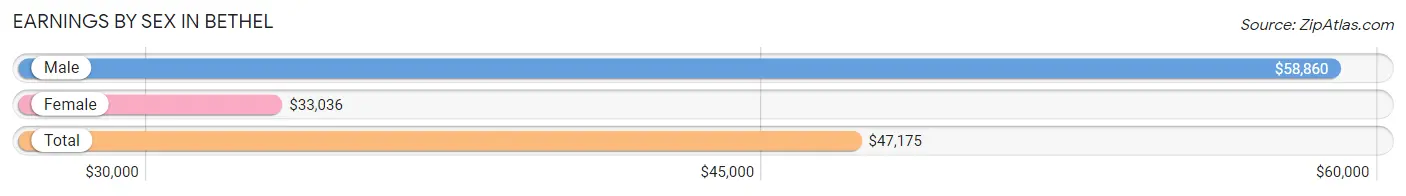
Earnings by Sex in Bethel
Average Earnings in Bethel are $47,175, $58,860 for men and $33,036 for women, a difference of 43.9%.
| Sex | Number | Average Earnings |
| Male | 1,107 (57.1%) | $58,860 |
| Female | 832 (42.9%) | $33,036 |
| Total | 1,939 (100.0%) | $47,175 |
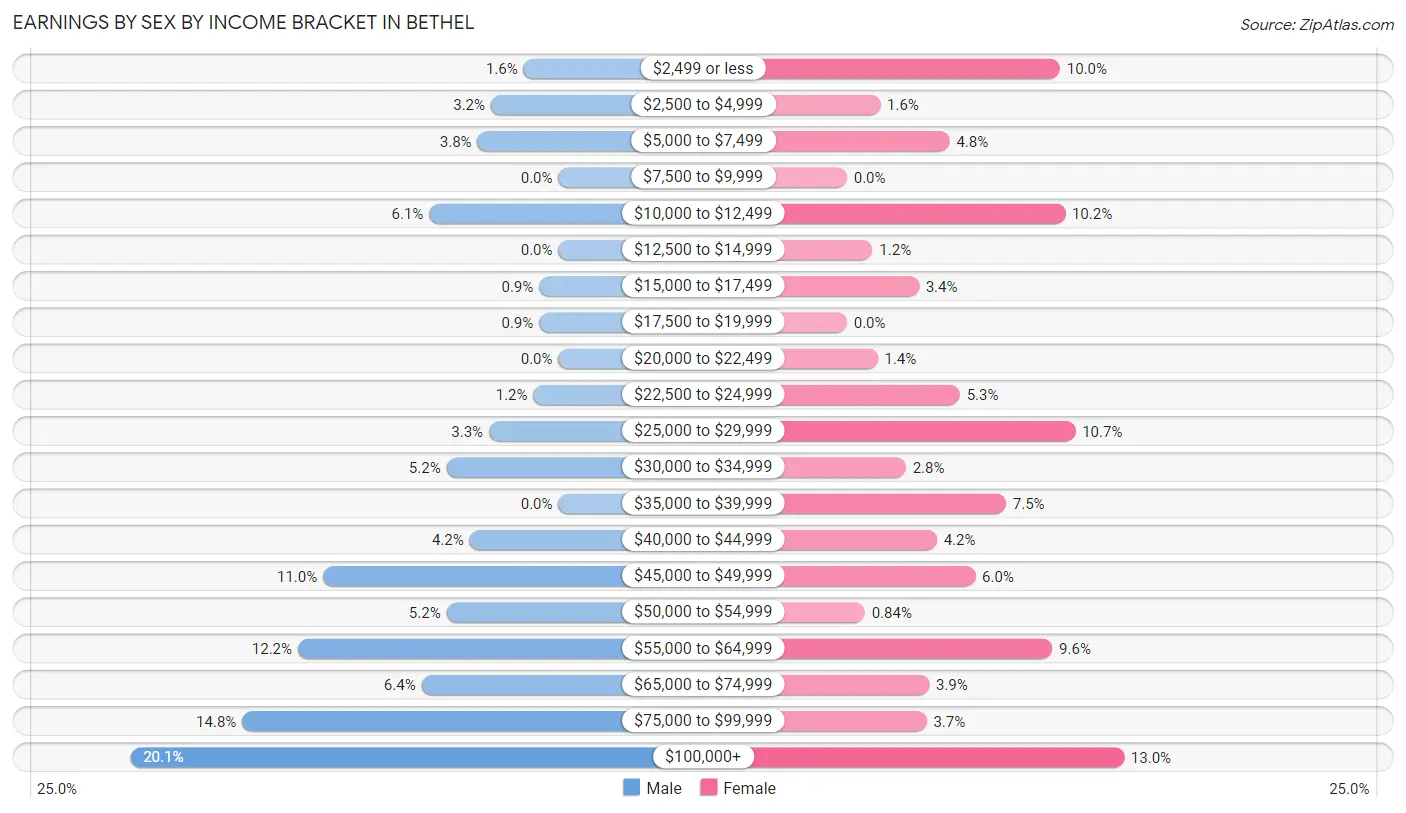
Earnings by Sex by Income Bracket in Bethel
The most common earnings brackets in Bethel are $100,000+ for men (222 | 20.1%) and $100,000+ for women (108 | 13.0%).
| Income | Male | Female |
| $2,499 or less | 18 (1.6%) | 83 (10.0%) |
| $2,500 to $4,999 | 35 (3.2%) | 13 (1.6%) |
| $5,000 to $7,499 | 42 (3.8%) | 40 (4.8%) |
| $7,500 to $9,999 | 0 (0.0%) | 0 (0.0%) |
| $10,000 to $12,499 | 67 (6.0%) | 85 (10.2%) |
| $12,500 to $14,999 | 0 (0.0%) | 10 (1.2%) |
| $15,000 to $17,499 | 10 (0.9%) | 28 (3.4%) |
| $17,500 to $19,999 | 10 (0.9%) | 0 (0.0%) |
| $20,000 to $22,499 | 0 (0.0%) | 12 (1.4%) |
| $22,500 to $24,999 | 13 (1.2%) | 44 (5.3%) |
| $25,000 to $29,999 | 36 (3.3%) | 89 (10.7%) |
| $30,000 to $34,999 | 58 (5.2%) | 23 (2.8%) |
| $35,000 to $39,999 | 0 (0.0%) | 62 (7.4%) |
| $40,000 to $44,999 | 46 (4.2%) | 35 (4.2%) |
| $45,000 to $49,999 | 122 (11.0%) | 50 (6.0%) |
| $50,000 to $54,999 | 58 (5.2%) | 7 (0.8%) |
| $55,000 to $64,999 | 135 (12.2%) | 80 (9.6%) |
| $65,000 to $74,999 | 71 (6.4%) | 32 (3.8%) |
| $75,000 to $99,999 | 164 (14.8%) | 31 (3.7%) |
| $100,000+ | 222 (20.1%) | 108 (13.0%) |
| Total | 1,107 (100.0%) | 832 (100.0%) |
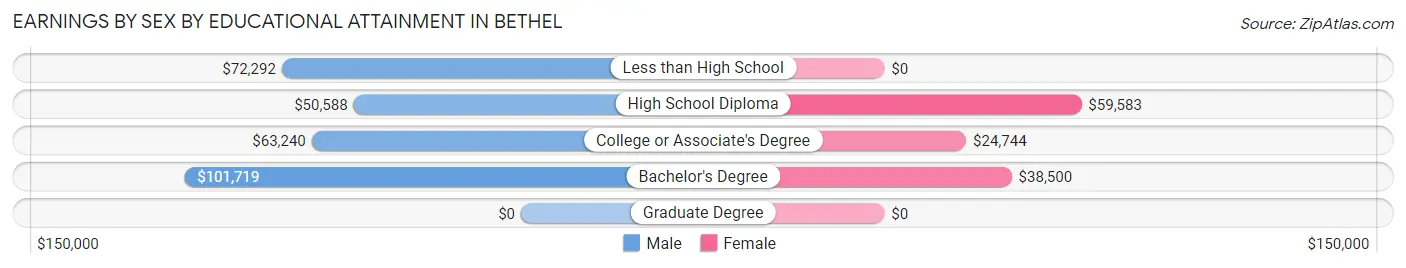
Earnings by Sex by Educational Attainment in Bethel
Average earnings in Bethel are $64,046 for men and $36,538 for women, a difference of 42.9%. Men with an educational attainment of bachelor's degree enjoy the highest average annual earnings of $101,719, while those with high school diploma education earn the least with $50,588. Women with an educational attainment of high school diploma earn the most with the average annual earnings of $59,583, while those with college or associate's degree education have the smallest earnings of $24,744.
| Educational Attainment | Male Income | Female Income |
| Less than High School | $72,292 | $0 |
| High School Diploma | $50,588 | $59,583 |
| College or Associate's Degree | $63,240 | $24,744 |
| Bachelor's Degree | $101,719 | $38,500 |
| Graduate Degree | - | - |
| Total | $64,046 | $36,538 |
Family Income in Bethel
Family Income Brackets in Bethel
According to the Bethel family income data, there are 370 families falling into the $50,000 to $74,999 income range, which is the most common income bracket and makes up 30.0% of all families. Conversely, the less than $10,000 income bracket is the least frequent group with only 30 families (2.4%) belonging to this category.
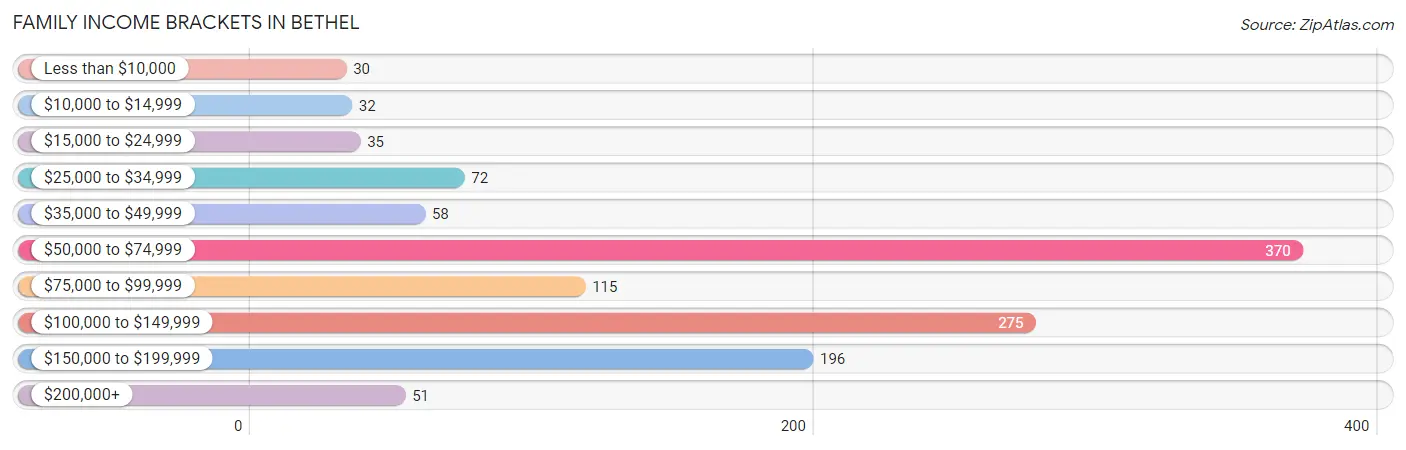
| Income Bracket | # Families | % Families |
| Less than $10,000 | 30 | 2.4% |
| $10,000 to $14,999 | 32 | 2.6% |
| $15,000 to $24,999 | 35 | 2.8% |
| $25,000 to $34,999 | 72 | 5.8% |
| $35,000 to $49,999 | 58 | 4.7% |
| $50,000 to $74,999 | 370 | 30.0% |
| $75,000 to $99,999 | 115 | 9.3% |
| $100,000 to $149,999 | 275 | 22.3% |
| $150,000 to $199,999 | 196 | 15.9% |
| $200,000+ | 51 | 4.1% |
Family Income by Famaliy Size in Bethel
6-person families (34 | 2.8%) account for the highest median family income in Bethel with $160,536 per family, while 2-person families (508 | 41.2%) have the highest median income of $41,136 per family member.
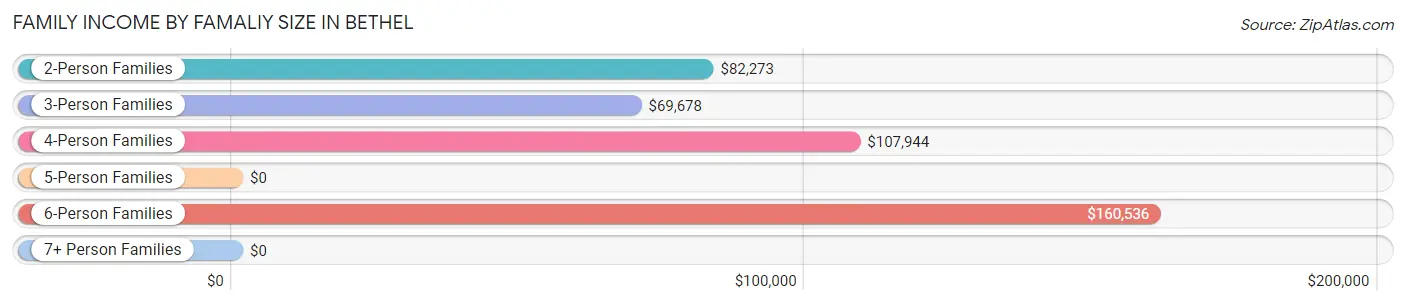
| Income Bracket | # Families | Median Income |
| 2-Person Families | 508 (41.2%) | $82,273 |
| 3-Person Families | 373 (30.2%) | $69,678 |
| 4-Person Families | 231 (18.7%) | $107,944 |
| 5-Person Families | 87 (7.1%) | $0 |
| 6-Person Families | 34 (2.8%) | $160,536 |
| 7+ Person Families | 0 (0.0%) | $0 |
| Total | 1,233 (100.0%) | $80,865 |
Family Income by Number of Earners in Bethel
The median family income in Bethel is $80,865, with families comprising 3+ earners (71) having the highest median family income of $157,159, while families with 1 earner (425) have the lowest median family income of $66,625, accounting for 5.8% and 34.5% of families, respectively.
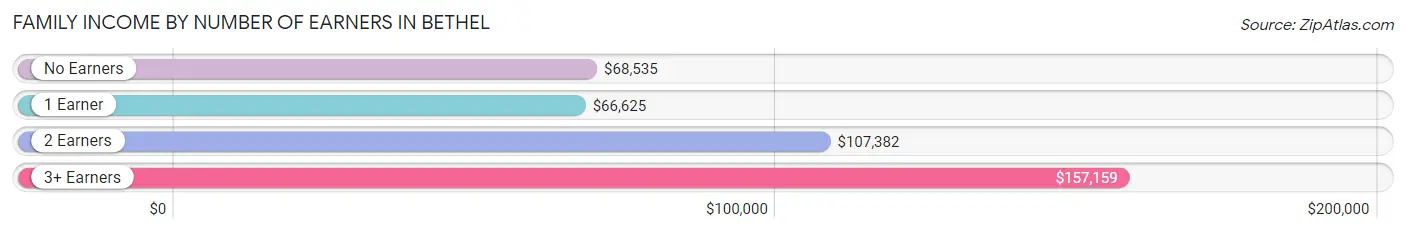
| Number of Earners | # Families | Median Income |
| No Earners | 338 (27.4%) | $68,535 |
| 1 Earner | 425 (34.5%) | $66,625 |
| 2 Earners | 399 (32.4%) | $107,382 |
| 3+ Earners | 71 (5.8%) | $157,159 |
| Total | 1,233 (100.0%) | $80,865 |
Household Income in Bethel
Household Income Brackets in Bethel
With 536 households falling in the category, the $50,000 to $74,999 income range is the most frequent in Bethel, accounting for 34.1% of all households. In contrast, only 24 households (1.5%) fall into the less than $10,000 income bracket, making it the least populous group.
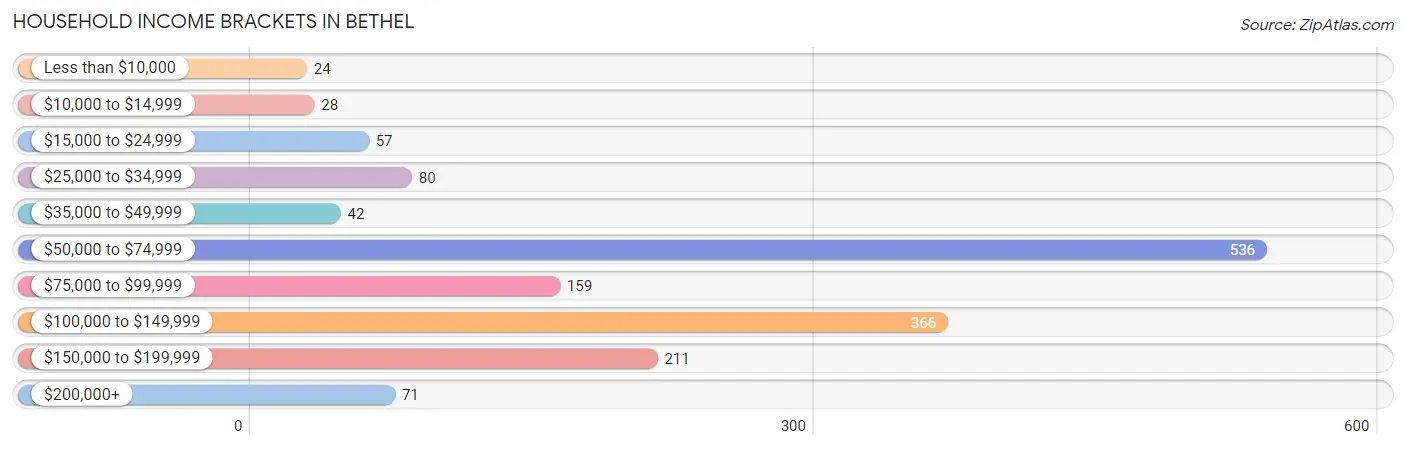
| Income Bracket | # Households | % Households |
| Less than $10,000 | 24 | 1.5% |
| $10,000 to $14,999 | 28 | 1.8% |
| $15,000 to $24,999 | 57 | 3.6% |
| $25,000 to $34,999 | 80 | 5.1% |
| $35,000 to $49,999 | 42 | 2.7% |
| $50,000 to $74,999 | 536 | 34.1% |
| $75,000 to $99,999 | 159 | 10.1% |
| $100,000 to $149,999 | 366 | 23.3% |
| $150,000 to $199,999 | 211 | 13.4% |
| $200,000+ | 71 | 4.5% |
Household Income by Householder Age in Bethel
The median household income in Bethel is $80,897, with the highest median household income of $100,682 found in the 45 to 64 years age bracket for the primary householder. A total of 530 households (33.7%) fall into this category. Meanwhile, the 15 to 24 years age bracket for the primary householder has the lowest median household income of $0, with 21 households (1.3%) in this group.
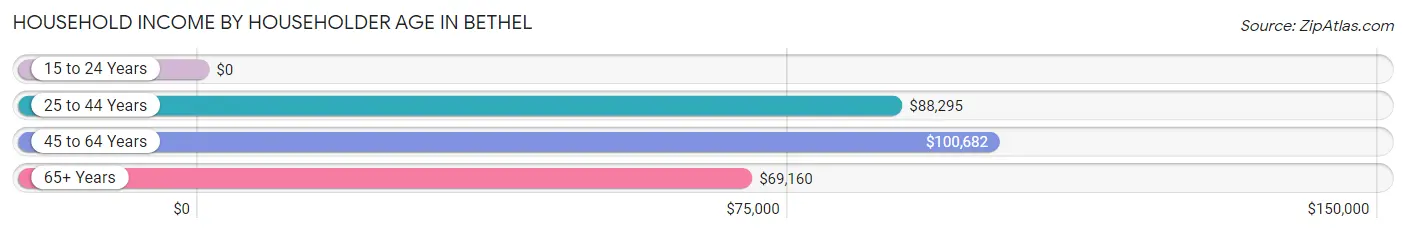
| Income Bracket | # Households | Median Income |
| 15 to 24 Years | 21 (1.3%) | $0 |
| 25 to 44 Years | 495 (31.5%) | $88,295 |
| 45 to 64 Years | 530 (33.7%) | $100,682 |
| 65+ Years | 526 (33.5%) | $69,160 |
| Total | 1,572 (100.0%) | $80,897 |
Poverty in Bethel
Income Below Poverty by Sex and Age in Bethel
With 5.8% poverty level for males and 9.8% for females among the residents of Bethel, under 5 year old males and 5 year old females are the most vulnerable to poverty, with 29 males (29.6%) and 10 females (47.6%) in their respective age groups living below the poverty level.
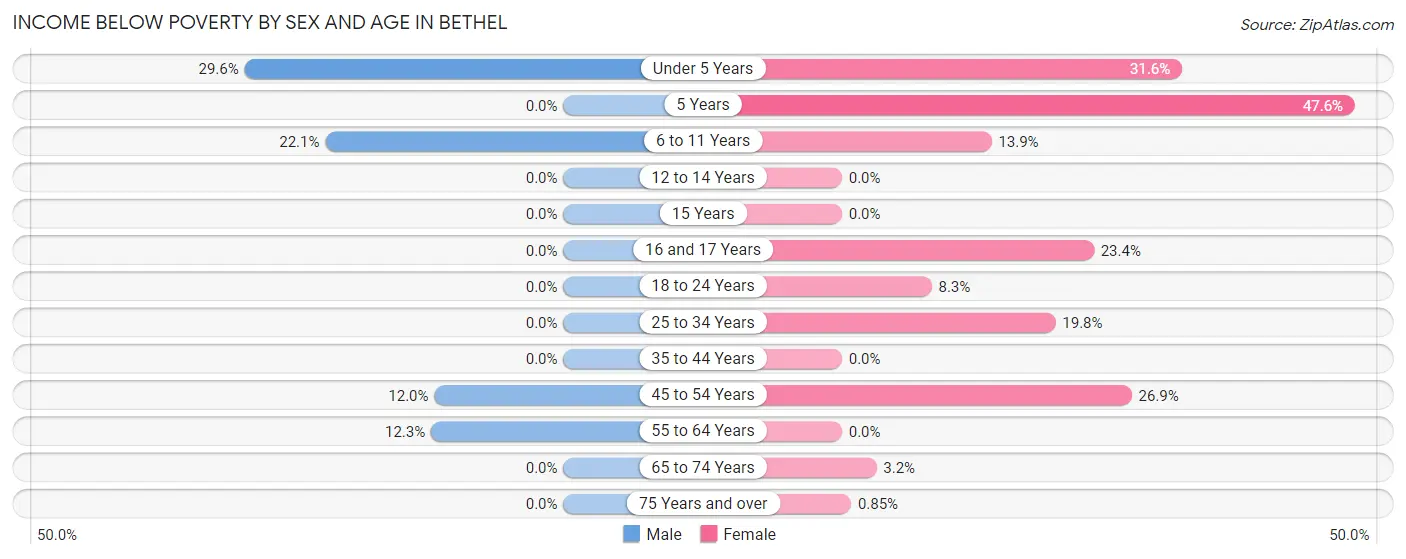
| Age Bracket | Male | Female |
| Under 5 Years | 29 (29.6%) | 18 (31.6%) |
| 5 Years | 0 (0.0%) | 10 (47.6%) |
| 6 to 11 Years | 36 (22.1%) | 25 (13.9%) |
| 12 to 14 Years | 0 (0.0%) | 0 (0.0%) |
| 15 Years | 0 (0.0%) | 0 (0.0%) |
| 16 and 17 Years | 0 (0.0%) | 18 (23.4%) |
| 18 to 24 Years | 0 (0.0%) | 11 (8.3%) |
| 25 to 34 Years | 0 (0.0%) | 44 (19.8%) |
| 35 to 44 Years | 0 (0.0%) | 0 (0.0%) |
| 45 to 54 Years | 31 (12.0%) | 71 (26.9%) |
| 55 to 64 Years | 28 (12.3%) | 0 (0.0%) |
| 65 to 74 Years | 0 (0.0%) | 7 (3.2%) |
| 75 Years and over | 0 (0.0%) | 1 (0.9%) |
| Total | 124 (5.8%) | 205 (9.8%) |
Income Above Poverty by Sex and Age in Bethel
According to the poverty statistics in Bethel, males aged 5 years and females aged 12 to 14 years are the age groups that are most secure financially, with 100.0% of males and 100.0% of females in these age groups living above the poverty line.
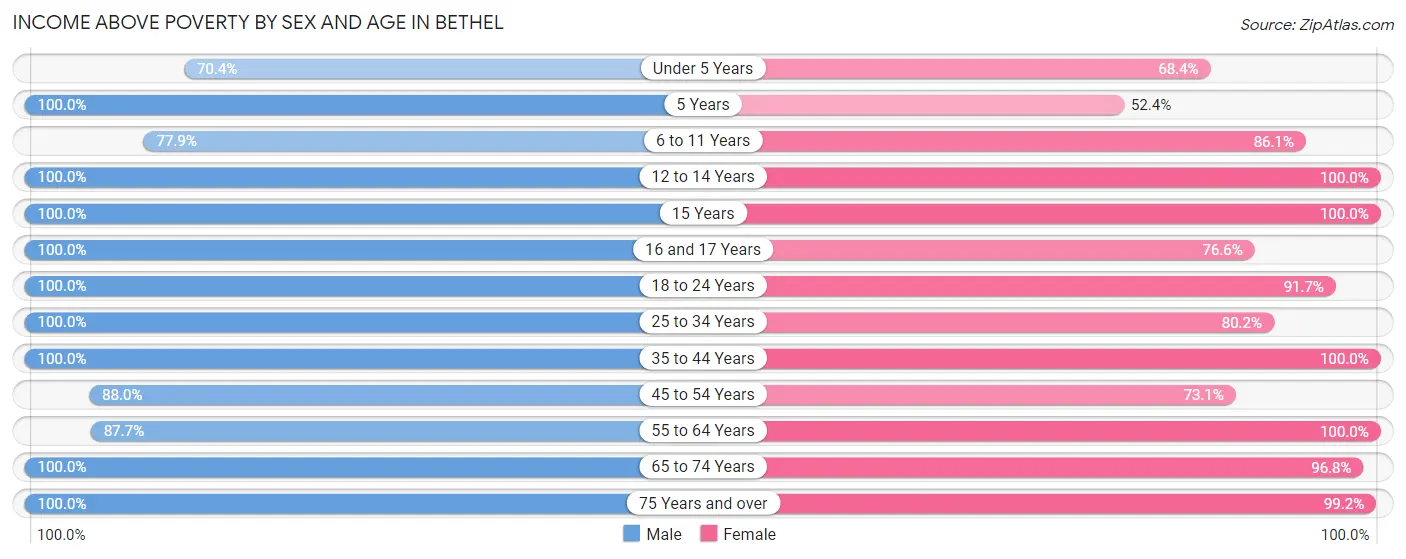
| Age Bracket | Male | Female |
| Under 5 Years | 69 (70.4%) | 39 (68.4%) |
| 5 Years | 9 (100.0%) | 11 (52.4%) |
| 6 to 11 Years | 127 (77.9%) | 155 (86.1%) |
| 12 to 14 Years | 46 (100.0%) | 88 (100.0%) |
| 15 Years | 11 (100.0%) | 3 (100.0%) |
| 16 and 17 Years | 49 (100.0%) | 59 (76.6%) |
| 18 to 24 Years | 146 (100.0%) | 121 (91.7%) |
| 25 to 34 Years | 352 (100.0%) | 178 (80.2%) |
| 35 to 44 Years | 283 (100.0%) | 343 (100.0%) |
| 45 to 54 Years | 228 (88.0%) | 193 (73.1%) |
| 55 to 64 Years | 200 (87.7%) | 371 (100.0%) |
| 65 to 74 Years | 283 (100.0%) | 211 (96.8%) |
| 75 Years and over | 200 (100.0%) | 116 (99.2%) |
| Total | 2,003 (94.2%) | 1,888 (90.2%) |
Income Below Poverty Among Married-Couple Families in Bethel
The poverty statistics for married-couple families in Bethel show that 4.6% or 46 of the total 1,000 families live below the poverty line. Families with 1 or 2 children have the highest poverty rate of 15.4%, comprising of 46 families. On the other hand, families with no children have the lowest poverty rate of 0.0%, which includes 0 families.
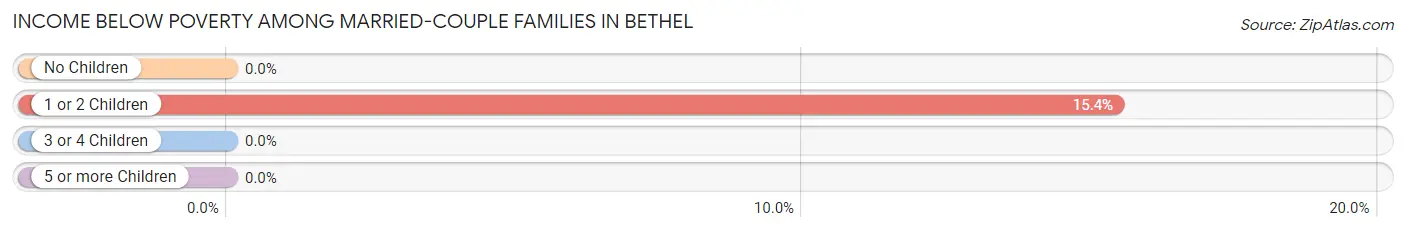
| Children | Above Poverty | Below Poverty |
| No Children | 624 (100.0%) | 0 (0.0%) |
| 1 or 2 Children | 252 (84.6%) | 46 (15.4%) |
| 3 or 4 Children | 78 (100.0%) | 0 (0.0%) |
| 5 or more Children | 0 (0.0%) | 0 (0.0%) |
| Total | 954 (95.4%) | 46 (4.6%) |
Income Below Poverty Among Single-Parent Households in Bethel
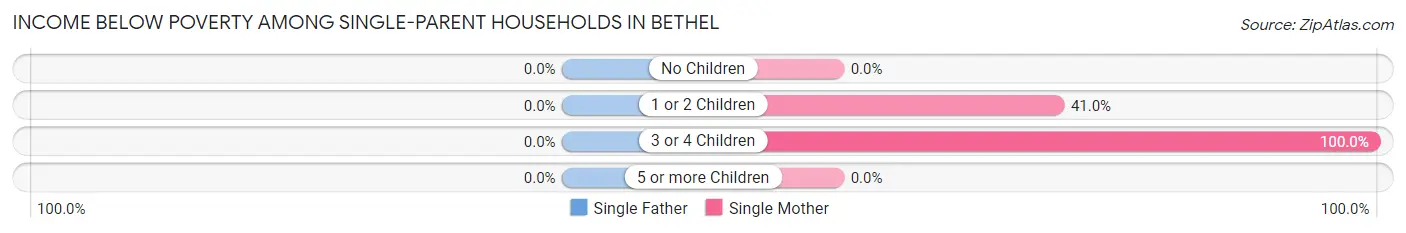
| Children | Single Father | Single Mother |
| No Children | 0 (0.0%) | 0 (0.0%) |
| 1 or 2 Children | 0 (0.0%) | 16 (41.0%) |
| 3 or 4 Children | 0 (0.0%) | 28 (100.0%) |
| 5 or more Children | 0 (0.0%) | 0 (0.0%) |
| Total | 0 (0.0%) | 44 (30.3%) |
Income Below Poverty Among Married-Couple vs Single-Parent Households in Bethel
The poverty data for Bethel shows that 46 of the married-couple family households (4.6%) and 44 of the single-parent households (18.9%) are living below the poverty level. Within the married-couple family households, those with 1 or 2 children have the highest poverty rate, with 46 households (15.4%) falling below the poverty line. Among the single-parent households, those with 3 or 4 children have the highest poverty rate, with 28 household (100.0%) living below poverty.
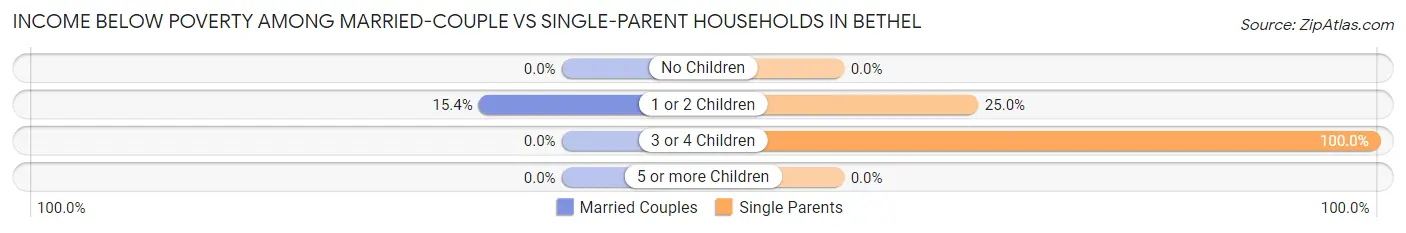
| Children | Married-Couple Families | Single-Parent Households |
| No Children | 0 (0.0%) | 0 (0.0%) |
| 1 or 2 Children | 46 (15.4%) | 16 (25.0%) |
| 3 or 4 Children | 0 (0.0%) | 28 (100.0%) |
| 5 or more Children | 0 (0.0%) | 0 (0.0%) |
| Total | 46 (4.6%) | 44 (18.9%) |
Race in Bethel
The most populous races in Bethel are White / Caucasian (3,264 | 77.3%), Two or more Races (462 | 11.0%), and Asian (325 | 7.7%).
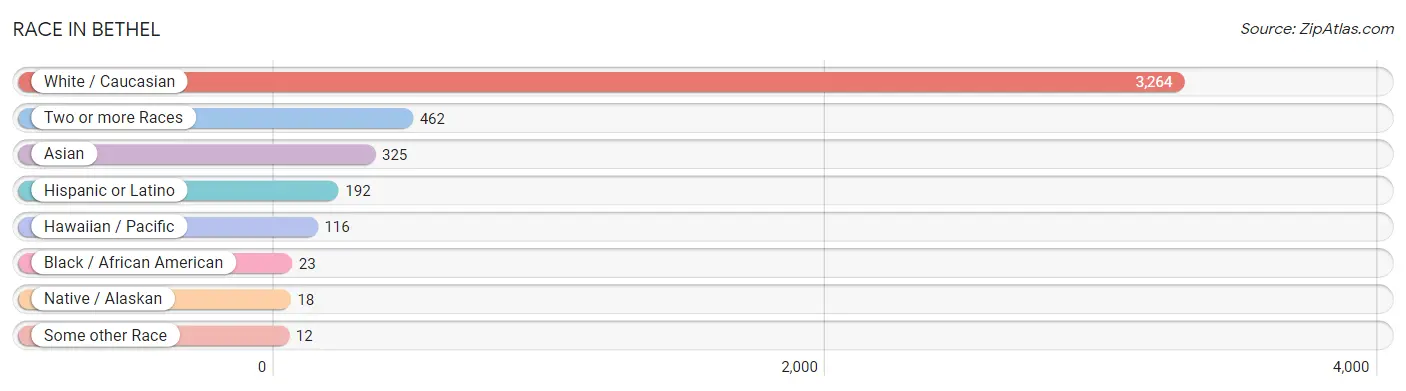
| Race | # Population | % Population |
| Asian | 325 | 7.7% |
| Black / African American | 23 | 0.5% |
| Hawaiian / Pacific | 116 | 2.8% |
| Hispanic or Latino | 192 | 4.5% |
| Native / Alaskan | 18 | 0.4% |
| White / Caucasian | 3,264 | 77.3% |
| Two or more Races | 462 | 11.0% |
| Some other Race | 12 | 0.3% |
| Total | 4,220 | 100.0% |
Ancestry in Bethel
The most populous ancestries reported in Bethel are German (877 | 20.8%), English (480 | 11.4%), Irish (457 | 10.8%), Korean (360 | 8.5%), and Scottish (310 | 7.3%), together accounting for 58.9% of all Bethel residents.
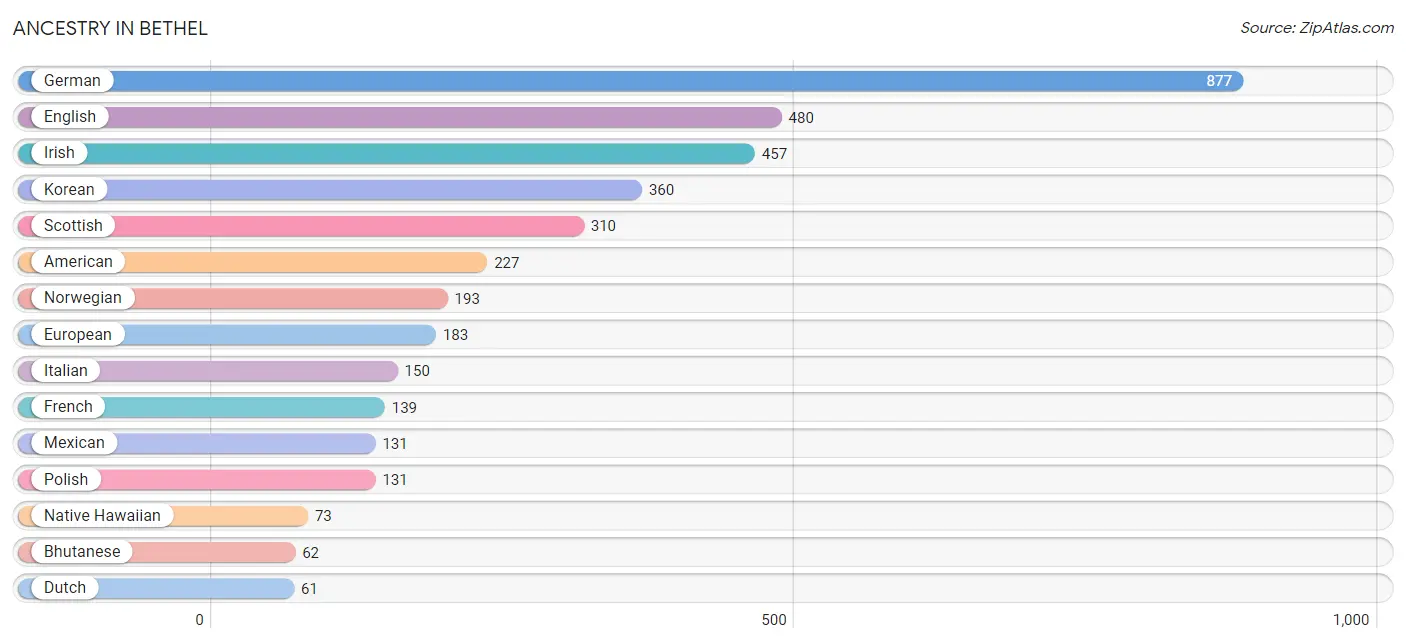
| Ancestry | # Population | % Population |
| American | 227 | 5.4% |
| Apache | 9 | 0.2% |
| Bhutanese | 62 | 1.5% |
| British | 33 | 0.8% |
| Burmese | 14 | 0.3% |
| Canadian | 13 | 0.3% |
| Central American | 20 | 0.5% |
| Cherokee | 20 | 0.5% |
| Chilean | 1 | 0.0% |
| Czechoslovakian | 31 | 0.7% |
| Dutch | 61 | 1.5% |
| Eastern European | 7 | 0.2% |
| English | 480 | 11.4% |
| European | 183 | 4.3% |
| Finnish | 6 | 0.1% |
| French | 139 | 3.3% |
| German | 877 | 20.8% |
| Greek | 3 | 0.1% |
| Guamanian / Chamorro | 60 | 1.4% |
| Icelander | 39 | 0.9% |
| Irish | 457 | 10.8% |
| Iroquois | 4 | 0.1% |
| Italian | 150 | 3.5% |
| Korean | 360 | 8.5% |
| Laotian | 41 | 1.0% |
| Mexican | 131 | 3.1% |
| Native Hawaiian | 73 | 1.7% |
| Nicaraguan | 20 | 0.5% |
| Norwegian | 193 | 4.6% |
| Polish | 131 | 3.1% |
| Portuguese | 47 | 1.1% |
| Russian | 7 | 0.2% |
| Scandinavian | 50 | 1.2% |
| Scotch-Irish | 15 | 0.4% |
| Scottish | 310 | 7.3% |
| Sioux | 9 | 0.2% |
| South American | 1 | 0.0% |
| Spaniard | 6 | 0.1% |
| Spanish | 24 | 0.6% |
| Swedish | 35 | 0.8% |
| Swiss | 41 | 1.0% |
| Ukrainian | 21 | 0.5% |
| Welsh | 28 | 0.7% | View All 43 Rows |
Immigrants in Bethel
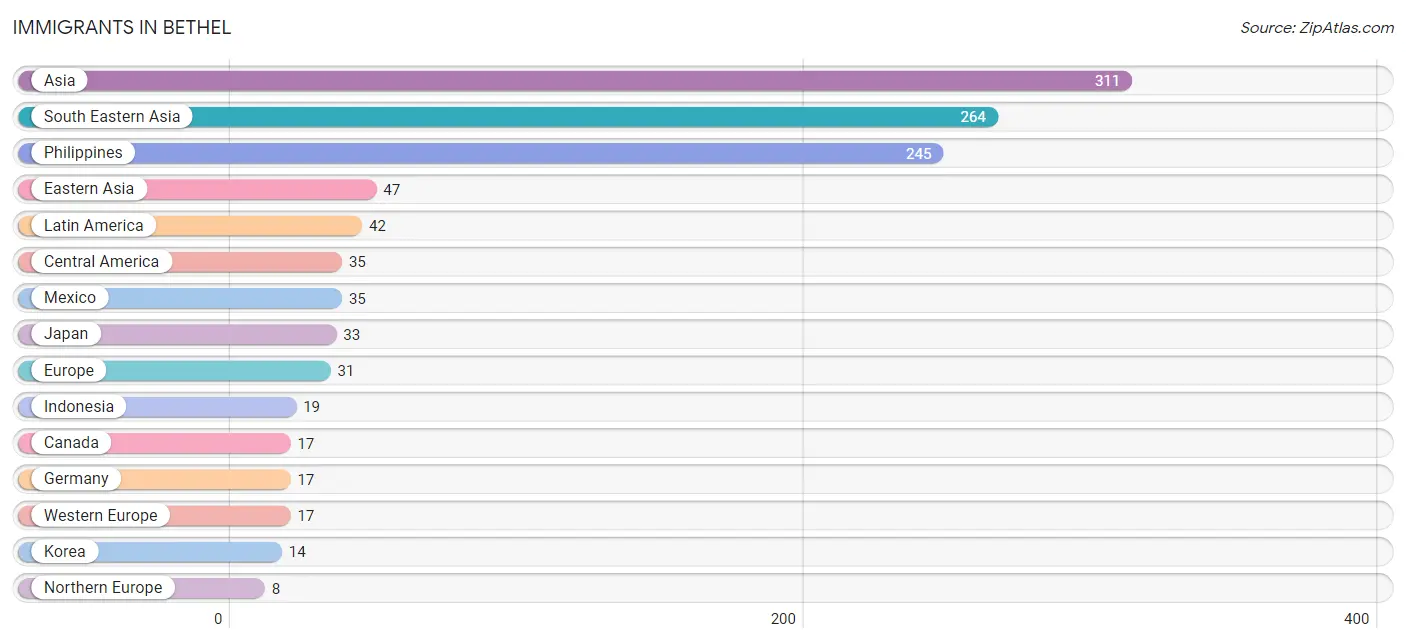
The most numerous immigrant groups reported in Bethel came from Asia (311 | 7.4%), South Eastern Asia (264 | 6.3%), Philippines (245 | 5.8%), Eastern Asia (47 | 1.1%), and Latin America (42 | 1.0%), together accounting for 21.6% of all Bethel residents.
| Immigration Origin | # Population | % Population |
| Asia | 311 | 7.4% |
| Brazil | 6 | 0.1% |
| Canada | 17 | 0.4% |
| Central America | 35 | 0.8% |
| Chile | 1 | 0.0% |
| Eastern Asia | 47 | 1.1% |
| Eastern Europe | 6 | 0.1% |
| England | 1 | 0.0% |
| Europe | 31 | 0.7% |
| Germany | 17 | 0.4% |
| Indonesia | 19 | 0.4% |
| Japan | 33 | 0.8% |
| Korea | 14 | 0.3% |
| Latin America | 42 | 1.0% |
| Mexico | 35 | 0.8% |
| Northern Europe | 8 | 0.2% |
| Philippines | 245 | 5.8% |
| South America | 7 | 0.2% |
| South Eastern Asia | 264 | 6.3% |
| Western Europe | 17 | 0.4% | View All 20 Rows |
Sex and Age in Bethel
Sex and Age in Bethel
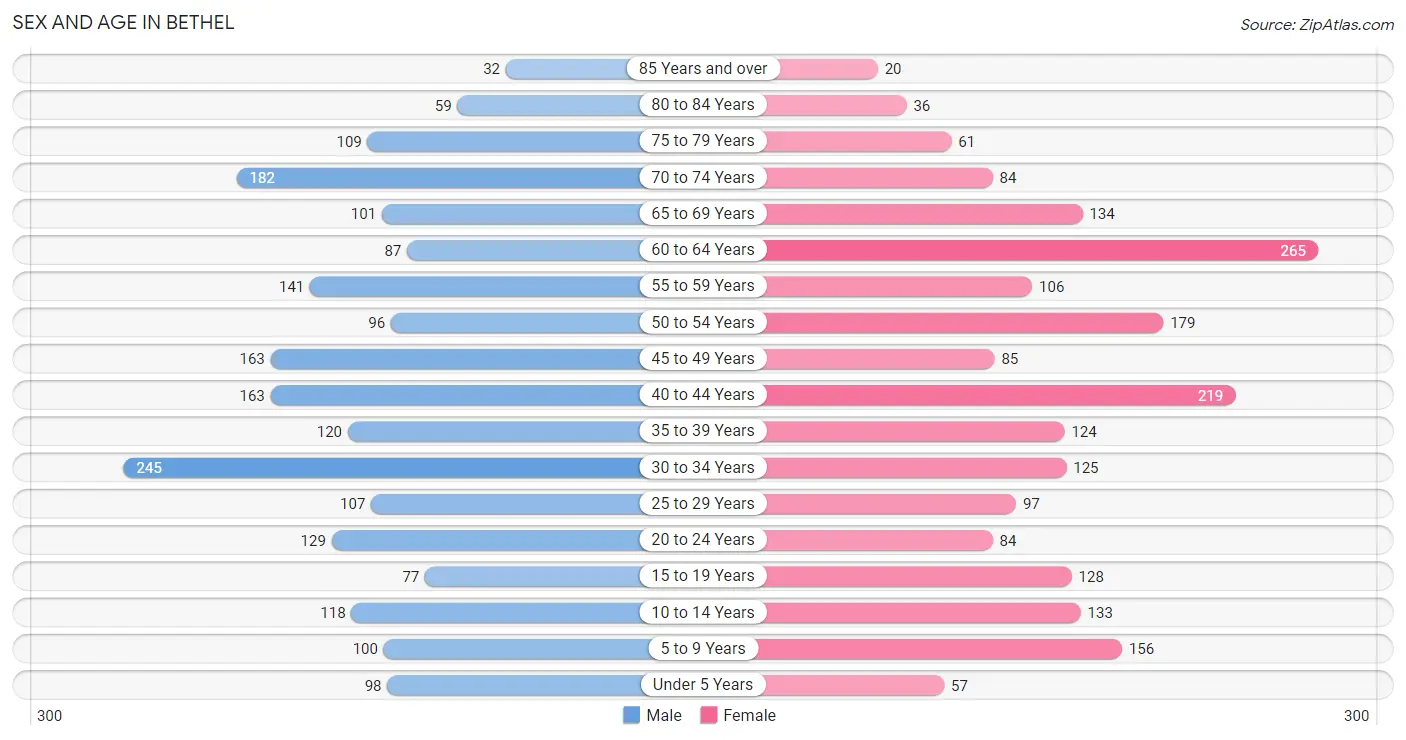
The most populous age groups in Bethel are 30 to 34 Years (245 | 11.5%) for men and 60 to 64 Years (265 | 12.7%) for women.
| Age Bracket | Male | Female |
| Under 5 Years | 98 (4.6%) | 57 (2.7%) |
| 5 to 9 Years | 100 (4.7%) | 156 (7.4%) |
| 10 to 14 Years | 118 (5.6%) | 133 (6.4%) |
| 15 to 19 Years | 77 (3.6%) | 128 (6.1%) |
| 20 to 24 Years | 129 (6.1%) | 84 (4.0%) |
| 25 to 29 Years | 107 (5.0%) | 97 (4.6%) |
| 30 to 34 Years | 245 (11.5%) | 125 (6.0%) |
| 35 to 39 Years | 120 (5.6%) | 124 (5.9%) |
| 40 to 44 Years | 163 (7.7%) | 219 (10.5%) |
| 45 to 49 Years | 163 (7.7%) | 85 (4.1%) |
| 50 to 54 Years | 96 (4.5%) | 179 (8.6%) |
| 55 to 59 Years | 141 (6.6%) | 106 (5.1%) |
| 60 to 64 Years | 87 (4.1%) | 265 (12.7%) |
| 65 to 69 Years | 101 (4.8%) | 134 (6.4%) |
| 70 to 74 Years | 182 (8.6%) | 84 (4.0%) |
| 75 to 79 Years | 109 (5.1%) | 61 (2.9%) |
| 80 to 84 Years | 59 (2.8%) | 36 (1.7%) |
| 85 Years and over | 32 (1.5%) | 20 (1.0%) |
| Total | 2,127 (100.0%) | 2,093 (100.0%) |
Families and Households in Bethel
Median Family Size in Bethel
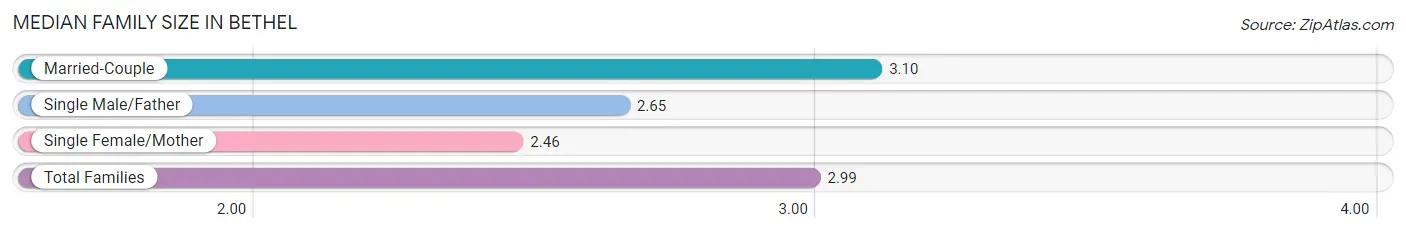
The median family size in Bethel is 2.99 persons per family, with married-couple families (1,000 | 81.1%) accounting for the largest median family size of 3.1 persons per family. On the other hand, single female/mother families (145 | 11.8%) represent the smallest median family size with 2.46 persons per family.
| Family Type | # Families | Family Size |
| Married-Couple | 1,000 (81.1%) | 3.10 |
| Single Male/Father | 88 (7.1%) | 2.65 |
| Single Female/Mother | 145 (11.8%) | 2.46 |
| Total Families | 1,233 (100.0%) | 2.99 |
Median Household Size in Bethel
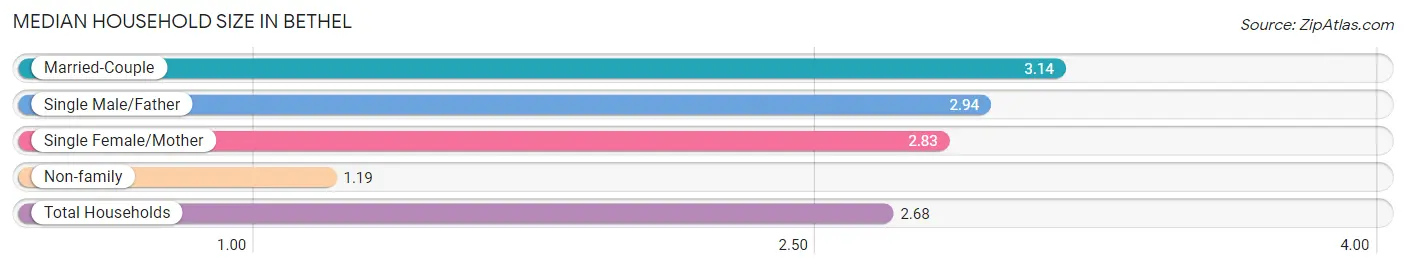
The median household size in Bethel is 2.68 persons per household, with married-couple households (1,000 | 63.6%) accounting for the largest median household size of 3.14 persons per household. non-family households (339 | 21.6%) represent the smallest median household size with 1.19 persons per household.
| Household Type | # Households | Household Size |
| Married-Couple | 1,000 (63.6%) | 3.14 |
| Single Male/Father | 88 (5.6%) | 2.94 |
| Single Female/Mother | 145 (9.2%) | 2.83 |
| Non-family | 339 (21.6%) | 1.19 |
| Total Households | 1,572 (100.0%) | 2.68 |
Household Size by Marriage Status in Bethel
Out of a total of 1,572 households in Bethel, 1,233 (78.4%) are family households, while 339 (21.6%) are nonfamily households. The most numerous type of family households are 2-person households, comprising 486, and the most common type of nonfamily households are 1-person households, comprising 278.
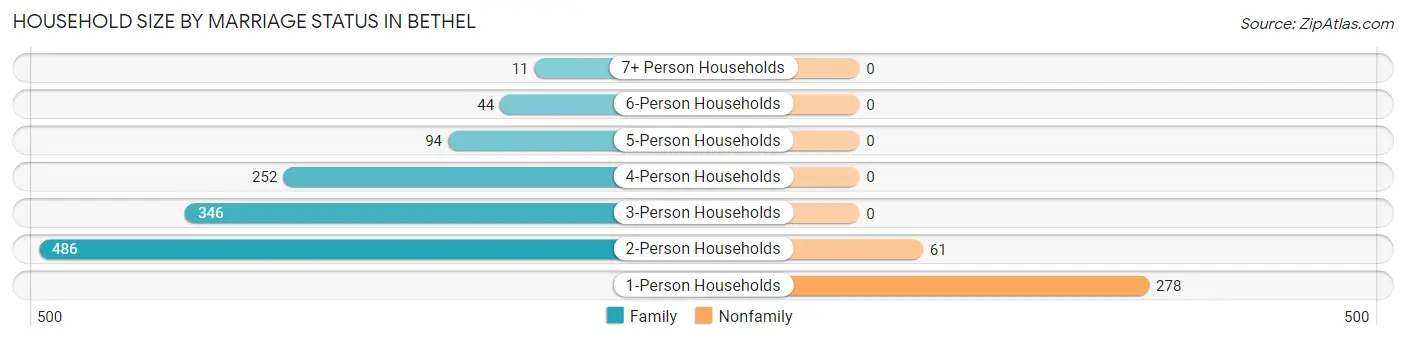
| Household Size | Family Households | Nonfamily Households |
| 1-Person Households | - | 278 (17.7%) |
| 2-Person Households | 486 (30.9%) | 61 (3.9%) |
| 3-Person Households | 346 (22.0%) | 0 (0.0%) |
| 4-Person Households | 252 (16.0%) | 0 (0.0%) |
| 5-Person Households | 94 (6.0%) | 0 (0.0%) |
| 6-Person Households | 44 (2.8%) | 0 (0.0%) |
| 7+ Person Households | 11 (0.7%) | 0 (0.0%) |
| Total | 1,233 (78.4%) | 339 (21.6%) |
Female Fertility in Bethel
Fertility by Age in Bethel
Average fertility rate in Bethel is 22.0 births per 1,000 women. Women in the age bracket of 35 to 50 years have the highest fertility rate with 30.0 births per 1,000 women. Women in the age bracket of 35 to 50 years acount for 68.4% of all women with births.
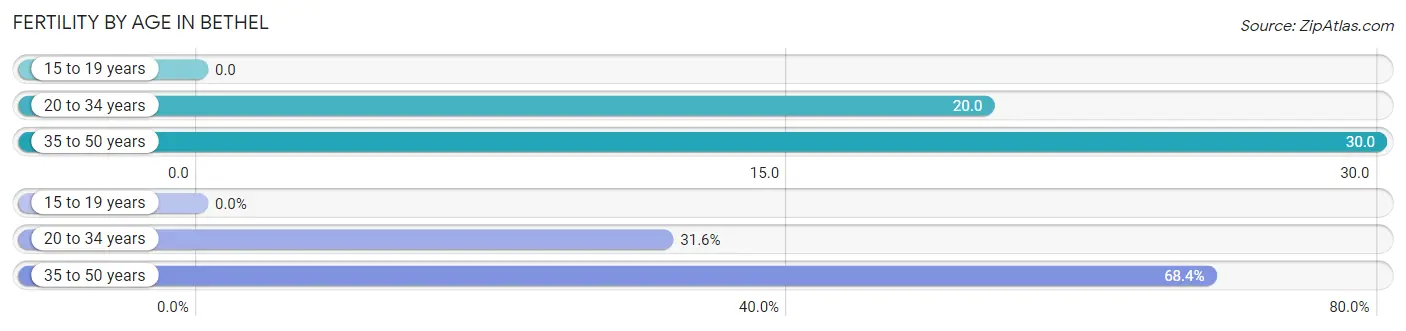
| Age Bracket | Women with Births | Births / 1,000 Women |
| 15 to 19 years | 0 (0.0%) | 0.0 |
| 20 to 34 years | 6 (31.6%) | 20.0 |
| 35 to 50 years | 13 (68.4%) | 30.0 |
| Total | 19 (100.0%) | 22.0 |
Fertility by Age by Marriage Status in Bethel
68.4% of women with births (19) in Bethel are married. The highest percentage of unmarried women with births falls into 20 to 34 years age bracket with 100.0% of them unmarried at the time of birth, while the lowest percentage of unmarried women with births belong to 35 to 50 years age bracket with 0.0% of them unmarried.
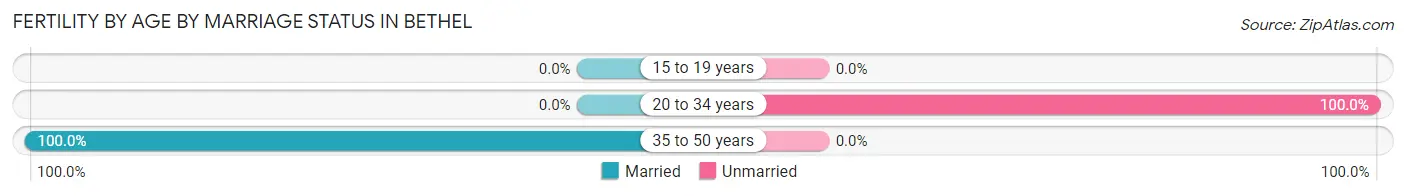
| Age Bracket | Married | Unmarried |
| 15 to 19 years | 0 (0.0%) | 0 (0.0%) |
| 20 to 34 years | 0 (0.0%) | 6 (100.0%) |
| 35 to 50 years | 13 (100.0%) | 0 (0.0%) |
| Total | 13 (68.4%) | 6 (31.6%) |
Fertility by Education in Bethel
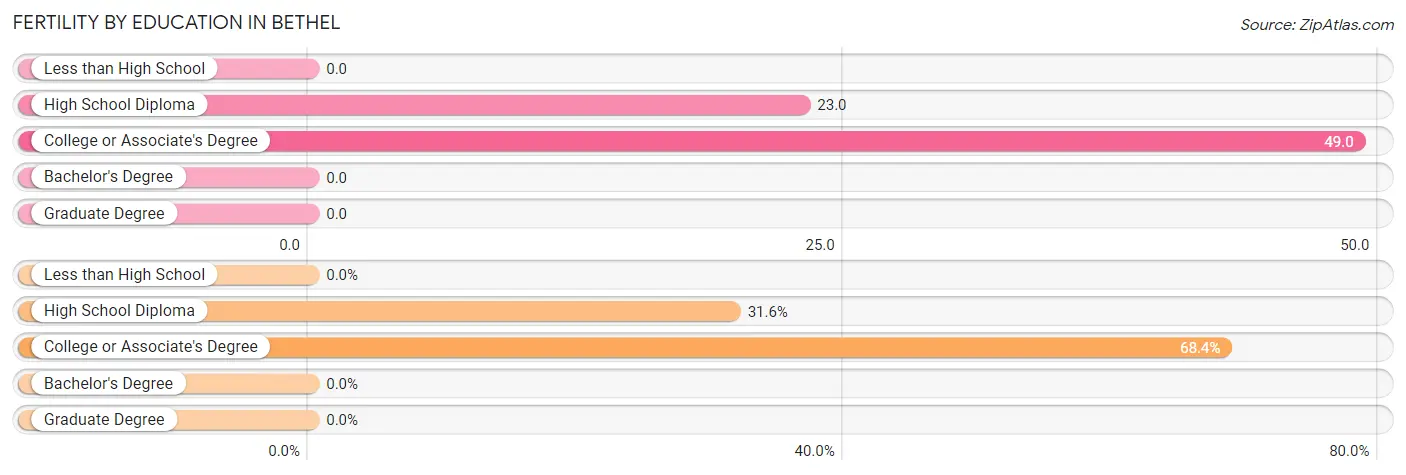
| Educational Attainment | Women with Births | Births / 1,000 Women |
| Less than High School | 0 (0.0%) | 0.0 |
| High School Diploma | 6 (31.6%) | 23.0 |
| College or Associate's Degree | 13 (68.4%) | 49.0 |
| Bachelor's Degree | 0 (0.0%) | 0.0 |
| Graduate Degree | 0 (0.0%) | 0.0 |
| Total | 19 (100.0%) | 22.0 |
Fertility by Education by Marriage Status in Bethel
31.6% of women with births in Bethel are unmarried. Women with the educational attainment of college or associate's degree are most likely to be married with 100.0% of them married at childbirth, while women with the educational attainment of high school diploma are least likely to be married with 100.0% of them unmarried at childbirth.
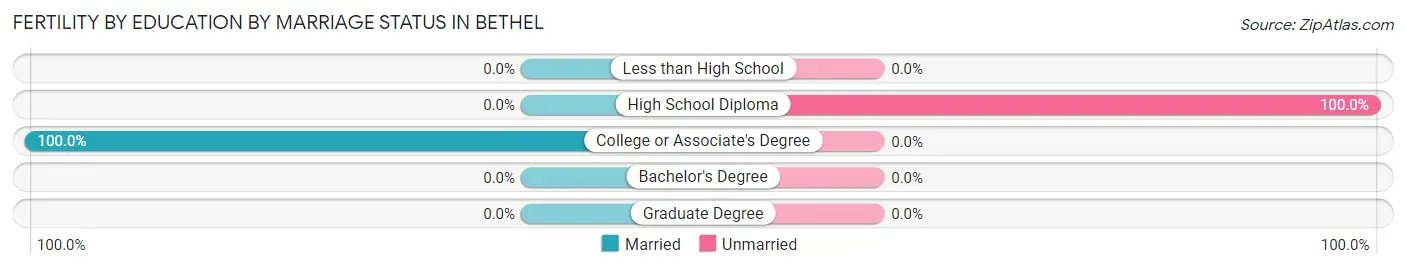
| Educational Attainment | Married | Unmarried |
| Less than High School | 0 (0.0%) | 0 (0.0%) |
| High School Diploma | 0 (0.0%) | 6 (100.0%) |
| College or Associate's Degree | 13 (100.0%) | 0 (0.0%) |
| Bachelor's Degree | 0 (0.0%) | 0 (0.0%) |
| Graduate Degree | 0 (0.0%) | 0 (0.0%) |
| Total | 13 (68.4%) | 6 (31.6%) |
Employment Characteristics in Bethel
Employment by Class of Employer in Bethel
Among the 1,799 employed individuals in Bethel, private company employees (960 | 53.4%), federal government employees (353 | 19.6%), and not-for-profit organizations (194 | 10.8%) make up the most common classes of employment.
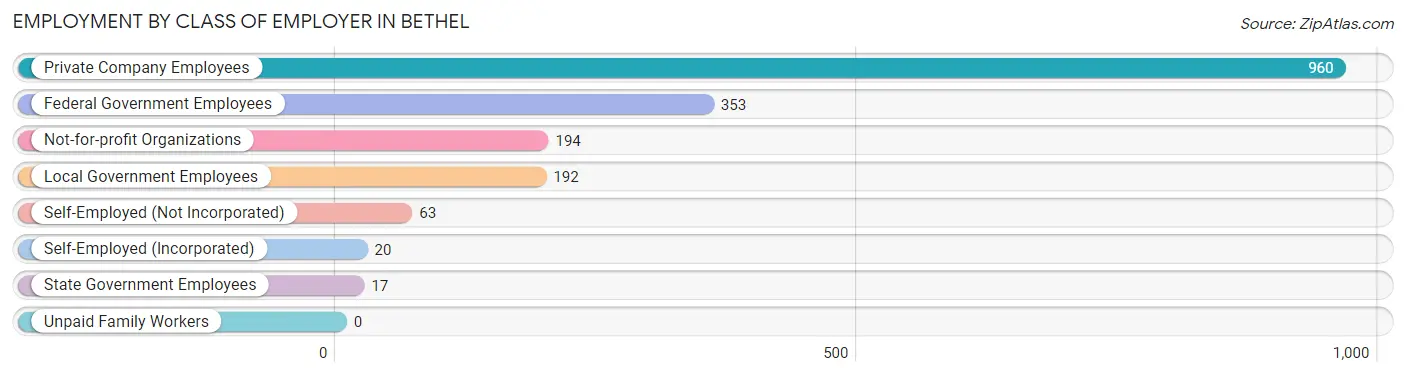
| Employer Class | # Employees | % Employees |
| Private Company Employees | 960 | 53.4% |
| Self-Employed (Incorporated) | 20 | 1.1% |
| Self-Employed (Not Incorporated) | 63 | 3.5% |
| Not-for-profit Organizations | 194 | 10.8% |
| Local Government Employees | 192 | 10.7% |
| State Government Employees | 17 | 0.9% |
| Federal Government Employees | 353 | 19.6% |
| Unpaid Family Workers | 0 | 0.0% |
| Total | 1,799 | 100.0% |
Employment Status by Age in Bethel
According to the labor force statistics for Bethel, out of the total population over 16 years of age (3,544), 58.4% or 2,070 individuals are in the labor force, with 13.2% or 273 of them unemployed. The age group with the highest labor force participation rate is 30 to 34 years, with 93.0% or 344 individuals in the labor force. Within the labor force, the 16 to 19 years age range has the highest percentage of unemployed individuals, with 55.4% or 51 of them being unemployed.
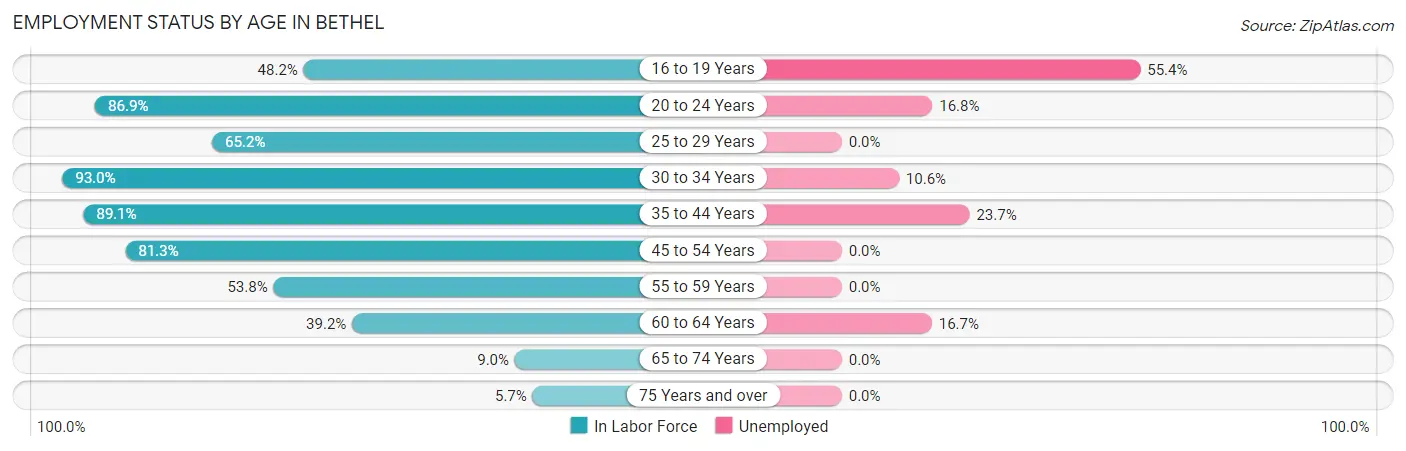
| Age Bracket | In Labor Force | Unemployed |
| 16 to 19 Years | 92 (48.2%) | 51 (55.4%) |
| 20 to 24 Years | 185 (86.9%) | 31 (16.8%) |
| 25 to 29 Years | 133 (65.2%) | 0 (0.0%) |
| 30 to 34 Years | 344 (93.0%) | 36 (10.6%) |
| 35 to 44 Years | 558 (89.1%) | 132 (23.7%) |
| 45 to 54 Years | 425 (81.3%) | 0 (0.0%) |
| 55 to 59 Years | 133 (53.8%) | 0 (0.0%) |
| 60 to 64 Years | 138 (39.2%) | 23 (16.7%) |
| 65 to 74 Years | 45 (9.0%) | 0 (0.0%) |
| 75 Years and over | 18 (5.7%) | 0 (0.0%) |
| Total | 2,070 (58.4%) | 273 (13.2%) |
Employment Status by Educational Attainment in Bethel
According to labor force statistics for Bethel, 74.5% of individuals (1,730) out of the total population between 25 and 64 years of age (2,322) are in the labor force, with 11.1% or 192 of them being unemployed. The group with the highest labor force participation rate are those with the educational attainment of bachelor's degree or higher, with 81.9% or 448 individuals in the labor force. Within the labor force, individuals with high school diploma education have the highest percentage of unemployment, with 36.0% or 146 of them being unemployed.
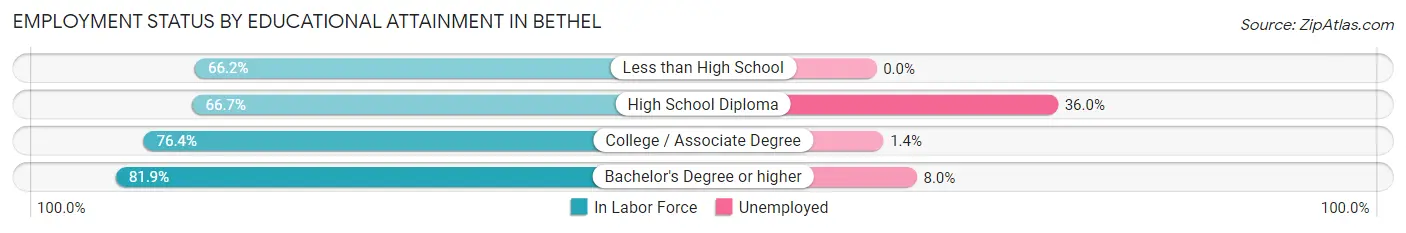
| Educational Attainment | In Labor Force | Unemployed |
| Less than High School | 88 (66.2%) | 0 (0.0%) |
| High School Diploma | 406 (66.7%) | 219 (36.0%) |
| College / Associate Degree | 789 (76.4%) | 14 (1.4%) |
| Bachelor's Degree or higher | 448 (81.9%) | 44 (8.0%) |
| Total | 1,730 (74.5%) | 258 (11.1%) |
Employment Occupations by Sex in Bethel
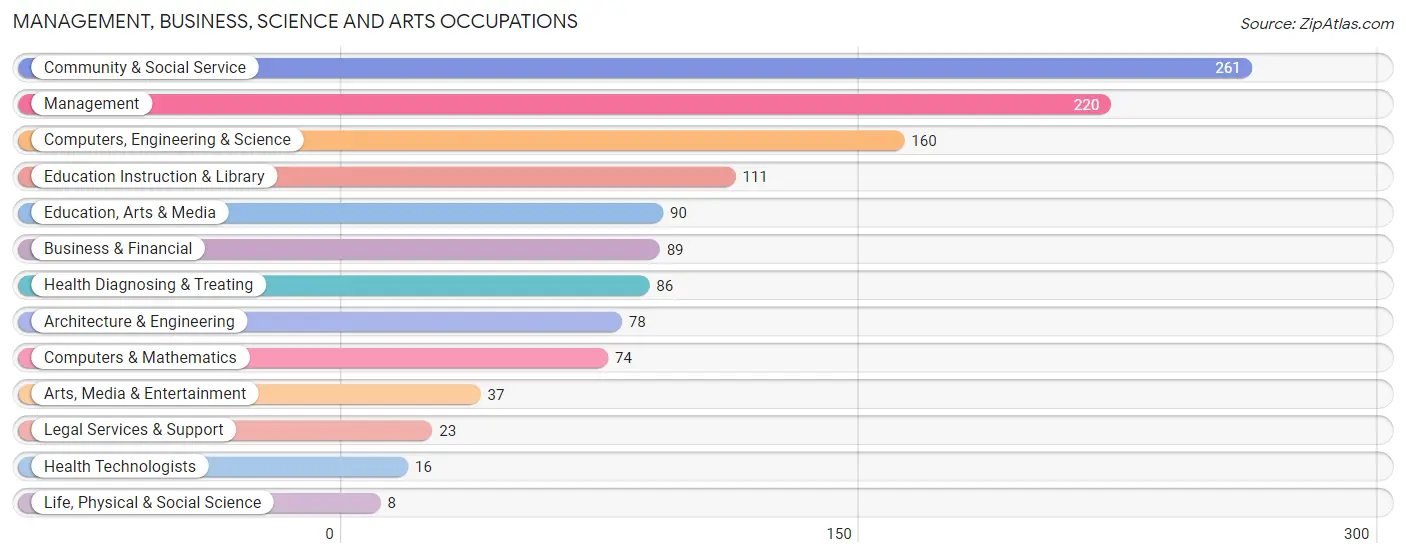
Management, Business, Science and Arts Occupations
The most common Management, Business, Science and Arts occupations in Bethel are Community & Social Service (261 | 14.6%), Management (220 | 12.3%), Computers, Engineering & Science (160 | 9.0%), Education Instruction & Library (111 | 6.2%), and Education, Arts & Media (90 | 5.1%).
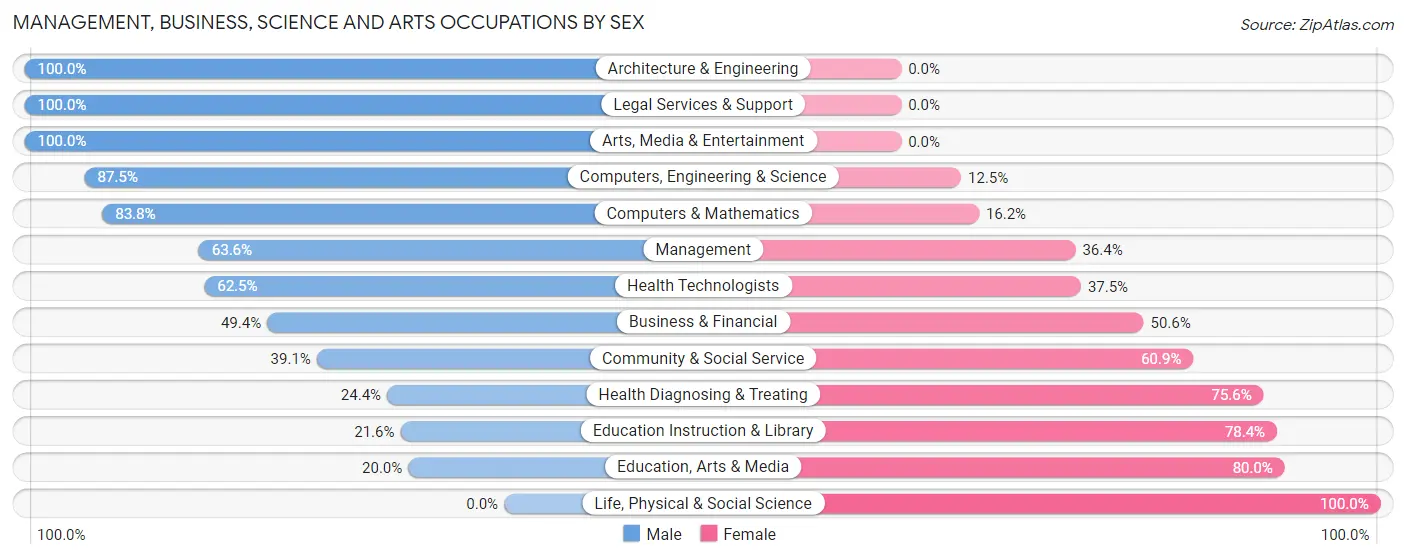
Management, Business, Science and Arts Occupations by Sex
Within the Management, Business, Science and Arts occupations in Bethel, the most male-oriented occupations are Architecture & Engineering (100.0%), Legal Services & Support (100.0%), and Arts, Media & Entertainment (100.0%), while the most female-oriented occupations are Life, Physical & Social Science (100.0%), Education, Arts & Media (80.0%), and Education Instruction & Library (78.4%).
| Occupation | Male | Female |
| Management | 140 (63.6%) | 80 (36.4%) |
| Business & Financial | 44 (49.4%) | 45 (50.6%) |
| Computers, Engineering & Science | 140 (87.5%) | 20 (12.5%) |
| Computers & Mathematics | 62 (83.8%) | 12 (16.2%) |
| Architecture & Engineering | 78 (100.0%) | 0 (0.0%) |
| Life, Physical & Social Science | 0 (0.0%) | 8 (100.0%) |
| Community & Social Service | 102 (39.1%) | 159 (60.9%) |
| Education, Arts & Media | 18 (20.0%) | 72 (80.0%) |
| Legal Services & Support | 23 (100.0%) | 0 (0.0%) |
| Education Instruction & Library | 24 (21.6%) | 87 (78.4%) |
| Arts, Media & Entertainment | 37 (100.0%) | 0 (0.0%) |
| Health Diagnosing & Treating | 21 (24.4%) | 65 (75.6%) |
| Health Technologists | 10 (62.5%) | 6 (37.5%) |
| Total (Category) | 447 (54.8%) | 369 (45.2%) |
| Total (Overall) | 1,000 (56.1%) | 782 (43.9%) |
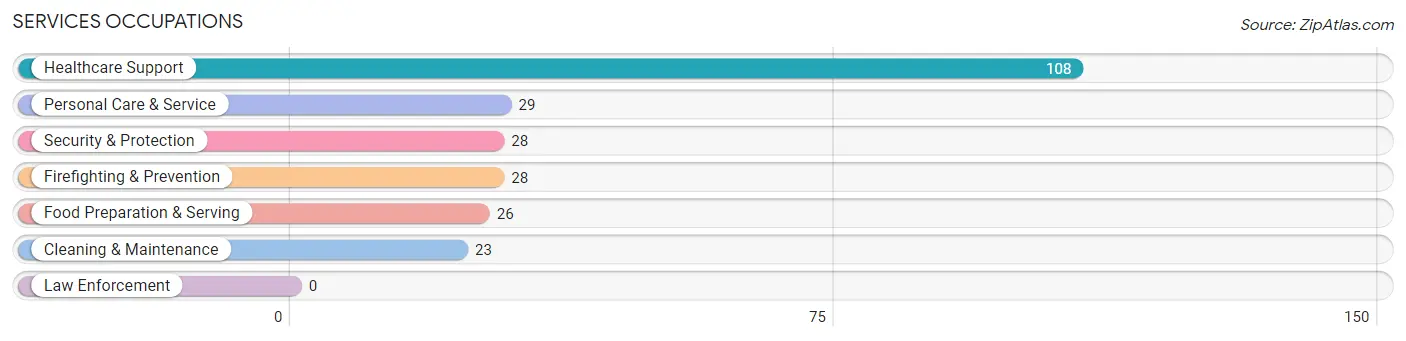
Services Occupations
The most common Services occupations in Bethel are Healthcare Support (108 | 6.1%), Personal Care & Service (29 | 1.6%), Security & Protection (28 | 1.6%), Firefighting & Prevention (28 | 1.6%), and Food Preparation & Serving (26 | 1.5%).
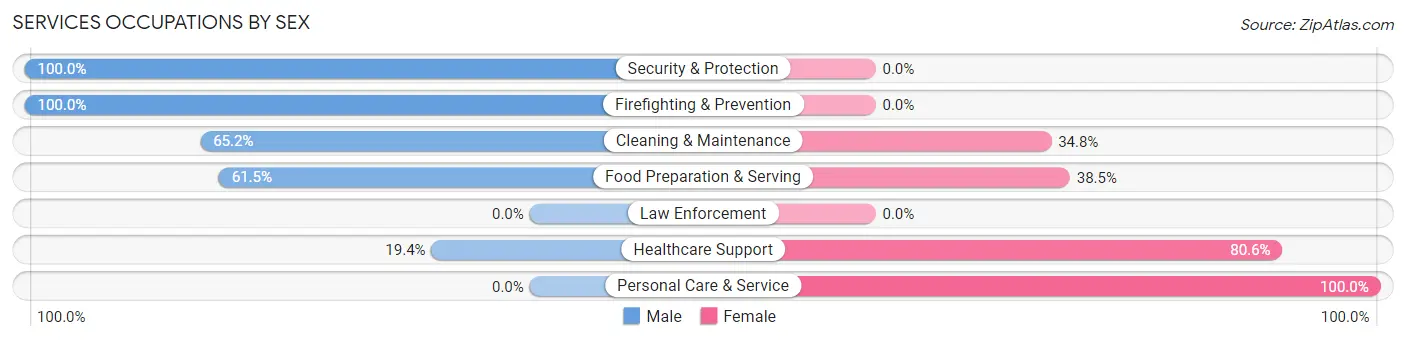
Services Occupations by Sex
Within the Services occupations in Bethel, the most male-oriented occupations are Security & Protection (100.0%), Firefighting & Prevention (100.0%), and Cleaning & Maintenance (65.2%), while the most female-oriented occupations are Personal Care & Service (100.0%), Healthcare Support (80.6%), and Food Preparation & Serving (38.5%).
| Occupation | Male | Female |
| Healthcare Support | 21 (19.4%) | 87 (80.6%) |
| Security & Protection | 28 (100.0%) | 0 (0.0%) |
| Firefighting & Prevention | 28 (100.0%) | 0 (0.0%) |
| Law Enforcement | 0 (0.0%) | 0 (0.0%) |
| Food Preparation & Serving | 16 (61.5%) | 10 (38.5%) |
| Cleaning & Maintenance | 15 (65.2%) | 8 (34.8%) |
| Personal Care & Service | 0 (0.0%) | 29 (100.0%) |
| Total (Category) | 80 (37.4%) | 134 (62.6%) |
| Total (Overall) | 1,000 (56.1%) | 782 (43.9%) |
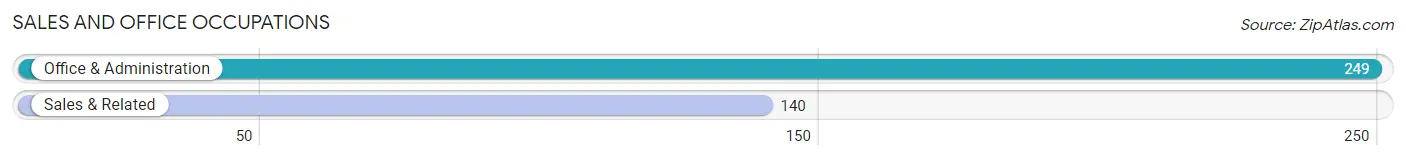
Sales and Office Occupations
The most common Sales and Office occupations in Bethel are Office & Administration (249 | 14.0%), and Sales & Related (140 | 7.9%).
Sales and Office Occupations by Sex
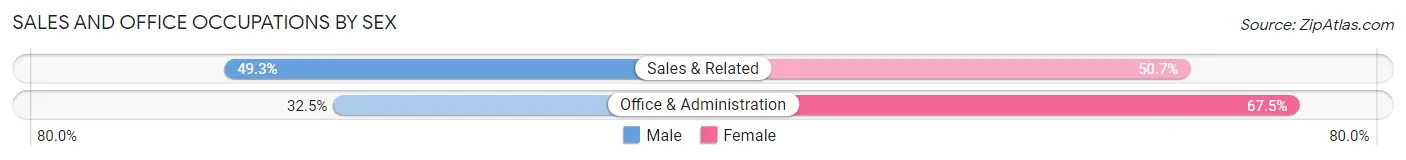
| Occupation | Male | Female |
| Sales & Related | 69 (49.3%) | 71 (50.7%) |
| Office & Administration | 81 (32.5%) | 168 (67.5%) |
| Total (Category) | 150 (38.6%) | 239 (61.4%) |
| Total (Overall) | 1,000 (56.1%) | 782 (43.9%) |
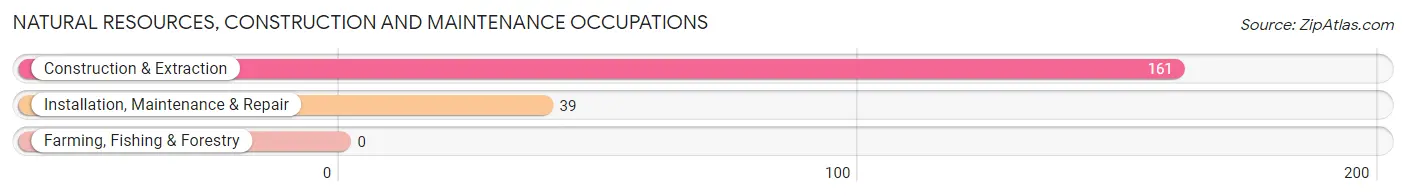
Natural Resources, Construction and Maintenance Occupations
The most common Natural Resources, Construction and Maintenance occupations in Bethel are Construction & Extraction (161 | 9.0%), and Installation, Maintenance & Repair (39 | 2.2%).
Natural Resources, Construction and Maintenance Occupations by Sex
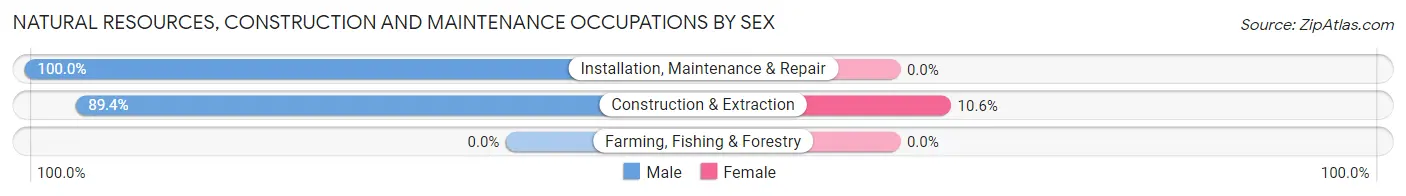
| Occupation | Male | Female |
| Farming, Fishing & Forestry | 0 (0.0%) | 0 (0.0%) |
| Construction & Extraction | 144 (89.4%) | 17 (10.6%) |
| Installation, Maintenance & Repair | 39 (100.0%) | 0 (0.0%) |
| Total (Category) | 183 (91.5%) | 17 (8.5%) |
| Total (Overall) | 1,000 (56.1%) | 782 (43.9%) |
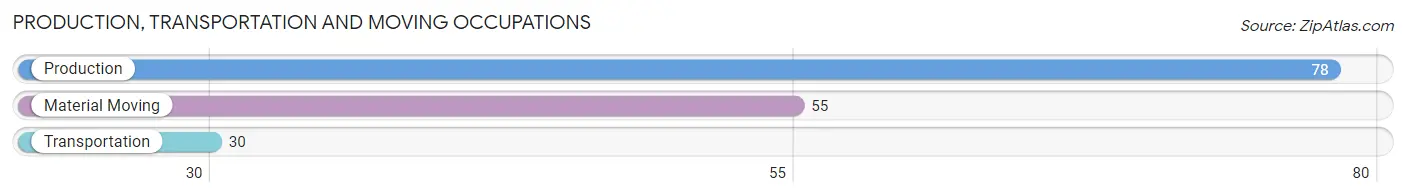
Production, Transportation and Moving Occupations
The most common Production, Transportation and Moving occupations in Bethel are Production (78 | 4.4%), Material Moving (55 | 3.1%), and Transportation (30 | 1.7%).
Production, Transportation and Moving Occupations by Sex
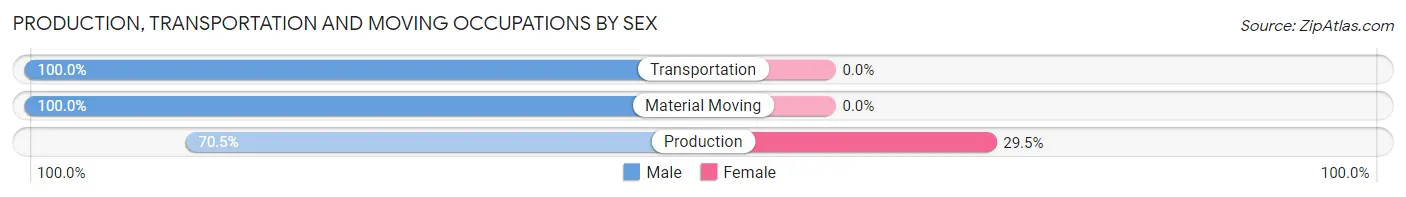
| Occupation | Male | Female |
| Production | 55 (70.5%) | 23 (29.5%) |
| Transportation | 30 (100.0%) | 0 (0.0%) |
| Material Moving | 55 (100.0%) | 0 (0.0%) |
| Total (Category) | 140 (85.9%) | 23 (14.1%) |
| Total (Overall) | 1,000 (56.1%) | 782 (43.9%) |
Employment Industries by Sex in Bethel
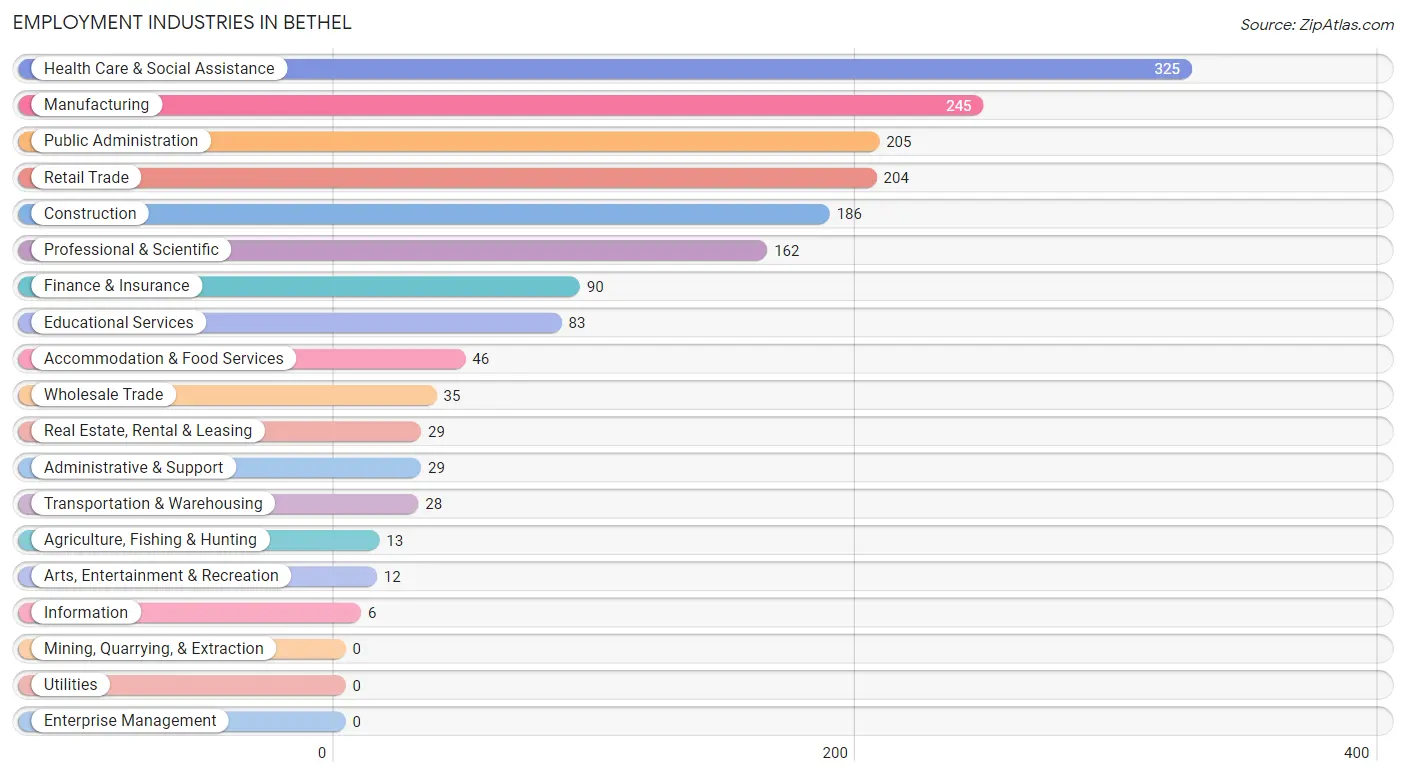
Employment Industries in Bethel
The major employment industries in Bethel include Health Care & Social Assistance (325 | 18.2%), Manufacturing (245 | 13.8%), Public Administration (205 | 11.5%), Retail Trade (204 | 11.5%), and Construction (186 | 10.4%).
Employment Industries by Sex in Bethel
The Bethel industries that see more men than women are Agriculture, Fishing & Hunting (100.0%), Wholesale Trade (100.0%), and Transportation & Warehousing (100.0%), whereas the industries that tend to have a higher number of women are Arts, Entertainment & Recreation (100.0%), Educational Services (78.3%), and Health Care & Social Assistance (68.3%).
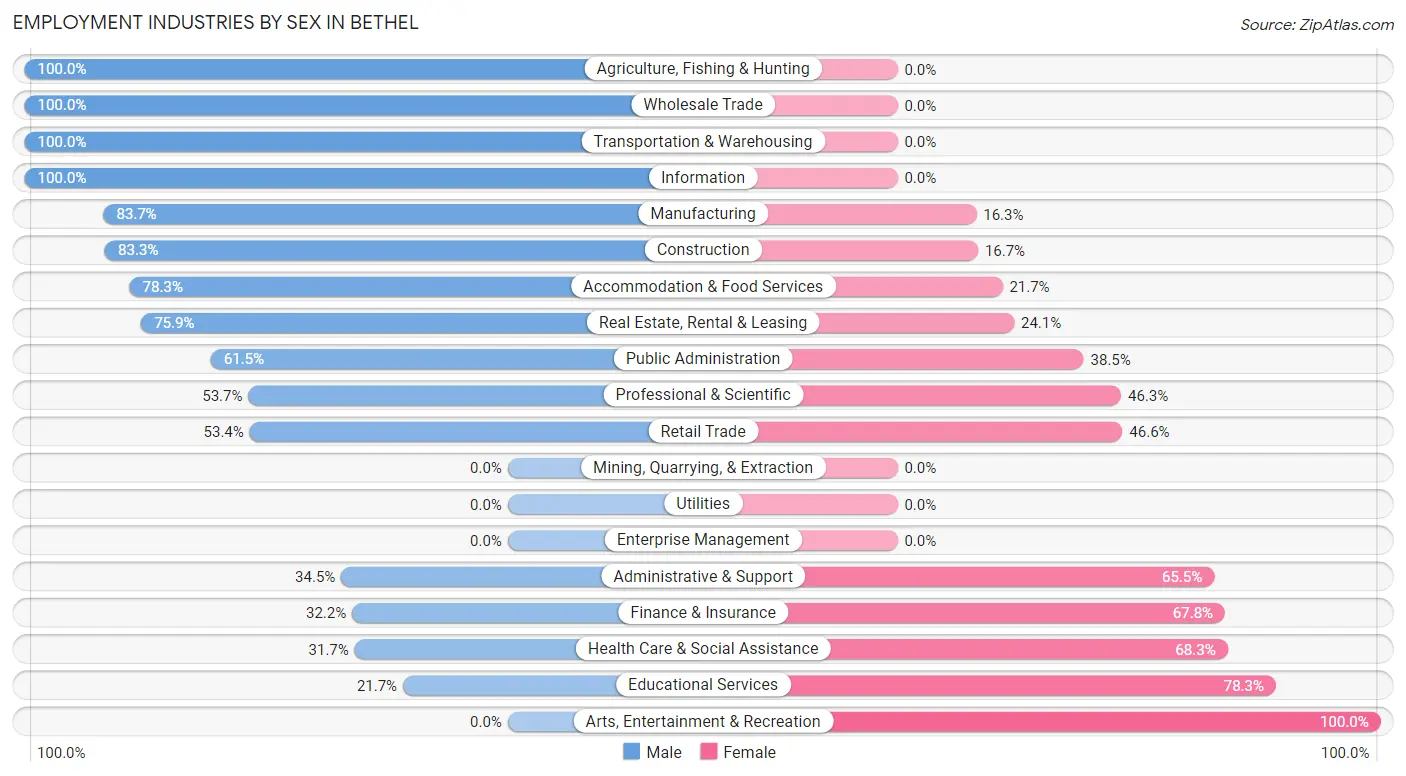
| Industry | Male | Female |
| Agriculture, Fishing & Hunting | 13 (100.0%) | 0 (0.0%) |
| Mining, Quarrying, & Extraction | 0 (0.0%) | 0 (0.0%) |
| Construction | 155 (83.3%) | 31 (16.7%) |
| Manufacturing | 205 (83.7%) | 40 (16.3%) |
| Wholesale Trade | 35 (100.0%) | 0 (0.0%) |
| Retail Trade | 109 (53.4%) | 95 (46.6%) |
| Transportation & Warehousing | 28 (100.0%) | 0 (0.0%) |
| Utilities | 0 (0.0%) | 0 (0.0%) |
| Information | 6 (100.0%) | 0 (0.0%) |
| Finance & Insurance | 29 (32.2%) | 61 (67.8%) |
| Real Estate, Rental & Leasing | 22 (75.9%) | 7 (24.1%) |
| Professional & Scientific | 87 (53.7%) | 75 (46.3%) |
| Enterprise Management | 0 (0.0%) | 0 (0.0%) |
| Administrative & Support | 10 (34.5%) | 19 (65.5%) |
| Educational Services | 18 (21.7%) | 65 (78.3%) |
| Health Care & Social Assistance | 103 (31.7%) | 222 (68.3%) |
| Arts, Entertainment & Recreation | 0 (0.0%) | 12 (100.0%) |
| Accommodation & Food Services | 36 (78.3%) | 10 (21.7%) |
| Public Administration | 126 (61.5%) | 79 (38.5%) |
| Total | 1,000 (56.1%) | 782 (43.9%) |
Education in Bethel
School Enrollment in Bethel
The most common levels of schooling among the 950 students in Bethel are elementary school (225 | 23.7%), middle school (222 | 23.4%), and high school (184 | 19.4%).
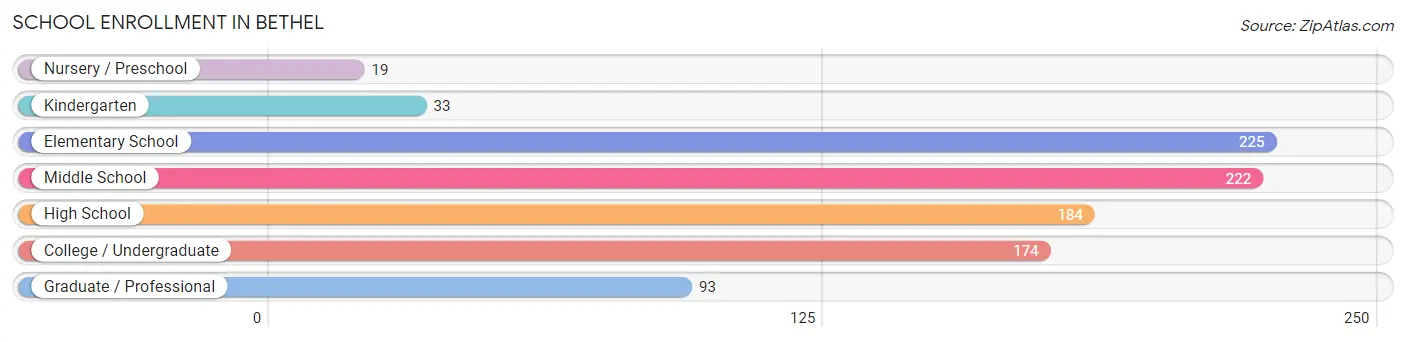
| School Level | # Students | % Students |
| Nursery / Preschool | 19 | 2.0% |
| Kindergarten | 33 | 3.5% |
| Elementary School | 225 | 23.7% |
| Middle School | 222 | 23.4% |
| High School | 184 | 19.4% |
| College / Undergraduate | 174 | 18.3% |
| Graduate / Professional | 93 | 9.8% |
| Total | 950 | 100.0% |
School Enrollment by Age by Funding Source in Bethel
Out of a total of 950 students who are enrolled in schools in Bethel, 79 (8.3%) attend a private institution, while the remaining 871 (91.7%) are enrolled in public schools. The age group of 3 to 4 year olds has the highest likelihood of being enrolled in private schools, with 3 (30.0% in the age bracket) enrolled. Conversely, the age group of 15 to 17 year olds has the lowest likelihood of being enrolled in a private school, with 140 (100.0% in the age bracket) attending a public institution.
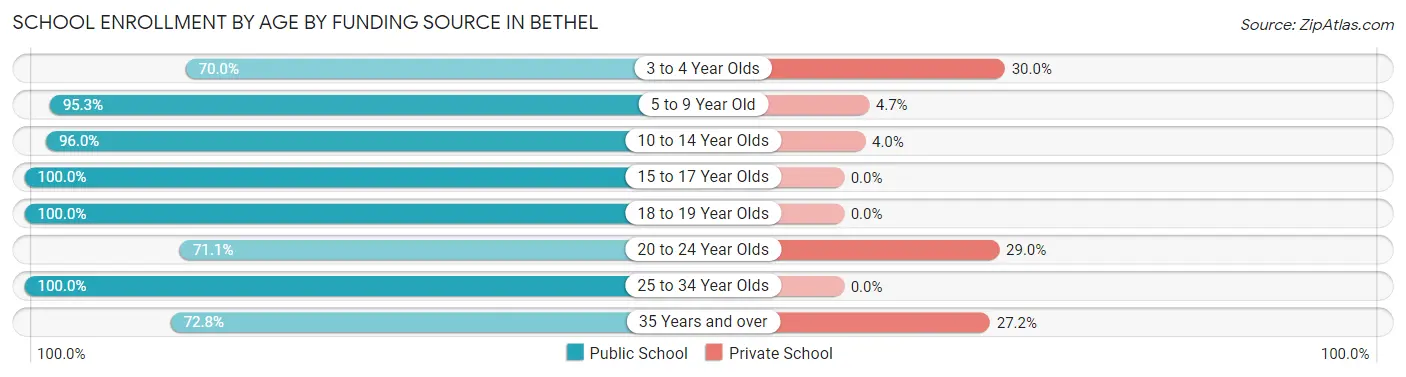
| Age Bracket | Public School | Private School |
| 3 to 4 Year Olds | 7 (70.0%) | 3 (30.0%) |
| 5 to 9 Year Old | 244 (95.3%) | 12 (4.7%) |
| 10 to 14 Year Olds | 241 (96.0%) | 10 (4.0%) |
| 15 to 17 Year Olds | 140 (100.0%) | 0 (0.0%) |
| 18 to 19 Year Olds | 26 (100.0%) | 0 (0.0%) |
| 20 to 24 Year Olds | 27 (71.1%) | 11 (28.9%) |
| 25 to 34 Year Olds | 71 (100.0%) | 0 (0.0%) |
| 35 Years and over | 115 (72.8%) | 43 (27.2%) |
| Total | 871 (91.7%) | 79 (8.3%) |
Educational Attainment by Field of Study in Bethel
Education (127 | 18.0%), engineering (89 | 12.6%), arts & humanities (89 | 12.6%), business (80 | 11.4%), and psychology (77 | 10.9%) are the most common fields of study among 704 individuals in Bethel who have obtained a bachelor's degree or higher.
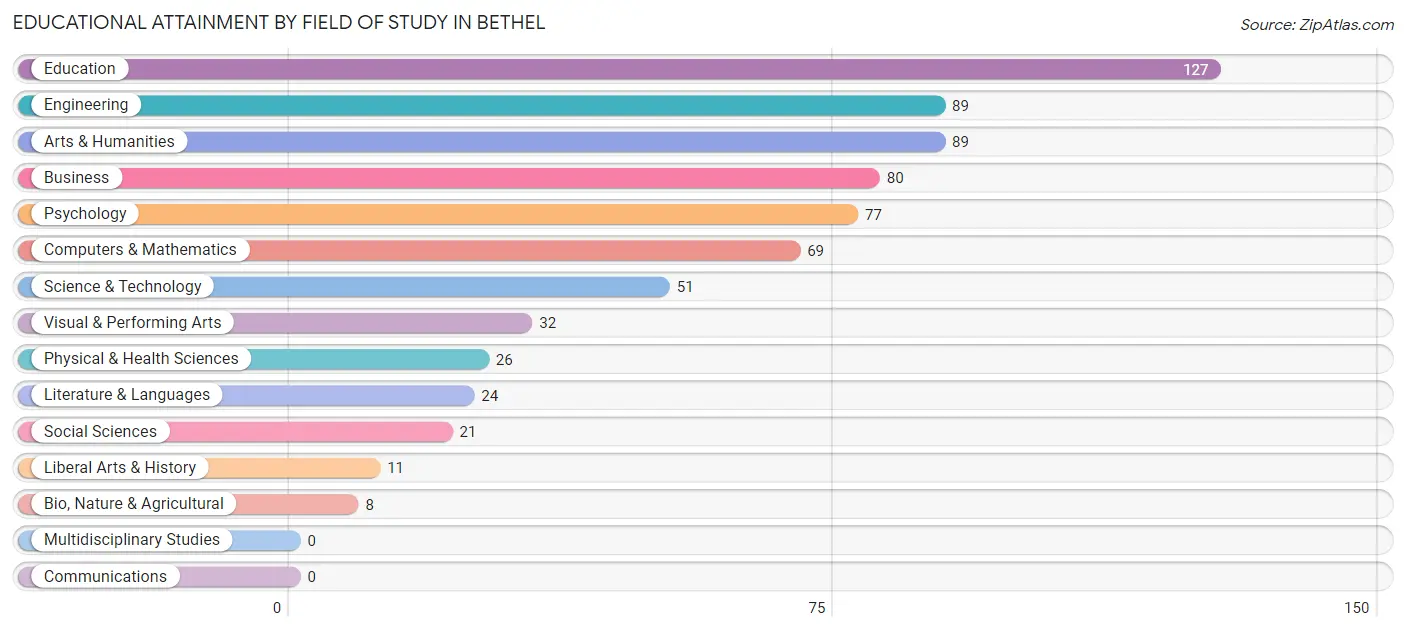
| Field of Study | # Graduates | % Graduates |
| Computers & Mathematics | 69 | 9.8% |
| Bio, Nature & Agricultural | 8 | 1.1% |
| Physical & Health Sciences | 26 | 3.7% |
| Psychology | 77 | 10.9% |
| Social Sciences | 21 | 3.0% |
| Engineering | 89 | 12.6% |
| Multidisciplinary Studies | 0 | 0.0% |
| Science & Technology | 51 | 7.2% |
| Business | 80 | 11.4% |
| Education | 127 | 18.0% |
| Literature & Languages | 24 | 3.4% |
| Liberal Arts & History | 11 | 1.6% |
| Visual & Performing Arts | 32 | 4.5% |
| Communications | 0 | 0.0% |
| Arts & Humanities | 89 | 12.6% |
| Total | 704 | 100.0% |
Transportation & Commute in Bethel
Vehicle Availability by Sex in Bethel
The most prevalent vehicle ownership categories in Bethel are males with 2 vehicles (375, accounting for 36.9%) and females with 2 vehicles (261, making up 47.9%).
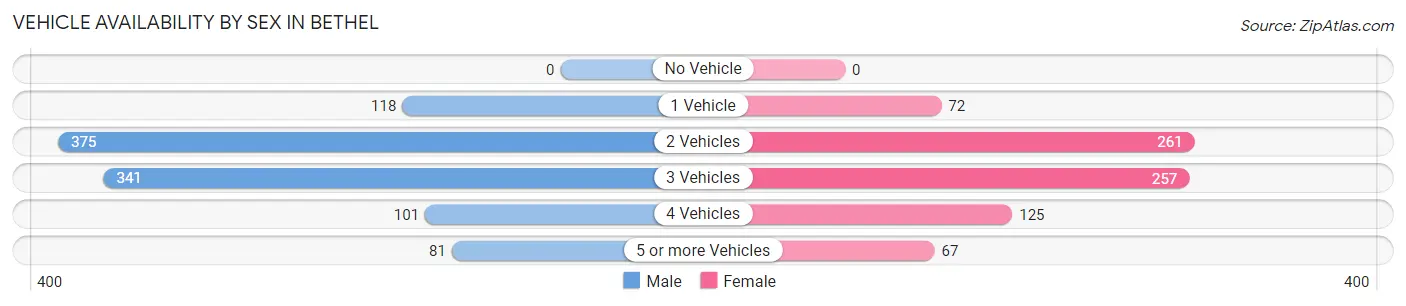
| Vehicles Available | Male | Female |
| No Vehicle | 0 (0.0%) | 0 (0.0%) |
| 1 Vehicle | 118 (11.6%) | 72 (9.2%) |
| 2 Vehicles | 375 (36.9%) | 261 (33.4%) |
| 3 Vehicles | 341 (33.6%) | 257 (32.9%) |
| 4 Vehicles | 101 (9.9%) | 125 (16.0%) |
| 5 or more Vehicles | 81 (8.0%) | 67 (8.6%) |
| Total | 1,016 (100.0%) | 782 (100.0%) |
Commute Time in Bethel
The most frequently occuring commute durations in Bethel are 10 to 14 minutes (271 commuters, 17.2%), 30 to 34 minutes (249 commuters, 15.8%), and 15 to 19 minutes (199 commuters, 12.7%).
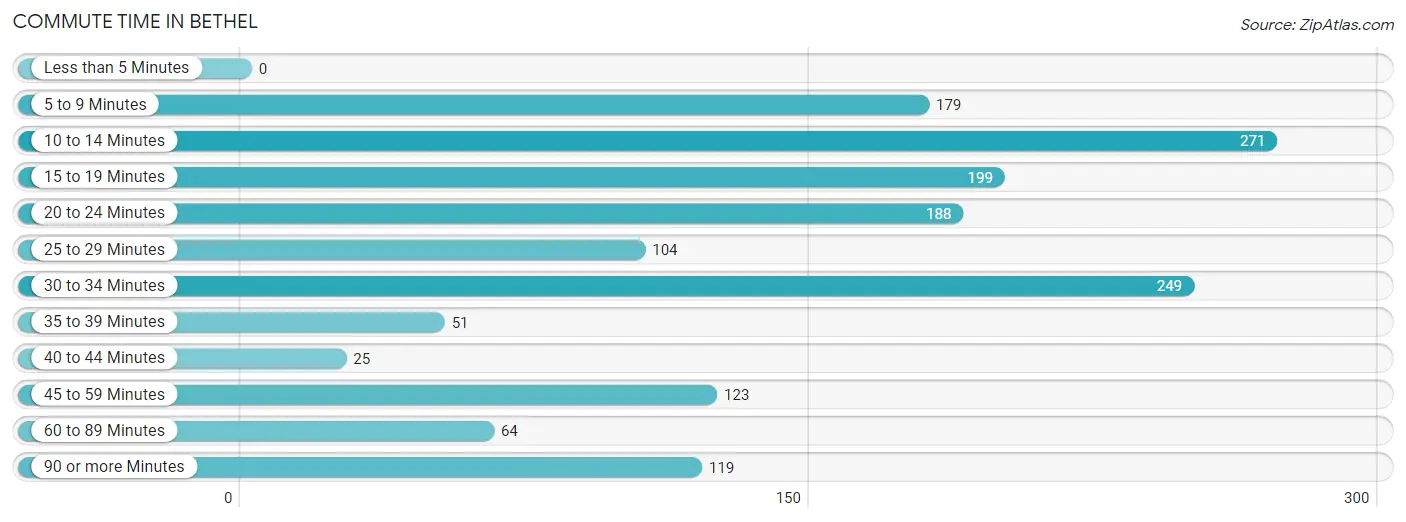
| Commute Time | # Commuters | % Commuters |
| Less than 5 Minutes | 0 | 0.0% |
| 5 to 9 Minutes | 179 | 11.4% |
| 10 to 14 Minutes | 271 | 17.2% |
| 15 to 19 Minutes | 199 | 12.7% |
| 20 to 24 Minutes | 188 | 12.0% |
| 25 to 29 Minutes | 104 | 6.6% |
| 30 to 34 Minutes | 249 | 15.8% |
| 35 to 39 Minutes | 51 | 3.2% |
| 40 to 44 Minutes | 25 | 1.6% |
| 45 to 59 Minutes | 123 | 7.8% |
| 60 to 89 Minutes | 64 | 4.1% |
| 90 or more Minutes | 119 | 7.6% |
Commute Time by Sex in Bethel
The most common commute times in Bethel are 30 to 34 minutes (189 commuters, 22.3%) for males and 10 to 14 minutes (214 commuters, 29.6%) for females.
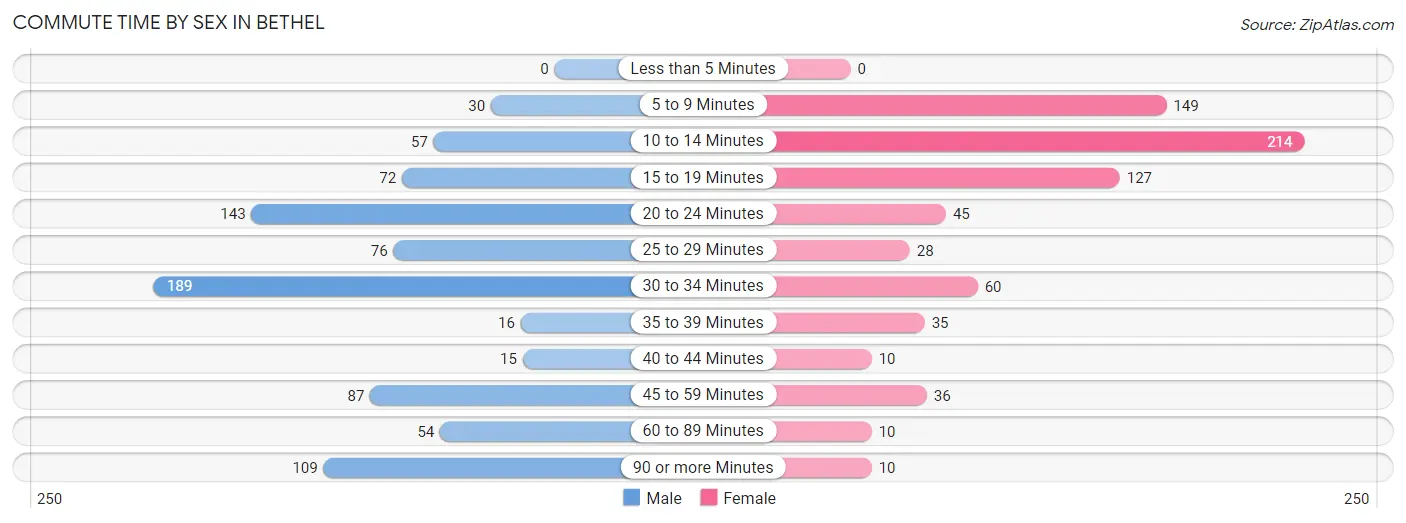
| Commute Time | Male | Female |
| Less than 5 Minutes | 0 (0.0%) | 0 (0.0%) |
| 5 to 9 Minutes | 30 (3.5%) | 149 (20.6%) |
| 10 to 14 Minutes | 57 (6.7%) | 214 (29.6%) |
| 15 to 19 Minutes | 72 (8.5%) | 127 (17.5%) |
| 20 to 24 Minutes | 143 (16.9%) | 45 (6.2%) |
| 25 to 29 Minutes | 76 (9.0%) | 28 (3.9%) |
| 30 to 34 Minutes | 189 (22.3%) | 60 (8.3%) |
| 35 to 39 Minutes | 16 (1.9%) | 35 (4.8%) |
| 40 to 44 Minutes | 15 (1.8%) | 10 (1.4%) |
| 45 to 59 Minutes | 87 (10.3%) | 36 (5.0%) |
| 60 to 89 Minutes | 54 (6.4%) | 10 (1.4%) |
| 90 or more Minutes | 109 (12.9%) | 10 (1.4%) |
Time of Departure to Work by Sex in Bethel
The most frequent times of departure to work in Bethel are 12:00 AM to 4:59 AM (195, 23.0%) for males and 7:30 AM to 7:59 AM (146, 20.2%) for females.
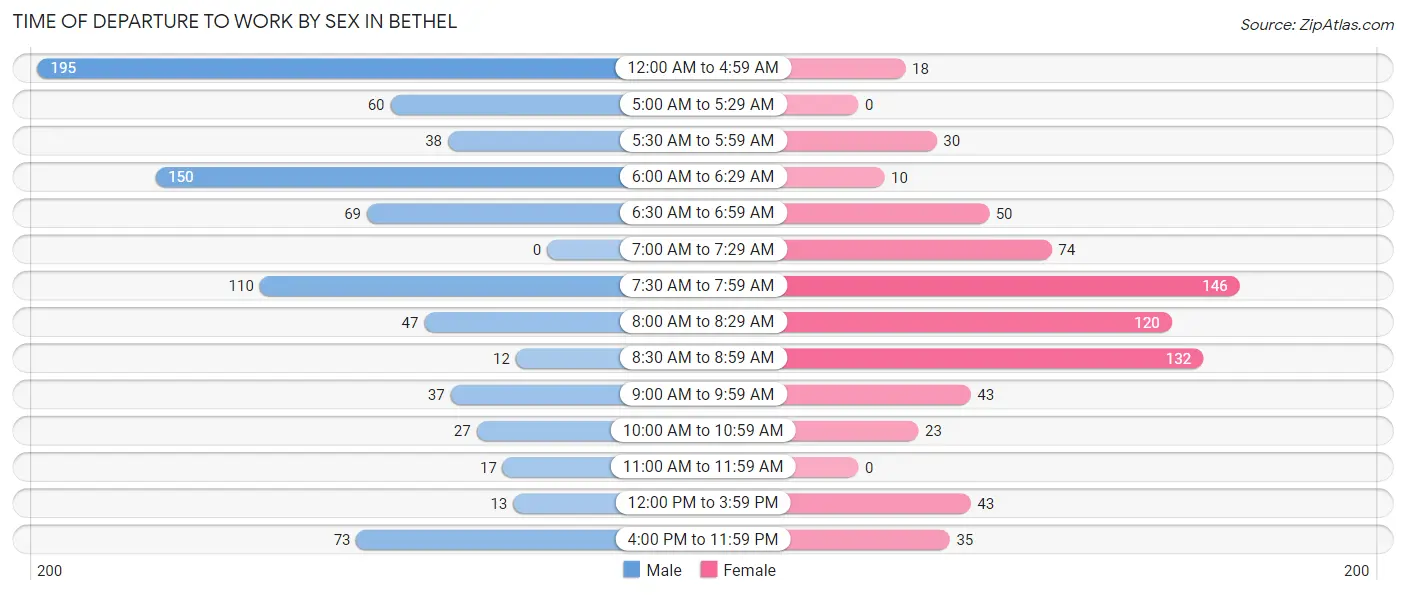
| Time of Departure | Male | Female |
| 12:00 AM to 4:59 AM | 195 (23.0%) | 18 (2.5%) |
| 5:00 AM to 5:29 AM | 60 (7.1%) | 0 (0.0%) |
| 5:30 AM to 5:59 AM | 38 (4.5%) | 30 (4.1%) |
| 6:00 AM to 6:29 AM | 150 (17.7%) | 10 (1.4%) |
| 6:30 AM to 6:59 AM | 69 (8.1%) | 50 (6.9%) |
| 7:00 AM to 7:29 AM | 0 (0.0%) | 74 (10.2%) |
| 7:30 AM to 7:59 AM | 110 (13.0%) | 146 (20.2%) |
| 8:00 AM to 8:29 AM | 47 (5.5%) | 120 (16.6%) |
| 8:30 AM to 8:59 AM | 12 (1.4%) | 132 (18.2%) |
| 9:00 AM to 9:59 AM | 37 (4.4%) | 43 (5.9%) |
| 10:00 AM to 10:59 AM | 27 (3.2%) | 23 (3.2%) |
| 11:00 AM to 11:59 AM | 17 (2.0%) | 0 (0.0%) |
| 12:00 PM to 3:59 PM | 13 (1.5%) | 43 (5.9%) |
| 4:00 PM to 11:59 PM | 73 (8.6%) | 35 (4.8%) |
| Total | 848 (100.0%) | 724 (100.0%) |
Housing Occupancy in Bethel
Occupancy by Ownership in Bethel
Of the total 1,572 dwellings in Bethel, owner-occupied units account for 1,427 (90.8%), while renter-occupied units make up 145 (9.2%).
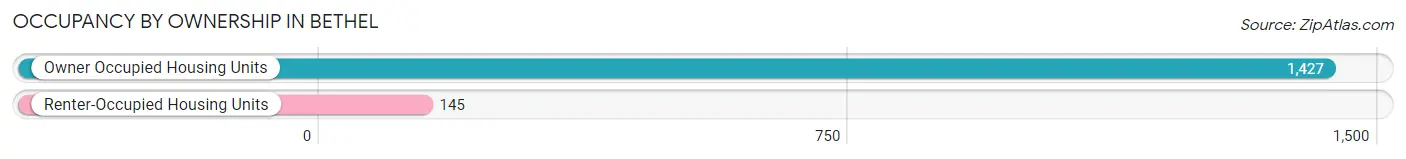
| Occupancy | # Housing Units | % Housing Units |
| Owner Occupied Housing Units | 1,427 | 90.8% |
| Renter-Occupied Housing Units | 145 | 9.2% |
| Total Occupied Housing Units | 1,572 | 100.0% |
Occupancy by Household Size in Bethel
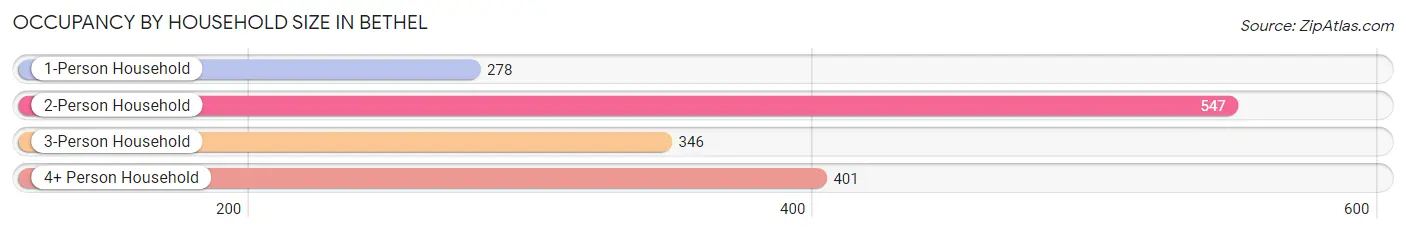
| Household Size | # Housing Units | % Housing Units |
| 1-Person Household | 278 | 17.7% |
| 2-Person Household | 547 | 34.8% |
| 3-Person Household | 346 | 22.0% |
| 4+ Person Household | 401 | 25.5% |
| Total Housing Units | 1,572 | 100.0% |
Occupancy by Ownership by Household Size in Bethel
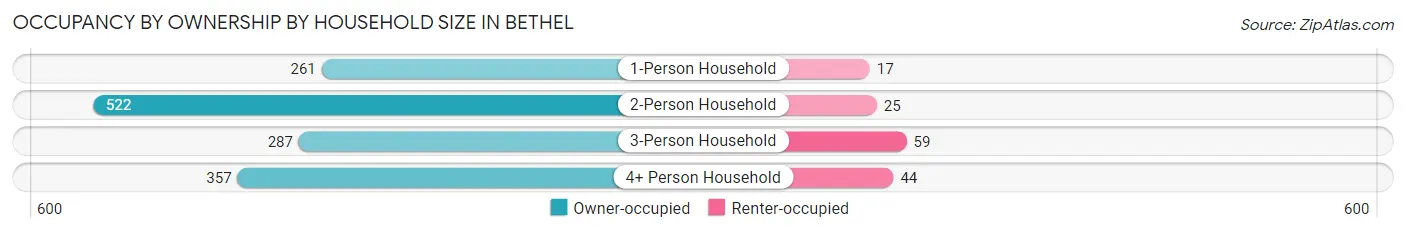
| Household Size | Owner-occupied | Renter-occupied |
| 1-Person Household | 261 (93.9%) | 17 (6.1%) |
| 2-Person Household | 522 (95.4%) | 25 (4.6%) |
| 3-Person Household | 287 (83.0%) | 59 (17.1%) |
| 4+ Person Household | 357 (89.0%) | 44 (11.0%) |
| Total Housing Units | 1,427 (90.8%) | 145 (9.2%) |
Occupancy by Educational Attainment in Bethel
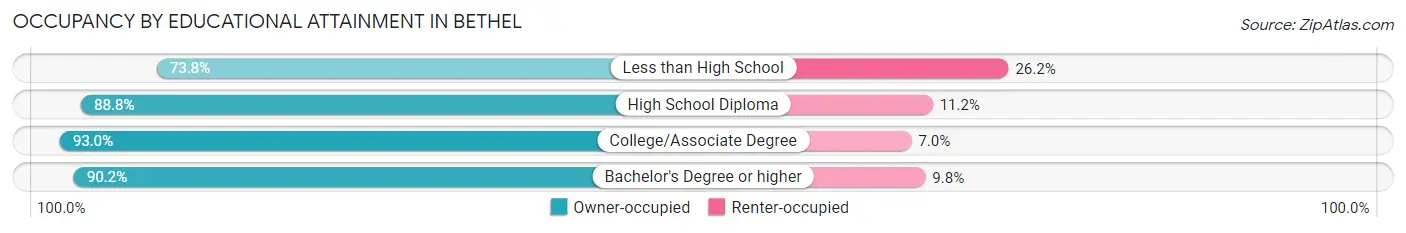
| Household Size | Owner-occupied | Renter-occupied |
| Less than High School | 45 (73.8%) | 16 (26.2%) |
| High School Diploma | 301 (88.8%) | 38 (11.2%) |
| College/Associate Degree | 785 (93.0%) | 59 (7.0%) |
| Bachelor's Degree or higher | 296 (90.2%) | 32 (9.8%) |
Occupancy by Age of Householder in Bethel
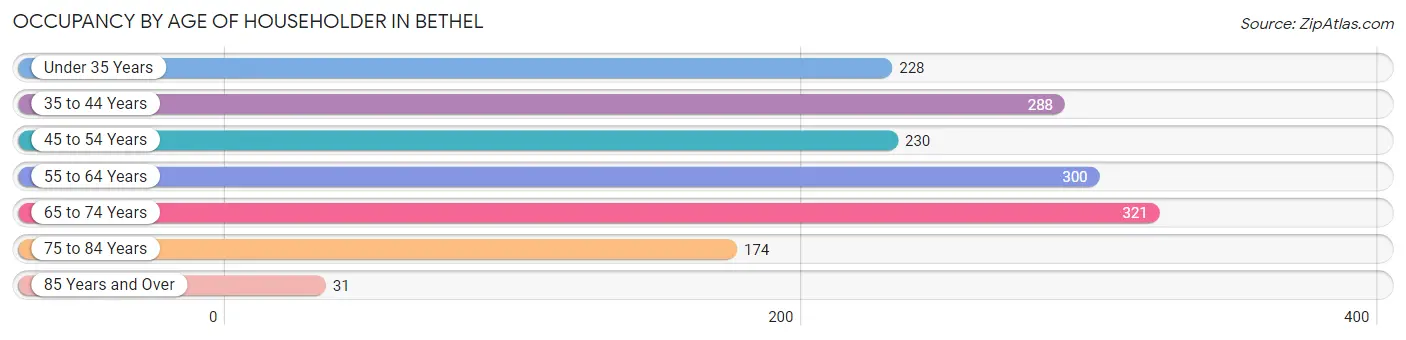
| Age Bracket | # Households | % Households |
| Under 35 Years | 228 | 14.5% |
| 35 to 44 Years | 288 | 18.3% |
| 45 to 54 Years | 230 | 14.6% |
| 55 to 64 Years | 300 | 19.1% |
| 65 to 74 Years | 321 | 20.4% |
| 75 to 84 Years | 174 | 11.1% |
| 85 Years and Over | 31 | 2.0% |
| Total | 1,572 | 100.0% |
Housing Finances in Bethel
Median Income by Occupancy in Bethel
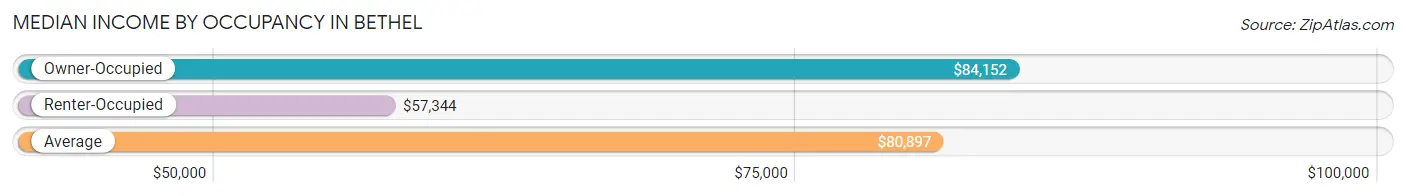
| Occupancy Type | # Households | Median Income |
| Owner-Occupied | 1,427 (90.8%) | $84,152 |
| Renter-Occupied | 145 (9.2%) | $57,344 |
| Average | 1,572 (100.0%) | $80,897 |
Occupancy by Householder Income Bracket in Bethel
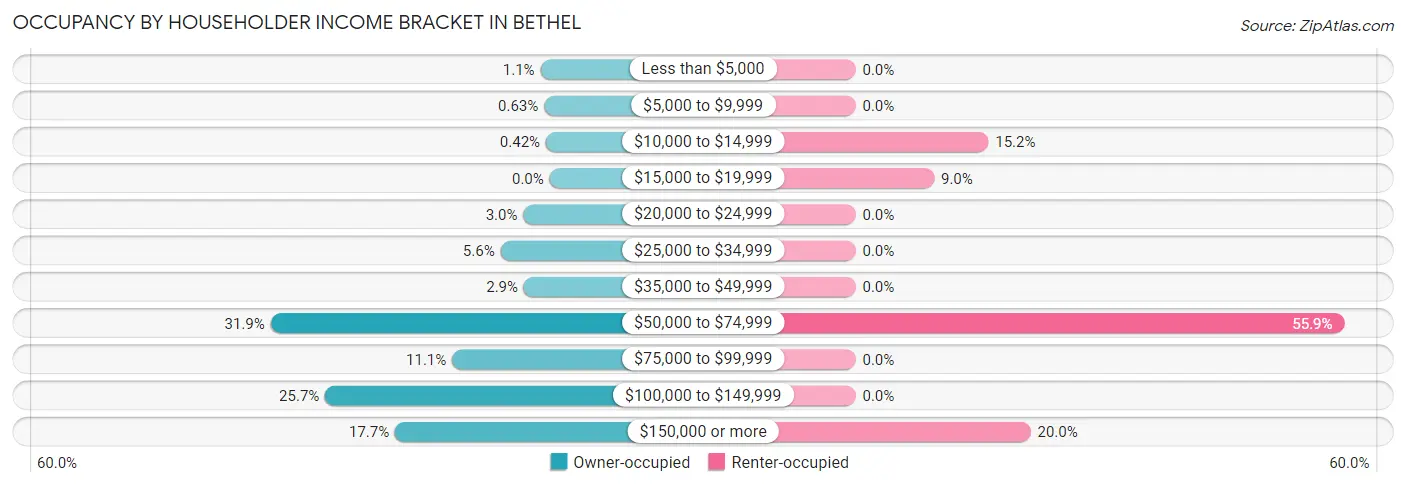
| Income Bracket | Owner-occupied | Renter-occupied |
| Less than $5,000 | 15 (1.1%) | 0 (0.0%) |
| $5,000 to $9,999 | 9 (0.6%) | 0 (0.0%) |
| $10,000 to $14,999 | 6 (0.4%) | 22 (15.2%) |
| $15,000 to $19,999 | 0 (0.0%) | 13 (9.0%) |
| $20,000 to $24,999 | 43 (3.0%) | 0 (0.0%) |
| $25,000 to $34,999 | 80 (5.6%) | 0 (0.0%) |
| $35,000 to $49,999 | 42 (2.9%) | 0 (0.0%) |
| $50,000 to $74,999 | 455 (31.9%) | 81 (55.9%) |
| $75,000 to $99,999 | 159 (11.1%) | 0 (0.0%) |
| $100,000 to $149,999 | 366 (25.7%) | 0 (0.0%) |
| $150,000 or more | 252 (17.7%) | 29 (20.0%) |
| Total | 1,427 (100.0%) | 145 (100.0%) |
Monthly Housing Cost Tiers in Bethel
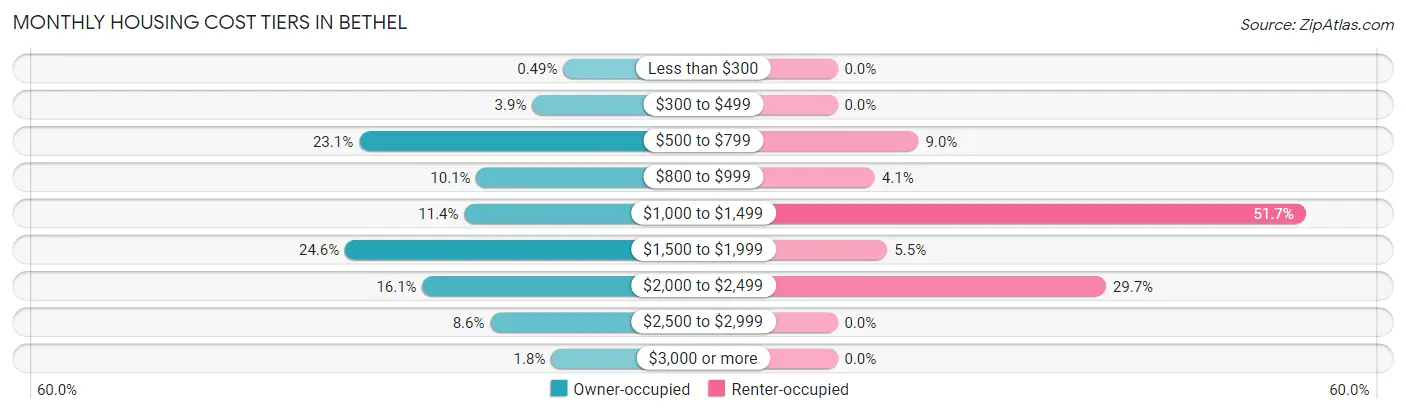
| Monthly Cost | Owner-occupied | Renter-occupied |
| Less than $300 | 7 (0.5%) | 0 (0.0%) |
| $300 to $499 | 56 (3.9%) | 0 (0.0%) |
| $500 to $799 | 329 (23.1%) | 13 (9.0%) |
| $800 to $999 | 144 (10.1%) | 6 (4.1%) |
| $1,000 to $1,499 | 163 (11.4%) | 75 (51.7%) |
| $1,500 to $1,999 | 351 (24.6%) | 8 (5.5%) |
| $2,000 to $2,499 | 229 (16.1%) | 43 (29.7%) |
| $2,500 to $2,999 | 122 (8.6%) | 0 (0.0%) |
| $3,000 or more | 26 (1.8%) | 0 (0.0%) |
| Total | 1,427 (100.0%) | 145 (100.0%) |
Physical Housing Characteristics in Bethel
Housing Structures in Bethel
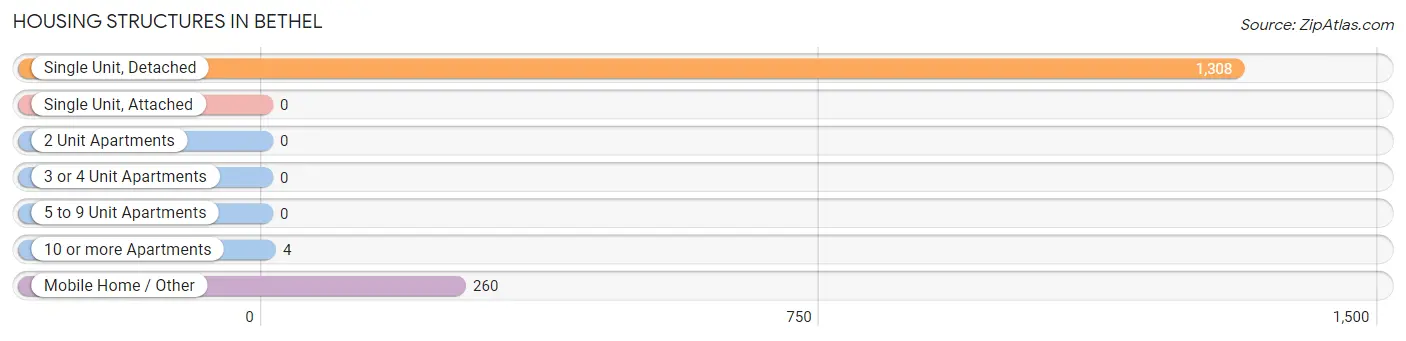
| Structure Type | # Housing Units | % Housing Units |
| Single Unit, Detached | 1,308 | 83.2% |
| Single Unit, Attached | 0 | 0.0% |
| 2 Unit Apartments | 0 | 0.0% |
| 3 or 4 Unit Apartments | 0 | 0.0% |
| 5 to 9 Unit Apartments | 0 | 0.0% |
| 10 or more Apartments | 4 | 0.3% |
| Mobile Home / Other | 260 | 16.5% |
| Total | 1,572 | 100.0% |
Housing Structures by Occupancy in Bethel
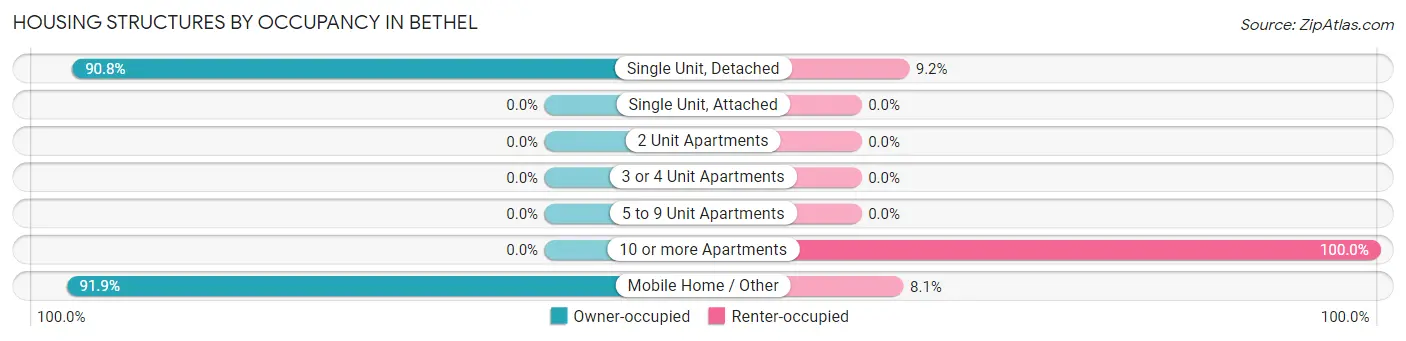
| Structure Type | Owner-occupied | Renter-occupied |
| Single Unit, Detached | 1,188 (90.8%) | 120 (9.2%) |
| Single Unit, Attached | 0 (0.0%) | 0 (0.0%) |
| 2 Unit Apartments | 0 (0.0%) | 0 (0.0%) |
| 3 or 4 Unit Apartments | 0 (0.0%) | 0 (0.0%) |
| 5 to 9 Unit Apartments | 0 (0.0%) | 0 (0.0%) |
| 10 or more Apartments | 0 (0.0%) | 4 (100.0%) |
| Mobile Home / Other | 239 (91.9%) | 21 (8.1%) |
| Total | 1,427 (90.8%) | 145 (9.2%) |
Housing Structures by Number of Rooms in Bethel
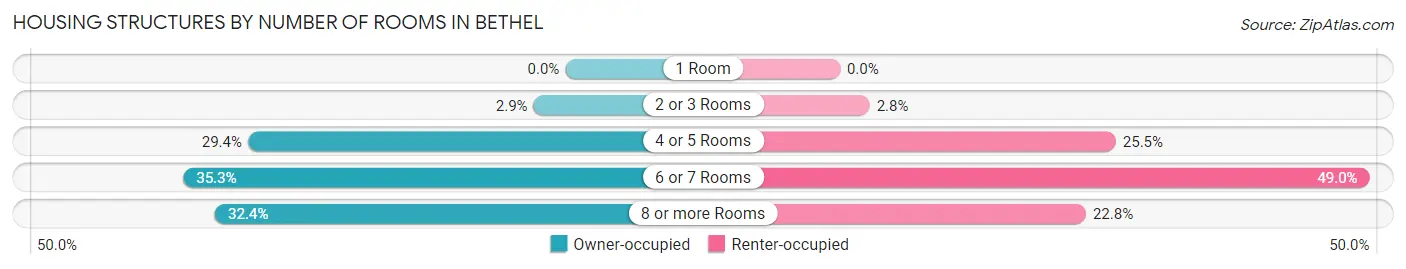
| Number of Rooms | Owner-occupied | Renter-occupied |
| 1 Room | 0 (0.0%) | 0 (0.0%) |
| 2 or 3 Rooms | 42 (2.9%) | 4 (2.8%) |
| 4 or 5 Rooms | 419 (29.4%) | 37 (25.5%) |
| 6 or 7 Rooms | 504 (35.3%) | 71 (49.0%) |
| 8 or more Rooms | 462 (32.4%) | 33 (22.8%) |
| Total | 1,427 (100.0%) | 145 (100.0%) |
Housing Structure by Heating Type in Bethel
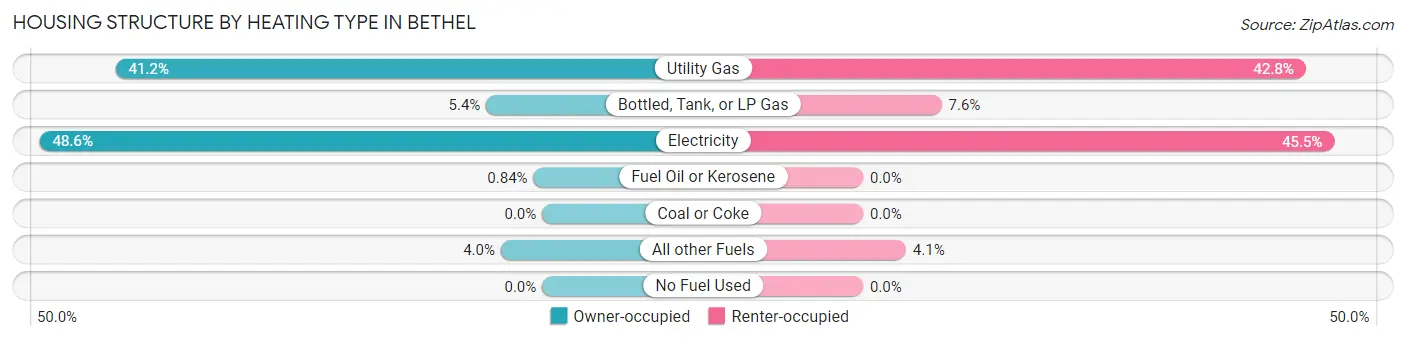
| Heating Type | Owner-occupied | Renter-occupied |
| Utility Gas | 588 (41.2%) | 62 (42.8%) |
| Bottled, Tank, or LP Gas | 77 (5.4%) | 11 (7.6%) |
| Electricity | 693 (48.6%) | 66 (45.5%) |
| Fuel Oil or Kerosene | 12 (0.8%) | 0 (0.0%) |
| Coal or Coke | 0 (0.0%) | 0 (0.0%) |
| All other Fuels | 57 (4.0%) | 6 (4.1%) |
| No Fuel Used | 0 (0.0%) | 0 (0.0%) |
| Total | 1,427 (100.0%) | 145 (100.0%) |
Household Vehicle Usage in Bethel
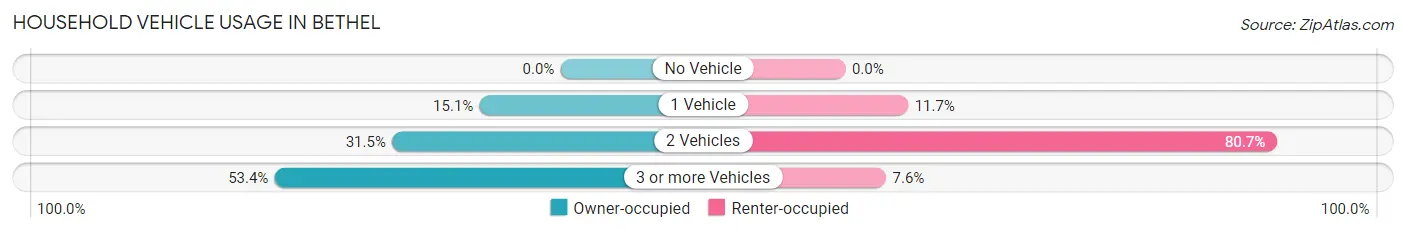
| Vehicles per Household | Owner-occupied | Renter-occupied |
| No Vehicle | 0 (0.0%) | 0 (0.0%) |
| 1 Vehicle | 216 (15.1%) | 17 (11.7%) |
| 2 Vehicles | 449 (31.5%) | 117 (80.7%) |
| 3 or more Vehicles | 762 (53.4%) | 11 (7.6%) |
| Total | 1,427 (100.0%) | 145 (100.0%) |
Real Estate & Mortgages in Bethel
Real Estate and Mortgage Overview in Bethel
| Characteristic | Without Mortgage | With Mortgage |
| Housing Units | 513 | 914 |
| Median Property Value | $324,700 | $431,800 |
| Median Household Income | $69,370 | $202 |
| Monthly Housing Costs | $689 | $26 |
| Real Estate Taxes | $3,505 | $0 |
Property Value by Mortgage Status in Bethel
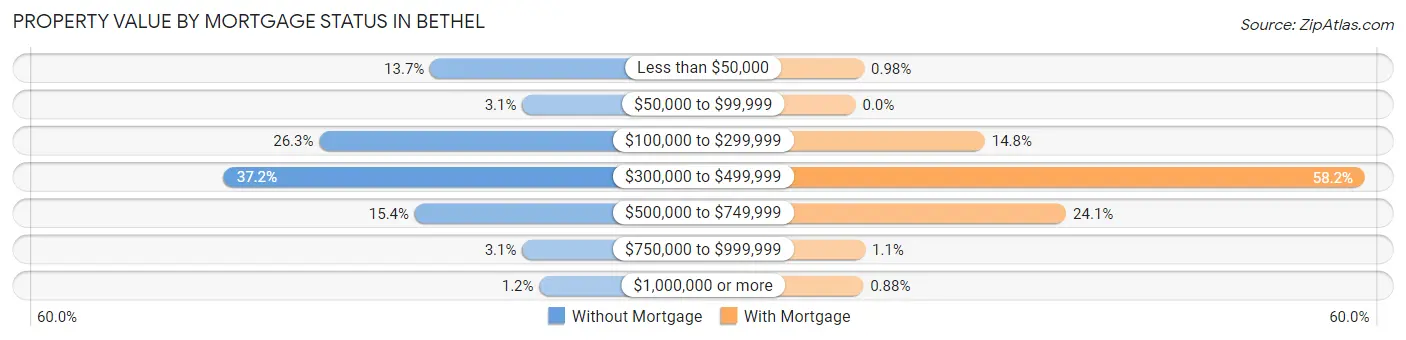
| Property Value | Without Mortgage | With Mortgage |
| Less than $50,000 | 70 (13.7%) | 9 (1.0%) |
| $50,000 to $99,999 | 16 (3.1%) | 0 (0.0%) |
| $100,000 to $299,999 | 135 (26.3%) | 135 (14.8%) |
| $300,000 to $499,999 | 191 (37.2%) | 532 (58.2%) |
| $500,000 to $749,999 | 79 (15.4%) | 220 (24.1%) |
| $750,000 to $999,999 | 16 (3.1%) | 10 (1.1%) |
| $1,000,000 or more | 6 (1.2%) | 8 (0.9%) |
| Total | 513 (100.0%) | 914 (100.0%) |
Household Income by Mortgage Status in Bethel
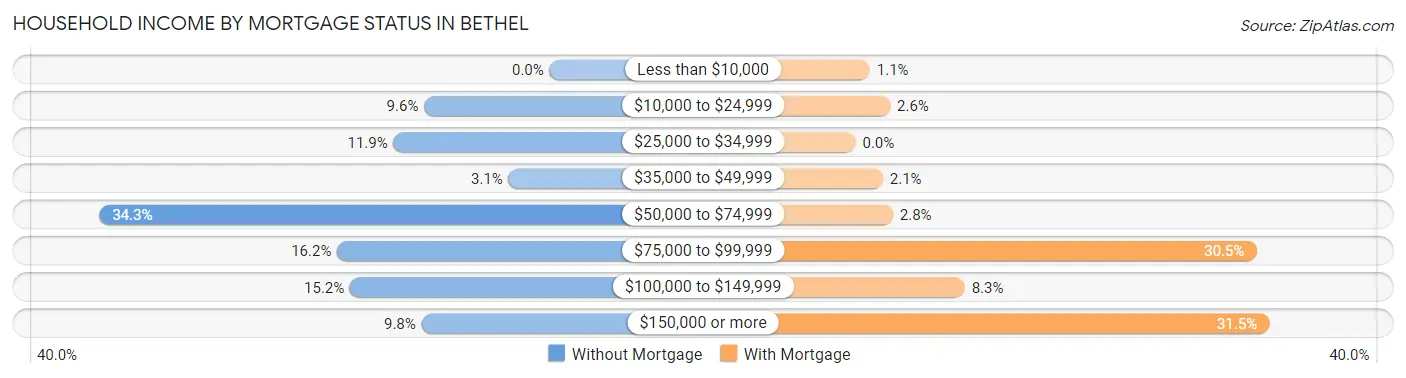
| Household Income | Without Mortgage | With Mortgage |
| Less than $10,000 | 0 (0.0%) | 10 (1.1%) |
| $10,000 to $24,999 | 49 (9.6%) | 24 (2.6%) |
| $25,000 to $34,999 | 61 (11.9%) | 0 (0.0%) |
| $35,000 to $49,999 | 16 (3.1%) | 19 (2.1%) |
| $50,000 to $74,999 | 176 (34.3%) | 26 (2.8%) |
| $75,000 to $99,999 | 83 (16.2%) | 279 (30.5%) |
| $100,000 to $149,999 | 78 (15.2%) | 76 (8.3%) |
| $150,000 or more | 50 (9.8%) | 288 (31.5%) |
| Total | 513 (100.0%) | 914 (100.0%) |
Property Value to Household Income Ratio in Bethel
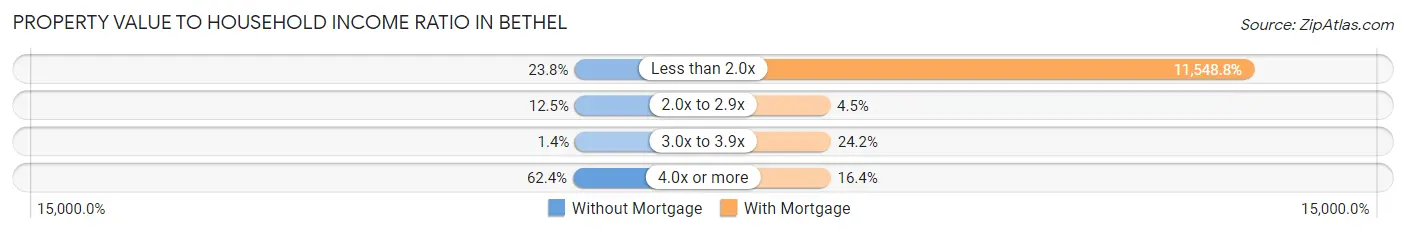
| Value-to-Income Ratio | Without Mortgage | With Mortgage |
| Less than 2.0x | 122 (23.8%) | 105,556 (11,548.8%) |
| 2.0x to 2.9x | 64 (12.5%) | 41 (4.5%) |
| 3.0x to 3.9x | 7 (1.4%) | 221 (24.2%) |
| 4.0x or more | 320 (62.4%) | 150 (16.4%) |
| Total | 513 (100.0%) | 914 (100.0%) |
Real Estate Taxes by Mortgage Status in Bethel
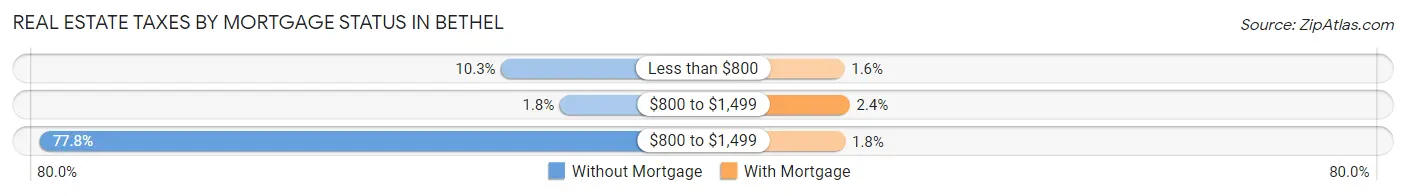
| Property Taxes | Without Mortgage | With Mortgage |
| Less than $800 | 53 (10.3%) | 15 (1.6%) |
| $800 to $1,499 | 9 (1.8%) | 22 (2.4%) |
| $800 to $1,499 | 399 (77.8%) | 16 (1.8%) |
| Total | 513 (100.0%) | 914 (100.0%) |
Health & Disability in Bethel
Health Insurance Coverage by Age in Bethel
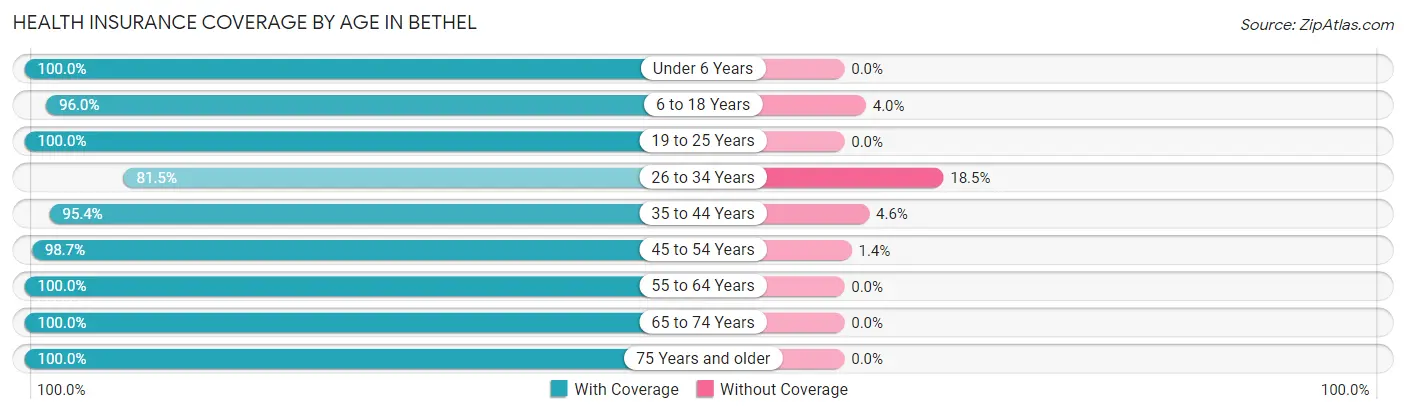
| Age Bracket | With Coverage | Without Coverage |
| Under 6 Years | 185 (100.0%) | 0 (0.0%) |
| 6 to 18 Years | 647 (96.0%) | 27 (4.0%) |
| 19 to 25 Years | 226 (100.0%) | 0 (0.0%) |
| 26 to 34 Years | 455 (81.5%) | 103 (18.5%) |
| 35 to 44 Years | 597 (95.4%) | 29 (4.6%) |
| 45 to 54 Years | 510 (98.7%) | 7 (1.3%) |
| 55 to 64 Years | 599 (100.0%) | 0 (0.0%) |
| 65 to 74 Years | 501 (100.0%) | 0 (0.0%) |
| 75 Years and older | 317 (100.0%) | 0 (0.0%) |
| Total | 4,037 (96.1%) | 166 (4.0%) |
Health Insurance Coverage by Citizenship Status in Bethel
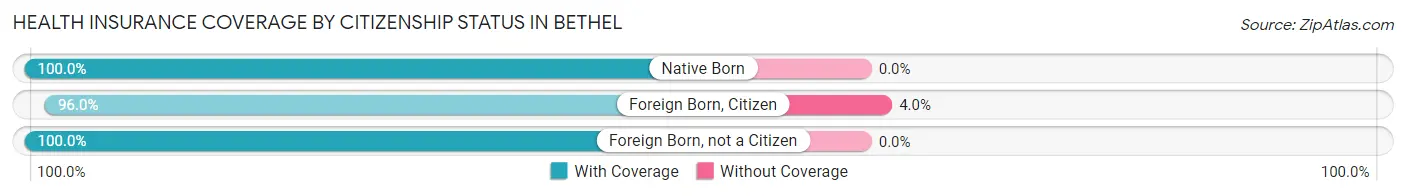
| Citizenship Status | With Coverage | Without Coverage |
| Native Born | 185 (100.0%) | 0 (0.0%) |
| Foreign Born, Citizen | 647 (96.0%) | 27 (4.0%) |
| Foreign Born, not a Citizen | 226 (100.0%) | 0 (0.0%) |
Health Insurance Coverage by Household Income in Bethel
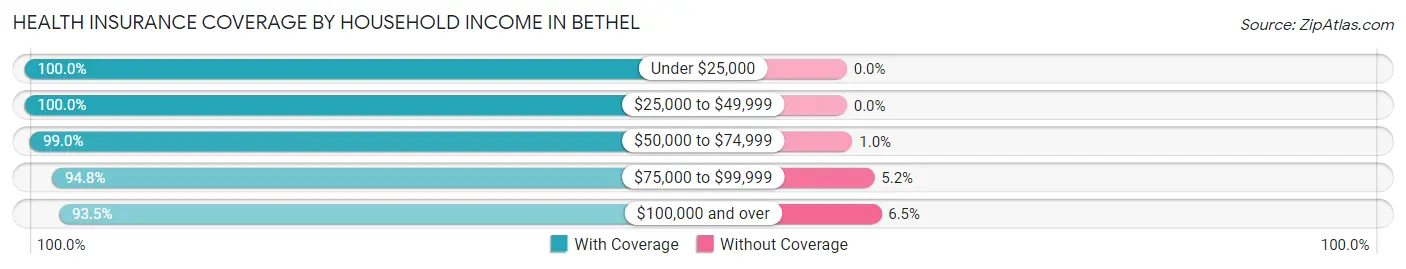
| Household Income | With Coverage | Without Coverage |
| Under $25,000 | 230 (100.0%) | 0 (0.0%) |
| $25,000 to $49,999 | 246 (100.0%) | 0 (0.0%) |
| $50,000 to $74,999 | 1,236 (99.0%) | 13 (1.0%) |
| $75,000 to $99,999 | 478 (94.8%) | 26 (5.2%) |
| $100,000 and over | 1,840 (93.5%) | 127 (6.5%) |
Public vs Private Health Insurance Coverage by Age in Bethel
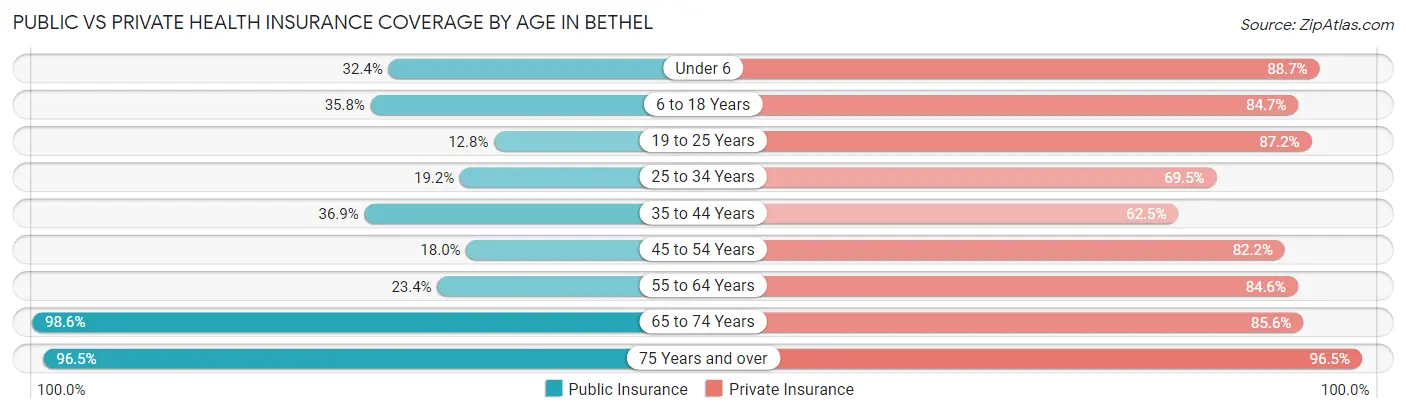
| Age Bracket | Public Insurance | Private Insurance |
| Under 6 | 60 (32.4%) | 164 (88.6%) |
| 6 to 18 Years | 241 (35.8%) | 571 (84.7%) |
| 19 to 25 Years | 29 (12.8%) | 197 (87.2%) |
| 25 to 34 Years | 107 (19.2%) | 388 (69.5%) |
| 35 to 44 Years | 231 (36.9%) | 391 (62.5%) |
| 45 to 54 Years | 93 (18.0%) | 425 (82.2%) |
| 55 to 64 Years | 140 (23.4%) | 507 (84.6%) |
| 65 to 74 Years | 494 (98.6%) | 429 (85.6%) |
| 75 Years and over | 306 (96.5%) | 306 (96.5%) |
| Total | 1,701 (40.5%) | 3,378 (80.4%) |
Disability Status by Sex by Age in Bethel
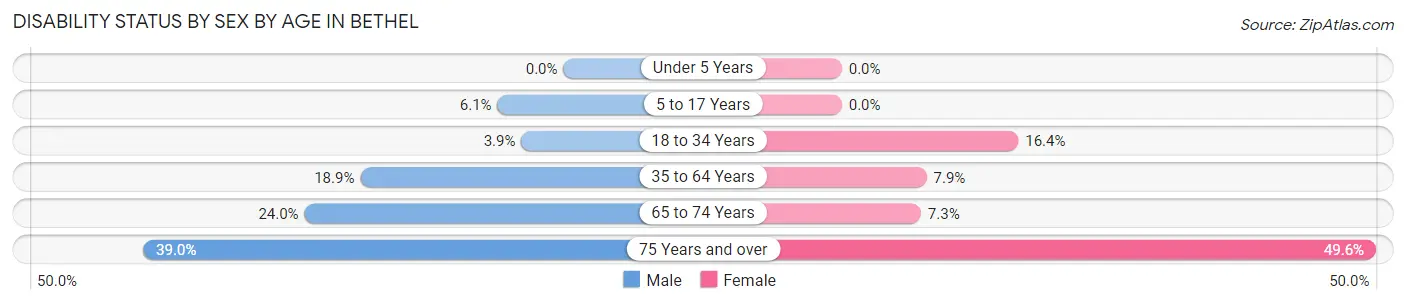
| Age Bracket | Male | Female |
| Under 5 Years | 0 (0.0%) | 0 (0.0%) |
| 5 to 17 Years | 17 (6.1%) | 0 (0.0%) |
| 18 to 34 Years | 19 (3.9%) | 58 (16.4%) |
| 35 to 64 Years | 144 (18.9%) | 77 (7.9%) |
| 65 to 74 Years | 68 (24.0%) | 16 (7.3%) |
| 75 Years and over | 78 (39.0%) | 58 (49.6%) |
Disability Class by Sex by Age in Bethel
Disability Class: Hearing Difficulty
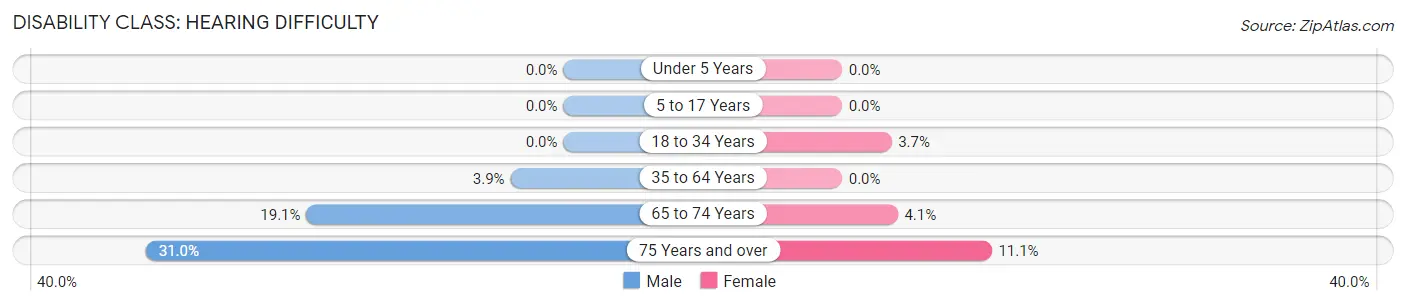
| Age Bracket | Male | Female |
| Under 5 Years | 0 (0.0%) | 0 (0.0%) |
| 5 to 17 Years | 0 (0.0%) | 0 (0.0%) |
| 18 to 34 Years | 0 (0.0%) | 13 (3.7%) |
| 35 to 64 Years | 30 (3.9%) | 0 (0.0%) |
| 65 to 74 Years | 54 (19.1%) | 9 (4.1%) |
| 75 Years and over | 62 (31.0%) | 13 (11.1%) |
Disability Class: Vision Difficulty
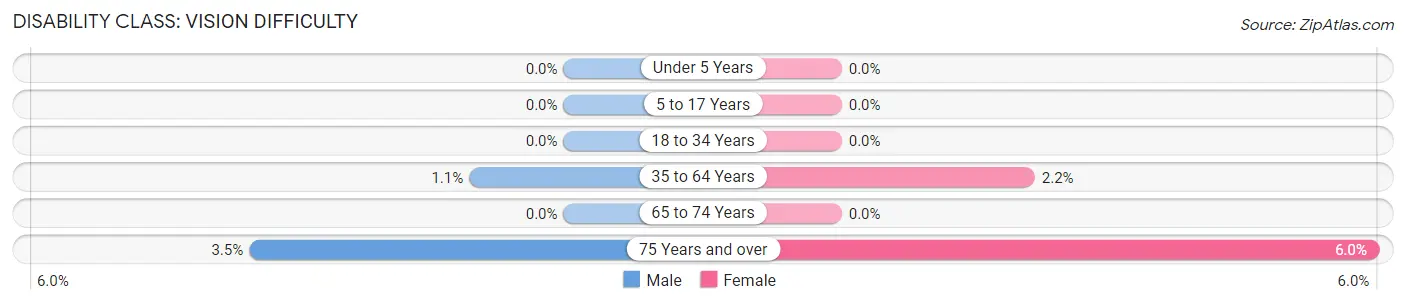
| Age Bracket | Male | Female |
| Under 5 Years | 0 (0.0%) | 0 (0.0%) |
| 5 to 17 Years | 0 (0.0%) | 0 (0.0%) |
| 18 to 34 Years | 0 (0.0%) | 0 (0.0%) |
| 35 to 64 Years | 8 (1.1%) | 21 (2.1%) |
| 65 to 74 Years | 0 (0.0%) | 0 (0.0%) |
| 75 Years and over | 7 (3.5%) | 7 (6.0%) |
Disability Class: Cognitive Difficulty
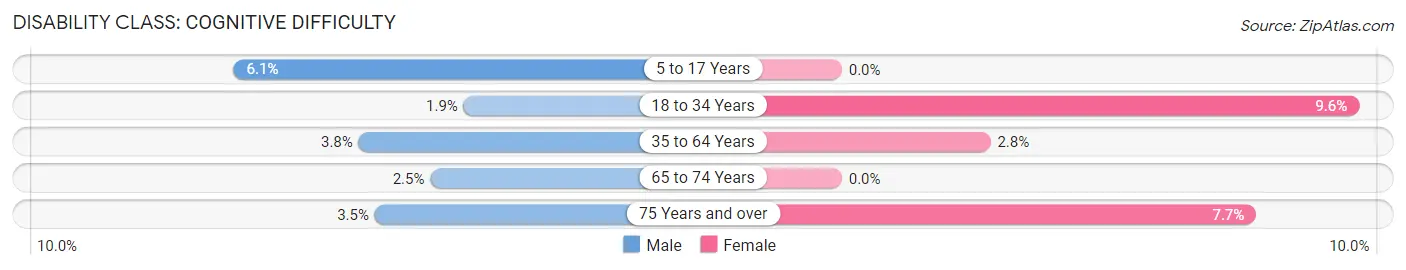
| Age Bracket | Male | Female |
| 5 to 17 Years | 17 (6.1%) | 0 (0.0%) |
| 18 to 34 Years | 9 (1.8%) | 34 (9.6%) |
| 35 to 64 Years | 29 (3.8%) | 27 (2.8%) |
| 65 to 74 Years | 7 (2.5%) | 0 (0.0%) |
| 75 Years and over | 7 (3.5%) | 9 (7.7%) |
Disability Class: Ambulatory Difficulty
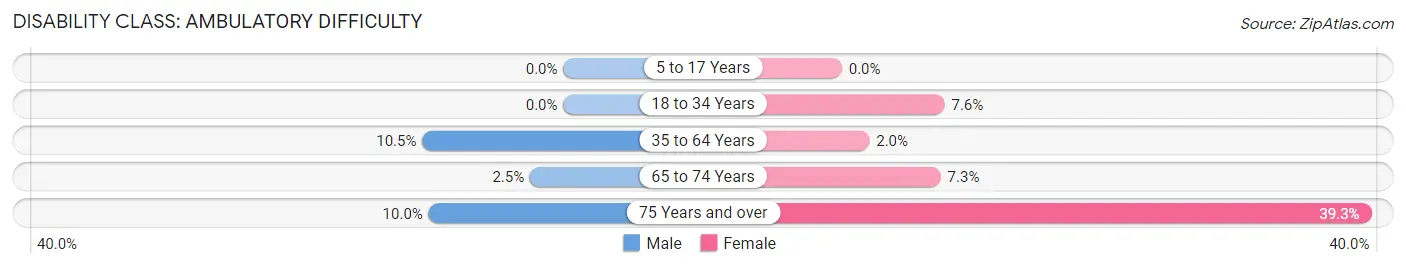
| Age Bracket | Male | Female |
| 5 to 17 Years | 0 (0.0%) | 0 (0.0%) |
| 18 to 34 Years | 0 (0.0%) | 27 (7.6%) |
| 35 to 64 Years | 80 (10.5%) | 20 (2.0%) |
| 65 to 74 Years | 7 (2.5%) | 16 (7.3%) |
| 75 Years and over | 20 (10.0%) | 46 (39.3%) |
Disability Class: Self-Care Difficulty
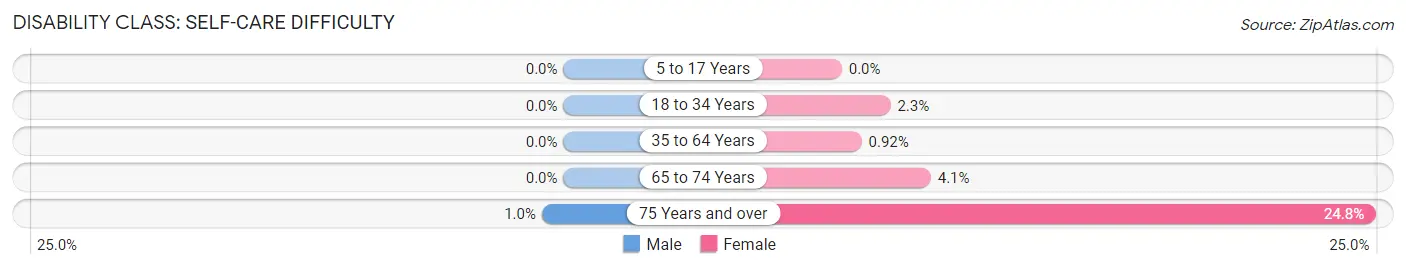
| Age Bracket | Male | Female |
| 5 to 17 Years | 0 (0.0%) | 0 (0.0%) |
| 18 to 34 Years | 0 (0.0%) | 8 (2.3%) |
| 35 to 64 Years | 0 (0.0%) | 9 (0.9%) |
| 65 to 74 Years | 0 (0.0%) | 9 (4.1%) |
| 75 Years and over | 2 (1.0%) | 29 (24.8%) |
Technology Access in Bethel
Computing Device Access in Bethel
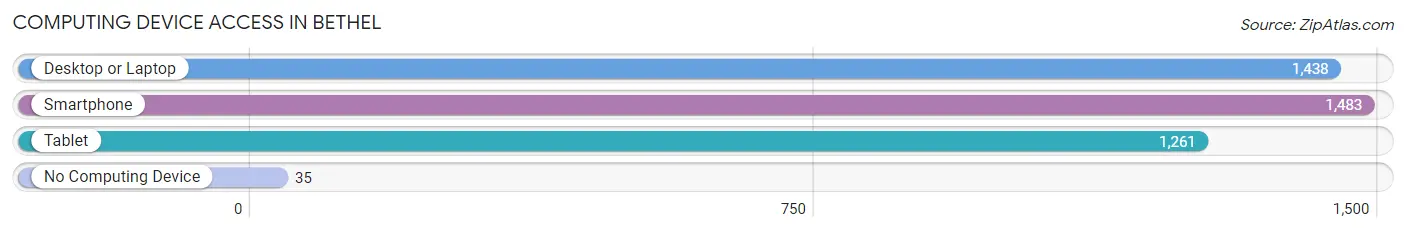
| Device Type | # Households | % Households |
| Desktop or Laptop | 1,438 | 91.5% |
| Smartphone | 1,483 | 94.3% |
| Tablet | 1,261 | 80.2% |
| No Computing Device | 35 | 2.2% |
| Total | 1,572 | 100.0% |
Internet Access in Bethel
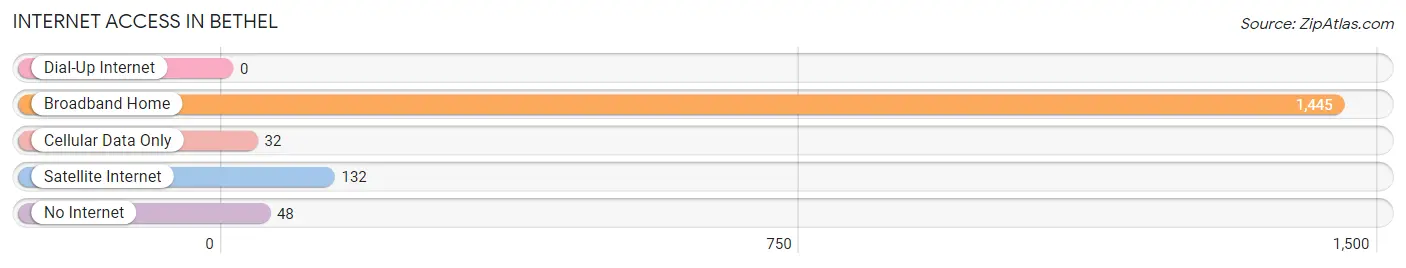
| Internet Type | # Households | % Households |
| Dial-Up Internet | 0 | 0.0% |
| Broadband Home | 1,445 | 91.9% |
| Cellular Data Only | 32 | 2.0% |
| Satellite Internet | 132 | 8.4% |
| No Internet | 48 | 3.0% |
| Total | 1,572 | 100.0% |
Bethel Summary
Bethel, Washington is a small unincorporated community located in Pierce County, Washington. It is situated in the foothills of the Cascade Mountains, approximately 25 miles east of Tacoma and 40 miles south of Seattle. The population of Bethel was estimated to be 1,845 in 2019.
History
Bethel was first settled in the late 1800s by a group of Swedish immigrants. The area was originally known as "Swedetown" and was home to a number of Swedish-American families. The town was officially incorporated in 1891 and was named after Bethel, Connecticut, the hometown of one of the original settlers.
In the early 1900s, Bethel was a thriving logging and farming community. The town was home to several sawmills, a general store, a post office, and a school. The town also had a number of churches, including a Swedish Lutheran church.
In the 1950s, Bethel began to experience a decline in population as many of the town's residents moved away in search of better economic opportunities. The town's population continued to decline until the late 1990s, when it began to experience a resurgence.
Geography
Bethel is located in the foothills of the Cascade Mountains, approximately 25 miles east of Tacoma and 40 miles south of Seattle. The town is situated at an elevation of 1,000 feet and is surrounded by forests and rolling hills. The nearby White River flows through the town and provides a source of recreation for the local residents.
The climate in Bethel is mild and temperate, with warm summers and cool winters. The average annual temperature is around 50 degrees Fahrenheit. The area receives an average of 40 inches of precipitation each year, with most of it falling in the form of rain.
Economy
Bethel's economy is largely based on agriculture and forestry. The town is home to several farms, which produce a variety of crops, including apples, cherries, and hay. The nearby forests provide a source of timber for the local sawmills.
The town is also home to a number of small businesses, including restaurants, retail stores, and service providers. The town is also home to a number of small manufacturing companies, which produce a variety of products, including furniture and clothing.
Demographics
As of 2019, the population of Bethel was estimated to be 1,845. The town is predominantly white, with approximately 90% of the population identifying as Caucasian. The remaining 10% of the population is made up of African Americans, Asians, and Hispanics.
The median household income in Bethel is $50,000, which is slightly lower than the national average. The town has a poverty rate of 11.3%, which is slightly higher than the national average. The town also has a high rate of unemployment, with an estimated 8.2% of the population being unemployed.
Conclusion
Bethel, Washington is a small unincorporated community located in Pierce County, Washington. It is situated in the foothills of the Cascade Mountains, approximately 25 miles east of Tacoma and 40 miles south of Seattle. The population of Bethel was estimated to be 1,845 in 2019. The town's economy is largely based on agriculture and forestry, and the town is home to a number of small businesses. The town is predominantly white, with approximately 90% of the population identifying as Caucasian. The median household income in Bethel is $50,000, which is slightly lower than the national average. The town has a poverty rate of 11.3%, which is slightly higher than the national average.
Common Questions
What is Per Capita Income in Bethel?
Per Capita income in Bethel is $38,764.
What is the Median Family Income in Bethel?
Median Family Income in Bethel is $80,865.
What is the Median Household income in Bethel?
Median Household Income in Bethel is $80,897.
What is Income or Wage Gap in Bethel?
Income or Wage Gap in Bethel is 43.9%.
Women in Bethel earn 56.1 cents for every dollar earned by a man.
What is Family Income Deficit in Bethel?
Family Income Deficit in Bethel is $14,426.
Families that are below poverty line in Bethel earn $14,426 less on average than the poverty threshold level.
What is Inequality or Gini Index in Bethel?
Inequality or Gini Index in Bethel is 0.36.
What is the Total Population of Bethel?
Total Population of Bethel is 4,220.
What is the Total Male Population of Bethel?
Total Male Population of Bethel is 2,127.
What is the Total Female Population of Bethel?
Total Female Population of Bethel is 2,093.
What is the Ratio of Males per 100 Females in Bethel?
There are 101.62 Males per 100 Females in Bethel.
What is the Ratio of Females per 100 Males in Bethel?
There are 98.40 Females per 100 Males in Bethel.
What is the Median Population Age in Bethel?
Median Population Age in Bethel is 42.1 Years.
What is the Average Family Size in Bethel
Average Family Size in Bethel is 3.0 People.
What is the Average Household Size in Bethel
Average Household Size in Bethel is 2.7 People.
How Large is the Labor Force in Bethel?
There are 2,070 People in the Labor Forcein in Bethel.
What is the Percentage of People in the Labor Force in Bethel?
58.4% of People are in the Labor Force in Bethel.
What is the Unemployment Rate in Bethel?
Unemployment Rate in Bethel is 13.2%.