Enetai, WA Map & Demographics
Enetai Map
Enetai Overview
$39,288
PER CAPITA INCOME
$67,143
AVG FAMILY INCOME
$68,839
AVG HOUSEHOLD INCOME
34.7%
WAGE / INCOME GAP [ % ]
65.3¢/ $1
WAGE / INCOME GAP [ $ ]
0.38
INEQUALITY / GINI INDEX
1,869
TOTAL POPULATION
945
MALE POPULATION
924
FEMALE POPULATION
102.27
MALES / 100 FEMALES
97.78
FEMALES / 100 MALES
38.7
MEDIAN AGE
2.9
AVG FAMILY SIZE
2.6
AVG HOUSEHOLD SIZE
867
LABOR FORCE [ PEOPLE ]
57.4%
PERCENT IN LABOR FORCE
10.1%
UNEMPLOYMENT RATE
Income in Enetai
Income Overview in Enetai
Per Capita Income in Enetai is $39,288, while median incomes of families and households are $67,143 and $68,839 respectively.
| Characteristic | Number | Measure |
| Per Capita Income | 1,869 | $39,288 |
| Median Family Income | 504 | $67,143 |
| Mean Family Income | 504 | $107,378 |
| Median Household Income | 707 | $68,839 |
| Mean Household Income | 707 | $103,459 |
| Income Deficit | 504 | $0 |
| Wage / Income Gap (%) | 1,869 | 34.67% |
| Wage / Income Gap ($) | 1,869 | 65.33¢ per $1 |
| Gini / Inequality Index | 1,869 | 0.38 |
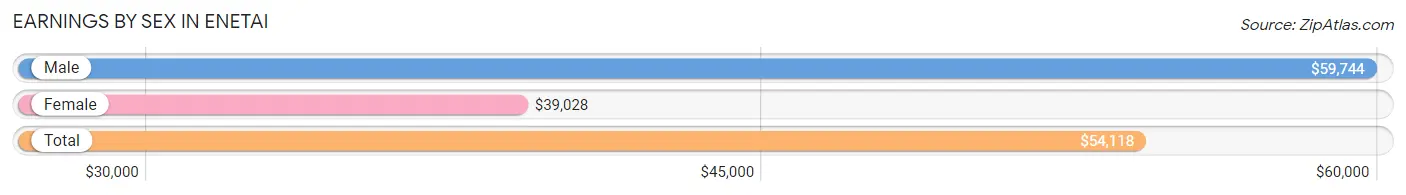
Earnings by Sex in Enetai
Average Earnings in Enetai are $54,118, $59,744 for men and $39,028 for women, a difference of 34.7%.
| Sex | Number | Average Earnings |
| Male | 473 (52.7%) | $59,744 |
| Female | 425 (47.3%) | $39,028 |
| Total | 898 (100.0%) | $54,118 |
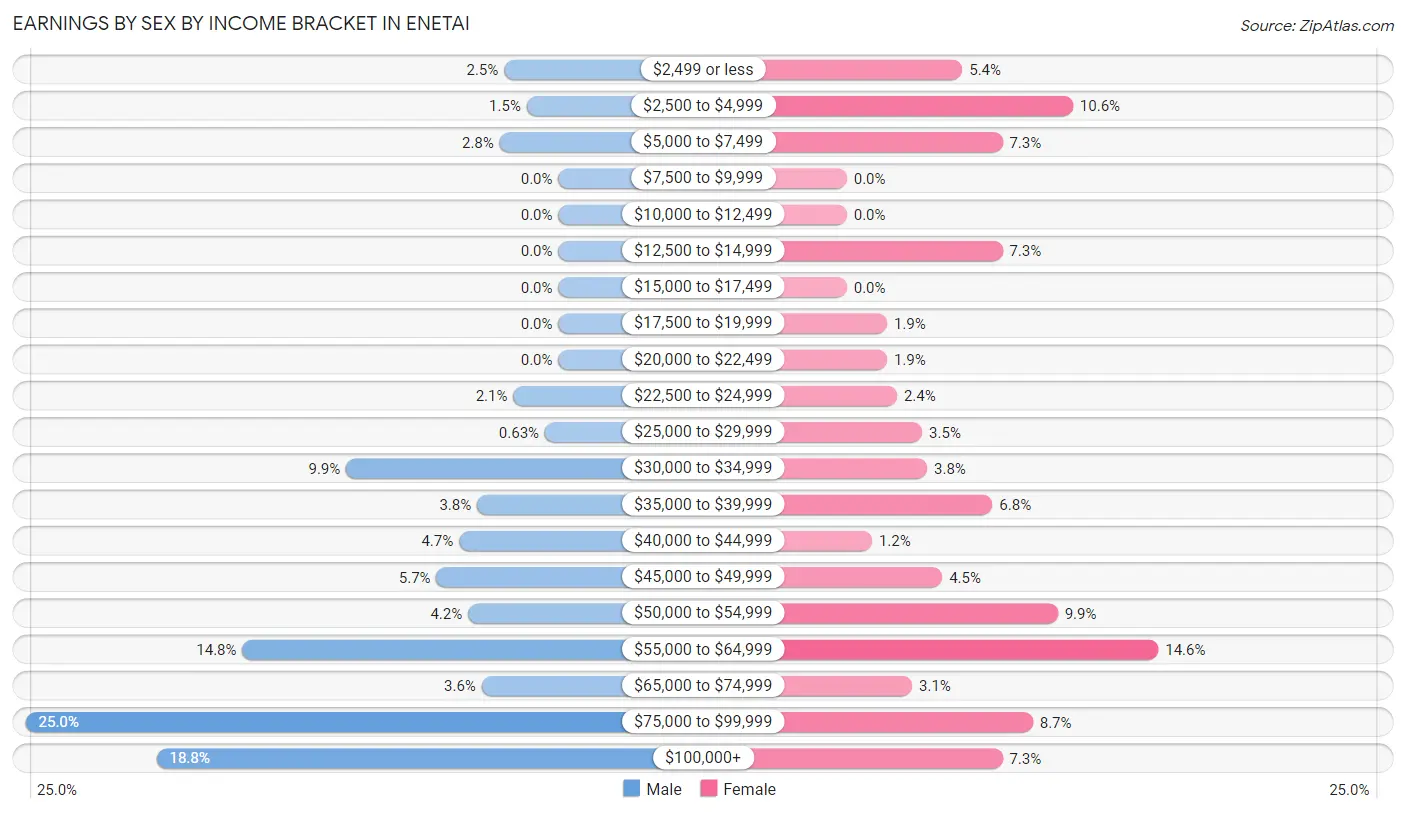
Earnings by Sex by Income Bracket in Enetai
The most common earnings brackets in Enetai are $75,000 to $99,999 for men (118 | 24.9%) and $55,000 to $64,999 for women (62 | 14.6%).
| Income | Male | Female |
| $2,499 or less | 12 (2.5%) | 23 (5.4%) |
| $2,500 to $4,999 | 7 (1.5%) | 45 (10.6%) |
| $5,000 to $7,499 | 13 (2.8%) | 31 (7.3%) |
| $7,500 to $9,999 | 0 (0.0%) | 0 (0.0%) |
| $10,000 to $12,499 | 0 (0.0%) | 0 (0.0%) |
| $12,500 to $14,999 | 0 (0.0%) | 31 (7.3%) |
| $15,000 to $17,499 | 0 (0.0%) | 0 (0.0%) |
| $17,500 to $19,999 | 0 (0.0%) | 8 (1.9%) |
| $20,000 to $22,499 | 0 (0.0%) | 8 (1.9%) |
| $22,500 to $24,999 | 10 (2.1%) | 10 (2.4%) |
| $25,000 to $29,999 | 3 (0.6%) | 15 (3.5%) |
| $30,000 to $34,999 | 47 (9.9%) | 16 (3.8%) |
| $35,000 to $39,999 | 18 (3.8%) | 29 (6.8%) |
| $40,000 to $44,999 | 22 (4.6%) | 5 (1.2%) |
| $45,000 to $49,999 | 27 (5.7%) | 19 (4.5%) |
| $50,000 to $54,999 | 20 (4.2%) | 42 (9.9%) |
| $55,000 to $64,999 | 70 (14.8%) | 62 (14.6%) |
| $65,000 to $74,999 | 17 (3.6%) | 13 (3.1%) |
| $75,000 to $99,999 | 118 (24.9%) | 37 (8.7%) |
| $100,000+ | 89 (18.8%) | 31 (7.3%) |
| Total | 473 (100.0%) | 425 (100.0%) |
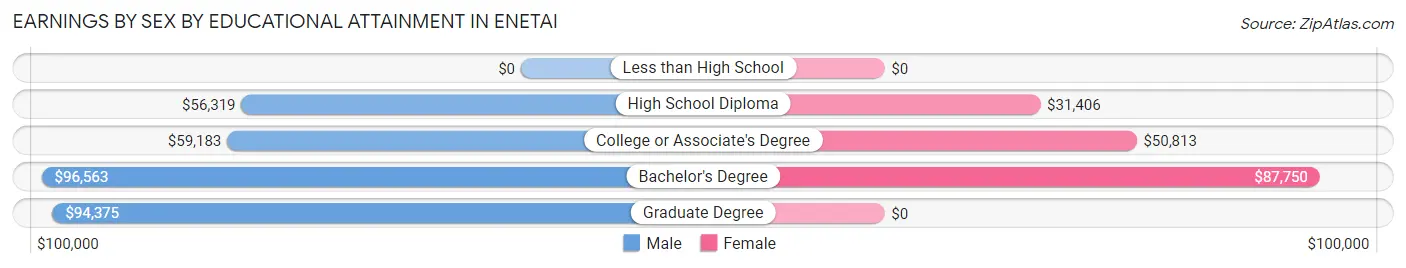
Earnings by Sex by Educational Attainment in Enetai
Average earnings in Enetai are $61,094 for men and $47,841 for women, a difference of 21.7%. Men with an educational attainment of bachelor's degree enjoy the highest average annual earnings of $96,563, while those with high school diploma education earn the least with $56,319. Women with an educational attainment of bachelor's degree earn the most with the average annual earnings of $87,750, while those with high school diploma education have the smallest earnings of $31,406.
| Educational Attainment | Male Income | Female Income |
| Less than High School | - | - |
| High School Diploma | $56,319 | $31,406 |
| College or Associate's Degree | $59,183 | $50,813 |
| Bachelor's Degree | $96,563 | $87,750 |
| Graduate Degree | $94,375 | $0 |
| Total | $61,094 | $47,841 |
Family Income in Enetai
Family Income Brackets in Enetai
According to the Enetai family income data, there are 187 families falling into the $50,000 to $74,999 income range, which is the most common income bracket and makes up 37.1% of all families.
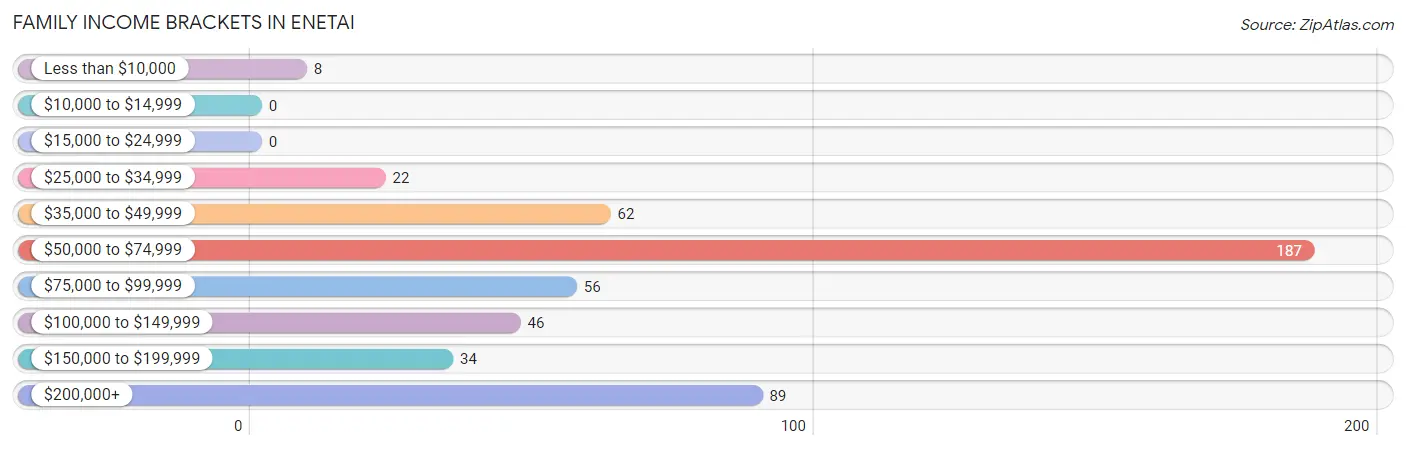
| Income Bracket | # Families | % Families |
| Less than $10,000 | 8 | 1.6% |
| $10,000 to $14,999 | 0 | 0.0% |
| $15,000 to $24,999 | 0 | 0.0% |
| $25,000 to $34,999 | 22 | 4.4% |
| $35,000 to $49,999 | 62 | 12.3% |
| $50,000 to $74,999 | 187 | 37.1% |
| $75,000 to $99,999 | 56 | 11.1% |
| $100,000 to $149,999 | 46 | 9.1% |
| $150,000 to $199,999 | 34 | 6.7% |
| $200,000+ | 89 | 17.7% |
Family Income by Famaliy Size in Enetai
3-person families (129 | 25.6%) account for the highest median family income in Enetai with $78,125 per family, while 2-person families (256 | 50.8%) have the highest median income of $30,606 per family member.
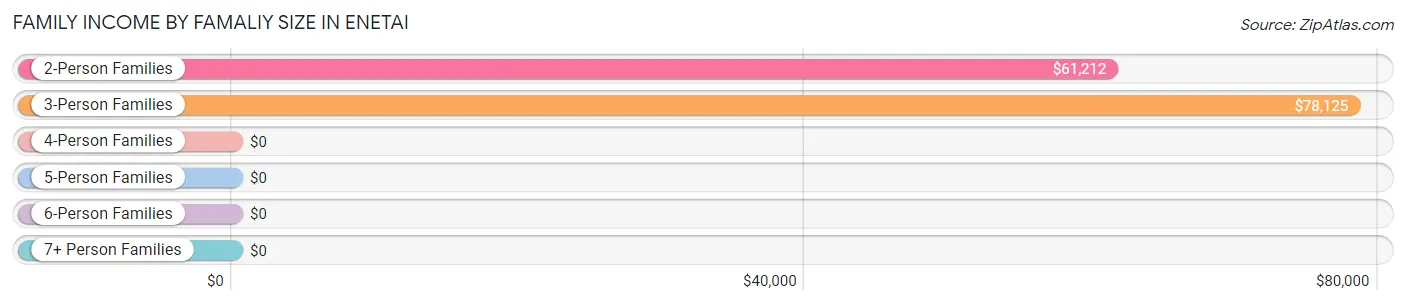
| Income Bracket | # Families | Median Income |
| 2-Person Families | 256 (50.8%) | $61,212 |
| 3-Person Families | 129 (25.6%) | $78,125 |
| 4-Person Families | 91 (18.1%) | $0 |
| 5-Person Families | 0 (0.0%) | $0 |
| 6-Person Families | 20 (4.0%) | $0 |
| 7+ Person Families | 8 (1.6%) | $0 |
| Total | 504 (100.0%) | $67,143 |
Family Income by Number of Earners in Enetai
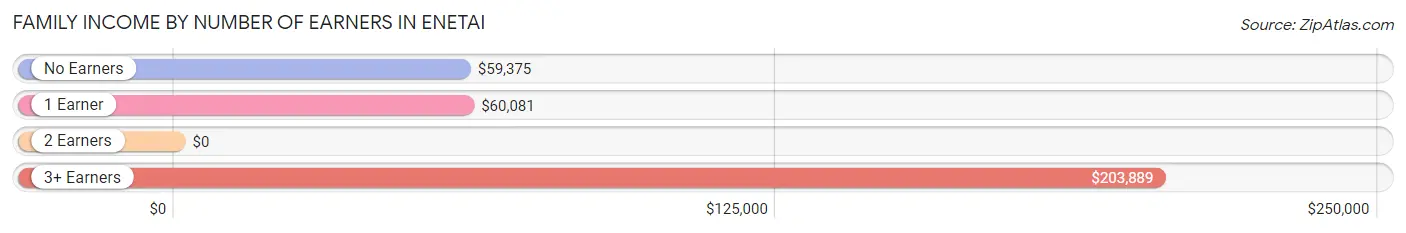
| Number of Earners | # Families | Median Income |
| No Earners | 128 (25.4%) | $59,375 |
| 1 Earner | 192 (38.1%) | $60,081 |
| 2 Earners | 140 (27.8%) | $0 |
| 3+ Earners | 44 (8.7%) | $203,889 |
| Total | 504 (100.0%) | $67,143 |
Household Income in Enetai
Household Income Brackets in Enetai
With 218 households falling in the category, the $50,000 to $74,999 income range is the most frequent in Enetai, accounting for 30.8% of all households.
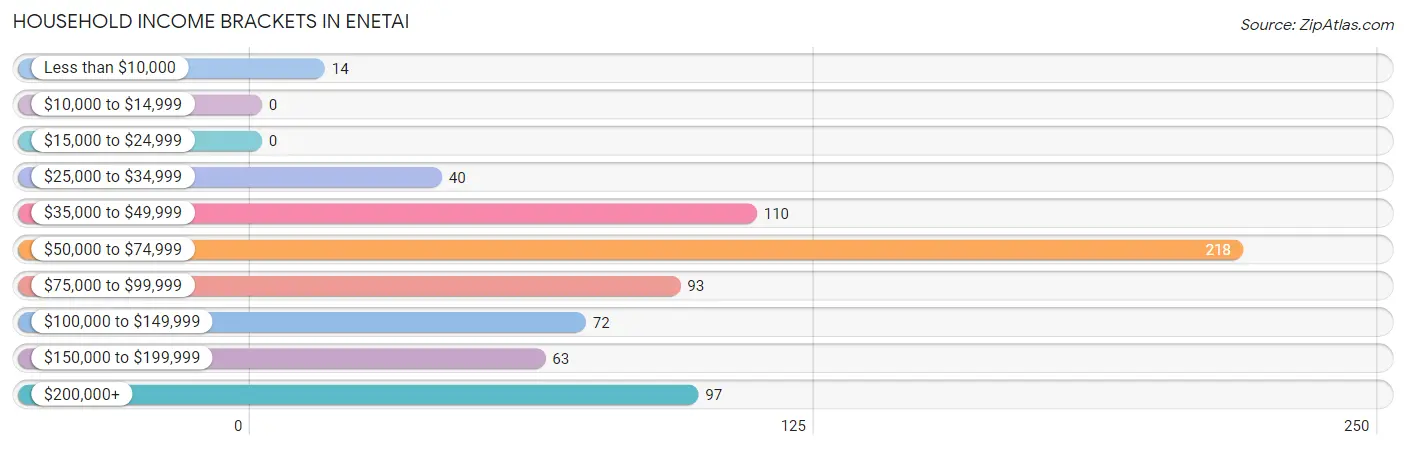
| Income Bracket | # Households | % Households |
| Less than $10,000 | 14 | 2.0% |
| $10,000 to $14,999 | 0 | 0.0% |
| $15,000 to $24,999 | 0 | 0.0% |
| $25,000 to $34,999 | 40 | 5.7% |
| $35,000 to $49,999 | 110 | 15.6% |
| $50,000 to $74,999 | 218 | 30.8% |
| $75,000 to $99,999 | 93 | 13.2% |
| $100,000 to $149,999 | 72 | 10.2% |
| $150,000 to $199,999 | 63 | 8.9% |
| $200,000+ | 97 | 13.7% |
Household Income by Householder Age in Enetai
The median household income in Enetai is $68,839, with the highest median household income of $87,679 found in the 25 to 44 years age bracket for the primary householder. A total of 269 households (38.1%) fall into this category. Meanwhile, the 15 to 24 years age bracket for the primary householder has the lowest median household income of $0, with 19 households (2.7%) in this group.
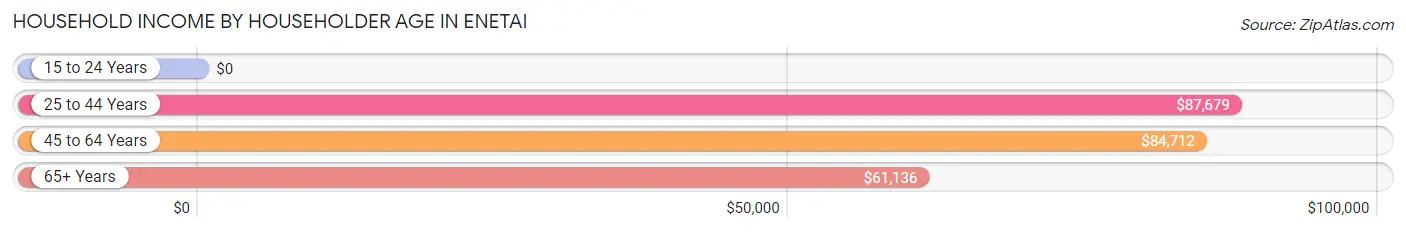
| Income Bracket | # Households | Median Income |
| 15 to 24 Years | 19 (2.7%) | $0 |
| 25 to 44 Years | 269 (38.1%) | $87,679 |
| 45 to 64 Years | 227 (32.1%) | $84,712 |
| 65+ Years | 192 (27.2%) | $61,136 |
| Total | 707 (100.0%) | $68,839 |
Poverty in Enetai
Income Below Poverty by Sex and Age in Enetai
With 3.7% poverty level for males and 4.9% for females among the residents of Enetai, 12 to 14 year old males and 35 to 44 year old females are the most vulnerable to poverty, with 8 males (38.1%) and 24 females (18.5%) in their respective age groups living below the poverty level.
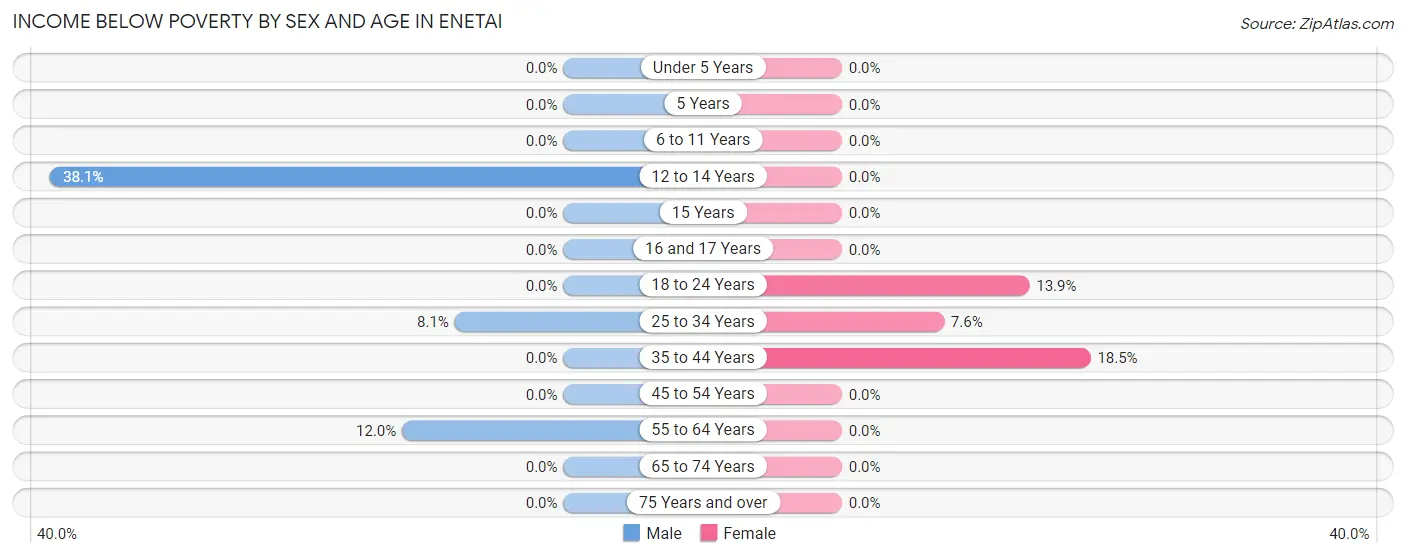
| Age Bracket | Male | Female |
| Under 5 Years | 0 (0.0%) | 0 (0.0%) |
| 5 Years | 0 (0.0%) | 0 (0.0%) |
| 6 to 11 Years | 0 (0.0%) | 0 (0.0%) |
| 12 to 14 Years | 8 (38.1%) | 0 (0.0%) |
| 15 Years | 0 (0.0%) | 0 (0.0%) |
| 16 and 17 Years | 0 (0.0%) | 0 (0.0%) |
| 18 to 24 Years | 0 (0.0%) | 11 (13.9%) |
| 25 to 34 Years | 13 (8.1%) | 10 (7.6%) |
| 35 to 44 Years | 0 (0.0%) | 24 (18.5%) |
| 45 to 54 Years | 0 (0.0%) | 0 (0.0%) |
| 55 to 64 Years | 14 (12.0%) | 0 (0.0%) |
| 65 to 74 Years | 0 (0.0%) | 0 (0.0%) |
| 75 Years and over | 0 (0.0%) | 0 (0.0%) |
| Total | 35 (3.7%) | 45 (4.9%) |
Income Above Poverty by Sex and Age in Enetai
According to the poverty statistics in Enetai, males aged under 5 years and females aged under 5 years are the age groups that are most secure financially, with 100.0% of males and 100.0% of females in these age groups living above the poverty line.
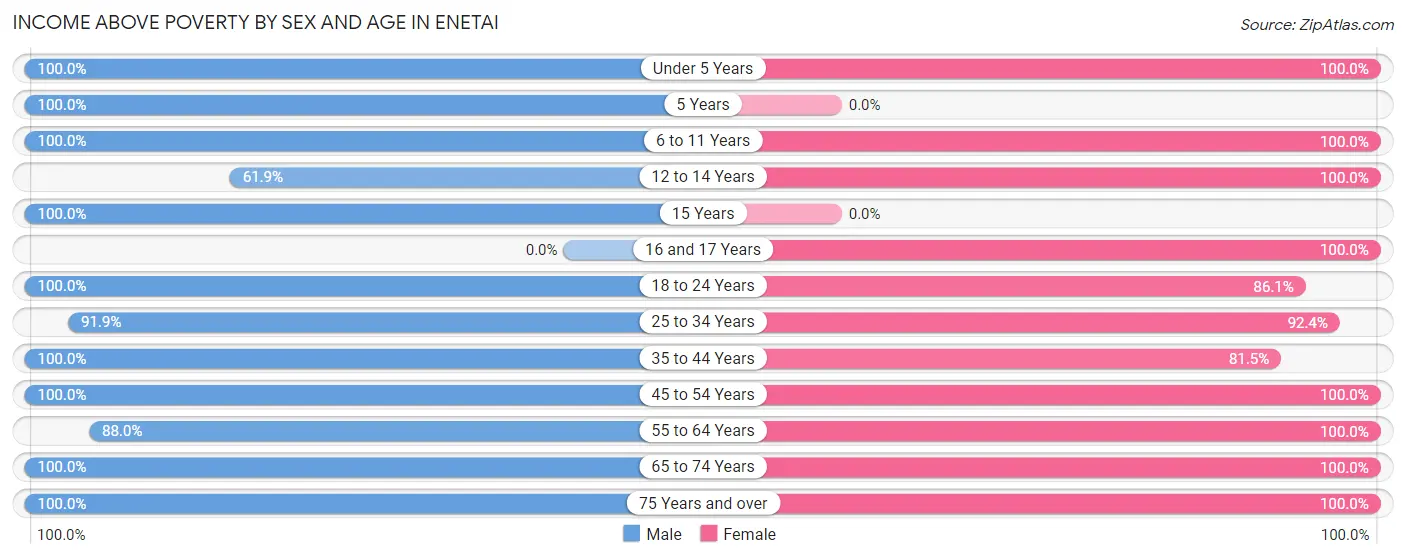
| Age Bracket | Male | Female |
| Under 5 Years | 132 (100.0%) | 8 (100.0%) |
| 5 Years | 28 (100.0%) | 0 (0.0%) |
| 6 to 11 Years | 31 (100.0%) | 45 (100.0%) |
| 12 to 14 Years | 13 (61.9%) | 87 (100.0%) |
| 15 Years | 6 (100.0%) | 0 (0.0%) |
| 16 and 17 Years | 0 (0.0%) | 41 (100.0%) |
| 18 to 24 Years | 34 (100.0%) | 68 (86.1%) |
| 25 to 34 Years | 148 (91.9%) | 122 (92.4%) |
| 35 to 44 Years | 166 (100.0%) | 106 (81.5%) |
| 45 to 54 Years | 56 (100.0%) | 76 (100.0%) |
| 55 to 64 Years | 103 (88.0%) | 113 (100.0%) |
| 65 to 74 Years | 110 (100.0%) | 148 (100.0%) |
| 75 Years and over | 83 (100.0%) | 65 (100.0%) |
| Total | 910 (96.3%) | 879 (95.1%) |
Income Below Poverty Among Married-Couple Families in Enetai
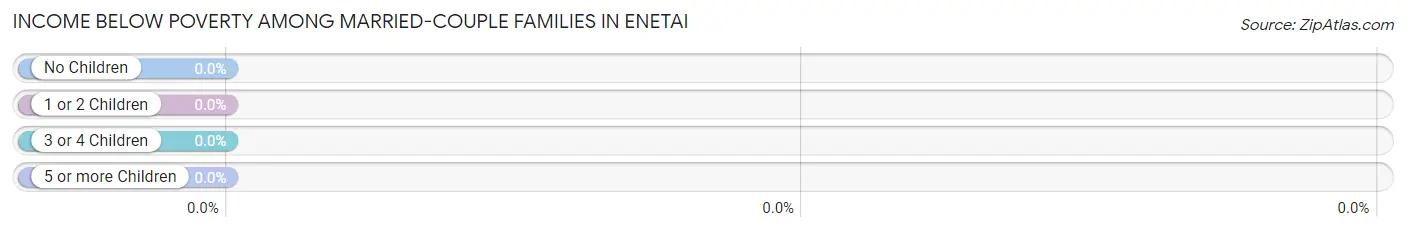
| Children | Above Poverty | Below Poverty |
| No Children | 218 (100.0%) | 0 (0.0%) |
| 1 or 2 Children | 142 (100.0%) | 0 (0.0%) |
| 3 or 4 Children | 0 (0.0%) | 0 (0.0%) |
| 5 or more Children | 0 (0.0%) | 0 (0.0%) |
| Total | 360 (100.0%) | 0 (0.0%) |
Income Below Poverty Among Single-Parent Households in Enetai
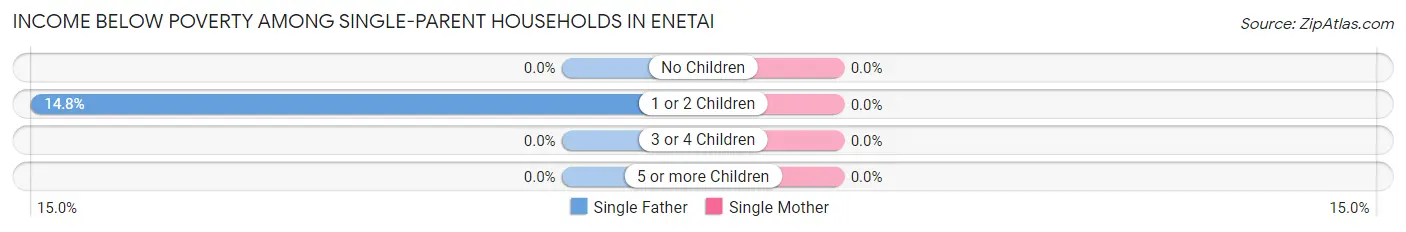
| Children | Single Father | Single Mother |
| No Children | 0 (0.0%) | 0 (0.0%) |
| 1 or 2 Children | 8 (14.8%) | 0 (0.0%) |
| 3 or 4 Children | 0 (0.0%) | 0 (0.0%) |
| 5 or more Children | 0 (0.0%) | 0 (0.0%) |
| Total | 8 (13.3%) | 0 (0.0%) |
Income Below Poverty Among Married-Couple vs Single-Parent Households in Enetai
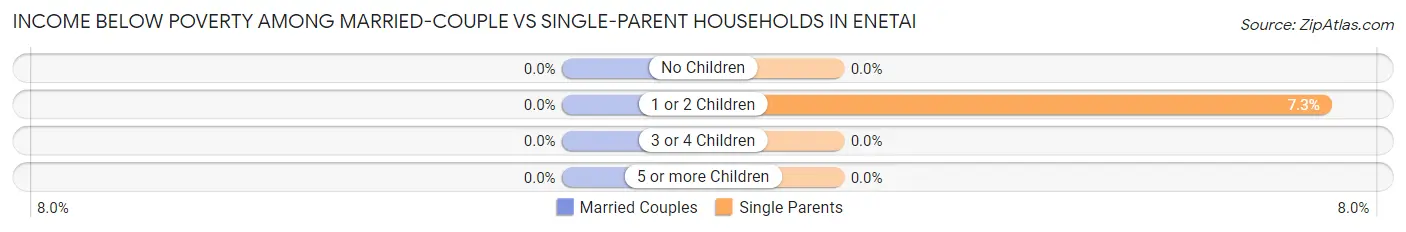
| Children | Married-Couple Families | Single-Parent Households |
| No Children | 0 (0.0%) | 0 (0.0%) |
| 1 or 2 Children | 0 (0.0%) | 8 (7.3%) |
| 3 or 4 Children | 0 (0.0%) | 0 (0.0%) |
| 5 or more Children | 0 (0.0%) | 0 (0.0%) |
| Total | 0 (0.0%) | 8 (5.6%) |
Race in Enetai
The most populous races in Enetai are White / Caucasian (1,442 | 77.1%), Hispanic or Latino (256 | 13.7%), and Some other Race (180 | 9.6%).
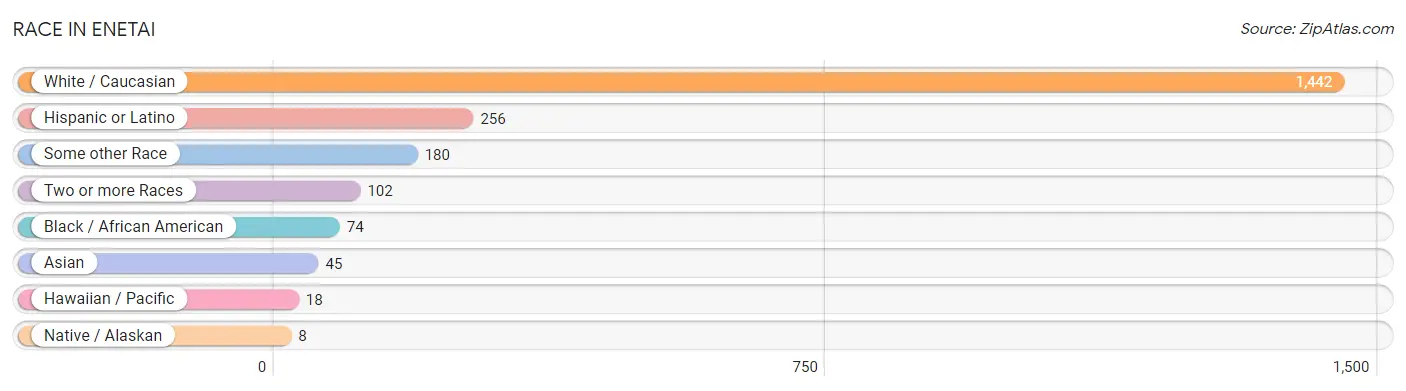
| Race | # Population | % Population |
| Asian | 45 | 2.4% |
| Black / African American | 74 | 4.0% |
| Hawaiian / Pacific | 18 | 1.0% |
| Hispanic or Latino | 256 | 13.7% |
| Native / Alaskan | 8 | 0.4% |
| White / Caucasian | 1,442 | 77.1% |
| Two or more Races | 102 | 5.5% |
| Some other Race | 180 | 9.6% |
| Total | 1,869 | 100.0% |
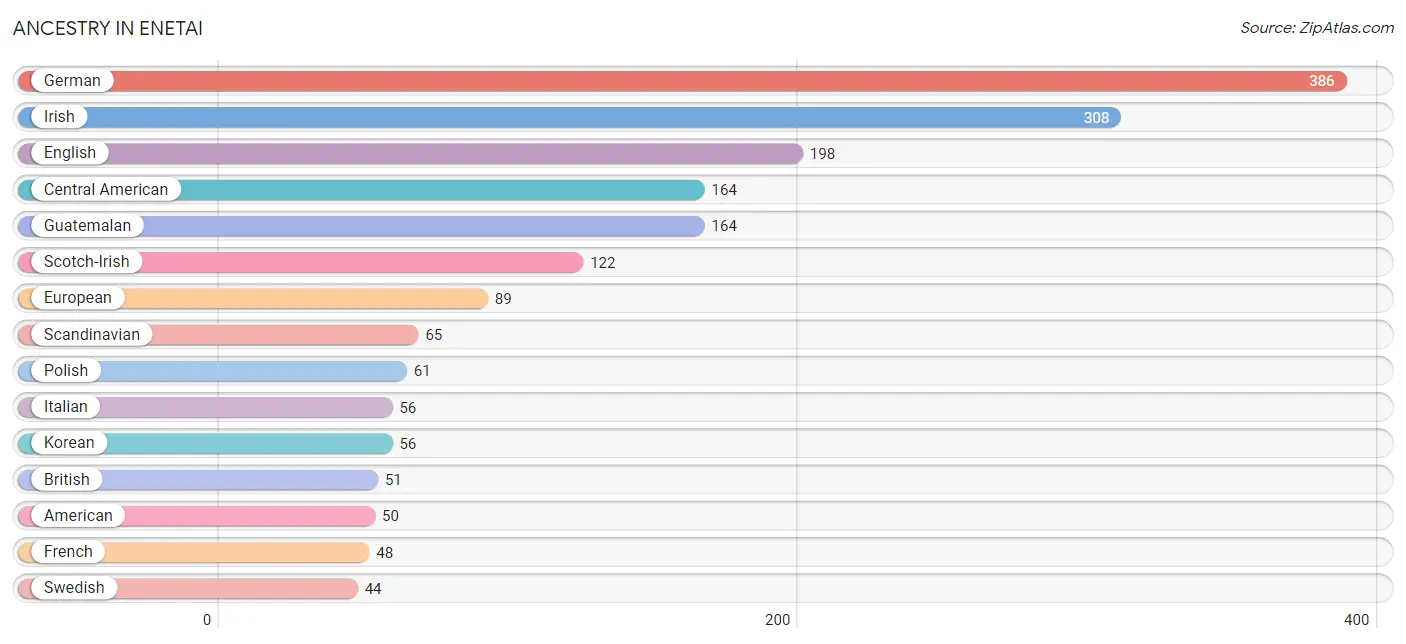
Ancestry in Enetai
The most populous ancestries reported in Enetai are German (386 | 20.6%), Irish (308 | 16.5%), English (198 | 10.6%), Central American (164 | 8.8%), and Guatemalan (164 | 8.8%), together accounting for 65.3% of all Enetai residents.
| Ancestry | # Population | % Population |
| American | 50 | 2.7% |
| Arab | 8 | 0.4% |
| British | 51 | 2.7% |
| Central American | 164 | 8.8% |
| Central American Indian | 11 | 0.6% |
| Chippewa | 7 | 0.4% |
| Colombian | 24 | 1.3% |
| Czech | 8 | 0.4% |
| Dutch | 32 | 1.7% |
| Eastern European | 7 | 0.4% |
| English | 198 | 10.6% |
| European | 89 | 4.8% |
| Finnish | 11 | 0.6% |
| French | 48 | 2.6% |
| French Canadian | 8 | 0.4% |
| German | 386 | 20.6% |
| Guamanian / Chamorro | 18 | 1.0% |
| Guatemalan | 164 | 8.8% |
| Hungarian | 10 | 0.5% |
| Indian (Asian) | 27 | 1.4% |
| Irish | 308 | 16.5% |
| Italian | 56 | 3.0% |
| Korean | 56 | 3.0% |
| Mexican | 36 | 1.9% |
| Navajo | 8 | 0.4% |
| Norwegian | 30 | 1.6% |
| Polish | 61 | 3.3% |
| Portuguese | 12 | 0.6% |
| Puerto Rican | 32 | 1.7% |
| Puget Sound Salish | 3 | 0.2% |
| Russian | 28 | 1.5% |
| Samoan | 21 | 1.1% |
| Scandinavian | 65 | 3.5% |
| Scotch-Irish | 122 | 6.5% |
| Scottish | 19 | 1.0% |
| South American | 24 | 1.3% |
| Swedish | 44 | 2.4% |
| Swiss | 16 | 0.9% |
| Ukrainian | 7 | 0.4% |
| Welsh | 7 | 0.4% |
| Yugoslavian | 8 | 0.4% | View All 41 Rows |
Immigrants in Enetai
The most numerous immigrant groups reported in Enetai came from Latin America (69 | 3.7%), Central America (59 | 3.2%), Guatemala (59 | 3.2%), Asia (39 | 2.1%), and Philippines (39 | 2.1%), together accounting for 14.2% of all Enetai residents.
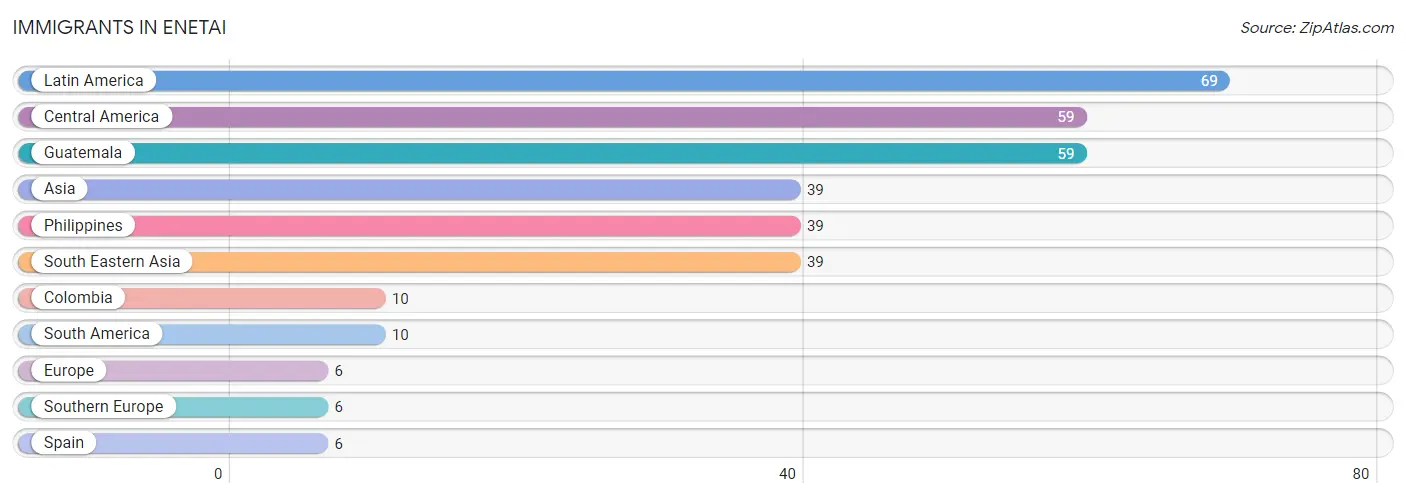
| Immigration Origin | # Population | % Population |
| Asia | 39 | 2.1% |
| Central America | 59 | 3.2% |
| Colombia | 10 | 0.5% |
| Europe | 6 | 0.3% |
| Guatemala | 59 | 3.2% |
| Latin America | 69 | 3.7% |
| Philippines | 39 | 2.1% |
| South America | 10 | 0.5% |
| South Eastern Asia | 39 | 2.1% |
| Southern Europe | 6 | 0.3% |
| Spain | 6 | 0.3% | View All 11 Rows |
Sex and Age in Enetai
Sex and Age in Enetai
The most populous age groups in Enetai are Under 5 Years (132 | 14.0%) for men and 70 to 74 Years (112 | 12.1%) for women.
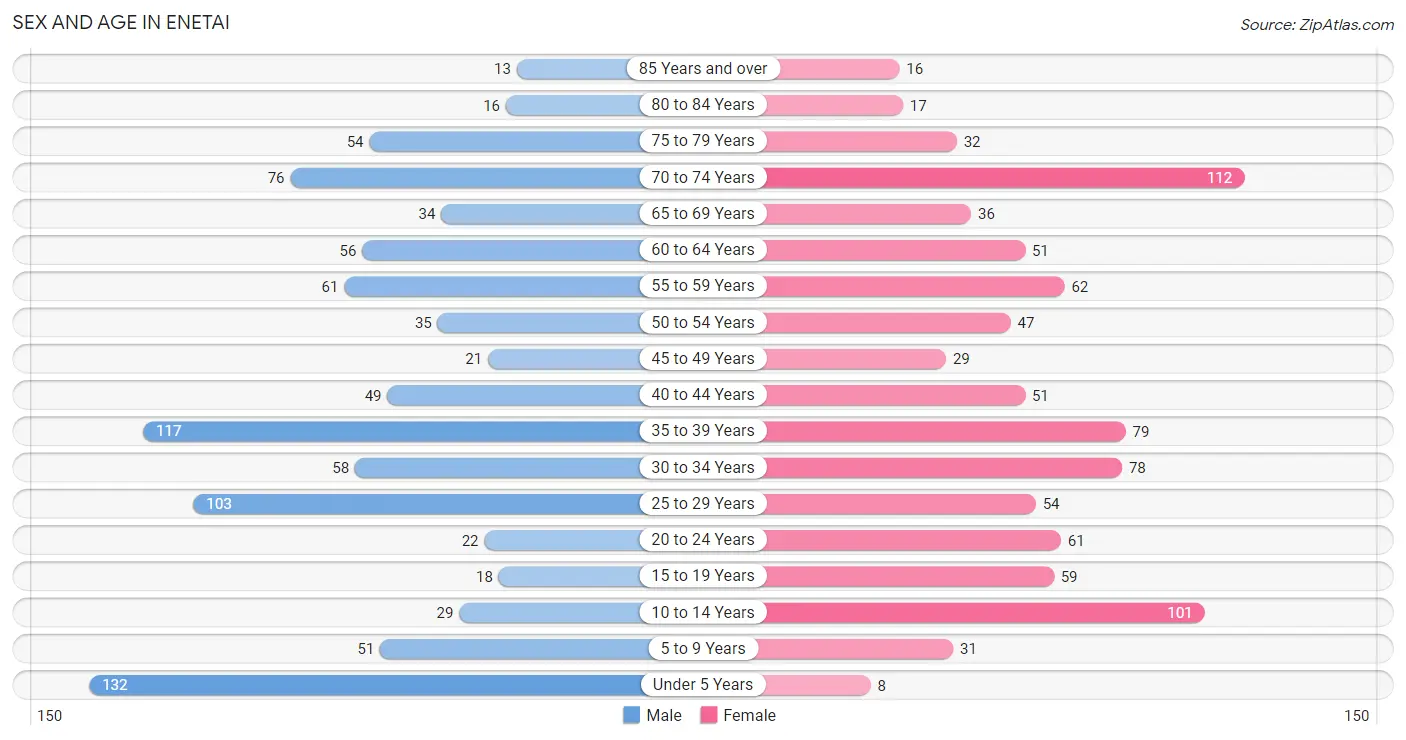
| Age Bracket | Male | Female |
| Under 5 Years | 132 (14.0%) | 8 (0.9%) |
| 5 to 9 Years | 51 (5.4%) | 31 (3.4%) |
| 10 to 14 Years | 29 (3.1%) | 101 (10.9%) |
| 15 to 19 Years | 18 (1.9%) | 59 (6.4%) |
| 20 to 24 Years | 22 (2.3%) | 61 (6.6%) |
| 25 to 29 Years | 103 (10.9%) | 54 (5.8%) |
| 30 to 34 Years | 58 (6.1%) | 78 (8.4%) |
| 35 to 39 Years | 117 (12.4%) | 79 (8.6%) |
| 40 to 44 Years | 49 (5.2%) | 51 (5.5%) |
| 45 to 49 Years | 21 (2.2%) | 29 (3.1%) |
| 50 to 54 Years | 35 (3.7%) | 47 (5.1%) |
| 55 to 59 Years | 61 (6.5%) | 62 (6.7%) |
| 60 to 64 Years | 56 (5.9%) | 51 (5.5%) |
| 65 to 69 Years | 34 (3.6%) | 36 (3.9%) |
| 70 to 74 Years | 76 (8.0%) | 112 (12.1%) |
| 75 to 79 Years | 54 (5.7%) | 32 (3.5%) |
| 80 to 84 Years | 16 (1.7%) | 17 (1.8%) |
| 85 Years and over | 13 (1.4%) | 16 (1.7%) |
| Total | 945 (100.0%) | 924 (100.0%) |
Families and Households in Enetai
Median Family Size in Enetai
The median family size in Enetai is 2.94 persons per family, with single female/mother families (84 | 16.7%) accounting for the largest median family size of 3.56 persons per family. On the other hand, single male/father families (60 | 11.9%) represent the smallest median family size with 2.32 persons per family.
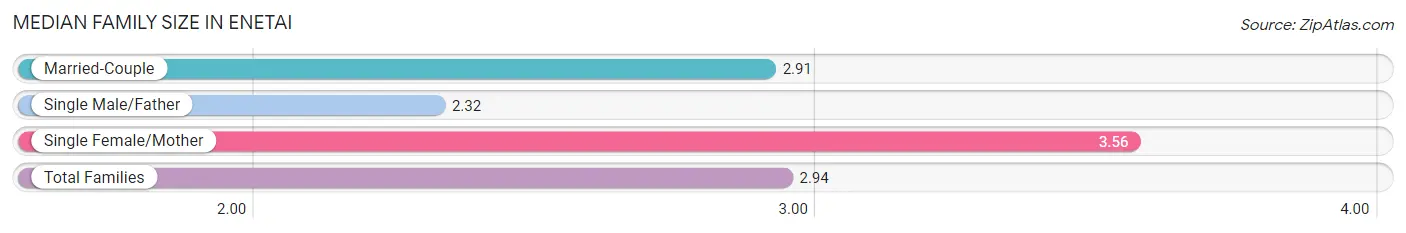
| Family Type | # Families | Family Size |
| Married-Couple | 360 (71.4%) | 2.91 |
| Single Male/Father | 60 (11.9%) | 2.32 |
| Single Female/Mother | 84 (16.7%) | 3.56 |
| Total Families | 504 (100.0%) | 2.94 |
Median Household Size in Enetai
The median household size in Enetai is 2.64 persons per household, with single female/mother households (84 | 11.9%) accounting for the largest median household size of 4.04 persons per household. non-family households (203 | 28.7%) represent the smallest median household size with 1.42 persons per household.
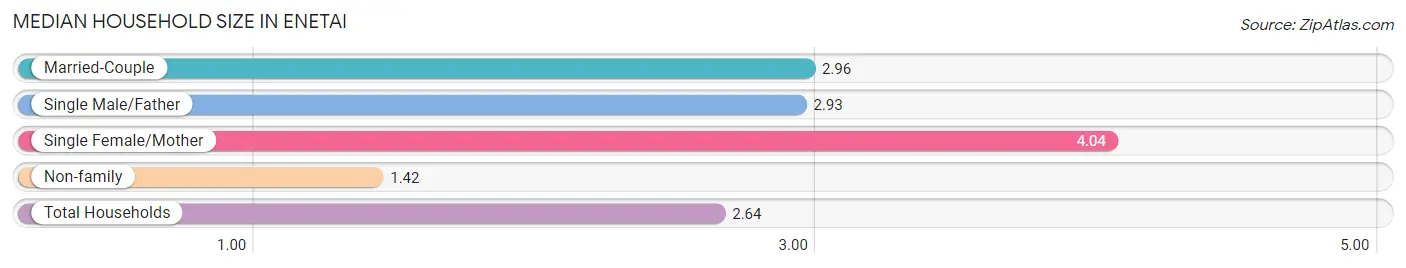
| Household Type | # Households | Household Size |
| Married-Couple | 360 (50.9%) | 2.96 |
| Single Male/Father | 60 (8.5%) | 2.93 |
| Single Female/Mother | 84 (11.9%) | 4.04 |
| Non-family | 203 (28.7%) | 1.42 |
| Total Households | 707 (100.0%) | 2.64 |
Household Size by Marriage Status in Enetai
Out of a total of 707 households in Enetai, 504 (71.3%) are family households, while 203 (28.7%) are nonfamily households. The most numerous type of family households are 2-person households, comprising 200, and the most common type of nonfamily households are 1-person households, comprising 132.
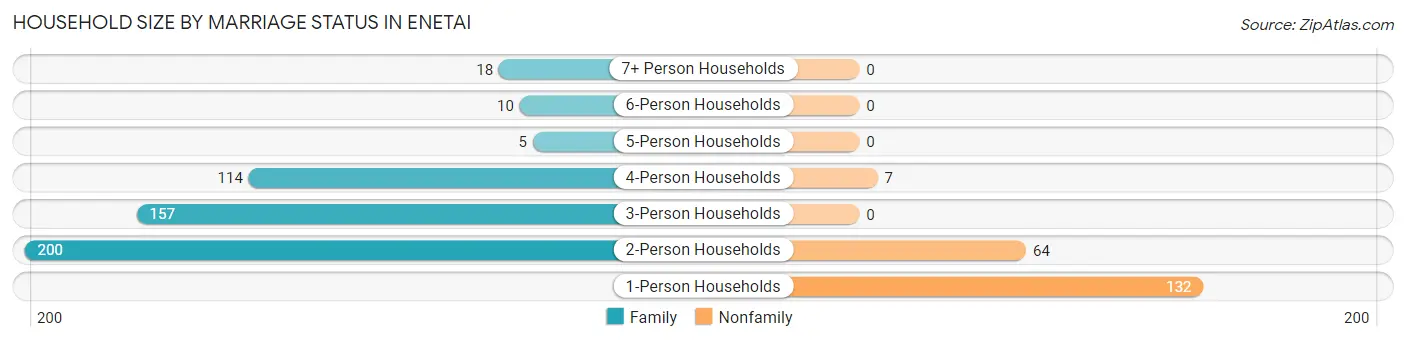
| Household Size | Family Households | Nonfamily Households |
| 1-Person Households | - | 132 (18.7%) |
| 2-Person Households | 200 (28.3%) | 64 (9.0%) |
| 3-Person Households | 157 (22.2%) | 0 (0.0%) |
| 4-Person Households | 114 (16.1%) | 7 (1.0%) |
| 5-Person Households | 5 (0.7%) | 0 (0.0%) |
| 6-Person Households | 10 (1.4%) | 0 (0.0%) |
| 7+ Person Households | 18 (2.5%) | 0 (0.0%) |
| Total | 504 (71.3%) | 203 (28.7%) |
Female Fertility in Enetai
Fertility by Age in Enetai
Average fertility rate in Enetai is 31.0 births per 1,000 women. Women in the age bracket of 20 to 34 years have the highest fertility rate with 67.0 births per 1,000 women. Women in the age bracket of 20 to 34 years acount for 100.0% of all women with births.
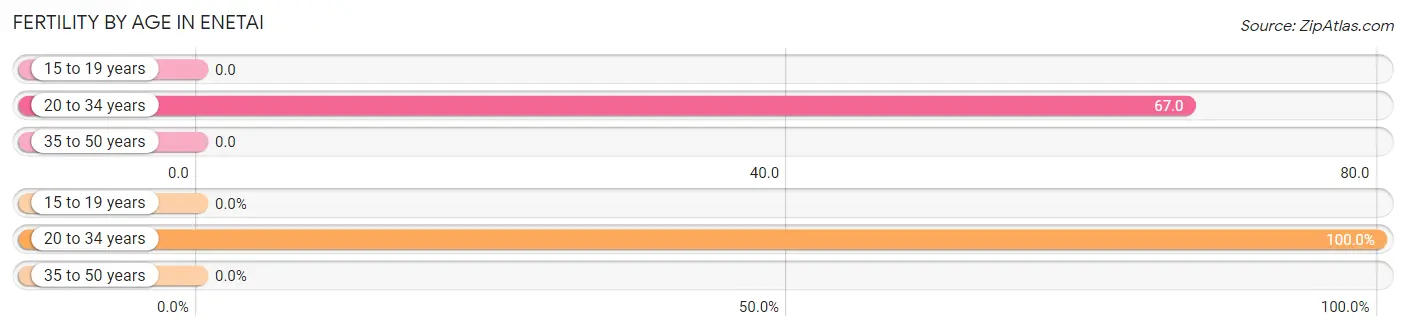
| Age Bracket | Women with Births | Births / 1,000 Women |
| 15 to 19 years | 0 (0.0%) | 0.0 |
| 20 to 34 years | 13 (100.0%) | 67.0 |
| 35 to 50 years | 0 (0.0%) | 0.0 |
| Total | 13 (100.0%) | 31.0 |
Fertility by Age by Marriage Status in Enetai
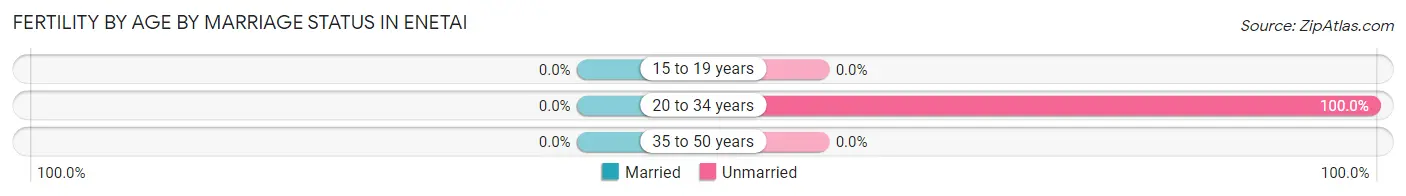
| Age Bracket | Married | Unmarried |
| 15 to 19 years | 0 (0.0%) | 0 (0.0%) |
| 20 to 34 years | 0 (0.0%) | 13 (100.0%) |
| 35 to 50 years | 0 (0.0%) | 0 (0.0%) |
| Total | 0 (0.0%) | 13 (100.0%) |
Fertility by Education in Enetai
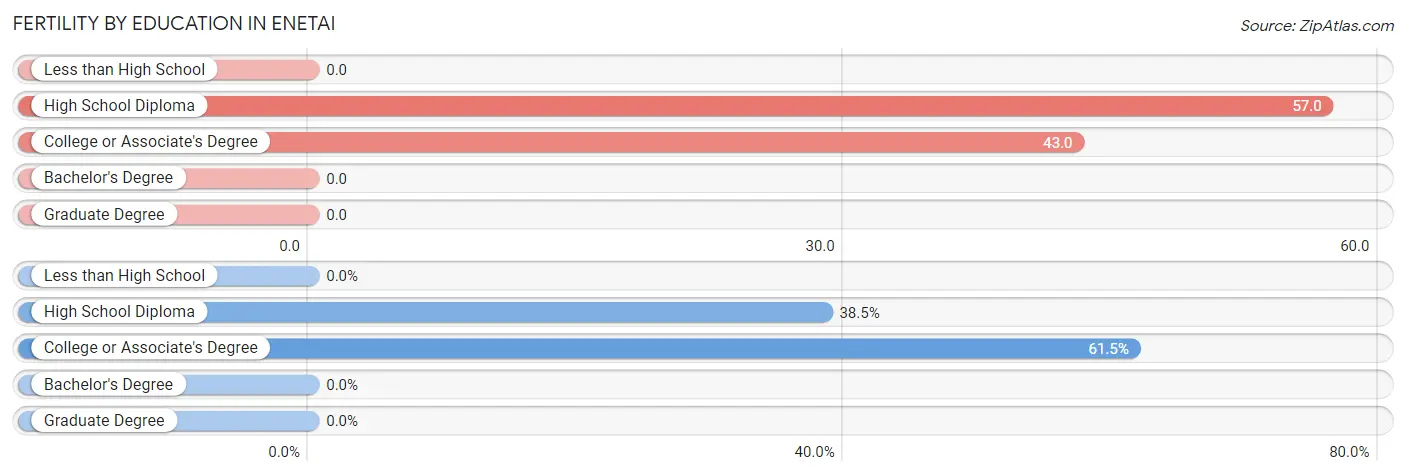
| Educational Attainment | Women with Births | Births / 1,000 Women |
| Less than High School | 0 (0.0%) | 0.0 |
| High School Diploma | 5 (38.5%) | 57.0 |
| College or Associate's Degree | 8 (61.5%) | 43.0 |
| Bachelor's Degree | 0 (0.0%) | 0.0 |
| Graduate Degree | 0 (0.0%) | 0.0 |
| Total | 13 (100.0%) | 31.0 |
Fertility by Education by Marriage Status in Enetai
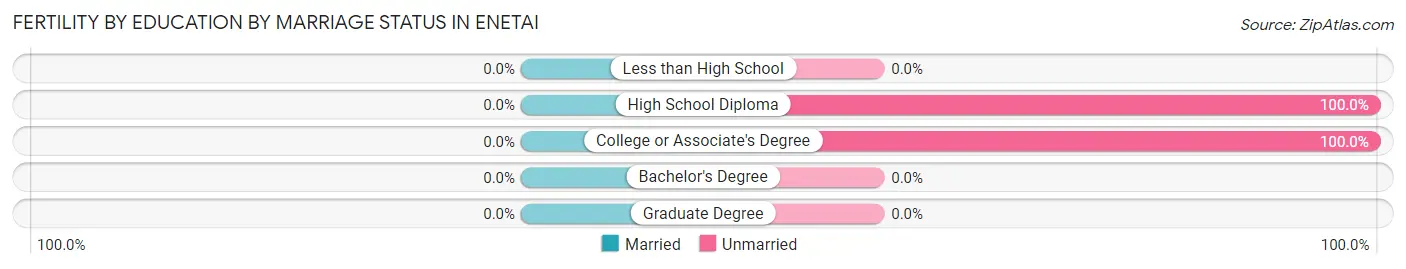
| Educational Attainment | Married | Unmarried |
| Less than High School | 0 (0.0%) | 0 (0.0%) |
| High School Diploma | 0 (0.0%) | 5 (100.0%) |
| College or Associate's Degree | 0 (0.0%) | 8 (100.0%) |
| Bachelor's Degree | 0 (0.0%) | 0 (0.0%) |
| Graduate Degree | 0 (0.0%) | 0 (0.0%) |
| Total | 0 (0.0%) | 13 (100.0%) |
Employment Characteristics in Enetai
Employment by Class of Employer in Enetai
Among the 766 employed individuals in Enetai, private company employees (339 | 44.3%), federal government employees (223 | 29.1%), and not-for-profit organizations (69 | 9.0%) make up the most common classes of employment.
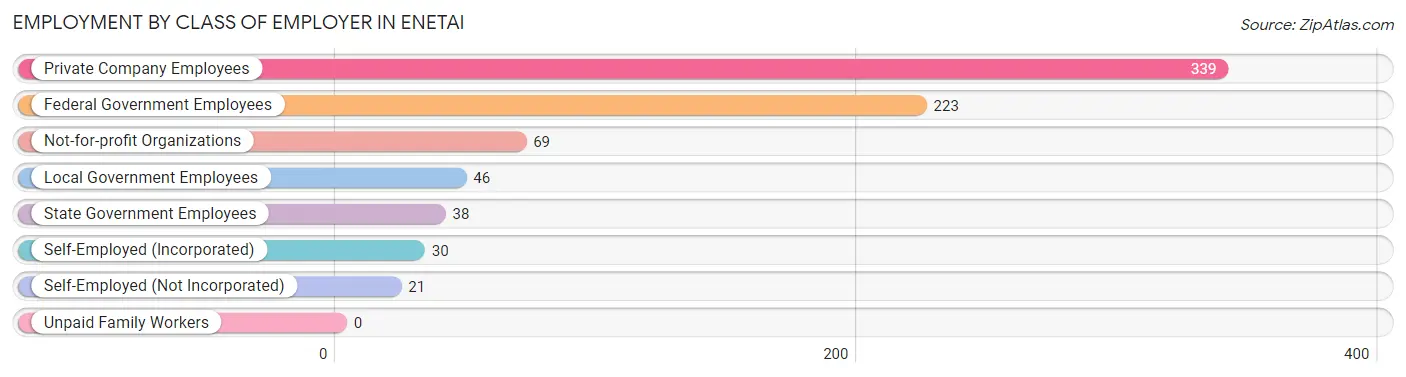
| Employer Class | # Employees | % Employees |
| Private Company Employees | 339 | 44.3% |
| Self-Employed (Incorporated) | 30 | 3.9% |
| Self-Employed (Not Incorporated) | 21 | 2.7% |
| Not-for-profit Organizations | 69 | 9.0% |
| Local Government Employees | 46 | 6.0% |
| State Government Employees | 38 | 5.0% |
| Federal Government Employees | 223 | 29.1% |
| Unpaid Family Workers | 0 | 0.0% |
| Total | 766 | 100.0% |
Employment Status by Age in Enetai
According to the labor force statistics for Enetai, out of the total population over 16 years of age (1,511), 57.4% or 867 individuals are in the labor force, with 10.1% or 88 of them unemployed. The age group with the highest labor force participation rate is 30 to 34 years, with 94.1% or 128 individuals in the labor force. Within the labor force, the 16 to 19 years age range has the highest percentage of unemployed individuals, with 52.8% or 28 of them being unemployed.
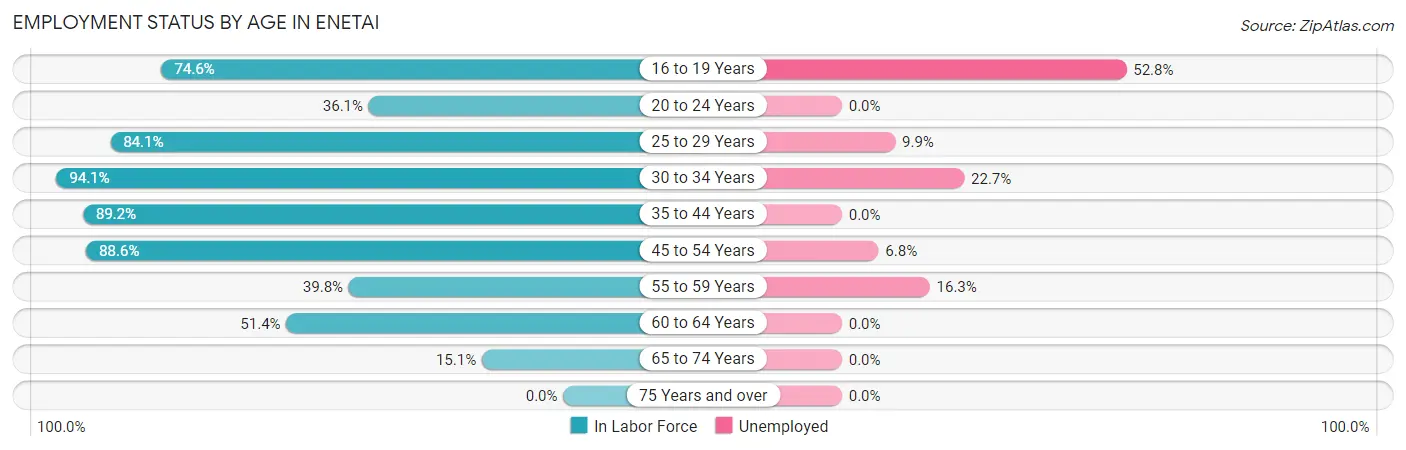
| Age Bracket | In Labor Force | Unemployed |
| 16 to 19 Years | 53 (74.6%) | 28 (52.8%) |
| 20 to 24 Years | 30 (36.1%) | 0 (0.0%) |
| 25 to 29 Years | 132 (84.1%) | 13 (9.9%) |
| 30 to 34 Years | 128 (94.1%) | 29 (22.7%) |
| 35 to 44 Years | 264 (89.2%) | 0 (0.0%) |
| 45 to 54 Years | 117 (88.6%) | 8 (6.8%) |
| 55 to 59 Years | 49 (39.8%) | 8 (16.3%) |
| 60 to 64 Years | 55 (51.4%) | 0 (0.0%) |
| 65 to 74 Years | 39 (15.1%) | 0 (0.0%) |
| 75 Years and over | 0 (0.0%) | 0 (0.0%) |
| Total | 867 (57.4%) | 88 (10.1%) |
Employment Status by Educational Attainment in Enetai
According to labor force statistics for Enetai, 78.3% of individuals (745) out of the total population between 25 and 64 years of age (951) are in the labor force, with 7.8% or 58 of them being unemployed. The group with the highest labor force participation rate are those with the educational attainment of college / associate degree, with 83.4% or 332 individuals in the labor force. Within the labor force, individuals with college / associate degree education have the highest percentage of unemployment, with 9.1% or 30 of them being unemployed.
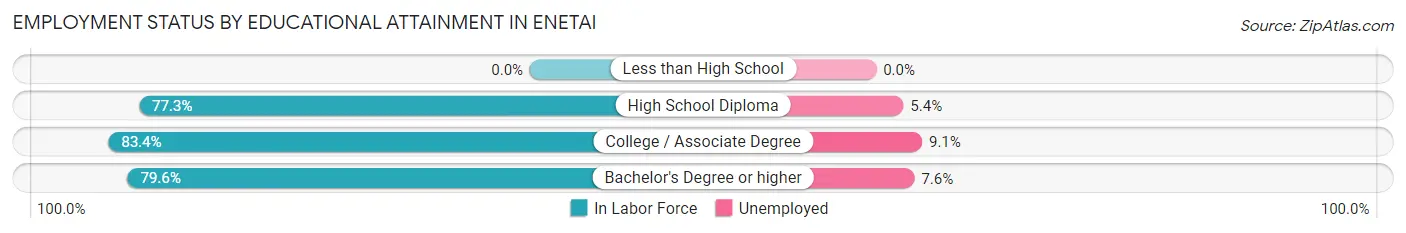
| Educational Attainment | In Labor Force | Unemployed |
| Less than High School | 0 (0.0%) | 0 (0.0%) |
| High School Diploma | 167 (77.3%) | 12 (5.4%) |
| College / Associate Degree | 332 (83.4%) | 36 (9.1%) |
| Bachelor's Degree or higher | 246 (79.6%) | 23 (7.6%) |
| Total | 745 (78.3%) | 74 (7.8%) |
Employment Occupations by Sex in Enetai
Management, Business, Science and Arts Occupations
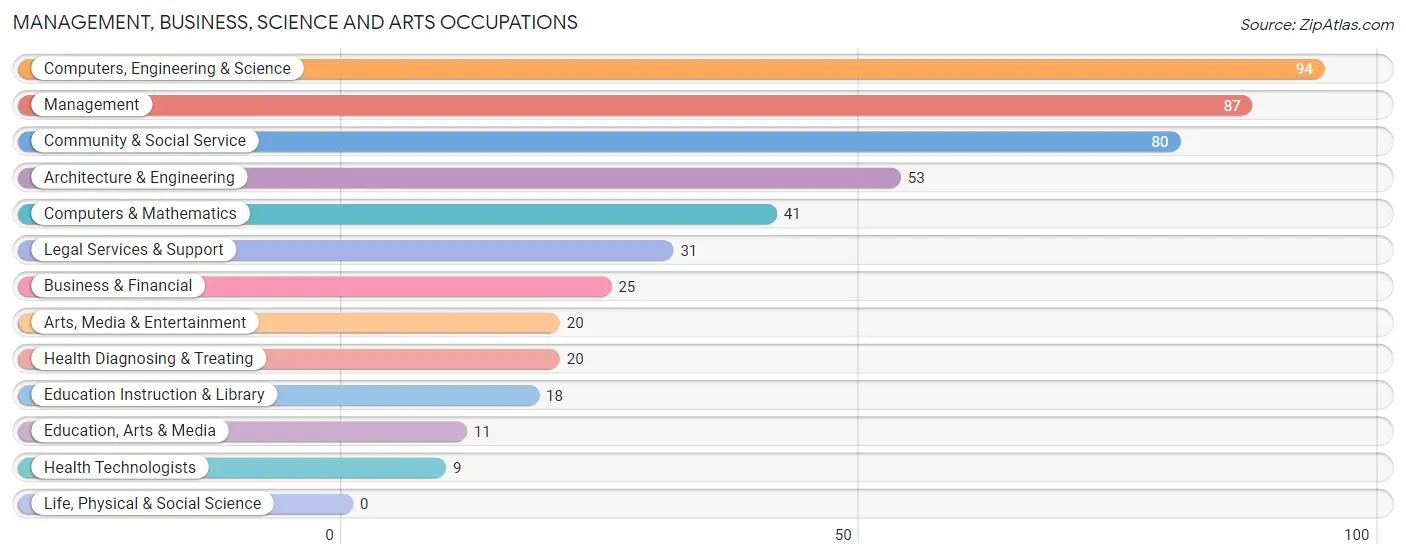
The most common Management, Business, Science and Arts occupations in Enetai are Computers, Engineering & Science (94 | 12.8%), Management (87 | 11.8%), Community & Social Service (80 | 10.9%), Architecture & Engineering (53 | 7.2%), and Computers & Mathematics (41 | 5.6%).
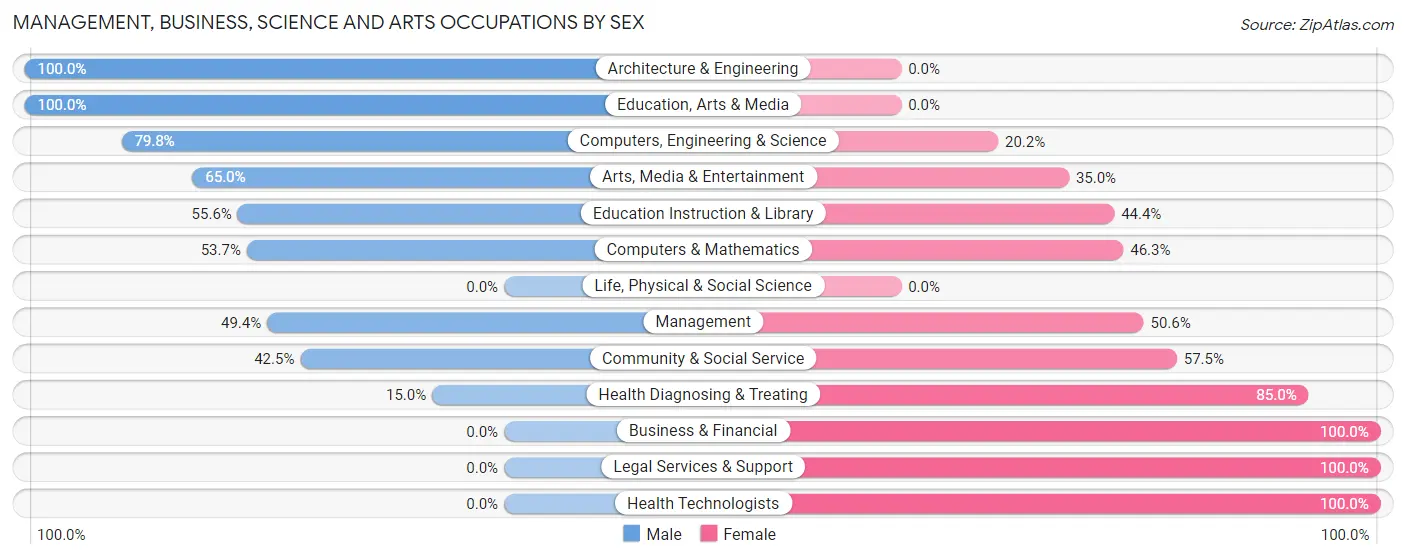
Management, Business, Science and Arts Occupations by Sex
Within the Management, Business, Science and Arts occupations in Enetai, the most male-oriented occupations are Architecture & Engineering (100.0%), Education, Arts & Media (100.0%), and Computers, Engineering & Science (79.8%), while the most female-oriented occupations are Business & Financial (100.0%), Legal Services & Support (100.0%), and Health Technologists (100.0%).
| Occupation | Male | Female |
| Management | 43 (49.4%) | 44 (50.6%) |
| Business & Financial | 0 (0.0%) | 25 (100.0%) |
| Computers, Engineering & Science | 75 (79.8%) | 19 (20.2%) |
| Computers & Mathematics | 22 (53.7%) | 19 (46.3%) |
| Architecture & Engineering | 53 (100.0%) | 0 (0.0%) |
| Life, Physical & Social Science | 0 (0.0%) | 0 (0.0%) |
| Community & Social Service | 34 (42.5%) | 46 (57.5%) |
| Education, Arts & Media | 11 (100.0%) | 0 (0.0%) |
| Legal Services & Support | 0 (0.0%) | 31 (100.0%) |
| Education Instruction & Library | 10 (55.6%) | 8 (44.4%) |
| Arts, Media & Entertainment | 13 (65.0%) | 7 (35.0%) |
| Health Diagnosing & Treating | 3 (15.0%) | 17 (85.0%) |
| Health Technologists | 0 (0.0%) | 9 (100.0%) |
| Total (Category) | 155 (50.6%) | 151 (49.3%) |
| Total (Overall) | 384 (52.2%) | 352 (47.8%) |
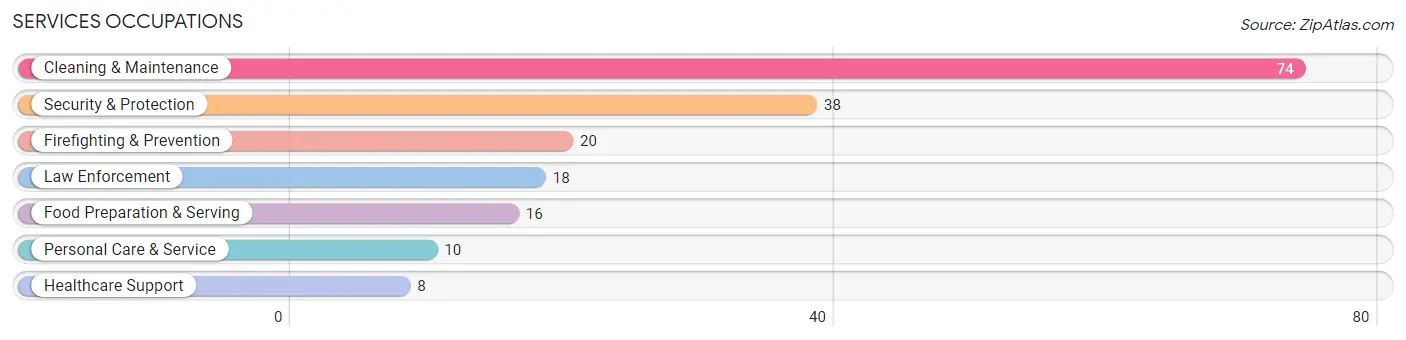
Services Occupations
The most common Services occupations in Enetai are Cleaning & Maintenance (74 | 10.1%), Security & Protection (38 | 5.2%), Firefighting & Prevention (20 | 2.7%), Law Enforcement (18 | 2.5%), and Food Preparation & Serving (16 | 2.2%).
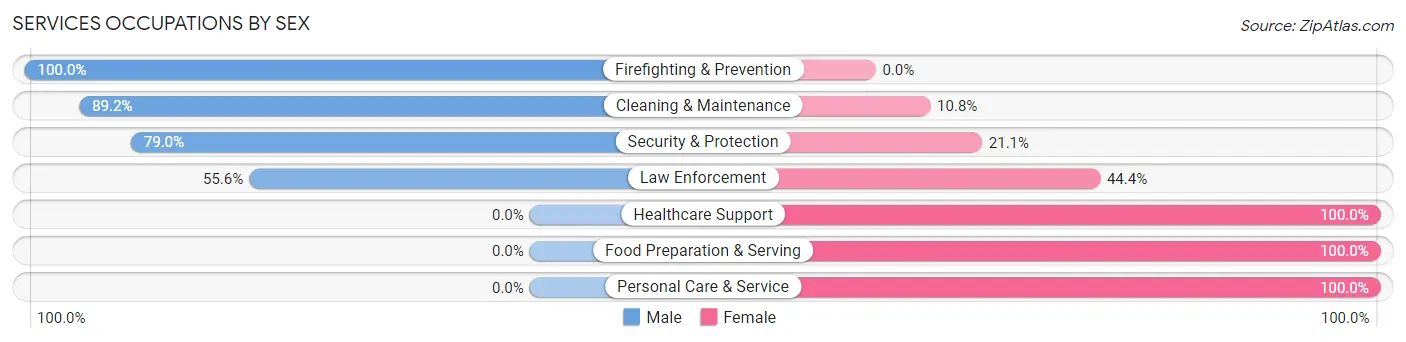
Services Occupations by Sex
Within the Services occupations in Enetai, the most male-oriented occupations are Firefighting & Prevention (100.0%), Cleaning & Maintenance (89.2%), and Security & Protection (78.9%), while the most female-oriented occupations are Healthcare Support (100.0%), Food Preparation & Serving (100.0%), and Personal Care & Service (100.0%).
| Occupation | Male | Female |
| Healthcare Support | 0 (0.0%) | 8 (100.0%) |
| Security & Protection | 30 (78.9%) | 8 (21.0%) |
| Firefighting & Prevention | 20 (100.0%) | 0 (0.0%) |
| Law Enforcement | 10 (55.6%) | 8 (44.4%) |
| Food Preparation & Serving | 0 (0.0%) | 16 (100.0%) |
| Cleaning & Maintenance | 66 (89.2%) | 8 (10.8%) |
| Personal Care & Service | 0 (0.0%) | 10 (100.0%) |
| Total (Category) | 96 (65.7%) | 50 (34.3%) |
| Total (Overall) | 384 (52.2%) | 352 (47.8%) |
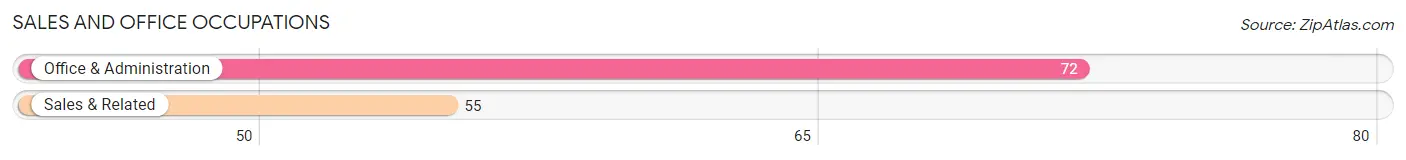
Sales and Office Occupations
The most common Sales and Office occupations in Enetai are Office & Administration (72 | 9.8%), and Sales & Related (55 | 7.5%).
Sales and Office Occupations by Sex
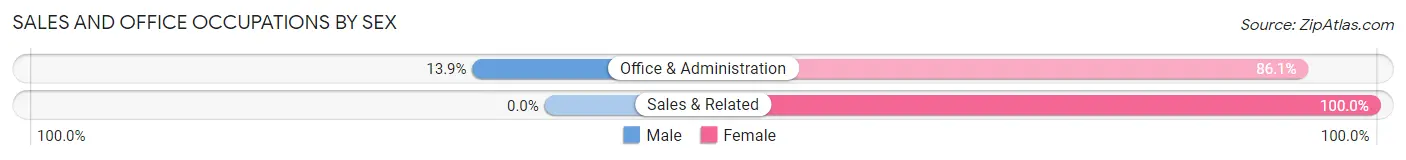
| Occupation | Male | Female |
| Sales & Related | 0 (0.0%) | 55 (100.0%) |
| Office & Administration | 10 (13.9%) | 62 (86.1%) |
| Total (Category) | 10 (7.9%) | 117 (92.1%) |
| Total (Overall) | 384 (52.2%) | 352 (47.8%) |
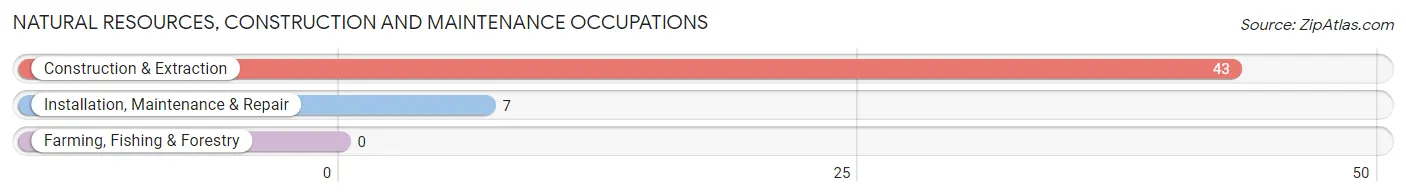
Natural Resources, Construction and Maintenance Occupations
The most common Natural Resources, Construction and Maintenance occupations in Enetai are Construction & Extraction (43 | 5.8%), and Installation, Maintenance & Repair (7 | 0.9%).
Natural Resources, Construction and Maintenance Occupations by Sex
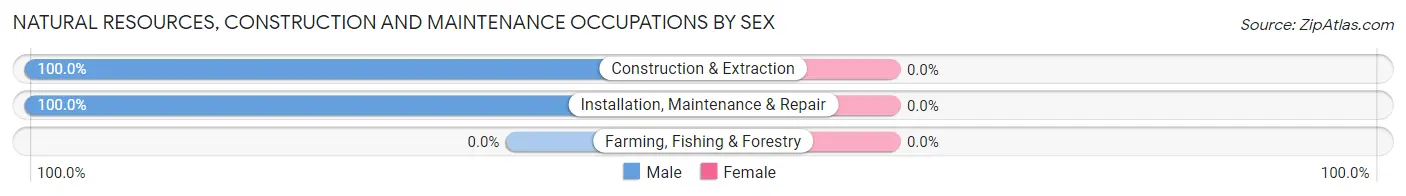
| Occupation | Male | Female |
| Farming, Fishing & Forestry | 0 (0.0%) | 0 (0.0%) |
| Construction & Extraction | 43 (100.0%) | 0 (0.0%) |
| Installation, Maintenance & Repair | 7 (100.0%) | 0 (0.0%) |
| Total (Category) | 50 (100.0%) | 0 (0.0%) |
| Total (Overall) | 384 (52.2%) | 352 (47.8%) |
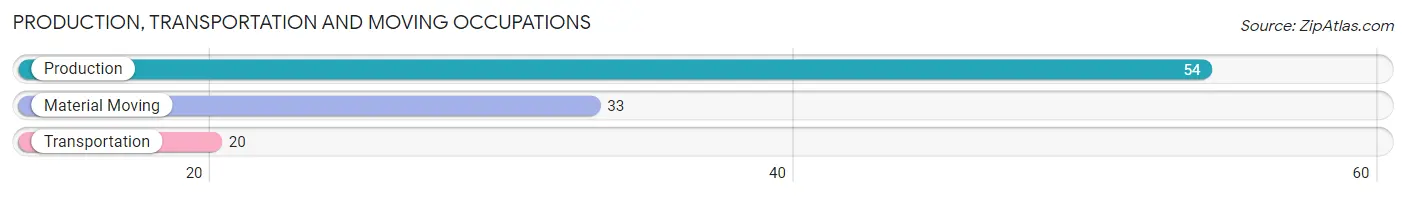
Production, Transportation and Moving Occupations
The most common Production, Transportation and Moving occupations in Enetai are Production (54 | 7.3%), Material Moving (33 | 4.5%), and Transportation (20 | 2.7%).
Production, Transportation and Moving Occupations by Sex
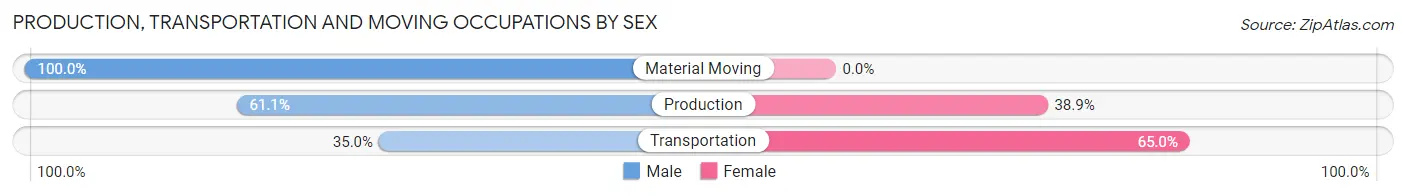
| Occupation | Male | Female |
| Production | 33 (61.1%) | 21 (38.9%) |
| Transportation | 7 (35.0%) | 13 (65.0%) |
| Material Moving | 33 (100.0%) | 0 (0.0%) |
| Total (Category) | 73 (68.2%) | 34 (31.8%) |
| Total (Overall) | 384 (52.2%) | 352 (47.8%) |
Employment Industries by Sex in Enetai
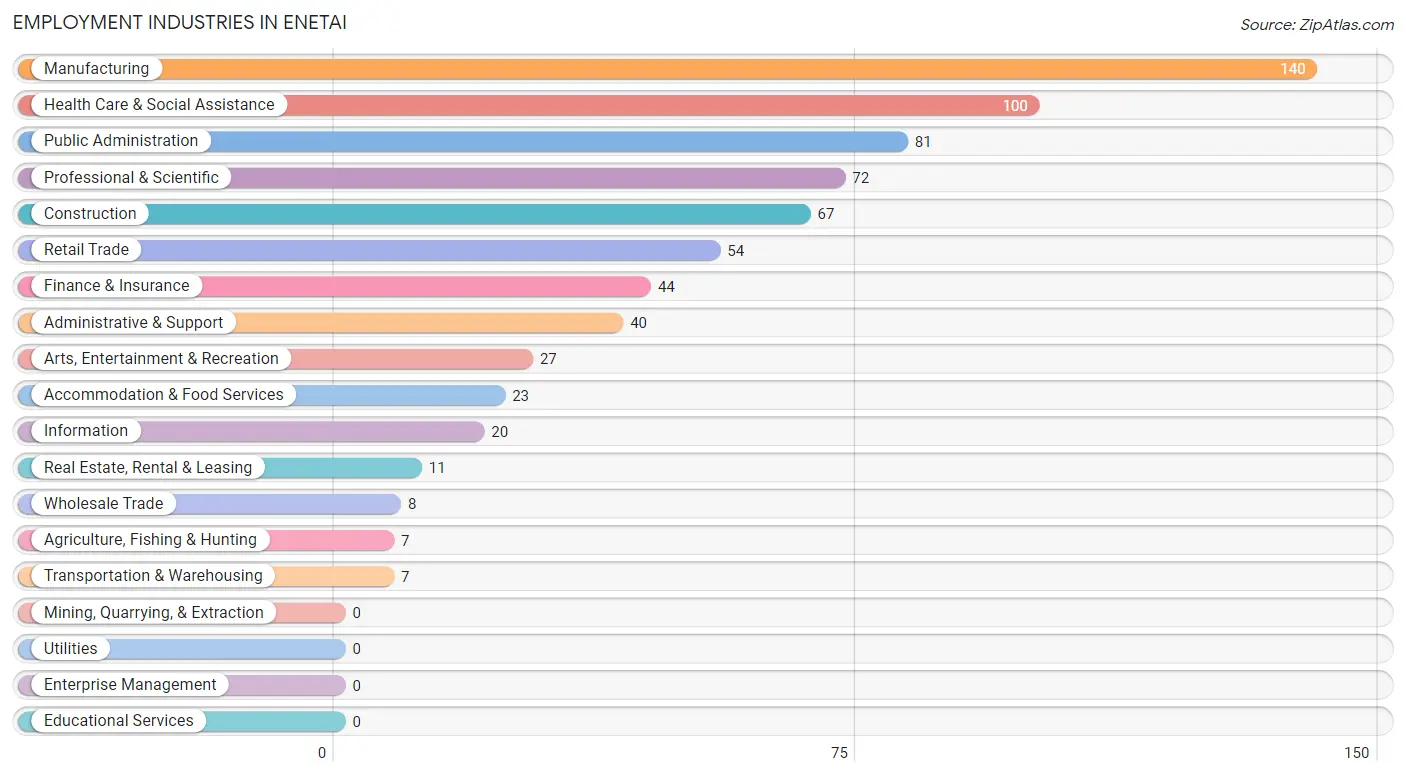
Employment Industries in Enetai
The major employment industries in Enetai include Manufacturing (140 | 19.0%), Health Care & Social Assistance (100 | 13.6%), Public Administration (81 | 11.0%), Professional & Scientific (72 | 9.8%), and Construction (67 | 9.1%).
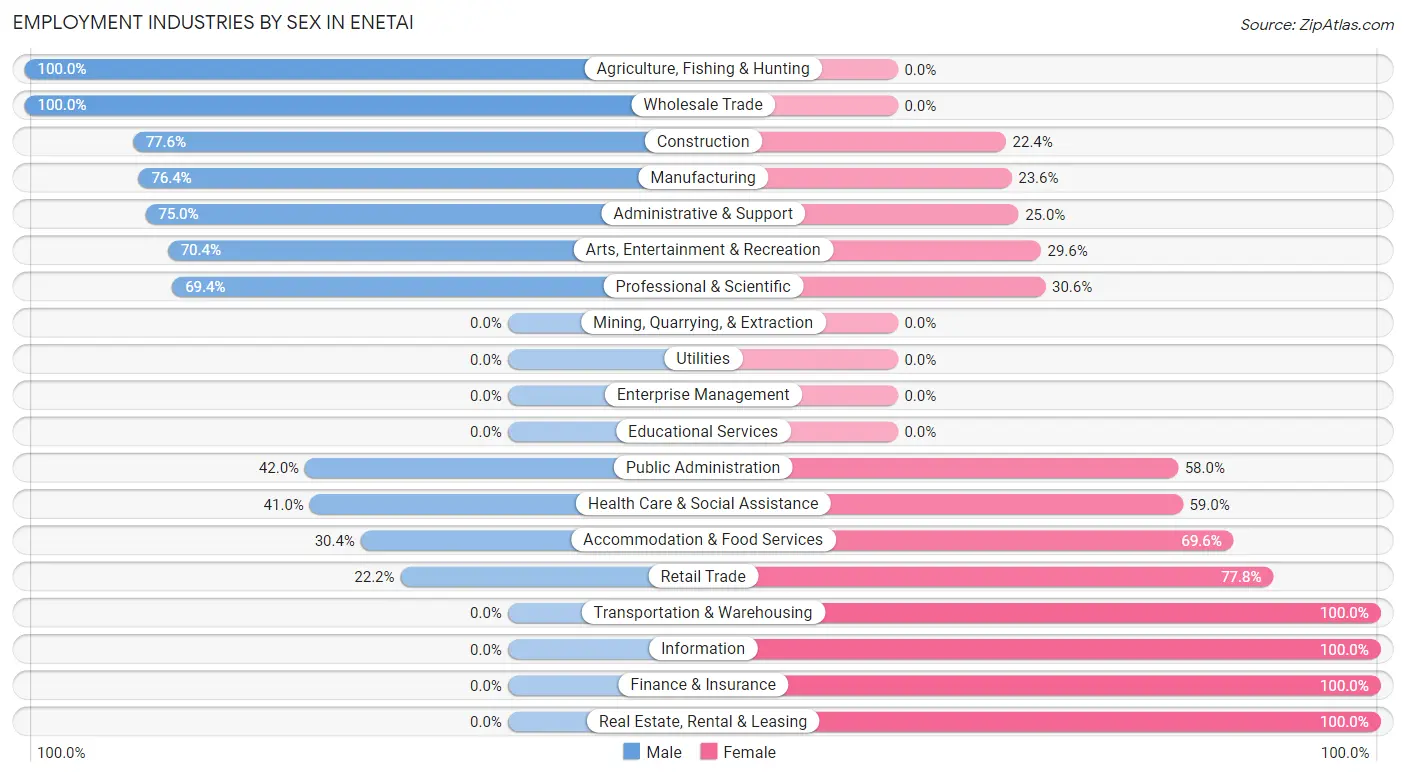
Employment Industries by Sex in Enetai
The Enetai industries that see more men than women are Agriculture, Fishing & Hunting (100.0%), Wholesale Trade (100.0%), and Construction (77.6%), whereas the industries that tend to have a higher number of women are Transportation & Warehousing (100.0%), Information (100.0%), and Finance & Insurance (100.0%).
| Industry | Male | Female |
| Agriculture, Fishing & Hunting | 7 (100.0%) | 0 (0.0%) |
| Mining, Quarrying, & Extraction | 0 (0.0%) | 0 (0.0%) |
| Construction | 52 (77.6%) | 15 (22.4%) |
| Manufacturing | 107 (76.4%) | 33 (23.6%) |
| Wholesale Trade | 8 (100.0%) | 0 (0.0%) |
| Retail Trade | 12 (22.2%) | 42 (77.8%) |
| Transportation & Warehousing | 0 (0.0%) | 7 (100.0%) |
| Utilities | 0 (0.0%) | 0 (0.0%) |
| Information | 0 (0.0%) | 20 (100.0%) |
| Finance & Insurance | 0 (0.0%) | 44 (100.0%) |
| Real Estate, Rental & Leasing | 0 (0.0%) | 11 (100.0%) |
| Professional & Scientific | 50 (69.4%) | 22 (30.6%) |
| Enterprise Management | 0 (0.0%) | 0 (0.0%) |
| Administrative & Support | 30 (75.0%) | 10 (25.0%) |
| Educational Services | 0 (0.0%) | 0 (0.0%) |
| Health Care & Social Assistance | 41 (41.0%) | 59 (59.0%) |
| Arts, Entertainment & Recreation | 19 (70.4%) | 8 (29.6%) |
| Accommodation & Food Services | 7 (30.4%) | 16 (69.6%) |
| Public Administration | 34 (42.0%) | 47 (58.0%) |
| Total | 384 (52.2%) | 352 (47.8%) |
Education in Enetai
School Enrollment in Enetai
The most common levels of schooling among the 407 students in Enetai are middle school (117 | 28.7%), college / undergraduate (115 | 28.3%), and high school (88 | 21.6%).
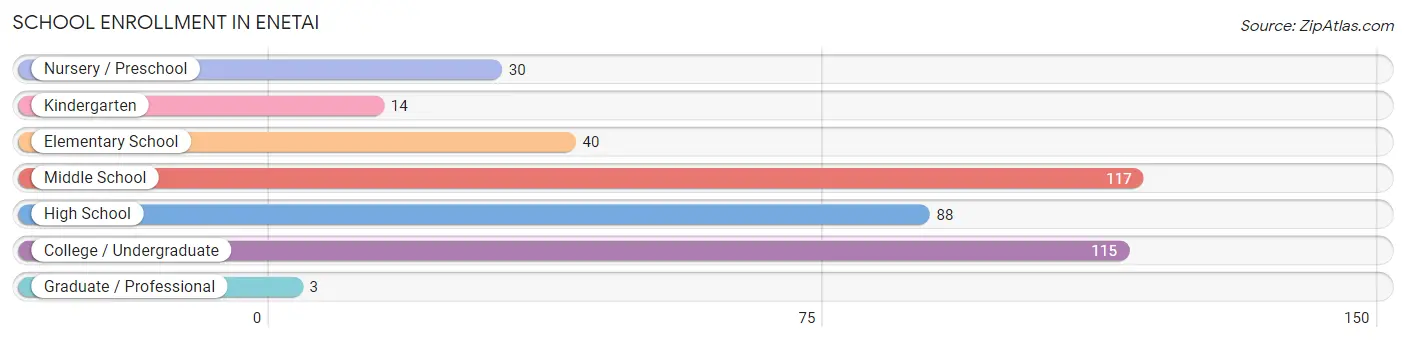
| School Level | # Students | % Students |
| Nursery / Preschool | 30 | 7.4% |
| Kindergarten | 14 | 3.4% |
| Elementary School | 40 | 9.8% |
| Middle School | 117 | 28.7% |
| High School | 88 | 21.6% |
| College / Undergraduate | 115 | 28.3% |
| Graduate / Professional | 3 | 0.7% |
| Total | 407 | 100.0% |
School Enrollment by Age by Funding Source in Enetai
Out of a total of 407 students who are enrolled in schools in Enetai, 90 (22.1%) attend a private institution, while the remaining 317 (77.9%) are enrolled in public schools. The age group of 3 to 4 year olds has the highest likelihood of being enrolled in private schools, with 10 (100.0% in the age bracket) enrolled. Conversely, the age group of 10 to 14 year olds has the lowest likelihood of being enrolled in a private school, with 130 (100.0% in the age bracket) attending a public institution.
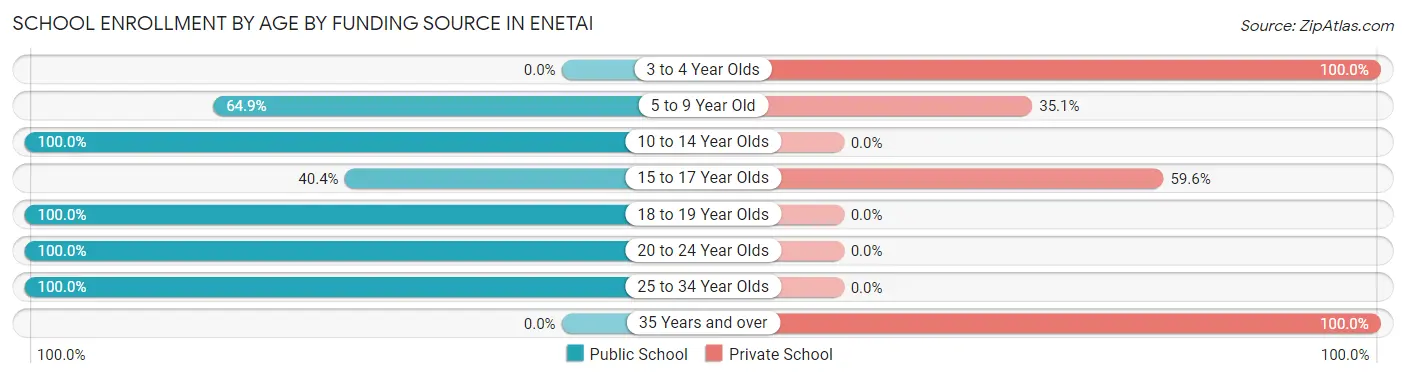
| Age Bracket | Public School | Private School |
| 3 to 4 Year Olds | 0 (0.0%) | 10 (100.0%) |
| 5 to 9 Year Old | 48 (64.9%) | 26 (35.1%) |
| 10 to 14 Year Olds | 130 (100.0%) | 0 (0.0%) |
| 15 to 17 Year Olds | 19 (40.4%) | 28 (59.6%) |
| 18 to 19 Year Olds | 25 (100.0%) | 0 (0.0%) |
| 20 to 24 Year Olds | 37 (100.0%) | 0 (0.0%) |
| 25 to 34 Year Olds | 58 (100.0%) | 0 (0.0%) |
| 35 Years and over | 0 (0.0%) | 26 (100.0%) |
| Total | 317 (77.9%) | 90 (22.1%) |
Educational Attainment by Field of Study in Enetai
Engineering (101 | 22.3%), business (83 | 18.3%), computers & mathematics (50 | 11.0%), social sciences (41 | 9.0%), and communications (36 | 7.9%) are the most common fields of study among 454 individuals in Enetai who have obtained a bachelor's degree or higher.
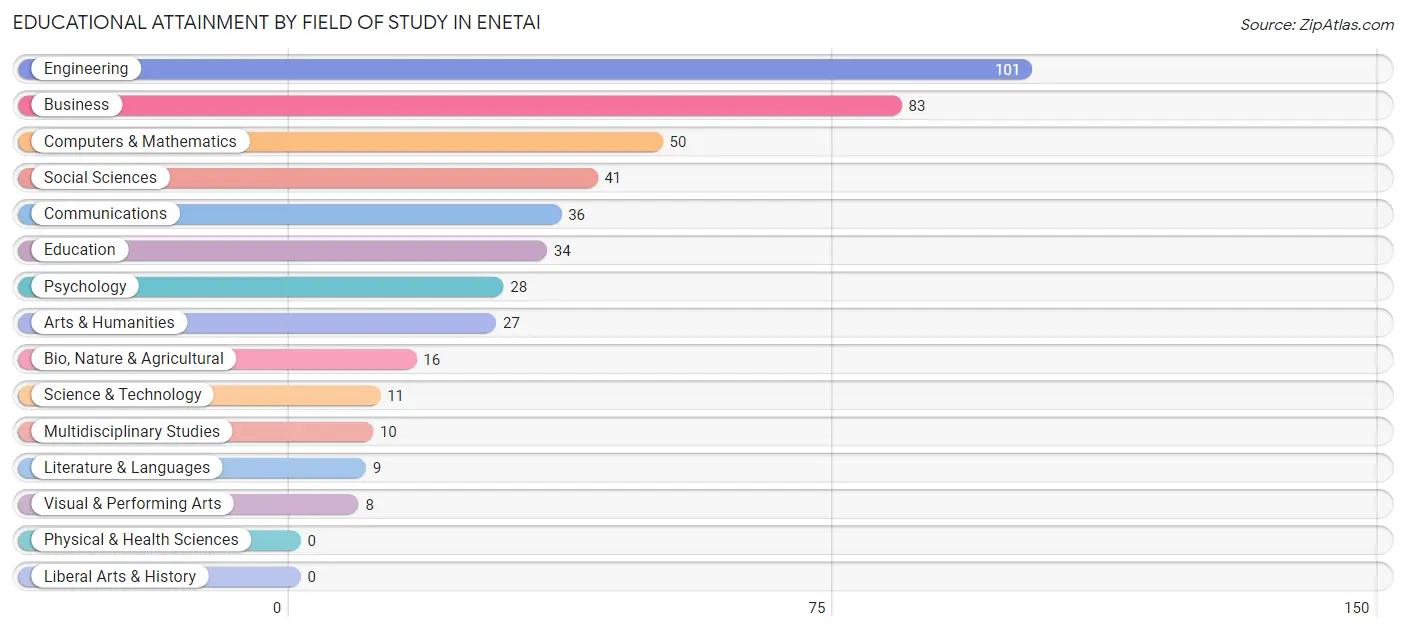
| Field of Study | # Graduates | % Graduates |
| Computers & Mathematics | 50 | 11.0% |
| Bio, Nature & Agricultural | 16 | 3.5% |
| Physical & Health Sciences | 0 | 0.0% |
| Psychology | 28 | 6.2% |
| Social Sciences | 41 | 9.0% |
| Engineering | 101 | 22.3% |
| Multidisciplinary Studies | 10 | 2.2% |
| Science & Technology | 11 | 2.4% |
| Business | 83 | 18.3% |
| Education | 34 | 7.5% |
| Literature & Languages | 9 | 2.0% |
| Liberal Arts & History | 0 | 0.0% |
| Visual & Performing Arts | 8 | 1.8% |
| Communications | 36 | 7.9% |
| Arts & Humanities | 27 | 5.9% |
| Total | 454 | 100.0% |
Transportation & Commute in Enetai
Vehicle Availability by Sex in Enetai
The most prevalent vehicle ownership categories in Enetai are males with 2 vehicles (179, accounting for 41.4%) and females with 2 vehicles (90, making up 53.6%).
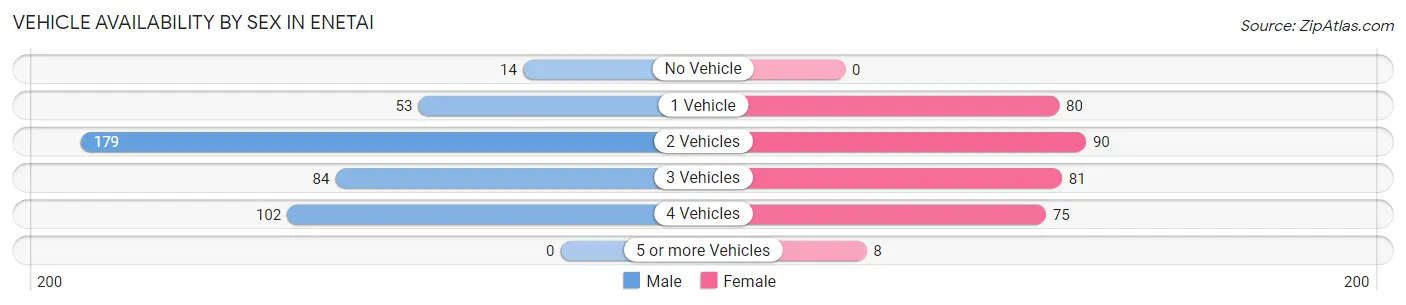
| Vehicles Available | Male | Female |
| No Vehicle | 14 (3.2%) | 0 (0.0%) |
| 1 Vehicle | 53 (12.3%) | 80 (23.9%) |
| 2 Vehicles | 179 (41.4%) | 90 (27.0%) |
| 3 Vehicles | 84 (19.4%) | 81 (24.2%) |
| 4 Vehicles | 102 (23.6%) | 75 (22.5%) |
| 5 or more Vehicles | 0 (0.0%) | 8 (2.4%) |
| Total | 432 (100.0%) | 334 (100.0%) |
Commute Time in Enetai
The most frequently occuring commute durations in Enetai are 15 to 19 minutes (214 commuters, 30.5%), 10 to 14 minutes (91 commuters, 13.0%), and 30 to 34 minutes (81 commuters, 11.6%).
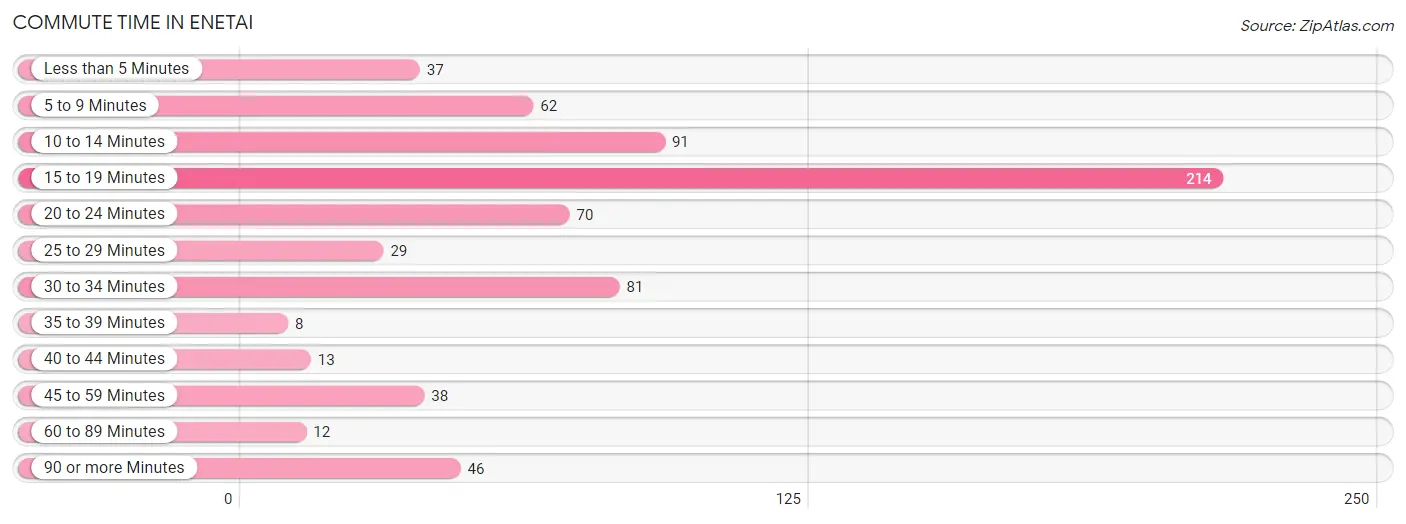
| Commute Time | # Commuters | % Commuters |
| Less than 5 Minutes | 37 | 5.3% |
| 5 to 9 Minutes | 62 | 8.8% |
| 10 to 14 Minutes | 91 | 13.0% |
| 15 to 19 Minutes | 214 | 30.5% |
| 20 to 24 Minutes | 70 | 10.0% |
| 25 to 29 Minutes | 29 | 4.1% |
| 30 to 34 Minutes | 81 | 11.6% |
| 35 to 39 Minutes | 8 | 1.1% |
| 40 to 44 Minutes | 13 | 1.8% |
| 45 to 59 Minutes | 38 | 5.4% |
| 60 to 89 Minutes | 12 | 1.7% |
| 90 or more Minutes | 46 | 6.6% |
Commute Time by Sex in Enetai
The most common commute times in Enetai are 15 to 19 minutes (137 commuters, 33.7%) for males and 15 to 19 minutes (77 commuters, 26.1%) for females.
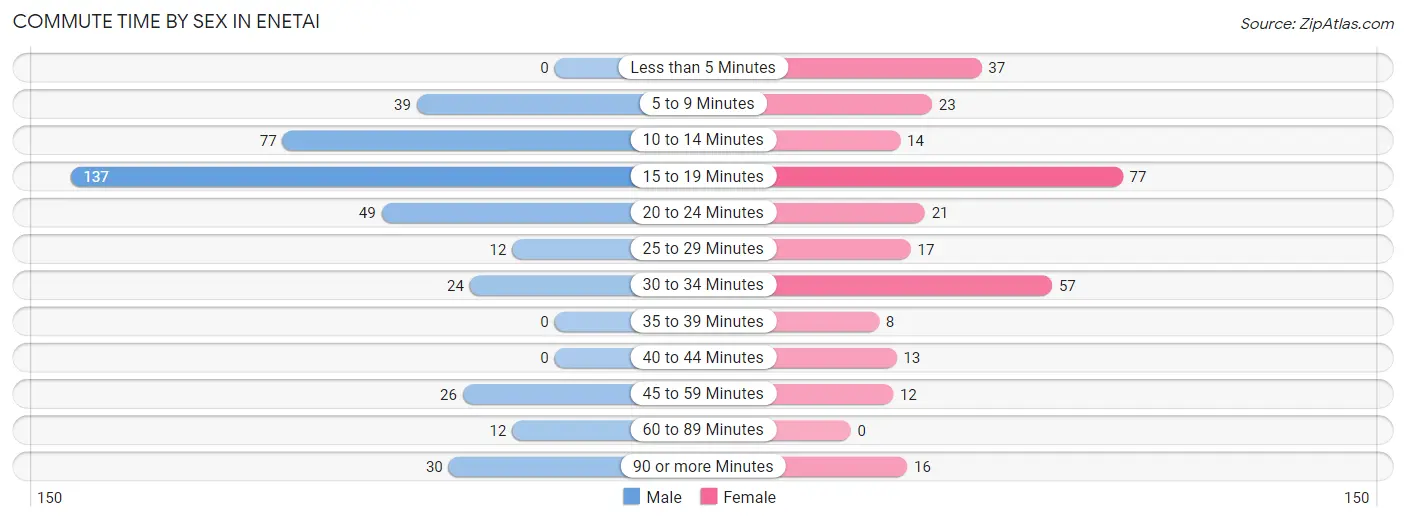
| Commute Time | Male | Female |
| Less than 5 Minutes | 0 (0.0%) | 37 (12.5%) |
| 5 to 9 Minutes | 39 (9.6%) | 23 (7.8%) |
| 10 to 14 Minutes | 77 (19.0%) | 14 (4.8%) |
| 15 to 19 Minutes | 137 (33.7%) | 77 (26.1%) |
| 20 to 24 Minutes | 49 (12.1%) | 21 (7.1%) |
| 25 to 29 Minutes | 12 (3.0%) | 17 (5.8%) |
| 30 to 34 Minutes | 24 (5.9%) | 57 (19.3%) |
| 35 to 39 Minutes | 0 (0.0%) | 8 (2.7%) |
| 40 to 44 Minutes | 0 (0.0%) | 13 (4.4%) |
| 45 to 59 Minutes | 26 (6.4%) | 12 (4.1%) |
| 60 to 89 Minutes | 12 (3.0%) | 0 (0.0%) |
| 90 or more Minutes | 30 (7.4%) | 16 (5.4%) |
Time of Departure to Work by Sex in Enetai
The most frequent times of departure to work in Enetai are 7:30 AM to 7:59 AM (69, 17.0%) for males and 8:30 AM to 8:59 AM (77, 26.1%) for females.
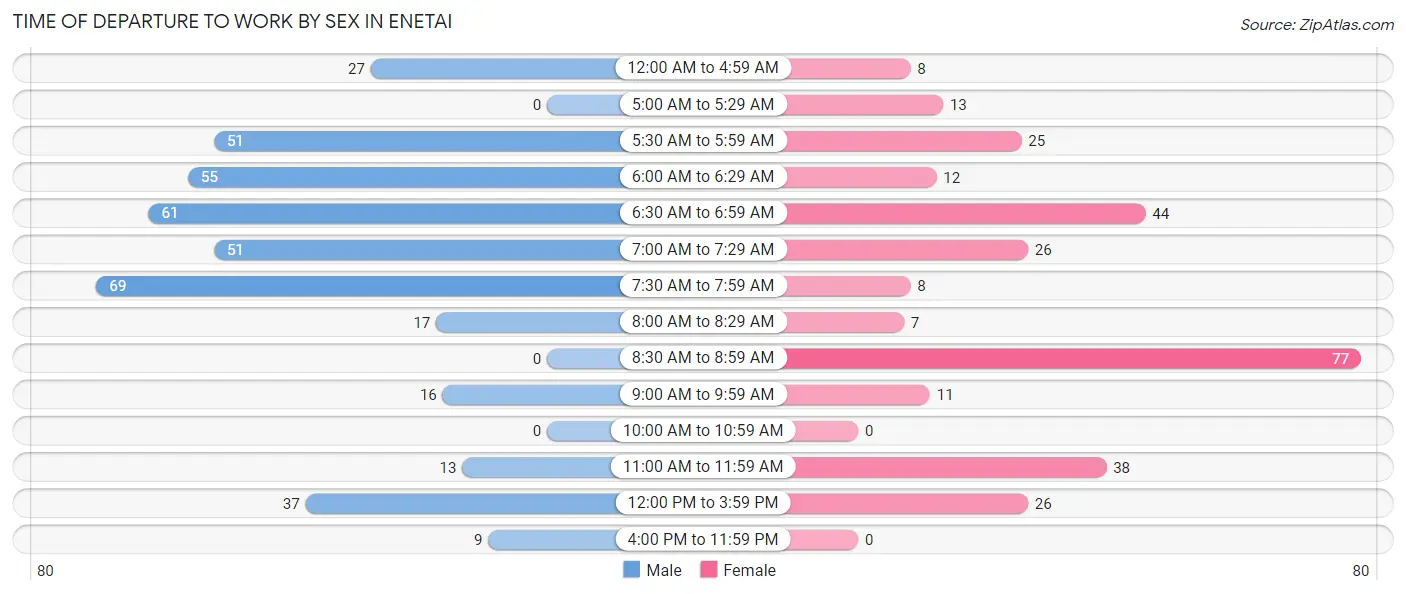
| Time of Departure | Male | Female |
| 12:00 AM to 4:59 AM | 27 (6.7%) | 8 (2.7%) |
| 5:00 AM to 5:29 AM | 0 (0.0%) | 13 (4.4%) |
| 5:30 AM to 5:59 AM | 51 (12.6%) | 25 (8.5%) |
| 6:00 AM to 6:29 AM | 55 (13.6%) | 12 (4.1%) |
| 6:30 AM to 6:59 AM | 61 (15.0%) | 44 (14.9%) |
| 7:00 AM to 7:29 AM | 51 (12.6%) | 26 (8.8%) |
| 7:30 AM to 7:59 AM | 69 (17.0%) | 8 (2.7%) |
| 8:00 AM to 8:29 AM | 17 (4.2%) | 7 (2.4%) |
| 8:30 AM to 8:59 AM | 0 (0.0%) | 77 (26.1%) |
| 9:00 AM to 9:59 AM | 16 (3.9%) | 11 (3.7%) |
| 10:00 AM to 10:59 AM | 0 (0.0%) | 0 (0.0%) |
| 11:00 AM to 11:59 AM | 13 (3.2%) | 38 (12.9%) |
| 12:00 PM to 3:59 PM | 37 (9.1%) | 26 (8.8%) |
| 4:00 PM to 11:59 PM | 9 (2.2%) | 0 (0.0%) |
| Total | 406 (100.0%) | 295 (100.0%) |
Housing Occupancy in Enetai
Occupancy by Ownership in Enetai
Of the total 707 dwellings in Enetai, owner-occupied units account for 559 (79.1%), while renter-occupied units make up 148 (20.9%).
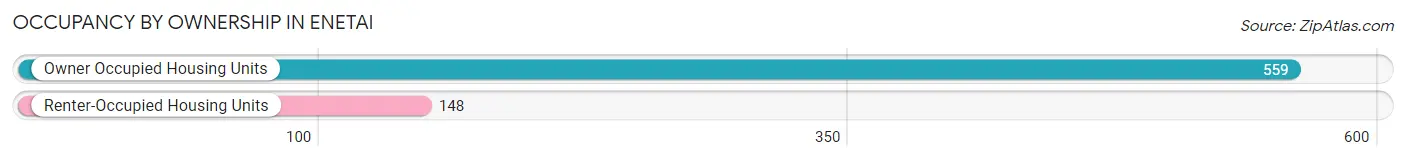
| Occupancy | # Housing Units | % Housing Units |
| Owner Occupied Housing Units | 559 | 79.1% |
| Renter-Occupied Housing Units | 148 | 20.9% |
| Total Occupied Housing Units | 707 | 100.0% |
Occupancy by Household Size in Enetai
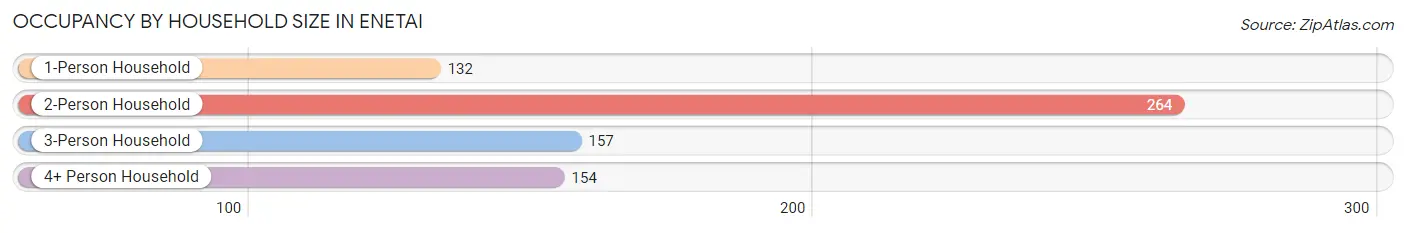
| Household Size | # Housing Units | % Housing Units |
| 1-Person Household | 132 | 18.7% |
| 2-Person Household | 264 | 37.3% |
| 3-Person Household | 157 | 22.2% |
| 4+ Person Household | 154 | 21.8% |
| Total Housing Units | 707 | 100.0% |
Occupancy by Ownership by Household Size in Enetai
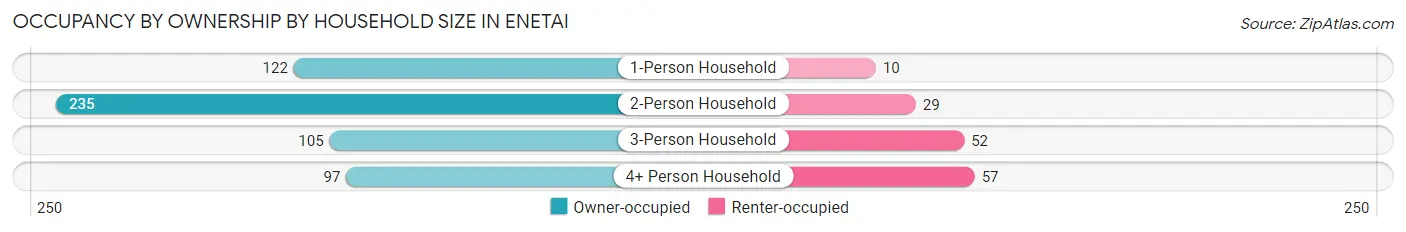
| Household Size | Owner-occupied | Renter-occupied |
| 1-Person Household | 122 (92.4%) | 10 (7.6%) |
| 2-Person Household | 235 (89.0%) | 29 (11.0%) |
| 3-Person Household | 105 (66.9%) | 52 (33.1%) |
| 4+ Person Household | 97 (63.0%) | 57 (37.0%) |
| Total Housing Units | 559 (79.1%) | 148 (20.9%) |
Occupancy by Educational Attainment in Enetai
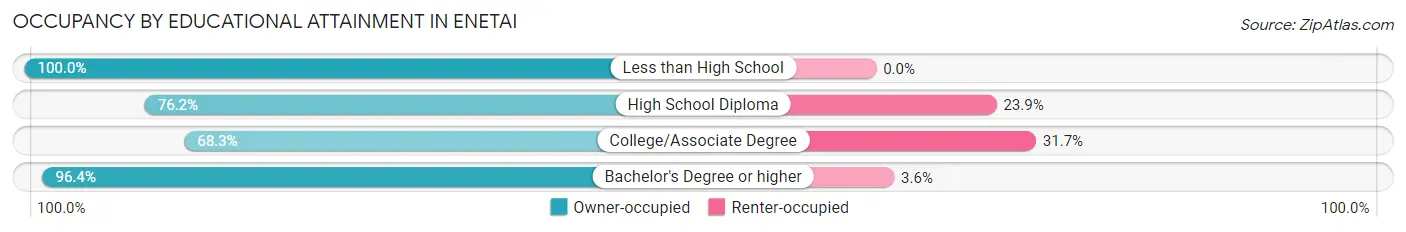
| Household Size | Owner-occupied | Renter-occupied |
| Less than High School | 14 (100.0%) | 0 (0.0%) |
| High School Diploma | 83 (76.1%) | 26 (23.8%) |
| College/Associate Degree | 246 (68.3%) | 114 (31.7%) |
| Bachelor's Degree or higher | 216 (96.4%) | 8 (3.6%) |
Occupancy by Age of Householder in Enetai
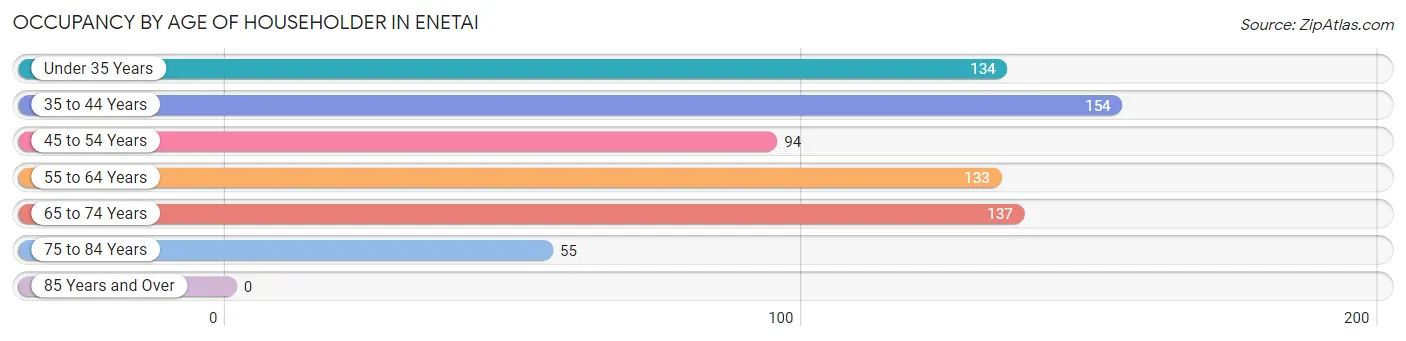
| Age Bracket | # Households | % Households |
| Under 35 Years | 134 | 19.0% |
| 35 to 44 Years | 154 | 21.8% |
| 45 to 54 Years | 94 | 13.3% |
| 55 to 64 Years | 133 | 18.8% |
| 65 to 74 Years | 137 | 19.4% |
| 75 to 84 Years | 55 | 7.8% |
| 85 Years and Over | 0 | 0.0% |
| Total | 707 | 100.0% |
Housing Finances in Enetai
Median Income by Occupancy in Enetai
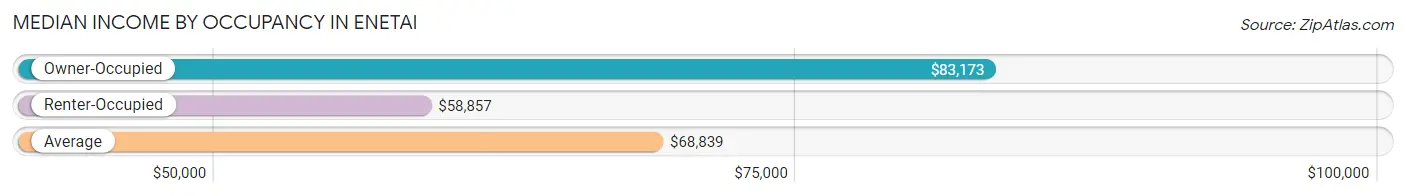
| Occupancy Type | # Households | Median Income |
| Owner-Occupied | 559 (79.1%) | $83,173 |
| Renter-Occupied | 148 (20.9%) | $58,857 |
| Average | 707 (100.0%) | $68,839 |
Occupancy by Householder Income Bracket in Enetai
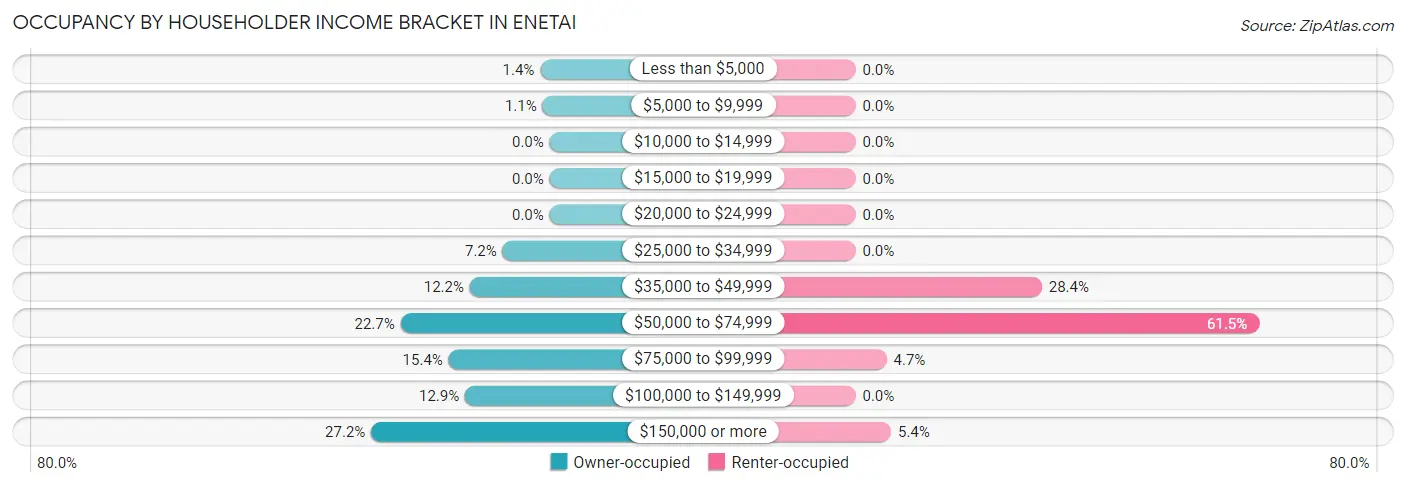
| Income Bracket | Owner-occupied | Renter-occupied |
| Less than $5,000 | 8 (1.4%) | 0 (0.0%) |
| $5,000 to $9,999 | 6 (1.1%) | 0 (0.0%) |
| $10,000 to $14,999 | 0 (0.0%) | 0 (0.0%) |
| $15,000 to $19,999 | 0 (0.0%) | 0 (0.0%) |
| $20,000 to $24,999 | 0 (0.0%) | 0 (0.0%) |
| $25,000 to $34,999 | 40 (7.2%) | 0 (0.0%) |
| $35,000 to $49,999 | 68 (12.2%) | 42 (28.4%) |
| $50,000 to $74,999 | 127 (22.7%) | 91 (61.5%) |
| $75,000 to $99,999 | 86 (15.4%) | 7 (4.7%) |
| $100,000 to $149,999 | 72 (12.9%) | 0 (0.0%) |
| $150,000 or more | 152 (27.2%) | 8 (5.4%) |
| Total | 559 (100.0%) | 148 (100.0%) |
Monthly Housing Cost Tiers in Enetai
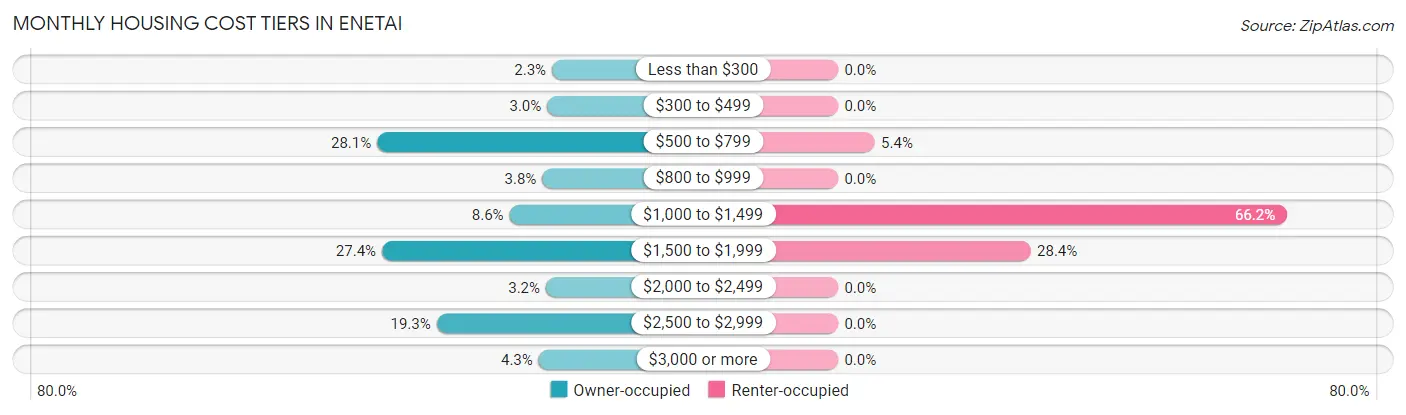
| Monthly Cost | Owner-occupied | Renter-occupied |
| Less than $300 | 13 (2.3%) | 0 (0.0%) |
| $300 to $499 | 17 (3.0%) | 0 (0.0%) |
| $500 to $799 | 157 (28.1%) | 8 (5.4%) |
| $800 to $999 | 21 (3.8%) | 0 (0.0%) |
| $1,000 to $1,499 | 48 (8.6%) | 98 (66.2%) |
| $1,500 to $1,999 | 153 (27.4%) | 42 (28.4%) |
| $2,000 to $2,499 | 18 (3.2%) | 0 (0.0%) |
| $2,500 to $2,999 | 108 (19.3%) | 0 (0.0%) |
| $3,000 or more | 24 (4.3%) | 0 (0.0%) |
| Total | 559 (100.0%) | 148 (100.0%) |
Physical Housing Characteristics in Enetai
Housing Structures in Enetai
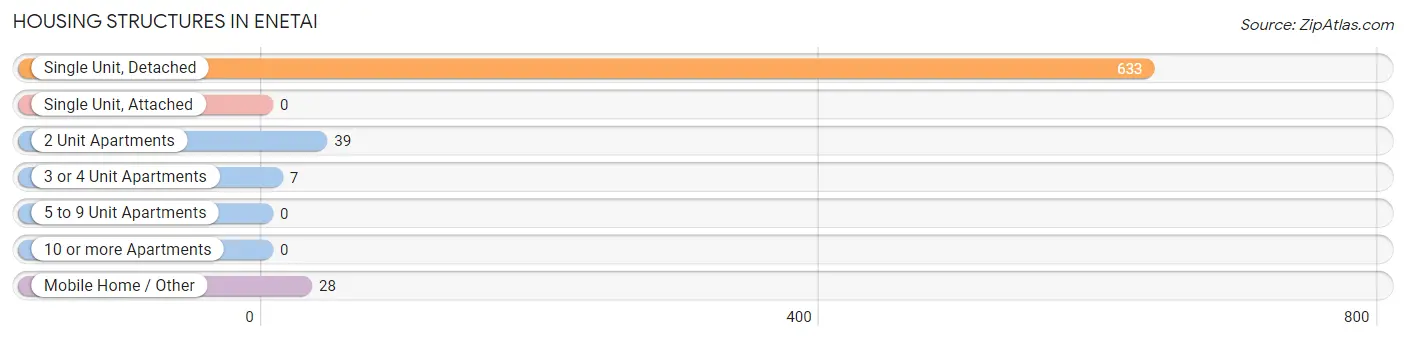
| Structure Type | # Housing Units | % Housing Units |
| Single Unit, Detached | 633 | 89.5% |
| Single Unit, Attached | 0 | 0.0% |
| 2 Unit Apartments | 39 | 5.5% |
| 3 or 4 Unit Apartments | 7 | 1.0% |
| 5 to 9 Unit Apartments | 0 | 0.0% |
| 10 or more Apartments | 0 | 0.0% |
| Mobile Home / Other | 28 | 4.0% |
| Total | 707 | 100.0% |
Housing Structures by Occupancy in Enetai
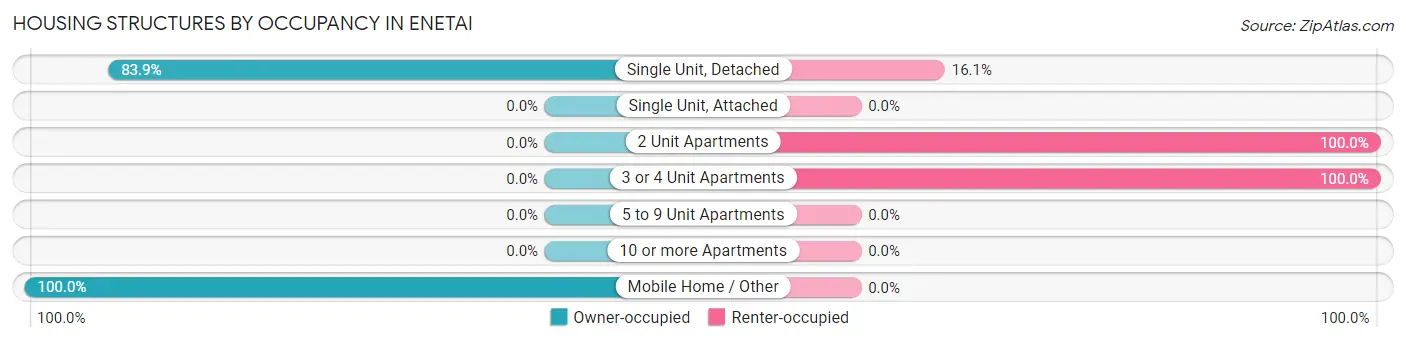
| Structure Type | Owner-occupied | Renter-occupied |
| Single Unit, Detached | 531 (83.9%) | 102 (16.1%) |
| Single Unit, Attached | 0 (0.0%) | 0 (0.0%) |
| 2 Unit Apartments | 0 (0.0%) | 39 (100.0%) |
| 3 or 4 Unit Apartments | 0 (0.0%) | 7 (100.0%) |
| 5 to 9 Unit Apartments | 0 (0.0%) | 0 (0.0%) |
| 10 or more Apartments | 0 (0.0%) | 0 (0.0%) |
| Mobile Home / Other | 28 (100.0%) | 0 (0.0%) |
| Total | 559 (79.1%) | 148 (20.9%) |
Housing Structures by Number of Rooms in Enetai
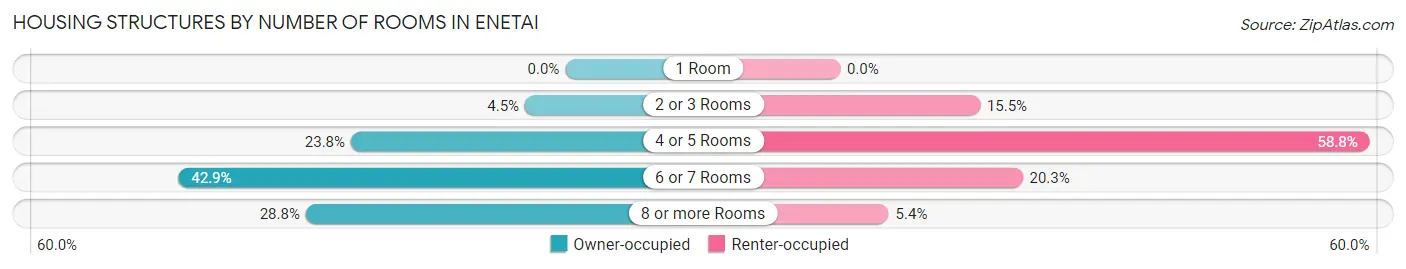
| Number of Rooms | Owner-occupied | Renter-occupied |
| 1 Room | 0 (0.0%) | 0 (0.0%) |
| 2 or 3 Rooms | 25 (4.5%) | 23 (15.5%) |
| 4 or 5 Rooms | 133 (23.8%) | 87 (58.8%) |
| 6 or 7 Rooms | 240 (42.9%) | 30 (20.3%) |
| 8 or more Rooms | 161 (28.8%) | 8 (5.4%) |
| Total | 559 (100.0%) | 148 (100.0%) |
Housing Structure by Heating Type in Enetai
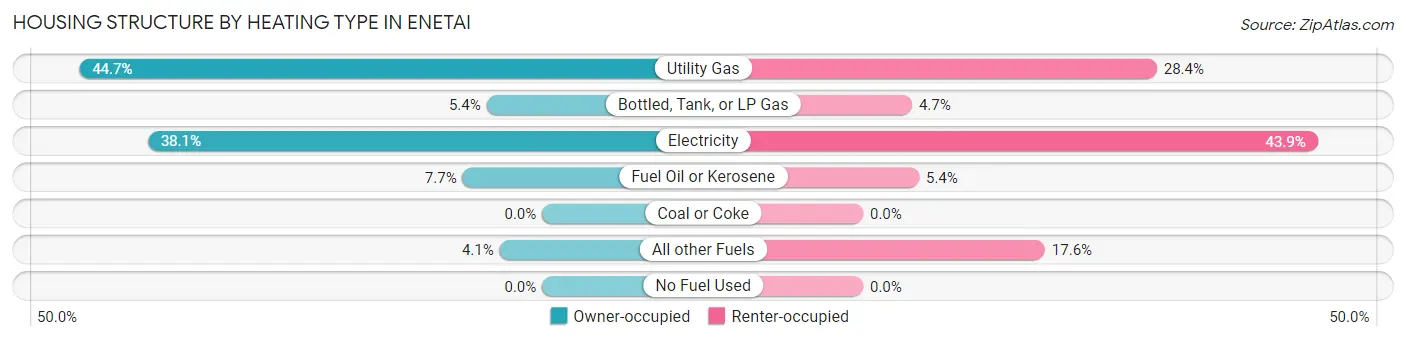
| Heating Type | Owner-occupied | Renter-occupied |
| Utility Gas | 250 (44.7%) | 42 (28.4%) |
| Bottled, Tank, or LP Gas | 30 (5.4%) | 7 (4.7%) |
| Electricity | 213 (38.1%) | 65 (43.9%) |
| Fuel Oil or Kerosene | 43 (7.7%) | 8 (5.4%) |
| Coal or Coke | 0 (0.0%) | 0 (0.0%) |
| All other Fuels | 23 (4.1%) | 26 (17.6%) |
| No Fuel Used | 0 (0.0%) | 0 (0.0%) |
| Total | 559 (100.0%) | 148 (100.0%) |
Household Vehicle Usage in Enetai
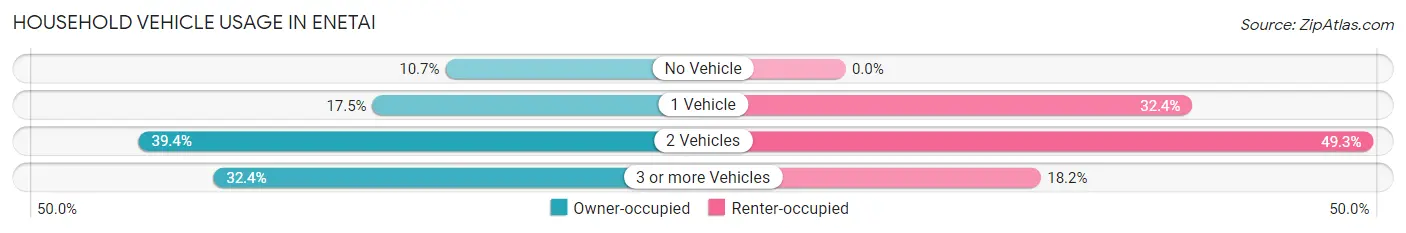
| Vehicles per Household | Owner-occupied | Renter-occupied |
| No Vehicle | 60 (10.7%) | 0 (0.0%) |
| 1 Vehicle | 98 (17.5%) | 48 (32.4%) |
| 2 Vehicles | 220 (39.4%) | 73 (49.3%) |
| 3 or more Vehicles | 181 (32.4%) | 27 (18.2%) |
| Total | 559 (100.0%) | 148 (100.0%) |
Real Estate & Mortgages in Enetai
Real Estate and Mortgage Overview in Enetai
| Characteristic | Without Mortgage | With Mortgage |
| Housing Units | 216 | 343 |
| Median Property Value | $407,400 | $425,500 |
| Median Household Income | $55,000 | $130 |
| Monthly Housing Costs | $650 | $24 |
| Real Estate Taxes | $3,941 | $8 |
Property Value by Mortgage Status in Enetai
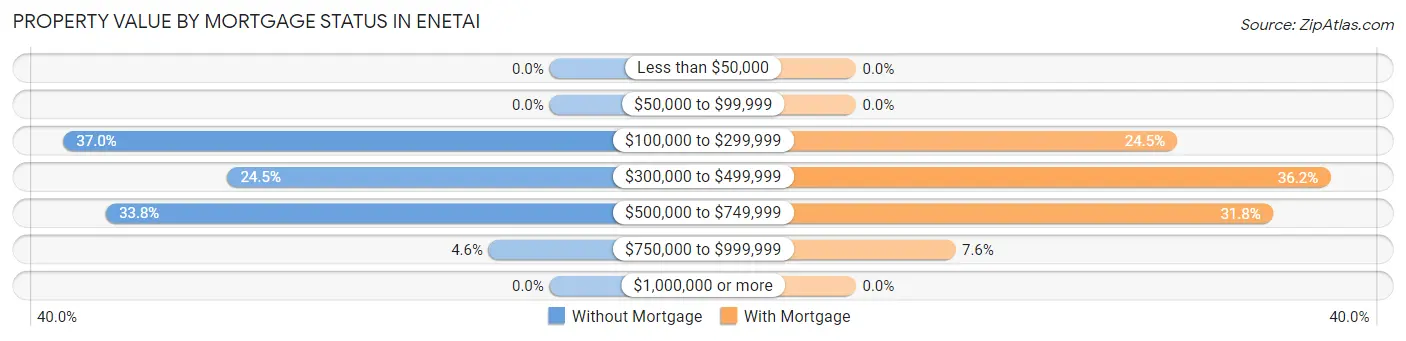
| Property Value | Without Mortgage | With Mortgage |
| Less than $50,000 | 0 (0.0%) | 0 (0.0%) |
| $50,000 to $99,999 | 0 (0.0%) | 0 (0.0%) |
| $100,000 to $299,999 | 80 (37.0%) | 84 (24.5%) |
| $300,000 to $499,999 | 53 (24.5%) | 124 (36.1%) |
| $500,000 to $749,999 | 73 (33.8%) | 109 (31.8%) |
| $750,000 to $999,999 | 10 (4.6%) | 26 (7.6%) |
| $1,000,000 or more | 0 (0.0%) | 0 (0.0%) |
| Total | 216 (100.0%) | 343 (100.0%) |
Household Income by Mortgage Status in Enetai
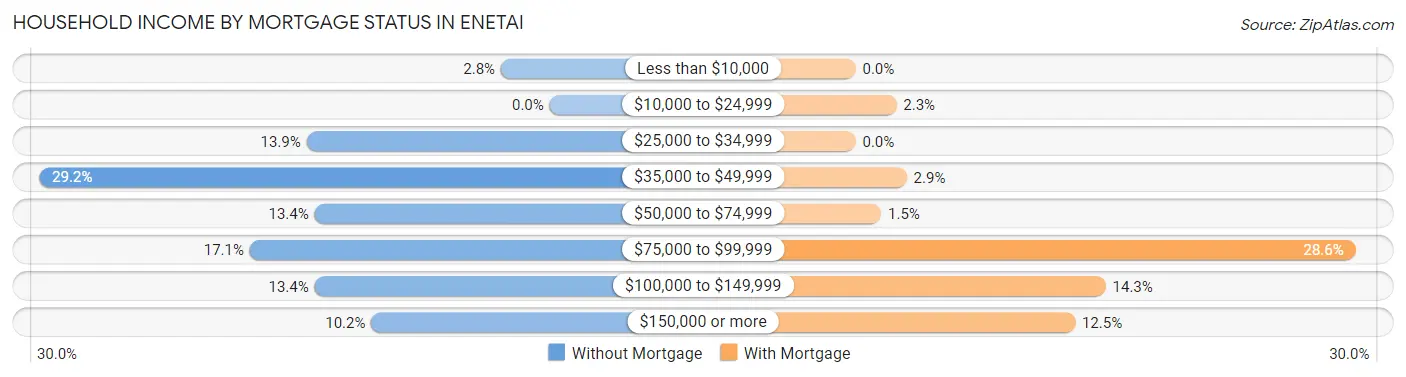
| Household Income | Without Mortgage | With Mortgage |
| Less than $10,000 | 6 (2.8%) | 0 (0.0%) |
| $10,000 to $24,999 | 0 (0.0%) | 8 (2.3%) |
| $25,000 to $34,999 | 30 (13.9%) | 0 (0.0%) |
| $35,000 to $49,999 | 63 (29.2%) | 10 (2.9%) |
| $50,000 to $74,999 | 29 (13.4%) | 5 (1.5%) |
| $75,000 to $99,999 | 37 (17.1%) | 98 (28.6%) |
| $100,000 to $149,999 | 29 (13.4%) | 49 (14.3%) |
| $150,000 or more | 22 (10.2%) | 43 (12.5%) |
| Total | 216 (100.0%) | 343 (100.0%) |
Property Value to Household Income Ratio in Enetai
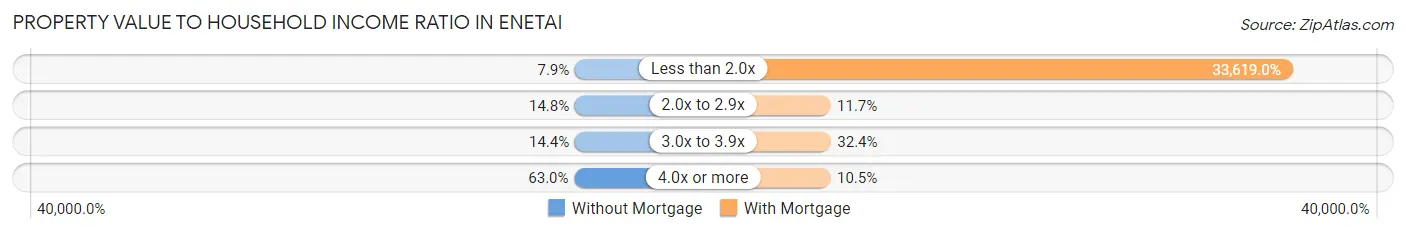
| Value-to-Income Ratio | Without Mortgage | With Mortgage |
| Less than 2.0x | 17 (7.9%) | 115,313 (33,619.0%) |
| 2.0x to 2.9x | 32 (14.8%) | 40 (11.7%) |
| 3.0x to 3.9x | 31 (14.3%) | 111 (32.4%) |
| 4.0x or more | 136 (63.0%) | 36 (10.5%) |
| Total | 216 (100.0%) | 343 (100.0%) |
Real Estate Taxes by Mortgage Status in Enetai
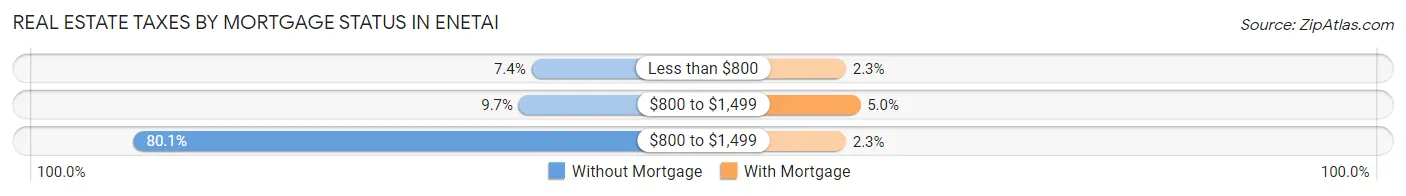
| Property Taxes | Without Mortgage | With Mortgage |
| Less than $800 | 16 (7.4%) | 8 (2.3%) |
| $800 to $1,499 | 21 (9.7%) | 17 (5.0%) |
| $800 to $1,499 | 173 (80.1%) | 8 (2.3%) |
| Total | 216 (100.0%) | 343 (100.0%) |
Health & Disability in Enetai
Health Insurance Coverage by Age in Enetai
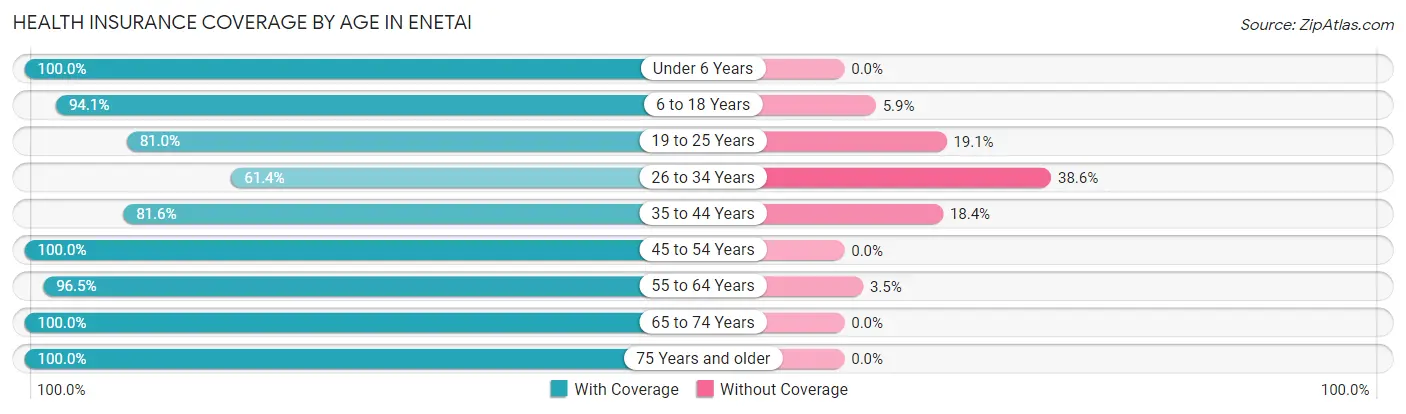
| Age Bracket | With Coverage | Without Coverage |
| Under 6 Years | 168 (100.0%) | 0 (0.0%) |
| 6 to 18 Years | 241 (94.1%) | 15 (5.9%) |
| 19 to 25 Years | 85 (80.9%) | 20 (19.1%) |
| 26 to 34 Years | 145 (61.4%) | 91 (38.6%) |
| 35 to 44 Years | 235 (81.6%) | 53 (18.4%) |
| 45 to 54 Years | 132 (100.0%) | 0 (0.0%) |
| 55 to 64 Years | 222 (96.5%) | 8 (3.5%) |
| 65 to 74 Years | 258 (100.0%) | 0 (0.0%) |
| 75 Years and older | 148 (100.0%) | 0 (0.0%) |
| Total | 1,634 (89.7%) | 187 (10.3%) |
Health Insurance Coverage by Citizenship Status in Enetai
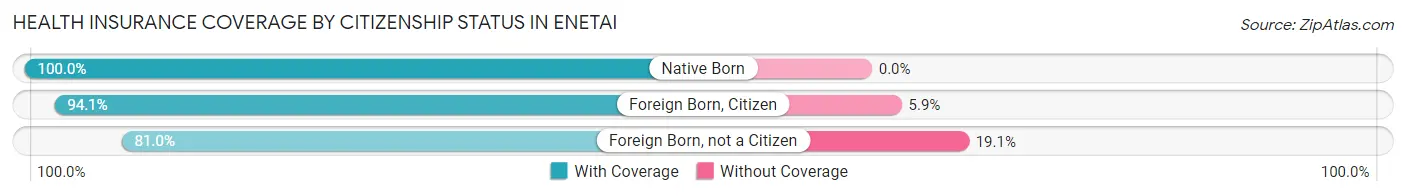
| Citizenship Status | With Coverage | Without Coverage |
| Native Born | 168 (100.0%) | 0 (0.0%) |
| Foreign Born, Citizen | 241 (94.1%) | 15 (5.9%) |
| Foreign Born, not a Citizen | 85 (80.9%) | 20 (19.1%) |
Health Insurance Coverage by Household Income in Enetai
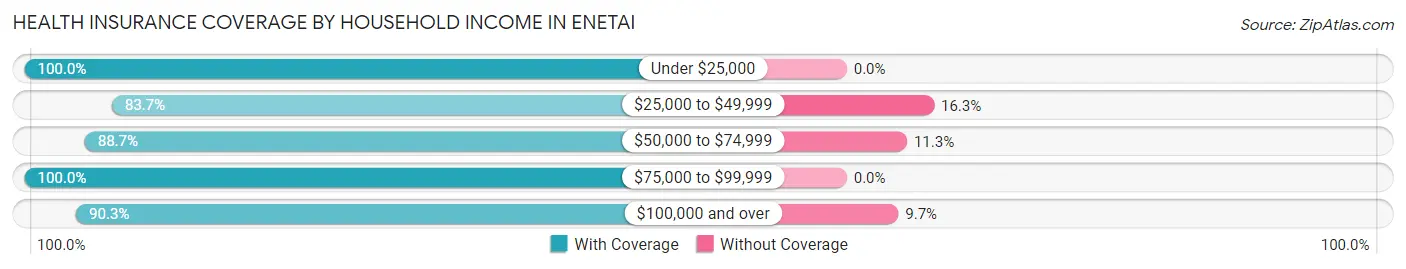
| Household Income | With Coverage | Without Coverage |
| Under $25,000 | 22 (100.0%) | 0 (0.0%) |
| $25,000 to $49,999 | 302 (83.7%) | 59 (16.3%) |
| $50,000 to $74,999 | 417 (88.7%) | 53 (11.3%) |
| $75,000 to $99,999 | 192 (100.0%) | 0 (0.0%) |
| $100,000 and over | 701 (90.3%) | 75 (9.7%) |
Public vs Private Health Insurance Coverage by Age in Enetai
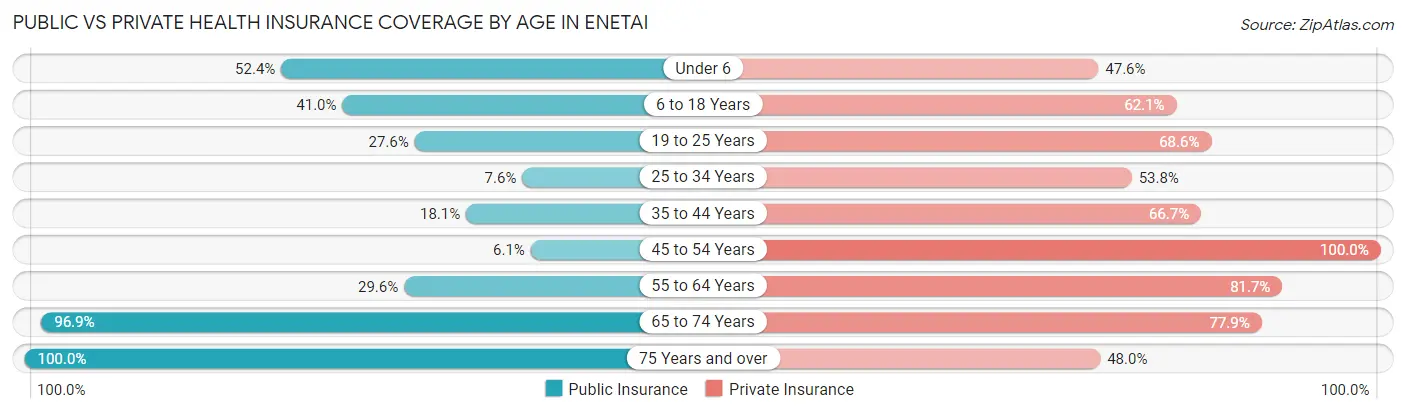
| Age Bracket | Public Insurance | Private Insurance |
| Under 6 | 88 (52.4%) | 80 (47.6%) |
| 6 to 18 Years | 105 (41.0%) | 159 (62.1%) |
| 19 to 25 Years | 29 (27.6%) | 72 (68.6%) |
| 25 to 34 Years | 18 (7.6%) | 127 (53.8%) |
| 35 to 44 Years | 52 (18.1%) | 192 (66.7%) |
| 45 to 54 Years | 8 (6.1%) | 132 (100.0%) |
| 55 to 64 Years | 68 (29.6%) | 188 (81.7%) |
| 65 to 74 Years | 250 (96.9%) | 201 (77.9%) |
| 75 Years and over | 148 (100.0%) | 71 (48.0%) |
| Total | 766 (42.1%) | 1,222 (67.1%) |
Disability Status by Sex by Age in Enetai
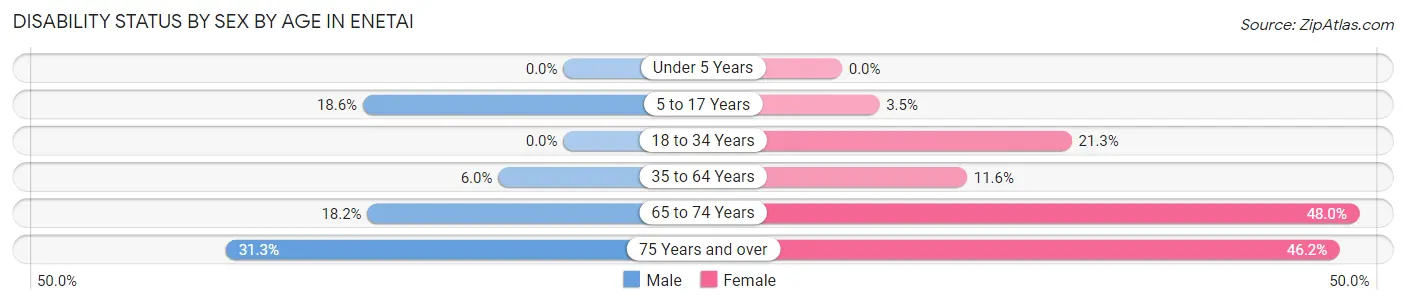
| Age Bracket | Male | Female |
| Under 5 Years | 0 (0.0%) | 0 (0.0%) |
| 5 to 17 Years | 16 (18.6%) | 6 (3.5%) |
| 18 to 34 Years | 0 (0.0%) | 45 (21.3%) |
| 35 to 64 Years | 20 (6.0%) | 37 (11.6%) |
| 65 to 74 Years | 20 (18.2%) | 71 (48.0%) |
| 75 Years and over | 26 (31.3%) | 30 (46.2%) |
Disability Class by Sex by Age in Enetai
Disability Class: Hearing Difficulty
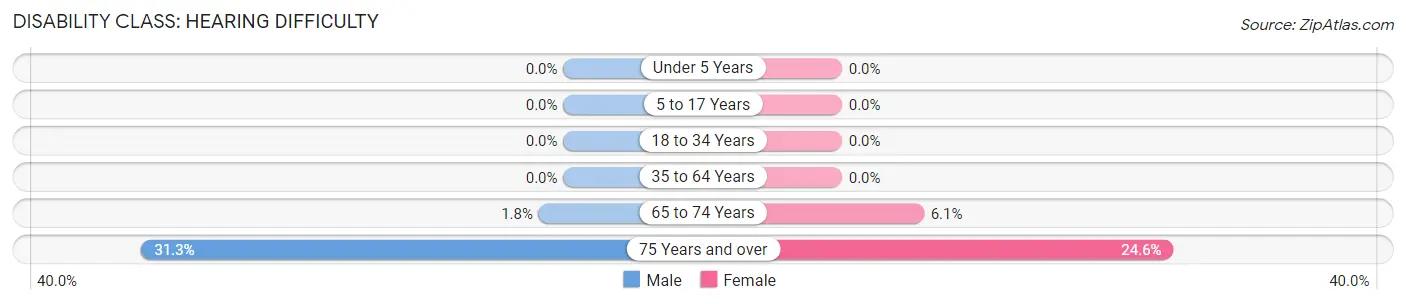
| Age Bracket | Male | Female |
| Under 5 Years | 0 (0.0%) | 0 (0.0%) |
| 5 to 17 Years | 0 (0.0%) | 0 (0.0%) |
| 18 to 34 Years | 0 (0.0%) | 0 (0.0%) |
| 35 to 64 Years | 0 (0.0%) | 0 (0.0%) |
| 65 to 74 Years | 2 (1.8%) | 9 (6.1%) |
| 75 Years and over | 26 (31.3%) | 16 (24.6%) |
Disability Class: Vision Difficulty
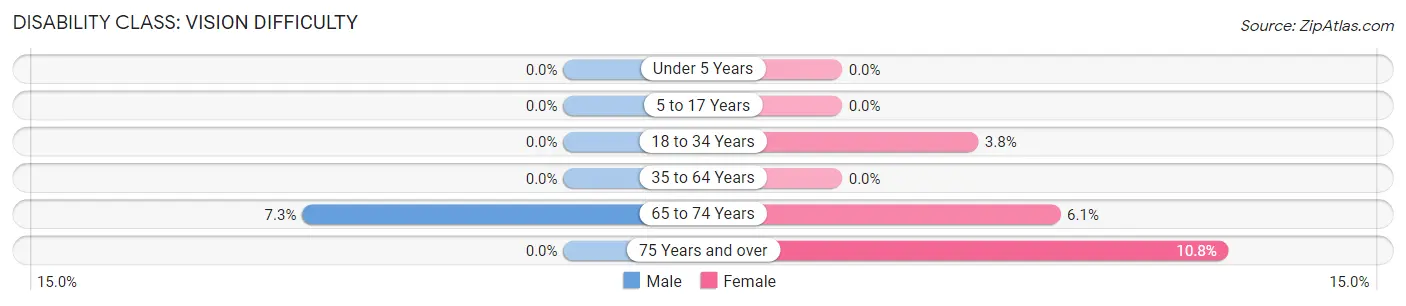
| Age Bracket | Male | Female |
| Under 5 Years | 0 (0.0%) | 0 (0.0%) |
| 5 to 17 Years | 0 (0.0%) | 0 (0.0%) |
| 18 to 34 Years | 0 (0.0%) | 8 (3.8%) |
| 35 to 64 Years | 0 (0.0%) | 0 (0.0%) |
| 65 to 74 Years | 8 (7.3%) | 9 (6.1%) |
| 75 Years and over | 0 (0.0%) | 7 (10.8%) |
Disability Class: Cognitive Difficulty
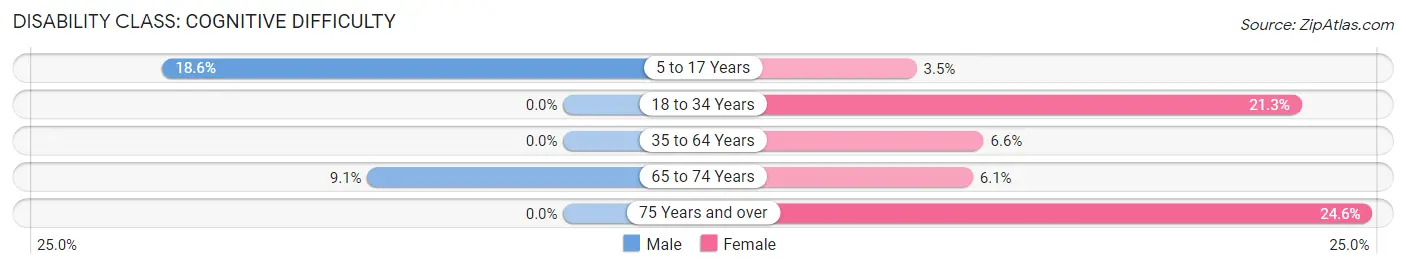
| Age Bracket | Male | Female |
| 5 to 17 Years | 16 (18.6%) | 6 (3.5%) |
| 18 to 34 Years | 0 (0.0%) | 45 (21.3%) |
| 35 to 64 Years | 0 (0.0%) | 21 (6.6%) |
| 65 to 74 Years | 10 (9.1%) | 9 (6.1%) |
| 75 Years and over | 0 (0.0%) | 16 (24.6%) |
Disability Class: Ambulatory Difficulty
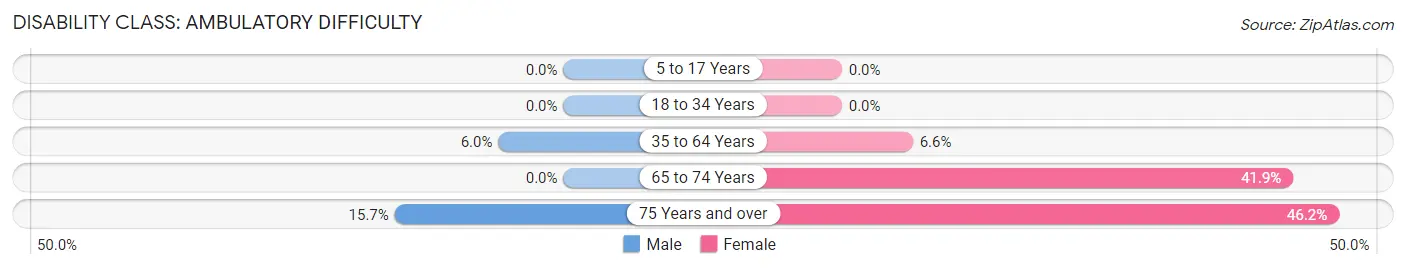
| Age Bracket | Male | Female |
| 5 to 17 Years | 0 (0.0%) | 0 (0.0%) |
| 18 to 34 Years | 0 (0.0%) | 0 (0.0%) |
| 35 to 64 Years | 20 (6.0%) | 21 (6.6%) |
| 65 to 74 Years | 0 (0.0%) | 62 (41.9%) |
| 75 Years and over | 13 (15.7%) | 30 (46.2%) |
Disability Class: Self-Care Difficulty
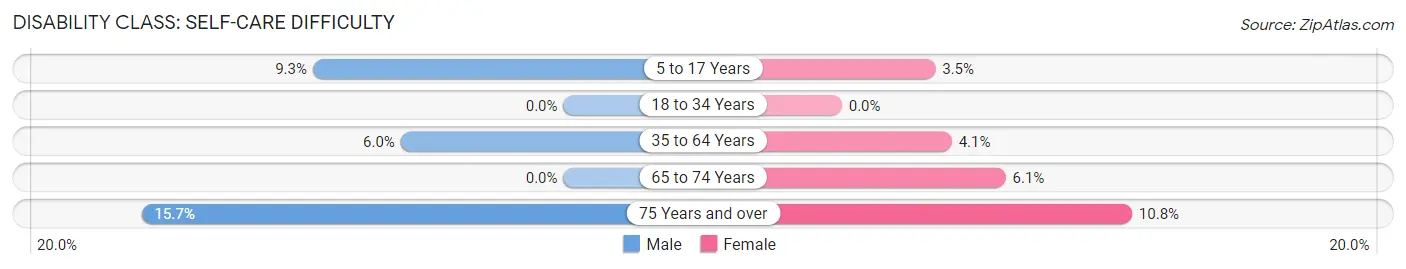
| Age Bracket | Male | Female |
| 5 to 17 Years | 8 (9.3%) | 6 (3.5%) |
| 18 to 34 Years | 0 (0.0%) | 0 (0.0%) |
| 35 to 64 Years | 20 (6.0%) | 13 (4.1%) |
| 65 to 74 Years | 0 (0.0%) | 9 (6.1%) |
| 75 Years and over | 13 (15.7%) | 7 (10.8%) |
Technology Access in Enetai
Computing Device Access in Enetai
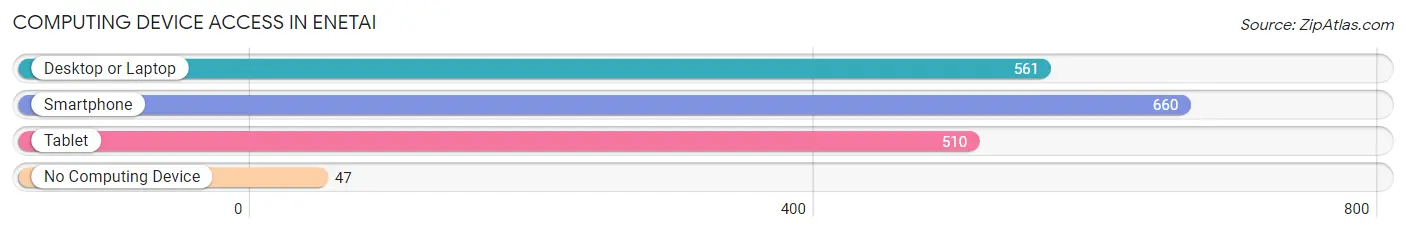
| Device Type | # Households | % Households |
| Desktop or Laptop | 561 | 79.3% |
| Smartphone | 660 | 93.3% |
| Tablet | 510 | 72.1% |
| No Computing Device | 47 | 6.7% |
| Total | 707 | 100.0% |
Internet Access in Enetai
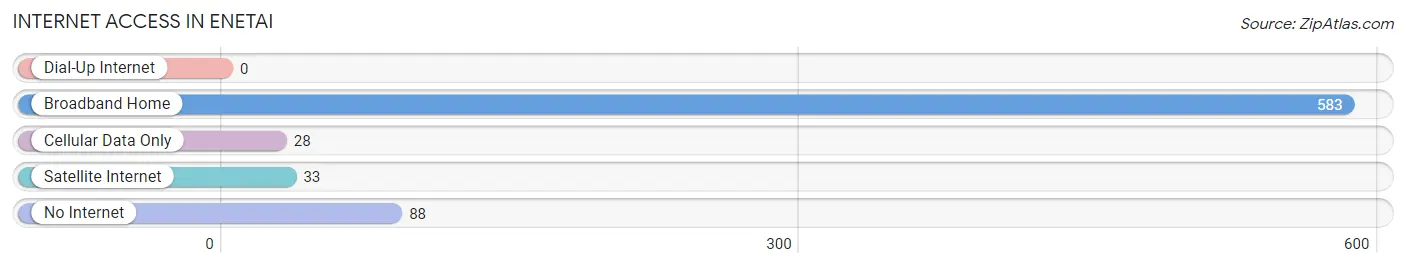
| Internet Type | # Households | % Households |
| Dial-Up Internet | 0 | 0.0% |
| Broadband Home | 583 | 82.5% |
| Cellular Data Only | 28 | 4.0% |
| Satellite Internet | 33 | 4.7% |
| No Internet | 88 | 12.4% |
| Total | 707 | 100.0% |
Enetai Summary
Enetai is a small unincorporated community located in Kitsap County, Washington. It is situated on the western shore of Puget Sound, just south of the city of Bremerton. The population of Enetai was estimated to be around 1,000 in 2000.
History
Enetai was first settled in the late 1800s by a group of Scandinavian immigrants. The area was originally known as “Enetai Point” and was used as a fishing and logging camp. In the early 1900s, the area was developed into a small community with a post office, general store, and a few homes.
In the 1920s, the area was annexed by the city of Bremerton and became part of the city’s growing industrial district. During World War II, the area was home to a large shipyard and several military installations. After the war, the area was redeveloped into a residential neighborhood.
Geography
Enetai is located on the western shore of Puget Sound, just south of the city of Bremerton. The area is bordered by the Sinclair Inlet to the north, the Port Washington Narrows to the east, and the Hood Canal to the south. The area is mostly flat, with some hills in the northern part of the community.
The climate in Enetai is mild and temperate, with average temperatures ranging from the mid-50s in the winter to the mid-70s in the summer. The area receives an average of 40 inches of rain per year.
Economy
The economy of Enetai is largely based on the service industry. The area is home to several restaurants, retail stores, and other businesses. The area also has a small marina, which provides access to the Puget Sound.
Demographics
As of the 2000 census, the population of Enetai was estimated to be around 1,000. The racial makeup of the area was 94.3% White, 1.2% African American, 0.7% Native American, 0.7% Asian, 0.3% Pacific Islander, and 2.1% from other races. The median household income was $45,000. The median age was 37.
Conclusion
Enetai is a small unincorporated community located in Kitsap County, Washington. It is situated on the western shore of Puget Sound, just south of the city of Bremerton. The area was first settled in the late 1800s by a group of Scandinavian immigrants and was later annexed by the city of Bremerton. The economy of Enetai is largely based on the service industry, and the population was estimated to be around 1,000 in 2000. The area has a mild and temperate climate, with average temperatures ranging from the mid-50s in the winter to the mid-70s in the summer.
Common Questions
What is Per Capita Income in Enetai?
Per Capita income in Enetai is $39,288.
What is the Median Family Income in Enetai?
Median Family Income in Enetai is $67,143.
What is the Median Household income in Enetai?
Median Household Income in Enetai is $68,839.
What is Income or Wage Gap in Enetai?
Income or Wage Gap in Enetai is 34.7%.
Women in Enetai earn 65.3 cents for every dollar earned by a man.
What is Inequality or Gini Index in Enetai?
Inequality or Gini Index in Enetai is 0.38.
What is the Total Population of Enetai?
Total Population of Enetai is 1,869.
What is the Total Male Population of Enetai?
Total Male Population of Enetai is 945.
What is the Total Female Population of Enetai?
Total Female Population of Enetai is 924.
What is the Ratio of Males per 100 Females in Enetai?
There are 102.27 Males per 100 Females in Enetai.
What is the Ratio of Females per 100 Males in Enetai?
There are 97.78 Females per 100 Males in Enetai.
What is the Median Population Age in Enetai?
Median Population Age in Enetai is 38.7 Years.
What is the Average Family Size in Enetai
Average Family Size in Enetai is 2.9 People.
What is the Average Household Size in Enetai
Average Household Size in Enetai is 2.6 People.
How Large is the Labor Force in Enetai?
There are 867 People in the Labor Forcein in Enetai.
What is the Percentage of People in the Labor Force in Enetai?
57.4% of People are in the Labor Force in Enetai.
What is the Unemployment Rate in Enetai?
Unemployment Rate in Enetai is 10.1%.