Lake Stevens, WA Map & Demographics
Lake Stevens Map
Lake Stevens Overview
$43,351
PER CAPITA INCOME
$116,071
AVG FAMILY INCOME
$111,821
AVG HOUSEHOLD INCOME
38.2%
WAGE / INCOME GAP [ % ]
61.8¢/ $1
WAGE / INCOME GAP [ $ ]
0.33
INEQUALITY / GINI INDEX
38,816
TOTAL POPULATION
19,581
MALE POPULATION
19,235
FEMALE POPULATION
101.80
MALES / 100 FEMALES
98.23
FEMALES / 100 MALES
34.4
MEDIAN AGE
3.3
AVG FAMILY SIZE
3.0
AVG HOUSEHOLD SIZE
20,837
LABOR FORCE [ PEOPLE ]
72.7%
PERCENT IN LABOR FORCE
5.1%
UNEMPLOYMENT RATE
Lake Stevens Zip Codes
Income in Lake Stevens
Income Overview in Lake Stevens
Per Capita Income in Lake Stevens is $43,351, while median incomes of families and households are $116,071 and $111,821 respectively.
| Characteristic | Number | Measure |
| Per Capita Income | 38,816 | $43,351 |
| Median Family Income | 10,311 | $116,071 |
| Mean Family Income | 10,311 | $132,121 |
| Median Household Income | 13,097 | $111,821 |
| Mean Household Income | 13,097 | $127,374 |
| Income Deficit | 10,311 | $0 |
| Wage / Income Gap (%) | 38,816 | 38.23% |
| Wage / Income Gap ($) | 38,816 | 61.77¢ per $1 |
| Gini / Inequality Index | 38,816 | 0.33 |
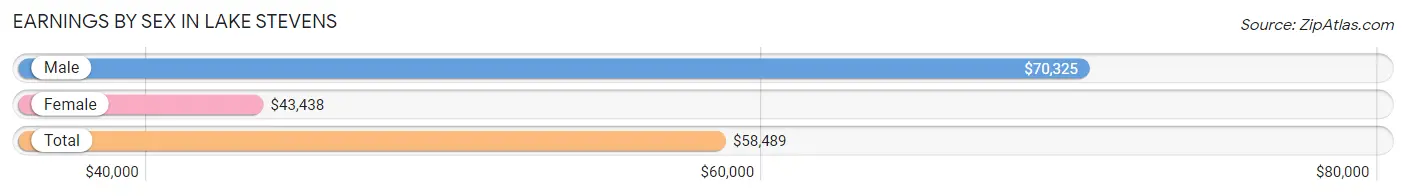
Earnings by Sex in Lake Stevens
Average Earnings in Lake Stevens are $58,489, $70,325 for men and $43,438 for women, a difference of 38.2%.
| Sex | Number | Average Earnings |
| Male | 12,121 (56.9%) | $70,325 |
| Female | 9,171 (43.1%) | $43,438 |
| Total | 21,292 (100.0%) | $58,489 |
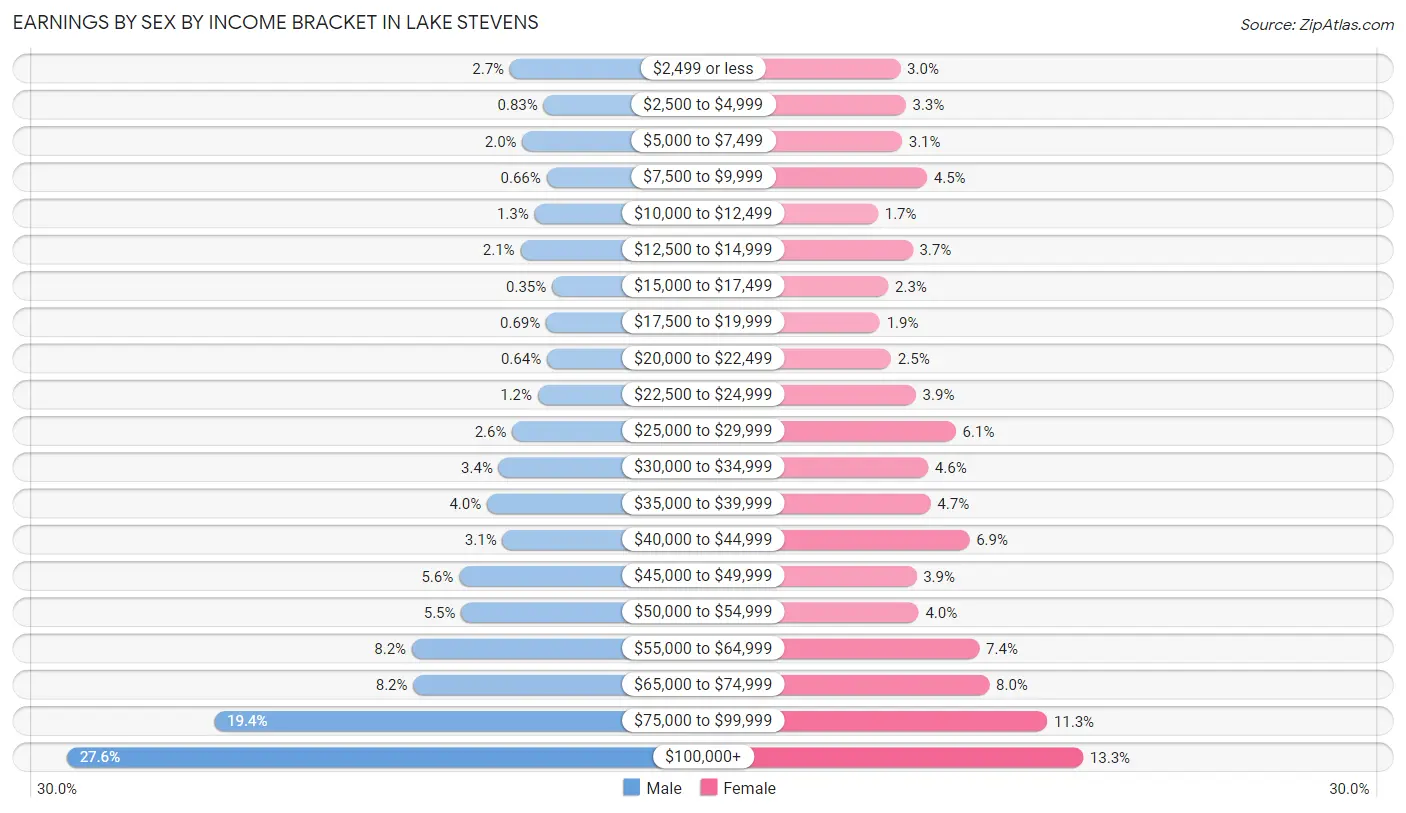
Earnings by Sex by Income Bracket in Lake Stevens
The most common earnings brackets in Lake Stevens are $100,000+ for men (3,349 | 27.6%) and $100,000+ for women (1,217 | 13.3%).
| Income | Male | Female |
| $2,499 or less | 330 (2.7%) | 275 (3.0%) |
| $2,500 to $4,999 | 100 (0.8%) | 303 (3.3%) |
| $5,000 to $7,499 | 245 (2.0%) | 283 (3.1%) |
| $7,500 to $9,999 | 80 (0.7%) | 413 (4.5%) |
| $10,000 to $12,499 | 162 (1.3%) | 160 (1.7%) |
| $12,500 to $14,999 | 258 (2.1%) | 338 (3.7%) |
| $15,000 to $17,499 | 43 (0.4%) | 213 (2.3%) |
| $17,500 to $19,999 | 84 (0.7%) | 170 (1.8%) |
| $20,000 to $22,499 | 77 (0.6%) | 227 (2.5%) |
| $22,500 to $24,999 | 139 (1.1%) | 355 (3.9%) |
| $25,000 to $29,999 | 314 (2.6%) | 561 (6.1%) |
| $30,000 to $34,999 | 406 (3.4%) | 418 (4.6%) |
| $35,000 to $39,999 | 486 (4.0%) | 431 (4.7%) |
| $40,000 to $44,999 | 380 (3.1%) | 631 (6.9%) |
| $45,000 to $49,999 | 676 (5.6%) | 358 (3.9%) |
| $50,000 to $54,999 | 660 (5.4%) | 370 (4.0%) |
| $55,000 to $64,999 | 998 (8.2%) | 682 (7.4%) |
| $65,000 to $74,999 | 988 (8.2%) | 734 (8.0%) |
| $75,000 to $99,999 | 2,346 (19.4%) | 1,032 (11.3%) |
| $100,000+ | 3,349 (27.6%) | 1,217 (13.3%) |
| Total | 12,121 (100.0%) | 9,171 (100.0%) |
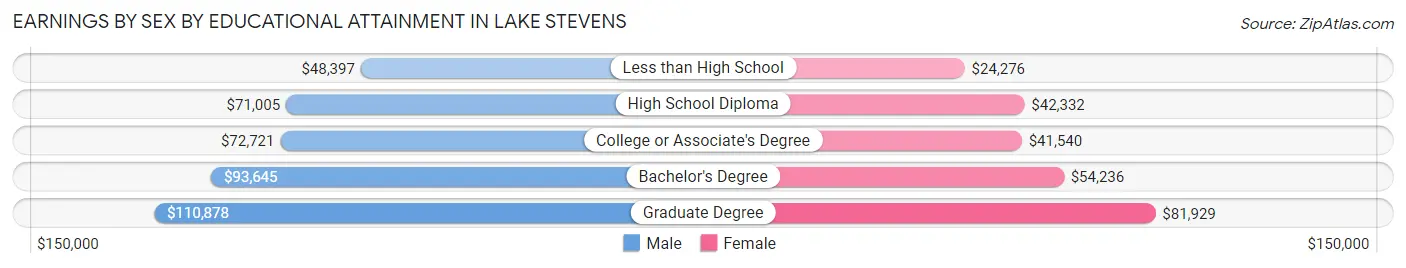
Earnings by Sex by Educational Attainment in Lake Stevens
Average earnings in Lake Stevens are $76,716 for men and $47,018 for women, a difference of 38.7%. Men with an educational attainment of graduate degree enjoy the highest average annual earnings of $110,878, while those with less than high school education earn the least with $48,397. Women with an educational attainment of graduate degree earn the most with the average annual earnings of $81,929, while those with less than high school education have the smallest earnings of $24,276.
| Educational Attainment | Male Income | Female Income |
| Less than High School | $48,397 | $24,276 |
| High School Diploma | $71,005 | $42,332 |
| College or Associate's Degree | $72,721 | $41,540 |
| Bachelor's Degree | $93,645 | $54,236 |
| Graduate Degree | $110,878 | $81,929 |
| Total | $76,716 | $47,018 |
Family Income in Lake Stevens
Family Income Brackets in Lake Stevens
According to the Lake Stevens family income data, there are 3,135 families falling into the $100,000 to $149,999 income range, which is the most common income bracket and makes up 30.4% of all families. Conversely, the less than $10,000 income bracket is the least frequent group with only 52 families (0.5%) belonging to this category.
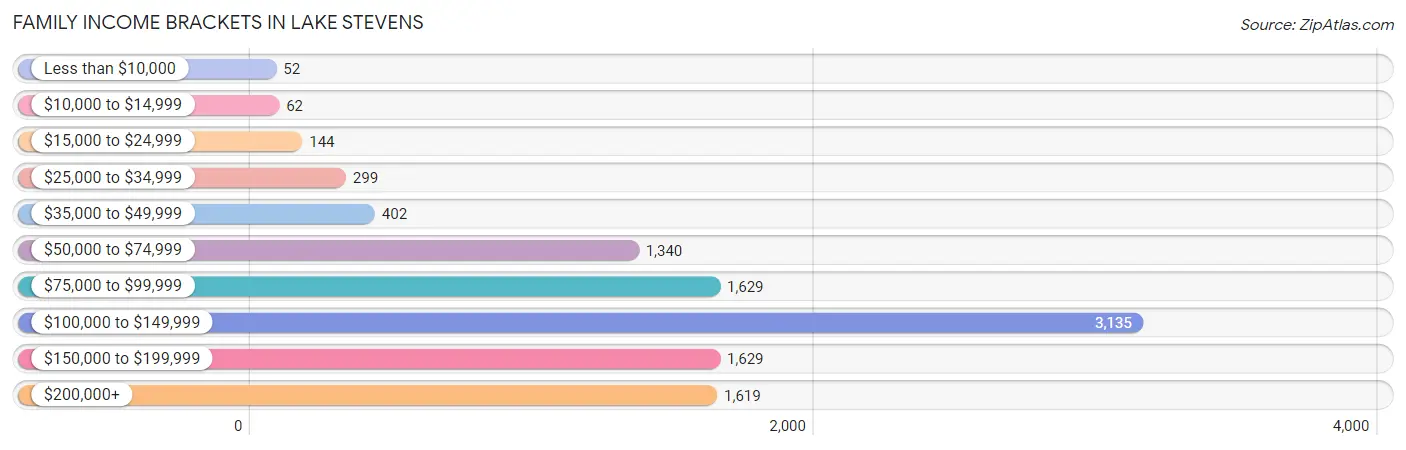
| Income Bracket | # Families | % Families |
| Less than $10,000 | 52 | 0.5% |
| $10,000 to $14,999 | 62 | 0.6% |
| $15,000 to $24,999 | 144 | 1.4% |
| $25,000 to $34,999 | 299 | 2.9% |
| $35,000 to $49,999 | 402 | 3.9% |
| $50,000 to $74,999 | 1,340 | 13.0% |
| $75,000 to $99,999 | 1,629 | 15.8% |
| $100,000 to $149,999 | 3,135 | 30.4% |
| $150,000 to $199,999 | 1,629 | 15.8% |
| $200,000+ | 1,619 | 15.7% |
Family Income by Famaliy Size in Lake Stevens
3-person families (3,001 | 29.1%) account for the highest median family income in Lake Stevens with $125,123 per family, while 2-person families (3,460 | 33.6%) have the highest median income of $55,608 per family member.
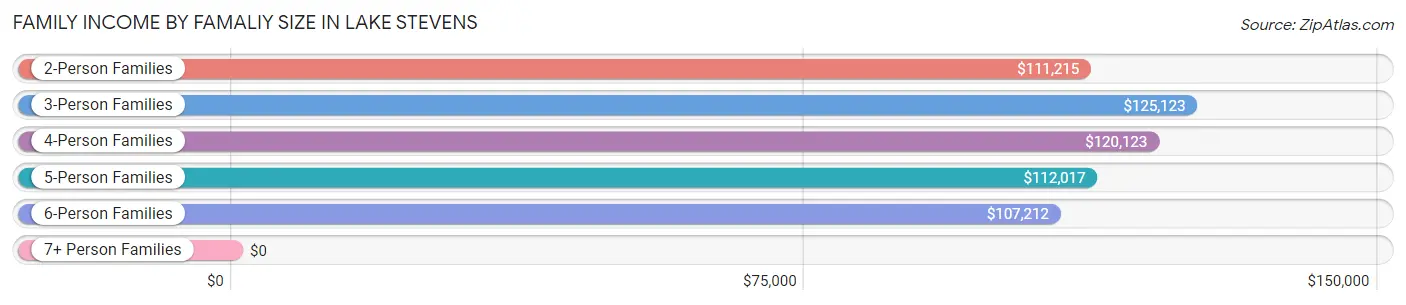
| Income Bracket | # Families | Median Income |
| 2-Person Families | 3,460 (33.6%) | $111,215 |
| 3-Person Families | 3,001 (29.1%) | $125,123 |
| 4-Person Families | 2,397 (23.3%) | $120,123 |
| 5-Person Families | 961 (9.3%) | $112,017 |
| 6-Person Families | 301 (2.9%) | $107,212 |
| 7+ Person Families | 191 (1.8%) | $0 |
| Total | 10,311 (100.0%) | $116,071 |
Family Income by Number of Earners in Lake Stevens
The median family income in Lake Stevens is $116,071, with families comprising 3+ earners (1,324) having the highest median family income of $159,130, while families with no earners (810) have the lowest median family income of $42,130, accounting for 12.8% and 7.9% of families, respectively.
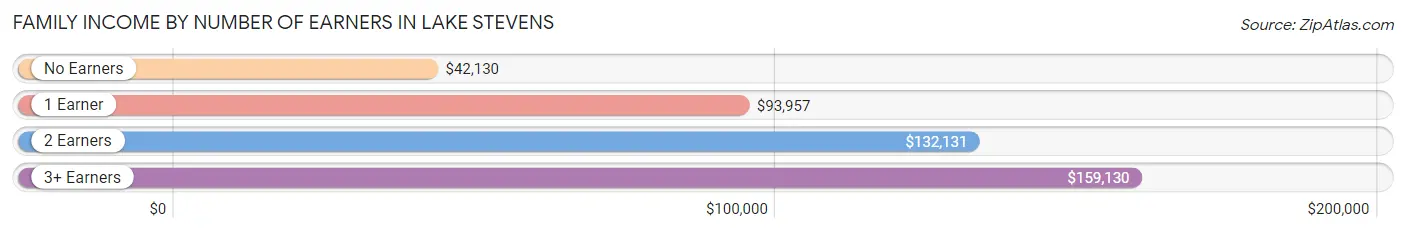
| Number of Earners | # Families | Median Income |
| No Earners | 810 (7.9%) | $42,130 |
| 1 Earner | 3,190 (30.9%) | $93,957 |
| 2 Earners | 4,987 (48.4%) | $132,131 |
| 3+ Earners | 1,324 (12.8%) | $159,130 |
| Total | 10,311 (100.0%) | $116,071 |
Household Income in Lake Stevens
Household Income Brackets in Lake Stevens
With 3,785 households falling in the category, the $100,000 to $149,999 income range is the most frequent in Lake Stevens, accounting for 28.9% of all households. In contrast, only 131 households (1.0%) fall into the less than $10,000 income bracket, making it the least populous group.
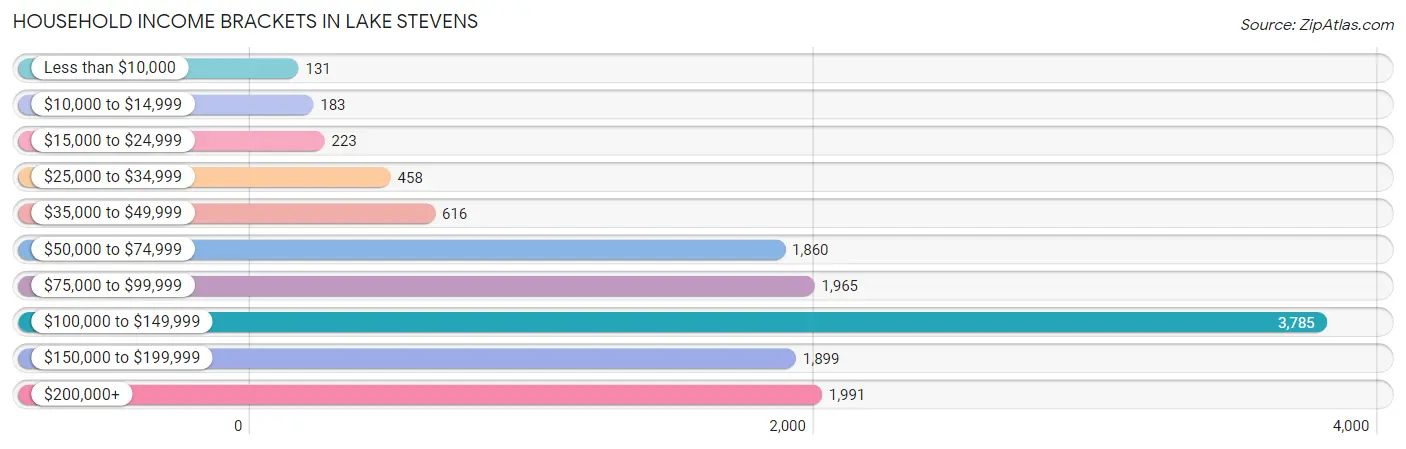
| Income Bracket | # Households | % Households |
| Less than $10,000 | 131 | 1.0% |
| $10,000 to $14,999 | 183 | 1.4% |
| $15,000 to $24,999 | 223 | 1.7% |
| $25,000 to $34,999 | 458 | 3.5% |
| $35,000 to $49,999 | 616 | 4.7% |
| $50,000 to $74,999 | 1,860 | 14.2% |
| $75,000 to $99,999 | 1,965 | 15.0% |
| $100,000 to $149,999 | 3,785 | 28.9% |
| $150,000 to $199,999 | 1,899 | 14.5% |
| $200,000+ | 1,991 | 15.2% |
Household Income by Householder Age in Lake Stevens
The median household income in Lake Stevens is $111,821, with the highest median household income of $118,659 found in the 45 to 64 years age bracket for the primary householder. A total of 4,619 households (35.3%) fall into this category. Meanwhile, the 65+ years age bracket for the primary householder has the lowest median household income of $73,614, with 2,088 households (15.9%) in this group.
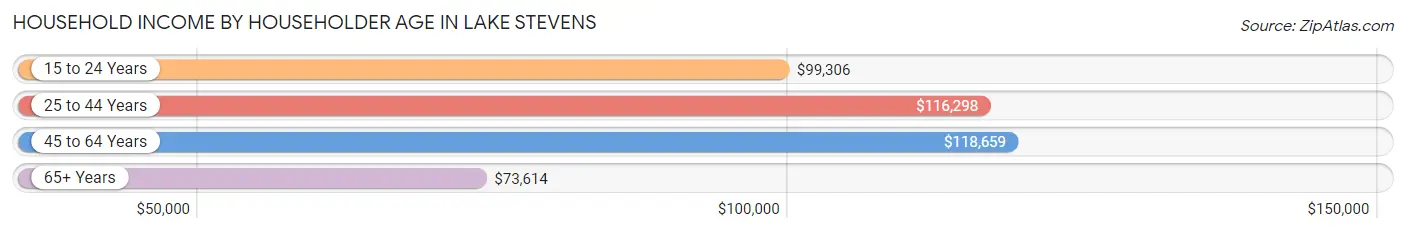
| Income Bracket | # Households | Median Income |
| 15 to 24 Years | 136 (1.0%) | $99,306 |
| 25 to 44 Years | 6,254 (47.7%) | $116,298 |
| 45 to 64 Years | 4,619 (35.3%) | $118,659 |
| 65+ Years | 2,088 (15.9%) | $73,614 |
| Total | 13,097 (100.0%) | $111,821 |
Poverty in Lake Stevens
Income Below Poverty by Sex and Age in Lake Stevens
With 5.3% poverty level for males and 5.3% for females among the residents of Lake Stevens, 5 year old males and 16 and 17 year old females are the most vulnerable to poverty, with 82 males (18.1%) and 109 females (20.2%) in their respective age groups living below the poverty level.
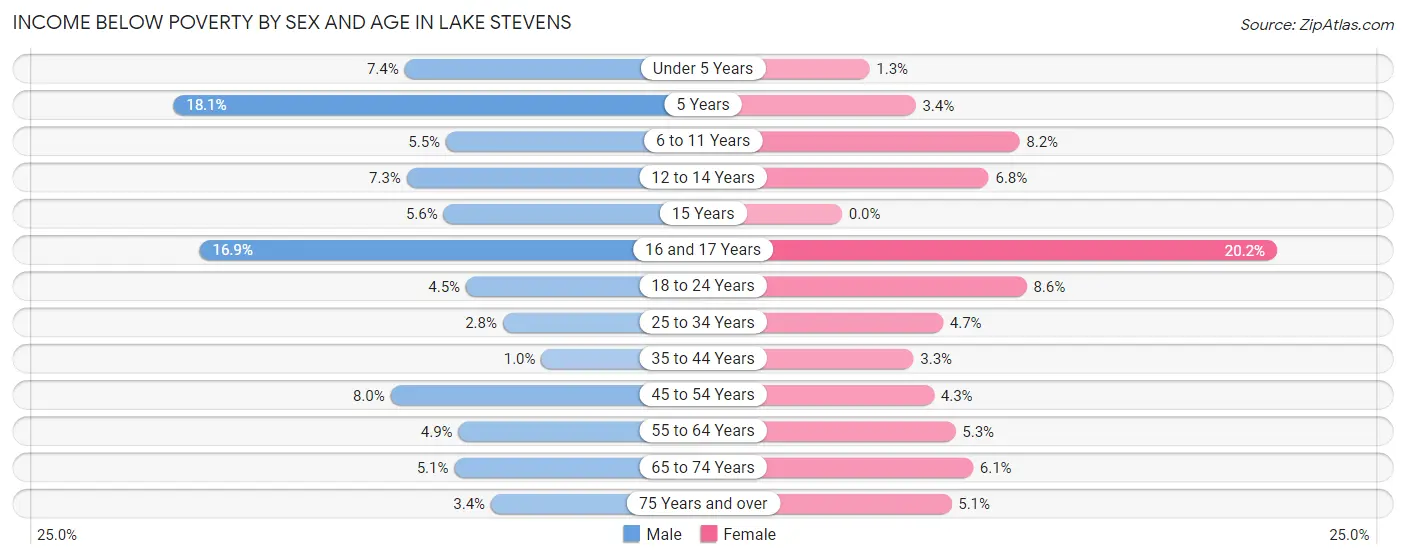
| Age Bracket | Male | Female |
| Under 5 Years | 129 (7.4%) | 18 (1.3%) |
| 5 Years | 82 (18.1%) | 10 (3.4%) |
| 6 to 11 Years | 96 (5.4%) | 153 (8.2%) |
| 12 to 14 Years | 61 (7.3%) | 74 (6.8%) |
| 15 Years | 12 (5.6%) | 0 (0.0%) |
| 16 and 17 Years | 94 (16.9%) | 109 (20.2%) |
| 18 to 24 Years | 53 (4.5%) | 88 (8.6%) |
| 25 to 34 Years | 90 (2.8%) | 160 (4.7%) |
| 35 to 44 Years | 35 (1.0%) | 102 (3.3%) |
| 45 to 54 Years | 205 (8.0%) | 91 (4.3%) |
| 55 to 64 Years | 103 (4.9%) | 110 (5.3%) |
| 65 to 74 Years | 53 (5.1%) | 78 (6.1%) |
| 75 Years and over | 15 (3.4%) | 30 (5.1%) |
| Total | 1,028 (5.3%) | 1,023 (5.3%) |
Income Above Poverty by Sex and Age in Lake Stevens
According to the poverty statistics in Lake Stevens, males aged 35 to 44 years and females aged 15 years are the age groups that are most secure financially, with 99.0% of males and 100.0% of females in these age groups living above the poverty line.
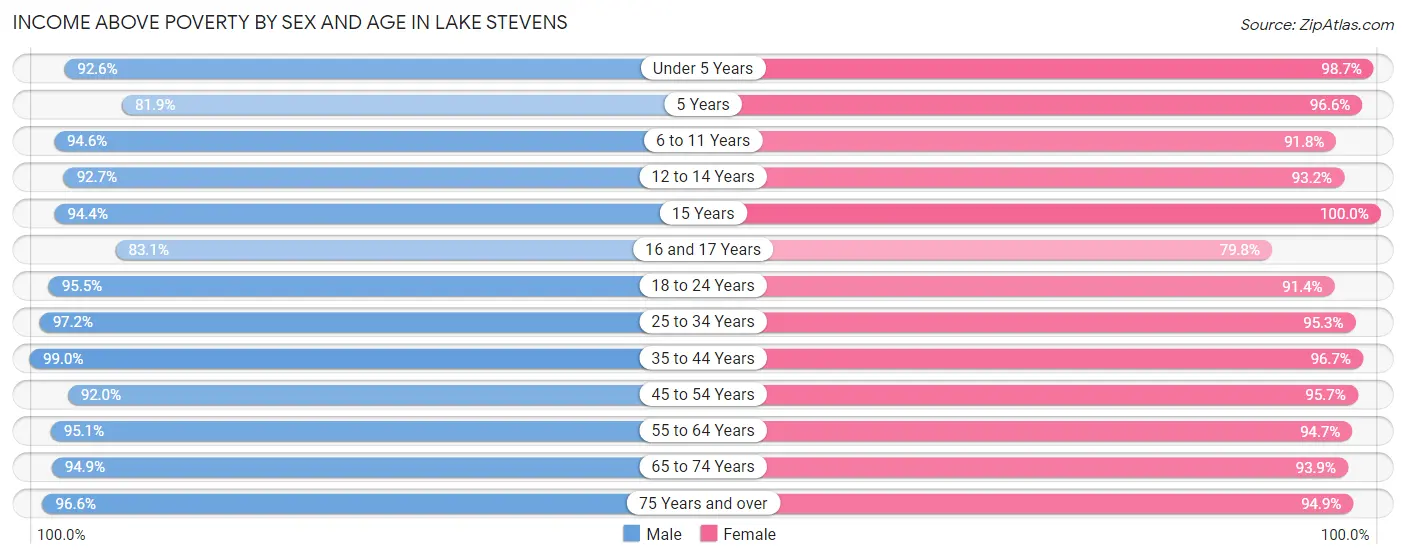
| Age Bracket | Male | Female |
| Under 5 Years | 1,622 (92.6%) | 1,391 (98.7%) |
| 5 Years | 371 (81.9%) | 282 (96.6%) |
| 6 to 11 Years | 1,666 (94.6%) | 1,703 (91.8%) |
| 12 to 14 Years | 778 (92.7%) | 1,013 (93.2%) |
| 15 Years | 204 (94.4%) | 367 (100.0%) |
| 16 and 17 Years | 463 (83.1%) | 431 (79.8%) |
| 18 to 24 Years | 1,119 (95.5%) | 939 (91.4%) |
| 25 to 34 Years | 3,112 (97.2%) | 3,248 (95.3%) |
| 35 to 44 Years | 3,382 (99.0%) | 2,968 (96.7%) |
| 45 to 54 Years | 2,350 (92.0%) | 2,038 (95.7%) |
| 55 to 64 Years | 2,010 (95.1%) | 1,976 (94.7%) |
| 65 to 74 Years | 994 (94.9%) | 1,204 (93.9%) |
| 75 Years and over | 431 (96.6%) | 560 (94.9%) |
| Total | 18,502 (94.7%) | 18,120 (94.7%) |
Income Below Poverty Among Married-Couple Families in Lake Stevens
The poverty statistics for married-couple families in Lake Stevens show that 1.8% or 152 of the total 8,197 families live below the poverty line. Families with 3 or 4 children have the highest poverty rate of 10.5%, comprising of 96 families. On the other hand, families with 1 or 2 children have the lowest poverty rate of 0.0%, which includes 0 families.
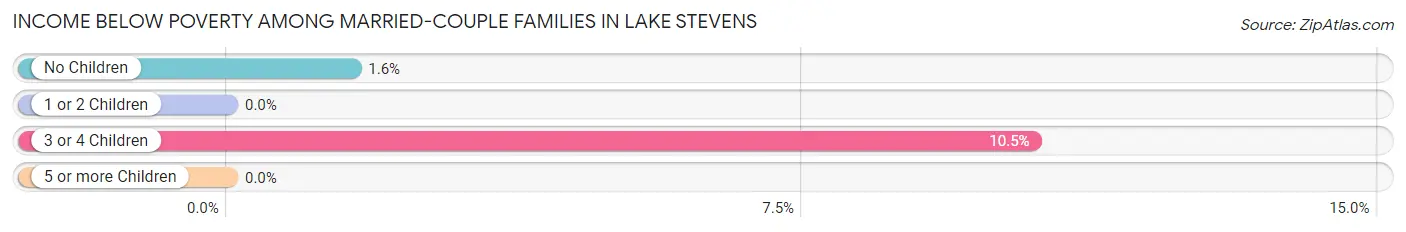
| Children | Above Poverty | Below Poverty |
| No Children | 3,432 (98.4%) | 56 (1.6%) |
| 1 or 2 Children | 3,742 (100.0%) | 0 (0.0%) |
| 3 or 4 Children | 819 (89.5%) | 96 (10.5%) |
| 5 or more Children | 52 (100.0%) | 0 (0.0%) |
| Total | 8,045 (98.2%) | 152 (1.8%) |
Income Below Poverty Among Single-Parent Households in Lake Stevens
According to the poverty data in Lake Stevens, 1.3% or 10 single-father households and 9.9% or 136 single-mother households are living below the poverty line. Among single-father households, those with 3 or 4 children have the highest poverty rate, with 10 households (32.3%) experiencing poverty. Likewise, among single-mother households, those with 5 or more children have the highest poverty rate, with 59 households (100.0%) falling below the poverty line.
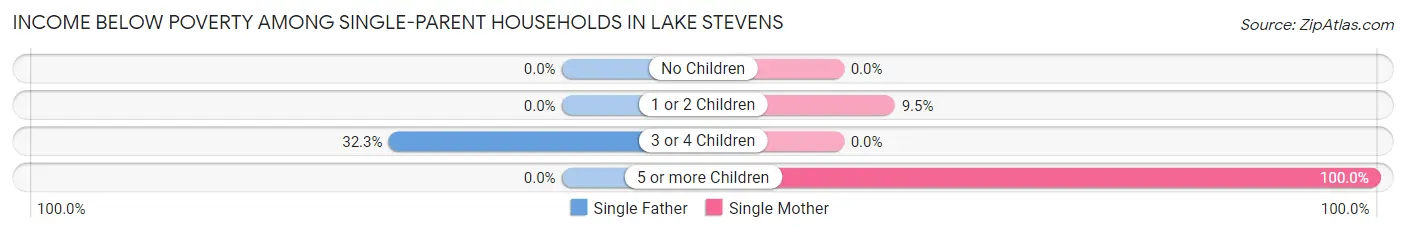
| Children | Single Father | Single Mother |
| No Children | 0 (0.0%) | 0 (0.0%) |
| 1 or 2 Children | 0 (0.0%) | 77 (9.5%) |
| 3 or 4 Children | 10 (32.3%) | 0 (0.0%) |
| 5 or more Children | 0 (0.0%) | 59 (100.0%) |
| Total | 10 (1.3%) | 136 (9.9%) |
Income Below Poverty Among Married-Couple vs Single-Parent Households in Lake Stevens
The poverty data for Lake Stevens shows that 152 of the married-couple family households (1.8%) and 146 of the single-parent households (6.9%) are living below the poverty level. Within the married-couple family households, those with 3 or 4 children have the highest poverty rate, with 96 households (10.5%) falling below the poverty line. Among the single-parent households, those with 5 or more children have the highest poverty rate, with 59 household (100.0%) living below poverty.
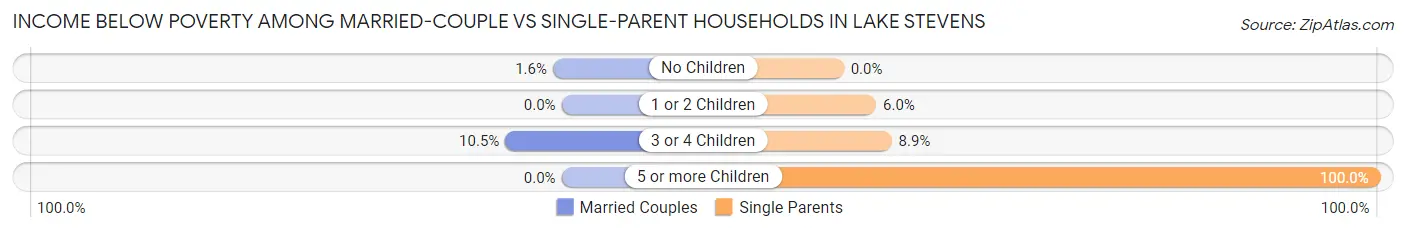
| Children | Married-Couple Families | Single-Parent Households |
| No Children | 56 (1.6%) | 0 (0.0%) |
| 1 or 2 Children | 0 (0.0%) | 77 (6.0%) |
| 3 or 4 Children | 96 (10.5%) | 10 (8.9%) |
| 5 or more Children | 0 (0.0%) | 59 (100.0%) |
| Total | 152 (1.8%) | 146 (6.9%) |
Race in Lake Stevens
The most populous races in Lake Stevens are White / Caucasian (29,845 | 76.9%), Hispanic or Latino (3,953 | 10.2%), and Two or more Races (3,891 | 10.0%).
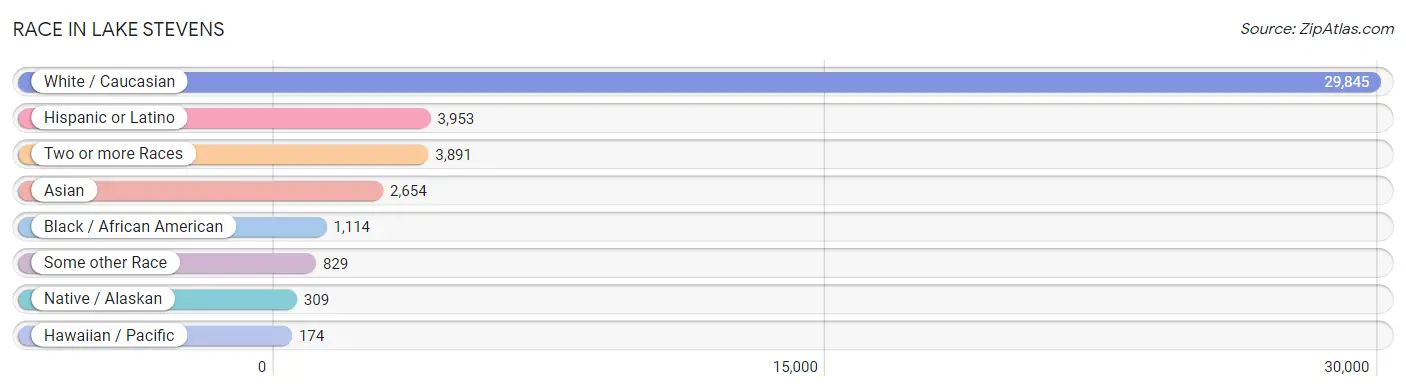
| Race | # Population | % Population |
| Asian | 2,654 | 6.8% |
| Black / African American | 1,114 | 2.9% |
| Hawaiian / Pacific | 174 | 0.4% |
| Hispanic or Latino | 3,953 | 10.2% |
| Native / Alaskan | 309 | 0.8% |
| White / Caucasian | 29,845 | 76.9% |
| Two or more Races | 3,891 | 10.0% |
| Some other Race | 829 | 2.1% |
| Total | 38,816 | 100.0% |
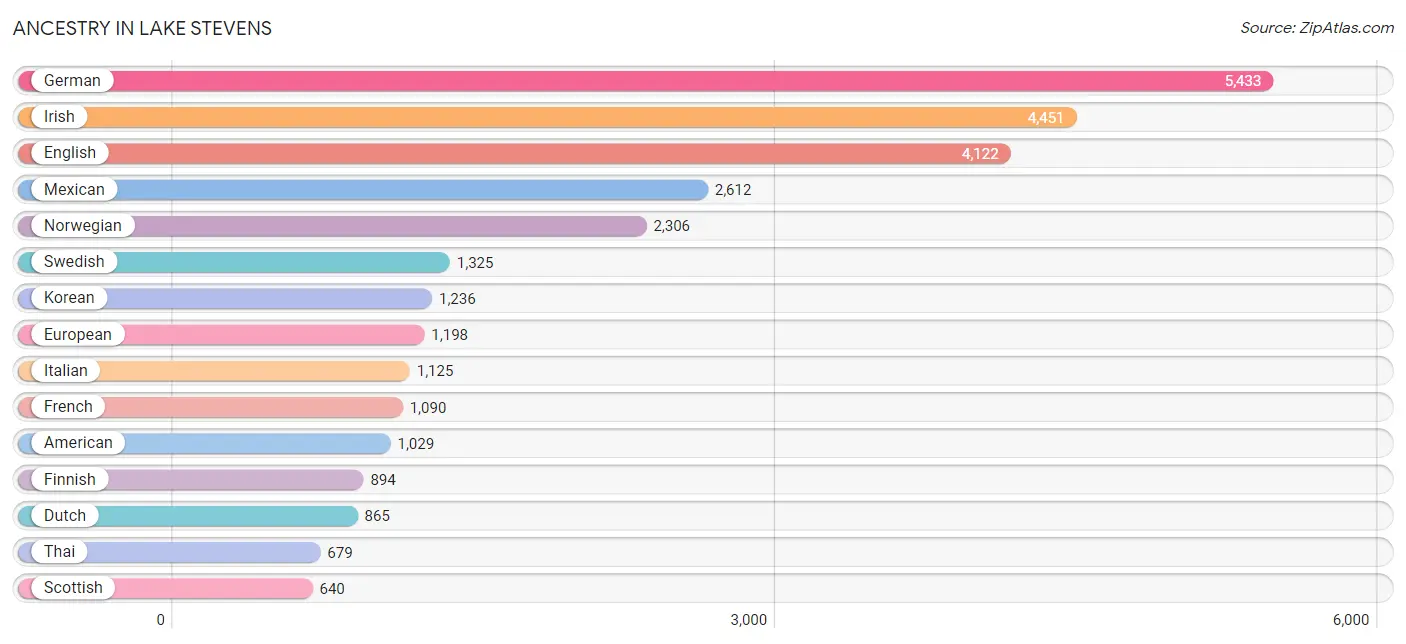
Ancestry in Lake Stevens
The most populous ancestries reported in Lake Stevens are German (5,433 | 14.0%), Irish (4,451 | 11.5%), English (4,122 | 10.6%), Mexican (2,612 | 6.7%), and Norwegian (2,306 | 5.9%), together accounting for 48.8% of all Lake Stevens residents.
| Ancestry | # Population | % Population |
| African | 2 | 0.0% |
| Alaska Native | 37 | 0.1% |
| Alaskan Athabascan | 15 | 0.0% |
| Aleut | 31 | 0.1% |
| Alsatian | 11 | 0.0% |
| American | 1,029 | 2.6% |
| Apache | 14 | 0.0% |
| Arab | 69 | 0.2% |
| Argentinean | 15 | 0.0% |
| Armenian | 24 | 0.1% |
| Austrian | 7 | 0.0% |
| Bangladeshi | 71 | 0.2% |
| Basque | 41 | 0.1% |
| Belgian | 29 | 0.1% |
| Bhutanese | 210 | 0.5% |
| Blackfeet | 12 | 0.0% |
| Bolivian | 16 | 0.0% |
| Brazilian | 102 | 0.3% |
| British | 369 | 0.9% |
| Bulgarian | 45 | 0.1% |
| Burmese | 244 | 0.6% |
| Canadian | 155 | 0.4% |
| Central American | 99 | 0.3% |
| Central American Indian | 24 | 0.1% |
| Cherokee | 141 | 0.4% |
| Chilean | 28 | 0.1% |
| Chinese | 17 | 0.0% |
| Chippewa | 13 | 0.0% |
| Colombian | 91 | 0.2% |
| Cree | 18 | 0.1% |
| Croatian | 62 | 0.2% |
| Cuban | 10 | 0.0% |
| Czech | 94 | 0.2% |
| Danish | 513 | 1.3% |
| Dominican | 24 | 0.1% |
| Dutch | 865 | 2.2% |
| Eastern European | 62 | 0.2% |
| Ecuadorian | 50 | 0.1% |
| Egyptian | 27 | 0.1% |
| English | 4,122 | 10.6% |
| Ethiopian | 26 | 0.1% |
| European | 1,198 | 3.1% |
| Finnish | 894 | 2.3% |
| French | 1,090 | 2.8% |
| French Canadian | 299 | 0.8% |
| German | 5,433 | 14.0% |
| Greek | 85 | 0.2% |
| Guamanian / Chamorro | 3 | 0.0% |
| Guatemalan | 24 | 0.1% |
| Hungarian | 74 | 0.2% |
| Icelander | 19 | 0.1% |
| Indian (Asian) | 394 | 1.0% |
| Inupiat | 85 | 0.2% |
| Iranian | 40 | 0.1% |
| Irish | 4,451 | 11.5% |
| Italian | 1,125 | 2.9% |
| Jamaican | 225 | 0.6% |
| Japanese | 136 | 0.4% |
| Kenyan | 46 | 0.1% |
| Korean | 1,236 | 3.2% |
| Laotian | 80 | 0.2% |
| Latvian | 48 | 0.1% |
| Lebanese | 21 | 0.1% |
| Lithuanian | 66 | 0.2% |
| Malaysian | 77 | 0.2% |
| Mexican | 2,612 | 6.7% |
| Mexican American Indian | 11 | 0.0% |
| Native Hawaiian | 306 | 0.8% |
| Nigerian | 158 | 0.4% |
| Northern European | 236 | 0.6% |
| Norwegian | 2,306 | 5.9% |
| Pakistani | 82 | 0.2% |
| Palestinian | 13 | 0.0% |
| Panamanian | 25 | 0.1% |
| Peruvian | 30 | 0.1% |
| Polish | 599 | 1.5% |
| Portuguese | 118 | 0.3% |
| Puerto Rican | 239 | 0.6% |
| Puget Sound Salish | 10 | 0.0% |
| Romanian | 166 | 0.4% |
| Russian | 513 | 1.3% |
| Salvadoran | 50 | 0.1% |
| Samoan | 22 | 0.1% |
| Scandinavian | 303 | 0.8% |
| Scotch-Irish | 547 | 1.4% |
| Scottish | 640 | 1.7% |
| Senegalese | 64 | 0.2% |
| Serbian | 12 | 0.0% |
| Slavic | 71 | 0.2% |
| South African | 24 | 0.1% |
| South American | 230 | 0.6% |
| Spaniard | 486 | 1.3% |
| Spanish | 248 | 0.6% |
| Sri Lankan | 533 | 1.4% |
| Subsaharan African | 353 | 0.9% |
| Swedish | 1,325 | 3.4% |
| Swiss | 205 | 0.5% |
| Thai | 679 | 1.8% |
| Tongan | 65 | 0.2% |
| Ukrainian | 196 | 0.5% |
| Welsh | 347 | 0.9% |
| West Indian | 29 | 0.1% |
| Yugoslavian | 75 | 0.2% |
| Yup'ik | 13 | 0.0% | View All 104 Rows |
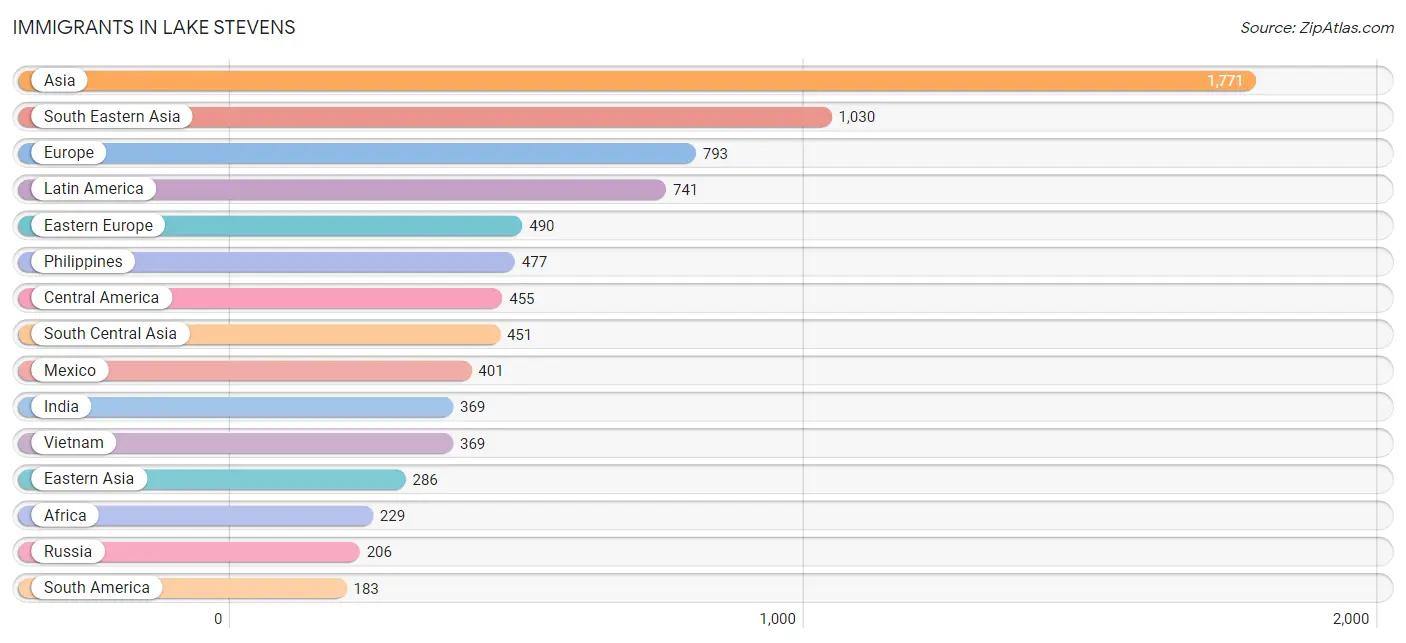
Immigrants in Lake Stevens
The most numerous immigrant groups reported in Lake Stevens came from Asia (1,771 | 4.6%), South Eastern Asia (1,030 | 2.6%), Europe (793 | 2.0%), Latin America (741 | 1.9%), and Eastern Europe (490 | 1.3%), together accounting for 12.4% of all Lake Stevens residents.
| Immigration Origin | # Population | % Population |
| Africa | 229 | 0.6% |
| Asia | 1,771 | 4.6% |
| Bangladesh | 26 | 0.1% |
| Bosnia and Herzegovina | 29 | 0.1% |
| Brazil | 61 | 0.2% |
| Cambodia | 10 | 0.0% |
| Canada | 151 | 0.4% |
| Caribbean | 103 | 0.3% |
| Central America | 455 | 1.2% |
| Chile | 47 | 0.1% |
| China | 139 | 0.4% |
| Colombia | 21 | 0.1% |
| Eastern Africa | 83 | 0.2% |
| Eastern Asia | 286 | 0.7% |
| Eastern Europe | 490 | 1.3% |
| Ecuador | 24 | 0.1% |
| Egypt | 7 | 0.0% |
| El Salvador | 23 | 0.1% |
| England | 39 | 0.1% |
| Europe | 793 | 2.0% |
| France | 26 | 0.1% |
| Germany | 88 | 0.2% |
| Guatemala | 24 | 0.1% |
| India | 369 | 0.9% |
| Indonesia | 53 | 0.1% |
| Iran | 56 | 0.1% |
| Jamaica | 74 | 0.2% |
| Japan | 32 | 0.1% |
| Kenya | 48 | 0.1% |
| Korea | 115 | 0.3% |
| Laos | 5 | 0.0% |
| Latin America | 741 | 1.9% |
| Latvia | 33 | 0.1% |
| Malaysia | 17 | 0.0% |
| Mexico | 401 | 1.0% |
| Nigeria | 45 | 0.1% |
| Northern Africa | 16 | 0.0% |
| Northern Europe | 154 | 0.4% |
| Norway | 7 | 0.0% |
| Oceania | 2 | 0.0% |
| Panama | 7 | 0.0% |
| Peru | 30 | 0.1% |
| Philippines | 477 | 1.2% |
| Poland | 21 | 0.1% |
| Romania | 50 | 0.1% |
| Russia | 206 | 0.5% |
| Scotland | 8 | 0.0% |
| South Africa | 43 | 0.1% |
| South America | 183 | 0.5% |
| South Central Asia | 451 | 1.2% |
| South Eastern Asia | 1,030 | 2.6% |
| Southern Europe | 25 | 0.1% |
| Spain | 25 | 0.1% |
| Switzerland | 10 | 0.0% |
| Taiwan | 22 | 0.1% |
| Thailand | 99 | 0.3% |
| Trinidad and Tobago | 14 | 0.0% |
| Uganda | 26 | 0.1% |
| Ukraine | 144 | 0.4% |
| Vietnam | 369 | 0.9% |
| Western Africa | 87 | 0.2% |
| Western Europe | 124 | 0.3% |
| Zimbabwe | 9 | 0.0% | View All 63 Rows |
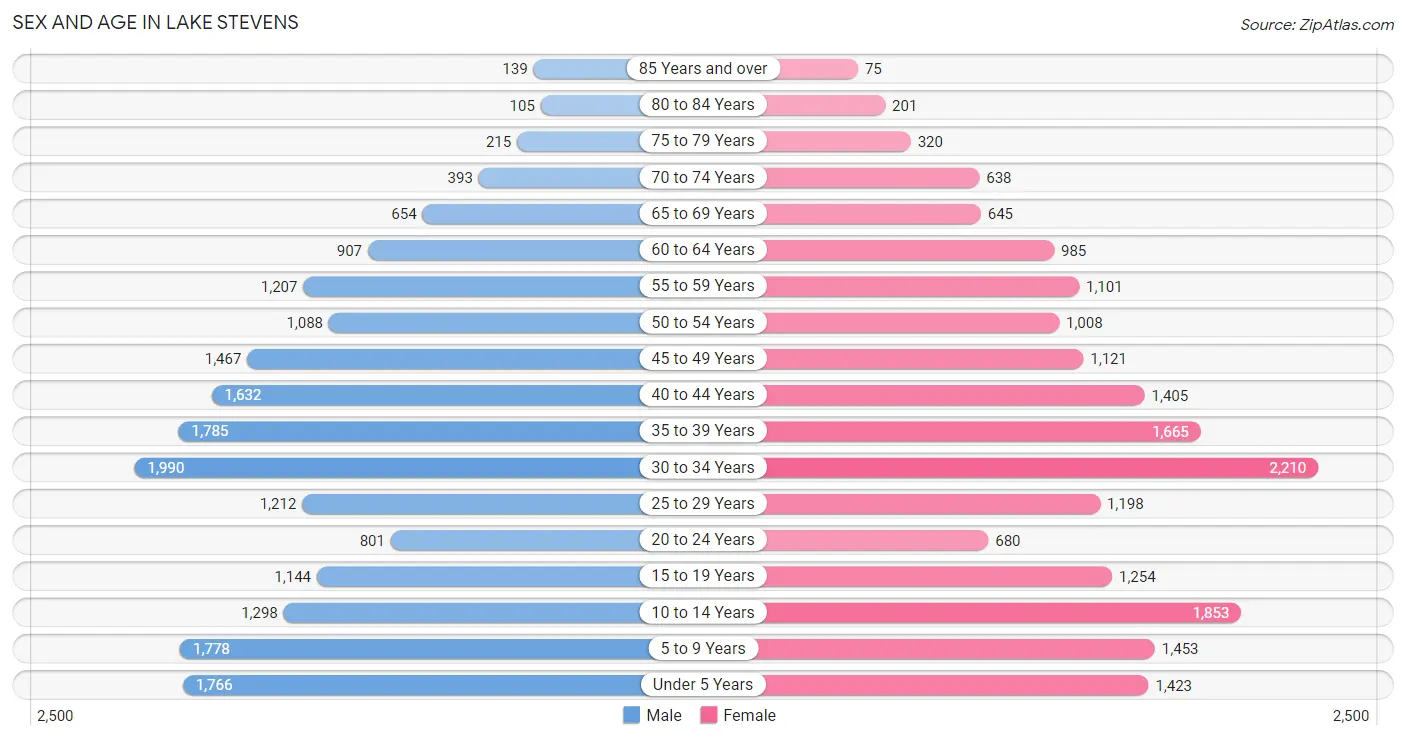
Sex and Age in Lake Stevens
Sex and Age in Lake Stevens
The most populous age groups in Lake Stevens are 30 to 34 Years (1,990 | 10.2%) for men and 30 to 34 Years (2,210 | 11.5%) for women.
| Age Bracket | Male | Female |
| Under 5 Years | 1,766 (9.0%) | 1,423 (7.4%) |
| 5 to 9 Years | 1,778 (9.1%) | 1,453 (7.5%) |
| 10 to 14 Years | 1,298 (6.6%) | 1,853 (9.6%) |
| 15 to 19 Years | 1,144 (5.8%) | 1,254 (6.5%) |
| 20 to 24 Years | 801 (4.1%) | 680 (3.5%) |
| 25 to 29 Years | 1,212 (6.2%) | 1,198 (6.2%) |
| 30 to 34 Years | 1,990 (10.2%) | 2,210 (11.5%) |
| 35 to 39 Years | 1,785 (9.1%) | 1,665 (8.7%) |
| 40 to 44 Years | 1,632 (8.3%) | 1,405 (7.3%) |
| 45 to 49 Years | 1,467 (7.5%) | 1,121 (5.8%) |
| 50 to 54 Years | 1,088 (5.6%) | 1,008 (5.2%) |
| 55 to 59 Years | 1,207 (6.2%) | 1,101 (5.7%) |
| 60 to 64 Years | 907 (4.6%) | 985 (5.1%) |
| 65 to 69 Years | 654 (3.3%) | 645 (3.4%) |
| 70 to 74 Years | 393 (2.0%) | 638 (3.3%) |
| 75 to 79 Years | 215 (1.1%) | 320 (1.7%) |
| 80 to 84 Years | 105 (0.5%) | 201 (1.0%) |
| 85 Years and over | 139 (0.7%) | 75 (0.4%) |
| Total | 19,581 (100.0%) | 19,235 (100.0%) |
Families and Households in Lake Stevens
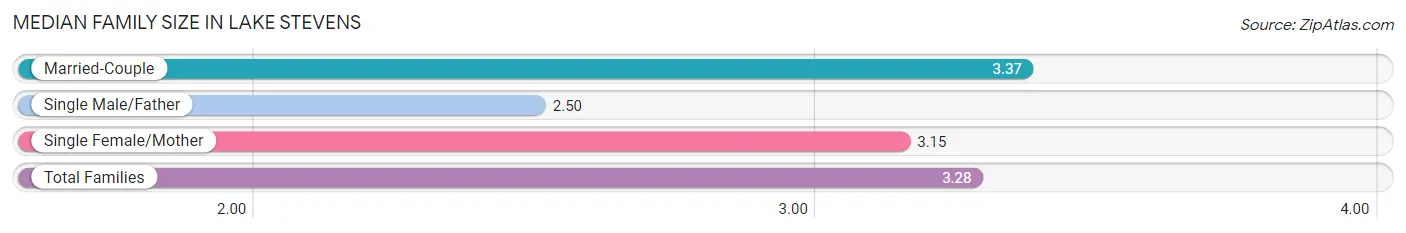
Median Family Size in Lake Stevens
The median family size in Lake Stevens is 3.28 persons per family, with married-couple families (8,197 | 79.5%) accounting for the largest median family size of 3.37 persons per family. On the other hand, single male/father families (742 | 7.2%) represent the smallest median family size with 2.50 persons per family.
| Family Type | # Families | Family Size |
| Married-Couple | 8,197 (79.5%) | 3.37 |
| Single Male/Father | 742 (7.2%) | 2.50 |
| Single Female/Mother | 1,372 (13.3%) | 3.15 |
| Total Families | 10,311 (100.0%) | 3.28 |
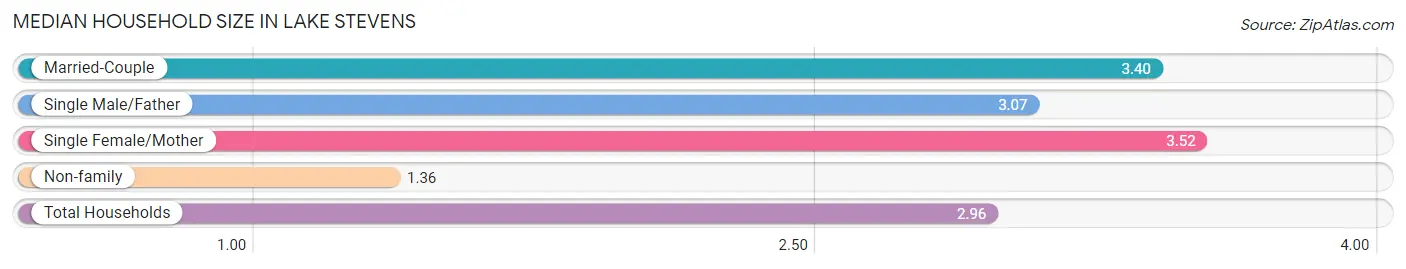
Median Household Size in Lake Stevens
The median household size in Lake Stevens is 2.96 persons per household, with single female/mother households (1,372 | 10.5%) accounting for the largest median household size of 3.52 persons per household. non-family households (2,786 | 21.3%) represent the smallest median household size with 1.36 persons per household.
| Household Type | # Households | Household Size |
| Married-Couple | 8,197 (62.6%) | 3.40 |
| Single Male/Father | 742 (5.7%) | 3.07 |
| Single Female/Mother | 1,372 (10.5%) | 3.52 |
| Non-family | 2,786 (21.3%) | 1.36 |
| Total Households | 13,097 (100.0%) | 2.96 |
Household Size by Marriage Status in Lake Stevens
Out of a total of 13,097 households in Lake Stevens, 10,311 (78.7%) are family households, while 2,786 (21.3%) are nonfamily households. The most numerous type of family households are 2-person households, comprising 3,094, and the most common type of nonfamily households are 1-person households, comprising 2,058.
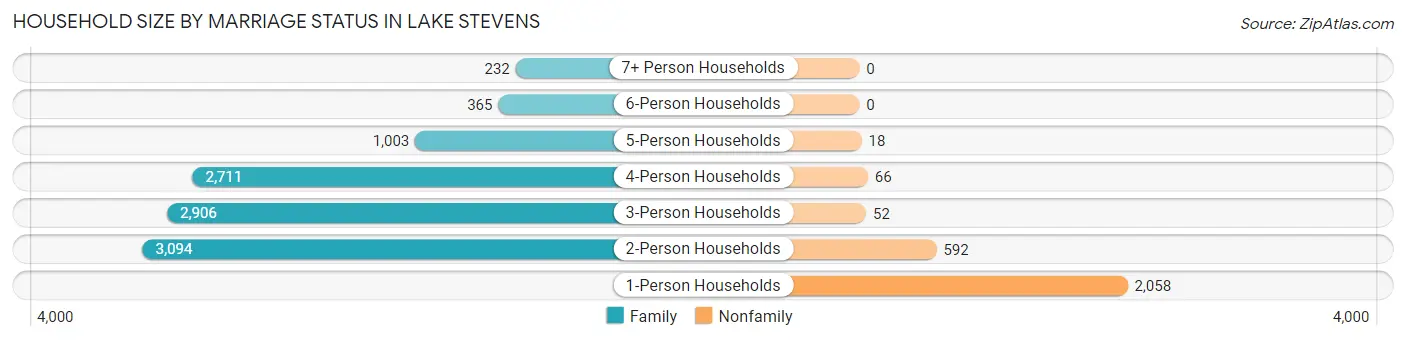
| Household Size | Family Households | Nonfamily Households |
| 1-Person Households | - | 2,058 (15.7%) |
| 2-Person Households | 3,094 (23.6%) | 592 (4.5%) |
| 3-Person Households | 2,906 (22.2%) | 52 (0.4%) |
| 4-Person Households | 2,711 (20.7%) | 66 (0.5%) |
| 5-Person Households | 1,003 (7.7%) | 18 (0.1%) |
| 6-Person Households | 365 (2.8%) | 0 (0.0%) |
| 7+ Person Households | 232 (1.8%) | 0 (0.0%) |
| Total | 10,311 (78.7%) | 2,786 (21.3%) |
Female Fertility in Lake Stevens
Fertility by Age in Lake Stevens
Average fertility rate in Lake Stevens is 73.0 births per 1,000 women. Women in the age bracket of 20 to 34 years have the highest fertility rate with 140.0 births per 1,000 women. Women in the age bracket of 20 to 34 years acount for 81.2% of all women with births.
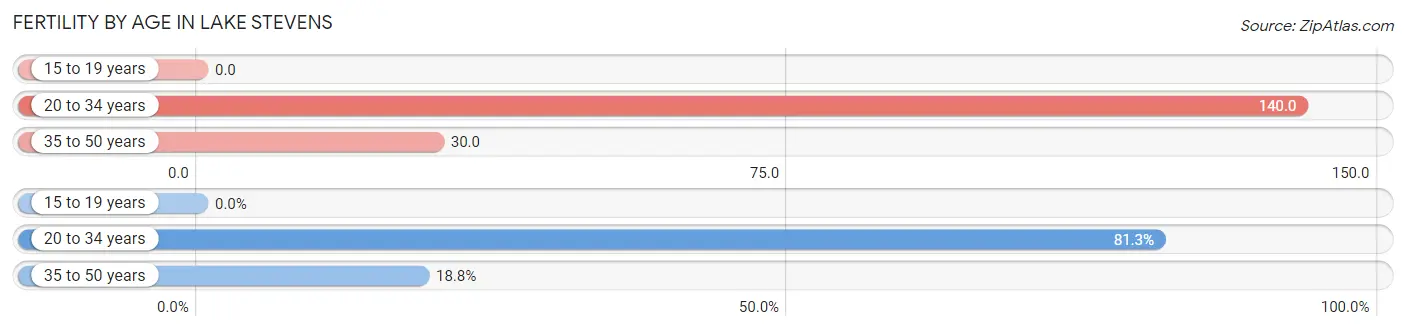
| Age Bracket | Women with Births | Births / 1,000 Women |
| 15 to 19 years | 0 (0.0%) | 0.0 |
| 20 to 34 years | 572 (81.2%) | 140.0 |
| 35 to 50 years | 132 (18.8%) | 30.0 |
| Total | 704 (100.0%) | 73.0 |
Fertility by Age by Marriage Status in Lake Stevens
82.0% of women with births (704) in Lake Stevens are married. The highest percentage of unmarried women with births falls into 35 to 50 years age bracket with 31.8% of them unmarried at the time of birth, while the lowest percentage of unmarried women with births belong to 20 to 34 years age bracket with 14.9% of them unmarried.
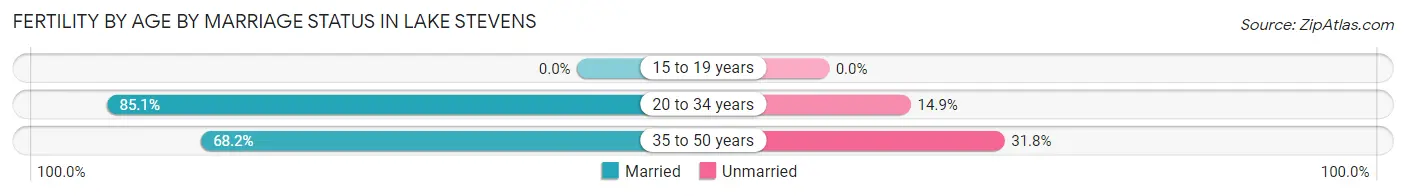
| Age Bracket | Married | Unmarried |
| 15 to 19 years | 0 (0.0%) | 0 (0.0%) |
| 20 to 34 years | 487 (85.1%) | 85 (14.9%) |
| 35 to 50 years | 90 (68.2%) | 42 (31.8%) |
| Total | 577 (82.0%) | 127 (18.0%) |
Fertility by Education in Lake Stevens
Average fertility rate in Lake Stevens is 73.0 births per 1,000 women. Women with the education attainment of graduate degree have the highest fertility rate of 161.0 births per 1,000 women, while women with the education attainment of less than high school have the lowest fertility at 35.0 births per 1,000 women. Women with the education attainment of bachelor's degree represent 36.9% of all women with births.
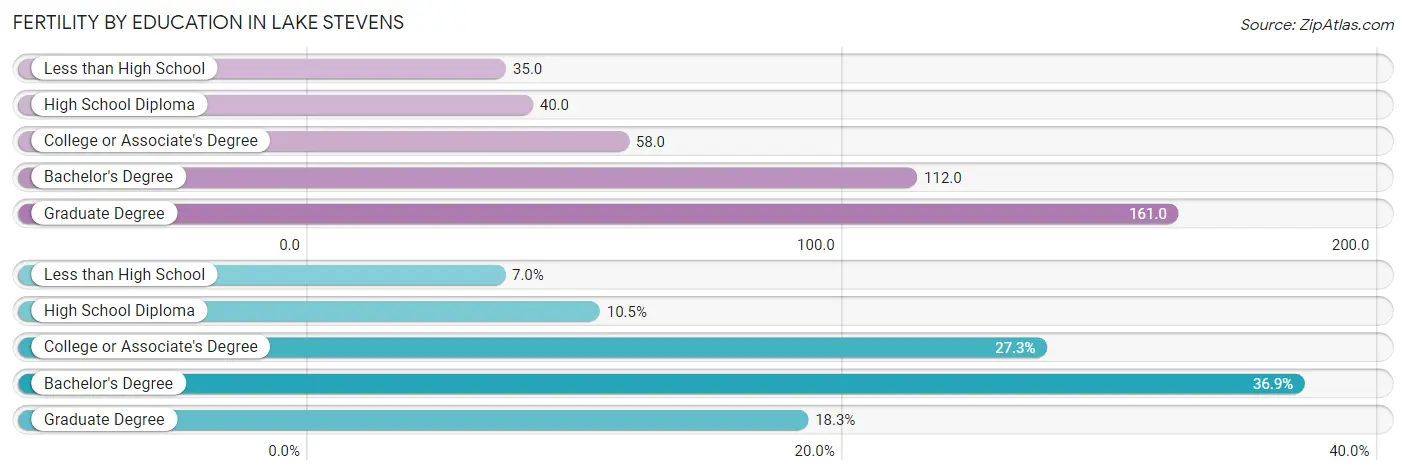
| Educational Attainment | Women with Births | Births / 1,000 Women |
| Less than High School | 49 (7.0%) | 35.0 |
| High School Diploma | 74 (10.5%) | 40.0 |
| College or Associate's Degree | 192 (27.3%) | 58.0 |
| Bachelor's Degree | 260 (36.9%) | 112.0 |
| Graduate Degree | 129 (18.3%) | 161.0 |
| Total | 704 (100.0%) | 73.0 |
Fertility by Education by Marriage Status in Lake Stevens
18.0% of women with births in Lake Stevens are unmarried. Women with the educational attainment of less than high school are most likely to be married with 100.0% of them married at childbirth, while women with the educational attainment of high school diploma are least likely to be married with 43.2% of them unmarried at childbirth.
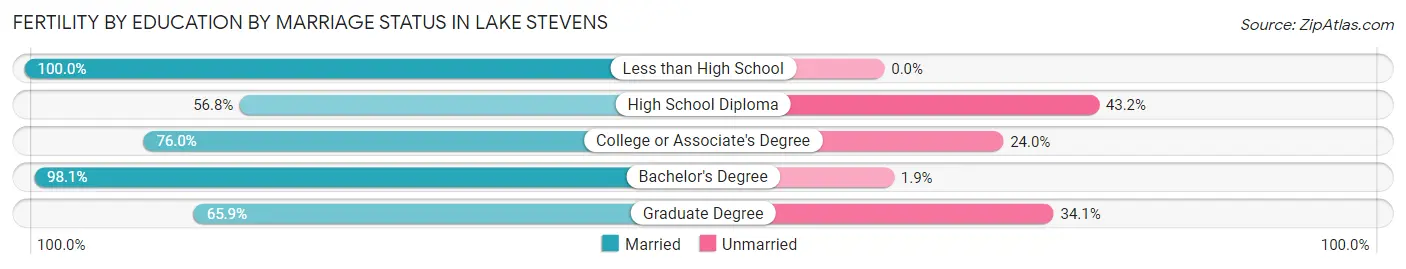
| Educational Attainment | Married | Unmarried |
| Less than High School | 49 (100.0%) | 0 (0.0%) |
| High School Diploma | 42 (56.8%) | 32 (43.2%) |
| College or Associate's Degree | 146 (76.0%) | 46 (24.0%) |
| Bachelor's Degree | 255 (98.1%) | 5 (1.9%) |
| Graduate Degree | 85 (65.9%) | 44 (34.1%) |
| Total | 577 (82.0%) | 127 (18.0%) |
Employment Characteristics in Lake Stevens
Employment by Class of Employer in Lake Stevens
Among the 19,131 employed individuals in Lake Stevens, private company employees (13,283 | 69.4%), local government employees (1,473 | 7.7%), and not-for-profit organizations (1,408 | 7.4%) make up the most common classes of employment.
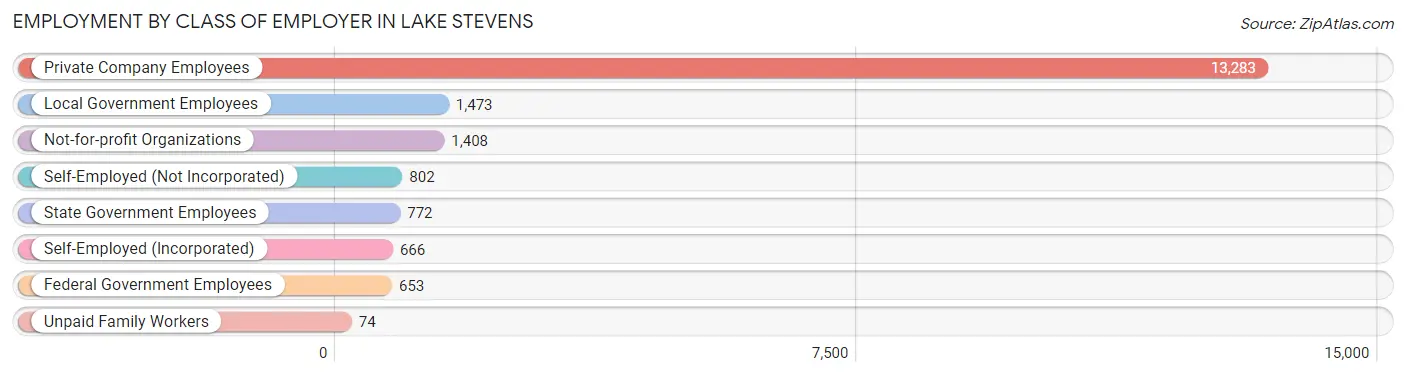
| Employer Class | # Employees | % Employees |
| Private Company Employees | 13,283 | 69.4% |
| Self-Employed (Incorporated) | 666 | 3.5% |
| Self-Employed (Not Incorporated) | 802 | 4.2% |
| Not-for-profit Organizations | 1,408 | 7.4% |
| Local Government Employees | 1,473 | 7.7% |
| State Government Employees | 772 | 4.0% |
| Federal Government Employees | 653 | 3.4% |
| Unpaid Family Workers | 74 | 0.4% |
| Total | 19,131 | 100.0% |
Employment Status by Age in Lake Stevens
According to the labor force statistics for Lake Stevens, out of the total population over 16 years of age (28,662), 72.7% or 20,837 individuals are in the labor force, with 5.1% or 1,063 of them unemployed. The age group with the highest labor force participation rate is 25 to 29 years, with 87.2% or 2,102 individuals in the labor force. Within the labor force, the 16 to 19 years age range has the highest percentage of unemployed individuals, with 14.2% or 91 of them being unemployed.
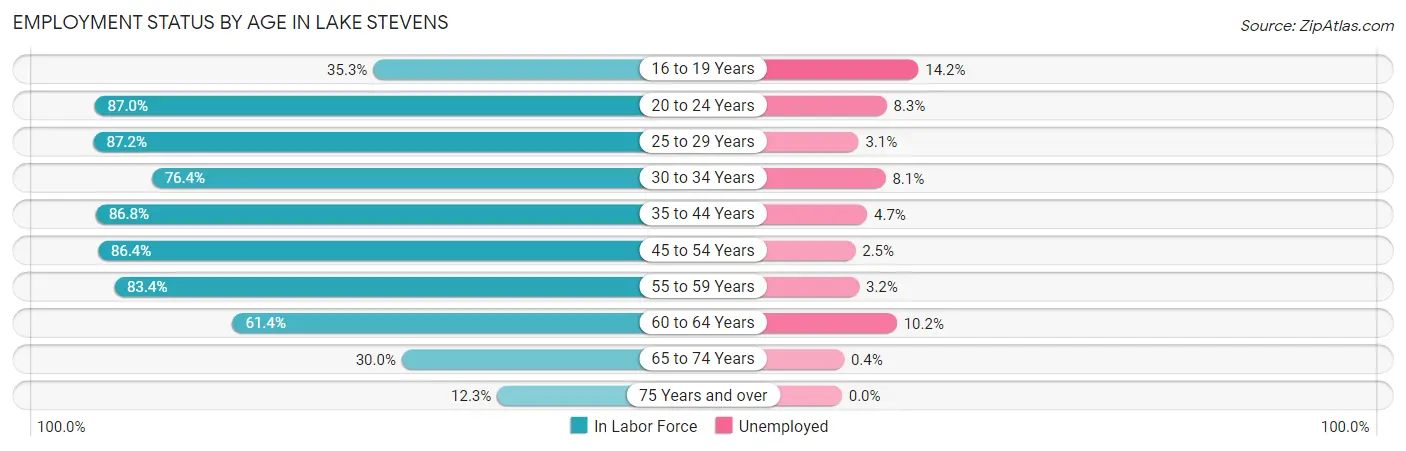
| Age Bracket | In Labor Force | Unemployed |
| 16 to 19 Years | 641 (35.3%) | 91 (14.2%) |
| 20 to 24 Years | 1,288 (87.0%) | 107 (8.3%) |
| 25 to 29 Years | 2,102 (87.2%) | 65 (3.1%) |
| 30 to 34 Years | 3,209 (76.4%) | 260 (8.1%) |
| 35 to 44 Years | 5,631 (86.8%) | 265 (4.7%) |
| 45 to 54 Years | 4,047 (86.4%) | 101 (2.5%) |
| 55 to 59 Years | 1,925 (83.4%) | 62 (3.2%) |
| 60 to 64 Years | 1,162 (61.4%) | 119 (10.2%) |
| 65 to 74 Years | 699 (30.0%) | 3 (0.4%) |
| 75 Years and over | 130 (12.3%) | 0 (0.0%) |
| Total | 20,837 (72.7%) | 1,063 (5.1%) |
Employment Status by Educational Attainment in Lake Stevens
According to labor force statistics for Lake Stevens, 82.2% of individuals (18,068) out of the total population between 25 and 64 years of age (21,981) are in the labor force, with 4.8% or 867 of them being unemployed. The group with the highest labor force participation rate are those with the educational attainment of bachelor's degree or higher, with 86.9% or 6,318 individuals in the labor force. Within the labor force, individuals with high school diploma education have the highest percentage of unemployment, with 6.8% or 279 of them being unemployed.
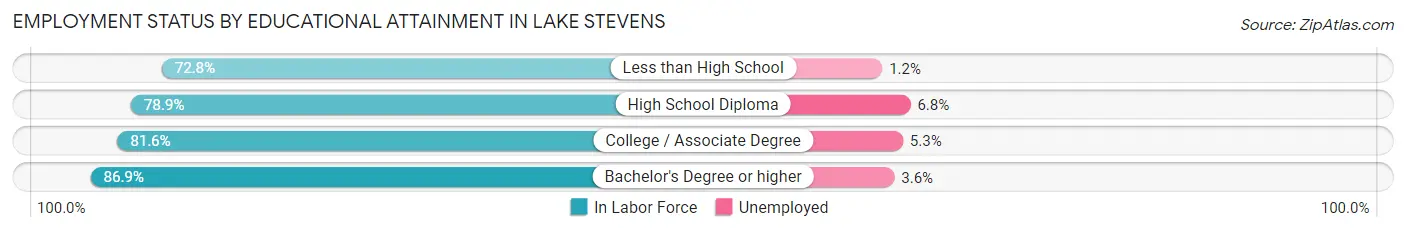
| Educational Attainment | In Labor Force | Unemployed |
| Less than High School | 907 (72.8%) | 15 (1.2%) |
| High School Diploma | 4,096 (78.9%) | 353 (6.8%) |
| College / Associate Degree | 6,750 (81.6%) | 438 (5.3%) |
| Bachelor's Degree or higher | 6,318 (86.9%) | 262 (3.6%) |
| Total | 18,068 (82.2%) | 1,055 (4.8%) |
Employment Occupations by Sex in Lake Stevens
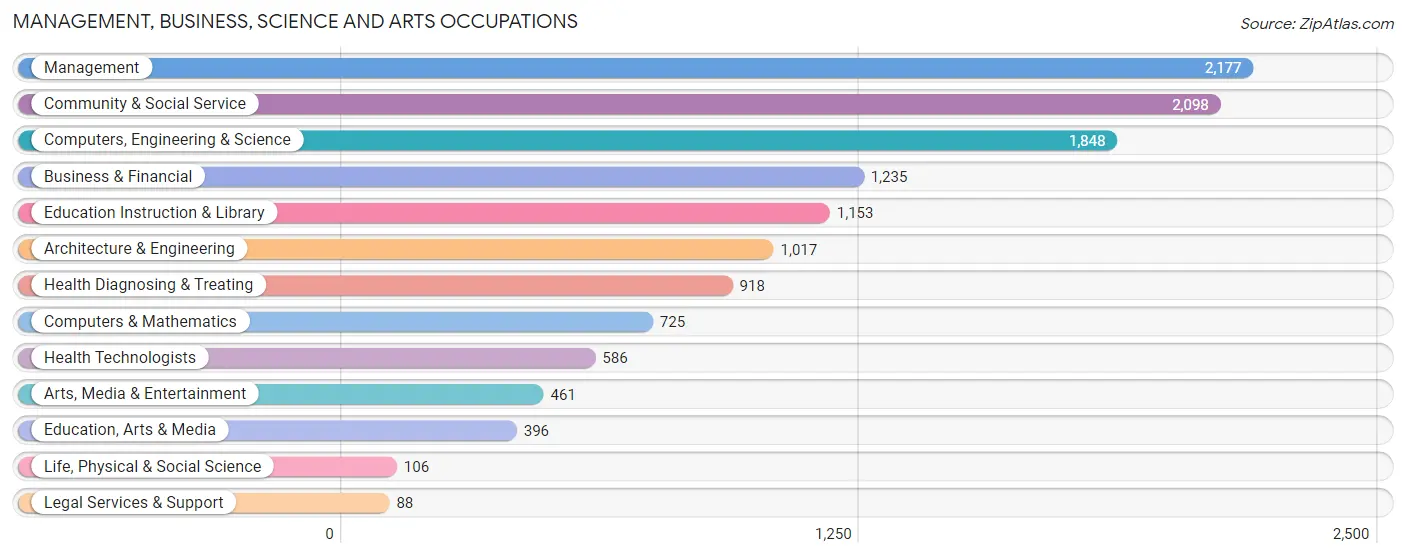
Management, Business, Science and Arts Occupations
The most common Management, Business, Science and Arts occupations in Lake Stevens are Management (2,177 | 11.1%), Community & Social Service (2,098 | 10.7%), Computers, Engineering & Science (1,848 | 9.4%), Business & Financial (1,235 | 6.3%), and Education Instruction & Library (1,153 | 5.9%).
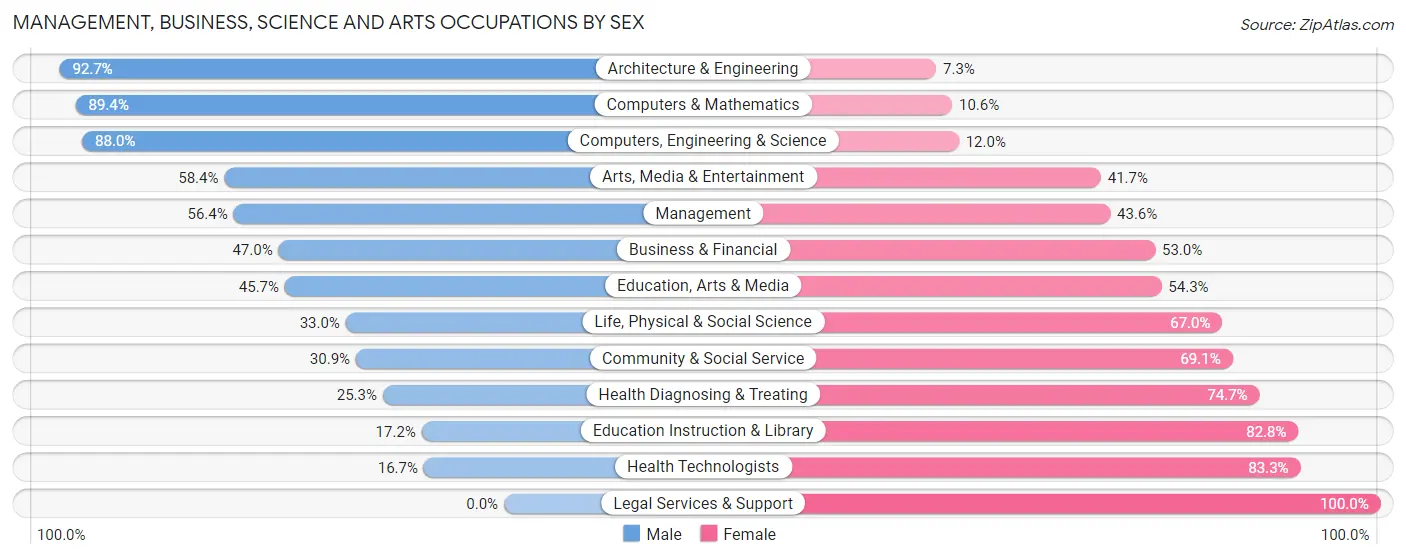
Management, Business, Science and Arts Occupations by Sex
Within the Management, Business, Science and Arts occupations in Lake Stevens, the most male-oriented occupations are Architecture & Engineering (92.7%), Computers & Mathematics (89.4%), and Computers, Engineering & Science (88.0%), while the most female-oriented occupations are Legal Services & Support (100.0%), Health Technologists (83.3%), and Education Instruction & Library (82.8%).
| Occupation | Male | Female |
| Management | 1,228 (56.4%) | 949 (43.6%) |
| Business & Financial | 581 (47.0%) | 654 (53.0%) |
| Computers, Engineering & Science | 1,626 (88.0%) | 222 (12.0%) |
| Computers & Mathematics | 648 (89.4%) | 77 (10.6%) |
| Architecture & Engineering | 943 (92.7%) | 74 (7.3%) |
| Life, Physical & Social Science | 35 (33.0%) | 71 (67.0%) |
| Community & Social Service | 648 (30.9%) | 1,450 (69.1%) |
| Education, Arts & Media | 181 (45.7%) | 215 (54.3%) |
| Legal Services & Support | 0 (0.0%) | 88 (100.0%) |
| Education Instruction & Library | 198 (17.2%) | 955 (82.8%) |
| Arts, Media & Entertainment | 269 (58.4%) | 192 (41.6%) |
| Health Diagnosing & Treating | 232 (25.3%) | 686 (74.7%) |
| Health Technologists | 98 (16.7%) | 488 (83.3%) |
| Total (Category) | 4,315 (52.1%) | 3,961 (47.9%) |
| Total (Overall) | 11,375 (58.1%) | 8,199 (41.9%) |
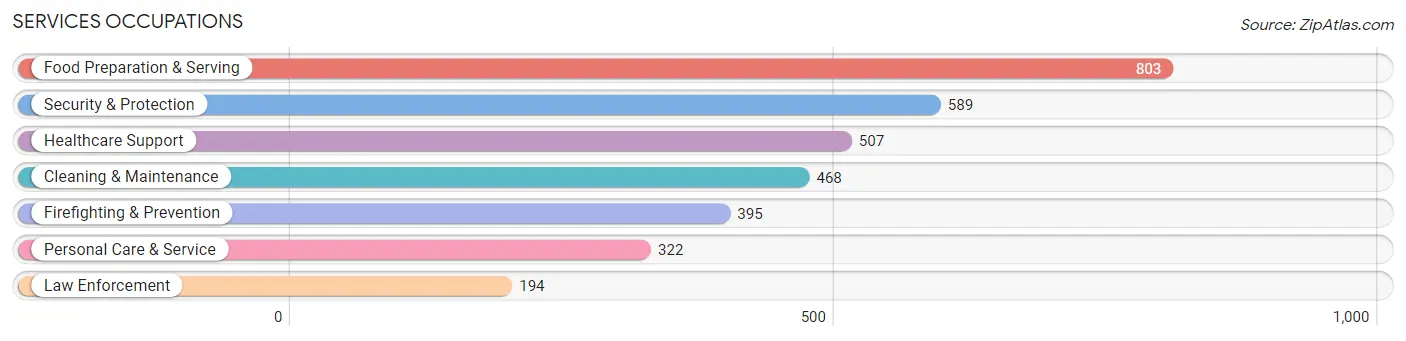
Services Occupations
The most common Services occupations in Lake Stevens are Food Preparation & Serving (803 | 4.1%), Security & Protection (589 | 3.0%), Healthcare Support (507 | 2.6%), Cleaning & Maintenance (468 | 2.4%), and Firefighting & Prevention (395 | 2.0%).
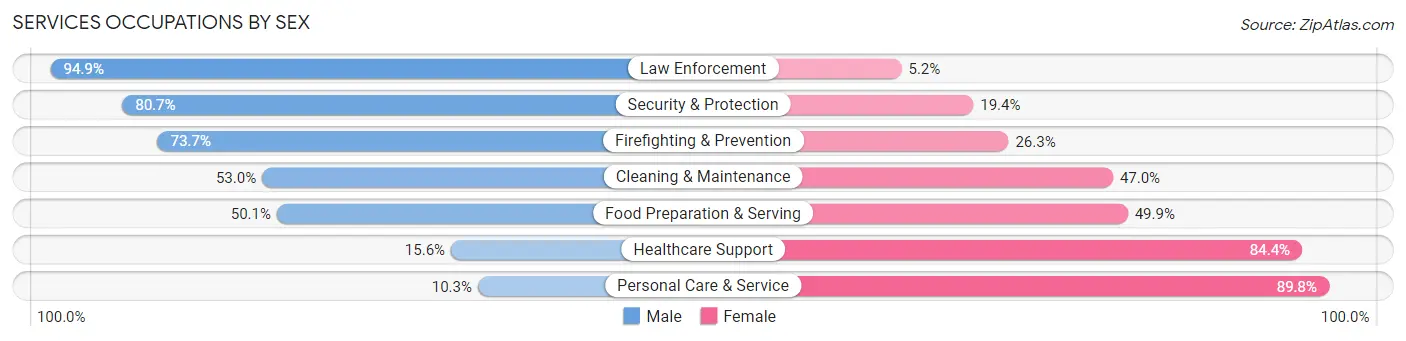
Services Occupations by Sex
Within the Services occupations in Lake Stevens, the most male-oriented occupations are Law Enforcement (94.9%), Security & Protection (80.6%), and Firefighting & Prevention (73.7%), while the most female-oriented occupations are Personal Care & Service (89.7%), Healthcare Support (84.4%), and Food Preparation & Serving (49.9%).
| Occupation | Male | Female |
| Healthcare Support | 79 (15.6%) | 428 (84.4%) |
| Security & Protection | 475 (80.6%) | 114 (19.4%) |
| Firefighting & Prevention | 291 (73.7%) | 104 (26.3%) |
| Law Enforcement | 184 (94.9%) | 10 (5.1%) |
| Food Preparation & Serving | 402 (50.1%) | 401 (49.9%) |
| Cleaning & Maintenance | 248 (53.0%) | 220 (47.0%) |
| Personal Care & Service | 33 (10.2%) | 289 (89.7%) |
| Total (Category) | 1,237 (46.0%) | 1,452 (54.0%) |
| Total (Overall) | 11,375 (58.1%) | 8,199 (41.9%) |
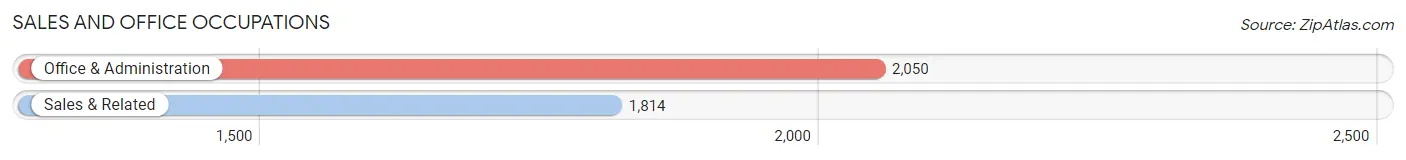
Sales and Office Occupations
The most common Sales and Office occupations in Lake Stevens are Office & Administration (2,050 | 10.5%), and Sales & Related (1,814 | 9.3%).
Sales and Office Occupations by Sex
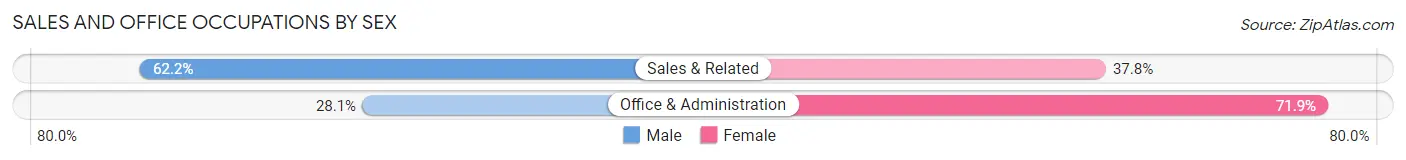
| Occupation | Male | Female |
| Sales & Related | 1,129 (62.2%) | 685 (37.8%) |
| Office & Administration | 576 (28.1%) | 1,474 (71.9%) |
| Total (Category) | 1,705 (44.1%) | 2,159 (55.9%) |
| Total (Overall) | 11,375 (58.1%) | 8,199 (41.9%) |
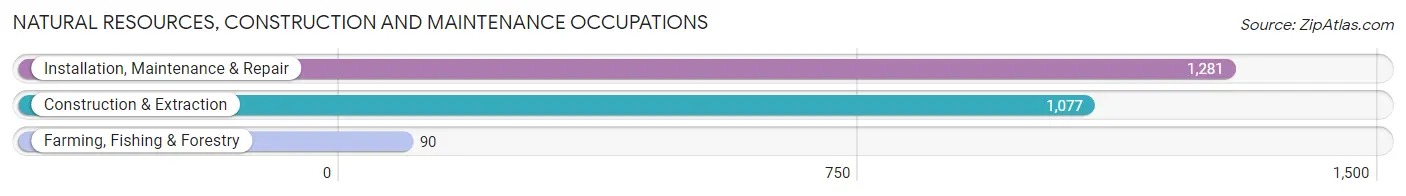
Natural Resources, Construction and Maintenance Occupations
The most common Natural Resources, Construction and Maintenance occupations in Lake Stevens are Installation, Maintenance & Repair (1,281 | 6.5%), Construction & Extraction (1,077 | 5.5%), and Farming, Fishing & Forestry (90 | 0.5%).
Natural Resources, Construction and Maintenance Occupations by Sex
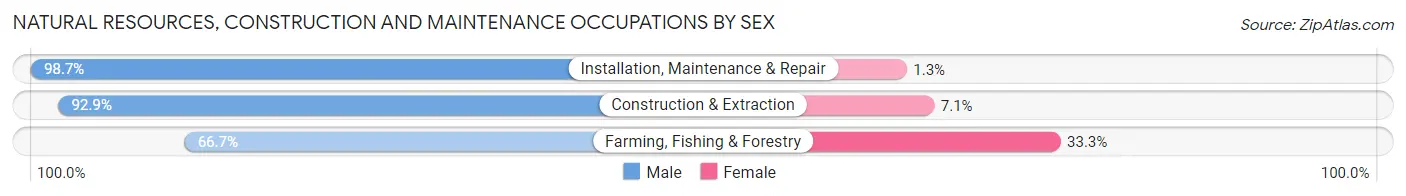
| Occupation | Male | Female |
| Farming, Fishing & Forestry | 60 (66.7%) | 30 (33.3%) |
| Construction & Extraction | 1,001 (92.9%) | 76 (7.1%) |
| Installation, Maintenance & Repair | 1,264 (98.7%) | 17 (1.3%) |
| Total (Category) | 2,325 (95.0%) | 123 (5.0%) |
| Total (Overall) | 11,375 (58.1%) | 8,199 (41.9%) |
Production, Transportation and Moving Occupations
The most common Production, Transportation and Moving occupations in Lake Stevens are Production (1,207 | 6.2%), Transportation (592 | 3.0%), and Material Moving (498 | 2.5%).
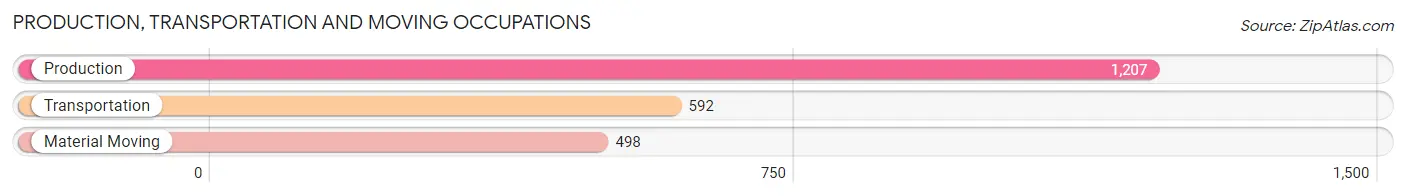
Production, Transportation and Moving Occupations by Sex
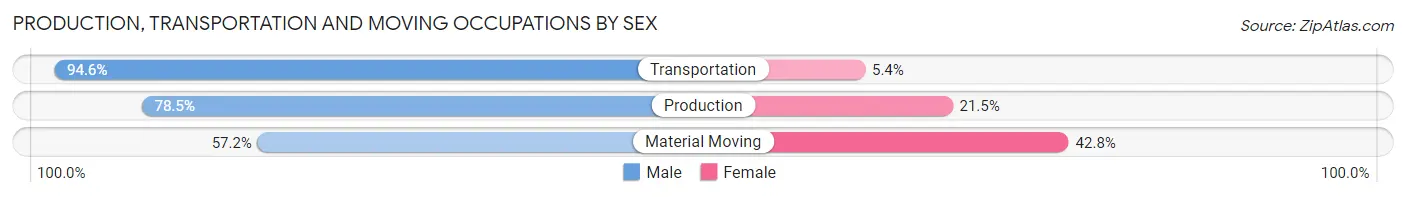
| Occupation | Male | Female |
| Production | 948 (78.5%) | 259 (21.5%) |
| Transportation | 560 (94.6%) | 32 (5.4%) |
| Material Moving | 285 (57.2%) | 213 (42.8%) |
| Total (Category) | 1,793 (78.1%) | 504 (21.9%) |
| Total (Overall) | 11,375 (58.1%) | 8,199 (41.9%) |
Employment Industries by Sex in Lake Stevens
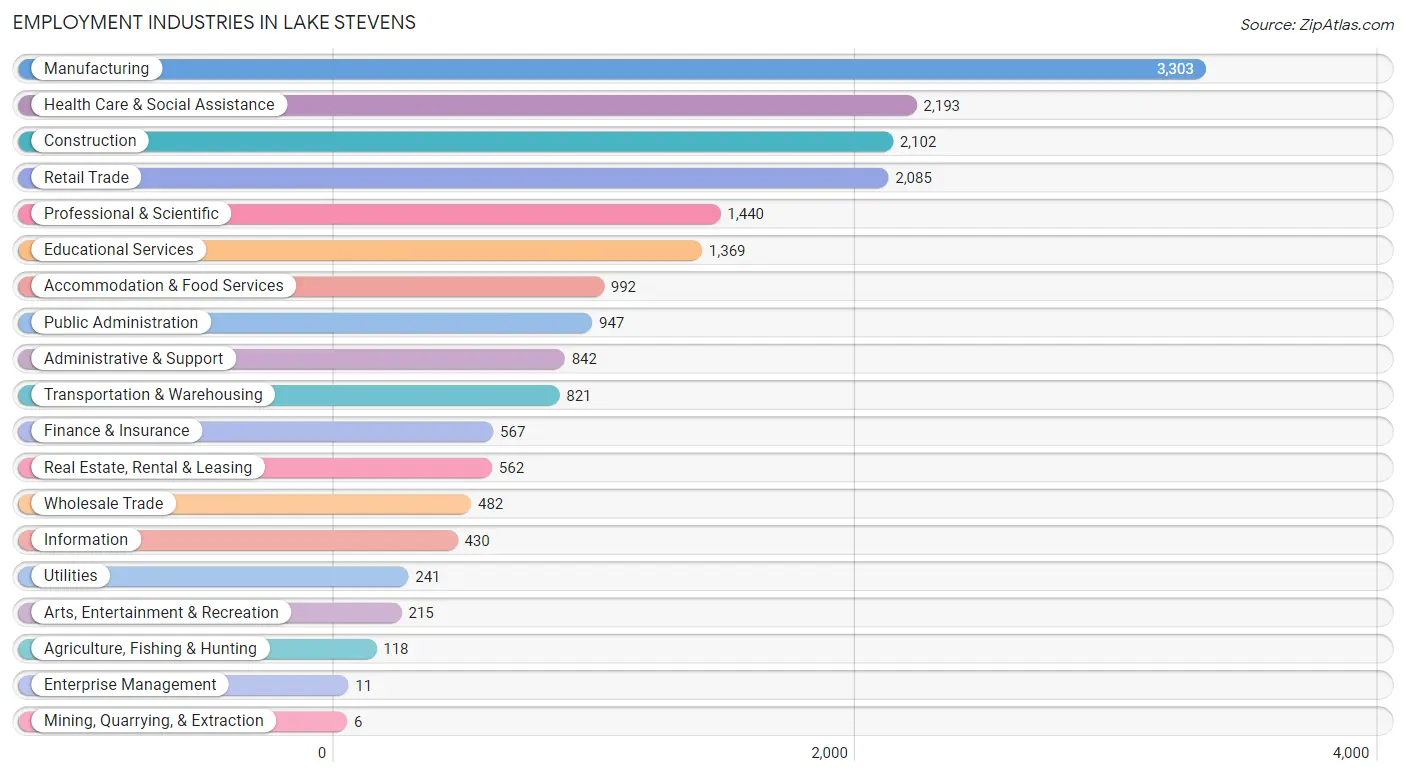
Employment Industries in Lake Stevens
The major employment industries in Lake Stevens include Manufacturing (3,303 | 16.9%), Health Care & Social Assistance (2,193 | 11.2%), Construction (2,102 | 10.7%), Retail Trade (2,085 | 10.6%), and Professional & Scientific (1,440 | 7.4%).
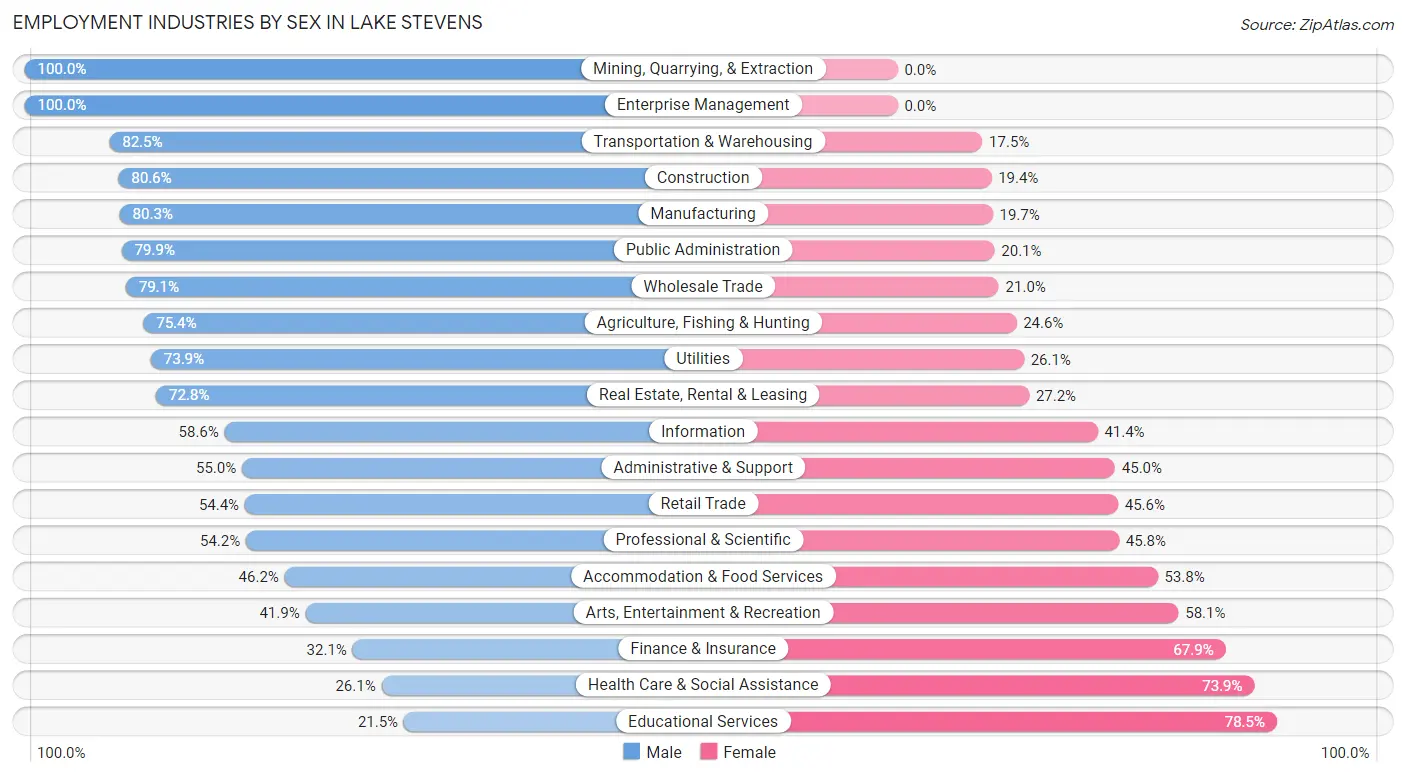
Employment Industries by Sex in Lake Stevens
The Lake Stevens industries that see more men than women are Mining, Quarrying, & Extraction (100.0%), Enterprise Management (100.0%), and Transportation & Warehousing (82.5%), whereas the industries that tend to have a higher number of women are Educational Services (78.5%), Health Care & Social Assistance (73.9%), and Finance & Insurance (67.9%).
| Industry | Male | Female |
| Agriculture, Fishing & Hunting | 89 (75.4%) | 29 (24.6%) |
| Mining, Quarrying, & Extraction | 6 (100.0%) | 0 (0.0%) |
| Construction | 1,694 (80.6%) | 408 (19.4%) |
| Manufacturing | 2,653 (80.3%) | 650 (19.7%) |
| Wholesale Trade | 381 (79.0%) | 101 (20.9%) |
| Retail Trade | 1,134 (54.4%) | 951 (45.6%) |
| Transportation & Warehousing | 677 (82.5%) | 144 (17.5%) |
| Utilities | 178 (73.9%) | 63 (26.1%) |
| Information | 252 (58.6%) | 178 (41.4%) |
| Finance & Insurance | 182 (32.1%) | 385 (67.9%) |
| Real Estate, Rental & Leasing | 409 (72.8%) | 153 (27.2%) |
| Professional & Scientific | 780 (54.2%) | 660 (45.8%) |
| Enterprise Management | 11 (100.0%) | 0 (0.0%) |
| Administrative & Support | 463 (55.0%) | 379 (45.0%) |
| Educational Services | 294 (21.5%) | 1,075 (78.5%) |
| Health Care & Social Assistance | 573 (26.1%) | 1,620 (73.9%) |
| Arts, Entertainment & Recreation | 90 (41.9%) | 125 (58.1%) |
| Accommodation & Food Services | 458 (46.2%) | 534 (53.8%) |
| Public Administration | 757 (79.9%) | 190 (20.1%) |
| Total | 11,375 (58.1%) | 8,199 (41.9%) |
Education in Lake Stevens
School Enrollment in Lake Stevens
The most common levels of schooling among the 9,680 students in Lake Stevens are elementary school (2,359 | 24.4%), high school (2,249 | 23.2%), and middle school (2,214 | 22.9%).
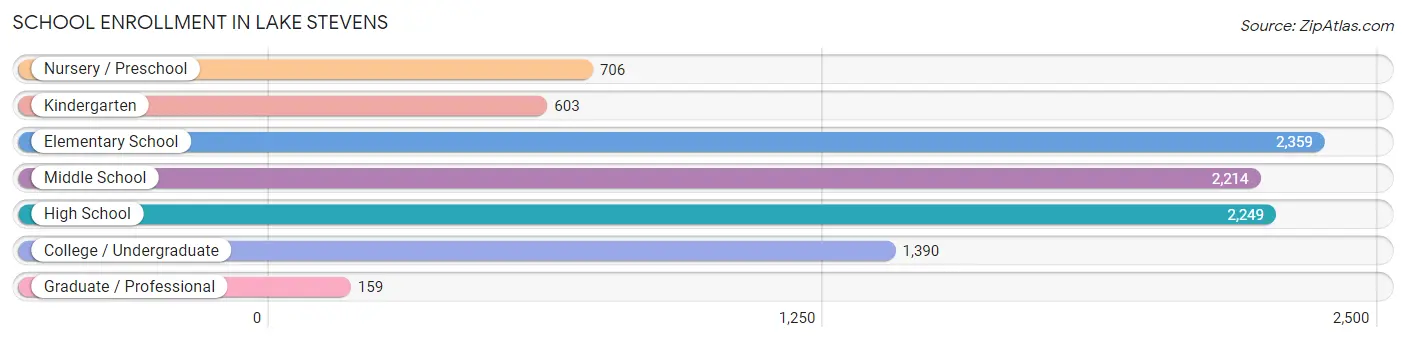
| School Level | # Students | % Students |
| Nursery / Preschool | 706 | 7.3% |
| Kindergarten | 603 | 6.2% |
| Elementary School | 2,359 | 24.4% |
| Middle School | 2,214 | 22.9% |
| High School | 2,249 | 23.2% |
| College / Undergraduate | 1,390 | 14.4% |
| Graduate / Professional | 159 | 1.6% |
| Total | 9,680 | 100.0% |
School Enrollment by Age by Funding Source in Lake Stevens
Out of a total of 9,680 students who are enrolled in schools in Lake Stevens, 1,239 (12.8%) attend a private institution, while the remaining 8,441 (87.2%) are enrolled in public schools. The age group of 3 to 4 year olds has the highest likelihood of being enrolled in private schools, with 304 (64.7% in the age bracket) enrolled. Conversely, the age group of 10 to 14 year olds has the lowest likelihood of being enrolled in a private school, with 2,812 (96.0% in the age bracket) attending a public institution.
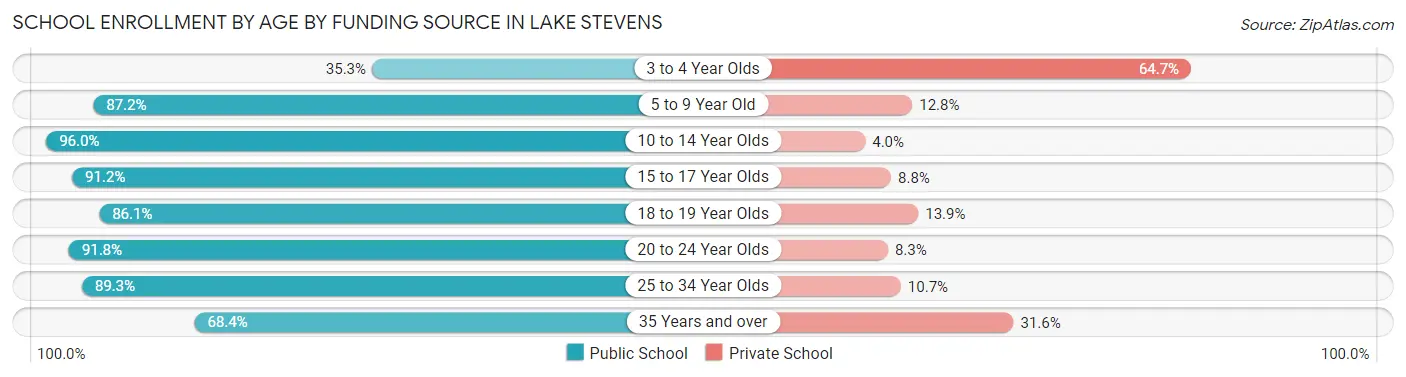
| Age Bracket | Public School | Private School |
| 3 to 4 Year Olds | 166 (35.3%) | 304 (64.7%) |
| 5 to 9 Year Old | 2,585 (87.2%) | 379 (12.8%) |
| 10 to 14 Year Olds | 2,812 (96.0%) | 118 (4.0%) |
| 15 to 17 Year Olds | 1,495 (91.2%) | 145 (8.8%) |
| 18 to 19 Year Olds | 384 (86.1%) | 62 (13.9%) |
| 20 to 24 Year Olds | 289 (91.7%) | 26 (8.3%) |
| 25 to 34 Year Olds | 377 (89.3%) | 45 (10.7%) |
| 35 Years and over | 337 (68.4%) | 156 (31.6%) |
| Total | 8,441 (87.2%) | 1,239 (12.8%) |
Educational Attainment by Field of Study in Lake Stevens
Business (1,385 | 15.8%), education (1,092 | 12.4%), science & technology (1,054 | 12.0%), engineering (1,035 | 11.8%), and arts & humanities (582 | 6.6%) are the most common fields of study among 8,774 individuals in Lake Stevens who have obtained a bachelor's degree or higher.
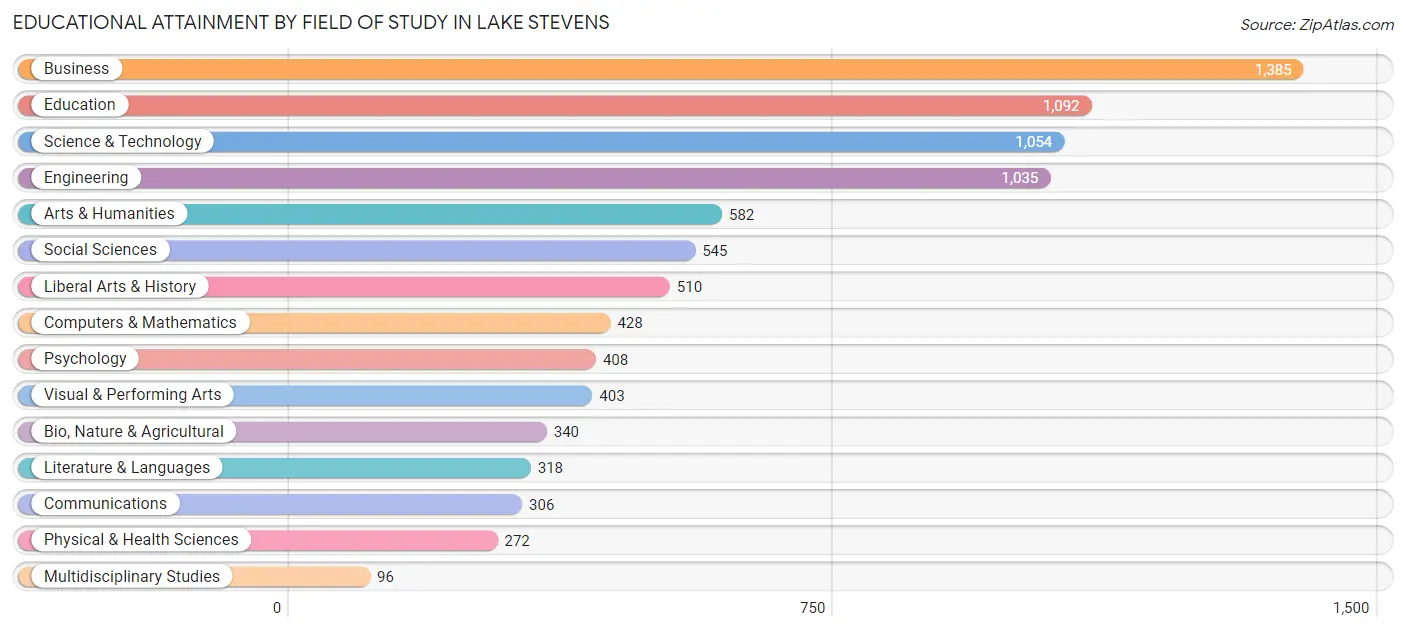
| Field of Study | # Graduates | % Graduates |
| Computers & Mathematics | 428 | 4.9% |
| Bio, Nature & Agricultural | 340 | 3.9% |
| Physical & Health Sciences | 272 | 3.1% |
| Psychology | 408 | 4.6% |
| Social Sciences | 545 | 6.2% |
| Engineering | 1,035 | 11.8% |
| Multidisciplinary Studies | 96 | 1.1% |
| Science & Technology | 1,054 | 12.0% |
| Business | 1,385 | 15.8% |
| Education | 1,092 | 12.4% |
| Literature & Languages | 318 | 3.6% |
| Liberal Arts & History | 510 | 5.8% |
| Visual & Performing Arts | 403 | 4.6% |
| Communications | 306 | 3.5% |
| Arts & Humanities | 582 | 6.6% |
| Total | 8,774 | 100.0% |
Transportation & Commute in Lake Stevens
Vehicle Availability by Sex in Lake Stevens
The most prevalent vehicle ownership categories in Lake Stevens are males with 2 vehicles (5,023, accounting for 44.8%) and females with 2 vehicles (3,576, making up 63.6%).
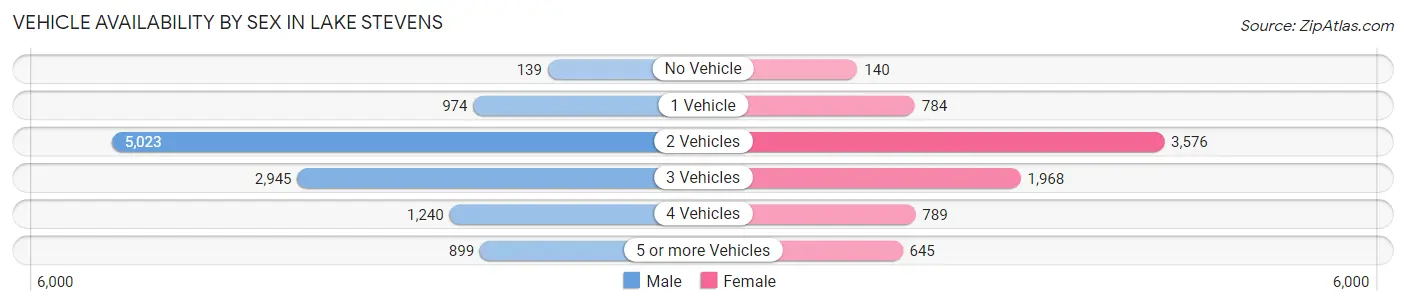
| Vehicles Available | Male | Female |
| No Vehicle | 139 (1.2%) | 140 (1.8%) |
| 1 Vehicle | 974 (8.7%) | 784 (9.9%) |
| 2 Vehicles | 5,023 (44.8%) | 3,576 (45.3%) |
| 3 Vehicles | 2,945 (26.3%) | 1,968 (24.9%) |
| 4 Vehicles | 1,240 (11.1%) | 789 (10.0%) |
| 5 or more Vehicles | 899 (8.0%) | 645 (8.2%) |
| Total | 11,220 (100.0%) | 7,902 (100.0%) |
Commute Time in Lake Stevens
The most frequently occuring commute durations in Lake Stevens are 20 to 24 minutes (2,420 commuters, 15.0%), 30 to 34 minutes (2,334 commuters, 14.5%), and 45 to 59 minutes (2,203 commuters, 13.7%).
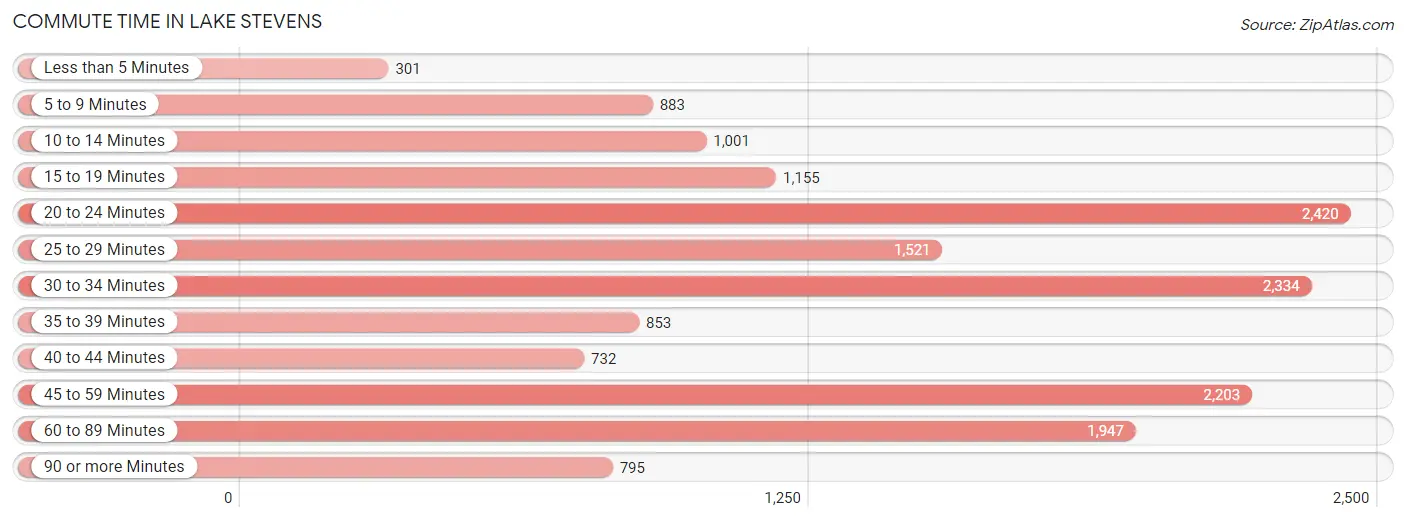
| Commute Time | # Commuters | % Commuters |
| Less than 5 Minutes | 301 | 1.9% |
| 5 to 9 Minutes | 883 | 5.5% |
| 10 to 14 Minutes | 1,001 | 6.2% |
| 15 to 19 Minutes | 1,155 | 7.1% |
| 20 to 24 Minutes | 2,420 | 15.0% |
| 25 to 29 Minutes | 1,521 | 9.4% |
| 30 to 34 Minutes | 2,334 | 14.5% |
| 35 to 39 Minutes | 853 | 5.3% |
| 40 to 44 Minutes | 732 | 4.5% |
| 45 to 59 Minutes | 2,203 | 13.7% |
| 60 to 89 Minutes | 1,947 | 12.1% |
| 90 or more Minutes | 795 | 4.9% |
Commute Time by Sex in Lake Stevens
The most common commute times in Lake Stevens are 20 to 24 minutes (1,611 commuters, 16.8%) for males and 30 to 34 minutes (1,214 commuters, 18.4%) for females.
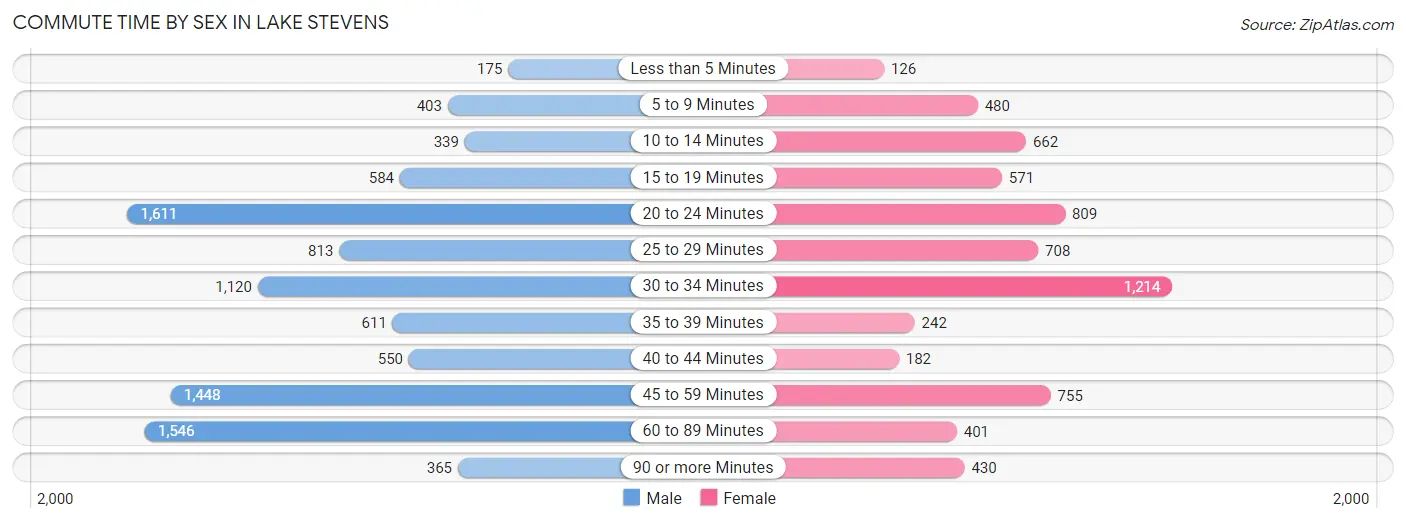
| Commute Time | Male | Female |
| Less than 5 Minutes | 175 (1.8%) | 126 (1.9%) |
| 5 to 9 Minutes | 403 (4.2%) | 480 (7.3%) |
| 10 to 14 Minutes | 339 (3.5%) | 662 (10.1%) |
| 15 to 19 Minutes | 584 (6.1%) | 571 (8.7%) |
| 20 to 24 Minutes | 1,611 (16.8%) | 809 (12.3%) |
| 25 to 29 Minutes | 813 (8.5%) | 708 (10.8%) |
| 30 to 34 Minutes | 1,120 (11.7%) | 1,214 (18.4%) |
| 35 to 39 Minutes | 611 (6.4%) | 242 (3.7%) |
| 40 to 44 Minutes | 550 (5.8%) | 182 (2.8%) |
| 45 to 59 Minutes | 1,448 (15.1%) | 755 (11.5%) |
| 60 to 89 Minutes | 1,546 (16.2%) | 401 (6.1%) |
| 90 or more Minutes | 365 (3.8%) | 430 (6.5%) |
Time of Departure to Work by Sex in Lake Stevens
The most frequent times of departure to work in Lake Stevens are 12:00 AM to 4:59 AM (1,587, 16.6%) for males and 8:00 AM to 8:29 AM (782, 11.9%) for females.
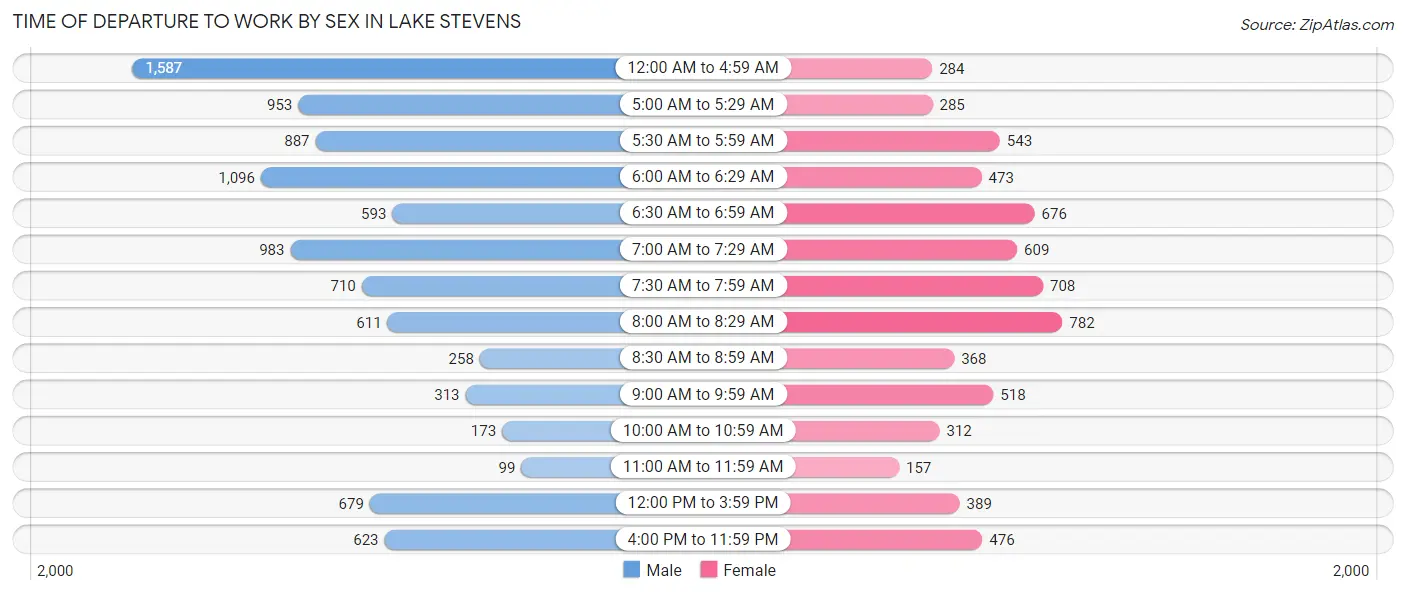
| Time of Departure | Male | Female |
| 12:00 AM to 4:59 AM | 1,587 (16.6%) | 284 (4.3%) |
| 5:00 AM to 5:29 AM | 953 (10.0%) | 285 (4.3%) |
| 5:30 AM to 5:59 AM | 887 (9.3%) | 543 (8.3%) |
| 6:00 AM to 6:29 AM | 1,096 (11.5%) | 473 (7.2%) |
| 6:30 AM to 6:59 AM | 593 (6.2%) | 676 (10.3%) |
| 7:00 AM to 7:29 AM | 983 (10.3%) | 609 (9.3%) |
| 7:30 AM to 7:59 AM | 710 (7.4%) | 708 (10.8%) |
| 8:00 AM to 8:29 AM | 611 (6.4%) | 782 (11.9%) |
| 8:30 AM to 8:59 AM | 258 (2.7%) | 368 (5.6%) |
| 9:00 AM to 9:59 AM | 313 (3.3%) | 518 (7.9%) |
| 10:00 AM to 10:59 AM | 173 (1.8%) | 312 (4.7%) |
| 11:00 AM to 11:59 AM | 99 (1.0%) | 157 (2.4%) |
| 12:00 PM to 3:59 PM | 679 (7.1%) | 389 (5.9%) |
| 4:00 PM to 11:59 PM | 623 (6.5%) | 476 (7.2%) |
| Total | 9,565 (100.0%) | 6,580 (100.0%) |
Housing Occupancy in Lake Stevens
Occupancy by Ownership in Lake Stevens
Of the total 13,097 dwellings in Lake Stevens, owner-occupied units account for 10,003 (76.4%), while renter-occupied units make up 3,094 (23.6%).
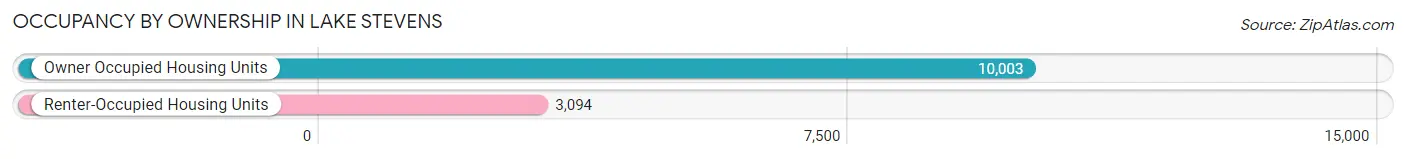
| Occupancy | # Housing Units | % Housing Units |
| Owner Occupied Housing Units | 10,003 | 76.4% |
| Renter-Occupied Housing Units | 3,094 | 23.6% |
| Total Occupied Housing Units | 13,097 | 100.0% |
Occupancy by Household Size in Lake Stevens
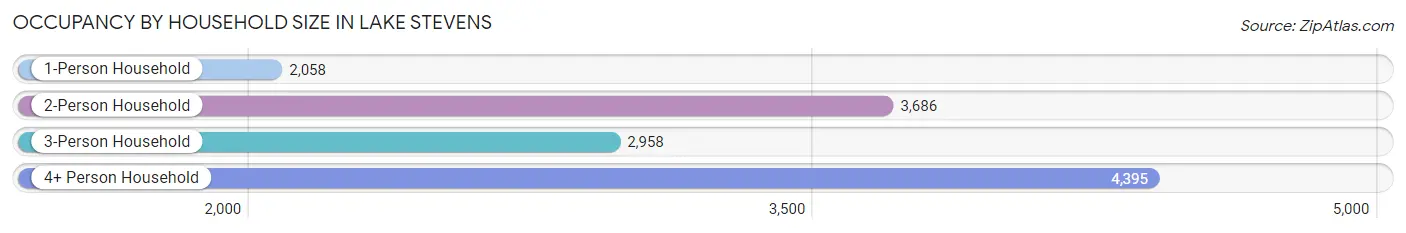
| Household Size | # Housing Units | % Housing Units |
| 1-Person Household | 2,058 | 15.7% |
| 2-Person Household | 3,686 | 28.1% |
| 3-Person Household | 2,958 | 22.6% |
| 4+ Person Household | 4,395 | 33.6% |
| Total Housing Units | 13,097 | 100.0% |
Occupancy by Ownership by Household Size in Lake Stevens
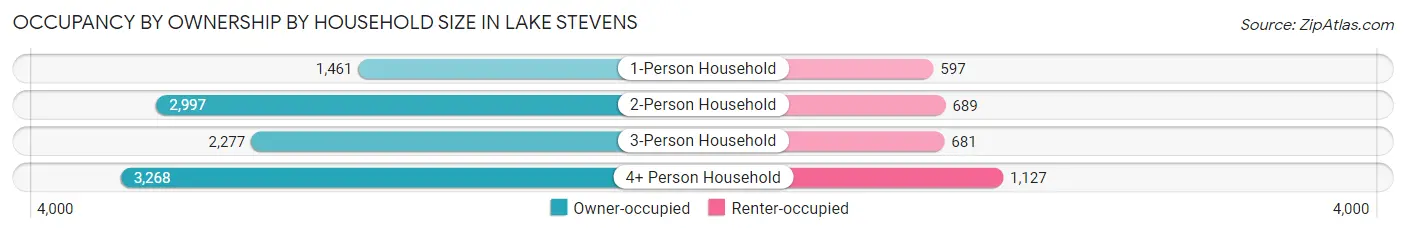
| Household Size | Owner-occupied | Renter-occupied |
| 1-Person Household | 1,461 (71.0%) | 597 (29.0%) |
| 2-Person Household | 2,997 (81.3%) | 689 (18.7%) |
| 3-Person Household | 2,277 (77.0%) | 681 (23.0%) |
| 4+ Person Household | 3,268 (74.4%) | 1,127 (25.6%) |
| Total Housing Units | 10,003 (76.4%) | 3,094 (23.6%) |
Occupancy by Educational Attainment in Lake Stevens
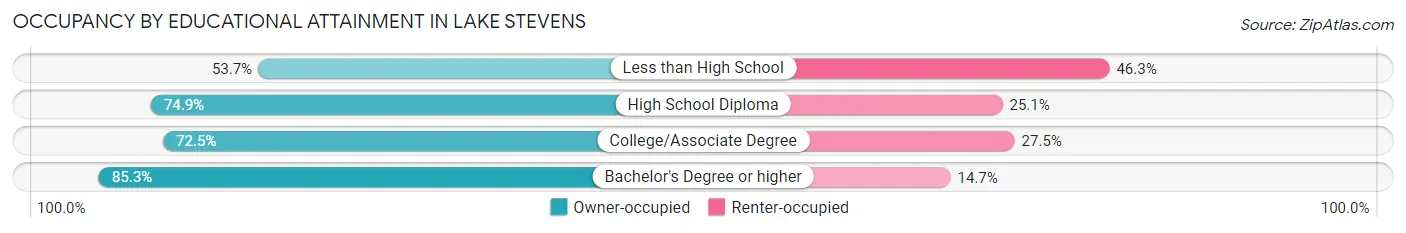
| Household Size | Owner-occupied | Renter-occupied |
| Less than High School | 366 (53.7%) | 315 (46.3%) |
| High School Diploma | 1,854 (74.9%) | 620 (25.1%) |
| College/Associate Degree | 3,955 (72.5%) | 1,497 (27.5%) |
| Bachelor's Degree or higher | 3,828 (85.3%) | 662 (14.7%) |
Occupancy by Age of Householder in Lake Stevens
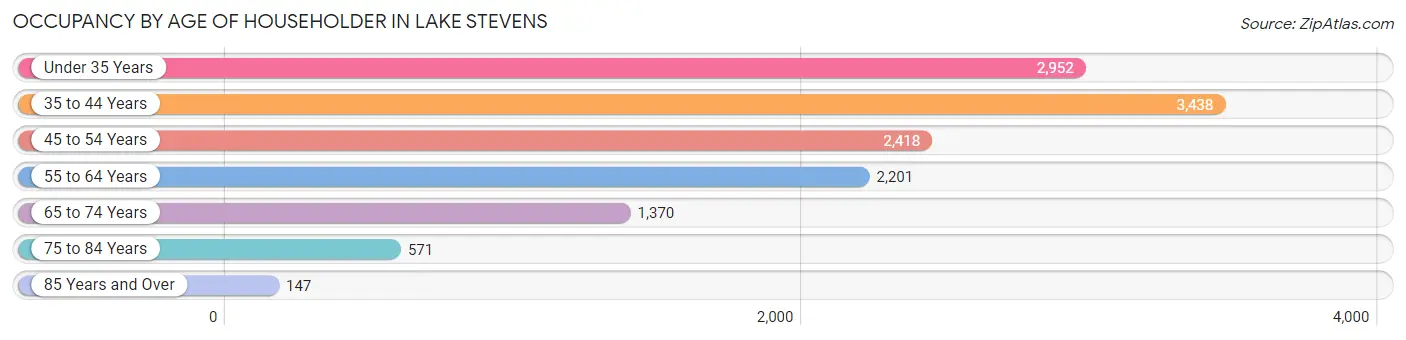
| Age Bracket | # Households | % Households |
| Under 35 Years | 2,952 | 22.5% |
| 35 to 44 Years | 3,438 | 26.3% |
| 45 to 54 Years | 2,418 | 18.5% |
| 55 to 64 Years | 2,201 | 16.8% |
| 65 to 74 Years | 1,370 | 10.5% |
| 75 to 84 Years | 571 | 4.4% |
| 85 Years and Over | 147 | 1.1% |
| Total | 13,097 | 100.0% |
Housing Finances in Lake Stevens
Median Income by Occupancy in Lake Stevens
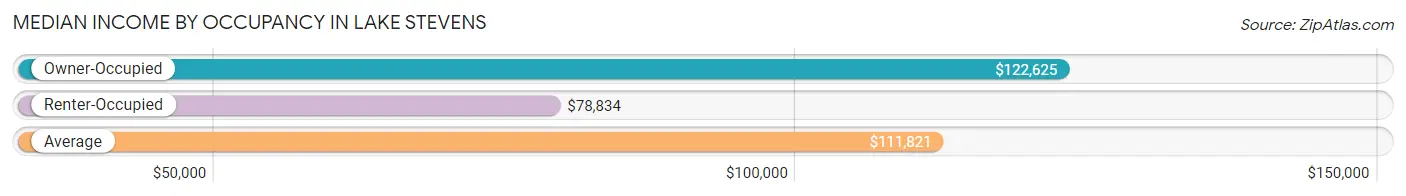
| Occupancy Type | # Households | Median Income |
| Owner-Occupied | 10,003 (76.4%) | $122,625 |
| Renter-Occupied | 3,094 (23.6%) | $78,834 |
| Average | 13,097 (100.0%) | $111,821 |
Occupancy by Householder Income Bracket in Lake Stevens
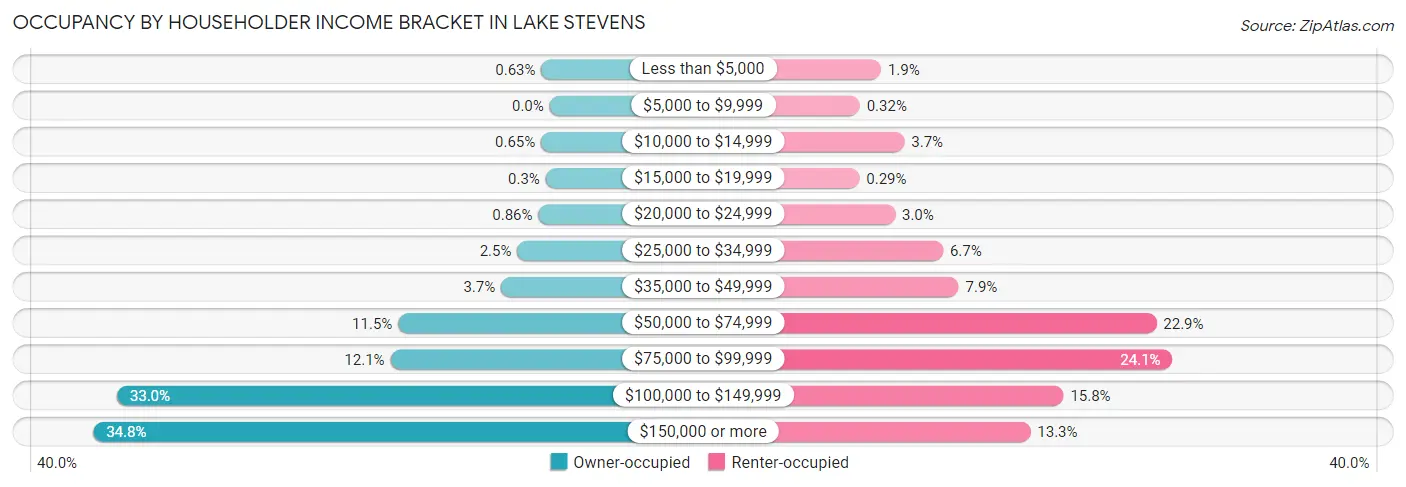
| Income Bracket | Owner-occupied | Renter-occupied |
| Less than $5,000 | 63 (0.6%) | 60 (1.9%) |
| $5,000 to $9,999 | 0 (0.0%) | 10 (0.3%) |
| $10,000 to $14,999 | 65 (0.6%) | 115 (3.7%) |
| $15,000 to $19,999 | 30 (0.3%) | 9 (0.3%) |
| $20,000 to $24,999 | 86 (0.9%) | 93 (3.0%) |
| $25,000 to $34,999 | 246 (2.5%) | 206 (6.7%) |
| $35,000 to $49,999 | 370 (3.7%) | 243 (7.9%) |
| $50,000 to $74,999 | 1,154 (11.5%) | 709 (22.9%) |
| $75,000 to $99,999 | 1,213 (12.1%) | 747 (24.1%) |
| $100,000 to $149,999 | 3,298 (33.0%) | 490 (15.8%) |
| $150,000 or more | 3,478 (34.8%) | 412 (13.3%) |
| Total | 10,003 (100.0%) | 3,094 (100.0%) |
Monthly Housing Cost Tiers in Lake Stevens
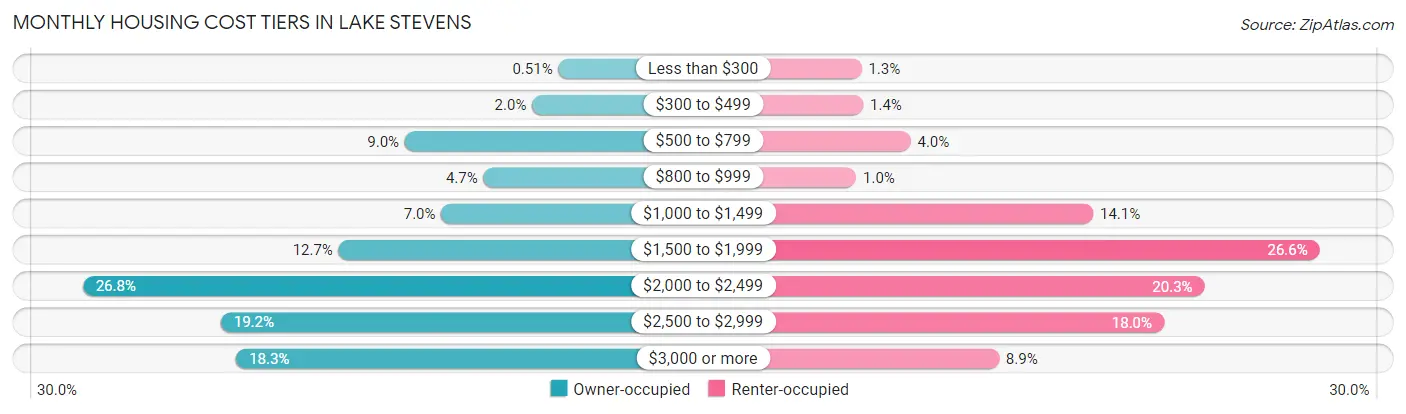
| Monthly Cost | Owner-occupied | Renter-occupied |
| Less than $300 | 51 (0.5%) | 41 (1.3%) |
| $300 to $499 | 196 (2.0%) | 44 (1.4%) |
| $500 to $799 | 899 (9.0%) | 125 (4.0%) |
| $800 to $999 | 465 (4.6%) | 32 (1.0%) |
| $1,000 to $1,499 | 698 (7.0%) | 437 (14.1%) |
| $1,500 to $1,999 | 1,265 (12.7%) | 824 (26.6%) |
| $2,000 to $2,499 | 2,680 (26.8%) | 627 (20.3%) |
| $2,500 to $2,999 | 1,917 (19.2%) | 558 (18.0%) |
| $3,000 or more | 1,832 (18.3%) | 276 (8.9%) |
| Total | 10,003 (100.0%) | 3,094 (100.0%) |
Physical Housing Characteristics in Lake Stevens
Housing Structures in Lake Stevens
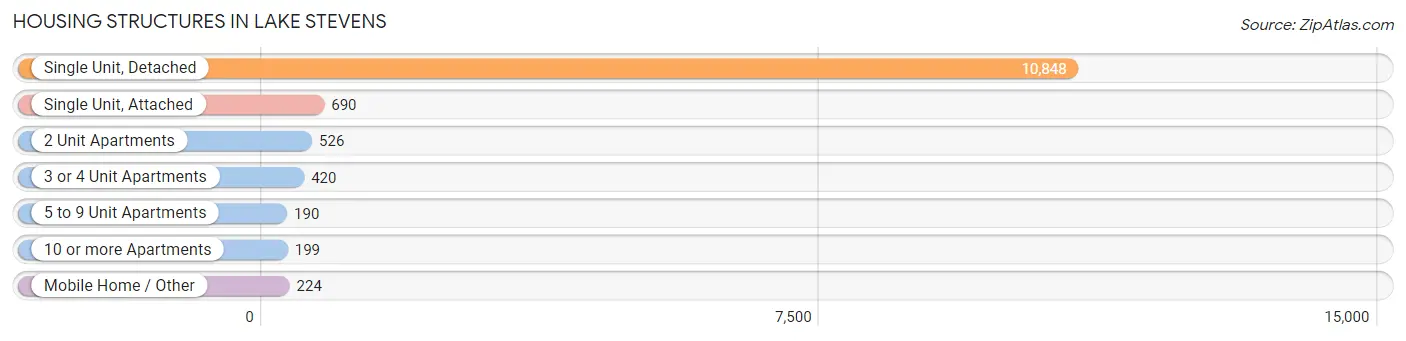
| Structure Type | # Housing Units | % Housing Units |
| Single Unit, Detached | 10,848 | 82.8% |
| Single Unit, Attached | 690 | 5.3% |
| 2 Unit Apartments | 526 | 4.0% |
| 3 or 4 Unit Apartments | 420 | 3.2% |
| 5 to 9 Unit Apartments | 190 | 1.5% |
| 10 or more Apartments | 199 | 1.5% |
| Mobile Home / Other | 224 | 1.7% |
| Total | 13,097 | 100.0% |
Housing Structures by Occupancy in Lake Stevens
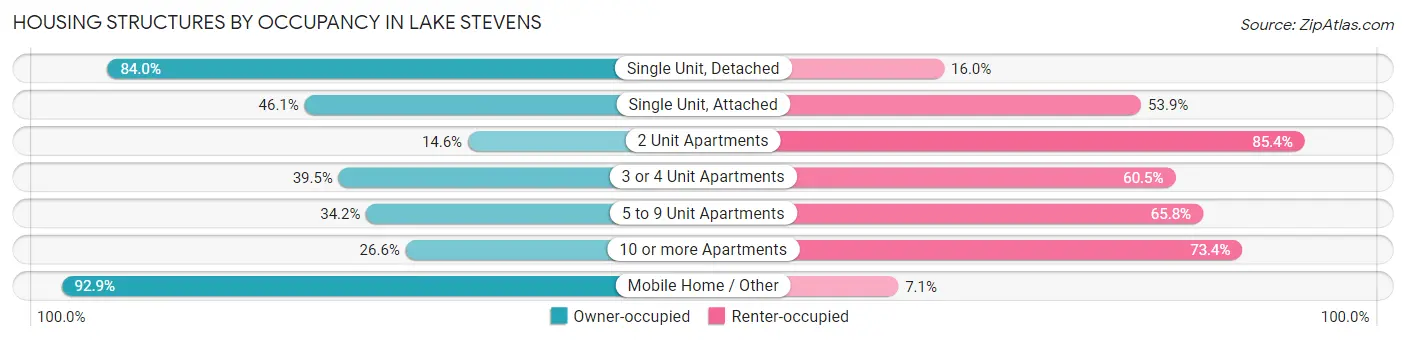
| Structure Type | Owner-occupied | Renter-occupied |
| Single Unit, Detached | 9,116 (84.0%) | 1,732 (16.0%) |
| Single Unit, Attached | 318 (46.1%) | 372 (53.9%) |
| 2 Unit Apartments | 77 (14.6%) | 449 (85.4%) |
| 3 or 4 Unit Apartments | 166 (39.5%) | 254 (60.5%) |
| 5 to 9 Unit Apartments | 65 (34.2%) | 125 (65.8%) |
| 10 or more Apartments | 53 (26.6%) | 146 (73.4%) |
| Mobile Home / Other | 208 (92.9%) | 16 (7.1%) |
| Total | 10,003 (76.4%) | 3,094 (23.6%) |
Housing Structures by Number of Rooms in Lake Stevens
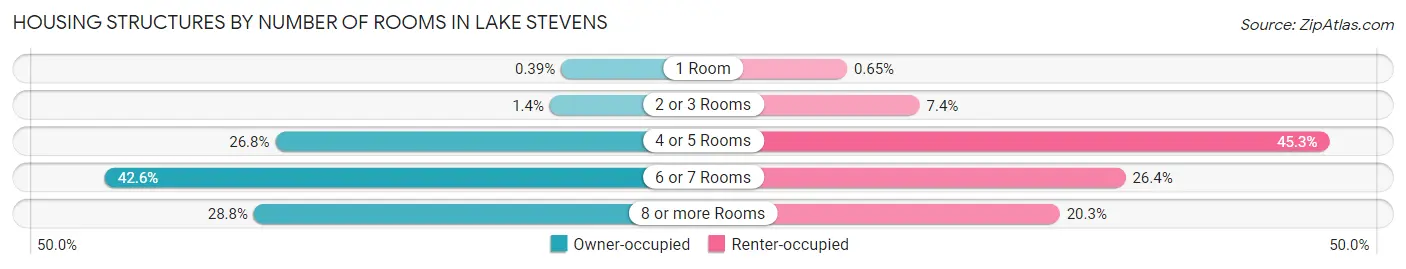
| Number of Rooms | Owner-occupied | Renter-occupied |
| 1 Room | 39 (0.4%) | 20 (0.6%) |
| 2 or 3 Rooms | 143 (1.4%) | 228 (7.4%) |
| 4 or 5 Rooms | 2,682 (26.8%) | 1,400 (45.3%) |
| 6 or 7 Rooms | 4,258 (42.6%) | 817 (26.4%) |
| 8 or more Rooms | 2,881 (28.8%) | 629 (20.3%) |
| Total | 10,003 (100.0%) | 3,094 (100.0%) |
Housing Structure by Heating Type in Lake Stevens
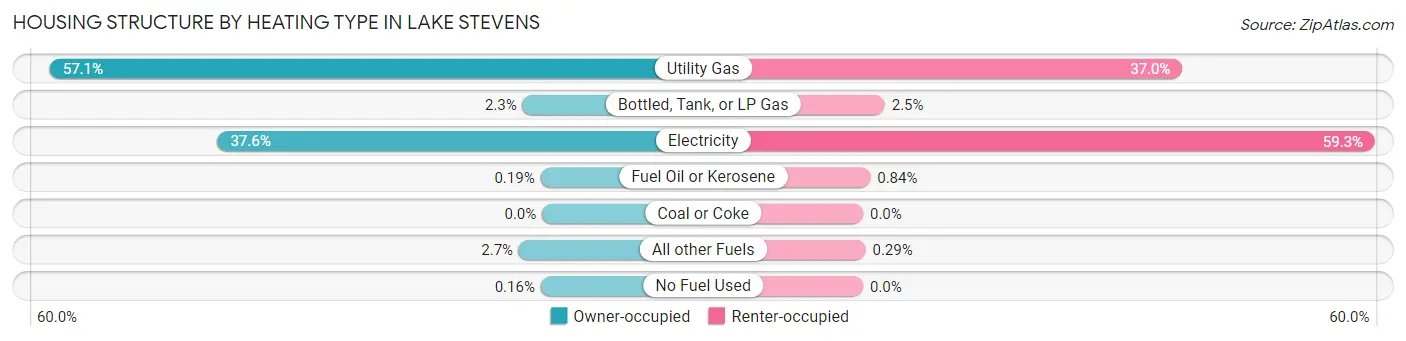
| Heating Type | Owner-occupied | Renter-occupied |
| Utility Gas | 5,709 (57.1%) | 1,145 (37.0%) |
| Bottled, Tank, or LP Gas | 226 (2.3%) | 78 (2.5%) |
| Electricity | 3,764 (37.6%) | 1,836 (59.3%) |
| Fuel Oil or Kerosene | 19 (0.2%) | 26 (0.8%) |
| Coal or Coke | 0 (0.0%) | 0 (0.0%) |
| All other Fuels | 269 (2.7%) | 9 (0.3%) |
| No Fuel Used | 16 (0.2%) | 0 (0.0%) |
| Total | 10,003 (100.0%) | 3,094 (100.0%) |
Household Vehicle Usage in Lake Stevens
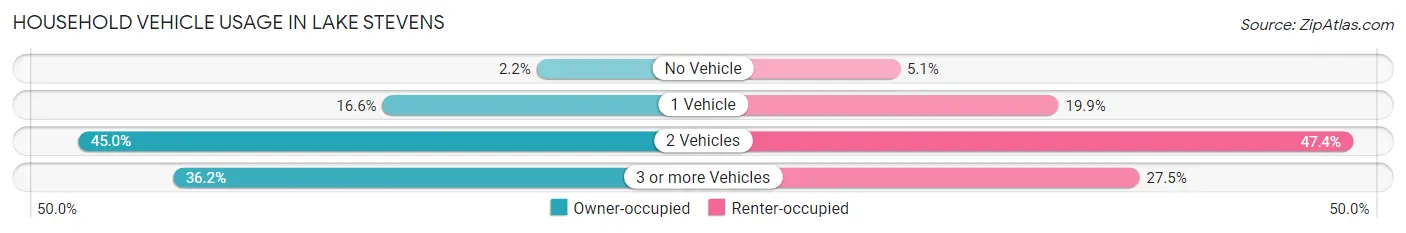
| Vehicles per Household | Owner-occupied | Renter-occupied |
| No Vehicle | 221 (2.2%) | 159 (5.1%) |
| 1 Vehicle | 1,660 (16.6%) | 617 (19.9%) |
| 2 Vehicles | 4,504 (45.0%) | 1,467 (47.4%) |
| 3 or more Vehicles | 3,618 (36.2%) | 851 (27.5%) |
| Total | 10,003 (100.0%) | 3,094 (100.0%) |
Real Estate & Mortgages in Lake Stevens
Real Estate and Mortgage Overview in Lake Stevens
| Characteristic | Without Mortgage | With Mortgage |
| Housing Units | 1,836 | 8,167 |
| Median Property Value | $487,600 | $523,900 |
| Median Household Income | $97,813 | $3,036 |
| Monthly Housing Costs | $752 | $1,832 |
| Real Estate Taxes | $4,469 | $22 |
Property Value by Mortgage Status in Lake Stevens
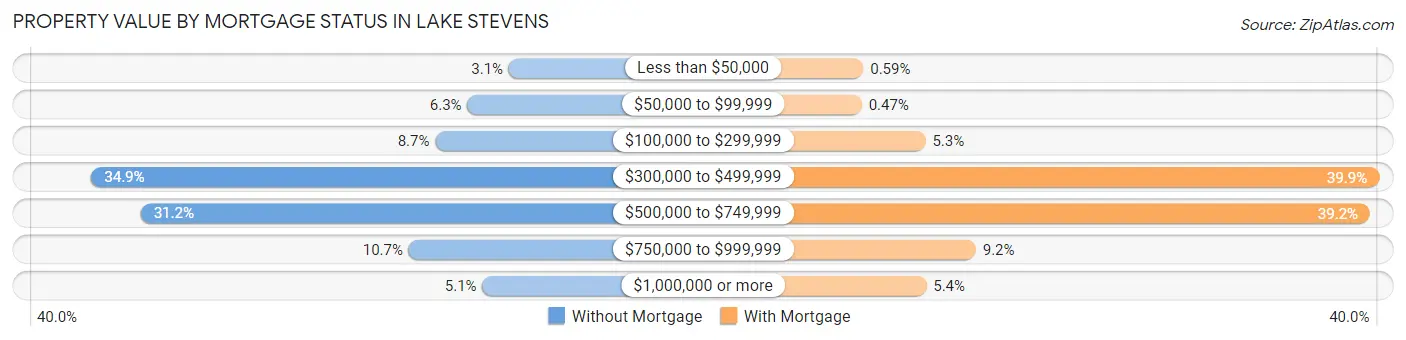
| Property Value | Without Mortgage | With Mortgage |
| Less than $50,000 | 57 (3.1%) | 48 (0.6%) |
| $50,000 to $99,999 | 115 (6.3%) | 38 (0.5%) |
| $100,000 to $299,999 | 160 (8.7%) | 435 (5.3%) |
| $300,000 to $499,999 | 641 (34.9%) | 3,257 (39.9%) |
| $500,000 to $749,999 | 572 (31.1%) | 3,201 (39.2%) |
| $750,000 to $999,999 | 197 (10.7%) | 748 (9.2%) |
| $1,000,000 or more | 94 (5.1%) | 440 (5.4%) |
| Total | 1,836 (100.0%) | 8,167 (100.0%) |
Household Income by Mortgage Status in Lake Stevens
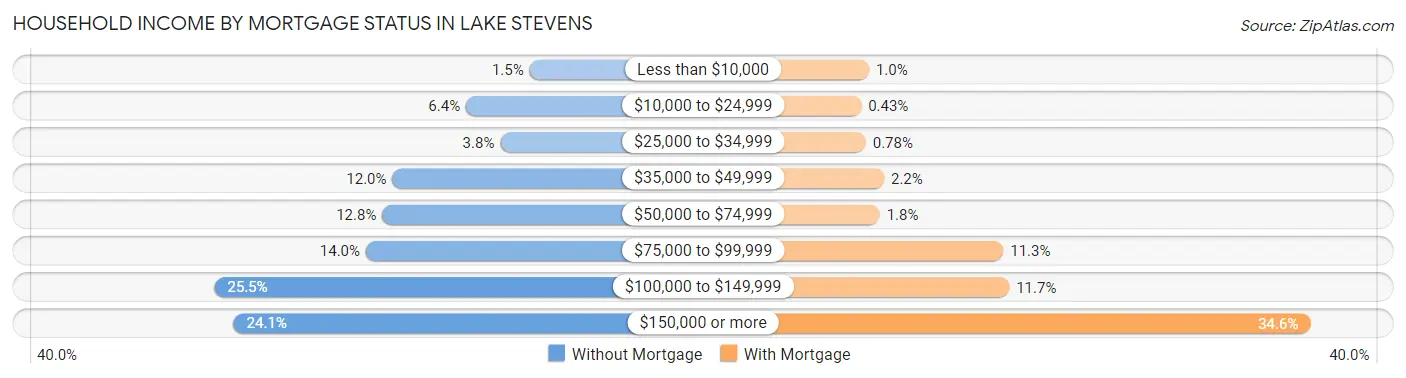
| Household Income | Without Mortgage | With Mortgage |
| Less than $10,000 | 28 (1.5%) | 83 (1.0%) |
| $10,000 to $24,999 | 117 (6.4%) | 35 (0.4%) |
| $25,000 to $34,999 | 69 (3.8%) | 64 (0.8%) |
| $35,000 to $49,999 | 220 (12.0%) | 177 (2.2%) |
| $50,000 to $74,999 | 234 (12.8%) | 150 (1.8%) |
| $75,000 to $99,999 | 257 (14.0%) | 920 (11.3%) |
| $100,000 to $149,999 | 469 (25.5%) | 956 (11.7%) |
| $150,000 or more | 442 (24.1%) | 2,829 (34.6%) |
| Total | 1,836 (100.0%) | 8,167 (100.0%) |
Property Value to Household Income Ratio in Lake Stevens
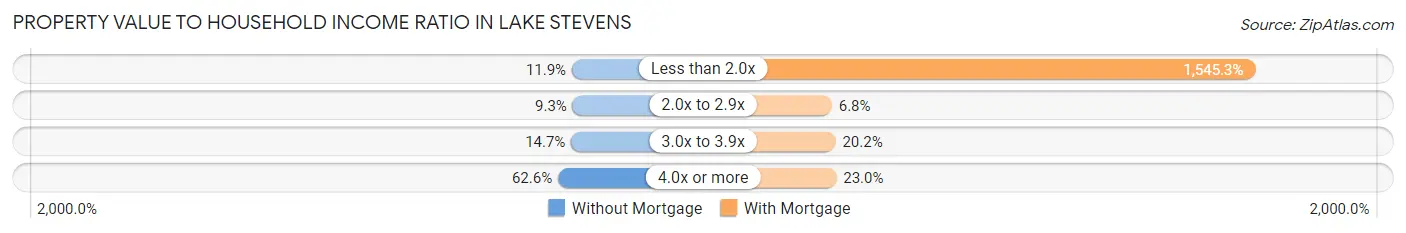
| Value-to-Income Ratio | Without Mortgage | With Mortgage |
| Less than 2.0x | 219 (11.9%) | 126,201 (1,545.3%) |
| 2.0x to 2.9x | 170 (9.3%) | 557 (6.8%) |
| 3.0x to 3.9x | 269 (14.6%) | 1,650 (20.2%) |
| 4.0x or more | 1,150 (62.6%) | 1,882 (23.0%) |
| Total | 1,836 (100.0%) | 8,167 (100.0%) |
Real Estate Taxes by Mortgage Status in Lake Stevens
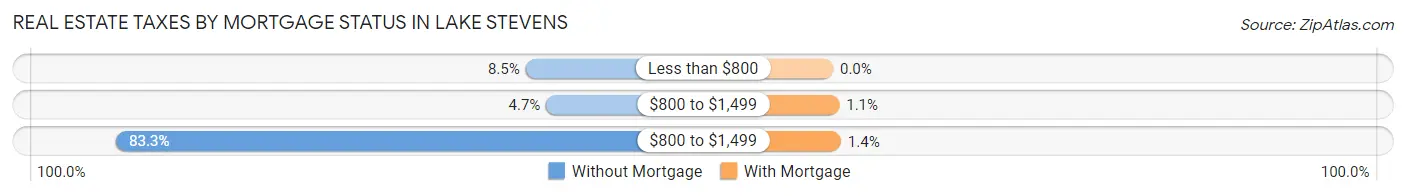
| Property Taxes | Without Mortgage | With Mortgage |
| Less than $800 | 156 (8.5%) | 0 (0.0%) |
| $800 to $1,499 | 87 (4.7%) | 93 (1.1%) |
| $800 to $1,499 | 1,529 (83.3%) | 118 (1.4%) |
| Total | 1,836 (100.0%) | 8,167 (100.0%) |
Health & Disability in Lake Stevens
Health Insurance Coverage by Age in Lake Stevens
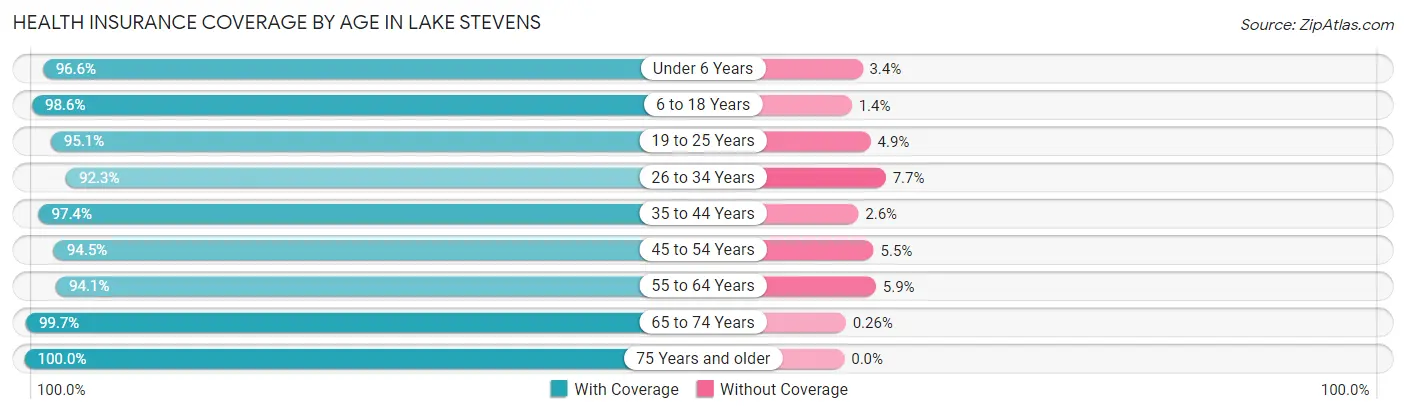
| Age Bracket | With Coverage | Without Coverage |
| Under 6 Years | 3,801 (96.6%) | 133 (3.4%) |
| 6 to 18 Years | 7,587 (98.6%) | 107 (1.4%) |
| 19 to 25 Years | 2,117 (95.1%) | 109 (4.9%) |
| 26 to 34 Years | 5,637 (92.3%) | 472 (7.7%) |
| 35 to 44 Years | 6,242 (97.4%) | 168 (2.6%) |
| 45 to 54 Years | 4,409 (94.5%) | 255 (5.5%) |
| 55 to 64 Years | 3,952 (94.1%) | 247 (5.9%) |
| 65 to 74 Years | 2,323 (99.7%) | 6 (0.3%) |
| 75 Years and older | 1,036 (100.0%) | 0 (0.0%) |
| Total | 37,104 (96.1%) | 1,497 (3.9%) |
Health Insurance Coverage by Citizenship Status in Lake Stevens
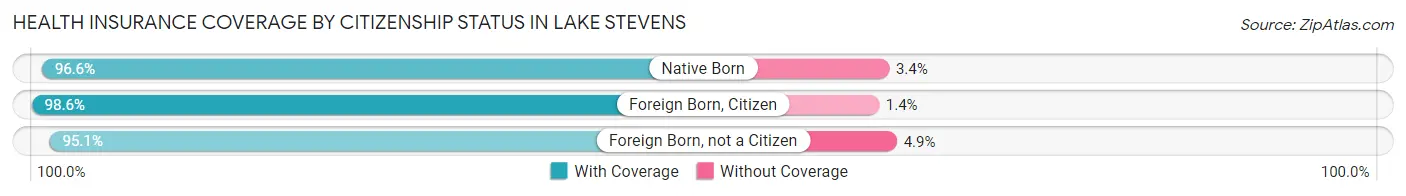
| Citizenship Status | With Coverage | Without Coverage |
| Native Born | 3,801 (96.6%) | 133 (3.4%) |
| Foreign Born, Citizen | 7,587 (98.6%) | 107 (1.4%) |
| Foreign Born, not a Citizen | 2,117 (95.1%) | 109 (4.9%) |
Health Insurance Coverage by Household Income in Lake Stevens
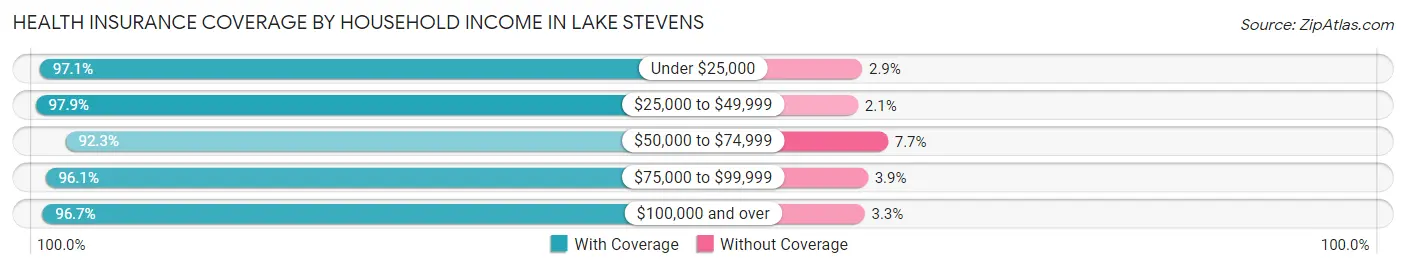
| Household Income | With Coverage | Without Coverage |
| Under $25,000 | 952 (97.1%) | 28 (2.9%) |
| $25,000 to $49,999 | 2,590 (97.9%) | 55 (2.1%) |
| $50,000 to $74,999 | 4,641 (92.3%) | 386 (7.7%) |
| $75,000 to $99,999 | 5,710 (96.1%) | 233 (3.9%) |
| $100,000 and over | 23,174 (96.7%) | 795 (3.3%) |
Public vs Private Health Insurance Coverage by Age in Lake Stevens
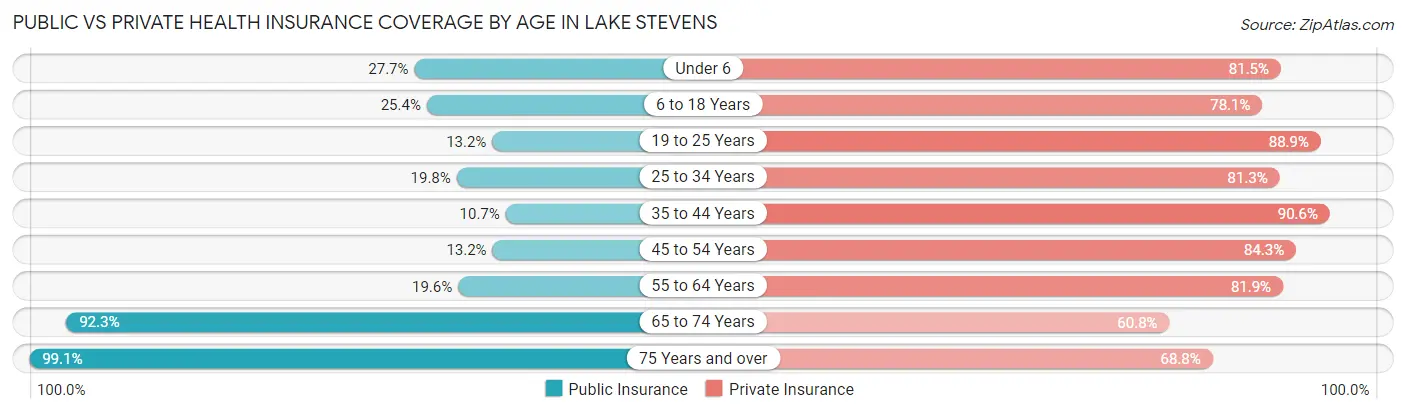
| Age Bracket | Public Insurance | Private Insurance |
| Under 6 | 1,088 (27.7%) | 3,206 (81.5%) |
| 6 to 18 Years | 1,951 (25.4%) | 6,005 (78.0%) |
| 19 to 25 Years | 294 (13.2%) | 1,979 (88.9%) |
| 25 to 34 Years | 1,210 (19.8%) | 4,964 (81.3%) |
| 35 to 44 Years | 687 (10.7%) | 5,806 (90.6%) |
| 45 to 54 Years | 614 (13.2%) | 3,932 (84.3%) |
| 55 to 64 Years | 821 (19.6%) | 3,438 (81.9%) |
| 65 to 74 Years | 2,149 (92.3%) | 1,416 (60.8%) |
| 75 Years and over | 1,027 (99.1%) | 713 (68.8%) |
| Total | 9,841 (25.5%) | 31,459 (81.5%) |
Disability Status by Sex by Age in Lake Stevens
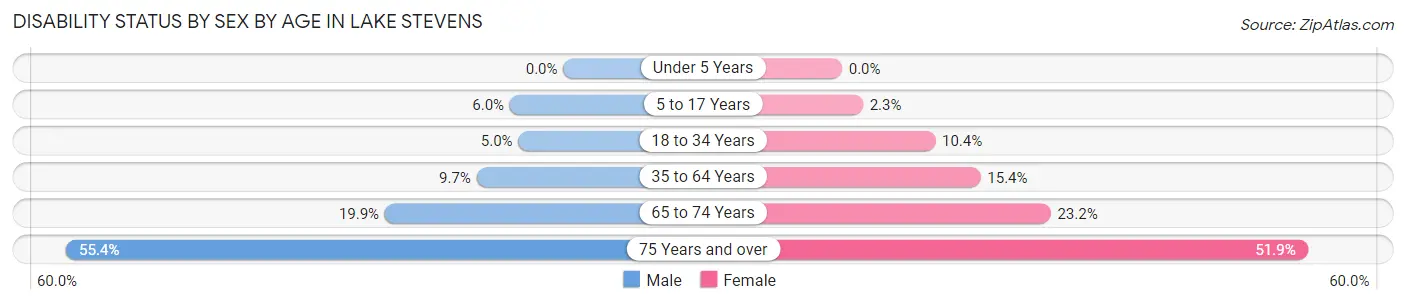
| Age Bracket | Male | Female |
| Under 5 Years | 0 (0.0%) | 0 (0.0%) |
| 5 to 17 Years | 229 (5.9%) | 98 (2.3%) |
| 18 to 34 Years | 215 (5.0%) | 458 (10.4%) |
| 35 to 64 Years | 771 (9.7%) | 1,124 (15.4%) |
| 65 to 74 Years | 208 (19.9%) | 298 (23.2%) |
| 75 Years and over | 247 (55.4%) | 306 (51.9%) |
Disability Class by Sex by Age in Lake Stevens
Disability Class: Hearing Difficulty
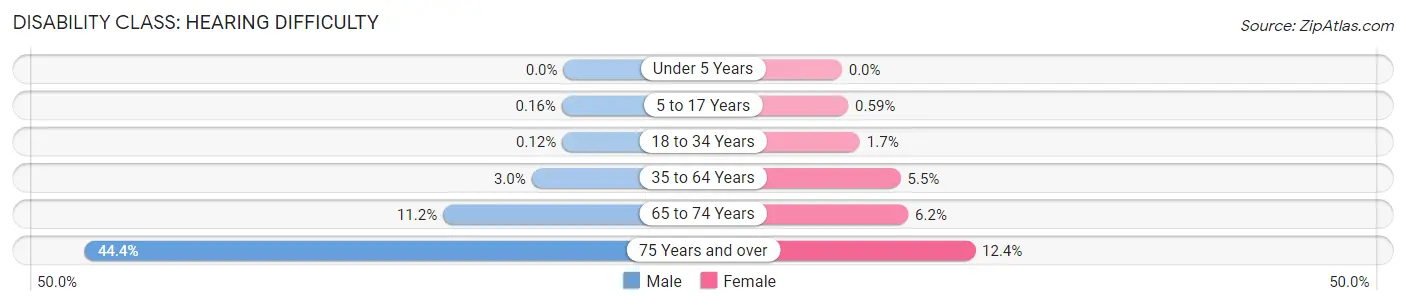
| Age Bracket | Male | Female |
| Under 5 Years | 0 (0.0%) | 0 (0.0%) |
| 5 to 17 Years | 6 (0.2%) | 25 (0.6%) |
| 18 to 34 Years | 5 (0.1%) | 74 (1.7%) |
| 35 to 64 Years | 236 (2.9%) | 398 (5.5%) |
| 65 to 74 Years | 117 (11.2%) | 79 (6.2%) |
| 75 Years and over | 198 (44.4%) | 73 (12.4%) |
Disability Class: Vision Difficulty
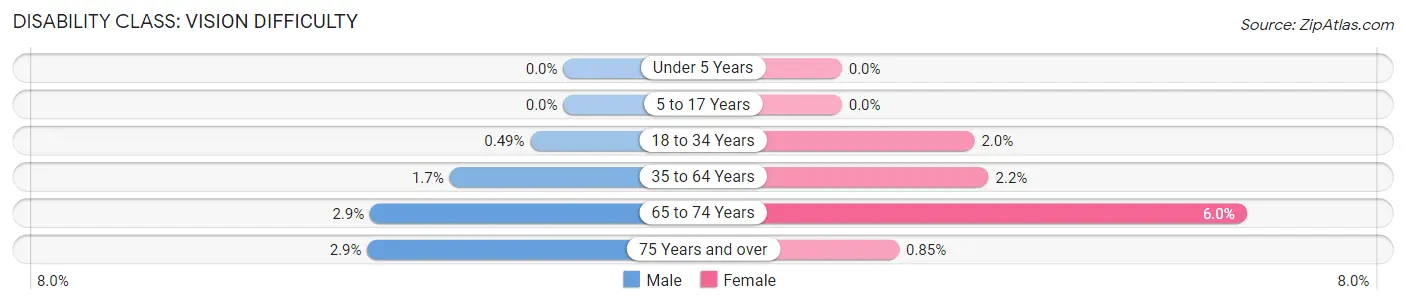
| Age Bracket | Male | Female |
| Under 5 Years | 0 (0.0%) | 0 (0.0%) |
| 5 to 17 Years | 0 (0.0%) | 0 (0.0%) |
| 18 to 34 Years | 21 (0.5%) | 87 (2.0%) |
| 35 to 64 Years | 135 (1.7%) | 159 (2.2%) |
| 65 to 74 Years | 30 (2.9%) | 77 (6.0%) |
| 75 Years and over | 13 (2.9%) | 5 (0.9%) |
Disability Class: Cognitive Difficulty
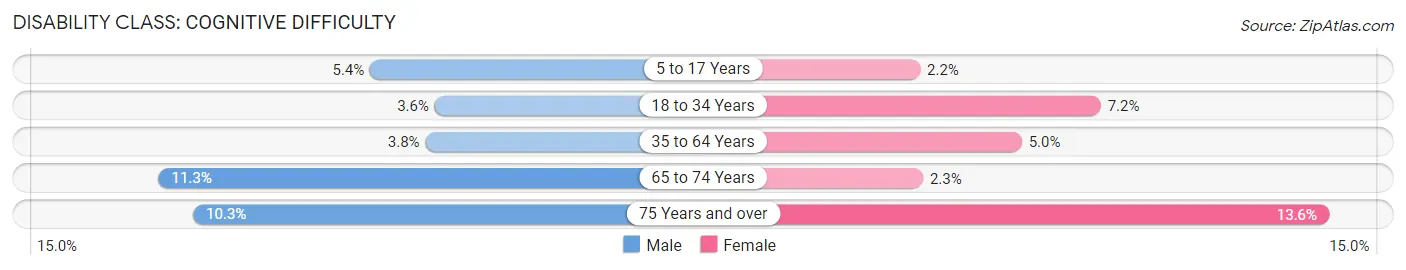
| Age Bracket | Male | Female |
| 5 to 17 Years | 207 (5.4%) | 92 (2.2%) |
| 18 to 34 Years | 154 (3.6%) | 318 (7.2%) |
| 35 to 64 Years | 307 (3.8%) | 365 (5.0%) |
| 65 to 74 Years | 118 (11.3%) | 29 (2.3%) |
| 75 Years and over | 46 (10.3%) | 80 (13.6%) |
Disability Class: Ambulatory Difficulty
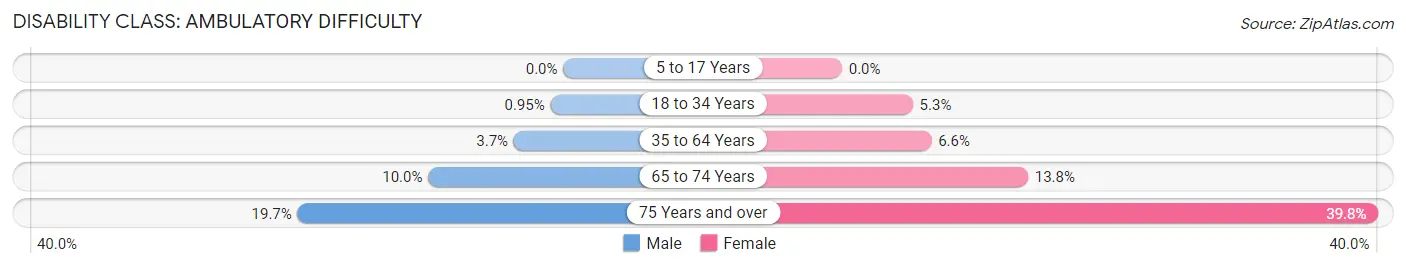
| Age Bracket | Male | Female |
| 5 to 17 Years | 0 (0.0%) | 0 (0.0%) |
| 18 to 34 Years | 41 (0.9%) | 232 (5.3%) |
| 35 to 64 Years | 293 (3.7%) | 484 (6.6%) |
| 65 to 74 Years | 105 (10.0%) | 177 (13.8%) |
| 75 Years and over | 88 (19.7%) | 235 (39.8%) |
Disability Class: Self-Care Difficulty
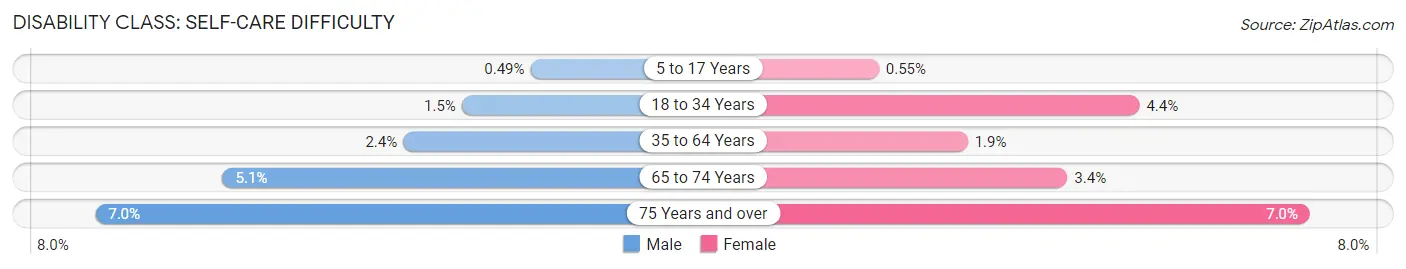
| Age Bracket | Male | Female |
| 5 to 17 Years | 19 (0.5%) | 23 (0.5%) |
| 18 to 34 Years | 65 (1.5%) | 195 (4.4%) |
| 35 to 64 Years | 190 (2.4%) | 136 (1.9%) |
| 65 to 74 Years | 53 (5.1%) | 43 (3.4%) |
| 75 Years and over | 31 (7.0%) | 41 (7.0%) |
Technology Access in Lake Stevens
Computing Device Access in Lake Stevens
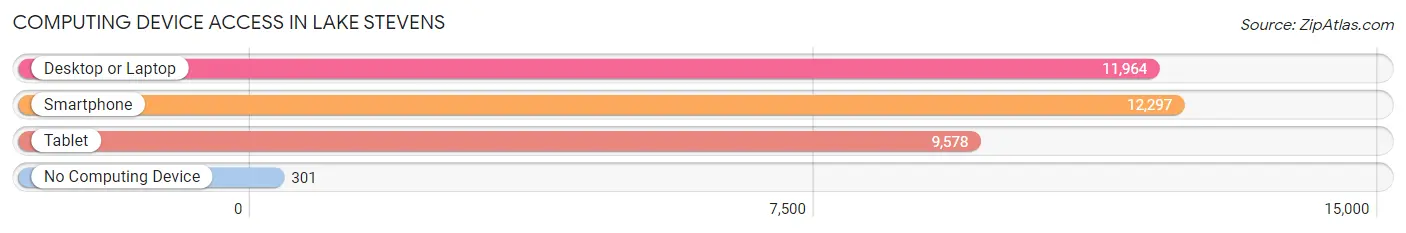
| Device Type | # Households | % Households |
| Desktop or Laptop | 11,964 | 91.3% |
| Smartphone | 12,297 | 93.9% |
| Tablet | 9,578 | 73.1% |
| No Computing Device | 301 | 2.3% |
| Total | 13,097 | 100.0% |
Internet Access in Lake Stevens
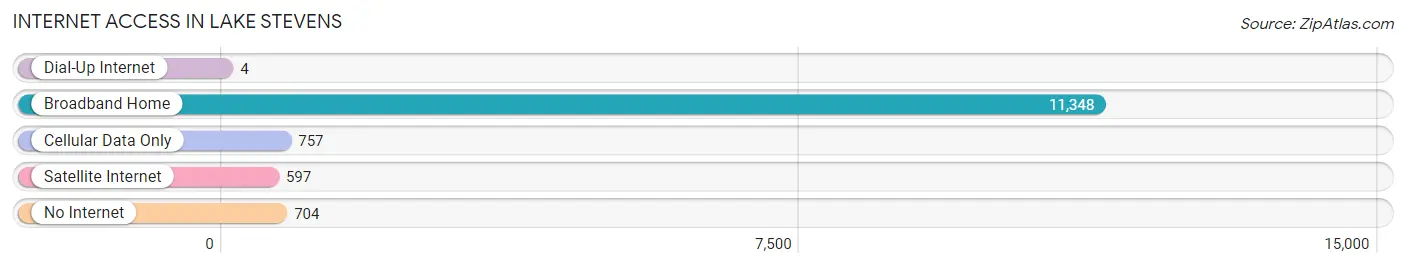
| Internet Type | # Households | % Households |
| Dial-Up Internet | 4 | 0.0% |
| Broadband Home | 11,348 | 86.7% |
| Cellular Data Only | 757 | 5.8% |
| Satellite Internet | 597 | 4.6% |
| No Internet | 704 | 5.4% |
| Total | 13,097 | 100.0% |
Lake Stevens Summary
History
The area now known as Lake Stevens was first inhabited by the Snohomish people, who lived in the area for thousands of years before the arrival of European settlers. The first recorded European exploration of the area was in 1792, when Spanish explorer Francisco de Eliza sailed up the Snohomish River. The first permanent settlement in the area was established in 1858, when a group of settlers from the Oregon Territory arrived and established a homestead near the lake.
The area was originally known as "Stevens Lake," after the first settler, John Stevens. In 1891, the name was changed to "Lake Stevens" by the Washington State Legislature. The town of Lake Stevens was officially incorporated in 1960.
Geography
Lake Stevens is located in Snohomish County, Washington, about 25 miles northeast of Seattle. The city is situated on the western shore of Lake Stevens, a large freshwater lake that is the centerpiece of the city. The lake is fed by the Pilchuck River and is surrounded by the Cascade Mountains to the east and the Olympic Mountains to the west.
The city of Lake Stevens covers an area of 8.3 square miles, with a population of 28,069 as of the 2010 census. The city is divided into several neighborhoods, including the historic downtown area, the residential area of North Lake Stevens, and the industrial area of South Lake Stevens.
Economy
The economy of Lake Stevens is largely based on the service industry, with many businesses providing services to the local population. The city is home to several large employers, including the Boeing Company, Microsoft, and the University of Washington.
The city is also home to several small businesses, including restaurants, retail stores, and professional services. The city is also home to several wineries, breweries, and distilleries, as well as a number of farms and agricultural businesses.
Demographics
As of the 2010 census, the population of Lake Stevens was 28,069. The racial makeup of the city was 87.3% White, 4.2% Hispanic or Latino, 2.2% Asian, 1.7% African American, 0.7% Native American, and 0.1% Pacific Islander.
The median household income in Lake Stevens was $68,845, and the median family income was $76,945. The per capita income was $30,945. The city's poverty rate was 8.3%.
Conclusion
Lake Stevens is a city in Snohomish County, Washington, located about 25 miles northeast of Seattle. The city is situated on the western shore of Lake Stevens, a large freshwater lake that is the centerpiece of the city. The economy of Lake Stevens is largely based on the service industry, with many businesses providing services to the local population. As of the 2010 census, the population of Lake Stevens was 28,069, with a median household income of $68,845. The city is home to several large employers, as well as several small businesses, wineries, breweries, and distilleries.
Common Questions
What is Per Capita Income in Lake Stevens?
Per Capita income in Lake Stevens is $43,351.
What is the Median Family Income in Lake Stevens?
Median Family Income in Lake Stevens is $116,071.
What is the Median Household income in Lake Stevens?
Median Household Income in Lake Stevens is $111,821.
What is Income or Wage Gap in Lake Stevens?
Income or Wage Gap in Lake Stevens is 38.2%.
Women in Lake Stevens earn 61.8 cents for every dollar earned by a man.
What is Inequality or Gini Index in Lake Stevens?
Inequality or Gini Index in Lake Stevens is 0.33.
What is the Total Population of Lake Stevens?
Total Population of Lake Stevens is 38,816.
What is the Total Male Population of Lake Stevens?
Total Male Population of Lake Stevens is 19,581.
What is the Total Female Population of Lake Stevens?
Total Female Population of Lake Stevens is 19,235.
What is the Ratio of Males per 100 Females in Lake Stevens?
There are 101.80 Males per 100 Females in Lake Stevens.
What is the Ratio of Females per 100 Males in Lake Stevens?
There are 98.23 Females per 100 Males in Lake Stevens.
What is the Median Population Age in Lake Stevens?
Median Population Age in Lake Stevens is 34.4 Years.
What is the Average Family Size in Lake Stevens
Average Family Size in Lake Stevens is 3.3 People.
What is the Average Household Size in Lake Stevens
Average Household Size in Lake Stevens is 3.0 People.
How Large is the Labor Force in Lake Stevens?
There are 20,837 People in the Labor Forcein in Lake Stevens.
What is the Percentage of People in the Labor Force in Lake Stevens?
72.7% of People are in the Labor Force in Lake Stevens.
What is the Unemployment Rate in Lake Stevens?
Unemployment Rate in Lake Stevens is 5.1%.