Maple Valley, WA Map & Demographics
Maple Valley Map
Maple Valley Overview
$50,480
PER CAPITA INCOME
$145,105
AVG FAMILY INCOME
$137,595
AVG HOUSEHOLD INCOME
51.8%
WAGE / INCOME GAP [ % ]
48.2¢/ $1
WAGE / INCOME GAP [ $ ]
$15,271
FAMILY INCOME DEFICIT
0.36
INEQUALITY / GINI INDEX
27,889
TOTAL POPULATION
13,933
MALE POPULATION
13,956
FEMALE POPULATION
99.84
MALES / 100 FEMALES
100.17
FEMALES / 100 MALES
36.4
MEDIAN AGE
3.3
AVG FAMILY SIZE
3.0
AVG HOUSEHOLD SIZE
14,066
LABOR FORCE [ PEOPLE ]
70.5%
PERCENT IN LABOR FORCE
4.9%
UNEMPLOYMENT RATE
Maple Valley Zip Codes
Maple Valley Area Codes
Income in Maple Valley
Income Overview in Maple Valley
Per Capita Income in Maple Valley is $50,480, while median incomes of families and households are $145,105 and $137,595 respectively.
| Characteristic | Number | Measure |
| Per Capita Income | 27,889 | $50,480 |
| Median Family Income | 7,670 | $145,105 |
| Mean Family Income | 7,670 | $162,590 |
| Median Household Income | 9,193 | $137,595 |
| Mean Household Income | 9,193 | $151,609 |
| Income Deficit | 7,670 | $15,271 |
| Wage / Income Gap (%) | 27,889 | 51.84% |
| Wage / Income Gap ($) | 27,889 | 48.16¢ per $1 |
| Gini / Inequality Index | 27,889 | 0.36 |
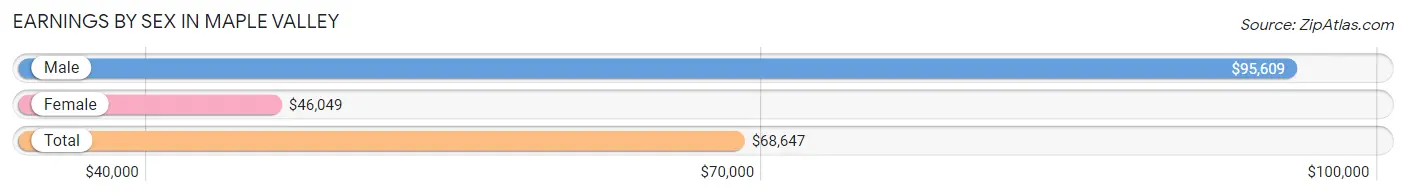
Earnings by Sex in Maple Valley
Average Earnings in Maple Valley are $68,647, $95,609 for men and $46,049 for women, a difference of 51.8%.
| Sex | Number | Average Earnings |
| Male | 7,970 (55.3%) | $95,609 |
| Female | 6,449 (44.7%) | $46,049 |
| Total | 14,419 (100.0%) | $68,647 |
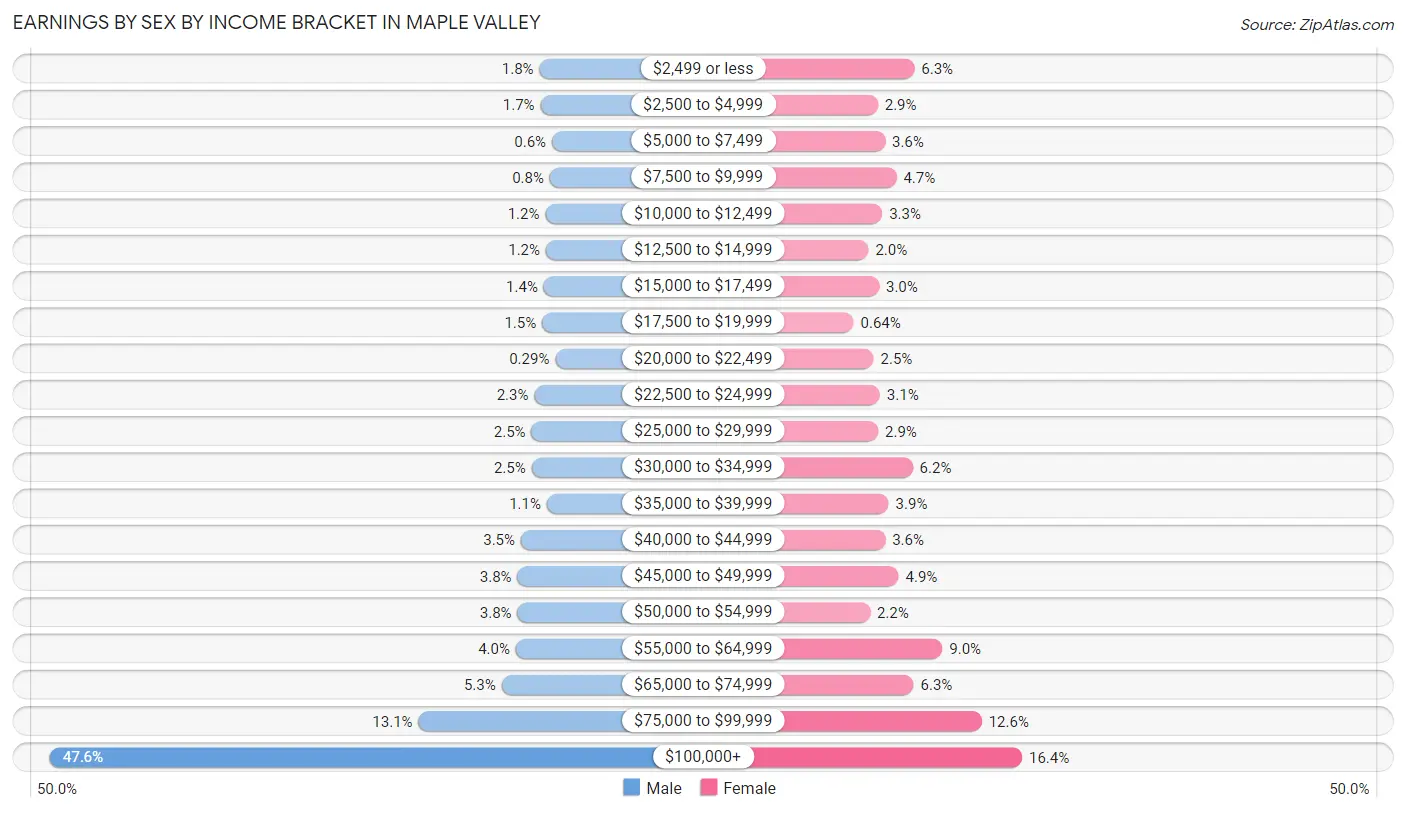
Earnings by Sex by Income Bracket in Maple Valley
The most common earnings brackets in Maple Valley are $100,000+ for men (3,796 | 47.6%) and $100,000+ for women (1,059 | 16.4%).
| Income | Male | Female |
| $2,499 or less | 141 (1.8%) | 408 (6.3%) |
| $2,500 to $4,999 | 134 (1.7%) | 187 (2.9%) |
| $5,000 to $7,499 | 48 (0.6%) | 231 (3.6%) |
| $7,500 to $9,999 | 64 (0.8%) | 300 (4.6%) |
| $10,000 to $12,499 | 97 (1.2%) | 214 (3.3%) |
| $12,500 to $14,999 | 93 (1.2%) | 131 (2.0%) |
| $15,000 to $17,499 | 109 (1.4%) | 195 (3.0%) |
| $17,500 to $19,999 | 122 (1.5%) | 41 (0.6%) |
| $20,000 to $22,499 | 23 (0.3%) | 162 (2.5%) |
| $22,500 to $24,999 | 179 (2.2%) | 200 (3.1%) |
| $25,000 to $29,999 | 201 (2.5%) | 189 (2.9%) |
| $30,000 to $34,999 | 200 (2.5%) | 398 (6.2%) |
| $35,000 to $39,999 | 86 (1.1%) | 253 (3.9%) |
| $40,000 to $44,999 | 280 (3.5%) | 232 (3.6%) |
| $45,000 to $49,999 | 305 (3.8%) | 313 (4.9%) |
| $50,000 to $54,999 | 305 (3.8%) | 140 (2.2%) |
| $55,000 to $64,999 | 318 (4.0%) | 577 (8.9%) |
| $65,000 to $74,999 | 424 (5.3%) | 404 (6.3%) |
| $75,000 to $99,999 | 1,045 (13.1%) | 815 (12.6%) |
| $100,000+ | 3,796 (47.6%) | 1,059 (16.4%) |
| Total | 7,970 (100.0%) | 6,449 (100.0%) |
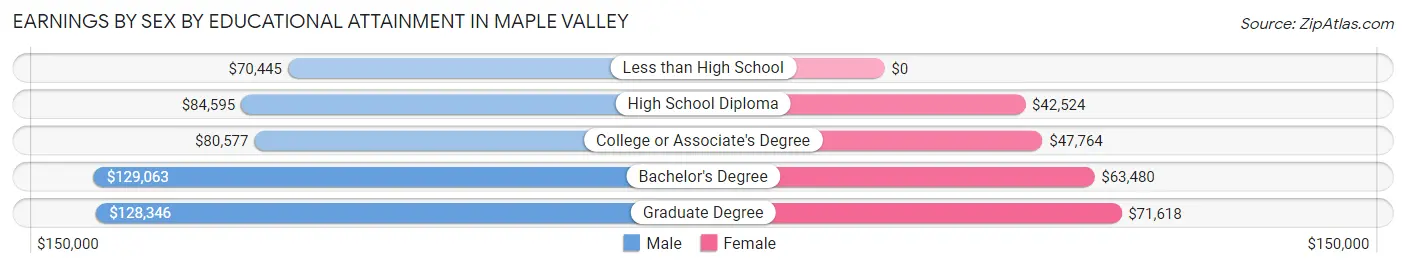
Earnings by Sex by Educational Attainment in Maple Valley
Average earnings in Maple Valley are $106,524 for men and $53,051 for women, a difference of 50.2%. Men with an educational attainment of bachelor's degree enjoy the highest average annual earnings of $129,063, while those with less than high school education earn the least with $70,445. Women with an educational attainment of graduate degree earn the most with the average annual earnings of $71,618, while those with high school diploma education have the smallest earnings of $42,524.
| Educational Attainment | Male Income | Female Income |
| Less than High School | $70,445 | $0 |
| High School Diploma | $84,595 | $42,524 |
| College or Associate's Degree | $80,577 | $47,764 |
| Bachelor's Degree | $129,063 | $63,480 |
| Graduate Degree | $128,346 | $71,618 |
| Total | $106,524 | $53,051 |
Family Income in Maple Valley
Family Income Brackets in Maple Valley
According to the Maple Valley family income data, there are 2,109 families falling into the $200,000+ income range, which is the most common income bracket and makes up 27.5% of all families. Conversely, the $10,000 to $14,999 income bracket is the least frequent group with only 8 families (0.1%) belonging to this category.
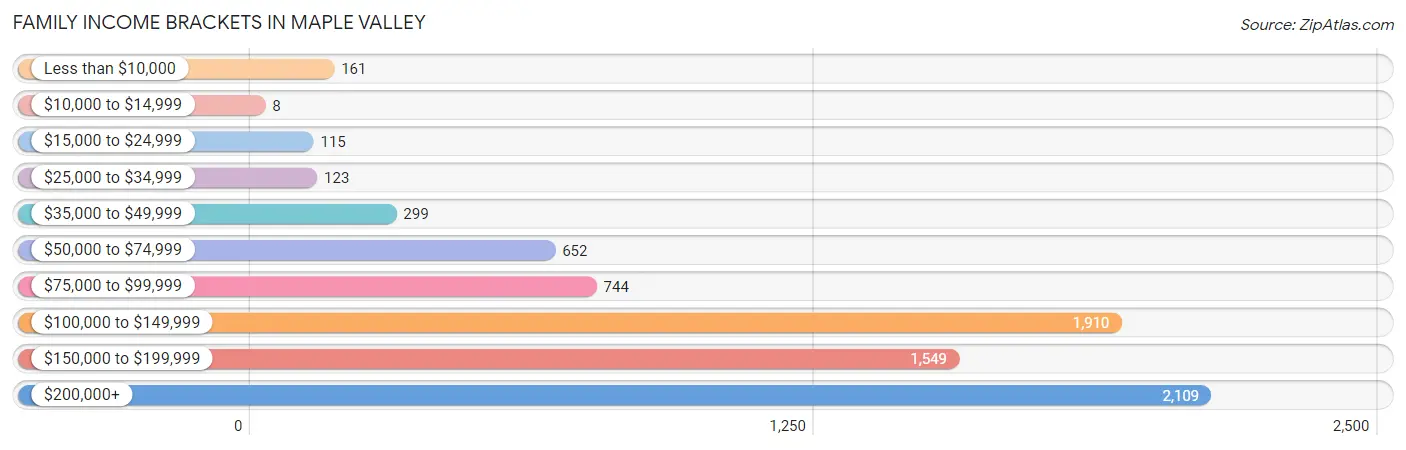
| Income Bracket | # Families | % Families |
| Less than $10,000 | 161 | 2.1% |
| $10,000 to $14,999 | 8 | 0.1% |
| $15,000 to $24,999 | 115 | 1.5% |
| $25,000 to $34,999 | 123 | 1.6% |
| $35,000 to $49,999 | 299 | 3.9% |
| $50,000 to $74,999 | 652 | 8.5% |
| $75,000 to $99,999 | 744 | 9.7% |
| $100,000 to $149,999 | 1,910 | 24.9% |
| $150,000 to $199,999 | 1,549 | 20.2% |
| $200,000+ | 2,109 | 27.5% |
Family Income by Famaliy Size in Maple Valley
6-person families (215 | 2.8%) account for the highest median family income in Maple Valley with $188,482 per family, while 2-person families (2,498 | 32.6%) have the highest median income of $59,756 per family member.
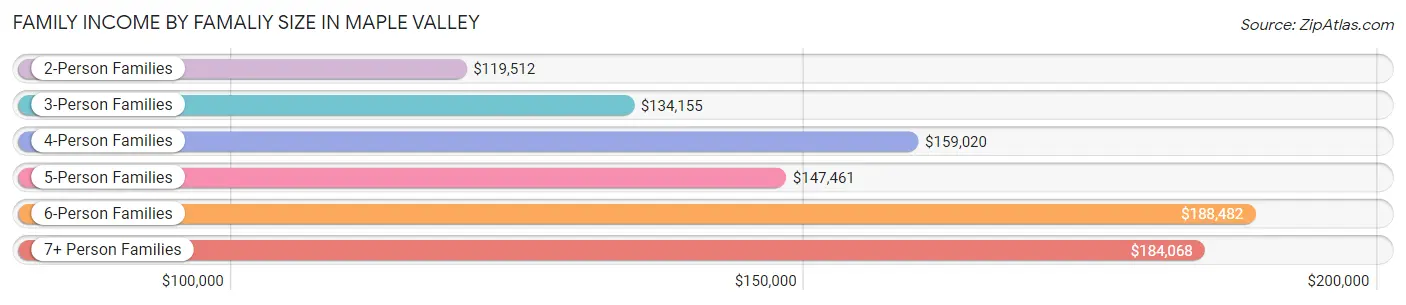
| Income Bracket | # Families | Median Income |
| 2-Person Families | 2,498 (32.6%) | $119,512 |
| 3-Person Families | 1,841 (24.0%) | $134,155 |
| 4-Person Families | 2,043 (26.6%) | $159,020 |
| 5-Person Families | 913 (11.9%) | $147,461 |
| 6-Person Families | 215 (2.8%) | $188,482 |
| 7+ Person Families | 160 (2.1%) | $184,068 |
| Total | 7,670 (100.0%) | $145,105 |
Family Income by Number of Earners in Maple Valley
The median family income in Maple Valley is $145,105, with families comprising 3+ earners (999) having the highest median family income of $199,632, while families with no earners (607) have the lowest median family income of $50,783, accounting for 13.0% and 7.9% of families, respectively.
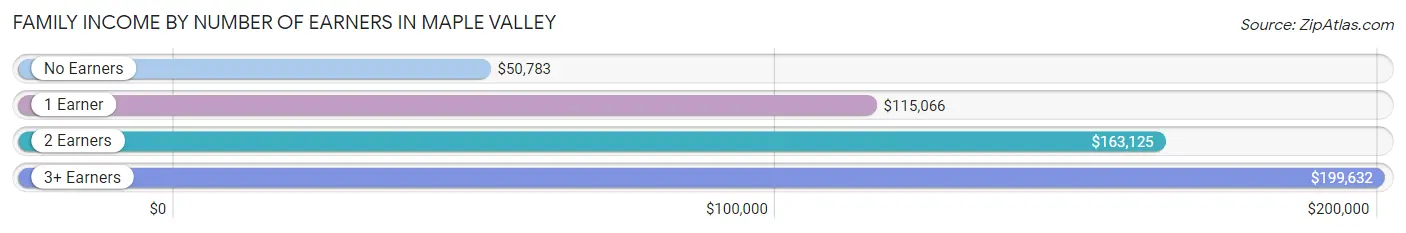
| Number of Earners | # Families | Median Income |
| No Earners | 607 (7.9%) | $50,783 |
| 1 Earner | 2,692 (35.1%) | $115,066 |
| 2 Earners | 3,372 (44.0%) | $163,125 |
| 3+ Earners | 999 (13.0%) | $199,632 |
| Total | 7,670 (100.0%) | $145,105 |
Household Income in Maple Valley
Household Income Brackets in Maple Valley
With 2,280 households falling in the category, the $200,000+ income range is the most frequent in Maple Valley, accounting for 24.8% of all households. In contrast, only 46 households (0.5%) fall into the $10,000 to $14,999 income bracket, making it the least populous group.
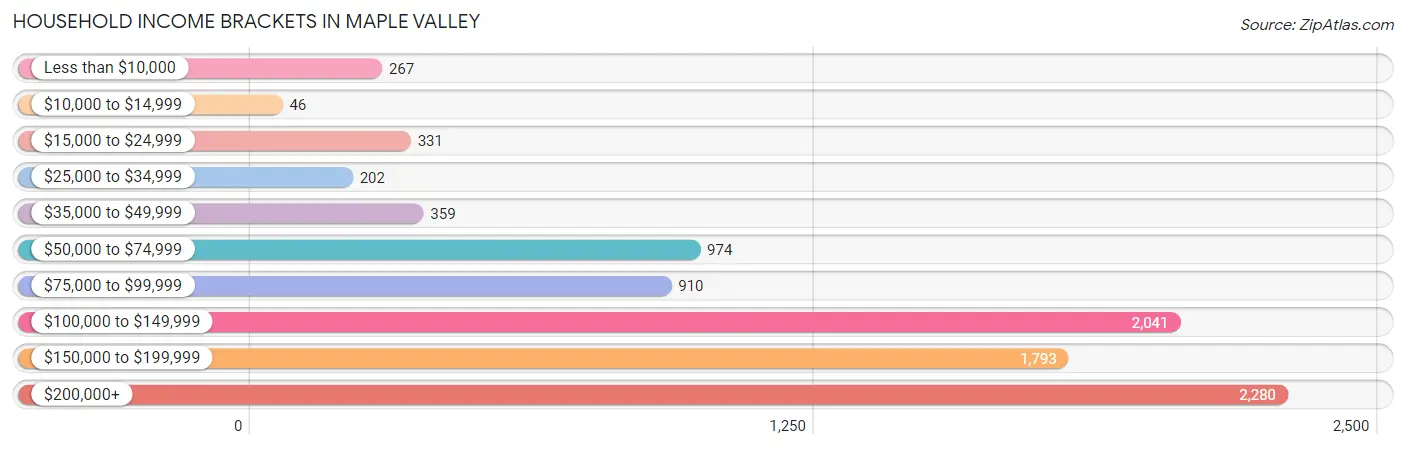
| Income Bracket | # Households | % Households |
| Less than $10,000 | 267 | 2.9% |
| $10,000 to $14,999 | 46 | 0.5% |
| $15,000 to $24,999 | 331 | 3.6% |
| $25,000 to $34,999 | 202 | 2.2% |
| $35,000 to $49,999 | 359 | 3.9% |
| $50,000 to $74,999 | 974 | 10.6% |
| $75,000 to $99,999 | 910 | 9.9% |
| $100,000 to $149,999 | 2,041 | 22.2% |
| $150,000 to $199,999 | 1,793 | 19.5% |
| $200,000+ | 2,280 | 24.8% |
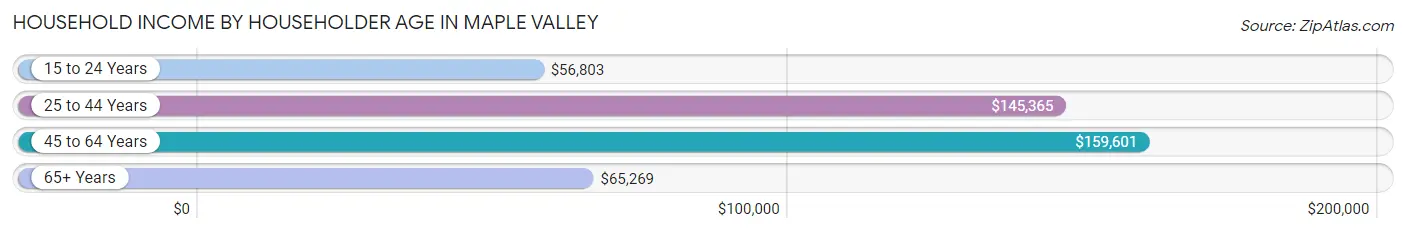
Household Income by Householder Age in Maple Valley
The median household income in Maple Valley is $137,595, with the highest median household income of $159,601 found in the 45 to 64 years age bracket for the primary householder. A total of 3,722 households (40.5%) fall into this category. Meanwhile, the 15 to 24 years age bracket for the primary householder has the lowest median household income of $56,803, with 150 households (1.6%) in this group.
| Income Bracket | # Households | Median Income |
| 15 to 24 Years | 150 (1.6%) | $56,803 |
| 25 to 44 Years | 3,769 (41.0%) | $145,365 |
| 45 to 64 Years | 3,722 (40.5%) | $159,601 |
| 65+ Years | 1,552 (16.9%) | $65,269 |
| Total | 9,193 (100.0%) | $137,595 |
Poverty in Maple Valley
Income Below Poverty by Sex and Age in Maple Valley
With 4.6% poverty level for males and 5.0% for females among the residents of Maple Valley, 5 year old males and 12 to 14 year old females are the most vulnerable to poverty, with 18 males (12.8%) and 157 females (20.5%) in their respective age groups living below the poverty level.
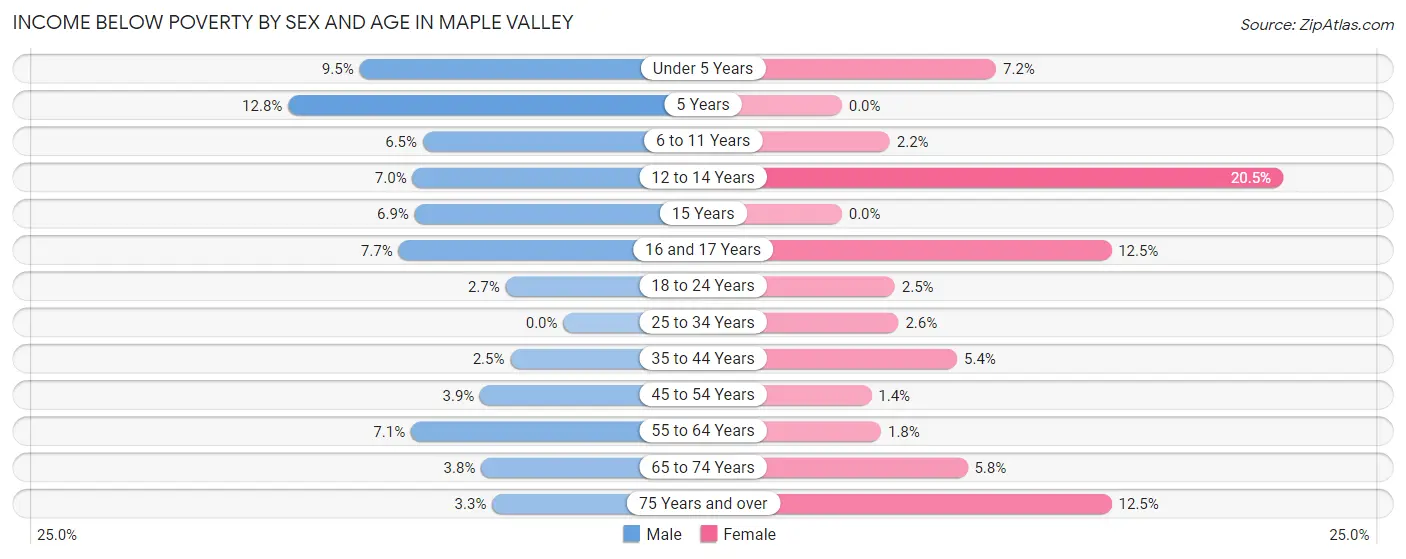
| Age Bracket | Male | Female |
| Under 5 Years | 88 (9.5%) | 68 (7.2%) |
| 5 Years | 18 (12.8%) | 0 (0.0%) |
| 6 to 11 Years | 102 (6.5%) | 41 (2.2%) |
| 12 to 14 Years | 70 (7.0%) | 157 (20.5%) |
| 15 Years | 18 (6.9%) | 0 (0.0%) |
| 16 and 17 Years | 38 (7.6%) | 58 (12.5%) |
| 18 to 24 Years | 29 (2.7%) | 14 (2.5%) |
| 25 to 34 Years | 0 (0.0%) | 35 (2.6%) |
| 35 to 44 Years | 62 (2.5%) | 151 (5.3%) |
| 45 to 54 Years | 78 (3.9%) | 26 (1.4%) |
| 55 to 64 Years | 108 (7.1%) | 24 (1.8%) |
| 65 to 74 Years | 22 (3.8%) | 57 (5.8%) |
| 75 Years and over | 15 (3.3%) | 67 (12.5%) |
| Total | 648 (4.6%) | 698 (5.0%) |
Income Above Poverty by Sex and Age in Maple Valley
According to the poverty statistics in Maple Valley, males aged 25 to 34 years and females aged 5 years are the age groups that are most secure financially, with 100.0% of males and 100.0% of females in these age groups living above the poverty line.
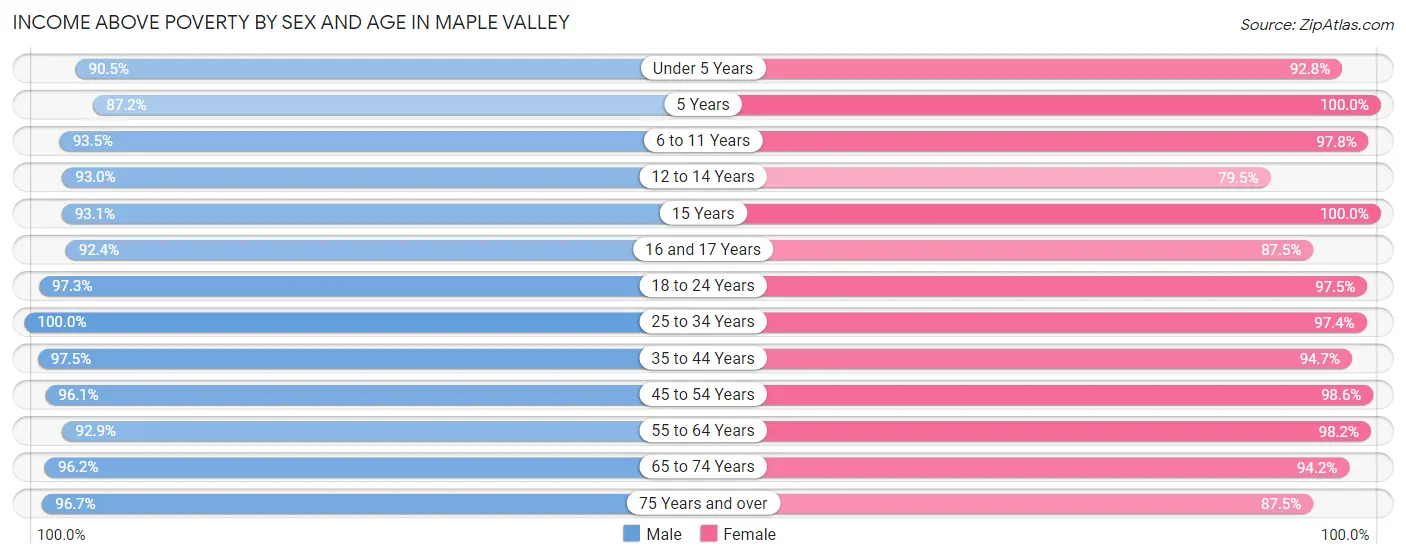
| Age Bracket | Male | Female |
| Under 5 Years | 842 (90.5%) | 882 (92.8%) |
| 5 Years | 123 (87.2%) | 263 (100.0%) |
| 6 to 11 Years | 1,462 (93.5%) | 1,798 (97.8%) |
| 12 to 14 Years | 930 (93.0%) | 610 (79.5%) |
| 15 Years | 243 (93.1%) | 222 (100.0%) |
| 16 and 17 Years | 459 (92.3%) | 406 (87.5%) |
| 18 to 24 Years | 1,054 (97.3%) | 555 (97.5%) |
| 25 to 34 Years | 1,356 (100.0%) | 1,295 (97.4%) |
| 35 to 44 Years | 2,456 (97.5%) | 2,671 (94.7%) |
| 45 to 54 Years | 1,945 (96.1%) | 1,870 (98.6%) |
| 55 to 64 Years | 1,419 (92.9%) | 1,298 (98.2%) |
| 65 to 74 Years | 556 (96.2%) | 920 (94.2%) |
| 75 Years and over | 440 (96.7%) | 468 (87.5%) |
| Total | 13,285 (95.4%) | 13,258 (95.0%) |
Income Below Poverty Among Married-Couple Families in Maple Valley
The poverty statistics for married-couple families in Maple Valley show that 0.9% or 58 of the total 6,419 families live below the poverty line. Families with 3 or 4 children have the highest poverty rate of 1.9%, comprising of 16 families. On the other hand, families with 5 or more children have the lowest poverty rate of 0.0%, which includes 0 families.
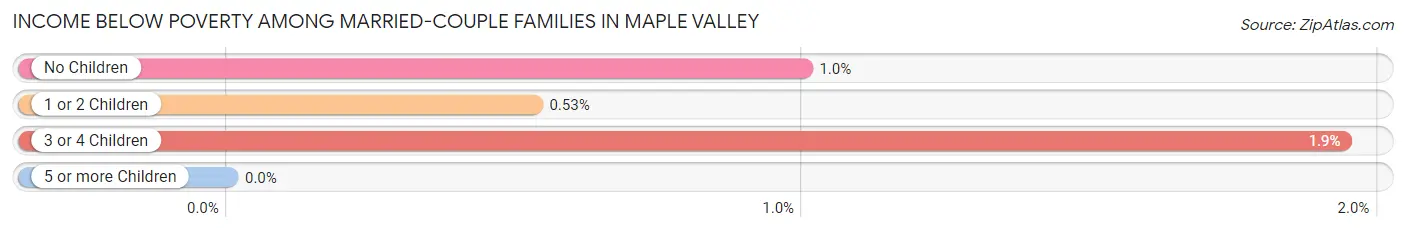
| Children | Above Poverty | Below Poverty |
| No Children | 2,676 (99.0%) | 27 (1.0%) |
| 1 or 2 Children | 2,841 (99.5%) | 15 (0.5%) |
| 3 or 4 Children | 807 (98.1%) | 16 (1.9%) |
| 5 or more Children | 37 (100.0%) | 0 (0.0%) |
| Total | 6,361 (99.1%) | 58 (0.9%) |
Income Below Poverty Among Single-Parent Households in Maple Valley
According to the poverty data in Maple Valley, 26.7% or 73 single-father households and 14.8% or 145 single-mother households are living below the poverty line. Among single-father households, those with 1 or 2 children have the highest poverty rate, with 73 households (29.3%) experiencing poverty. Likewise, among single-mother households, those with 5 or more children have the highest poverty rate, with 17 households (100.0%) falling below the poverty line.
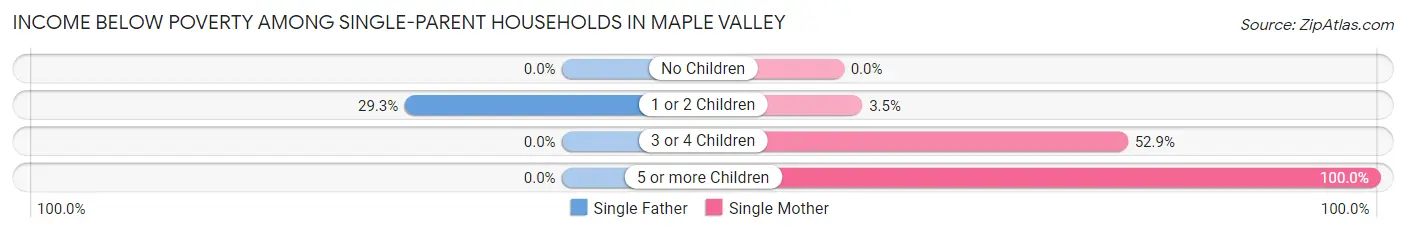
| Children | Single Father | Single Mother |
| No Children | 0 (0.0%) | 0 (0.0%) |
| 1 or 2 Children | 73 (29.3%) | 19 (3.5%) |
| 3 or 4 Children | 0 (0.0%) | 109 (52.9%) |
| 5 or more Children | 0 (0.0%) | 17 (100.0%) |
| Total | 73 (26.7%) | 145 (14.8%) |
Income Below Poverty Among Married-Couple vs Single-Parent Households in Maple Valley
The poverty data for Maple Valley shows that 58 of the married-couple family households (0.9%) and 218 of the single-parent households (17.4%) are living below the poverty level. Within the married-couple family households, those with 3 or 4 children have the highest poverty rate, with 16 households (1.9%) falling below the poverty line. Among the single-parent households, those with 5 or more children have the highest poverty rate, with 17 household (100.0%) living below poverty.
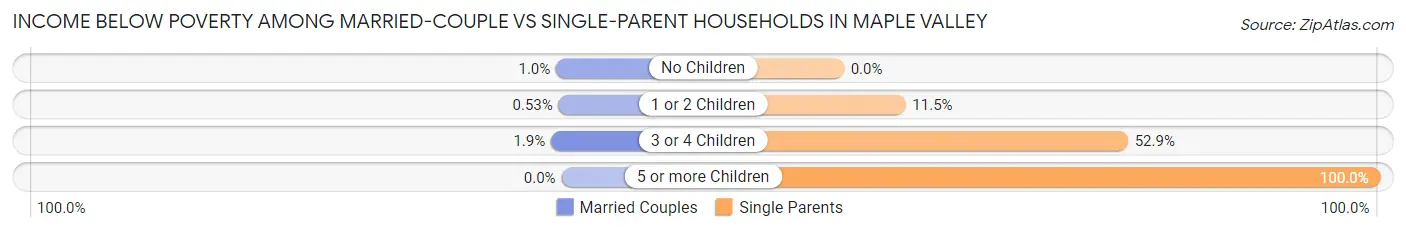
| Children | Married-Couple Families | Single-Parent Households |
| No Children | 27 (1.0%) | 0 (0.0%) |
| 1 or 2 Children | 15 (0.5%) | 92 (11.5%) |
| 3 or 4 Children | 16 (1.9%) | 109 (52.9%) |
| 5 or more Children | 0 (0.0%) | 17 (100.0%) |
| Total | 58 (0.9%) | 218 (17.4%) |
Race in Maple Valley
The most populous races in Maple Valley are White / Caucasian (21,401 | 76.7%), Asian (3,115 | 11.2%), and Two or more Races (2,395 | 8.6%).
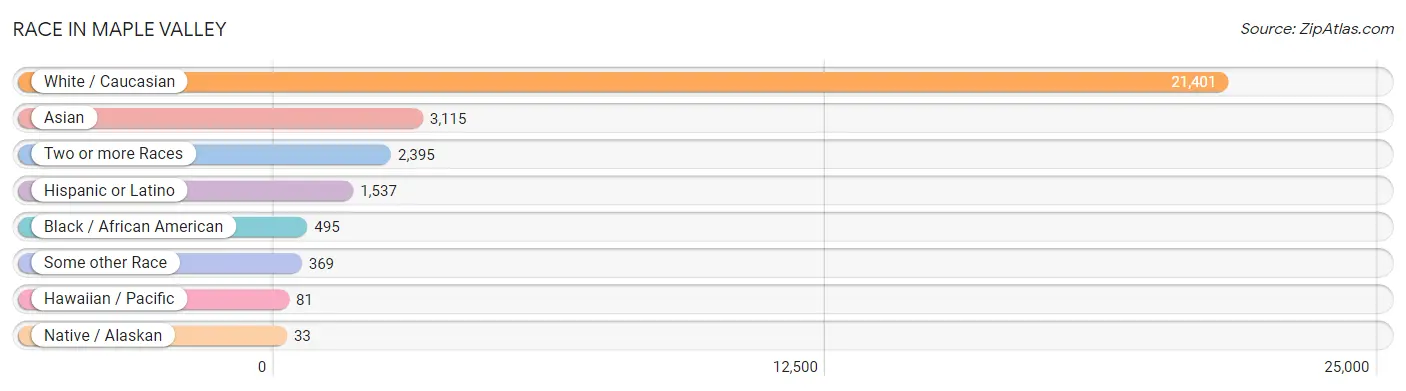
| Race | # Population | % Population |
| Asian | 3,115 | 11.2% |
| Black / African American | 495 | 1.8% |
| Hawaiian / Pacific | 81 | 0.3% |
| Hispanic or Latino | 1,537 | 5.5% |
| Native / Alaskan | 33 | 0.1% |
| White / Caucasian | 21,401 | 76.7% |
| Two or more Races | 2,395 | 8.6% |
| Some other Race | 369 | 1.3% |
| Total | 27,889 | 100.0% |
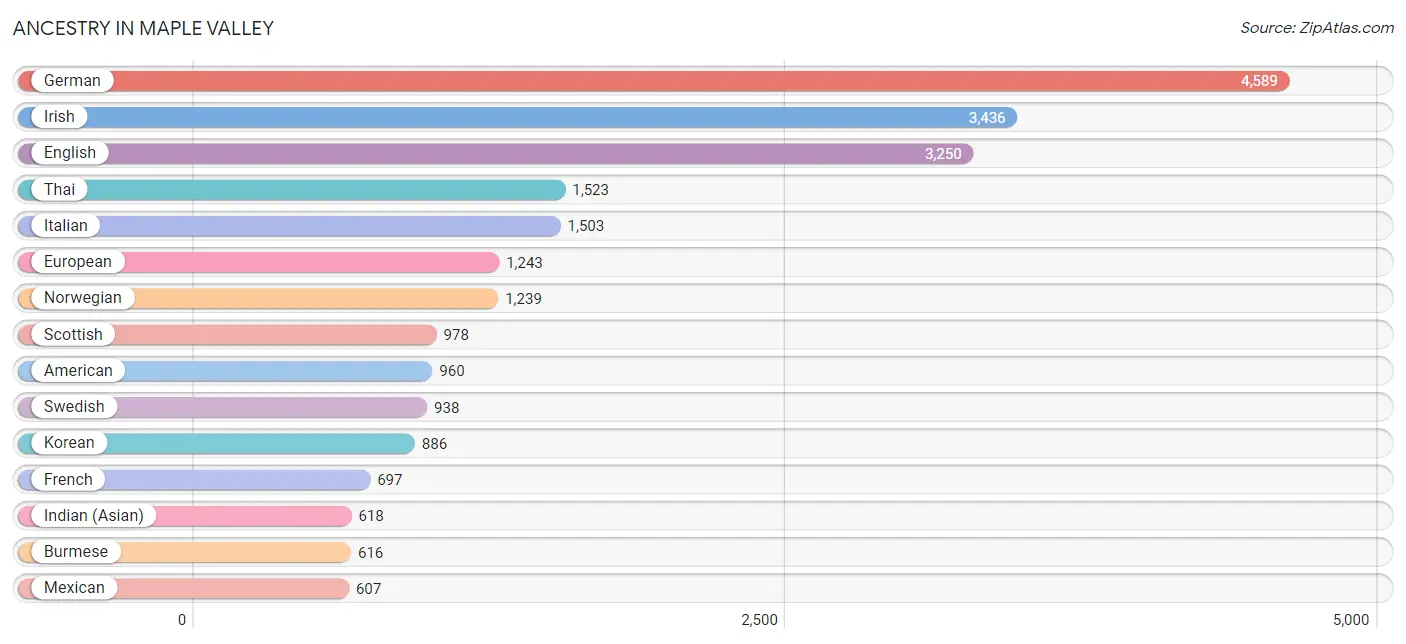
Ancestry in Maple Valley
The most populous ancestries reported in Maple Valley are German (4,589 | 16.5%), Irish (3,436 | 12.3%), English (3,250 | 11.7%), Thai (1,523 | 5.5%), and Italian (1,503 | 5.4%), together accounting for 51.3% of all Maple Valley residents.
| Ancestry | # Population | % Population |
| African | 36 | 0.1% |
| American | 960 | 3.4% |
| Arab | 277 | 1.0% |
| Argentinean | 19 | 0.1% |
| Armenian | 15 | 0.1% |
| Australian | 34 | 0.1% |
| Austrian | 110 | 0.4% |
| Basque | 18 | 0.1% |
| Belgian | 24 | 0.1% |
| Bhutanese | 419 | 1.5% |
| Blackfeet | 61 | 0.2% |
| Brazilian | 42 | 0.2% |
| British | 263 | 0.9% |
| Burmese | 616 | 2.2% |
| Cambodian | 35 | 0.1% |
| Canadian | 58 | 0.2% |
| Celtic | 35 | 0.1% |
| Central American | 213 | 0.8% |
| Cherokee | 44 | 0.2% |
| Chickasaw | 17 | 0.1% |
| Chippewa | 32 | 0.1% |
| Croatian | 58 | 0.2% |
| Cuban | 44 | 0.2% |
| Czech | 48 | 0.2% |
| Czechoslovakian | 59 | 0.2% |
| Danish | 326 | 1.2% |
| Dutch | 516 | 1.8% |
| Eastern European | 128 | 0.5% |
| Ecuadorian | 130 | 0.5% |
| Egyptian | 34 | 0.1% |
| English | 3,250 | 11.7% |
| Ethiopian | 13 | 0.1% |
| European | 1,243 | 4.5% |
| Filipino | 124 | 0.4% |
| Finnish | 107 | 0.4% |
| French | 697 | 2.5% |
| French Canadian | 132 | 0.5% |
| German | 4,589 | 16.5% |
| Greek | 52 | 0.2% |
| Guatemalan | 92 | 0.3% |
| Hungarian | 9 | 0.0% |
| Icelander | 56 | 0.2% |
| Indian (Asian) | 618 | 2.2% |
| Iranian | 62 | 0.2% |
| Iraqi | 25 | 0.1% |
| Irish | 3,436 | 12.3% |
| Israeli | 18 | 0.1% |
| Italian | 1,503 | 5.4% |
| Jamaican | 40 | 0.1% |
| Japanese | 81 | 0.3% |
| Kenyan | 64 | 0.2% |
| Korean | 886 | 3.2% |
| Lebanese | 33 | 0.1% |
| Lithuanian | 122 | 0.4% |
| Luxembourger | 13 | 0.1% |
| Malaysian | 92 | 0.3% |
| Mexican | 607 | 2.2% |
| Mexican American Indian | 5 | 0.0% |
| Native Hawaiian | 197 | 0.7% |
| Northern European | 100 | 0.4% |
| Norwegian | 1,239 | 4.4% |
| Pakistani | 4 | 0.0% |
| Panamanian | 121 | 0.4% |
| Polish | 584 | 2.1% |
| Portuguese | 10 | 0.0% |
| Puerto Rican | 72 | 0.3% |
| Puget Sound Salish | 15 | 0.1% |
| Romanian | 18 | 0.1% |
| Russian | 506 | 1.8% |
| Samoan | 12 | 0.0% |
| Scandinavian | 557 | 2.0% |
| Scotch-Irish | 295 | 1.1% |
| Scottish | 978 | 3.5% |
| Sioux | 15 | 0.1% |
| South American | 223 | 0.8% |
| South American Indian | 6 | 0.0% |
| Spaniard | 200 | 0.7% |
| Spanish | 28 | 0.1% |
| Sri Lankan | 147 | 0.5% |
| Subsaharan African | 113 | 0.4% |
| Swedish | 938 | 3.4% |
| Swiss | 52 | 0.2% |
| Syrian | 60 | 0.2% |
| Thai | 1,523 | 5.5% |
| Trinidadian and Tobagonian | 30 | 0.1% |
| Turkish | 74 | 0.3% |
| Ukrainian | 106 | 0.4% |
| Venezuelan | 74 | 0.3% |
| Welsh | 304 | 1.1% |
| Yugoslavian | 62 | 0.2% | View All 90 Rows |
Immigrants in Maple Valley
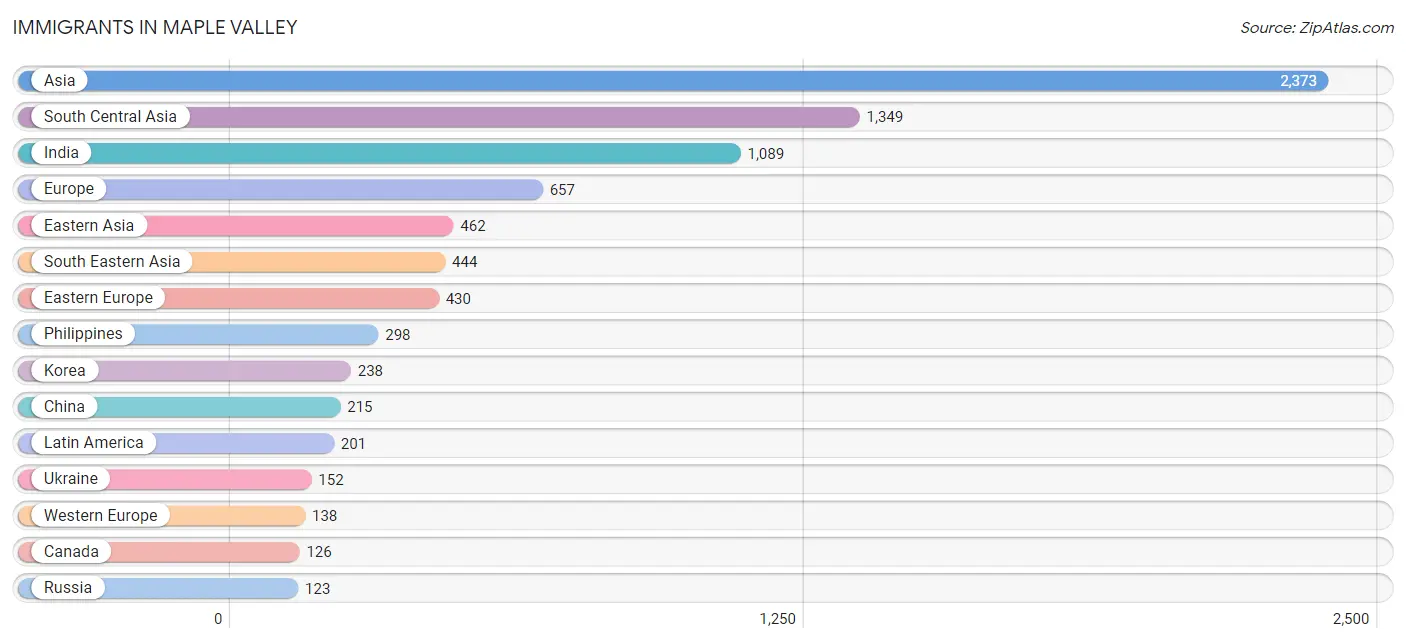
The most numerous immigrant groups reported in Maple Valley came from Asia (2,373 | 8.5%), South Central Asia (1,349 | 4.8%), India (1,089 | 3.9%), Europe (657 | 2.4%), and Eastern Asia (462 | 1.7%), together accounting for 21.3% of all Maple Valley residents.
| Immigration Origin | # Population | % Population |
| Afghanistan | 15 | 0.1% |
| Africa | 81 | 0.3% |
| Argentina | 19 | 0.1% |
| Asia | 2,373 | 8.5% |
| Australia | 23 | 0.1% |
| Belarus | 28 | 0.1% |
| Bosnia and Herzegovina | 24 | 0.1% |
| Brazil | 42 | 0.2% |
| Cambodia | 22 | 0.1% |
| Canada | 126 | 0.4% |
| Caribbean | 11 | 0.0% |
| Central America | 105 | 0.4% |
| China | 215 | 0.8% |
| Denmark | 15 | 0.1% |
| Eastern Africa | 46 | 0.2% |
| Eastern Asia | 462 | 1.7% |
| Eastern Europe | 430 | 1.5% |
| Egypt | 20 | 0.1% |
| England | 35 | 0.1% |
| Ethiopia | 13 | 0.1% |
| Europe | 657 | 2.4% |
| France | 21 | 0.1% |
| Germany | 99 | 0.4% |
| Hong Kong | 35 | 0.1% |
| India | 1,089 | 3.9% |
| Iran | 40 | 0.1% |
| Iraq | 25 | 0.1% |
| Israel | 33 | 0.1% |
| Italy | 32 | 0.1% |
| Japan | 9 | 0.0% |
| Kazakhstan | 11 | 0.0% |
| Kenya | 33 | 0.1% |
| Korea | 238 | 0.9% |
| Kuwait | 8 | 0.0% |
| Laos | 24 | 0.1% |
| Latin America | 201 | 0.7% |
| Latvia | 6 | 0.0% |
| Mexico | 105 | 0.4% |
| Nepal | 18 | 0.1% |
| Northern Africa | 35 | 0.1% |
| Northern Europe | 57 | 0.2% |
| Norway | 7 | 0.0% |
| Oceania | 56 | 0.2% |
| Pakistan | 58 | 0.2% |
| Philippines | 298 | 1.1% |
| Poland | 55 | 0.2% |
| Romania | 8 | 0.0% |
| Russia | 123 | 0.4% |
| Singapore | 29 | 0.1% |
| South America | 85 | 0.3% |
| South Central Asia | 1,349 | 4.8% |
| South Eastern Asia | 444 | 1.6% |
| Southern Europe | 32 | 0.1% |
| Switzerland | 18 | 0.1% |
| Syria | 22 | 0.1% |
| Taiwan | 59 | 0.2% |
| Thailand | 4 | 0.0% |
| Trinidad and Tobago | 11 | 0.0% |
| Turkey | 30 | 0.1% |
| Ukraine | 152 | 0.5% |
| Uzbekistan | 118 | 0.4% |
| Venezuela | 24 | 0.1% |
| Vietnam | 67 | 0.2% |
| Western Asia | 118 | 0.4% |
| Western Europe | 138 | 0.5% | View All 65 Rows |
Sex and Age in Maple Valley
Sex and Age in Maple Valley
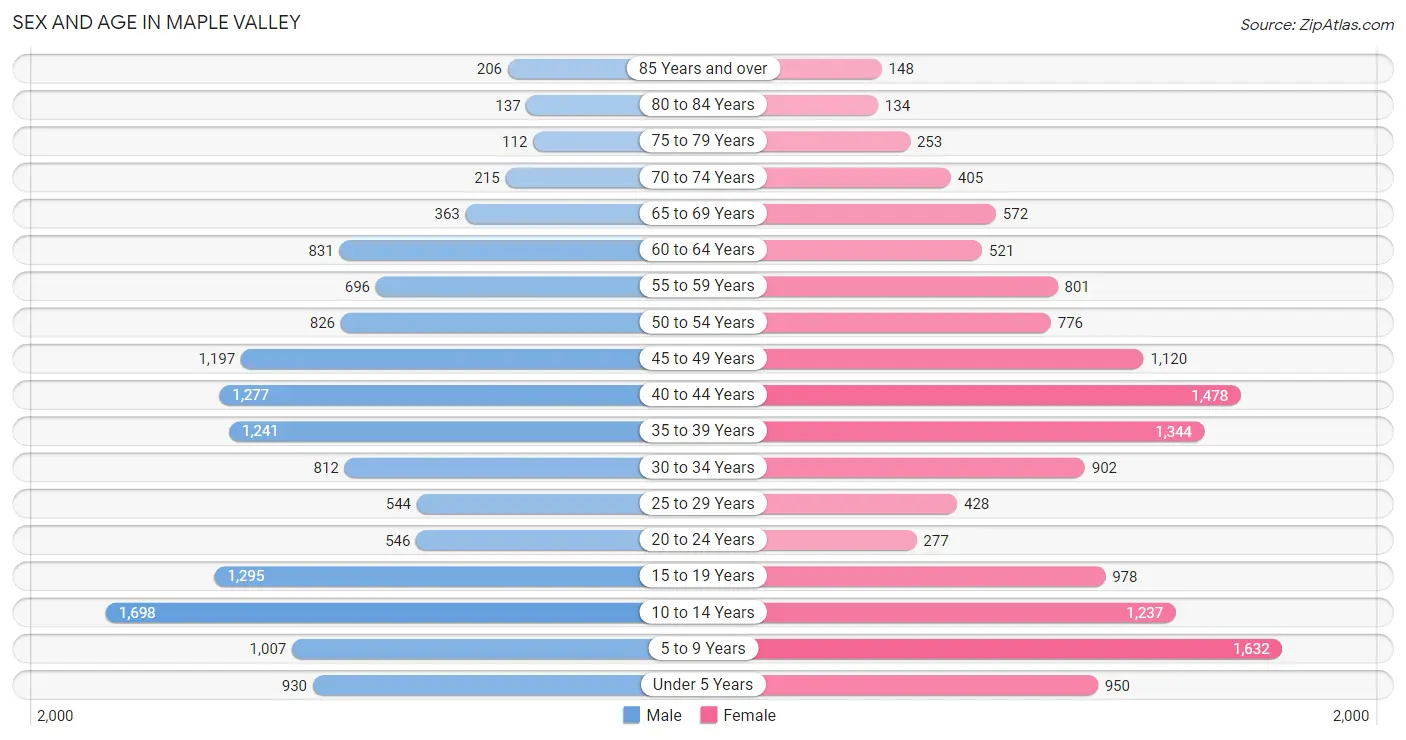
The most populous age groups in Maple Valley are 10 to 14 Years (1,698 | 12.2%) for men and 5 to 9 Years (1,632 | 11.7%) for women.
| Age Bracket | Male | Female |
| Under 5 Years | 930 (6.7%) | 950 (6.8%) |
| 5 to 9 Years | 1,007 (7.2%) | 1,632 (11.7%) |
| 10 to 14 Years | 1,698 (12.2%) | 1,237 (8.9%) |
| 15 to 19 Years | 1,295 (9.3%) | 978 (7.0%) |
| 20 to 24 Years | 546 (3.9%) | 277 (2.0%) |
| 25 to 29 Years | 544 (3.9%) | 428 (3.1%) |
| 30 to 34 Years | 812 (5.8%) | 902 (6.5%) |
| 35 to 39 Years | 1,241 (8.9%) | 1,344 (9.6%) |
| 40 to 44 Years | 1,277 (9.2%) | 1,478 (10.6%) |
| 45 to 49 Years | 1,197 (8.6%) | 1,120 (8.0%) |
| 50 to 54 Years | 826 (5.9%) | 776 (5.6%) |
| 55 to 59 Years | 696 (5.0%) | 801 (5.7%) |
| 60 to 64 Years | 831 (6.0%) | 521 (3.7%) |
| 65 to 69 Years | 363 (2.6%) | 572 (4.1%) |
| 70 to 74 Years | 215 (1.5%) | 405 (2.9%) |
| 75 to 79 Years | 112 (0.8%) | 253 (1.8%) |
| 80 to 84 Years | 137 (1.0%) | 134 (1.0%) |
| 85 Years and over | 206 (1.5%) | 148 (1.1%) |
| Total | 13,933 (100.0%) | 13,956 (100.0%) |
Families and Households in Maple Valley
Median Family Size in Maple Valley
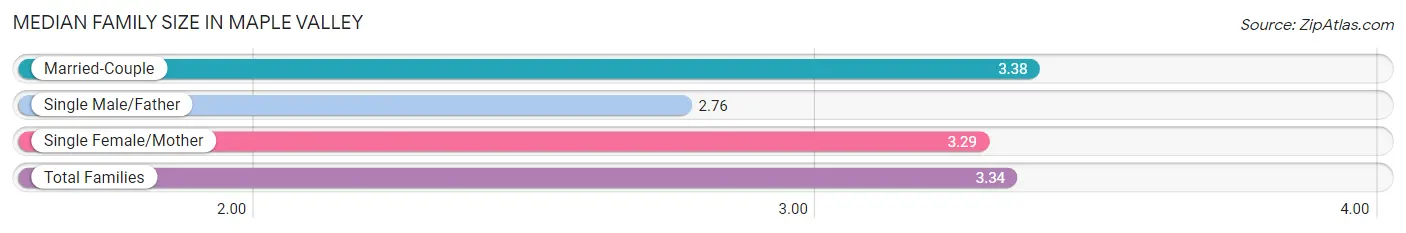
The median family size in Maple Valley is 3.34 persons per family, with married-couple families (6,419 | 83.7%) accounting for the largest median family size of 3.38 persons per family. On the other hand, single male/father families (273 | 3.6%) represent the smallest median family size with 2.76 persons per family.
| Family Type | # Families | Family Size |
| Married-Couple | 6,419 (83.7%) | 3.38 |
| Single Male/Father | 273 (3.6%) | 2.76 |
| Single Female/Mother | 978 (12.8%) | 3.29 |
| Total Families | 7,670 (100.0%) | 3.34 |
Median Household Size in Maple Valley
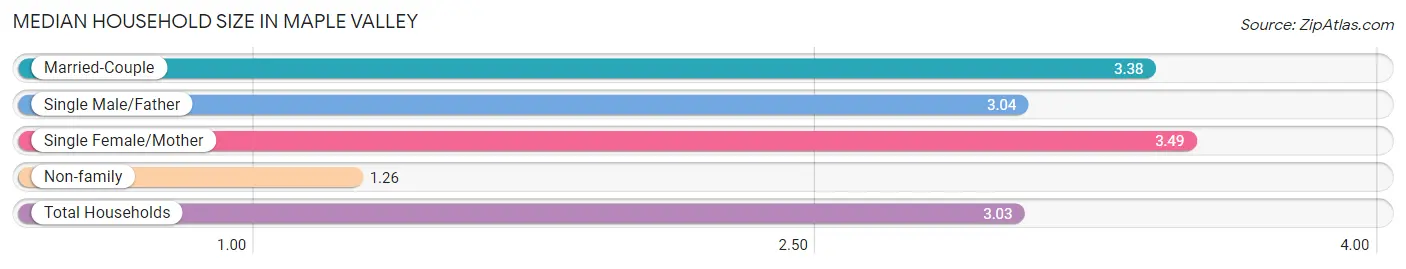
The median household size in Maple Valley is 3.03 persons per household, with single female/mother households (978 | 10.6%) accounting for the largest median household size of 3.49 persons per household. non-family households (1,523 | 16.6%) represent the smallest median household size with 1.26 persons per household.
| Household Type | # Households | Household Size |
| Married-Couple | 6,419 (69.8%) | 3.38 |
| Single Male/Father | 273 (3.0%) | 3.04 |
| Single Female/Mother | 978 (10.6%) | 3.49 |
| Non-family | 1,523 (16.6%) | 1.26 |
| Total Households | 9,193 (100.0%) | 3.03 |
Household Size by Marriage Status in Maple Valley
Out of a total of 9,193 households in Maple Valley, 7,670 (83.4%) are family households, while 1,523 (16.6%) are nonfamily households. The most numerous type of family households are 2-person households, comprising 2,403, and the most common type of nonfamily households are 1-person households, comprising 1,186.
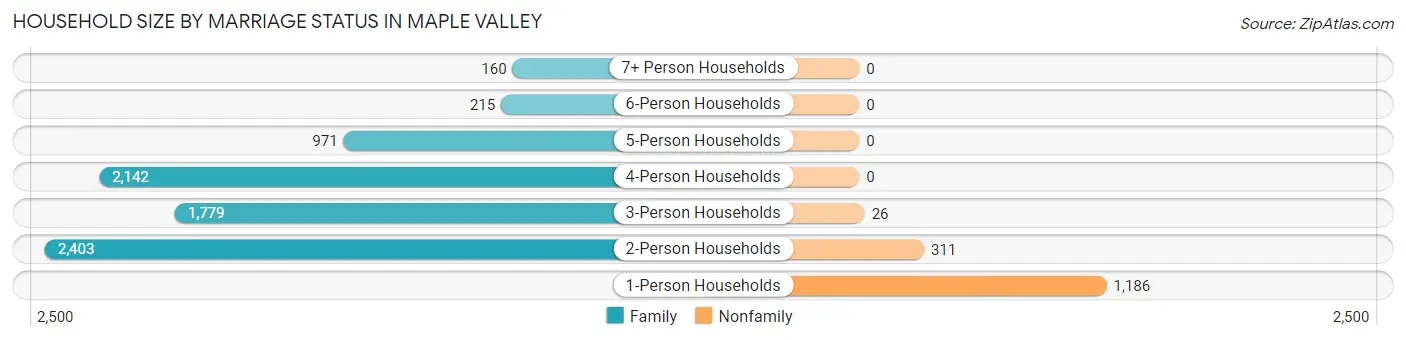
| Household Size | Family Households | Nonfamily Households |
| 1-Person Households | - | 1,186 (12.9%) |
| 2-Person Households | 2,403 (26.1%) | 311 (3.4%) |
| 3-Person Households | 1,779 (19.4%) | 26 (0.3%) |
| 4-Person Households | 2,142 (23.3%) | 0 (0.0%) |
| 5-Person Households | 971 (10.6%) | 0 (0.0%) |
| 6-Person Households | 215 (2.3%) | 0 (0.0%) |
| 7+ Person Households | 160 (1.7%) | 0 (0.0%) |
| Total | 7,670 (83.4%) | 1,523 (16.6%) |
Female Fertility in Maple Valley
Fertility by Age in Maple Valley
Average fertility rate in Maple Valley is 58.0 births per 1,000 women. Women in the age bracket of 20 to 34 years have the highest fertility rate with 144.0 births per 1,000 women. Women in the age bracket of 20 to 34 years acount for 60.9% of all women with births.
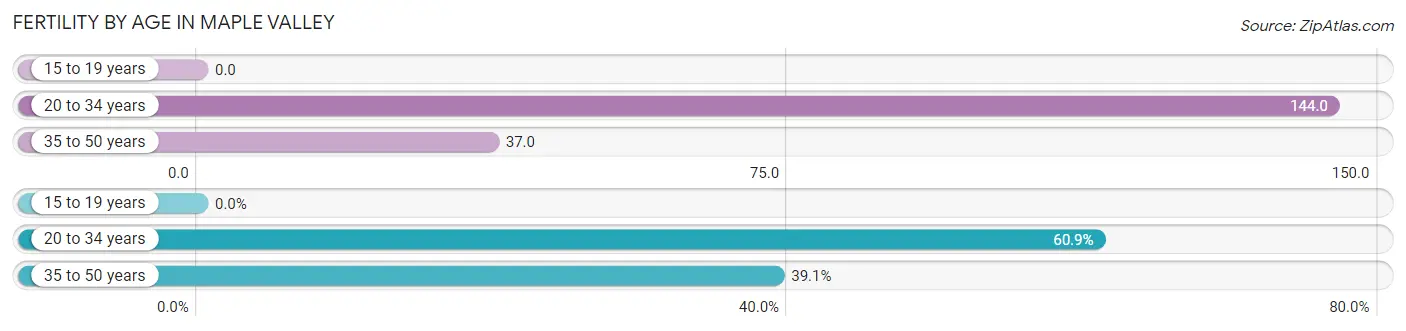
| Age Bracket | Women with Births | Births / 1,000 Women |
| 15 to 19 years | 0 (0.0%) | 0.0 |
| 20 to 34 years | 232 (60.9%) | 144.0 |
| 35 to 50 years | 149 (39.1%) | 37.0 |
| Total | 381 (100.0%) | 58.0 |
Fertility by Age by Marriage Status in Maple Valley
79.3% of women with births (381) in Maple Valley are married. The highest percentage of unmarried women with births falls into 35 to 50 years age bracket with 29.5% of them unmarried at the time of birth, while the lowest percentage of unmarried women with births belong to 20 to 34 years age bracket with 15.1% of them unmarried.
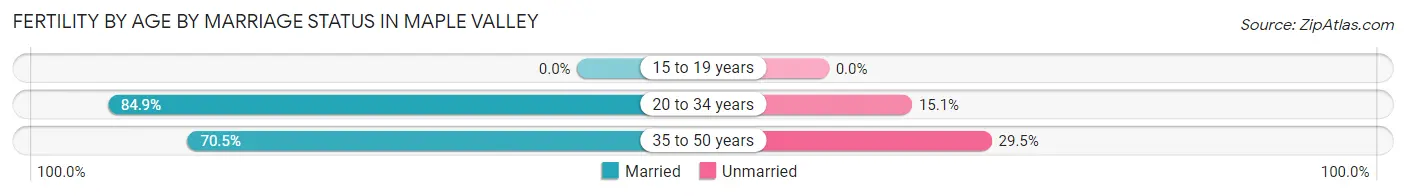
| Age Bracket | Married | Unmarried |
| 15 to 19 years | 0 (0.0%) | 0 (0.0%) |
| 20 to 34 years | 197 (84.9%) | 35 (15.1%) |
| 35 to 50 years | 105 (70.5%) | 44 (29.5%) |
| Total | 302 (79.3%) | 79 (20.7%) |
Fertility by Education in Maple Valley
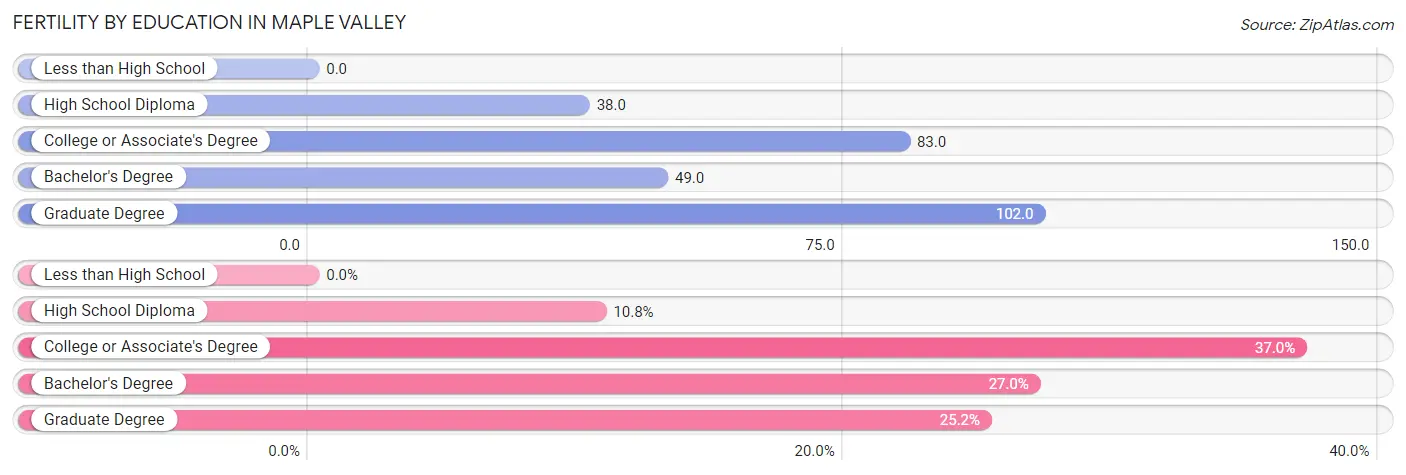
| Educational Attainment | Women with Births | Births / 1,000 Women |
| Less than High School | 0 (0.0%) | 0.0 |
| High School Diploma | 41 (10.8%) | 38.0 |
| College or Associate's Degree | 141 (37.0%) | 83.0 |
| Bachelor's Degree | 103 (27.0%) | 49.0 |
| Graduate Degree | 96 (25.2%) | 102.0 |
| Total | 381 (100.0%) | 58.0 |
Fertility by Education by Marriage Status in Maple Valley
20.7% of women with births in Maple Valley are unmarried. Women with the educational attainment of graduate degree are most likely to be married with 100.0% of them married at childbirth, while women with the educational attainment of high school diploma are least likely to be married with 48.8% of them unmarried at childbirth.
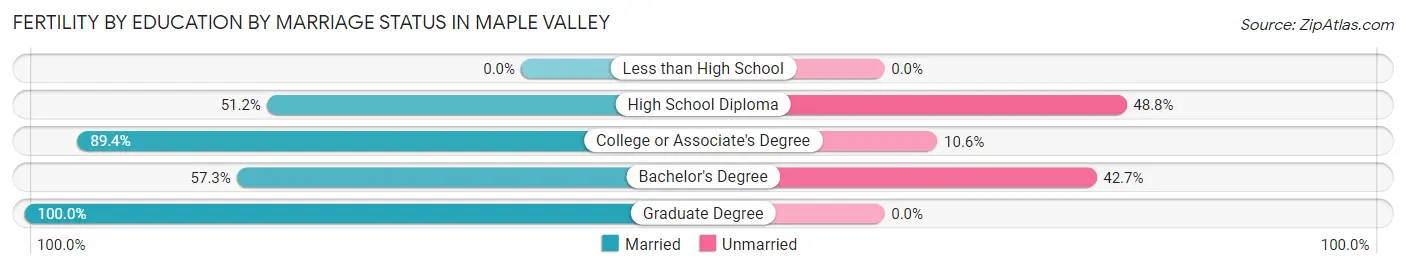
| Educational Attainment | Married | Unmarried |
| Less than High School | 0 (0.0%) | 0 (0.0%) |
| High School Diploma | 21 (51.2%) | 20 (48.8%) |
| College or Associate's Degree | 126 (89.4%) | 15 (10.6%) |
| Bachelor's Degree | 59 (57.3%) | 44 (42.7%) |
| Graduate Degree | 96 (100.0%) | 0 (0.0%) |
| Total | 302 (79.3%) | 79 (20.7%) |
Employment Characteristics in Maple Valley
Employment by Class of Employer in Maple Valley
Among the 13,080 employed individuals in Maple Valley, private company employees (8,813 | 67.4%), local government employees (1,501 | 11.5%), and not-for-profit organizations (902 | 6.9%) make up the most common classes of employment.
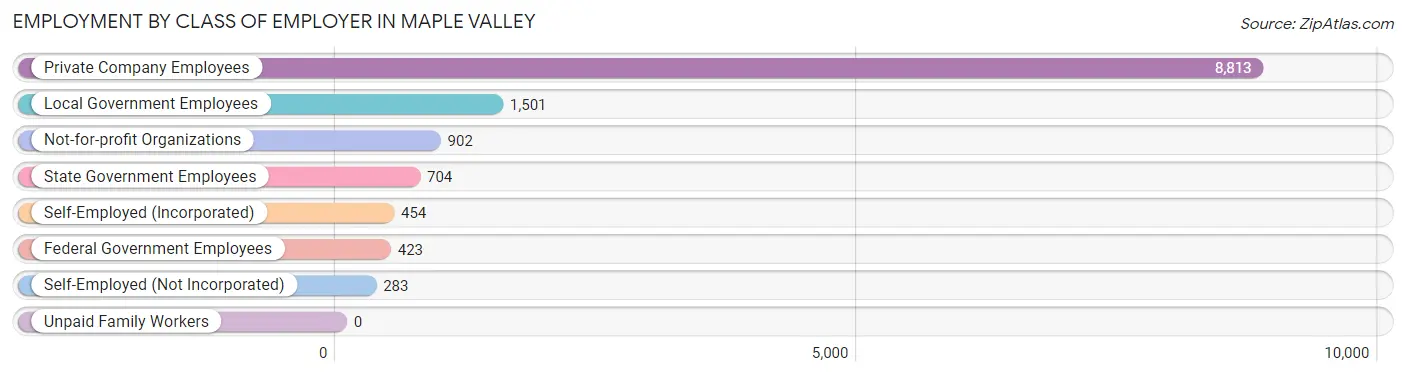
| Employer Class | # Employees | % Employees |
| Private Company Employees | 8,813 | 67.4% |
| Self-Employed (Incorporated) | 454 | 3.5% |
| Self-Employed (Not Incorporated) | 283 | 2.2% |
| Not-for-profit Organizations | 902 | 6.9% |
| Local Government Employees | 1,501 | 11.5% |
| State Government Employees | 704 | 5.4% |
| Federal Government Employees | 423 | 3.2% |
| Unpaid Family Workers | 0 | 0.0% |
| Total | 13,080 | 100.0% |
Employment Status by Age in Maple Valley
According to the labor force statistics for Maple Valley, out of the total population over 16 years of age (19,952), 70.5% or 14,066 individuals are in the labor force, with 4.9% or 689 of them unemployed. The age group with the highest labor force participation rate is 20 to 24 years, with 88.1% or 725 individuals in the labor force. Within the labor force, the 16 to 19 years age range has the highest percentage of unemployed individuals, with 17.0% or 129 of them being unemployed.
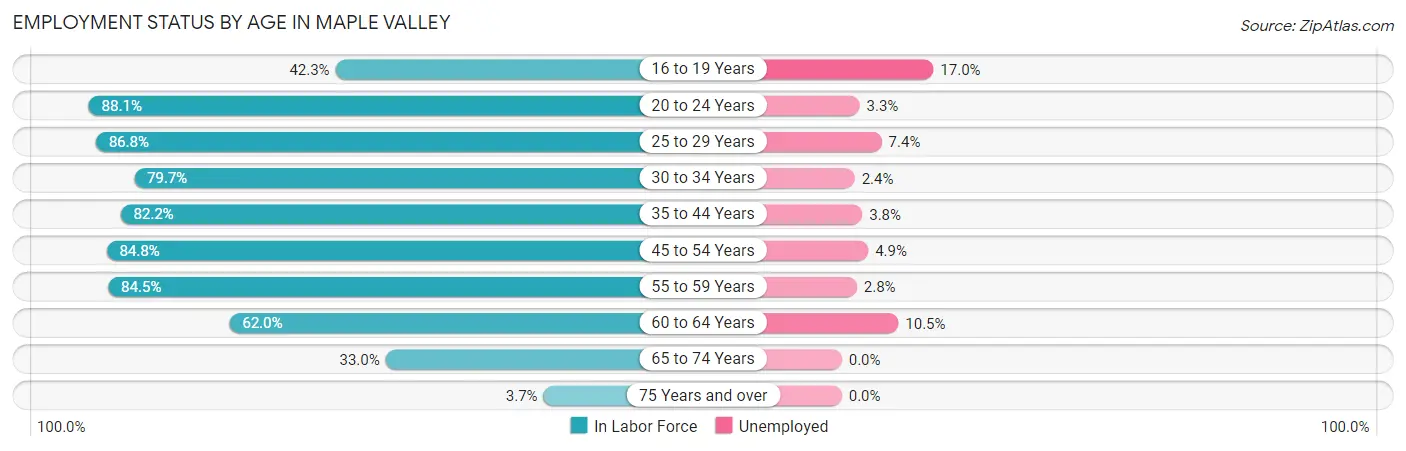
| Age Bracket | In Labor Force | Unemployed |
| 16 to 19 Years | 757 (42.3%) | 129 (17.0%) |
| 20 to 24 Years | 725 (88.1%) | 24 (3.3%) |
| 25 to 29 Years | 844 (86.8%) | 62 (7.4%) |
| 30 to 34 Years | 1,366 (79.7%) | 33 (2.4%) |
| 35 to 44 Years | 4,389 (82.2%) | 167 (3.8%) |
| 45 to 54 Years | 3,323 (84.8%) | 163 (4.9%) |
| 55 to 59 Years | 1,265 (84.5%) | 35 (2.8%) |
| 60 to 64 Years | 838 (62.0%) | 88 (10.5%) |
| 65 to 74 Years | 513 (33.0%) | 0 (0.0%) |
| 75 Years and over | 37 (3.7%) | 0 (0.0%) |
| Total | 14,066 (70.5%) | 689 (4.9%) |
Employment Status by Educational Attainment in Maple Valley
According to labor force statistics for Maple Valley, 81.3% of individuals (12,028) out of the total population between 25 and 64 years of age (14,794) are in the labor force, with 4.6% or 553 of them being unemployed. The group with the highest labor force participation rate are those with the educational attainment of less than high school, with 83.9% or 359 individuals in the labor force. Within the labor force, individuals with college / associate degree education have the highest percentage of unemployment, with 6.8% or 243 of them being unemployed.
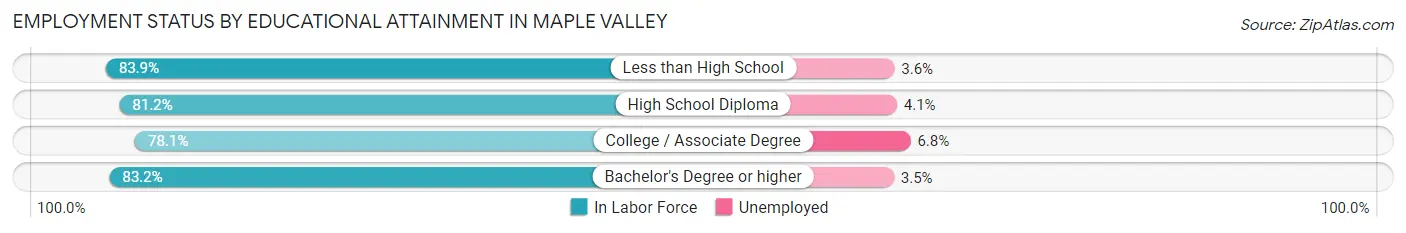
| Educational Attainment | In Labor Force | Unemployed |
| Less than High School | 359 (83.9%) | 15 (3.6%) |
| High School Diploma | 1,990 (81.2%) | 100 (4.1%) |
| College / Associate Degree | 3,577 (78.1%) | 311 (6.8%) |
| Bachelor's Degree or higher | 6,103 (83.2%) | 257 (3.5%) |
| Total | 12,028 (81.3%) | 681 (4.6%) |
Employment Occupations by Sex in Maple Valley
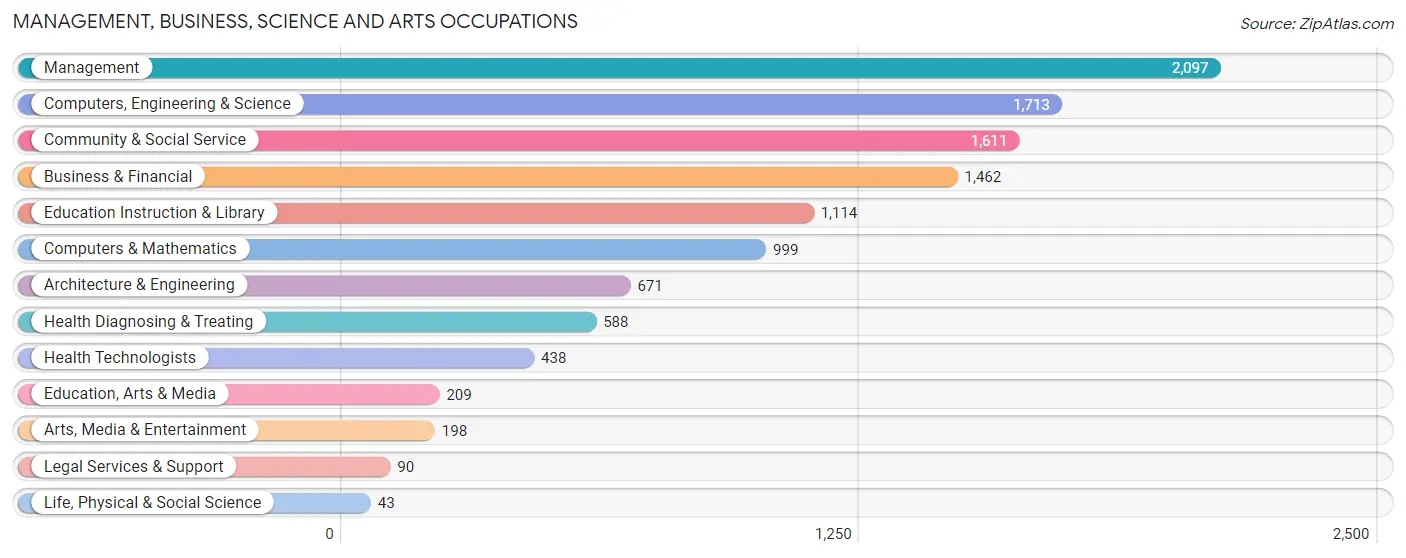
Management, Business, Science and Arts Occupations
The most common Management, Business, Science and Arts occupations in Maple Valley are Management (2,097 | 15.8%), Computers, Engineering & Science (1,713 | 12.9%), Community & Social Service (1,611 | 12.1%), Business & Financial (1,462 | 11.0%), and Education Instruction & Library (1,114 | 8.4%).
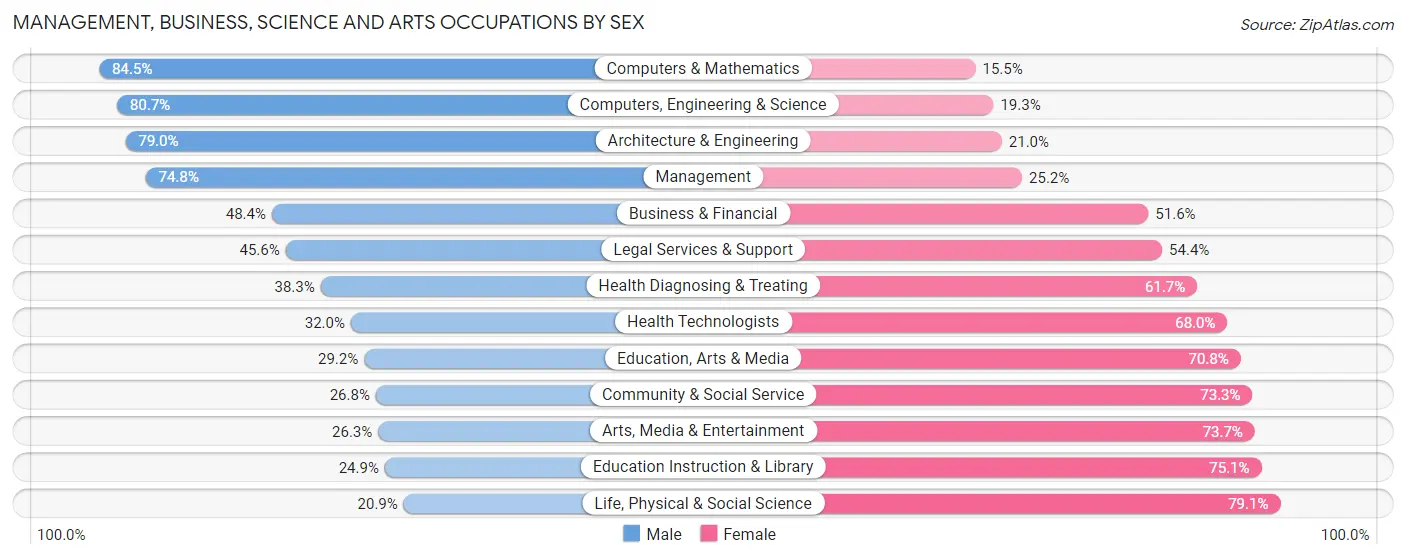
Management, Business, Science and Arts Occupations by Sex
Within the Management, Business, Science and Arts occupations in Maple Valley, the most male-oriented occupations are Computers & Mathematics (84.5%), Computers, Engineering & Science (80.7%), and Architecture & Engineering (79.0%), while the most female-oriented occupations are Life, Physical & Social Science (79.1%), Education Instruction & Library (75.1%), and Arts, Media & Entertainment (73.7%).
| Occupation | Male | Female |
| Management | 1,568 (74.8%) | 529 (25.2%) |
| Business & Financial | 708 (48.4%) | 754 (51.6%) |
| Computers, Engineering & Science | 1,383 (80.7%) | 330 (19.3%) |
| Computers & Mathematics | 844 (84.5%) | 155 (15.5%) |
| Architecture & Engineering | 530 (79.0%) | 141 (21.0%) |
| Life, Physical & Social Science | 9 (20.9%) | 34 (79.1%) |
| Community & Social Service | 431 (26.8%) | 1,180 (73.3%) |
| Education, Arts & Media | 61 (29.2%) | 148 (70.8%) |
| Legal Services & Support | 41 (45.6%) | 49 (54.4%) |
| Education Instruction & Library | 277 (24.9%) | 837 (75.1%) |
| Arts, Media & Entertainment | 52 (26.3%) | 146 (73.7%) |
| Health Diagnosing & Treating | 225 (38.3%) | 363 (61.7%) |
| Health Technologists | 140 (32.0%) | 298 (68.0%) |
| Total (Category) | 4,315 (57.8%) | 3,156 (42.2%) |
| Total (Overall) | 7,558 (56.9%) | 5,729 (43.1%) |
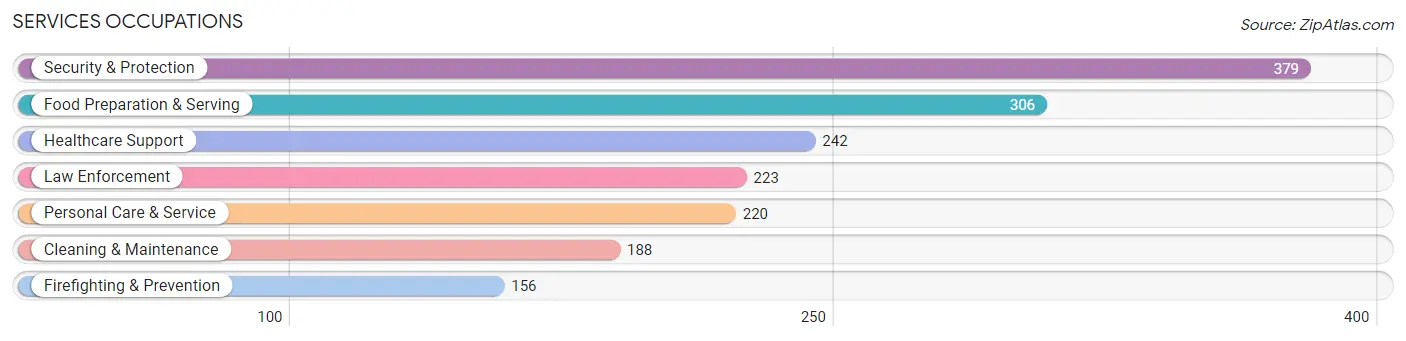
Services Occupations
The most common Services occupations in Maple Valley are Security & Protection (379 | 2.9%), Food Preparation & Serving (306 | 2.3%), Healthcare Support (242 | 1.8%), Law Enforcement (223 | 1.7%), and Personal Care & Service (220 | 1.7%).
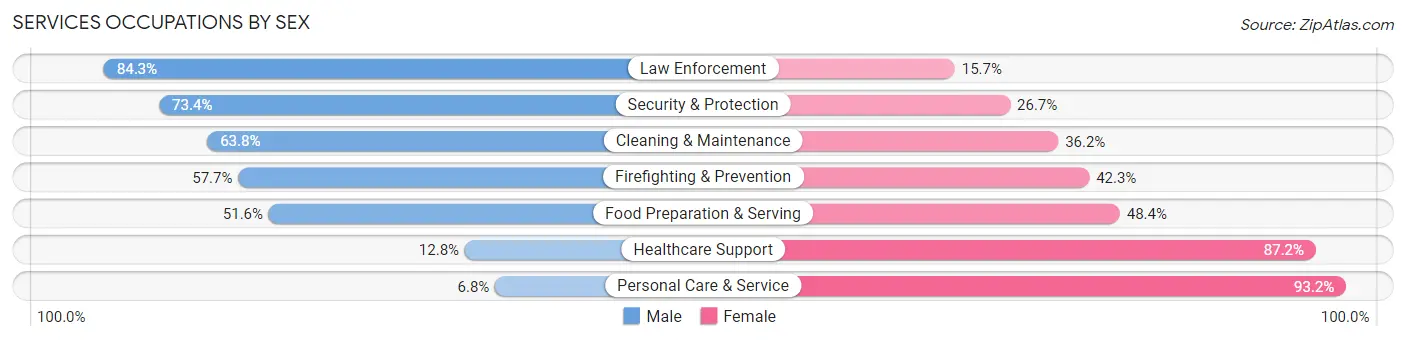
Services Occupations by Sex
Within the Services occupations in Maple Valley, the most male-oriented occupations are Law Enforcement (84.3%), Security & Protection (73.4%), and Cleaning & Maintenance (63.8%), while the most female-oriented occupations are Personal Care & Service (93.2%), Healthcare Support (87.2%), and Food Preparation & Serving (48.4%).
| Occupation | Male | Female |
| Healthcare Support | 31 (12.8%) | 211 (87.2%) |
| Security & Protection | 278 (73.4%) | 101 (26.7%) |
| Firefighting & Prevention | 90 (57.7%) | 66 (42.3%) |
| Law Enforcement | 188 (84.3%) | 35 (15.7%) |
| Food Preparation & Serving | 158 (51.6%) | 148 (48.4%) |
| Cleaning & Maintenance | 120 (63.8%) | 68 (36.2%) |
| Personal Care & Service | 15 (6.8%) | 205 (93.2%) |
| Total (Category) | 602 (45.1%) | 733 (54.9%) |
| Total (Overall) | 7,558 (56.9%) | 5,729 (43.1%) |
Sales and Office Occupations
The most common Sales and Office occupations in Maple Valley are Sales & Related (1,361 | 10.2%), and Office & Administration (1,205 | 9.1%).
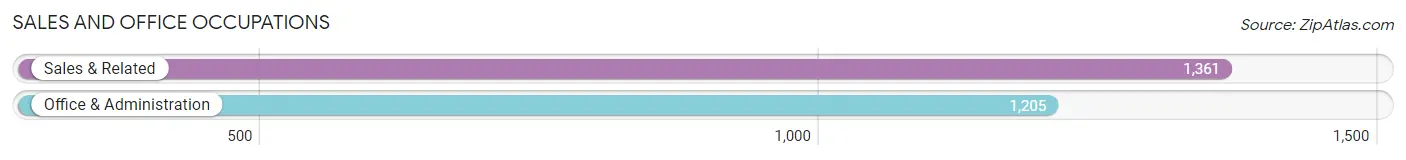
Sales and Office Occupations by Sex
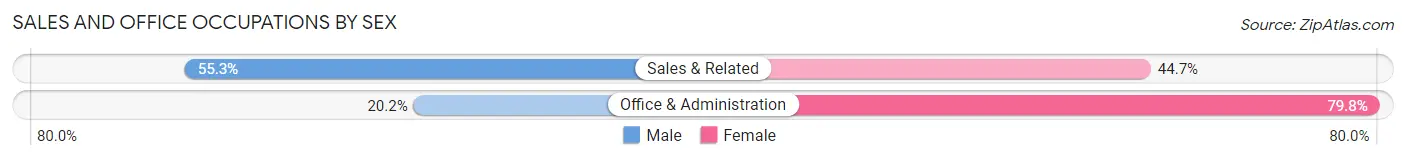
| Occupation | Male | Female |
| Sales & Related | 753 (55.3%) | 608 (44.7%) |
| Office & Administration | 243 (20.2%) | 962 (79.8%) |
| Total (Category) | 996 (38.8%) | 1,570 (61.2%) |
| Total (Overall) | 7,558 (56.9%) | 5,729 (43.1%) |
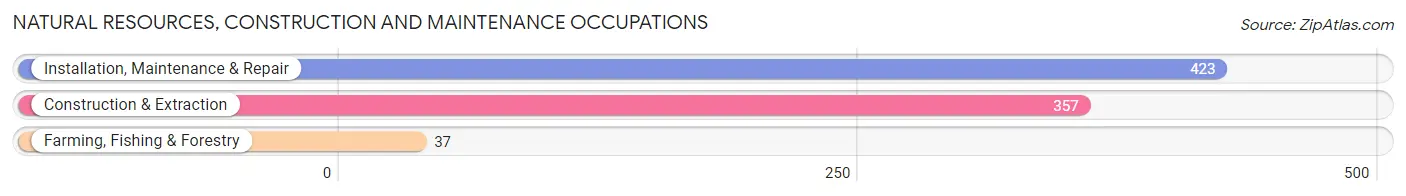
Natural Resources, Construction and Maintenance Occupations
The most common Natural Resources, Construction and Maintenance occupations in Maple Valley are Installation, Maintenance & Repair (423 | 3.2%), Construction & Extraction (357 | 2.7%), and Farming, Fishing & Forestry (37 | 0.3%).
Natural Resources, Construction and Maintenance Occupations by Sex
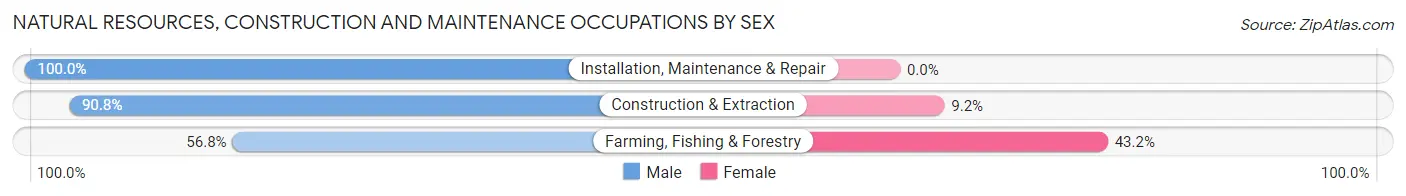
| Occupation | Male | Female |
| Farming, Fishing & Forestry | 21 (56.8%) | 16 (43.2%) |
| Construction & Extraction | 324 (90.8%) | 33 (9.2%) |
| Installation, Maintenance & Repair | 423 (100.0%) | 0 (0.0%) |
| Total (Category) | 768 (94.0%) | 49 (6.0%) |
| Total (Overall) | 7,558 (56.9%) | 5,729 (43.1%) |
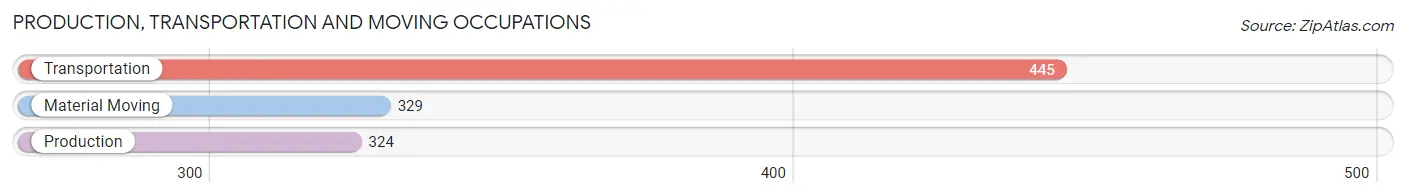
Production, Transportation and Moving Occupations
The most common Production, Transportation and Moving occupations in Maple Valley are Transportation (445 | 3.4%), Material Moving (329 | 2.5%), and Production (324 | 2.4%).
Production, Transportation and Moving Occupations by Sex
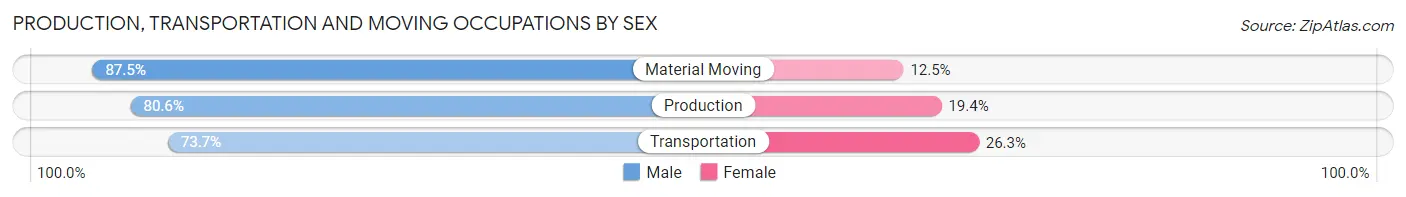
| Occupation | Male | Female |
| Production | 261 (80.6%) | 63 (19.4%) |
| Transportation | 328 (73.7%) | 117 (26.3%) |
| Material Moving | 288 (87.5%) | 41 (12.5%) |
| Total (Category) | 877 (79.9%) | 221 (20.1%) |
| Total (Overall) | 7,558 (56.9%) | 5,729 (43.1%) |
Employment Industries by Sex in Maple Valley
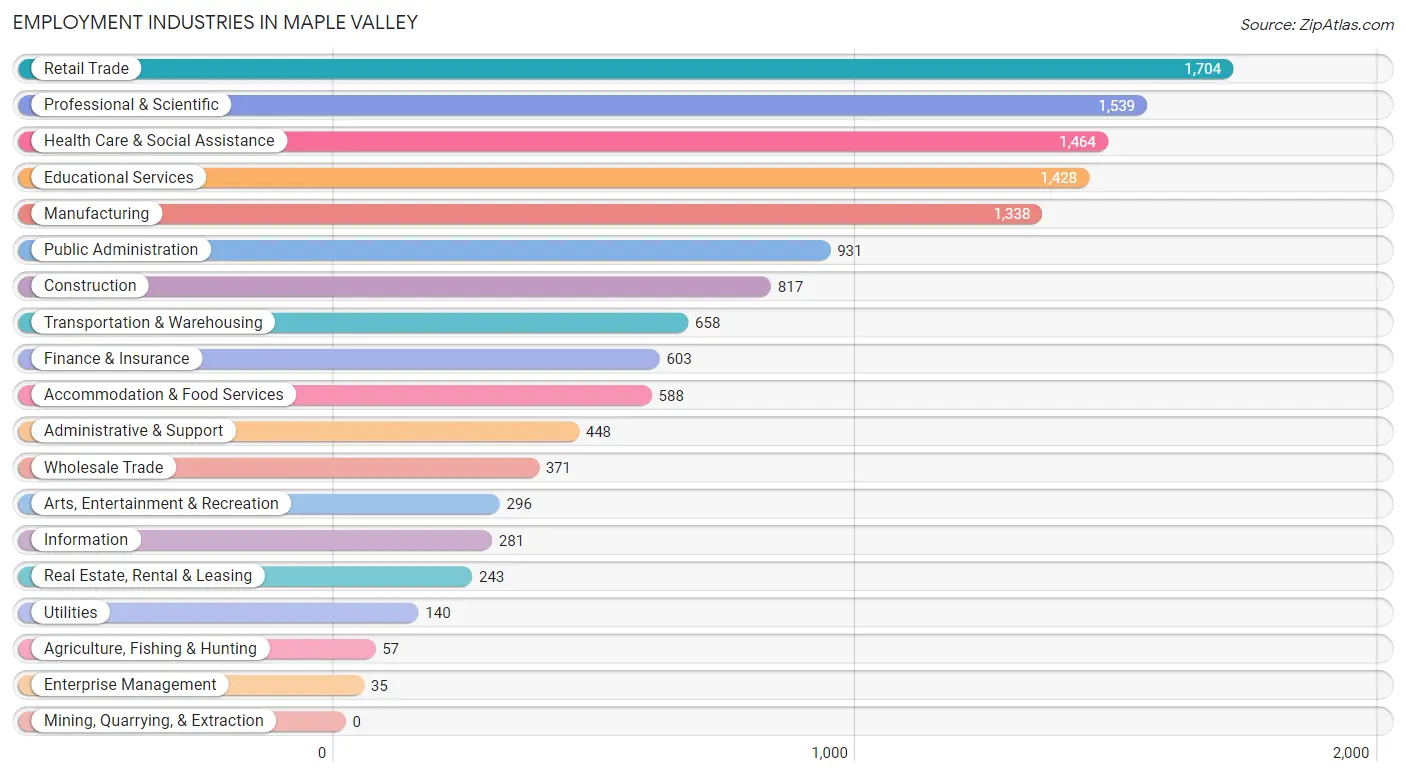
Employment Industries in Maple Valley
The major employment industries in Maple Valley include Retail Trade (1,704 | 12.8%), Professional & Scientific (1,539 | 11.6%), Health Care & Social Assistance (1,464 | 11.0%), Educational Services (1,428 | 10.7%), and Manufacturing (1,338 | 10.1%).
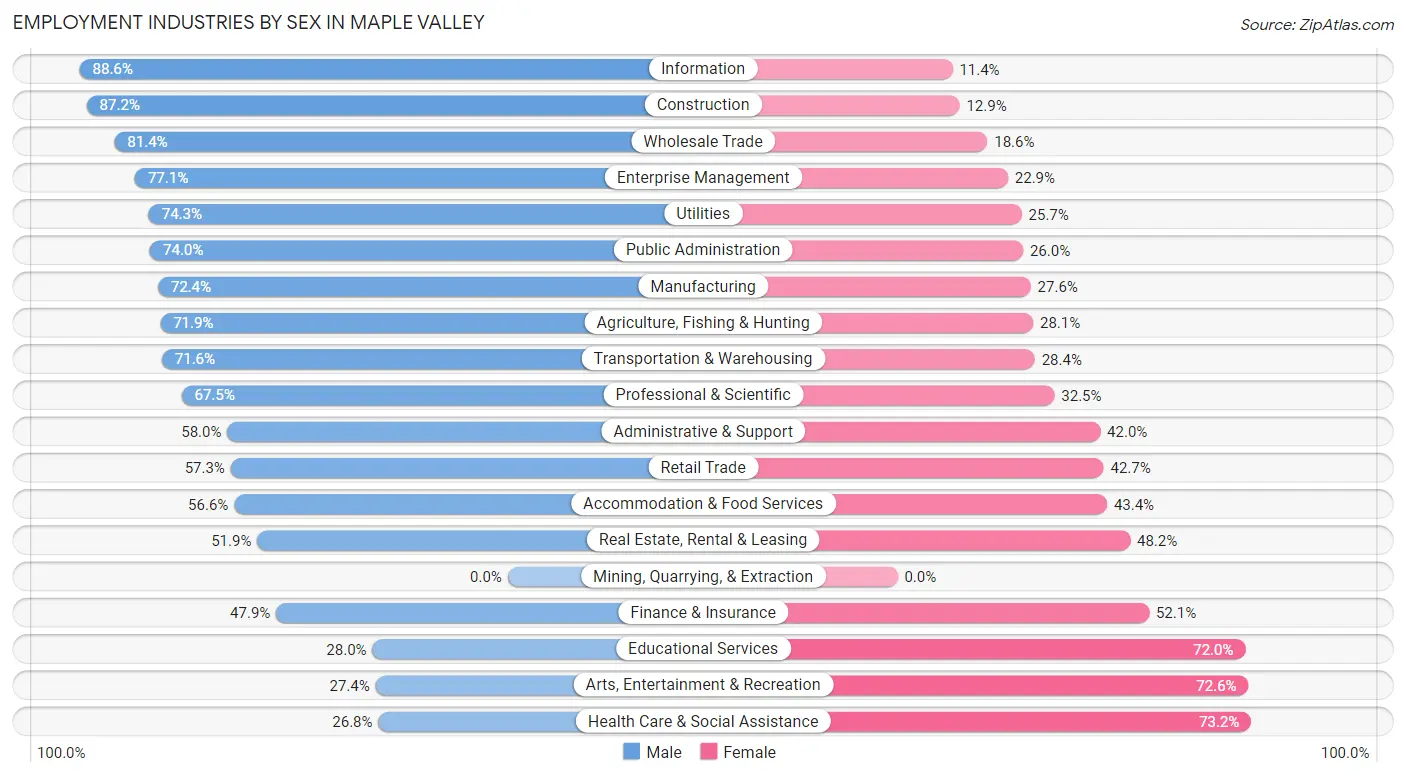
Employment Industries by Sex in Maple Valley
The Maple Valley industries that see more men than women are Information (88.6%), Construction (87.2%), and Wholesale Trade (81.4%), whereas the industries that tend to have a higher number of women are Health Care & Social Assistance (73.2%), Arts, Entertainment & Recreation (72.6%), and Educational Services (72.0%).
| Industry | Male | Female |
| Agriculture, Fishing & Hunting | 41 (71.9%) | 16 (28.1%) |
| Mining, Quarrying, & Extraction | 0 (0.0%) | 0 (0.0%) |
| Construction | 712 (87.2%) | 105 (12.9%) |
| Manufacturing | 969 (72.4%) | 369 (27.6%) |
| Wholesale Trade | 302 (81.4%) | 69 (18.6%) |
| Retail Trade | 977 (57.3%) | 727 (42.7%) |
| Transportation & Warehousing | 471 (71.6%) | 187 (28.4%) |
| Utilities | 104 (74.3%) | 36 (25.7%) |
| Information | 249 (88.6%) | 32 (11.4%) |
| Finance & Insurance | 289 (47.9%) | 314 (52.1%) |
| Real Estate, Rental & Leasing | 126 (51.8%) | 117 (48.1%) |
| Professional & Scientific | 1,039 (67.5%) | 500 (32.5%) |
| Enterprise Management | 27 (77.1%) | 8 (22.9%) |
| Administrative & Support | 260 (58.0%) | 188 (42.0%) |
| Educational Services | 400 (28.0%) | 1,028 (72.0%) |
| Health Care & Social Assistance | 392 (26.8%) | 1,072 (73.2%) |
| Arts, Entertainment & Recreation | 81 (27.4%) | 215 (72.6%) |
| Accommodation & Food Services | 333 (56.6%) | 255 (43.4%) |
| Public Administration | 689 (74.0%) | 242 (26.0%) |
| Total | 7,558 (56.9%) | 5,729 (43.1%) |
Education in Maple Valley
School Enrollment in Maple Valley
The most common levels of schooling among the 8,890 students in Maple Valley are middle school (2,333 | 26.2%), elementary school (2,063 | 23.2%), and high school (2,025 | 22.8%).
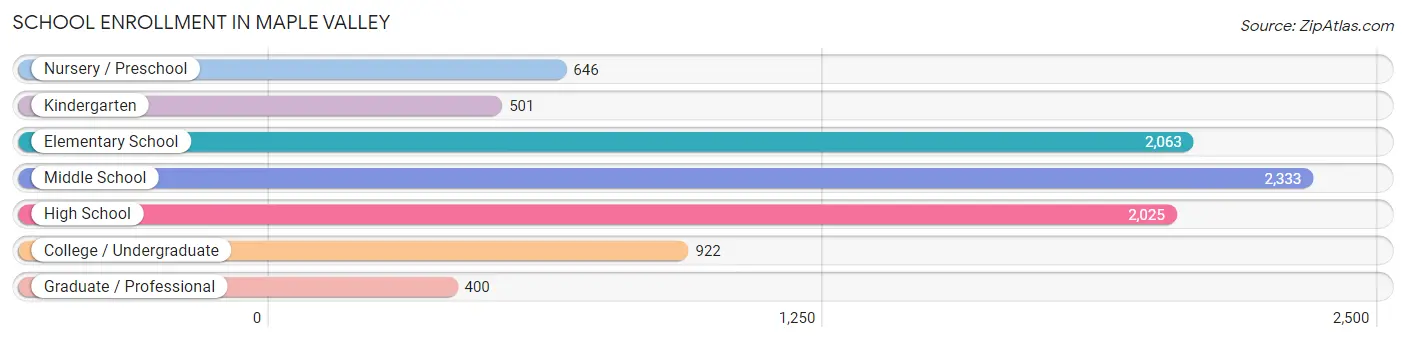
| School Level | # Students | % Students |
| Nursery / Preschool | 646 | 7.3% |
| Kindergarten | 501 | 5.6% |
| Elementary School | 2,063 | 23.2% |
| Middle School | 2,333 | 26.2% |
| High School | 2,025 | 22.8% |
| College / Undergraduate | 922 | 10.4% |
| Graduate / Professional | 400 | 4.5% |
| Total | 8,890 | 100.0% |
School Enrollment by Age by Funding Source in Maple Valley
Out of a total of 8,890 students who are enrolled in schools in Maple Valley, 1,325 (14.9%) attend a private institution, while the remaining 7,565 (85.1%) are enrolled in public schools. The age group of 3 to 4 year olds has the highest likelihood of being enrolled in private schools, with 310 (62.6% in the age bracket) enrolled. Conversely, the age group of 18 to 19 year olds has the lowest likelihood of being enrolled in a private school, with 531 (97.4% in the age bracket) attending a public institution.
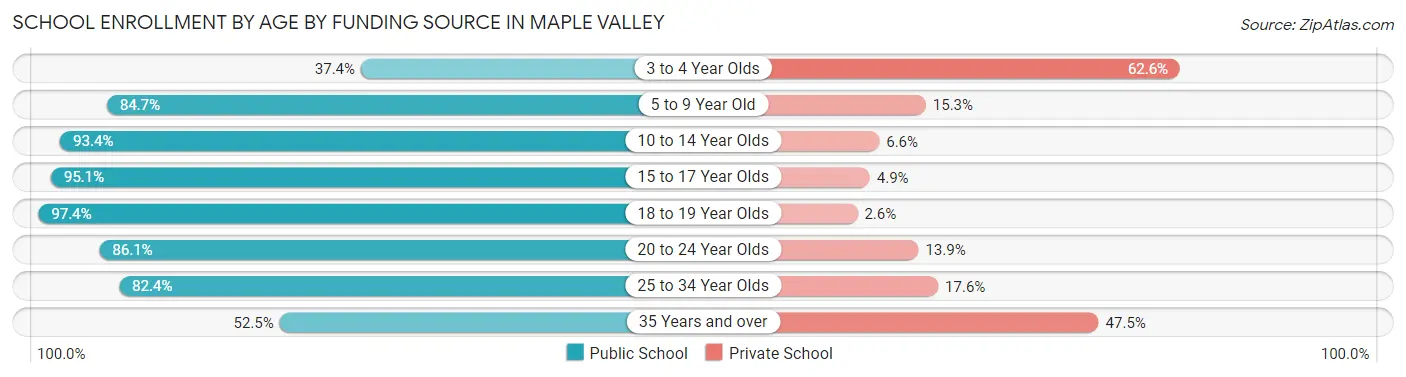
| Age Bracket | Public School | Private School |
| 3 to 4 Year Olds | 185 (37.4%) | 310 (62.6%) |
| 5 to 9 Year Old | 2,069 (84.7%) | 374 (15.3%) |
| 10 to 14 Year Olds | 2,730 (93.4%) | 194 (6.6%) |
| 15 to 17 Year Olds | 1,363 (95.1%) | 70 (4.9%) |
| 18 to 19 Year Olds | 531 (97.4%) | 14 (2.6%) |
| 20 to 24 Year Olds | 247 (86.1%) | 40 (13.9%) |
| 25 to 34 Year Olds | 103 (82.4%) | 22 (17.6%) |
| 35 Years and over | 335 (52.5%) | 303 (47.5%) |
| Total | 7,565 (85.1%) | 1,325 (14.9%) |
Educational Attainment by Field of Study in Maple Valley
Business (1,637 | 19.2%), engineering (983 | 11.5%), education (857 | 10.0%), computers & mathematics (784 | 9.2%), and science & technology (735 | 8.6%) are the most common fields of study among 8,548 individuals in Maple Valley who have obtained a bachelor's degree or higher.
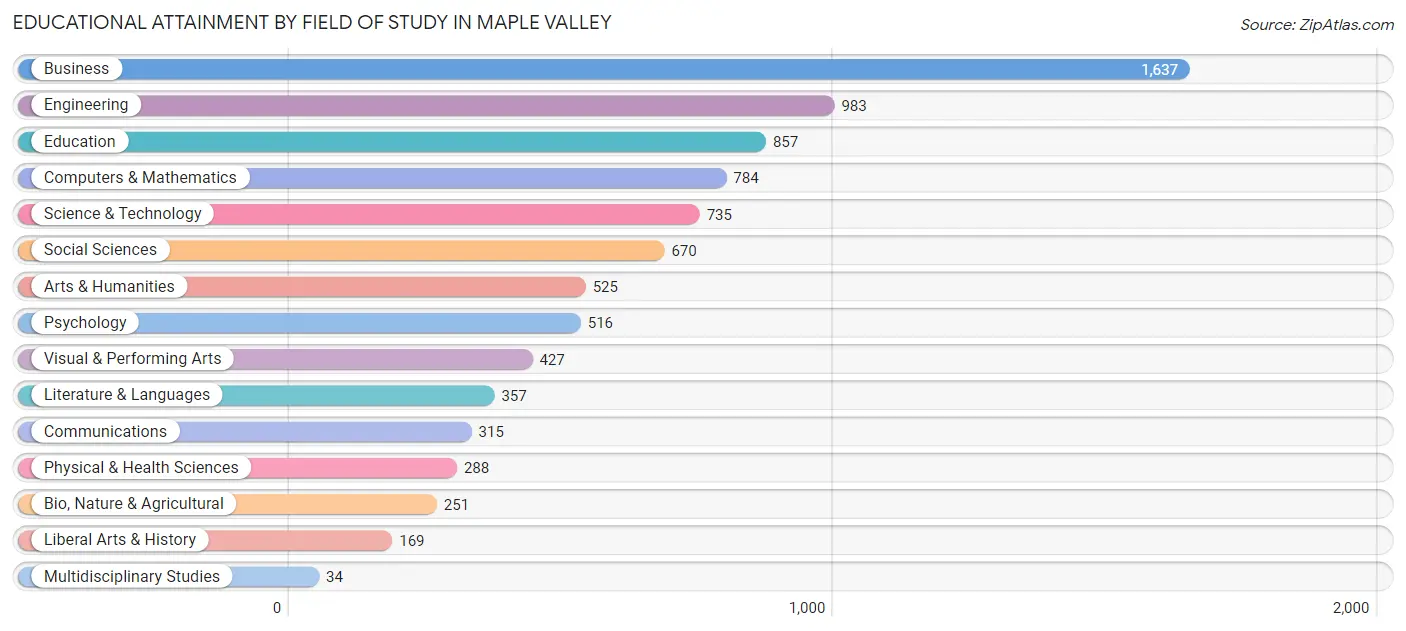
| Field of Study | # Graduates | % Graduates |
| Computers & Mathematics | 784 | 9.2% |
| Bio, Nature & Agricultural | 251 | 2.9% |
| Physical & Health Sciences | 288 | 3.4% |
| Psychology | 516 | 6.0% |
| Social Sciences | 670 | 7.8% |
| Engineering | 983 | 11.5% |
| Multidisciplinary Studies | 34 | 0.4% |
| Science & Technology | 735 | 8.6% |
| Business | 1,637 | 19.2% |
| Education | 857 | 10.0% |
| Literature & Languages | 357 | 4.2% |
| Liberal Arts & History | 169 | 2.0% |
| Visual & Performing Arts | 427 | 5.0% |
| Communications | 315 | 3.7% |
| Arts & Humanities | 525 | 6.1% |
| Total | 8,548 | 100.0% |
Transportation & Commute in Maple Valley
Vehicle Availability by Sex in Maple Valley
The most prevalent vehicle ownership categories in Maple Valley are males with 2 vehicles (3,511, accounting for 47.2%) and females with 2 vehicles (2,537, making up 62.2%).
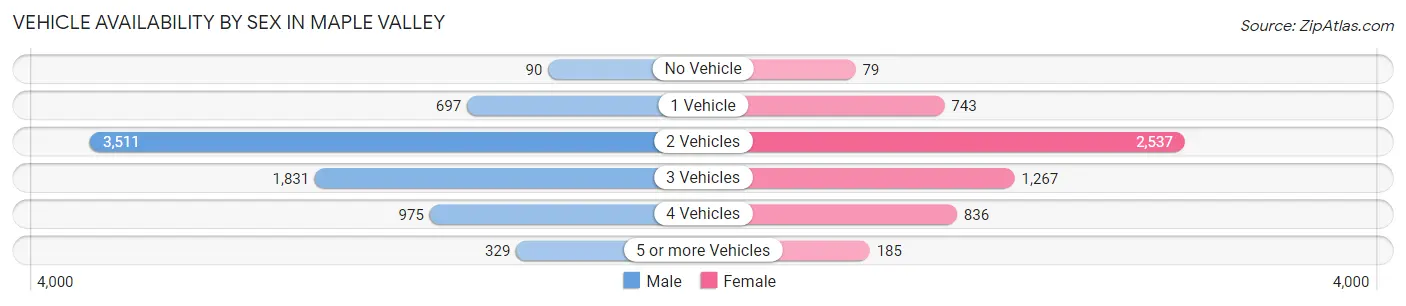
| Vehicles Available | Male | Female |
| No Vehicle | 90 (1.2%) | 79 (1.4%) |
| 1 Vehicle | 697 (9.4%) | 743 (13.2%) |
| 2 Vehicles | 3,511 (47.2%) | 2,537 (44.9%) |
| 3 Vehicles | 1,831 (24.6%) | 1,267 (22.4%) |
| 4 Vehicles | 975 (13.1%) | 836 (14.8%) |
| 5 or more Vehicles | 329 (4.4%) | 185 (3.3%) |
| Total | 7,433 (100.0%) | 5,647 (100.0%) |
Commute Time in Maple Valley
The most frequently occuring commute durations in Maple Valley are 45 to 59 minutes (2,136 commuters, 19.9%), 30 to 34 minutes (1,918 commuters, 17.9%), and 60 to 89 minutes (1,397 commuters, 13.0%).
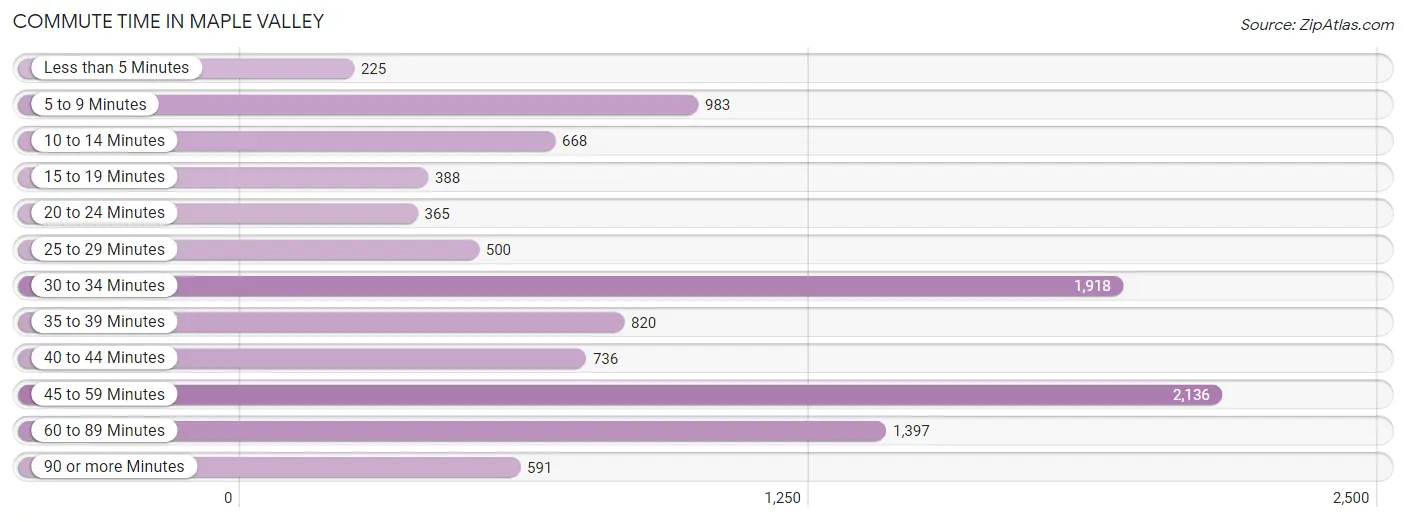
| Commute Time | # Commuters | % Commuters |
| Less than 5 Minutes | 225 | 2.1% |
| 5 to 9 Minutes | 983 | 9.2% |
| 10 to 14 Minutes | 668 | 6.2% |
| 15 to 19 Minutes | 388 | 3.6% |
| 20 to 24 Minutes | 365 | 3.4% |
| 25 to 29 Minutes | 500 | 4.7% |
| 30 to 34 Minutes | 1,918 | 17.9% |
| 35 to 39 Minutes | 820 | 7.6% |
| 40 to 44 Minutes | 736 | 6.9% |
| 45 to 59 Minutes | 2,136 | 19.9% |
| 60 to 89 Minutes | 1,397 | 13.0% |
| 90 or more Minutes | 591 | 5.5% |
Commute Time by Sex in Maple Valley
The most common commute times in Maple Valley are 45 to 59 minutes (1,392 commuters, 22.8%) for males and 30 to 34 minutes (754 commuters, 16.3%) for females.
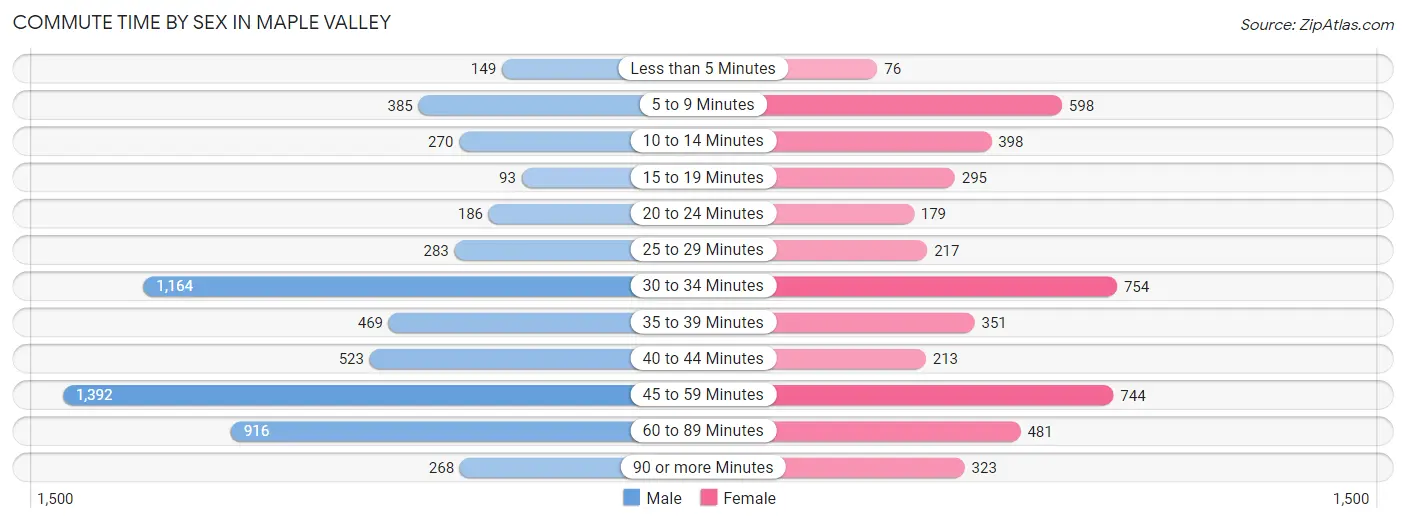
| Commute Time | Male | Female |
| Less than 5 Minutes | 149 (2.4%) | 76 (1.6%) |
| 5 to 9 Minutes | 385 (6.3%) | 598 (12.9%) |
| 10 to 14 Minutes | 270 (4.4%) | 398 (8.6%) |
| 15 to 19 Minutes | 93 (1.5%) | 295 (6.4%) |
| 20 to 24 Minutes | 186 (3.0%) | 179 (3.9%) |
| 25 to 29 Minutes | 283 (4.6%) | 217 (4.7%) |
| 30 to 34 Minutes | 1,164 (19.1%) | 754 (16.3%) |
| 35 to 39 Minutes | 469 (7.7%) | 351 (7.6%) |
| 40 to 44 Minutes | 523 (8.6%) | 213 (4.6%) |
| 45 to 59 Minutes | 1,392 (22.8%) | 744 (16.1%) |
| 60 to 89 Minutes | 916 (15.0%) | 481 (10.4%) |
| 90 or more Minutes | 268 (4.4%) | 323 (7.0%) |
Time of Departure to Work by Sex in Maple Valley
The most frequent times of departure to work in Maple Valley are 7:00 AM to 7:29 AM (823, 13.5%) for males and 7:00 AM to 7:29 AM (877, 19.0%) for females.
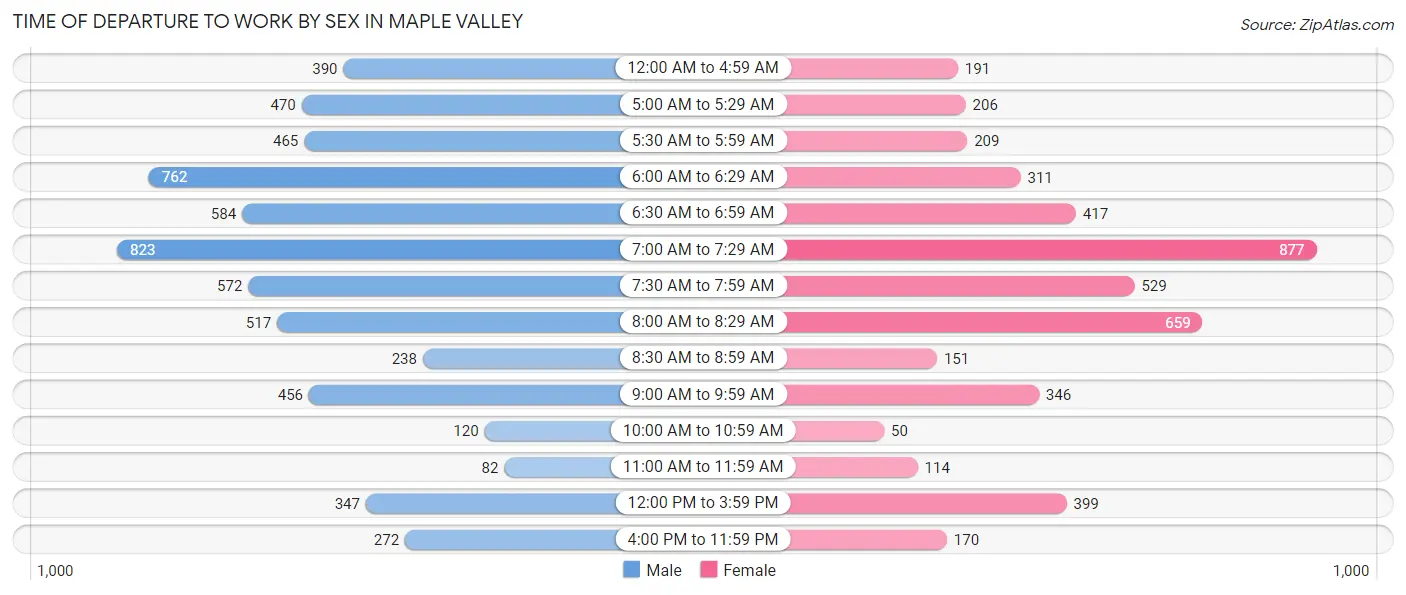
| Time of Departure | Male | Female |
| 12:00 AM to 4:59 AM | 390 (6.4%) | 191 (4.1%) |
| 5:00 AM to 5:29 AM | 470 (7.7%) | 206 (4.4%) |
| 5:30 AM to 5:59 AM | 465 (7.6%) | 209 (4.5%) |
| 6:00 AM to 6:29 AM | 762 (12.5%) | 311 (6.7%) |
| 6:30 AM to 6:59 AM | 584 (9.6%) | 417 (9.0%) |
| 7:00 AM to 7:29 AM | 823 (13.5%) | 877 (19.0%) |
| 7:30 AM to 7:59 AM | 572 (9.4%) | 529 (11.4%) |
| 8:00 AM to 8:29 AM | 517 (8.5%) | 659 (14.2%) |
| 8:30 AM to 8:59 AM | 238 (3.9%) | 151 (3.3%) |
| 9:00 AM to 9:59 AM | 456 (7.5%) | 346 (7.5%) |
| 10:00 AM to 10:59 AM | 120 (2.0%) | 50 (1.1%) |
| 11:00 AM to 11:59 AM | 82 (1.3%) | 114 (2.5%) |
| 12:00 PM to 3:59 PM | 347 (5.7%) | 399 (8.6%) |
| 4:00 PM to 11:59 PM | 272 (4.5%) | 170 (3.7%) |
| Total | 6,098 (100.0%) | 4,629 (100.0%) |
Housing Occupancy in Maple Valley
Occupancy by Ownership in Maple Valley
Of the total 9,193 dwellings in Maple Valley, owner-occupied units account for 7,814 (85.0%), while renter-occupied units make up 1,379 (15.0%).
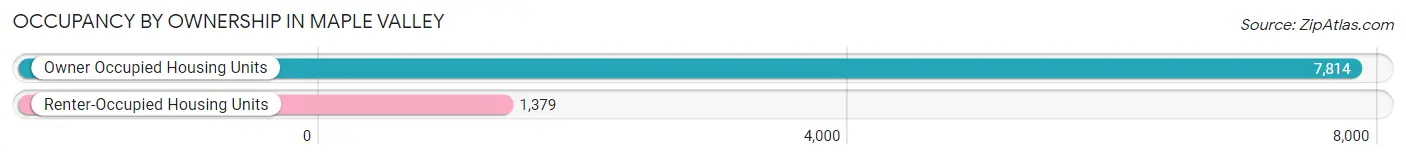
| Occupancy | # Housing Units | % Housing Units |
| Owner Occupied Housing Units | 7,814 | 85.0% |
| Renter-Occupied Housing Units | 1,379 | 15.0% |
| Total Occupied Housing Units | 9,193 | 100.0% |
Occupancy by Household Size in Maple Valley
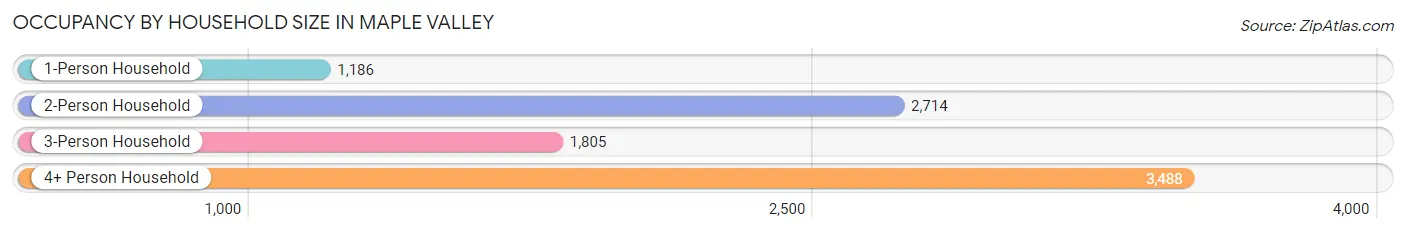
| Household Size | # Housing Units | % Housing Units |
| 1-Person Household | 1,186 | 12.9% |
| 2-Person Household | 2,714 | 29.5% |
| 3-Person Household | 1,805 | 19.6% |
| 4+ Person Household | 3,488 | 37.9% |
| Total Housing Units | 9,193 | 100.0% |
Occupancy by Ownership by Household Size in Maple Valley
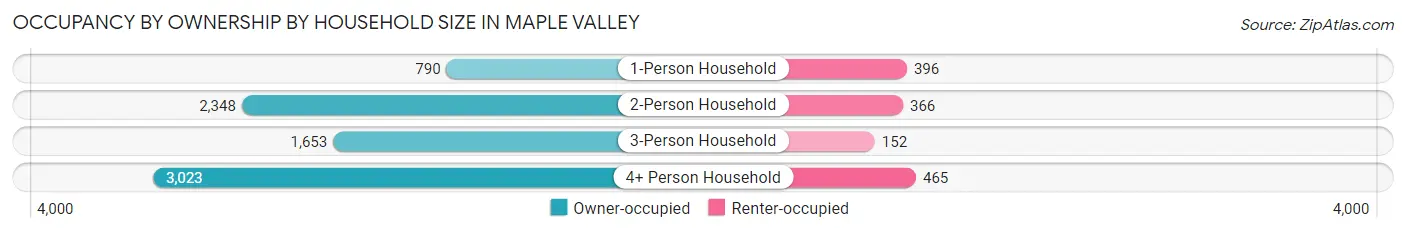
| Household Size | Owner-occupied | Renter-occupied |
| 1-Person Household | 790 (66.6%) | 396 (33.4%) |
| 2-Person Household | 2,348 (86.5%) | 366 (13.5%) |
| 3-Person Household | 1,653 (91.6%) | 152 (8.4%) |
| 4+ Person Household | 3,023 (86.7%) | 465 (13.3%) |
| Total Housing Units | 7,814 (85.0%) | 1,379 (15.0%) |
Occupancy by Educational Attainment in Maple Valley
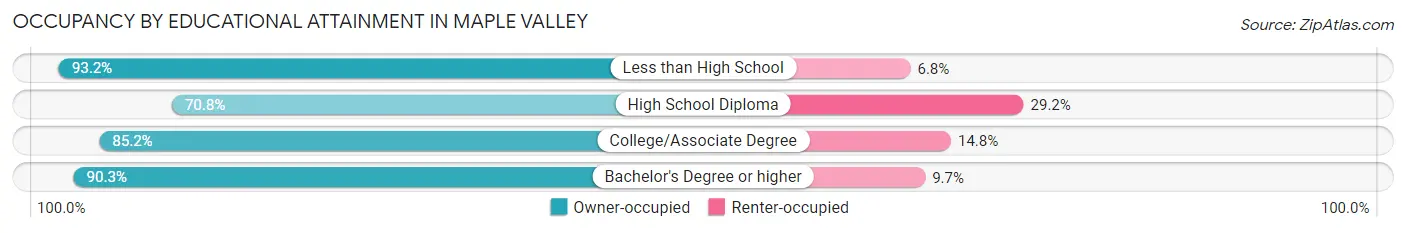
| Household Size | Owner-occupied | Renter-occupied |
| Less than High School | 178 (93.2%) | 13 (6.8%) |
| High School Diploma | 1,283 (70.8%) | 530 (29.2%) |
| College/Associate Degree | 2,273 (85.2%) | 396 (14.8%) |
| Bachelor's Degree or higher | 4,080 (90.3%) | 440 (9.7%) |
Occupancy by Age of Householder in Maple Valley
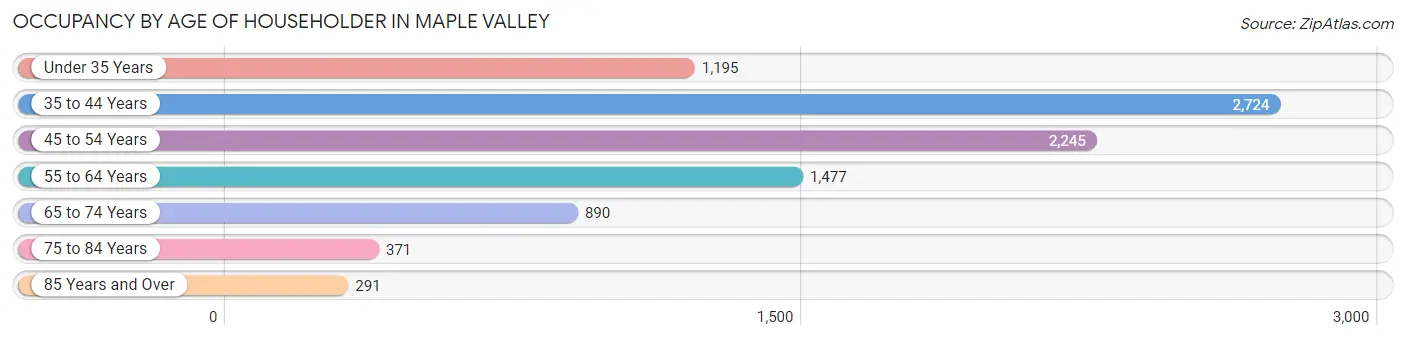
| Age Bracket | # Households | % Households |
| Under 35 Years | 1,195 | 13.0% |
| 35 to 44 Years | 2,724 | 29.6% |
| 45 to 54 Years | 2,245 | 24.4% |
| 55 to 64 Years | 1,477 | 16.1% |
| 65 to 74 Years | 890 | 9.7% |
| 75 to 84 Years | 371 | 4.0% |
| 85 Years and Over | 291 | 3.2% |
| Total | 9,193 | 100.0% |
Housing Finances in Maple Valley
Median Income by Occupancy in Maple Valley
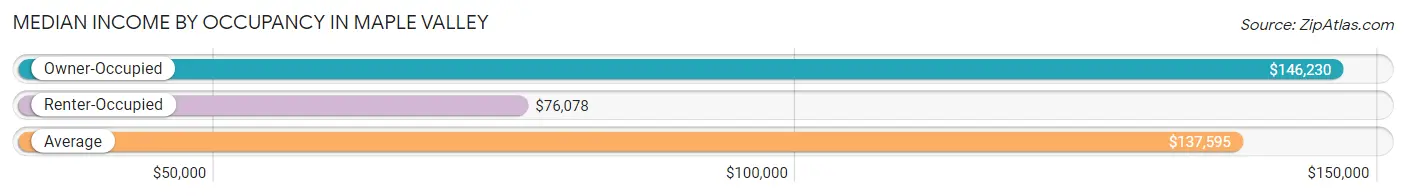
| Occupancy Type | # Households | Median Income |
| Owner-Occupied | 7,814 (85.0%) | $146,230 |
| Renter-Occupied | 1,379 (15.0%) | $76,078 |
| Average | 9,193 (100.0%) | $137,595 |
Occupancy by Householder Income Bracket in Maple Valley
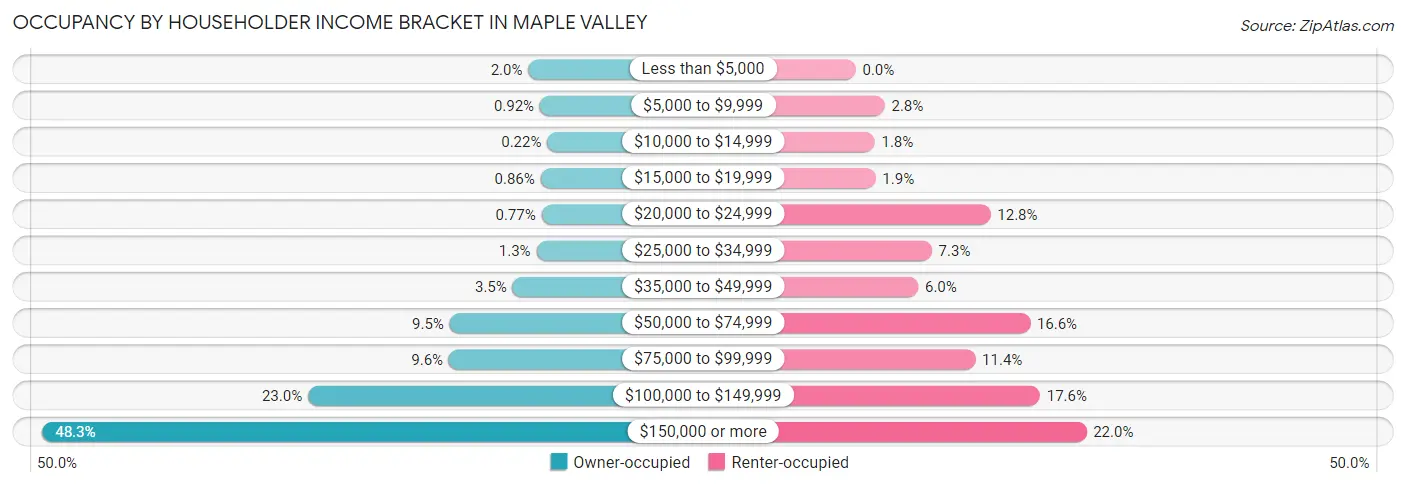
| Income Bracket | Owner-occupied | Renter-occupied |
| Less than $5,000 | 159 (2.0%) | 0 (0.0%) |
| $5,000 to $9,999 | 72 (0.9%) | 38 (2.8%) |
| $10,000 to $14,999 | 17 (0.2%) | 25 (1.8%) |
| $15,000 to $19,999 | 67 (0.9%) | 26 (1.9%) |
| $20,000 to $24,999 | 60 (0.8%) | 177 (12.8%) |
| $25,000 to $34,999 | 98 (1.3%) | 100 (7.2%) |
| $35,000 to $49,999 | 275 (3.5%) | 82 (5.9%) |
| $50,000 to $74,999 | 744 (9.5%) | 229 (16.6%) |
| $75,000 to $99,999 | 749 (9.6%) | 157 (11.4%) |
| $100,000 to $149,999 | 1,798 (23.0%) | 242 (17.5%) |
| $150,000 or more | 3,775 (48.3%) | 303 (22.0%) |
| Total | 7,814 (100.0%) | 1,379 (100.0%) |
Monthly Housing Cost Tiers in Maple Valley
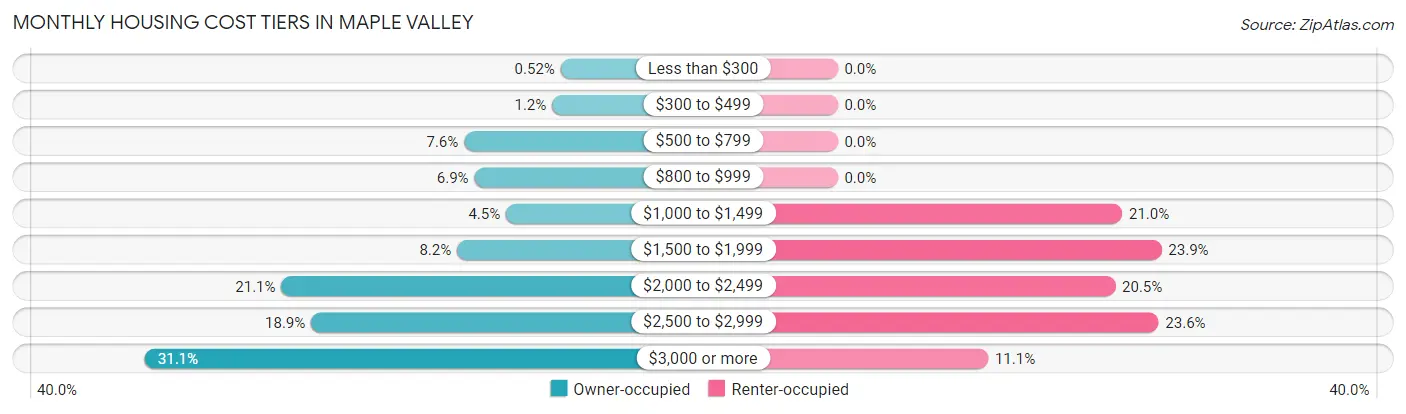
| Monthly Cost | Owner-occupied | Renter-occupied |
| Less than $300 | 41 (0.5%) | 0 (0.0%) |
| $300 to $499 | 90 (1.1%) | 0 (0.0%) |
| $500 to $799 | 596 (7.6%) | 0 (0.0%) |
| $800 to $999 | 537 (6.9%) | 0 (0.0%) |
| $1,000 to $1,499 | 355 (4.5%) | 289 (21.0%) |
| $1,500 to $1,999 | 637 (8.2%) | 329 (23.9%) |
| $2,000 to $2,499 | 1,648 (21.1%) | 282 (20.4%) |
| $2,500 to $2,999 | 1,477 (18.9%) | 326 (23.6%) |
| $3,000 or more | 2,433 (31.1%) | 153 (11.1%) |
| Total | 7,814 (100.0%) | 1,379 (100.0%) |
Physical Housing Characteristics in Maple Valley
Housing Structures in Maple Valley
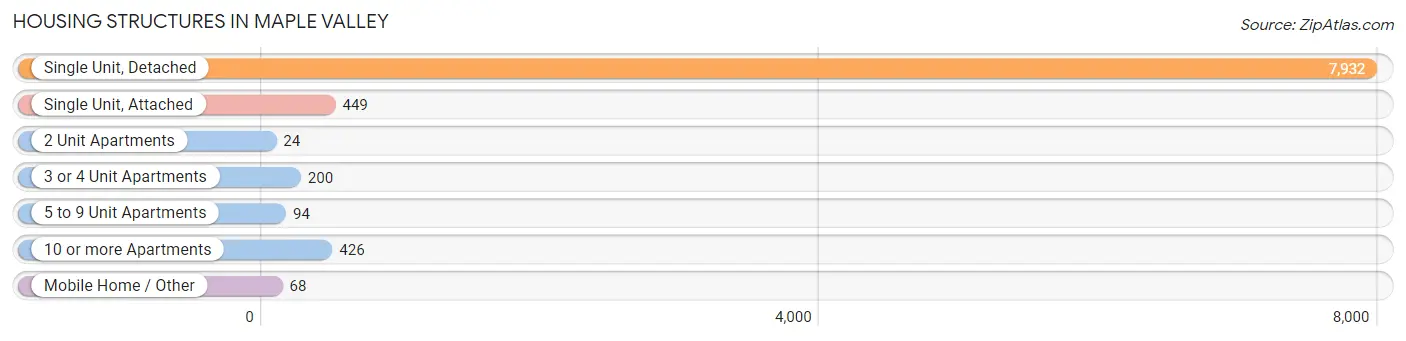
| Structure Type | # Housing Units | % Housing Units |
| Single Unit, Detached | 7,932 | 86.3% |
| Single Unit, Attached | 449 | 4.9% |
| 2 Unit Apartments | 24 | 0.3% |
| 3 or 4 Unit Apartments | 200 | 2.2% |
| 5 to 9 Unit Apartments | 94 | 1.0% |
| 10 or more Apartments | 426 | 4.6% |
| Mobile Home / Other | 68 | 0.7% |
| Total | 9,193 | 100.0% |
Housing Structures by Occupancy in Maple Valley
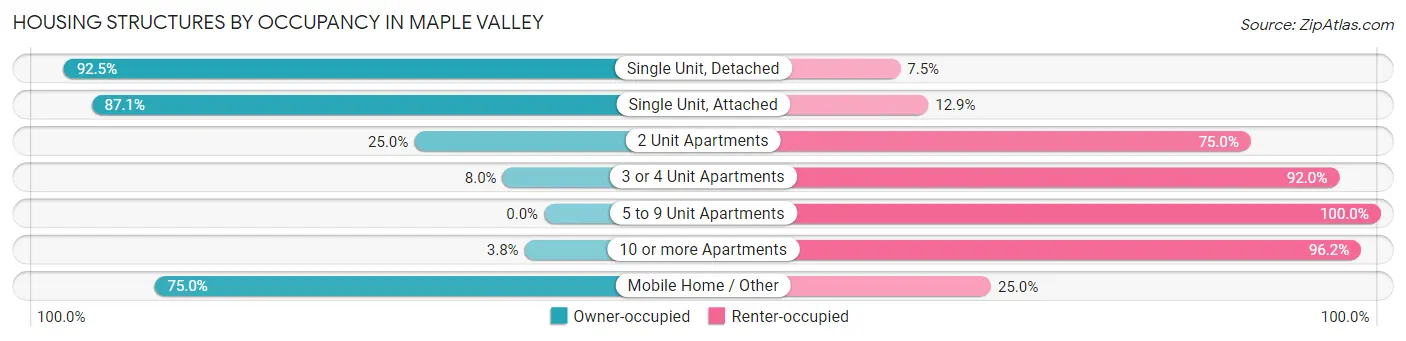
| Structure Type | Owner-occupied | Renter-occupied |
| Single Unit, Detached | 7,334 (92.5%) | 598 (7.5%) |
| Single Unit, Attached | 391 (87.1%) | 58 (12.9%) |
| 2 Unit Apartments | 6 (25.0%) | 18 (75.0%) |
| 3 or 4 Unit Apartments | 16 (8.0%) | 184 (92.0%) |
| 5 to 9 Unit Apartments | 0 (0.0%) | 94 (100.0%) |
| 10 or more Apartments | 16 (3.8%) | 410 (96.2%) |
| Mobile Home / Other | 51 (75.0%) | 17 (25.0%) |
| Total | 7,814 (85.0%) | 1,379 (15.0%) |
Housing Structures by Number of Rooms in Maple Valley
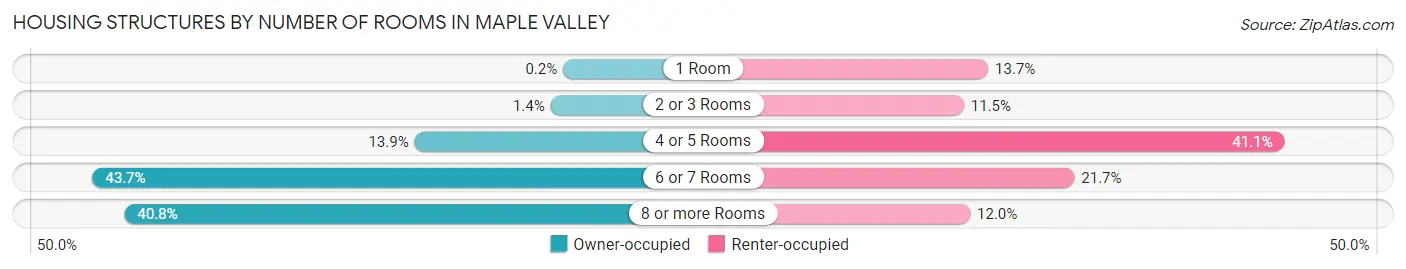
| Number of Rooms | Owner-occupied | Renter-occupied |
| 1 Room | 16 (0.2%) | 189 (13.7%) |
| 2 or 3 Rooms | 106 (1.4%) | 158 (11.5%) |
| 4 or 5 Rooms | 1,089 (13.9%) | 567 (41.1%) |
| 6 or 7 Rooms | 3,417 (43.7%) | 299 (21.7%) |
| 8 or more Rooms | 3,186 (40.8%) | 166 (12.0%) |
| Total | 7,814 (100.0%) | 1,379 (100.0%) |
Housing Structure by Heating Type in Maple Valley
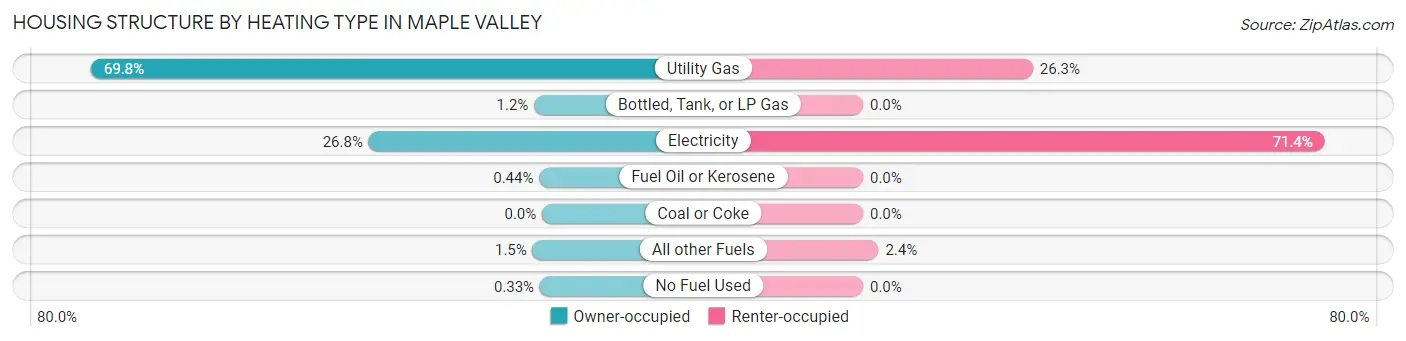
| Heating Type | Owner-occupied | Renter-occupied |
| Utility Gas | 5,450 (69.8%) | 362 (26.3%) |
| Bottled, Tank, or LP Gas | 95 (1.2%) | 0 (0.0%) |
| Electricity | 2,094 (26.8%) | 984 (71.4%) |
| Fuel Oil or Kerosene | 34 (0.4%) | 0 (0.0%) |
| Coal or Coke | 0 (0.0%) | 0 (0.0%) |
| All other Fuels | 115 (1.5%) | 33 (2.4%) |
| No Fuel Used | 26 (0.3%) | 0 (0.0%) |
| Total | 7,814 (100.0%) | 1,379 (100.0%) |
Household Vehicle Usage in Maple Valley
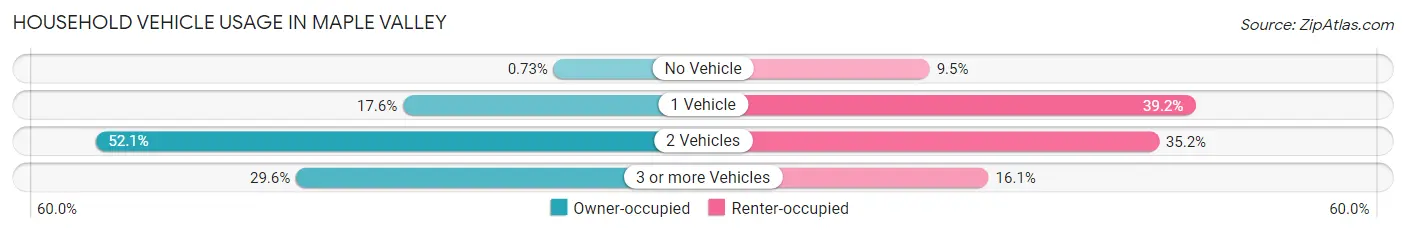
| Vehicles per Household | Owner-occupied | Renter-occupied |
| No Vehicle | 57 (0.7%) | 131 (9.5%) |
| 1 Vehicle | 1,376 (17.6%) | 541 (39.2%) |
| 2 Vehicles | 4,069 (52.1%) | 485 (35.2%) |
| 3 or more Vehicles | 2,312 (29.6%) | 222 (16.1%) |
| Total | 7,814 (100.0%) | 1,379 (100.0%) |
Real Estate & Mortgages in Maple Valley
Real Estate and Mortgage Overview in Maple Valley
| Characteristic | Without Mortgage | With Mortgage |
| Housing Units | 1,401 | 6,413 |
| Median Property Value | $588,400 | $630,200 |
| Median Household Income | $85,040 | $3,534 |
| Monthly Housing Costs | $802 | $2,433 |
| Real Estate Taxes | $5,243 | $33 |
Property Value by Mortgage Status in Maple Valley
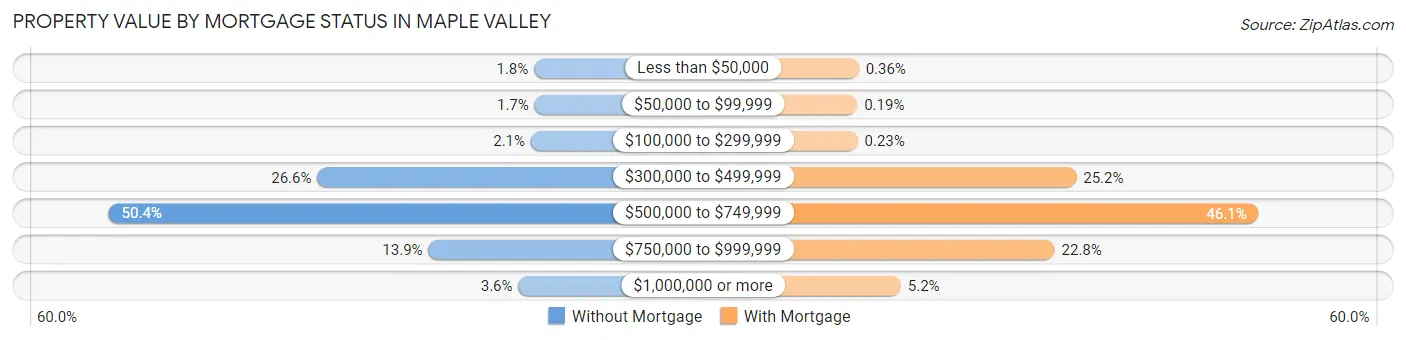
| Property Value | Without Mortgage | With Mortgage |
| Less than $50,000 | 25 (1.8%) | 23 (0.4%) |
| $50,000 to $99,999 | 24 (1.7%) | 12 (0.2%) |
| $100,000 to $299,999 | 30 (2.1%) | 15 (0.2%) |
| $300,000 to $499,999 | 372 (26.6%) | 1,618 (25.2%) |
| $500,000 to $749,999 | 706 (50.4%) | 2,954 (46.1%) |
| $750,000 to $999,999 | 194 (13.9%) | 1,459 (22.8%) |
| $1,000,000 or more | 50 (3.6%) | 332 (5.2%) |
| Total | 1,401 (100.0%) | 6,413 (100.0%) |
Household Income by Mortgage Status in Maple Valley
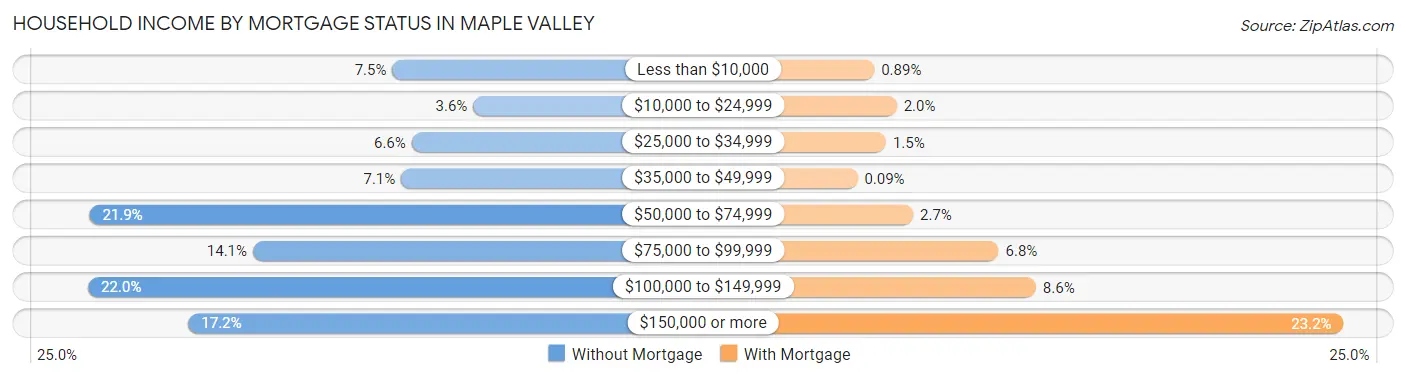
| Household Income | Without Mortgage | With Mortgage |
| Less than $10,000 | 105 (7.5%) | 57 (0.9%) |
| $10,000 to $24,999 | 51 (3.6%) | 126 (2.0%) |
| $25,000 to $34,999 | 92 (6.6%) | 93 (1.5%) |
| $35,000 to $49,999 | 99 (7.1%) | 6 (0.1%) |
| $50,000 to $74,999 | 307 (21.9%) | 176 (2.7%) |
| $75,000 to $99,999 | 198 (14.1%) | 437 (6.8%) |
| $100,000 to $149,999 | 308 (22.0%) | 551 (8.6%) |
| $150,000 or more | 241 (17.2%) | 1,490 (23.2%) |
| Total | 1,401 (100.0%) | 6,413 (100.0%) |
Property Value to Household Income Ratio in Maple Valley
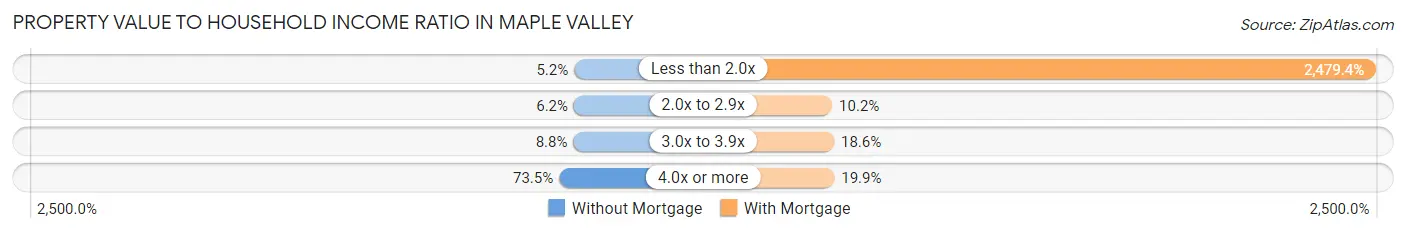
| Value-to-Income Ratio | Without Mortgage | With Mortgage |
| Less than 2.0x | 73 (5.2%) | 159,005 (2,479.4%) |
| 2.0x to 2.9x | 87 (6.2%) | 654 (10.2%) |
| 3.0x to 3.9x | 123 (8.8%) | 1,193 (18.6%) |
| 4.0x or more | 1,030 (73.5%) | 1,278 (19.9%) |
| Total | 1,401 (100.0%) | 6,413 (100.0%) |
Real Estate Taxes by Mortgage Status in Maple Valley
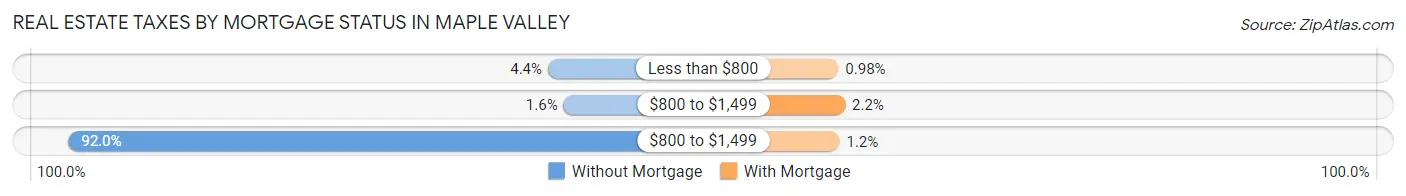
| Property Taxes | Without Mortgage | With Mortgage |
| Less than $800 | 62 (4.4%) | 63 (1.0%) |
| $800 to $1,499 | 22 (1.6%) | 141 (2.2%) |
| $800 to $1,499 | 1,289 (92.0%) | 76 (1.2%) |
| Total | 1,401 (100.0%) | 6,413 (100.0%) |
Health & Disability in Maple Valley
Health Insurance Coverage by Age in Maple Valley
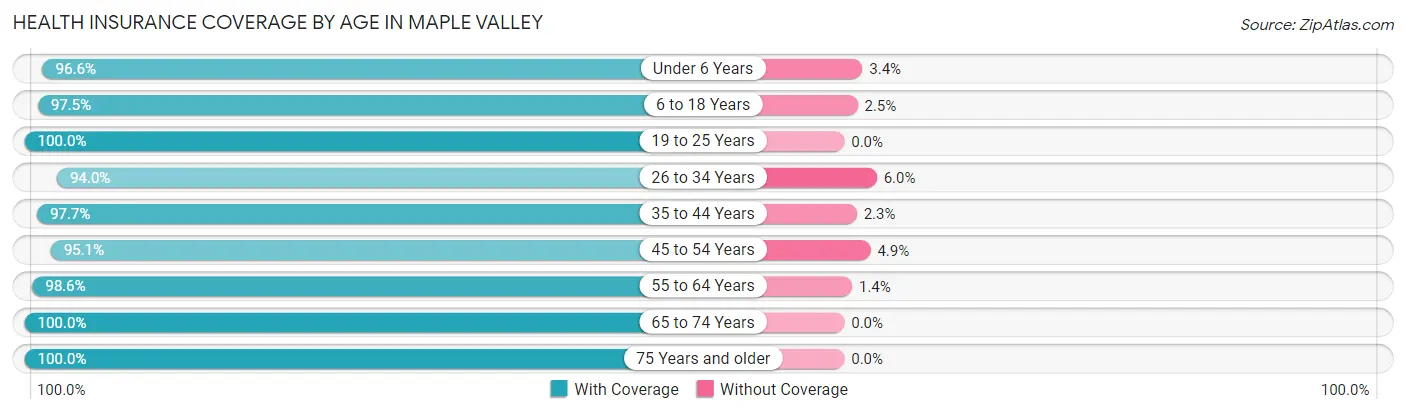
| Age Bracket | With Coverage | Without Coverage |
| Under 6 Years | 2,207 (96.6%) | 77 (3.4%) |
| 6 to 18 Years | 6,751 (97.5%) | 171 (2.5%) |
| 19 to 25 Years | 1,472 (100.0%) | 0 (0.0%) |
| 26 to 34 Years | 2,333 (94.0%) | 150 (6.0%) |
| 35 to 44 Years | 5,216 (97.7%) | 124 (2.3%) |
| 45 to 54 Years | 3,719 (95.1%) | 191 (4.9%) |
| 55 to 64 Years | 2,808 (98.6%) | 41 (1.4%) |
| 65 to 74 Years | 1,555 (100.0%) | 0 (0.0%) |
| 75 Years and older | 990 (100.0%) | 0 (0.0%) |
| Total | 27,051 (97.3%) | 754 (2.7%) |
Health Insurance Coverage by Citizenship Status in Maple Valley
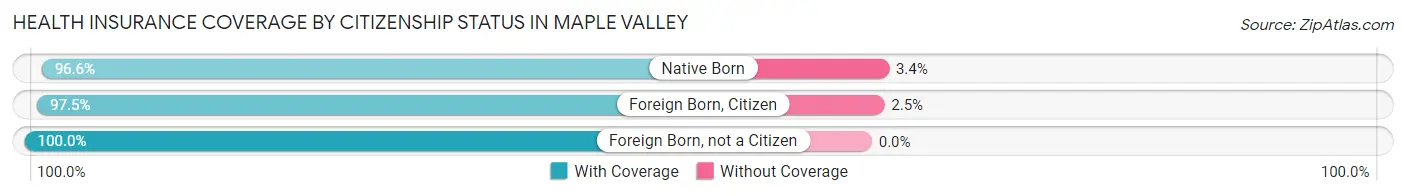
| Citizenship Status | With Coverage | Without Coverage |
| Native Born | 2,207 (96.6%) | 77 (3.4%) |
| Foreign Born, Citizen | 6,751 (97.5%) | 171 (2.5%) |
| Foreign Born, not a Citizen | 1,472 (100.0%) | 0 (0.0%) |
Health Insurance Coverage by Household Income in Maple Valley
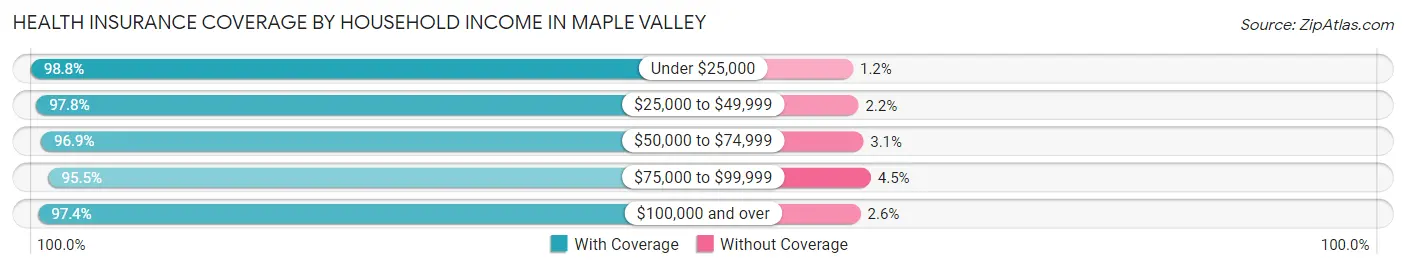
| Household Income | With Coverage | Without Coverage |
| Under $25,000 | 1,266 (98.8%) | 15 (1.2%) |
| $25,000 to $49,999 | 1,028 (97.8%) | 23 (2.2%) |
| $50,000 to $74,999 | 1,912 (96.9%) | 61 (3.1%) |
| $75,000 to $99,999 | 2,412 (95.5%) | 114 (4.5%) |
| $100,000 and over | 20,425 (97.4%) | 541 (2.6%) |
Public vs Private Health Insurance Coverage by Age in Maple Valley

| Age Bracket | Public Insurance | Private Insurance |
| Under 6 | 281 (12.3%) | 2,038 (89.2%) |
| 6 to 18 Years | 869 (12.6%) | 6,265 (90.5%) |
| 19 to 25 Years | 135 (9.2%) | 1,371 (93.1%) |
| 25 to 34 Years | 165 (6.7%) | 2,215 (89.2%) |
| 35 to 44 Years | 373 (7.0%) | 5,011 (93.8%) |
| 45 to 54 Years | 260 (6.7%) | 3,593 (91.9%) |
| 55 to 64 Years | 453 (15.9%) | 2,486 (87.3%) |
| 65 to 74 Years | 1,459 (93.8%) | 1,070 (68.8%) |
| 75 Years and over | 990 (100.0%) | 736 (74.3%) |
| Total | 4,985 (17.9%) | 24,785 (89.1%) |
Disability Status by Sex by Age in Maple Valley
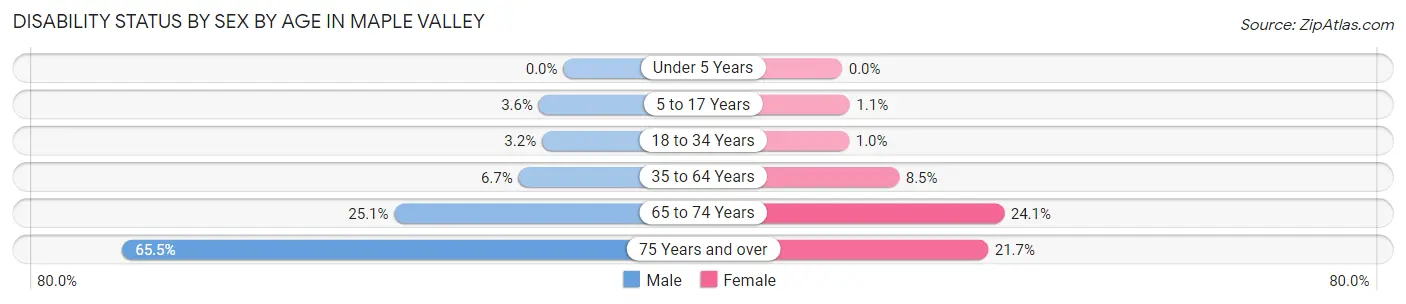
| Age Bracket | Male | Female |
| Under 5 Years | 0 (0.0%) | 0 (0.0%) |
| 5 to 17 Years | 126 (3.6%) | 40 (1.1%) |
| 18 to 34 Years | 77 (3.2%) | 19 (1.0%) |
| 35 to 64 Years | 403 (6.7%) | 511 (8.5%) |
| 65 to 74 Years | 145 (25.1%) | 235 (24.0%) |
| 75 Years and over | 298 (65.5%) | 116 (21.7%) |
Disability Class by Sex by Age in Maple Valley
Disability Class: Hearing Difficulty
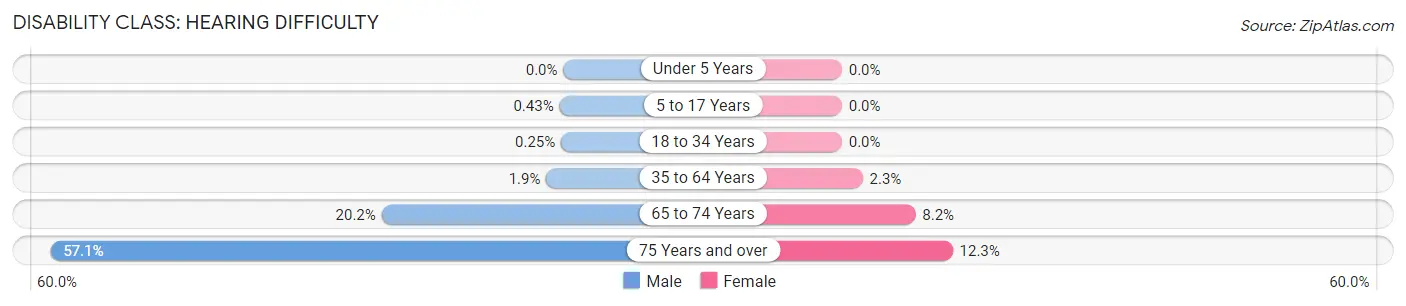
| Age Bracket | Male | Female |
| Under 5 Years | 0 (0.0%) | 0 (0.0%) |
| 5 to 17 Years | 15 (0.4%) | 0 (0.0%) |
| 18 to 34 Years | 6 (0.3%) | 0 (0.0%) |
| 35 to 64 Years | 115 (1.9%) | 140 (2.3%) |
| 65 to 74 Years | 117 (20.2%) | 80 (8.2%) |
| 75 Years and over | 260 (57.1%) | 66 (12.3%) |
Disability Class: Vision Difficulty
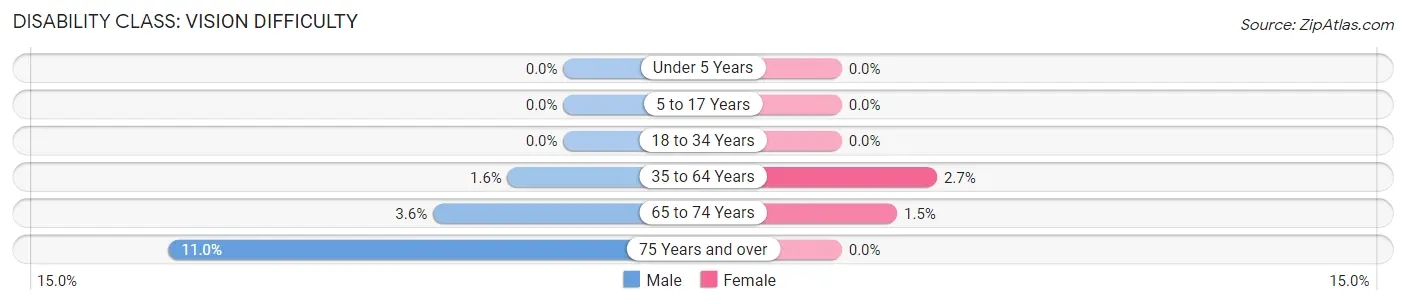
| Age Bracket | Male | Female |
| Under 5 Years | 0 (0.0%) | 0 (0.0%) |
| 5 to 17 Years | 0 (0.0%) | 0 (0.0%) |
| 18 to 34 Years | 0 (0.0%) | 0 (0.0%) |
| 35 to 64 Years | 94 (1.5%) | 160 (2.6%) |
| 65 to 74 Years | 21 (3.6%) | 15 (1.5%) |
| 75 Years and over | 50 (11.0%) | 0 (0.0%) |
Disability Class: Cognitive Difficulty
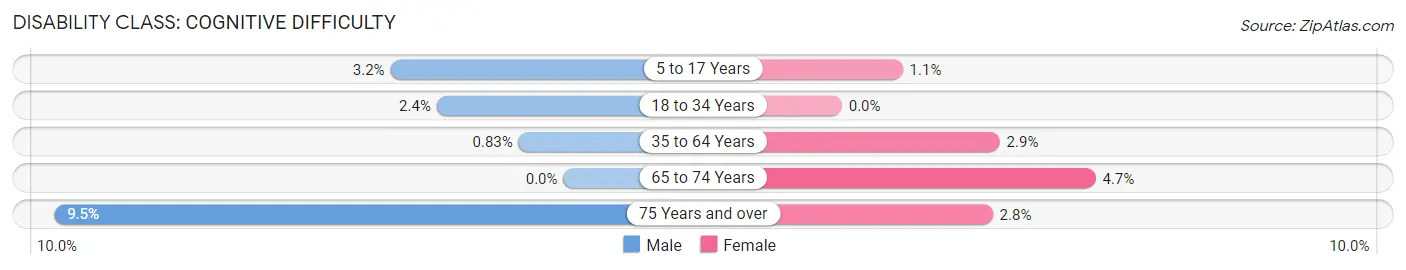
| Age Bracket | Male | Female |
| 5 to 17 Years | 111 (3.2%) | 40 (1.1%) |
| 18 to 34 Years | 57 (2.4%) | 0 (0.0%) |
| 35 to 64 Years | 50 (0.8%) | 177 (2.9%) |
| 65 to 74 Years | 0 (0.0%) | 46 (4.7%) |
| 75 Years and over | 43 (9.5%) | 15 (2.8%) |
Disability Class: Ambulatory Difficulty
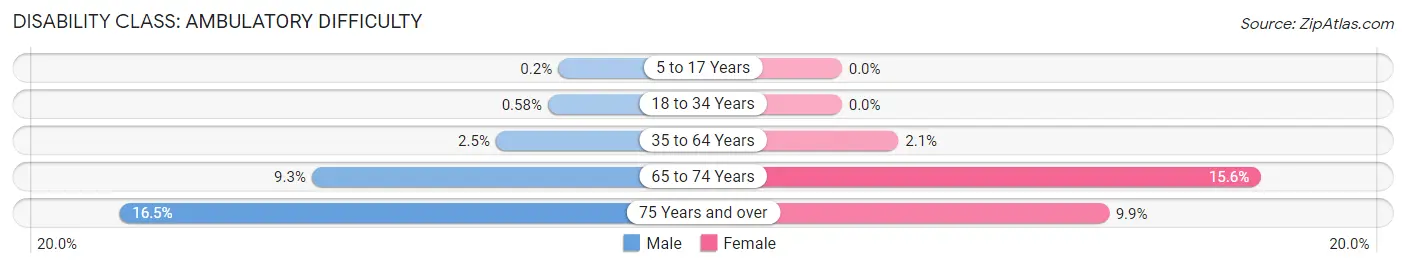
| Age Bracket | Male | Female |
| 5 to 17 Years | 7 (0.2%) | 0 (0.0%) |
| 18 to 34 Years | 14 (0.6%) | 0 (0.0%) |
| 35 to 64 Years | 152 (2.5%) | 127 (2.1%) |
| 65 to 74 Years | 54 (9.3%) | 152 (15.6%) |
| 75 Years and over | 75 (16.5%) | 53 (9.9%) |
Disability Class: Self-Care Difficulty
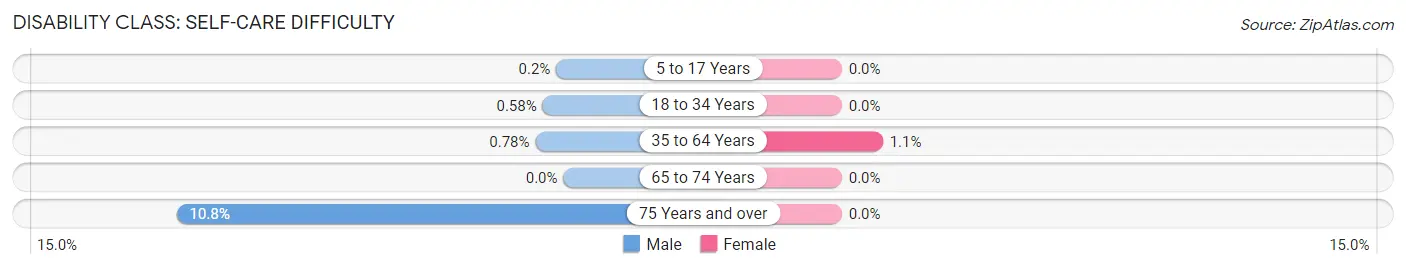
| Age Bracket | Male | Female |
| 5 to 17 Years | 7 (0.2%) | 0 (0.0%) |
| 18 to 34 Years | 14 (0.6%) | 0 (0.0%) |
| 35 to 64 Years | 47 (0.8%) | 69 (1.1%) |
| 65 to 74 Years | 0 (0.0%) | 0 (0.0%) |
| 75 Years and over | 49 (10.8%) | 0 (0.0%) |
Technology Access in Maple Valley
Computing Device Access in Maple Valley
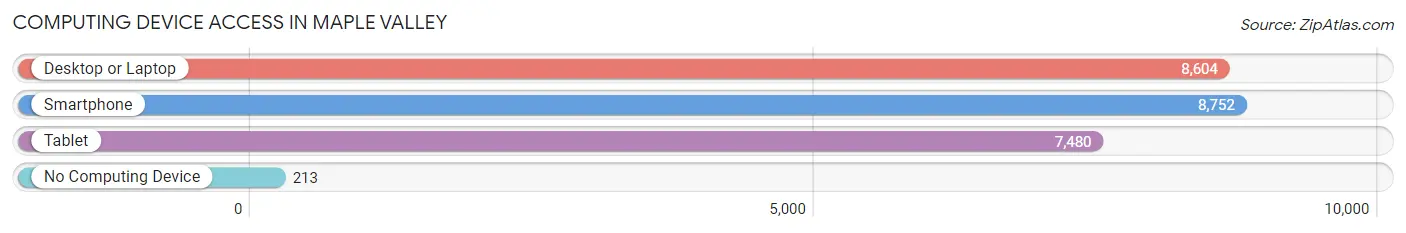
| Device Type | # Households | % Households |
| Desktop or Laptop | 8,604 | 93.6% |
| Smartphone | 8,752 | 95.2% |
| Tablet | 7,480 | 81.4% |
| No Computing Device | 213 | 2.3% |
| Total | 9,193 | 100.0% |
Internet Access in Maple Valley
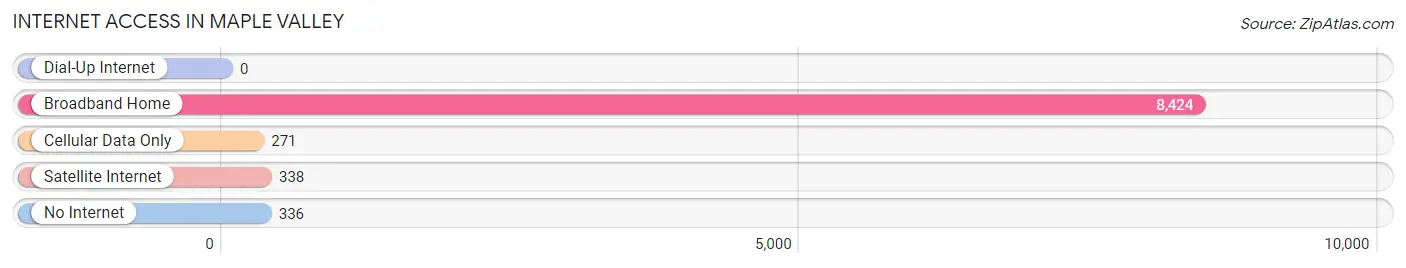
| Internet Type | # Households | % Households |
| Dial-Up Internet | 0 | 0.0% |
| Broadband Home | 8,424 | 91.6% |
| Cellular Data Only | 271 | 2.9% |
| Satellite Internet | 338 | 3.7% |
| No Internet | 336 | 3.6% |
| Total | 9,193 | 100.0% |
Maple Valley Summary
Maple Valley is a city located in King County, Washington, United States. The population was 22,684 at the 2010 census. The city is bordered by the cities of Covington to the west and Renton to the south.
History
The area that is now Maple Valley was first settled in the mid-1800s by homesteaders. The area was originally known as Cedar Mountain, and was later renamed Rock Creek. In the early 1900s, the area was renamed again to Maple Valley, after the many maple trees that grew in the area.
The first post office in the area was established in 1891, and the first school was built in 1895. The area was officially incorporated as a city in 1997.
Geography
Maple Valley is located in the foothills of the Cascade Mountains, about 25 miles southeast of Seattle. The city is situated in the Green River Valley, and is bordered by the cities of Covington to the west and Renton to the south. The city covers an area of 11.7 square miles, and has an elevation of 545 feet.
The city is home to several parks and trails, including Lake Wilderness Park, Rock Creek Trail, and Cedar River Trail. The city is also home to several lakes, including Lake Wilderness, Lake Lucerne, and Lake Sawyer.
Economy
The economy of Maple Valley is largely based on retail, healthcare, and manufacturing. The city is home to several major employers, including Boeing, Microsoft, and Amazon. The city is also home to several small businesses, including restaurants, shops, and service providers.
Demographics
As of the 2010 census, the population of Maple Valley was 22,684. The racial makeup of the city was 79.2% White, 8.2% Asian, 6.2% Hispanic or Latino, 4.2% African American, and 2.2% Native American. The median household income was $87,845, and the median family income was $95,845.
Conclusion
Maple Valley is a city located in King County, Washington, United States. The city is bordered by the cities of Covington to the west and Renton to the south. The area was first settled in the mid-1800s by homesteaders, and was officially incorporated as a city in 1997. The economy of Maple Valley is largely based on retail, healthcare, and manufacturing. As of the 2010 census, the population of Maple Valley was 22,684. The city is home to several parks and trails, and is a great place to live and work.
Common Questions
What is Per Capita Income in Maple Valley?
Per Capita income in Maple Valley is $50,480.
What is the Median Family Income in Maple Valley?
Median Family Income in Maple Valley is $145,105.
What is the Median Household income in Maple Valley?
Median Household Income in Maple Valley is $137,595.
What is Income or Wage Gap in Maple Valley?
Income or Wage Gap in Maple Valley is 51.8%.
Women in Maple Valley earn 48.2 cents for every dollar earned by a man.
What is Family Income Deficit in Maple Valley?
Family Income Deficit in Maple Valley is $15,271.
Families that are below poverty line in Maple Valley earn $15,271 less on average than the poverty threshold level.
What is Inequality or Gini Index in Maple Valley?
Inequality or Gini Index in Maple Valley is 0.36.
What is the Total Population of Maple Valley?
Total Population of Maple Valley is 27,889.
What is the Total Male Population of Maple Valley?
Total Male Population of Maple Valley is 13,933.
What is the Total Female Population of Maple Valley?
Total Female Population of Maple Valley is 13,956.
What is the Ratio of Males per 100 Females in Maple Valley?
There are 99.84 Males per 100 Females in Maple Valley.
What is the Ratio of Females per 100 Males in Maple Valley?
There are 100.17 Females per 100 Males in Maple Valley.
What is the Median Population Age in Maple Valley?
Median Population Age in Maple Valley is 36.4 Years.
What is the Average Family Size in Maple Valley
Average Family Size in Maple Valley is 3.3 People.
What is the Average Household Size in Maple Valley
Average Household Size in Maple Valley is 3.0 People.
How Large is the Labor Force in Maple Valley?
There are 14,066 People in the Labor Forcein in Maple Valley.
What is the Percentage of People in the Labor Force in Maple Valley?
70.5% of People are in the Labor Force in Maple Valley.
What is the Unemployment Rate in Maple Valley?
Unemployment Rate in Maple Valley is 4.9%.