Sisco Heights, WA Map & Demographics
Sisco Heights Map
Sisco Heights Overview
$53,060
PER CAPITA INCOME
$121,848
AVG FAMILY INCOME
$119,036
AVG HOUSEHOLD INCOME
45.2%
WAGE / INCOME GAP [ % ]
54.8¢/ $1
WAGE / INCOME GAP [ $ ]
0.40
INEQUALITY / GINI INDEX
2,972
TOTAL POPULATION
1,618
MALE POPULATION
1,354
FEMALE POPULATION
119.50
MALES / 100 FEMALES
83.68
FEMALES / 100 MALES
45.6
MEDIAN AGE
3.2
AVG FAMILY SIZE
2.9
AVG HOUSEHOLD SIZE
1,546
LABOR FORCE [ PEOPLE ]
64.3%
PERCENT IN LABOR FORCE
4.8%
UNEMPLOYMENT RATE
Income in Sisco Heights
Income Overview in Sisco Heights
Per Capita Income in Sisco Heights is $53,060, while median incomes of families and households are $121,848 and $119,036 respectively.
| Characteristic | Number | Measure |
| Per Capita Income | 2,972 | $53,060 |
| Median Family Income | 844 | $121,848 |
| Mean Family Income | 844 | $161,362 |
| Median Household Income | 1,035 | $119,036 |
| Mean Household Income | 1,035 | $150,255 |
| Income Deficit | 844 | $0 |
| Wage / Income Gap (%) | 2,972 | 45.18% |
| Wage / Income Gap ($) | 2,972 | 54.82¢ per $1 |
| Gini / Inequality Index | 2,972 | 0.40 |
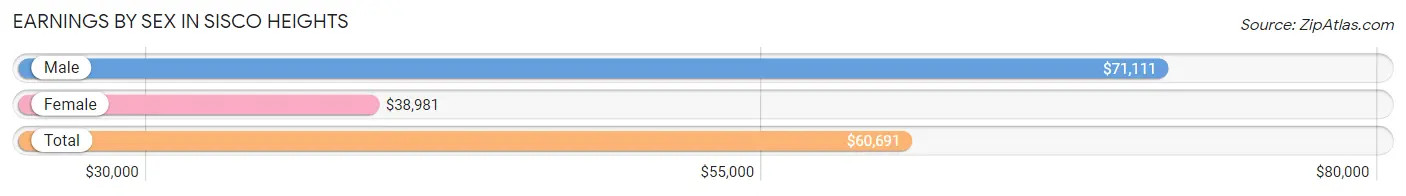
Earnings by Sex in Sisco Heights
Average Earnings in Sisco Heights are $60,691, $71,111 for men and $38,981 for women, a difference of 45.2%.
| Sex | Number | Average Earnings |
| Male | 982 (59.3%) | $71,111 |
| Female | 674 (40.7%) | $38,981 |
| Total | 1,656 (100.0%) | $60,691 |
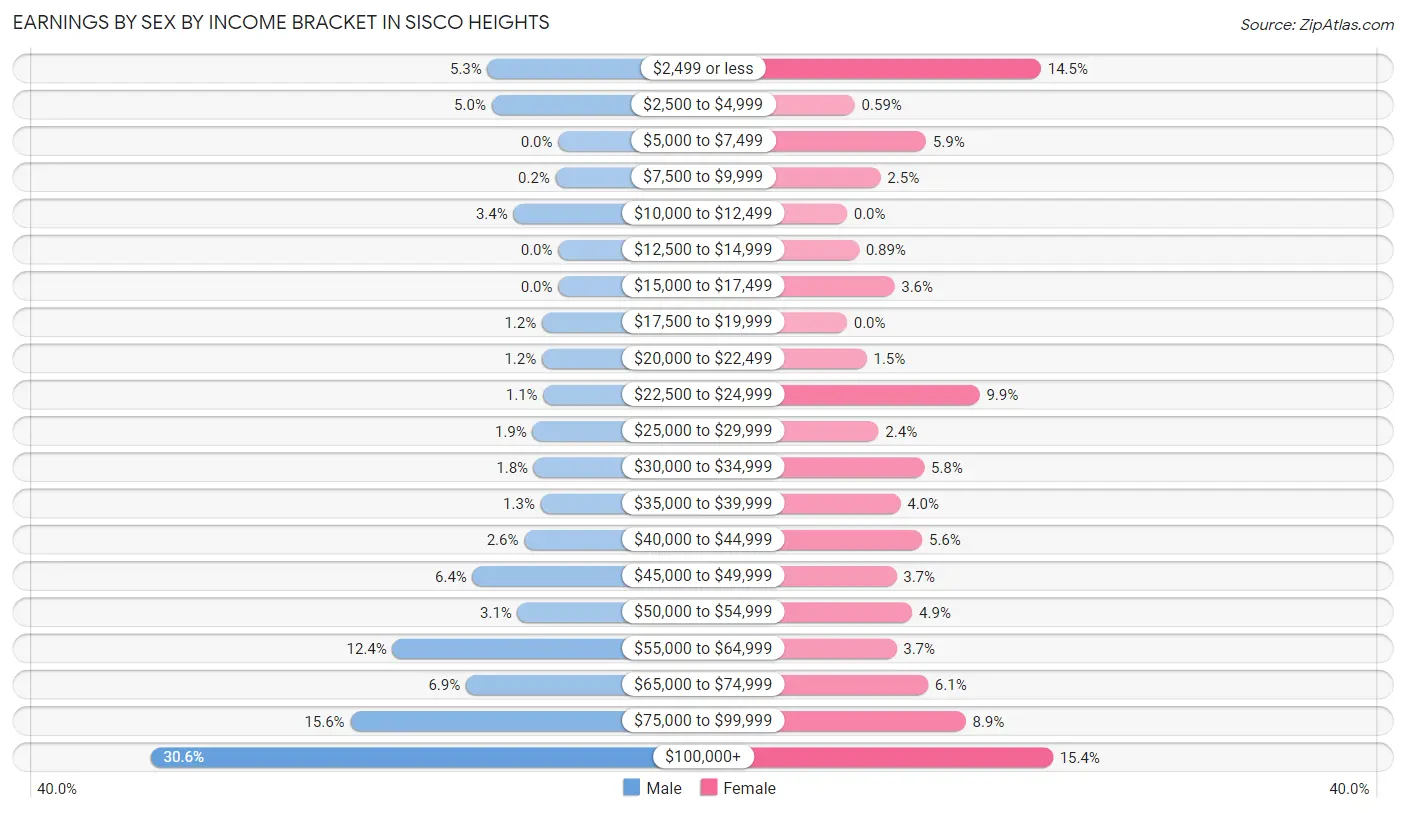
Earnings by Sex by Income Bracket in Sisco Heights
The most common earnings brackets in Sisco Heights are $100,000+ for men (300 | 30.5%) and $100,000+ for women (104 | 15.4%).
| Income | Male | Female |
| $2,499 or less | 52 (5.3%) | 98 (14.5%) |
| $2,500 to $4,999 | 49 (5.0%) | 4 (0.6%) |
| $5,000 to $7,499 | 0 (0.0%) | 40 (5.9%) |
| $7,500 to $9,999 | 2 (0.2%) | 17 (2.5%) |
| $10,000 to $12,499 | 33 (3.4%) | 0 (0.0%) |
| $12,500 to $14,999 | 0 (0.0%) | 6 (0.9%) |
| $15,000 to $17,499 | 0 (0.0%) | 24 (3.6%) |
| $17,500 to $19,999 | 12 (1.2%) | 0 (0.0%) |
| $20,000 to $22,499 | 12 (1.2%) | 10 (1.5%) |
| $22,500 to $24,999 | 11 (1.1%) | 67 (9.9%) |
| $25,000 to $29,999 | 19 (1.9%) | 16 (2.4%) |
| $30,000 to $34,999 | 18 (1.8%) | 39 (5.8%) |
| $35,000 to $39,999 | 13 (1.3%) | 27 (4.0%) |
| $40,000 to $44,999 | 25 (2.5%) | 38 (5.6%) |
| $45,000 to $49,999 | 63 (6.4%) | 25 (3.7%) |
| $50,000 to $54,999 | 30 (3.0%) | 33 (4.9%) |
| $55,000 to $64,999 | 122 (12.4%) | 25 (3.7%) |
| $65,000 to $74,999 | 68 (6.9%) | 41 (6.1%) |
| $75,000 to $99,999 | 153 (15.6%) | 60 (8.9%) |
| $100,000+ | 300 (30.5%) | 104 (15.4%) |
| Total | 982 (100.0%) | 674 (100.0%) |
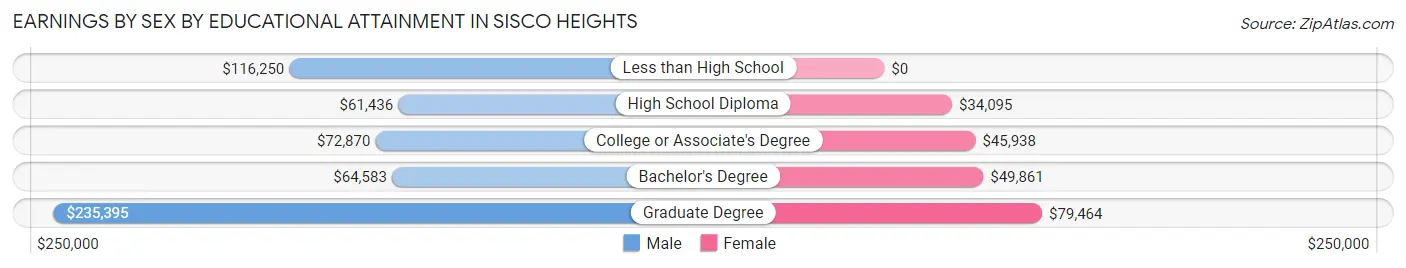
Earnings by Sex by Educational Attainment in Sisco Heights
Average earnings in Sisco Heights are $72,955 for men and $41,638 for women, a difference of 42.9%. Men with an educational attainment of graduate degree enjoy the highest average annual earnings of $235,395, while those with high school diploma education earn the least with $61,436. Women with an educational attainment of graduate degree earn the most with the average annual earnings of $79,464, while those with high school diploma education have the smallest earnings of $34,095.
| Educational Attainment | Male Income | Female Income |
| Less than High School | $116,250 | $0 |
| High School Diploma | $61,436 | $34,095 |
| College or Associate's Degree | $72,870 | $45,938 |
| Bachelor's Degree | $64,583 | $49,861 |
| Graduate Degree | $235,395 | $79,464 |
| Total | $72,955 | $41,638 |
Family Income in Sisco Heights
Family Income Brackets in Sisco Heights
According to the Sisco Heights family income data, there are 227 families falling into the $100,000 to $149,999 income range, which is the most common income bracket and makes up 26.9% of all families.
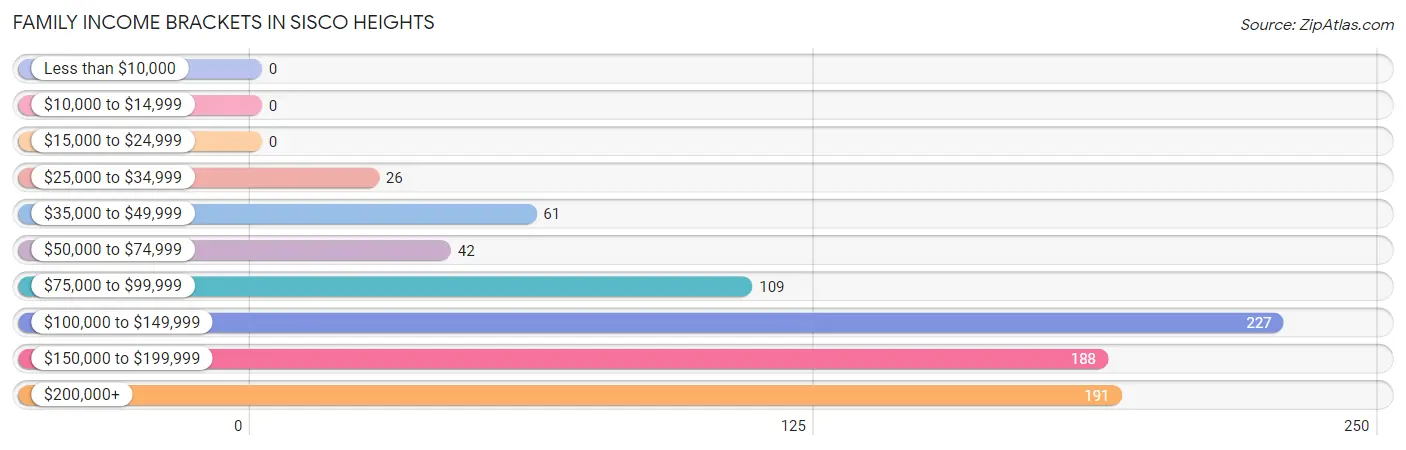
| Income Bracket | # Families | % Families |
| Less than $10,000 | 0 | 0.0% |
| $10,000 to $14,999 | 0 | 0.0% |
| $15,000 to $24,999 | 0 | 0.0% |
| $25,000 to $34,999 | 26 | 3.1% |
| $35,000 to $49,999 | 61 | 7.2% |
| $50,000 to $74,999 | 42 | 5.0% |
| $75,000 to $99,999 | 109 | 12.9% |
| $100,000 to $149,999 | 227 | 26.9% |
| $150,000 to $199,999 | 188 | 22.3% |
| $200,000+ | 191 | 22.6% |
Family Income by Famaliy Size in Sisco Heights
7+ person families (25 | 3.0%) account for the highest median family income in Sisco Heights with $250,001 per family, while 2-person families (313 | 37.1%) have the highest median income of $57,396 per family member.
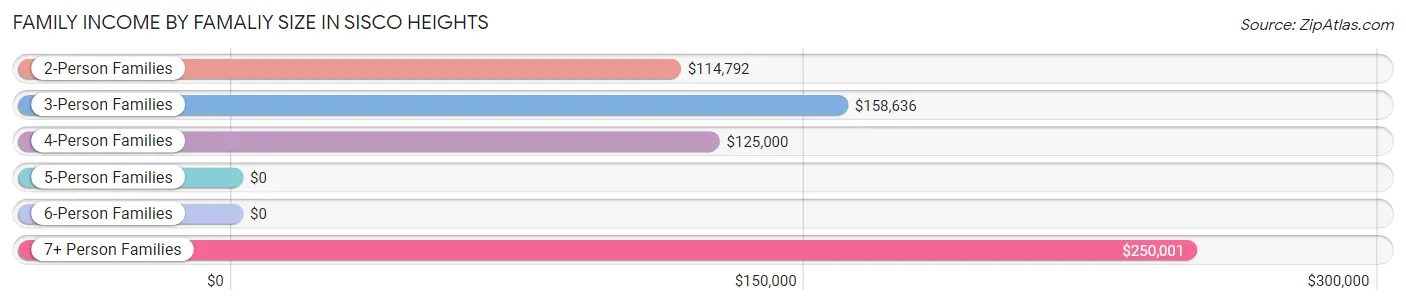
| Income Bracket | # Families | Median Income |
| 2-Person Families | 313 (37.1%) | $114,792 |
| 3-Person Families | 272 (32.2%) | $158,636 |
| 4-Person Families | 216 (25.6%) | $125,000 |
| 5-Person Families | 2 (0.2%) | $0 |
| 6-Person Families | 16 (1.9%) | $0 |
| 7+ Person Families | 25 (3.0%) | $250,001 |
| Total | 844 (100.0%) | $121,848 |
Family Income by Number of Earners in Sisco Heights
The median family income in Sisco Heights is $121,848, with families comprising 2 earners (410) having the highest median family income of $173,081, while families with no earners (135) have the lowest median family income of $109,145, accounting for 48.6% and 16.0% of families, respectively.
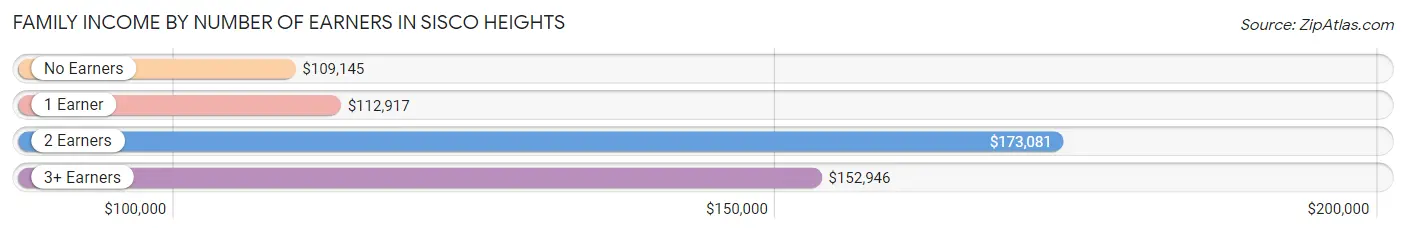
| Number of Earners | # Families | Median Income |
| No Earners | 135 (16.0%) | $109,145 |
| 1 Earner | 166 (19.7%) | $112,917 |
| 2 Earners | 410 (48.6%) | $173,081 |
| 3+ Earners | 133 (15.8%) | $152,946 |
| Total | 844 (100.0%) | $121,848 |
Household Income in Sisco Heights
Household Income Brackets in Sisco Heights
With 270 households falling in the category, the $100,000 to $149,999 income range is the most frequent in Sisco Heights, accounting for 26.1% of all households.
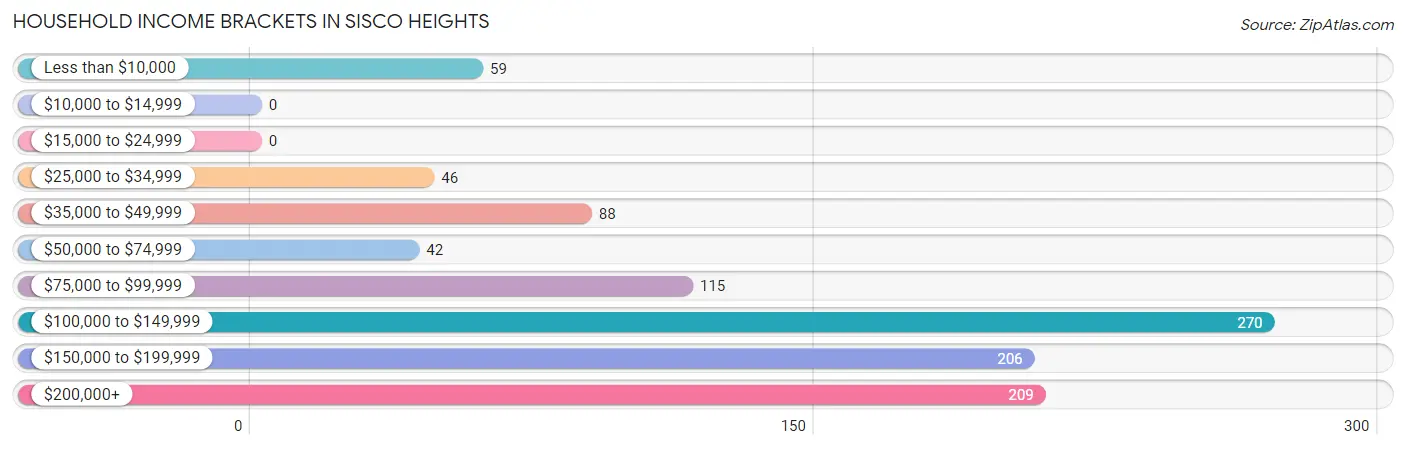
| Income Bracket | # Households | % Households |
| Less than $10,000 | 59 | 5.7% |
| $10,000 to $14,999 | 0 | 0.0% |
| $15,000 to $24,999 | 0 | 0.0% |
| $25,000 to $34,999 | 46 | 4.4% |
| $35,000 to $49,999 | 88 | 8.5% |
| $50,000 to $74,999 | 42 | 4.1% |
| $75,000 to $99,999 | 115 | 11.1% |
| $100,000 to $149,999 | 270 | 26.1% |
| $150,000 to $199,999 | 206 | 19.9% |
| $200,000+ | 209 | 20.2% |
Household Income by Householder Age in Sisco Heights
The median household income in Sisco Heights is $119,036, with the highest median household income of $149,531 found in the 45 to 64 years age bracket for the primary householder. A total of 599 households (57.9%) fall into this category.
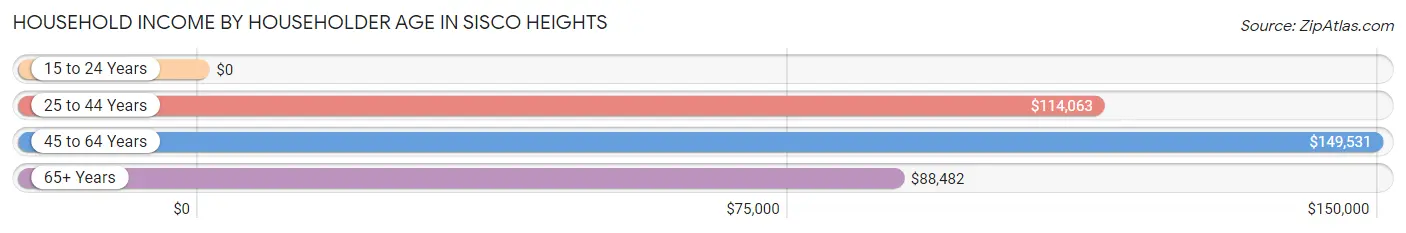
| Income Bracket | # Households | Median Income |
| 15 to 24 Years | 0 (0.0%) | $0 |
| 25 to 44 Years | 237 (22.9%) | $114,063 |
| 45 to 64 Years | 599 (57.9%) | $149,531 |
| 65+ Years | 199 (19.2%) | $88,482 |
| Total | 1,035 (100.0%) | $119,036 |
Poverty in Sisco Heights
Income Below Poverty by Sex and Age in Sisco Heights
With 3.6% poverty level for males and 1.6% for females among the residents of Sisco Heights, 55 to 64 year old males and 25 to 34 year old females are the most vulnerable to poverty, with 59 males (14.9%) and 9 females (6.9%) in their respective age groups living below the poverty level.
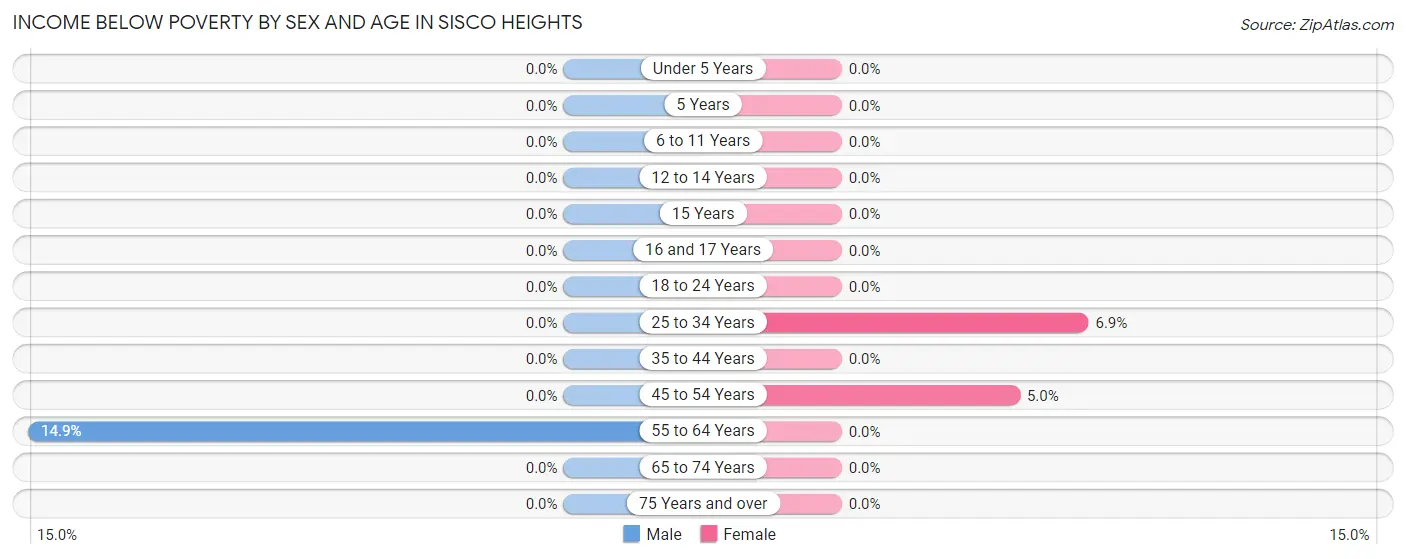
| Age Bracket | Male | Female |
| Under 5 Years | 0 (0.0%) | 0 (0.0%) |
| 5 Years | 0 (0.0%) | 0 (0.0%) |
| 6 to 11 Years | 0 (0.0%) | 0 (0.0%) |
| 12 to 14 Years | 0 (0.0%) | 0 (0.0%) |
| 15 Years | 0 (0.0%) | 0 (0.0%) |
| 16 and 17 Years | 0 (0.0%) | 0 (0.0%) |
| 18 to 24 Years | 0 (0.0%) | 0 (0.0%) |
| 25 to 34 Years | 0 (0.0%) | 9 (6.9%) |
| 35 to 44 Years | 0 (0.0%) | 0 (0.0%) |
| 45 to 54 Years | 0 (0.0%) | 12 (5.0%) |
| 55 to 64 Years | 59 (14.9%) | 0 (0.0%) |
| 65 to 74 Years | 0 (0.0%) | 0 (0.0%) |
| 75 Years and over | 0 (0.0%) | 0 (0.0%) |
| Total | 59 (3.6%) | 21 (1.6%) |
Income Above Poverty by Sex and Age in Sisco Heights
According to the poverty statistics in Sisco Heights, males aged under 5 years and females aged under 5 years are the age groups that are most secure financially, with 100.0% of males and 100.0% of females in these age groups living above the poverty line.
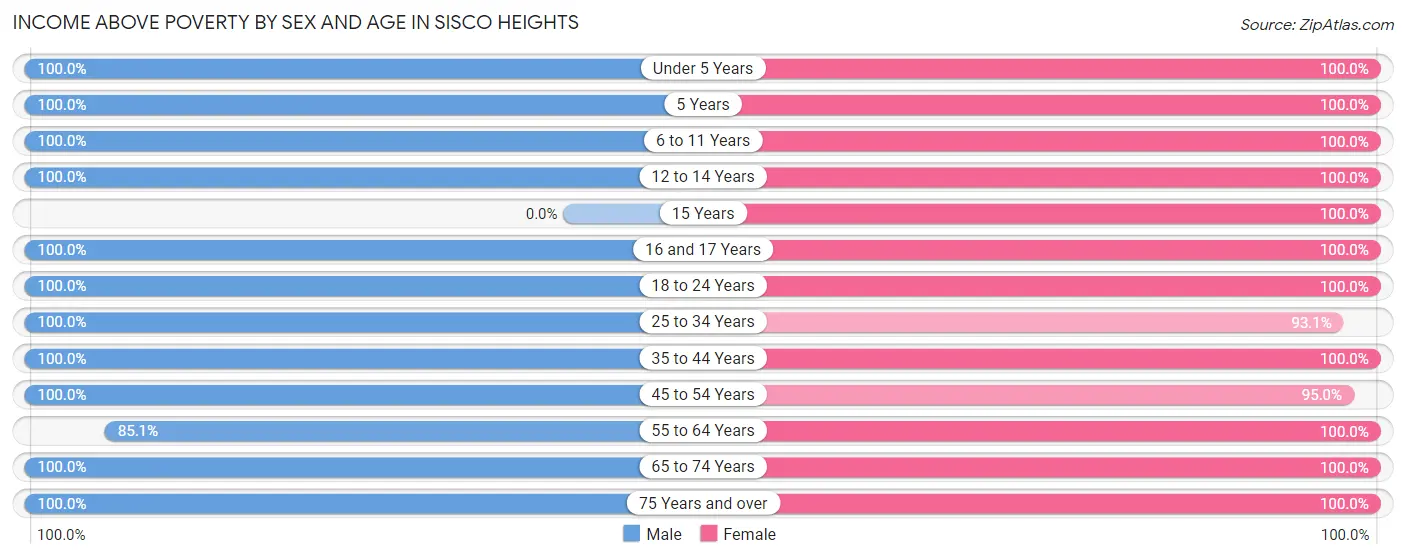
| Age Bracket | Male | Female |
| Under 5 Years | 129 (100.0%) | 67 (100.0%) |
| 5 Years | 8 (100.0%) | 9 (100.0%) |
| 6 to 11 Years | 149 (100.0%) | 46 (100.0%) |
| 12 to 14 Years | 80 (100.0%) | 53 (100.0%) |
| 15 Years | 0 (0.0%) | 19 (100.0%) |
| 16 and 17 Years | 10 (100.0%) | 29 (100.0%) |
| 18 to 24 Years | 48 (100.0%) | 97 (100.0%) |
| 25 to 34 Years | 197 (100.0%) | 122 (93.1%) |
| 35 to 44 Years | 196 (100.0%) | 188 (100.0%) |
| 45 to 54 Years | 234 (100.0%) | 230 (95.0%) |
| 55 to 64 Years | 337 (85.1%) | 264 (100.0%) |
| 65 to 74 Years | 133 (100.0%) | 134 (100.0%) |
| 75 Years and over | 38 (100.0%) | 67 (100.0%) |
| Total | 1,559 (96.4%) | 1,325 (98.4%) |
Income Below Poverty Among Married-Couple Families in Sisco Heights
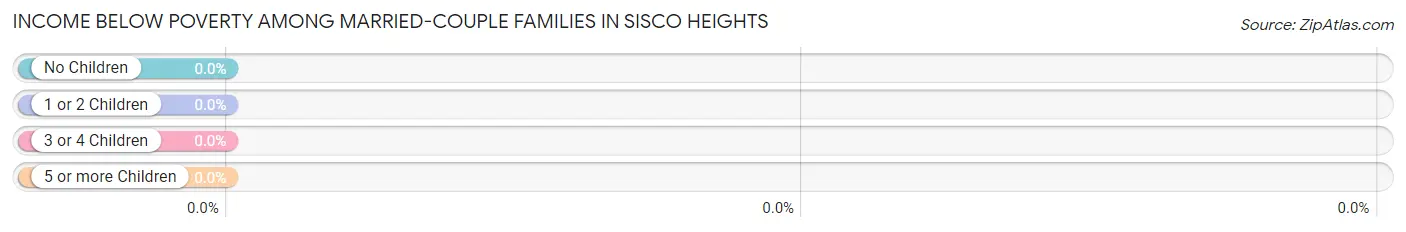
| Children | Above Poverty | Below Poverty |
| No Children | 490 (100.0%) | 0 (0.0%) |
| 1 or 2 Children | 279 (100.0%) | 0 (0.0%) |
| 3 or 4 Children | 22 (100.0%) | 0 (0.0%) |
| 5 or more Children | 0 (0.0%) | 0 (0.0%) |
| Total | 791 (100.0%) | 0 (0.0%) |
Income Below Poverty Among Single-Parent Households in Sisco Heights
| Children | Single Father | Single Mother |
| No Children | 0 (0.0%) | 0 (0.0%) |
| 1 or 2 Children | 0 (0.0%) | 0 (0.0%) |
| 3 or 4 Children | 0 (0.0%) | 0 (0.0%) |
| 5 or more Children | 0 (0.0%) | 0 (0.0%) |
| Total | 0 (0.0%) | 0 (0.0%) |
Income Below Poverty Among Married-Couple vs Single-Parent Households in Sisco Heights
| Children | Married-Couple Families | Single-Parent Households |
| No Children | 0 (0.0%) | 0 (0.0%) |
| 1 or 2 Children | 0 (0.0%) | 0 (0.0%) |
| 3 or 4 Children | 0 (0.0%) | 0 (0.0%) |
| 5 or more Children | 0 (0.0%) | 0 (0.0%) |
| Total | 0 (0.0%) | 0 (0.0%) |
Race in Sisco Heights
The most populous races in Sisco Heights are White / Caucasian (2,500 | 84.1%), Two or more Races (366 | 12.3%), and Hispanic or Latino (254 | 8.6%).
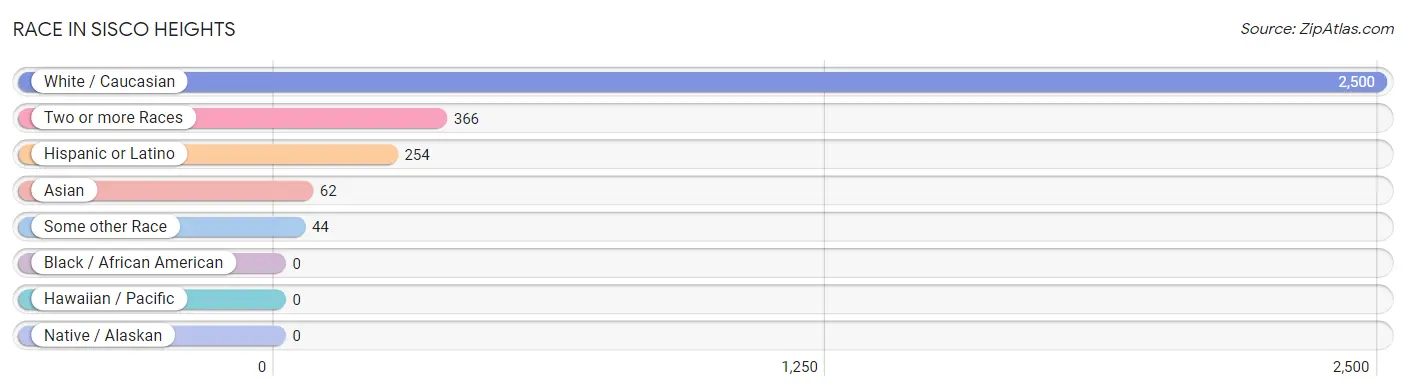
| Race | # Population | % Population |
| Asian | 62 | 2.1% |
| Black / African American | 0 | 0.0% |
| Hawaiian / Pacific | 0 | 0.0% |
| Hispanic or Latino | 254 | 8.6% |
| Native / Alaskan | 0 | 0.0% |
| White / Caucasian | 2,500 | 84.1% |
| Two or more Races | 366 | 12.3% |
| Some other Race | 44 | 1.5% |
| Total | 2,972 | 100.0% |
Ancestry in Sisco Heights
The most populous ancestries reported in Sisco Heights are German (808 | 27.2%), English (328 | 11.0%), Norwegian (260 | 8.7%), Dutch (240 | 8.1%), and Irish (228 | 7.7%), together accounting for 62.7% of all Sisco Heights residents.
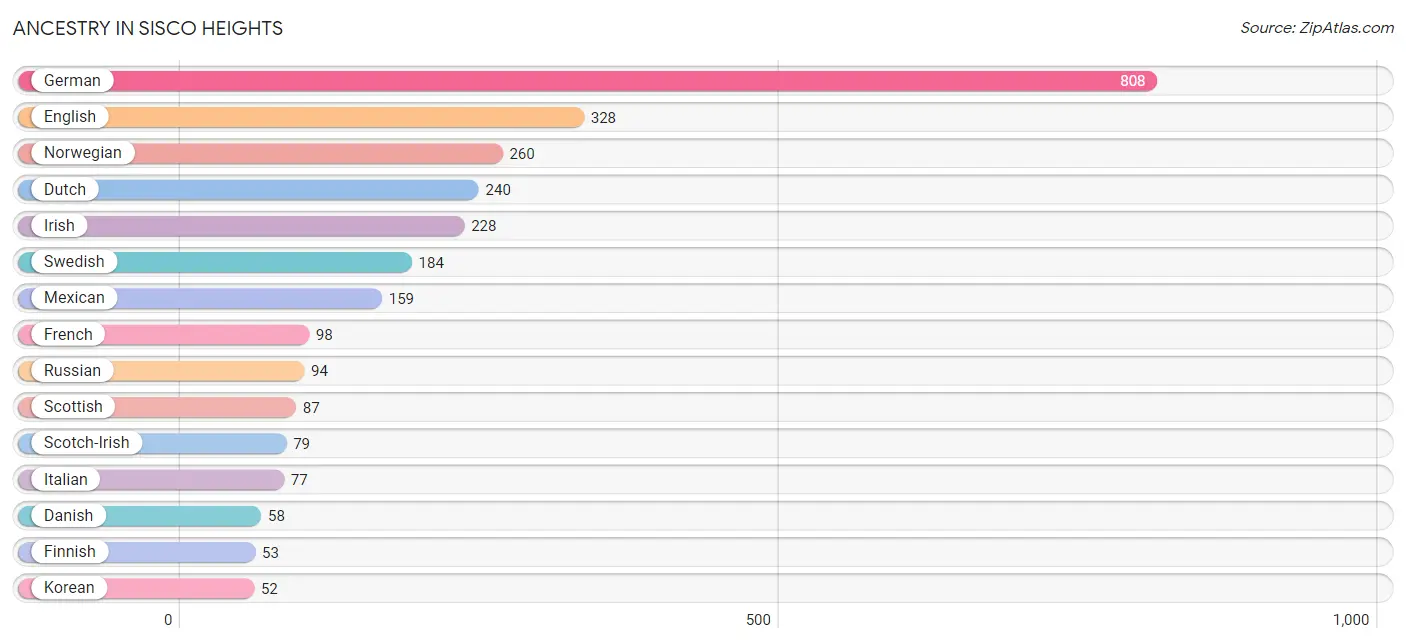
| Ancestry | # Population | % Population |
| American | 47 | 1.6% |
| Arab | 14 | 0.5% |
| Bhutanese | 10 | 0.3% |
| British | 2 | 0.1% |
| Burmese | 10 | 0.3% |
| Central American | 17 | 0.6% |
| Colombian | 9 | 0.3% |
| Danish | 58 | 1.9% |
| Dutch | 240 | 8.1% |
| English | 328 | 11.0% |
| European | 33 | 1.1% |
| Finnish | 53 | 1.8% |
| French | 98 | 3.3% |
| German | 808 | 27.2% |
| Irish | 228 | 7.7% |
| Italian | 77 | 2.6% |
| Korean | 52 | 1.8% |
| Lebanese | 14 | 0.5% |
| Lithuanian | 7 | 0.2% |
| Mexican | 159 | 5.3% |
| Native Hawaiian | 23 | 0.8% |
| Norwegian | 260 | 8.7% |
| Polish | 5 | 0.2% |
| Puerto Rican | 16 | 0.5% |
| Russian | 94 | 3.2% |
| Salvadoran | 17 | 0.6% |
| Scandinavian | 35 | 1.2% |
| Scotch-Irish | 79 | 2.7% |
| Scottish | 87 | 2.9% |
| South American | 9 | 0.3% |
| Spaniard | 7 | 0.2% |
| Spanish | 46 | 1.5% |
| Swedish | 184 | 6.2% |
| Welsh | 4 | 0.1% | View All 34 Rows |
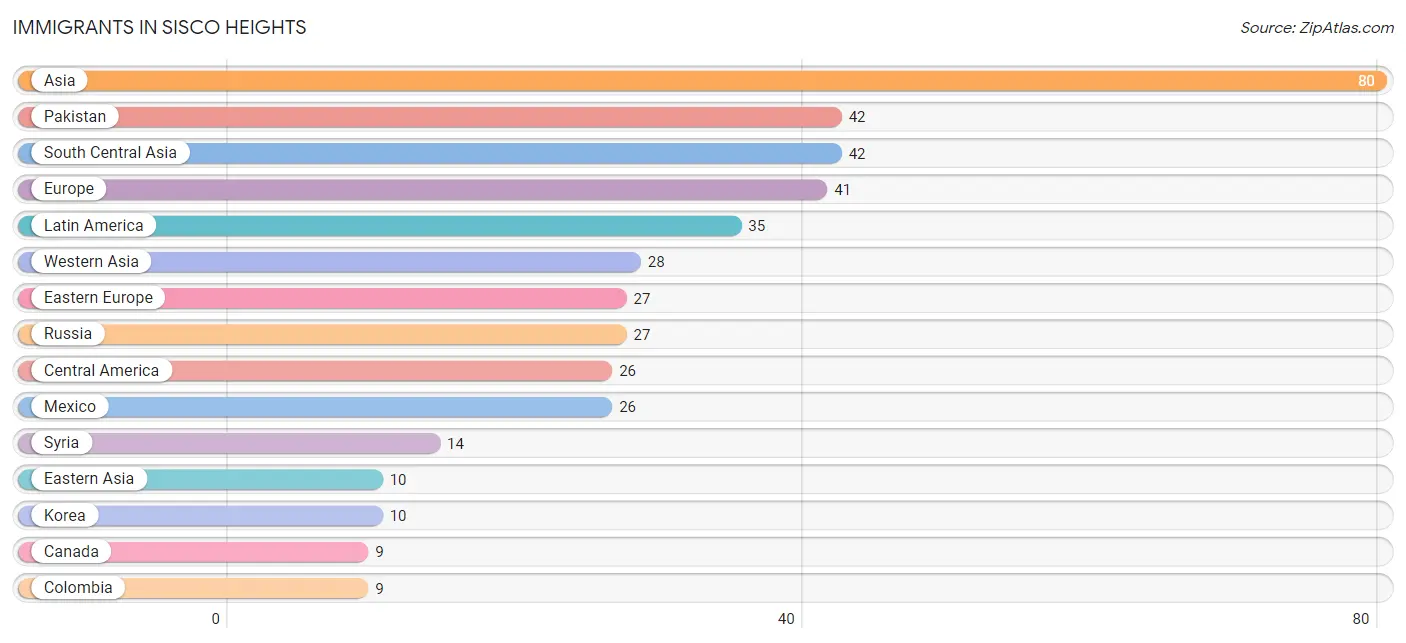
Immigrants in Sisco Heights
The most numerous immigrant groups reported in Sisco Heights came from Asia (80 | 2.7%), Pakistan (42 | 1.4%), South Central Asia (42 | 1.4%), Europe (41 | 1.4%), and Latin America (35 | 1.2%), together accounting for 8.1% of all Sisco Heights residents.
| Immigration Origin | # Population | % Population |
| Asia | 80 | 2.7% |
| Canada | 9 | 0.3% |
| Central America | 26 | 0.9% |
| Colombia | 9 | 0.3% |
| Eastern Asia | 10 | 0.3% |
| Eastern Europe | 27 | 0.9% |
| England | 7 | 0.2% |
| Europe | 41 | 1.4% |
| Korea | 10 | 0.3% |
| Latin America | 35 | 1.2% |
| Mexico | 26 | 0.9% |
| Northern Europe | 7 | 0.2% |
| Pakistan | 42 | 1.4% |
| Russia | 27 | 0.9% |
| South America | 9 | 0.3% |
| South Central Asia | 42 | 1.4% |
| Southern Europe | 7 | 0.2% |
| Spain | 7 | 0.2% |
| Syria | 14 | 0.5% |
| Western Asia | 28 | 0.9% | View All 20 Rows |
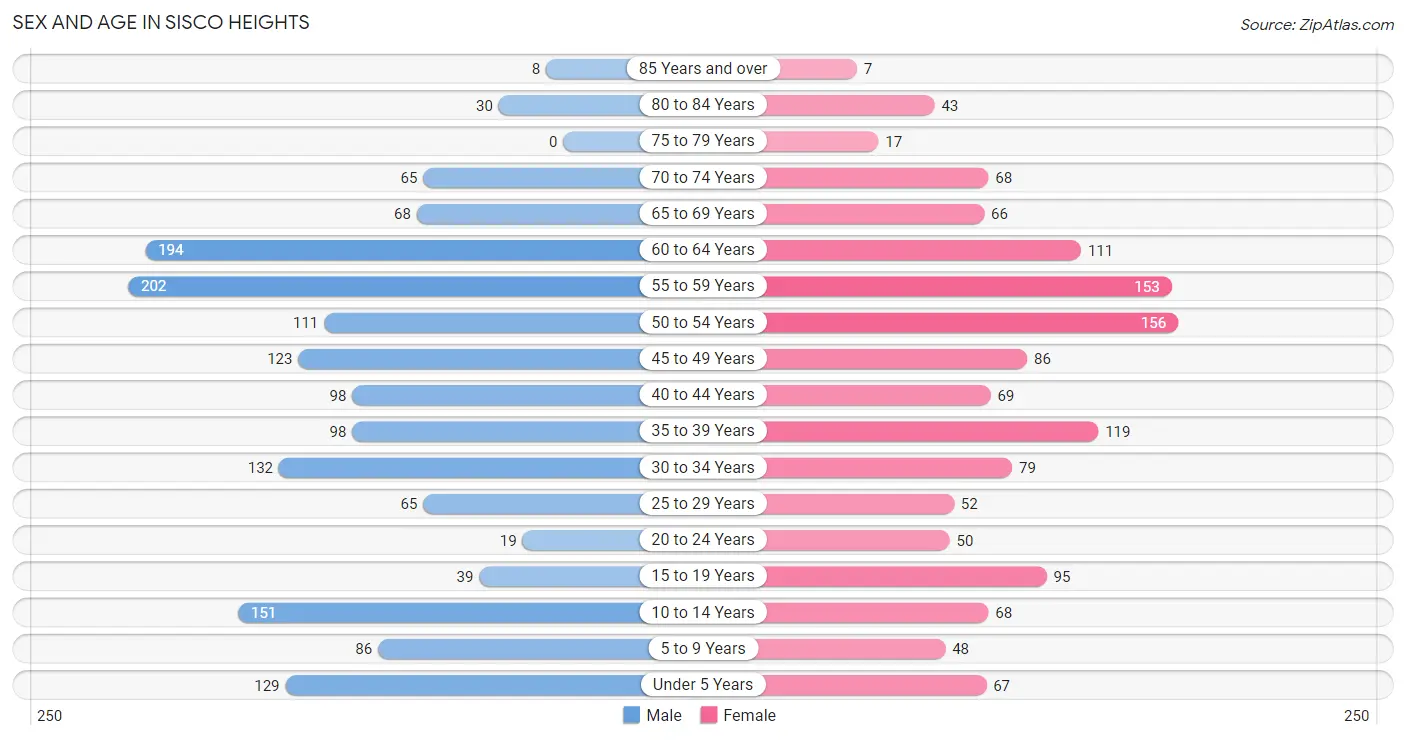
Sex and Age in Sisco Heights
Sex and Age in Sisco Heights
The most populous age groups in Sisco Heights are 55 to 59 Years (202 | 12.5%) for men and 50 to 54 Years (156 | 11.5%) for women.
| Age Bracket | Male | Female |
| Under 5 Years | 129 (8.0%) | 67 (5.0%) |
| 5 to 9 Years | 86 (5.3%) | 48 (3.5%) |
| 10 to 14 Years | 151 (9.3%) | 68 (5.0%) |
| 15 to 19 Years | 39 (2.4%) | 95 (7.0%) |
| 20 to 24 Years | 19 (1.2%) | 50 (3.7%) |
| 25 to 29 Years | 65 (4.0%) | 52 (3.8%) |
| 30 to 34 Years | 132 (8.2%) | 79 (5.8%) |
| 35 to 39 Years | 98 (6.1%) | 119 (8.8%) |
| 40 to 44 Years | 98 (6.1%) | 69 (5.1%) |
| 45 to 49 Years | 123 (7.6%) | 86 (6.4%) |
| 50 to 54 Years | 111 (6.9%) | 156 (11.5%) |
| 55 to 59 Years | 202 (12.5%) | 153 (11.3%) |
| 60 to 64 Years | 194 (12.0%) | 111 (8.2%) |
| 65 to 69 Years | 68 (4.2%) | 66 (4.9%) |
| 70 to 74 Years | 65 (4.0%) | 68 (5.0%) |
| 75 to 79 Years | 0 (0.0%) | 17 (1.3%) |
| 80 to 84 Years | 30 (1.8%) | 43 (3.2%) |
| 85 Years and over | 8 (0.5%) | 7 (0.5%) |
| Total | 1,618 (100.0%) | 1,354 (100.0%) |
Families and Households in Sisco Heights
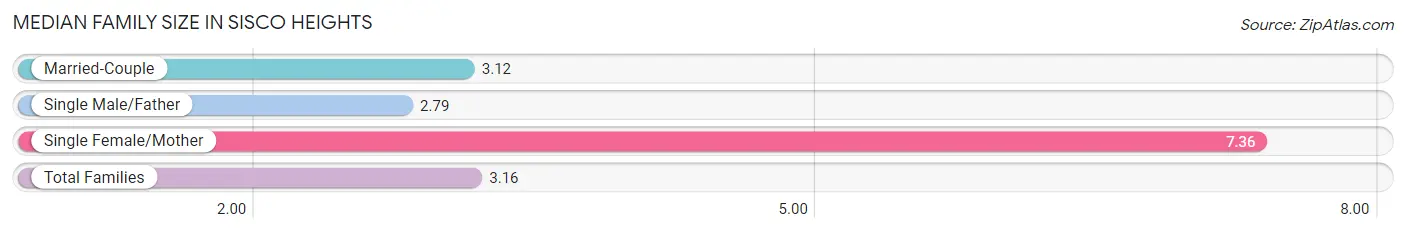
Median Family Size in Sisco Heights
The median family size in Sisco Heights is 3.16 persons per family, with single female/mother families (11 | 1.3%) accounting for the largest median family size of 7.36 persons per family. On the other hand, single male/father families (42 | 5.0%) represent the smallest median family size with 2.79 persons per family.
| Family Type | # Families | Family Size |
| Married-Couple | 791 (93.7%) | 3.12 |
| Single Male/Father | 42 (5.0%) | 2.79 |
| Single Female/Mother | 11 (1.3%) | 7.36 |
| Total Families | 844 (100.0%) | 3.16 |
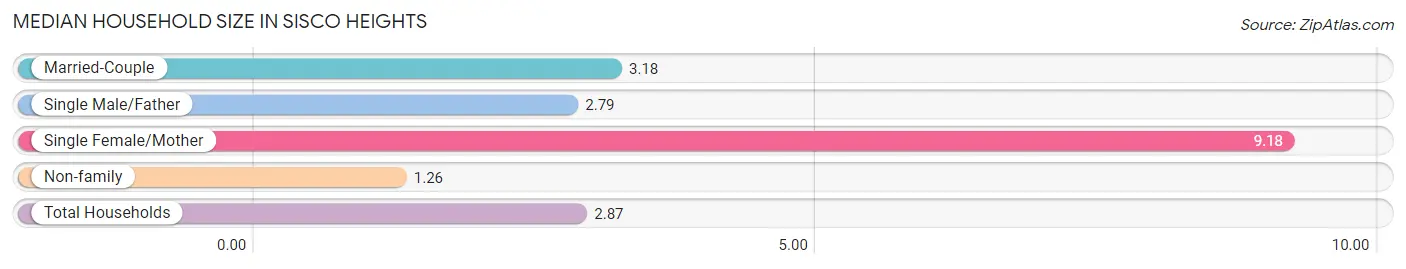
Median Household Size in Sisco Heights
The median household size in Sisco Heights is 2.87 persons per household, with single female/mother households (11 | 1.1%) accounting for the largest median household size of 9.18 persons per household. non-family households (191 | 18.4%) represent the smallest median household size with 1.26 persons per household.
| Household Type | # Households | Household Size |
| Married-Couple | 791 (76.4%) | 3.18 |
| Single Male/Father | 42 (4.1%) | 2.79 |
| Single Female/Mother | 11 (1.1%) | 9.18 |
| Non-family | 191 (18.4%) | 1.26 |
| Total Households | 1,035 (100.0%) | 2.87 |
Household Size by Marriage Status in Sisco Heights
Out of a total of 1,035 households in Sisco Heights, 844 (81.6%) are family households, while 191 (18.4%) are nonfamily households. The most numerous type of family households are 2-person households, comprising 313, and the most common type of nonfamily households are 1-person households, comprising 150.
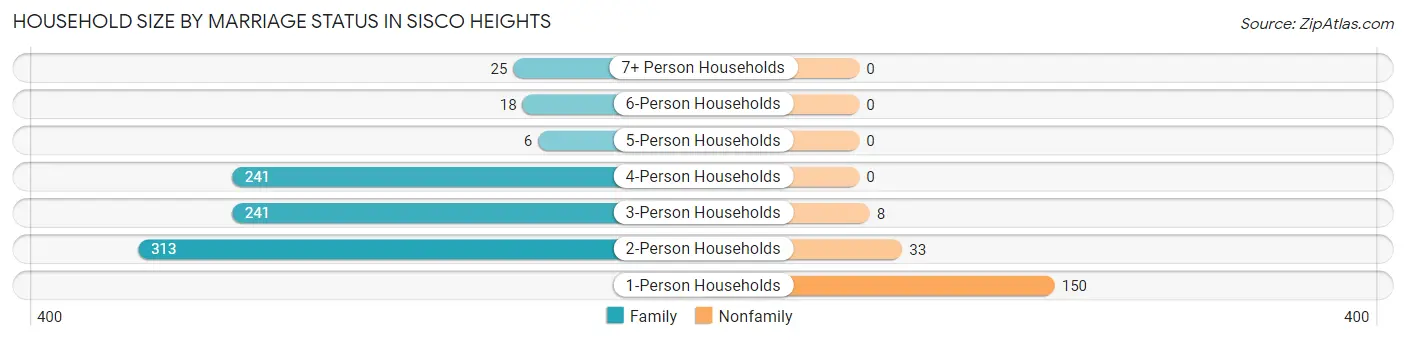
| Household Size | Family Households | Nonfamily Households |
| 1-Person Households | - | 150 (14.5%) |
| 2-Person Households | 313 (30.2%) | 33 (3.2%) |
| 3-Person Households | 241 (23.3%) | 8 (0.8%) |
| 4-Person Households | 241 (23.3%) | 0 (0.0%) |
| 5-Person Households | 6 (0.6%) | 0 (0.0%) |
| 6-Person Households | 18 (1.7%) | 0 (0.0%) |
| 7+ Person Households | 25 (2.4%) | 0 (0.0%) |
| Total | 844 (81.6%) | 191 (18.4%) |
Female Fertility in Sisco Heights
Fertility by Age in Sisco Heights
Average fertility rate in Sisco Heights is 86.0 births per 1,000 women. Women in the age bracket of 35 to 50 years have the highest fertility rate with 122.0 births per 1,000 women. Women in the age bracket of 35 to 50 years acount for 79.2% of all women with births.
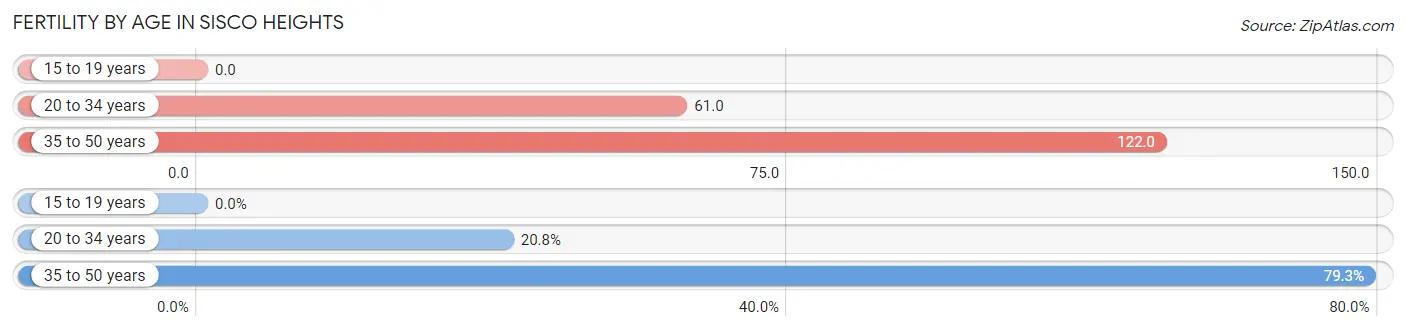
| Age Bracket | Women with Births | Births / 1,000 Women |
| 15 to 19 years | 0 (0.0%) | 0.0 |
| 20 to 34 years | 11 (20.7%) | 61.0 |
| 35 to 50 years | 42 (79.2%) | 122.0 |
| Total | 53 (100.0%) | 86.0 |
Fertility by Age by Marriage Status in Sisco Heights
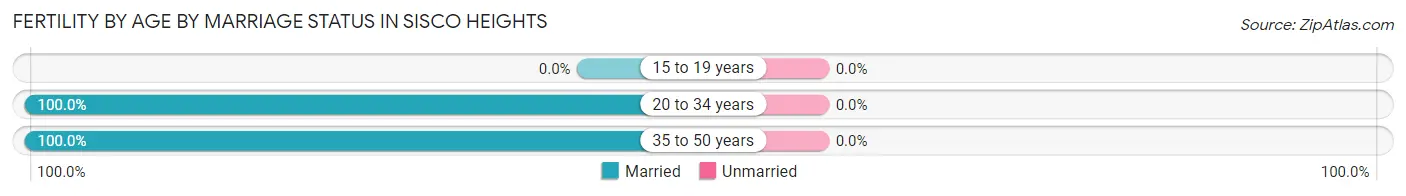
| Age Bracket | Married | Unmarried |
| 15 to 19 years | 0 (0.0%) | 0 (0.0%) |
| 20 to 34 years | 11 (100.0%) | 0 (0.0%) |
| 35 to 50 years | 42 (100.0%) | 0 (0.0%) |
| Total | 53 (100.0%) | 0 (0.0%) |
Fertility by Education in Sisco Heights
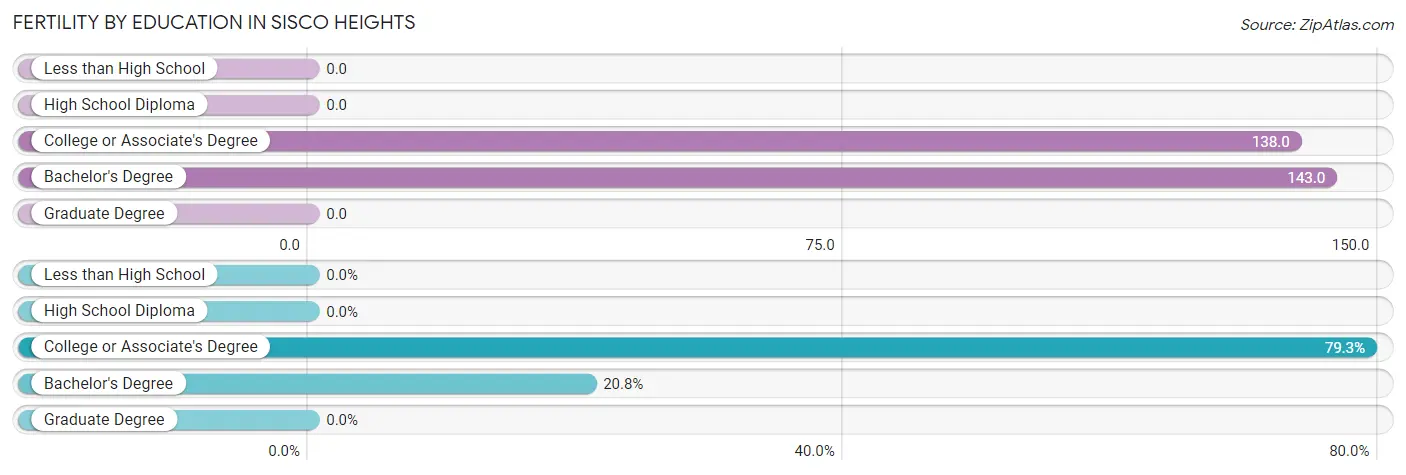
| Educational Attainment | Women with Births | Births / 1,000 Women |
| Less than High School | 0 (0.0%) | 0.0 |
| High School Diploma | 0 (0.0%) | 0.0 |
| College or Associate's Degree | 42 (79.2%) | 138.0 |
| Bachelor's Degree | 11 (20.7%) | 143.0 |
| Graduate Degree | 0 (0.0%) | 0.0 |
| Total | 53 (100.0%) | 86.0 |
Fertility by Education by Marriage Status in Sisco Heights
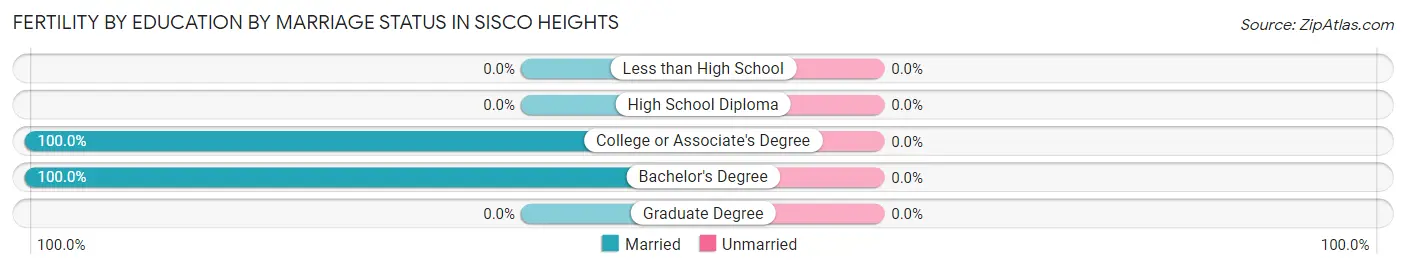
| Educational Attainment | Married | Unmarried |
| Less than High School | 0 (0.0%) | 0 (0.0%) |
| High School Diploma | 0 (0.0%) | 0 (0.0%) |
| College or Associate's Degree | 42 (100.0%) | 0 (0.0%) |
| Bachelor's Degree | 11 (100.0%) | 0 (0.0%) |
| Graduate Degree | 0 (0.0%) | 0 (0.0%) |
| Total | 53 (100.0%) | 0 (0.0%) |
Employment Characteristics in Sisco Heights
Employment by Class of Employer in Sisco Heights
Among the 1,423 employed individuals in Sisco Heights, private company employees (1,028 | 72.2%), local government employees (161 | 11.3%), and not-for-profit organizations (123 | 8.6%) make up the most common classes of employment.
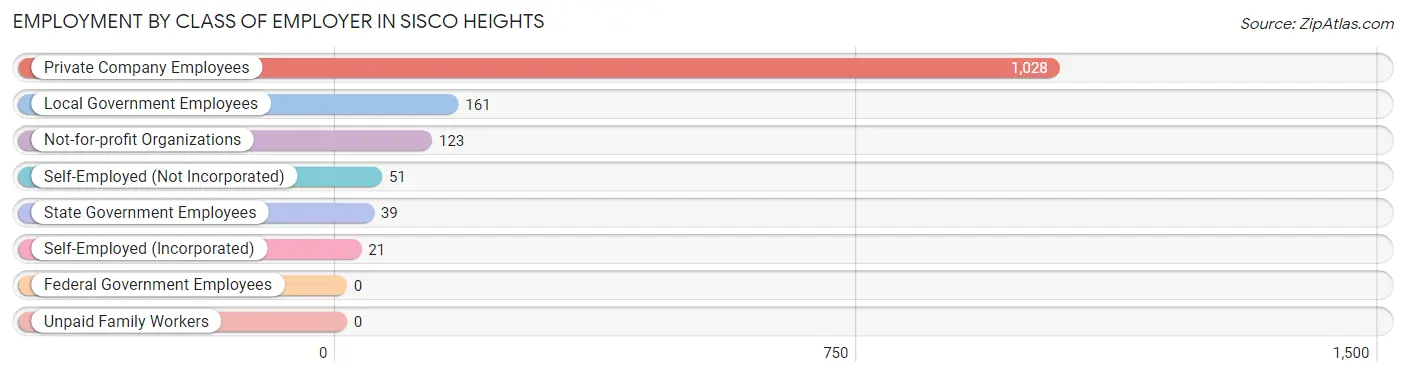
| Employer Class | # Employees | % Employees |
| Private Company Employees | 1,028 | 72.2% |
| Self-Employed (Incorporated) | 21 | 1.5% |
| Self-Employed (Not Incorporated) | 51 | 3.6% |
| Not-for-profit Organizations | 123 | 8.6% |
| Local Government Employees | 161 | 11.3% |
| State Government Employees | 39 | 2.7% |
| Federal Government Employees | 0 | 0.0% |
| Unpaid Family Workers | 0 | 0.0% |
| Total | 1,423 | 100.0% |
Employment Status by Age in Sisco Heights
According to the labor force statistics for Sisco Heights, out of the total population over 16 years of age (2,404), 64.3% or 1,546 individuals are in the labor force, with 4.8% or 74 of them unemployed. The age group with the highest labor force participation rate is 30 to 34 years, with 96.2% or 203 individuals in the labor force. Within the labor force, the 20 to 24 years age range has the highest percentage of unemployed individuals, with 29.4% or 10 of them being unemployed.
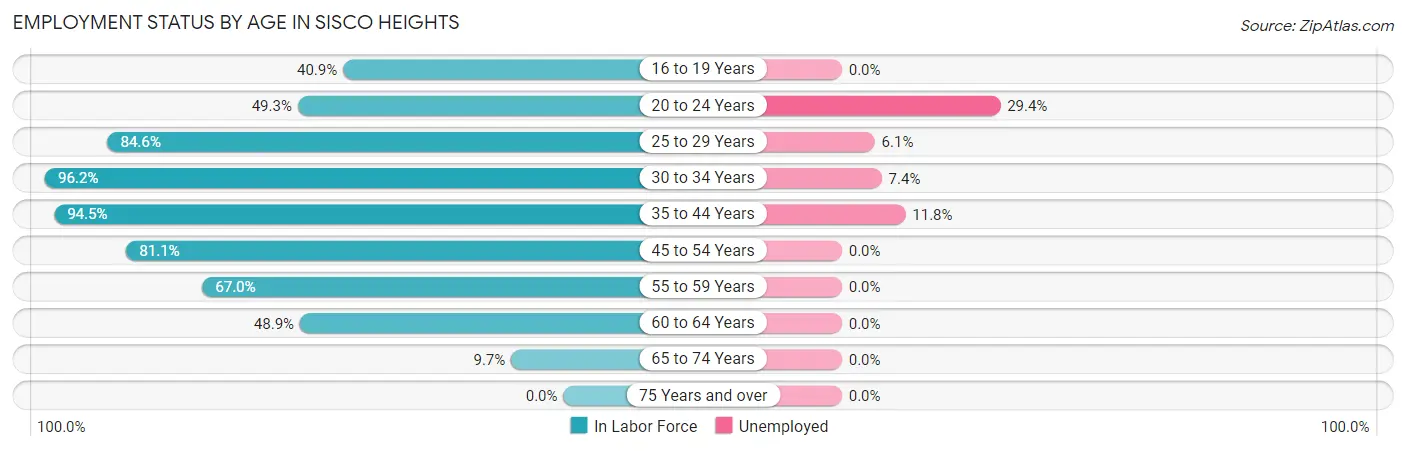
| Age Bracket | In Labor Force | Unemployed |
| 16 to 19 Years | 47 (40.9%) | 0 (0.0%) |
| 20 to 24 Years | 34 (49.3%) | 10 (29.4%) |
| 25 to 29 Years | 99 (84.6%) | 6 (6.1%) |
| 30 to 34 Years | 203 (96.2%) | 15 (7.4%) |
| 35 to 44 Years | 363 (94.5%) | 43 (11.8%) |
| 45 to 54 Years | 386 (81.1%) | 0 (0.0%) |
| 55 to 59 Years | 238 (67.0%) | 0 (0.0%) |
| 60 to 64 Years | 149 (48.9%) | 0 (0.0%) |
| 65 to 74 Years | 26 (9.7%) | 0 (0.0%) |
| 75 Years and over | 0 (0.0%) | 0 (0.0%) |
| Total | 1,546 (64.3%) | 74 (4.8%) |
Employment Status by Educational Attainment in Sisco Heights
According to labor force statistics for Sisco Heights, 77.8% of individuals (1,438) out of the total population between 25 and 64 years of age (1,848) are in the labor force, with 4.5% or 65 of them being unemployed. The group with the highest labor force participation rate are those with the educational attainment of less than high school, with 82.2% or 60 individuals in the labor force. Within the labor force, individuals with college / associate degree education have the highest percentage of unemployment, with 7.6% or 43 of them being unemployed.
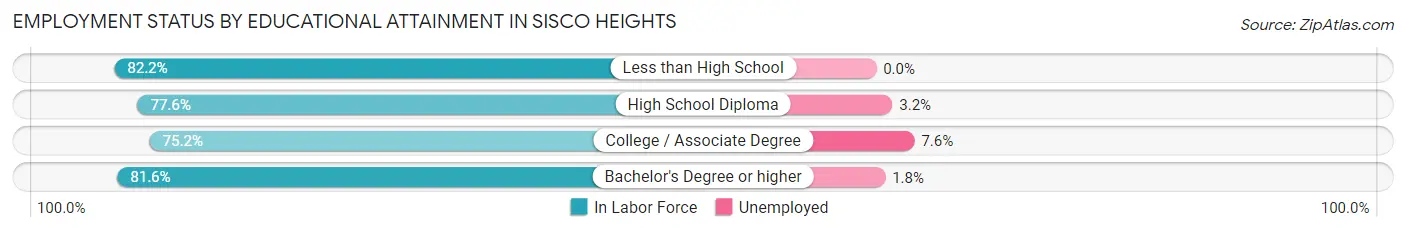
| Educational Attainment | In Labor Force | Unemployed |
| Less than High School | 60 (82.2%) | 0 (0.0%) |
| High School Diploma | 433 (77.6%) | 18 (3.2%) |
| College / Associate Degree | 563 (75.2%) | 57 (7.6%) |
| Bachelor's Degree or higher | 382 (81.6%) | 8 (1.8%) |
| Total | 1,438 (77.8%) | 83 (4.5%) |
Employment Occupations by Sex in Sisco Heights
Management, Business, Science and Arts Occupations
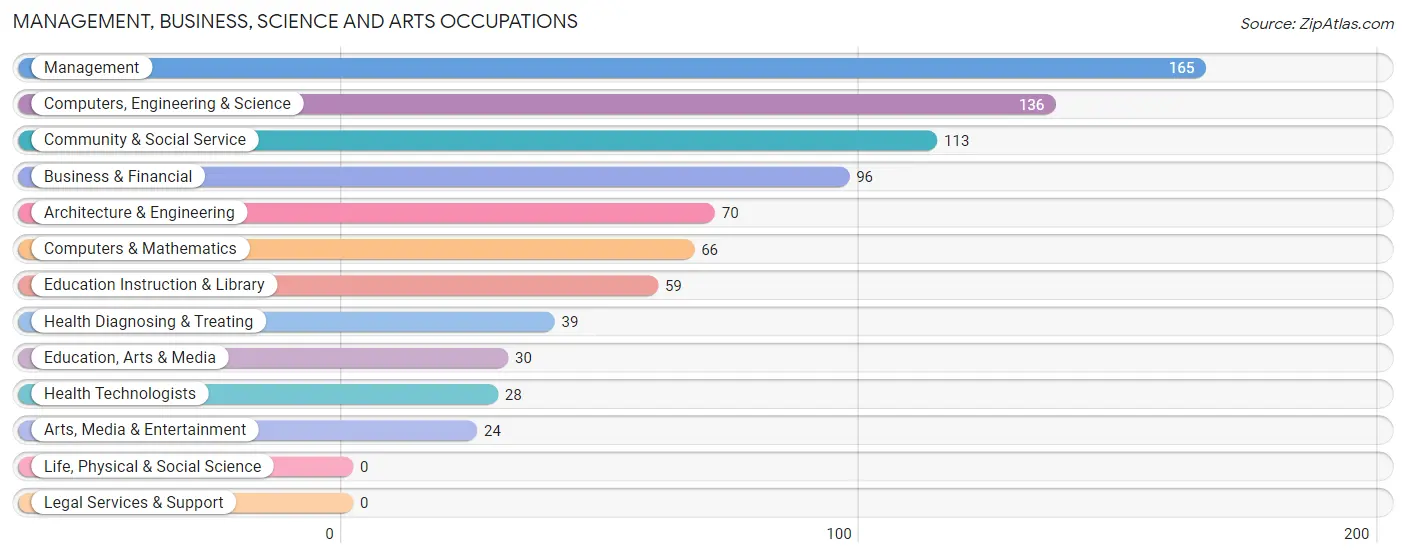
The most common Management, Business, Science and Arts occupations in Sisco Heights are Management (165 | 11.2%), Computers, Engineering & Science (136 | 9.2%), Community & Social Service (113 | 7.7%), Business & Financial (96 | 6.5%), and Architecture & Engineering (70 | 4.8%).
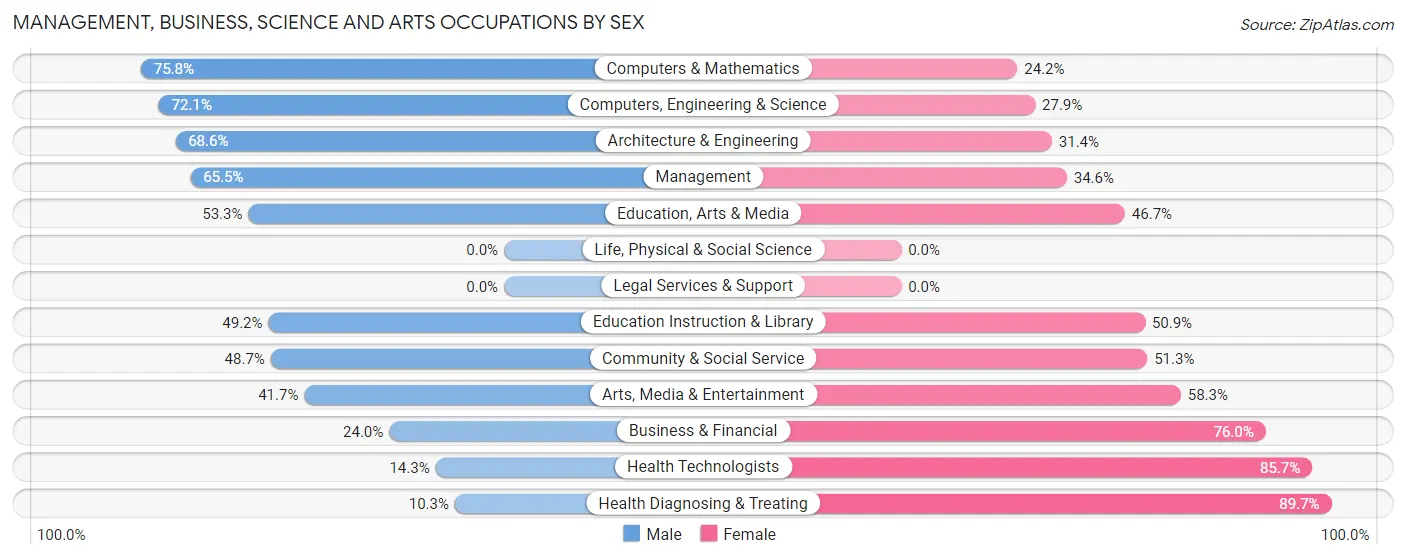
Management, Business, Science and Arts Occupations by Sex
Within the Management, Business, Science and Arts occupations in Sisco Heights, the most male-oriented occupations are Computers & Mathematics (75.8%), Computers, Engineering & Science (72.1%), and Architecture & Engineering (68.6%), while the most female-oriented occupations are Health Diagnosing & Treating (89.7%), Health Technologists (85.7%), and Business & Financial (76.0%).
| Occupation | Male | Female |
| Management | 108 (65.4%) | 57 (34.5%) |
| Business & Financial | 23 (24.0%) | 73 (76.0%) |
| Computers, Engineering & Science | 98 (72.1%) | 38 (27.9%) |
| Computers & Mathematics | 50 (75.8%) | 16 (24.2%) |
| Architecture & Engineering | 48 (68.6%) | 22 (31.4%) |
| Life, Physical & Social Science | 0 (0.0%) | 0 (0.0%) |
| Community & Social Service | 55 (48.7%) | 58 (51.3%) |
| Education, Arts & Media | 16 (53.3%) | 14 (46.7%) |
| Legal Services & Support | 0 (0.0%) | 0 (0.0%) |
| Education Instruction & Library | 29 (49.1%) | 30 (50.8%) |
| Arts, Media & Entertainment | 10 (41.7%) | 14 (58.3%) |
| Health Diagnosing & Treating | 4 (10.3%) | 35 (89.7%) |
| Health Technologists | 4 (14.3%) | 24 (85.7%) |
| Total (Category) | 288 (52.5%) | 261 (47.5%) |
| Total (Overall) | 907 (61.7%) | 564 (38.3%) |
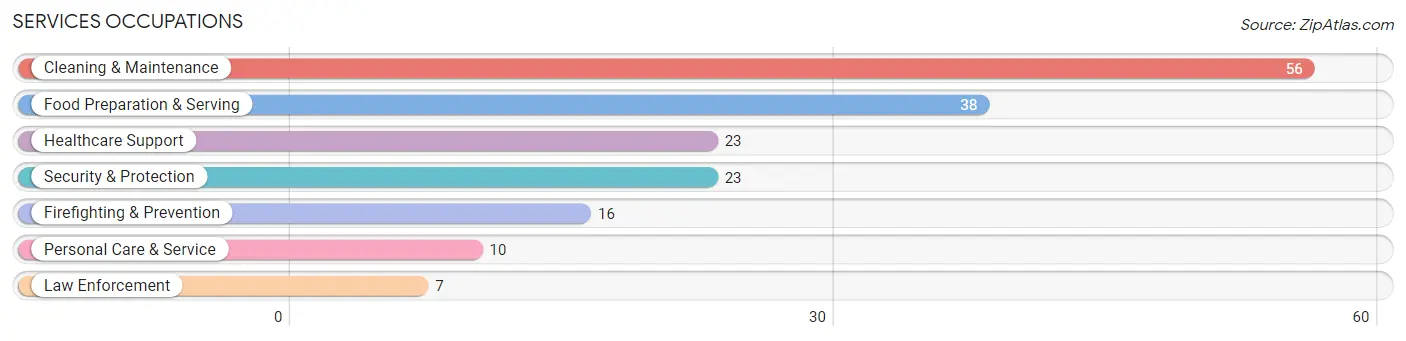
Services Occupations
The most common Services occupations in Sisco Heights are Cleaning & Maintenance (56 | 3.8%), Food Preparation & Serving (38 | 2.6%), Healthcare Support (23 | 1.6%), Security & Protection (23 | 1.6%), and Firefighting & Prevention (16 | 1.1%).
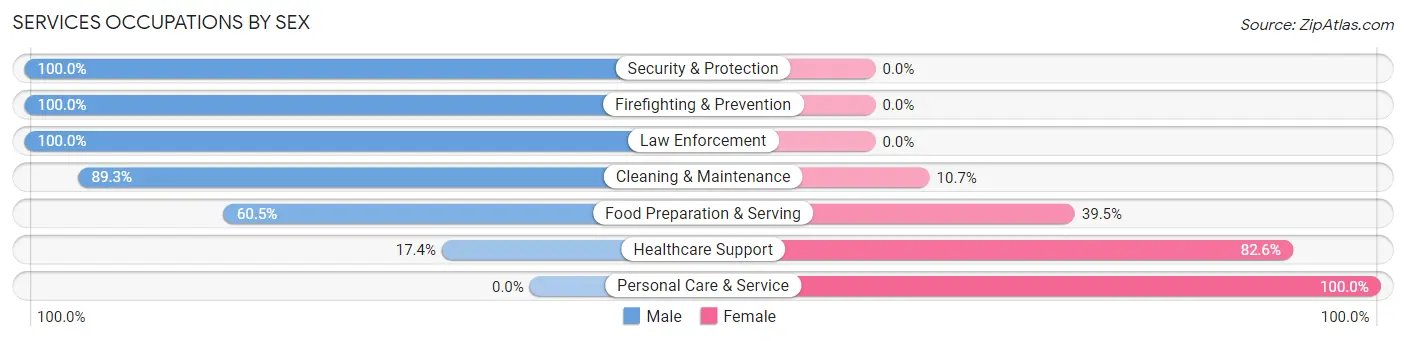
Services Occupations by Sex
Within the Services occupations in Sisco Heights, the most male-oriented occupations are Security & Protection (100.0%), Firefighting & Prevention (100.0%), and Law Enforcement (100.0%), while the most female-oriented occupations are Personal Care & Service (100.0%), Healthcare Support (82.6%), and Food Preparation & Serving (39.5%).
| Occupation | Male | Female |
| Healthcare Support | 4 (17.4%) | 19 (82.6%) |
| Security & Protection | 23 (100.0%) | 0 (0.0%) |
| Firefighting & Prevention | 16 (100.0%) | 0 (0.0%) |
| Law Enforcement | 7 (100.0%) | 0 (0.0%) |
| Food Preparation & Serving | 23 (60.5%) | 15 (39.5%) |
| Cleaning & Maintenance | 50 (89.3%) | 6 (10.7%) |
| Personal Care & Service | 0 (0.0%) | 10 (100.0%) |
| Total (Category) | 100 (66.7%) | 50 (33.3%) |
| Total (Overall) | 907 (61.7%) | 564 (38.3%) |
Sales and Office Occupations
The most common Sales and Office occupations in Sisco Heights are Office & Administration (153 | 10.4%), and Sales & Related (132 | 9.0%).
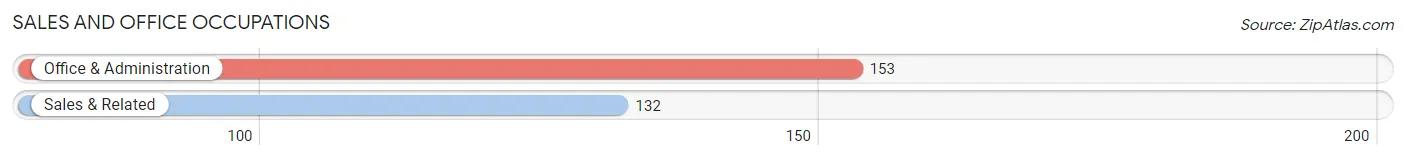
Sales and Office Occupations by Sex

| Occupation | Male | Female |
| Sales & Related | 57 (43.2%) | 75 (56.8%) |
| Office & Administration | 0 (0.0%) | 153 (100.0%) |
| Total (Category) | 57 (20.0%) | 228 (80.0%) |
| Total (Overall) | 907 (61.7%) | 564 (38.3%) |
Natural Resources, Construction and Maintenance Occupations
The most common Natural Resources, Construction and Maintenance occupations in Sisco Heights are Installation, Maintenance & Repair (178 | 12.1%), Construction & Extraction (81 | 5.5%), and Farming, Fishing & Forestry (45 | 3.1%).
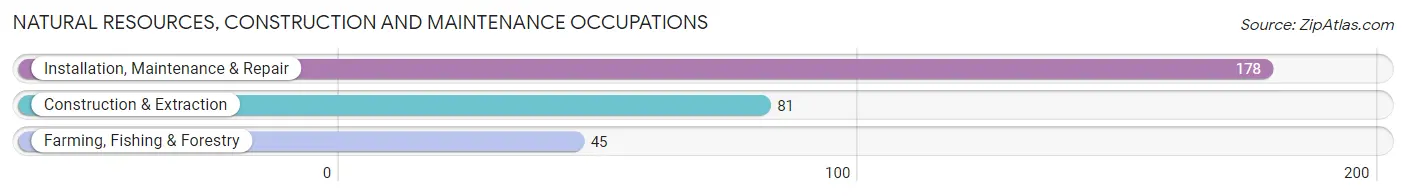
Natural Resources, Construction and Maintenance Occupations by Sex
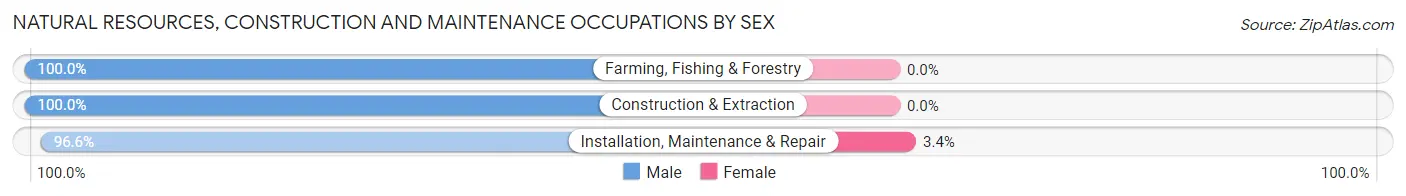
| Occupation | Male | Female |
| Farming, Fishing & Forestry | 45 (100.0%) | 0 (0.0%) |
| Construction & Extraction | 81 (100.0%) | 0 (0.0%) |
| Installation, Maintenance & Repair | 172 (96.6%) | 6 (3.4%) |
| Total (Category) | 298 (98.0%) | 6 (2.0%) |
| Total (Overall) | 907 (61.7%) | 564 (38.3%) |
Production, Transportation and Moving Occupations
The most common Production, Transportation and Moving occupations in Sisco Heights are Production (91 | 6.2%), Transportation (82 | 5.6%), and Material Moving (10 | 0.7%).
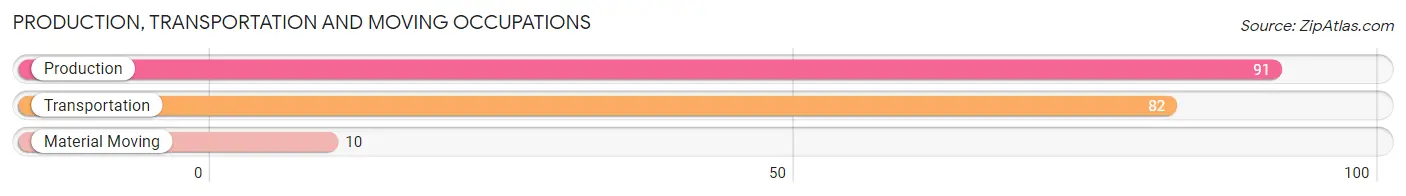
Production, Transportation and Moving Occupations by Sex
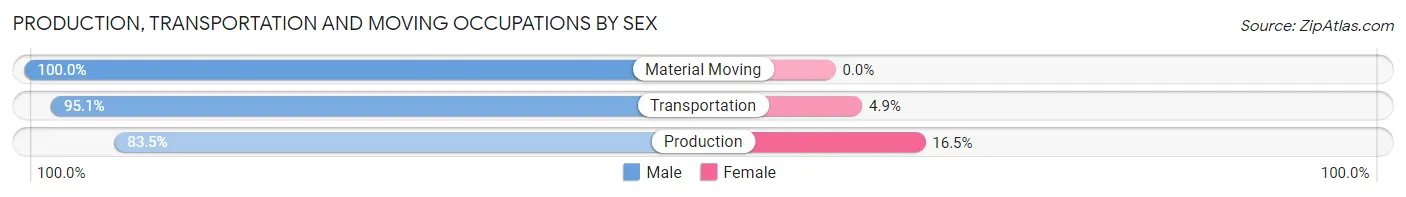
| Occupation | Male | Female |
| Production | 76 (83.5%) | 15 (16.5%) |
| Transportation | 78 (95.1%) | 4 (4.9%) |
| Material Moving | 10 (100.0%) | 0 (0.0%) |
| Total (Category) | 164 (89.6%) | 19 (10.4%) |
| Total (Overall) | 907 (61.7%) | 564 (38.3%) |
Employment Industries by Sex in Sisco Heights
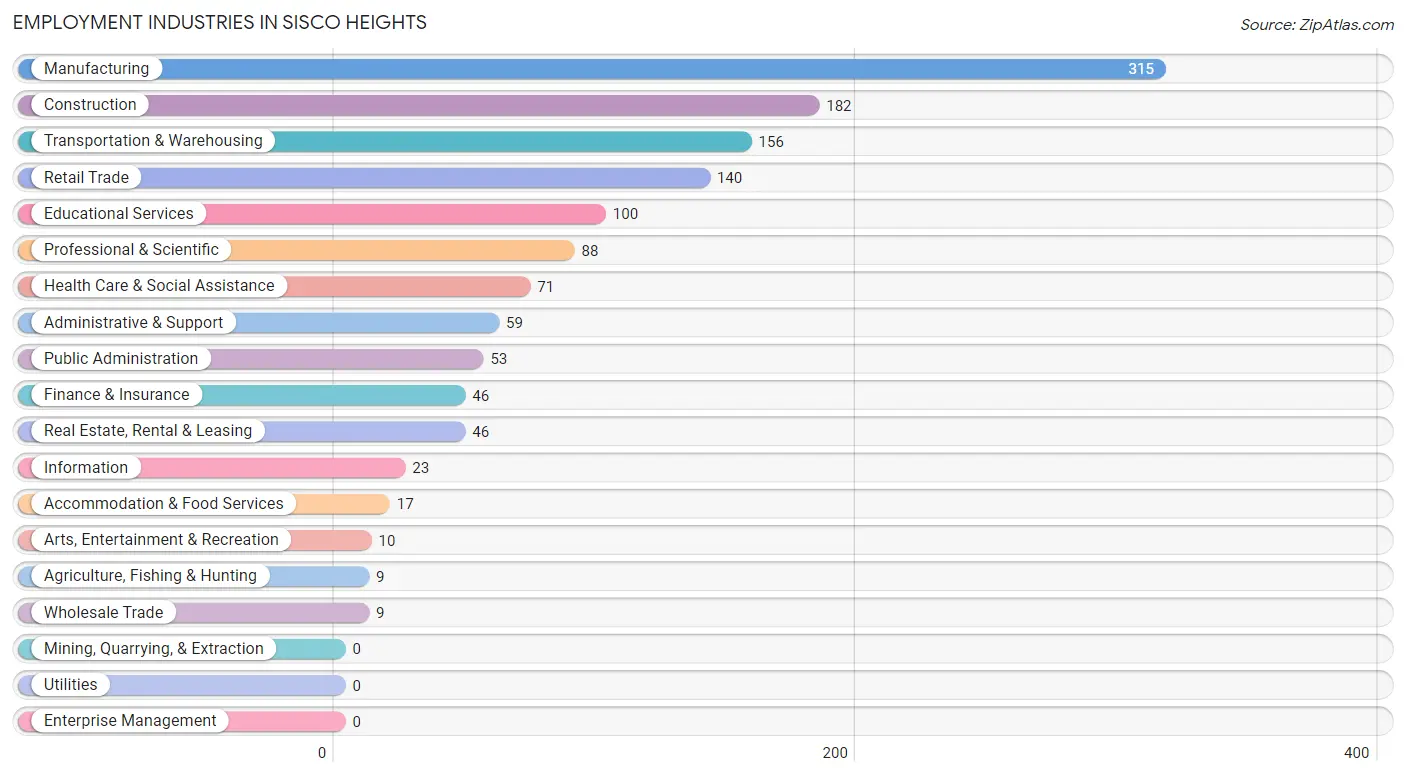
Employment Industries in Sisco Heights
The major employment industries in Sisco Heights include Manufacturing (315 | 21.4%), Construction (182 | 12.4%), Transportation & Warehousing (156 | 10.6%), Retail Trade (140 | 9.5%), and Educational Services (100 | 6.8%).
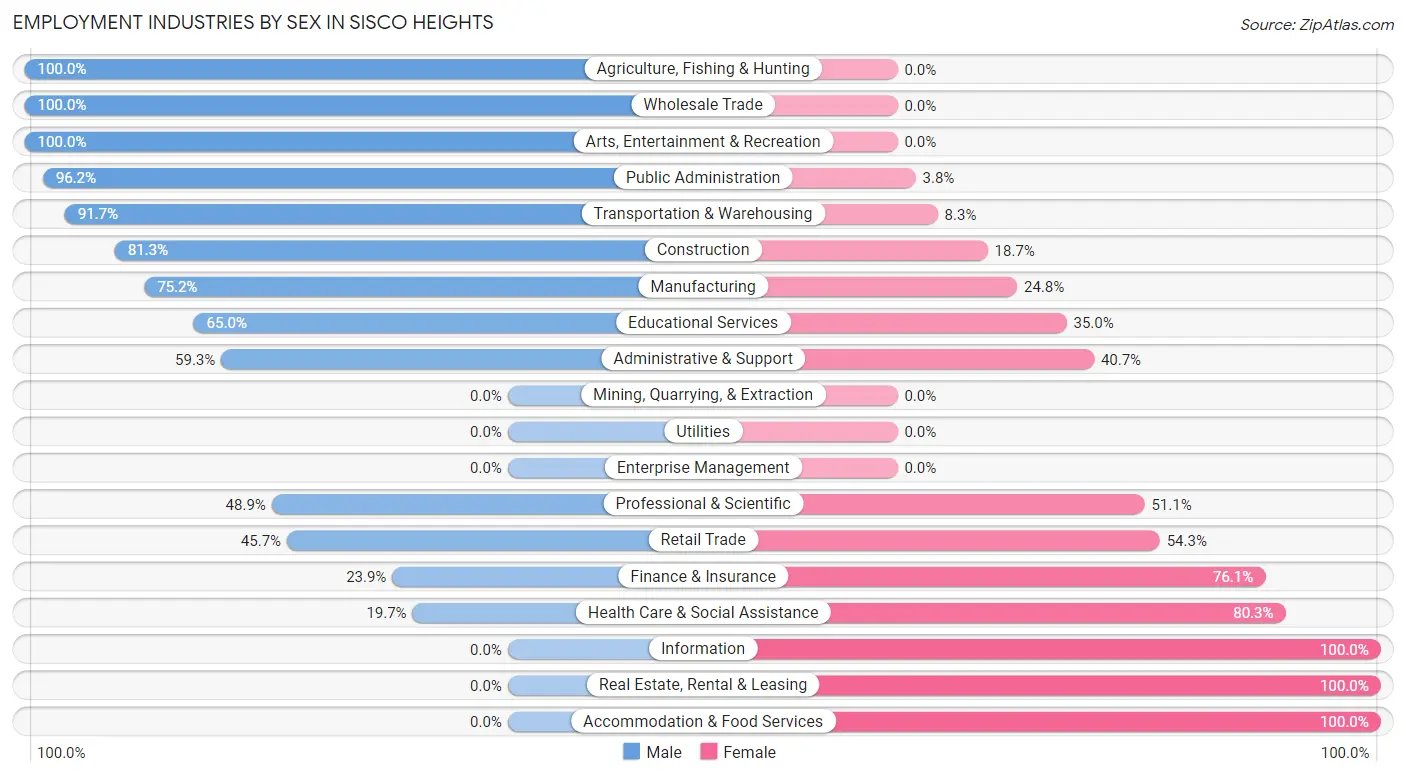
Employment Industries by Sex in Sisco Heights
The Sisco Heights industries that see more men than women are Agriculture, Fishing & Hunting (100.0%), Wholesale Trade (100.0%), and Arts, Entertainment & Recreation (100.0%), whereas the industries that tend to have a higher number of women are Information (100.0%), Real Estate, Rental & Leasing (100.0%), and Accommodation & Food Services (100.0%).
| Industry | Male | Female |
| Agriculture, Fishing & Hunting | 9 (100.0%) | 0 (0.0%) |
| Mining, Quarrying, & Extraction | 0 (0.0%) | 0 (0.0%) |
| Construction | 148 (81.3%) | 34 (18.7%) |
| Manufacturing | 237 (75.2%) | 78 (24.8%) |
| Wholesale Trade | 9 (100.0%) | 0 (0.0%) |
| Retail Trade | 64 (45.7%) | 76 (54.3%) |
| Transportation & Warehousing | 143 (91.7%) | 13 (8.3%) |
| Utilities | 0 (0.0%) | 0 (0.0%) |
| Information | 0 (0.0%) | 23 (100.0%) |
| Finance & Insurance | 11 (23.9%) | 35 (76.1%) |
| Real Estate, Rental & Leasing | 0 (0.0%) | 46 (100.0%) |
| Professional & Scientific | 43 (48.9%) | 45 (51.1%) |
| Enterprise Management | 0 (0.0%) | 0 (0.0%) |
| Administrative & Support | 35 (59.3%) | 24 (40.7%) |
| Educational Services | 65 (65.0%) | 35 (35.0%) |
| Health Care & Social Assistance | 14 (19.7%) | 57 (80.3%) |
| Arts, Entertainment & Recreation | 10 (100.0%) | 0 (0.0%) |
| Accommodation & Food Services | 0 (0.0%) | 17 (100.0%) |
| Public Administration | 51 (96.2%) | 2 (3.8%) |
| Total | 907 (61.7%) | 564 (38.3%) |
Education in Sisco Heights
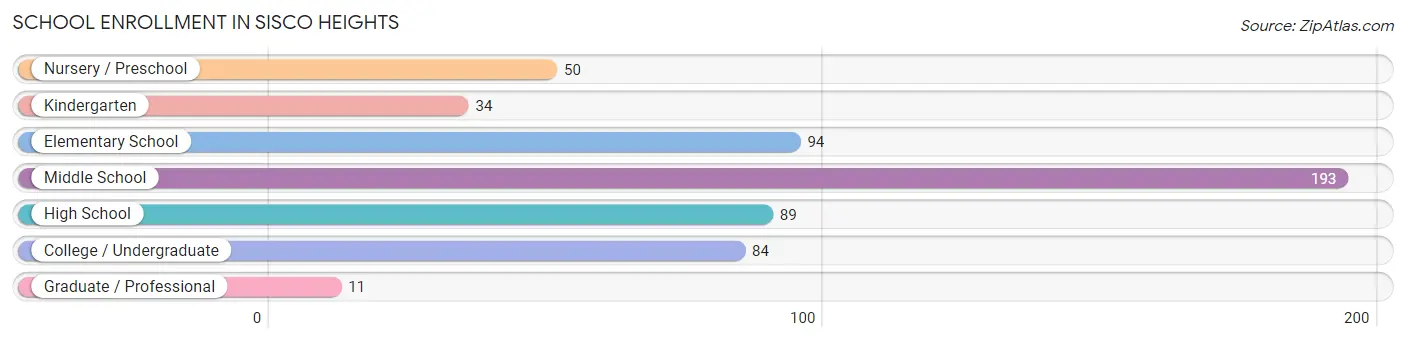
School Enrollment in Sisco Heights
The most common levels of schooling among the 555 students in Sisco Heights are middle school (193 | 34.8%), elementary school (94 | 16.9%), and high school (89 | 16.0%).
| School Level | # Students | % Students |
| Nursery / Preschool | 50 | 9.0% |
| Kindergarten | 34 | 6.1% |
| Elementary School | 94 | 16.9% |
| Middle School | 193 | 34.8% |
| High School | 89 | 16.0% |
| College / Undergraduate | 84 | 15.1% |
| Graduate / Professional | 11 | 2.0% |
| Total | 555 | 100.0% |
School Enrollment by Age by Funding Source in Sisco Heights
Out of a total of 555 students who are enrolled in schools in Sisco Heights, 95 (17.1%) attend a private institution, while the remaining 460 (82.9%) are enrolled in public schools. The age group of 3 to 4 year olds has the highest likelihood of being enrolled in private schools, with 34 (100.0% in the age bracket) enrolled. Conversely, the age group of 15 to 17 year olds has the lowest likelihood of being enrolled in a private school, with 58 (100.0% in the age bracket) attending a public institution.
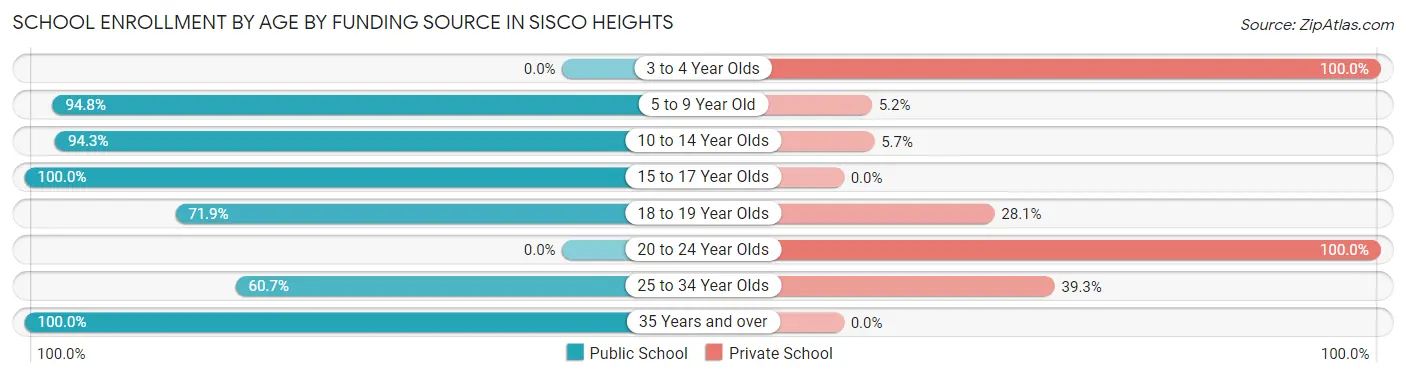
| Age Bracket | Public School | Private School |
| 3 to 4 Year Olds | 0 (0.0%) | 34 (100.0%) |
| 5 to 9 Year Old | 127 (94.8%) | 7 (5.2%) |
| 10 to 14 Year Olds | 199 (94.3%) | 12 (5.7%) |
| 15 to 17 Year Olds | 58 (100.0%) | 0 (0.0%) |
| 18 to 19 Year Olds | 41 (71.9%) | 16 (28.1%) |
| 20 to 24 Year Olds | 0 (0.0%) | 15 (100.0%) |
| 25 to 34 Year Olds | 17 (60.7%) | 11 (39.3%) |
| 35 Years and over | 18 (100.0%) | 0 (0.0%) |
| Total | 460 (82.9%) | 95 (17.1%) |
Educational Attainment by Field of Study in Sisco Heights
Engineering (95 | 16.6%), business (74 | 13.0%), visual & performing arts (56 | 9.8%), literature & languages (55 | 9.6%), and science & technology (47 | 8.2%) are the most common fields of study among 571 individuals in Sisco Heights who have obtained a bachelor's degree or higher.
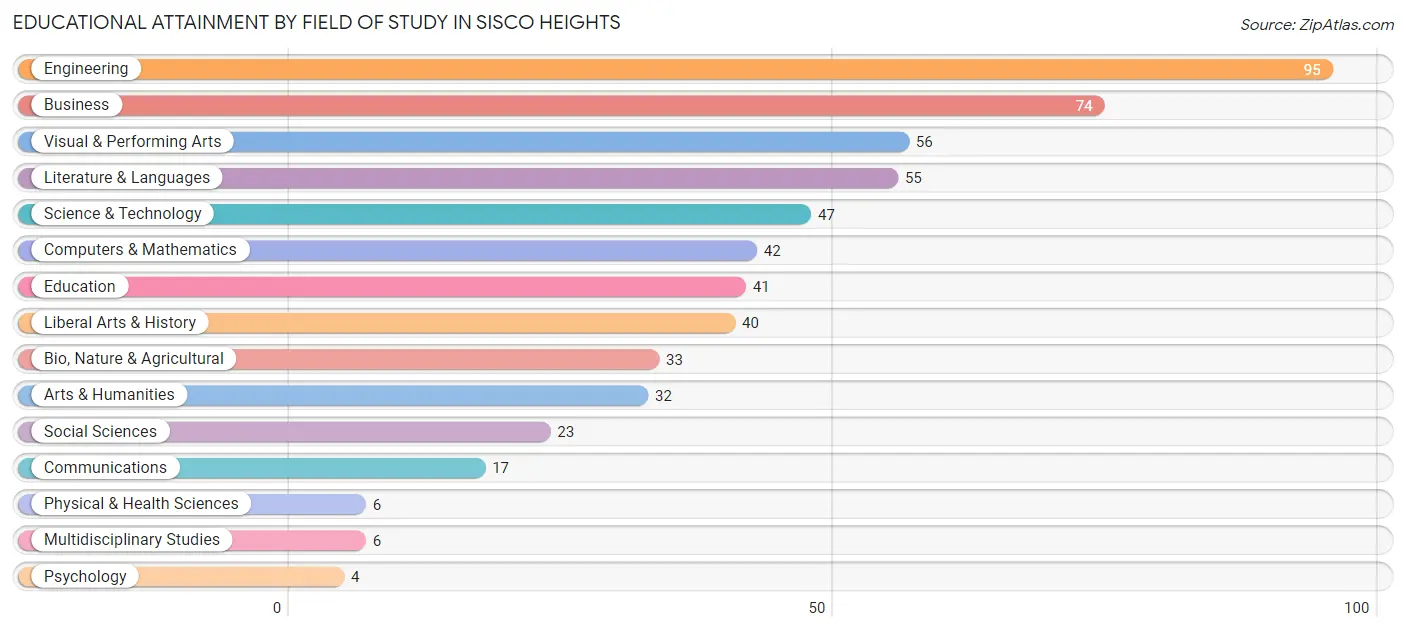
| Field of Study | # Graduates | % Graduates |
| Computers & Mathematics | 42 | 7.4% |
| Bio, Nature & Agricultural | 33 | 5.8% |
| Physical & Health Sciences | 6 | 1.1% |
| Psychology | 4 | 0.7% |
| Social Sciences | 23 | 4.0% |
| Engineering | 95 | 16.6% |
| Multidisciplinary Studies | 6 | 1.1% |
| Science & Technology | 47 | 8.2% |
| Business | 74 | 13.0% |
| Education | 41 | 7.2% |
| Literature & Languages | 55 | 9.6% |
| Liberal Arts & History | 40 | 7.0% |
| Visual & Performing Arts | 56 | 9.8% |
| Communications | 17 | 3.0% |
| Arts & Humanities | 32 | 5.6% |
| Total | 571 | 100.0% |
Transportation & Commute in Sisco Heights
Vehicle Availability by Sex in Sisco Heights
The most prevalent vehicle ownership categories in Sisco Heights are males with 3 vehicles (273, accounting for 31.8%) and females with 3 vehicles (166, making up 48.4%).
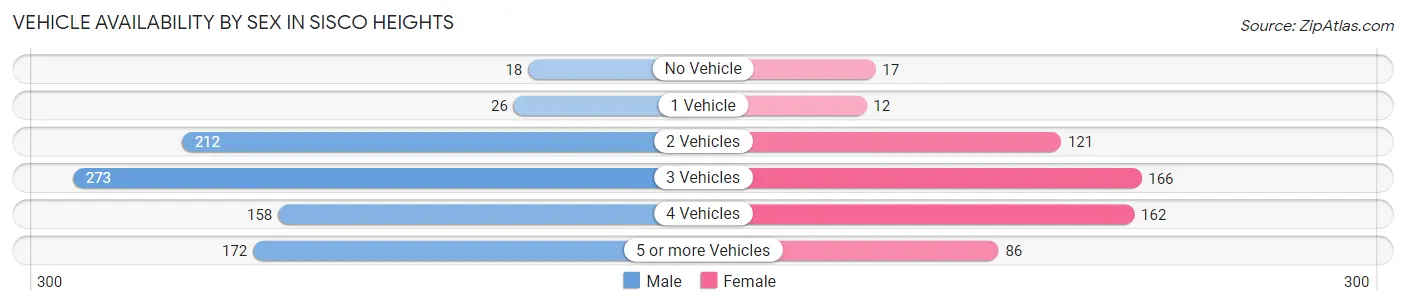
| Vehicles Available | Male | Female |
| No Vehicle | 18 (2.1%) | 17 (3.0%) |
| 1 Vehicle | 26 (3.0%) | 12 (2.1%) |
| 2 Vehicles | 212 (24.7%) | 121 (21.4%) |
| 3 Vehicles | 273 (31.8%) | 166 (29.4%) |
| 4 Vehicles | 158 (18.4%) | 162 (28.7%) |
| 5 or more Vehicles | 172 (20.0%) | 86 (15.2%) |
| Total | 859 (100.0%) | 564 (100.0%) |
Commute Time in Sisco Heights
The most frequently occuring commute durations in Sisco Heights are 30 to 34 minutes (324 commuters, 25.8%), 60 to 89 minutes (167 commuters, 13.3%), and 20 to 24 minutes (144 commuters, 11.5%).
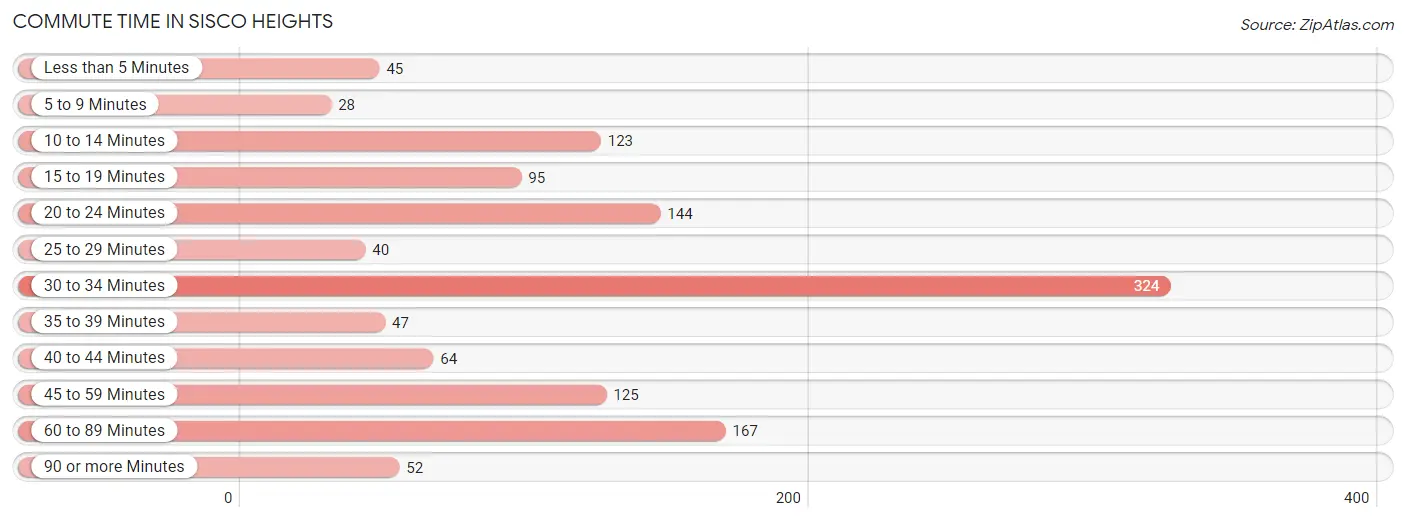
| Commute Time | # Commuters | % Commuters |
| Less than 5 Minutes | 45 | 3.6% |
| 5 to 9 Minutes | 28 | 2.2% |
| 10 to 14 Minutes | 123 | 9.8% |
| 15 to 19 Minutes | 95 | 7.6% |
| 20 to 24 Minutes | 144 | 11.5% |
| 25 to 29 Minutes | 40 | 3.2% |
| 30 to 34 Minutes | 324 | 25.8% |
| 35 to 39 Minutes | 47 | 3.7% |
| 40 to 44 Minutes | 64 | 5.1% |
| 45 to 59 Minutes | 125 | 10.0% |
| 60 to 89 Minutes | 167 | 13.3% |
| 90 or more Minutes | 52 | 4.2% |
Commute Time by Sex in Sisco Heights
The most common commute times in Sisco Heights are 30 to 34 minutes (186 commuters, 23.2%) for males and 30 to 34 minutes (138 commuters, 30.5%) for females.
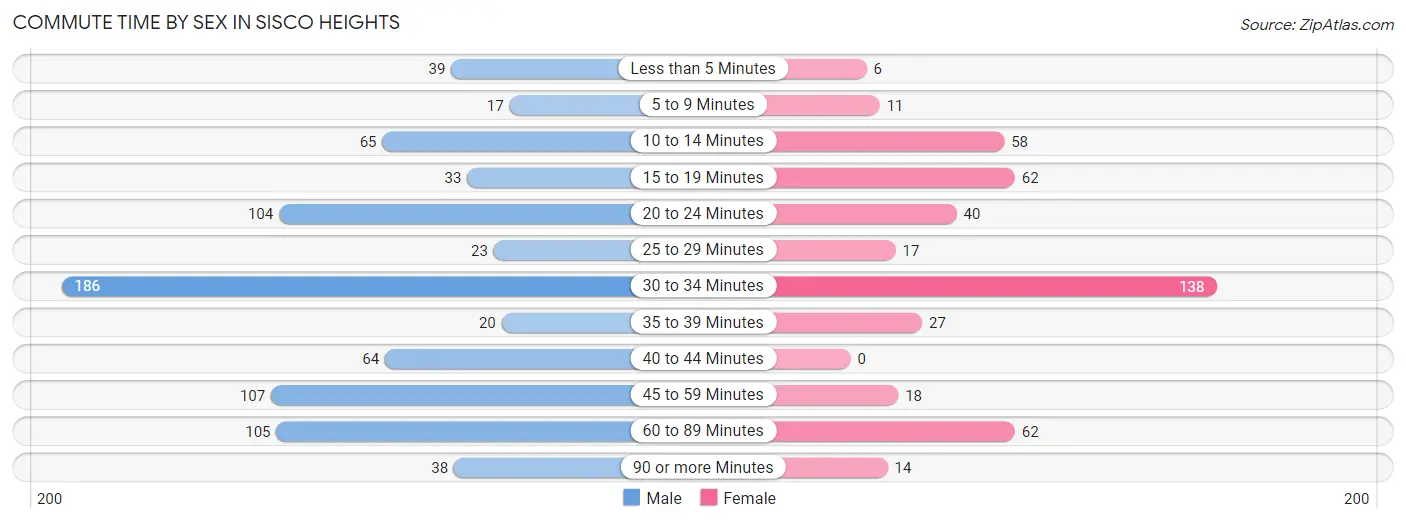
| Commute Time | Male | Female |
| Less than 5 Minutes | 39 (4.9%) | 6 (1.3%) |
| 5 to 9 Minutes | 17 (2.1%) | 11 (2.4%) |
| 10 to 14 Minutes | 65 (8.1%) | 58 (12.8%) |
| 15 to 19 Minutes | 33 (4.1%) | 62 (13.7%) |
| 20 to 24 Minutes | 104 (13.0%) | 40 (8.8%) |
| 25 to 29 Minutes | 23 (2.9%) | 17 (3.7%) |
| 30 to 34 Minutes | 186 (23.2%) | 138 (30.5%) |
| 35 to 39 Minutes | 20 (2.5%) | 27 (6.0%) |
| 40 to 44 Minutes | 64 (8.0%) | 0 (0.0%) |
| 45 to 59 Minutes | 107 (13.4%) | 18 (4.0%) |
| 60 to 89 Minutes | 105 (13.1%) | 62 (13.7%) |
| 90 or more Minutes | 38 (4.7%) | 14 (3.1%) |
Time of Departure to Work by Sex in Sisco Heights
The most frequent times of departure to work in Sisco Heights are 12:00 AM to 4:59 AM (189, 23.6%) for males and 8:00 AM to 8:29 AM (103, 22.7%) for females.
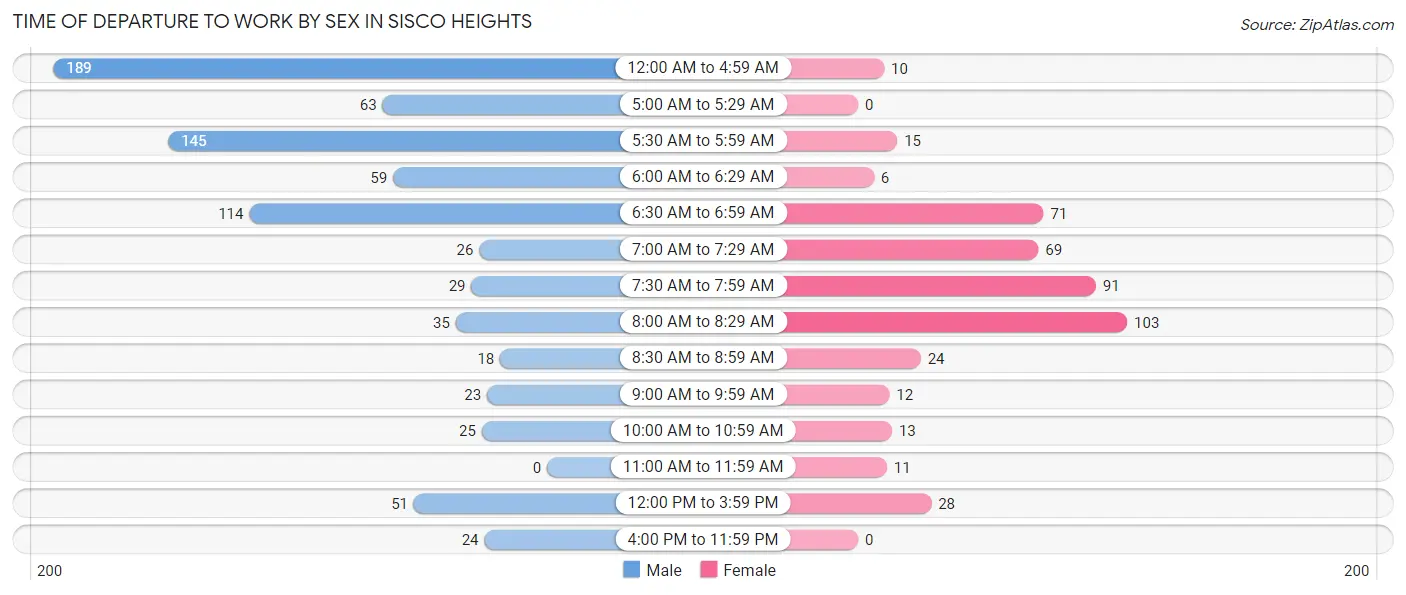
| Time of Departure | Male | Female |
| 12:00 AM to 4:59 AM | 189 (23.6%) | 10 (2.2%) |
| 5:00 AM to 5:29 AM | 63 (7.9%) | 0 (0.0%) |
| 5:30 AM to 5:59 AM | 145 (18.1%) | 15 (3.3%) |
| 6:00 AM to 6:29 AM | 59 (7.4%) | 6 (1.3%) |
| 6:30 AM to 6:59 AM | 114 (14.2%) | 71 (15.7%) |
| 7:00 AM to 7:29 AM | 26 (3.3%) | 69 (15.2%) |
| 7:30 AM to 7:59 AM | 29 (3.6%) | 91 (20.1%) |
| 8:00 AM to 8:29 AM | 35 (4.4%) | 103 (22.7%) |
| 8:30 AM to 8:59 AM | 18 (2.2%) | 24 (5.3%) |
| 9:00 AM to 9:59 AM | 23 (2.9%) | 12 (2.6%) |
| 10:00 AM to 10:59 AM | 25 (3.1%) | 13 (2.9%) |
| 11:00 AM to 11:59 AM | 0 (0.0%) | 11 (2.4%) |
| 12:00 PM to 3:59 PM | 51 (6.4%) | 28 (6.2%) |
| 4:00 PM to 11:59 PM | 24 (3.0%) | 0 (0.0%) |
| Total | 801 (100.0%) | 453 (100.0%) |
Housing Occupancy in Sisco Heights
Occupancy by Ownership in Sisco Heights
Of the total 1,035 dwellings in Sisco Heights, owner-occupied units account for 886 (85.6%), while renter-occupied units make up 149 (14.4%).
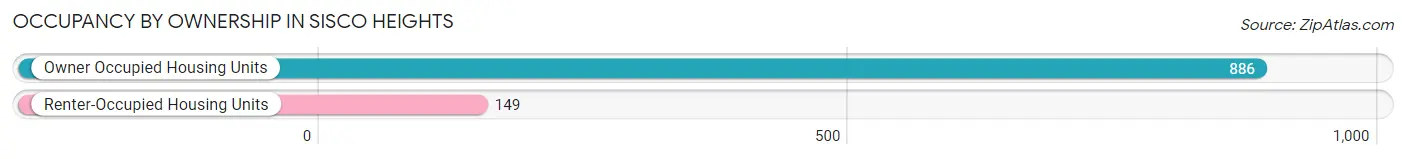
| Occupancy | # Housing Units | % Housing Units |
| Owner Occupied Housing Units | 886 | 85.6% |
| Renter-Occupied Housing Units | 149 | 14.4% |
| Total Occupied Housing Units | 1,035 | 100.0% |
Occupancy by Household Size in Sisco Heights
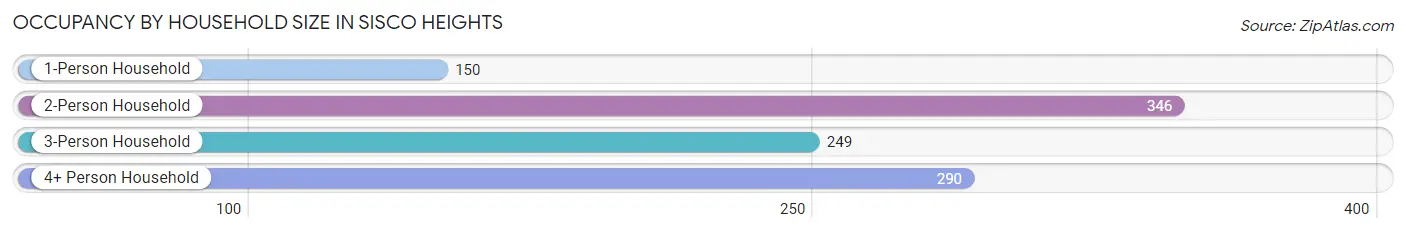
| Household Size | # Housing Units | % Housing Units |
| 1-Person Household | 150 | 14.5% |
| 2-Person Household | 346 | 33.4% |
| 3-Person Household | 249 | 24.1% |
| 4+ Person Household | 290 | 28.0% |
| Total Housing Units | 1,035 | 100.0% |
Occupancy by Ownership by Household Size in Sisco Heights
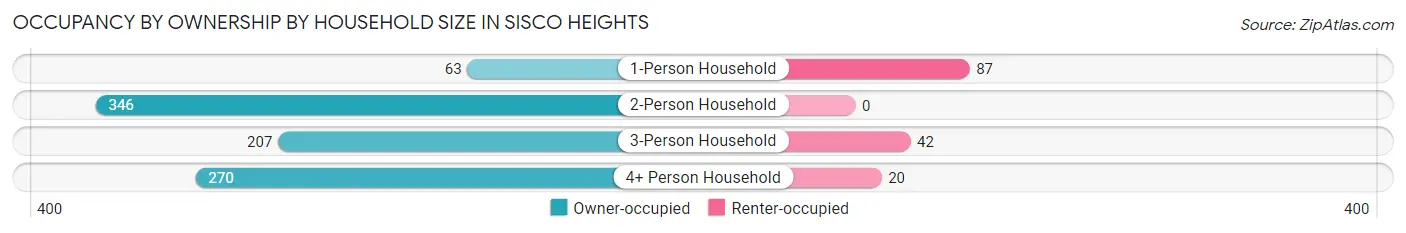
| Household Size | Owner-occupied | Renter-occupied |
| 1-Person Household | 63 (42.0%) | 87 (58.0%) |
| 2-Person Household | 346 (100.0%) | 0 (0.0%) |
| 3-Person Household | 207 (83.1%) | 42 (16.9%) |
| 4+ Person Household | 270 (93.1%) | 20 (6.9%) |
| Total Housing Units | 886 (85.6%) | 149 (14.4%) |
Occupancy by Educational Attainment in Sisco Heights
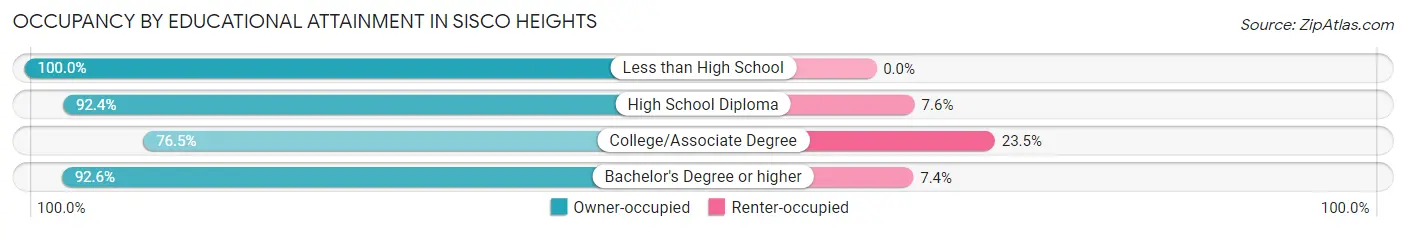
| Household Size | Owner-occupied | Renter-occupied |
| Less than High School | 19 (100.0%) | 0 (0.0%) |
| High School Diploma | 242 (92.4%) | 20 (7.6%) |
| College/Associate Degree | 348 (76.5%) | 107 (23.5%) |
| Bachelor's Degree or higher | 277 (92.6%) | 22 (7.4%) |
Occupancy by Age of Householder in Sisco Heights
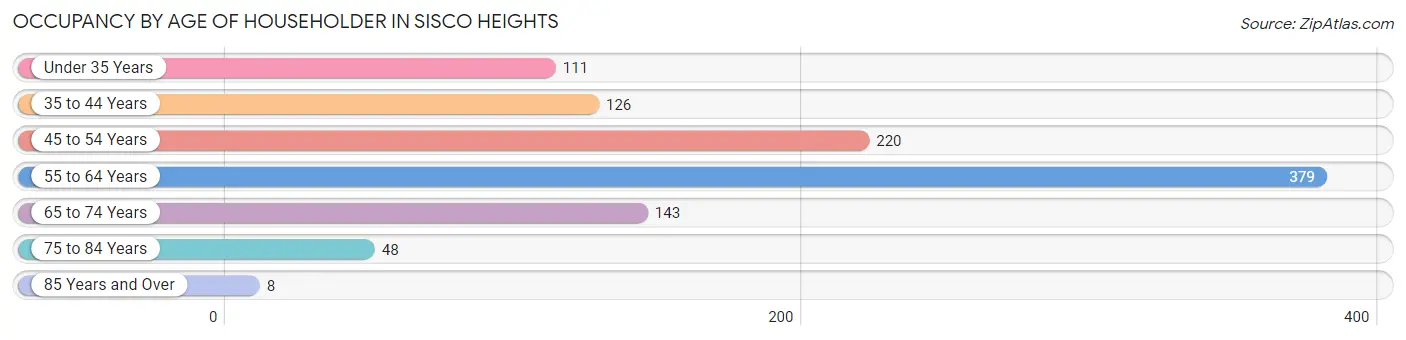
| Age Bracket | # Households | % Households |
| Under 35 Years | 111 | 10.7% |
| 35 to 44 Years | 126 | 12.2% |
| 45 to 54 Years | 220 | 21.3% |
| 55 to 64 Years | 379 | 36.6% |
| 65 to 74 Years | 143 | 13.8% |
| 75 to 84 Years | 48 | 4.6% |
| 85 Years and Over | 8 | 0.8% |
| Total | 1,035 | 100.0% |
Housing Finances in Sisco Heights
Median Income by Occupancy in Sisco Heights
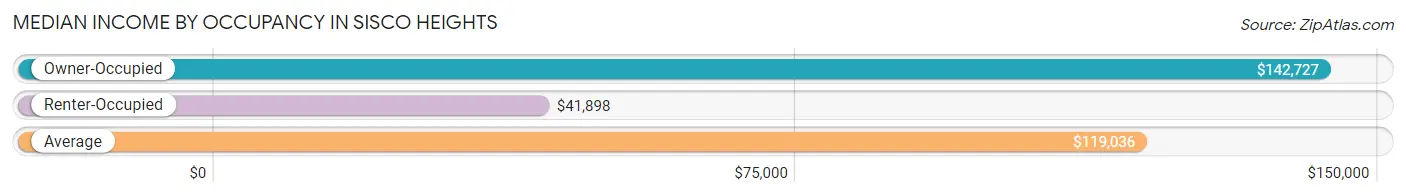
| Occupancy Type | # Households | Median Income |
| Owner-Occupied | 886 (85.6%) | $142,727 |
| Renter-Occupied | 149 (14.4%) | $41,898 |
| Average | 1,035 (100.0%) | $119,036 |
Occupancy by Householder Income Bracket in Sisco Heights
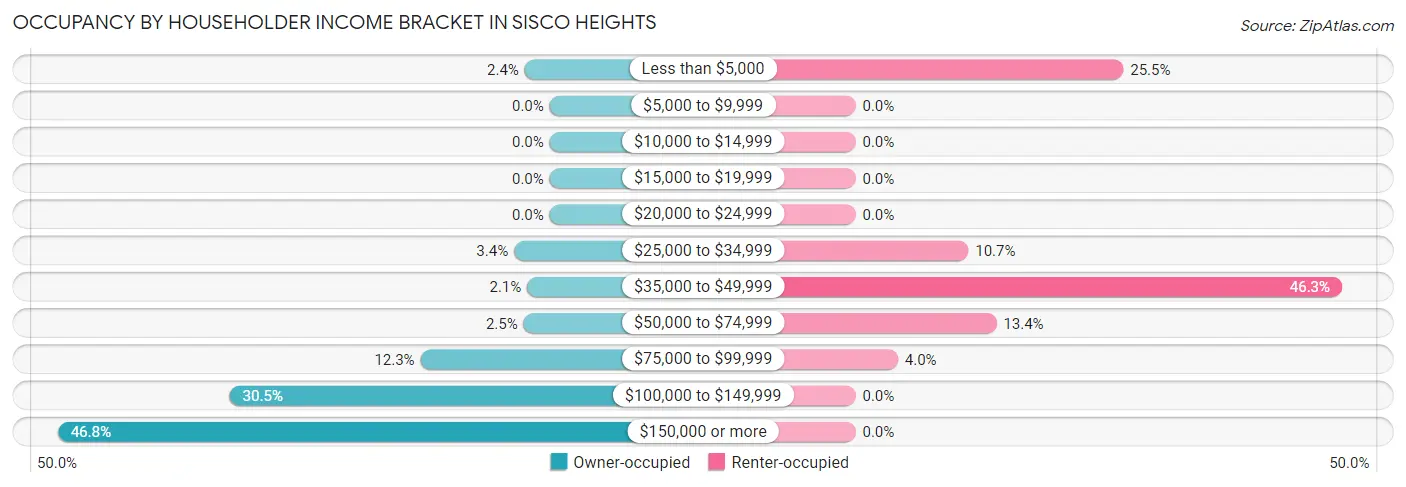
| Income Bracket | Owner-occupied | Renter-occupied |
| Less than $5,000 | 21 (2.4%) | 38 (25.5%) |
| $5,000 to $9,999 | 0 (0.0%) | 0 (0.0%) |
| $10,000 to $14,999 | 0 (0.0%) | 0 (0.0%) |
| $15,000 to $19,999 | 0 (0.0%) | 0 (0.0%) |
| $20,000 to $24,999 | 0 (0.0%) | 0 (0.0%) |
| $25,000 to $34,999 | 30 (3.4%) | 16 (10.7%) |
| $35,000 to $49,999 | 19 (2.1%) | 69 (46.3%) |
| $50,000 to $74,999 | 22 (2.5%) | 20 (13.4%) |
| $75,000 to $99,999 | 109 (12.3%) | 6 (4.0%) |
| $100,000 to $149,999 | 270 (30.5%) | 0 (0.0%) |
| $150,000 or more | 415 (46.8%) | 0 (0.0%) |
| Total | 886 (100.0%) | 149 (100.0%) |
Monthly Housing Cost Tiers in Sisco Heights
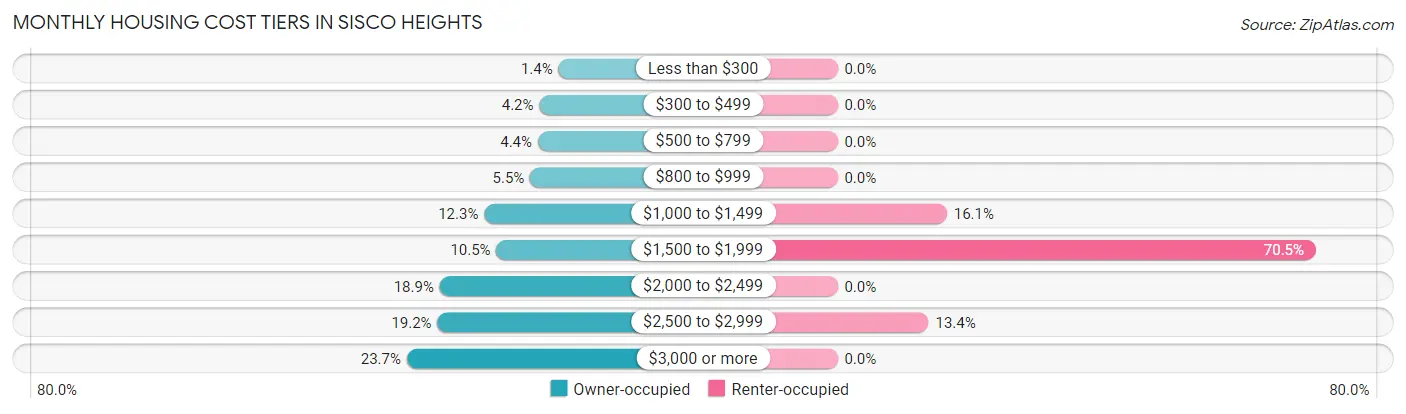
| Monthly Cost | Owner-occupied | Renter-occupied |
| Less than $300 | 12 (1.3%) | 0 (0.0%) |
| $300 to $499 | 37 (4.2%) | 0 (0.0%) |
| $500 to $799 | 39 (4.4%) | 0 (0.0%) |
| $800 to $999 | 49 (5.5%) | 0 (0.0%) |
| $1,000 to $1,499 | 109 (12.3%) | 24 (16.1%) |
| $1,500 to $1,999 | 93 (10.5%) | 105 (70.5%) |
| $2,000 to $2,499 | 167 (18.9%) | 0 (0.0%) |
| $2,500 to $2,999 | 170 (19.2%) | 20 (13.4%) |
| $3,000 or more | 210 (23.7%) | 0 (0.0%) |
| Total | 886 (100.0%) | 149 (100.0%) |
Physical Housing Characteristics in Sisco Heights
Housing Structures in Sisco Heights
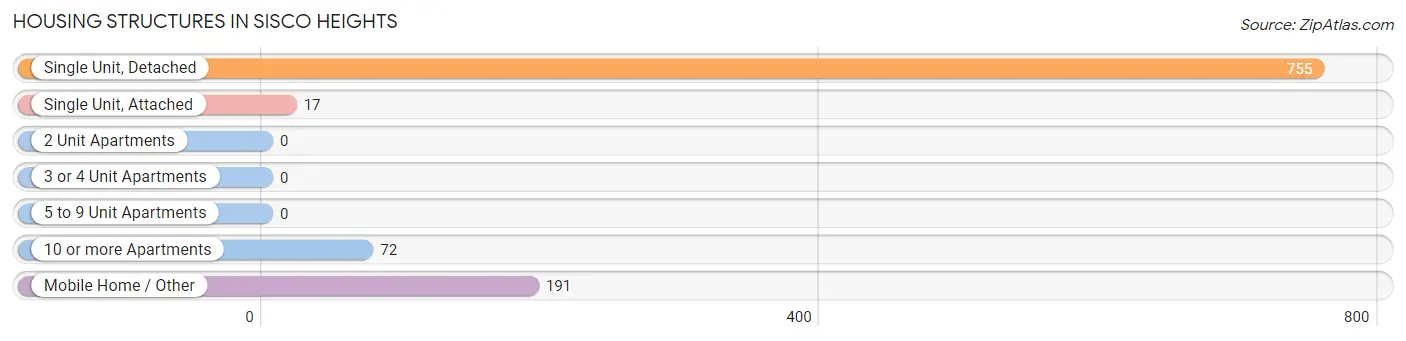
| Structure Type | # Housing Units | % Housing Units |
| Single Unit, Detached | 755 | 73.0% |
| Single Unit, Attached | 17 | 1.6% |
| 2 Unit Apartments | 0 | 0.0% |
| 3 or 4 Unit Apartments | 0 | 0.0% |
| 5 to 9 Unit Apartments | 0 | 0.0% |
| 10 or more Apartments | 72 | 7.0% |
| Mobile Home / Other | 191 | 18.4% |
| Total | 1,035 | 100.0% |
Housing Structures by Occupancy in Sisco Heights
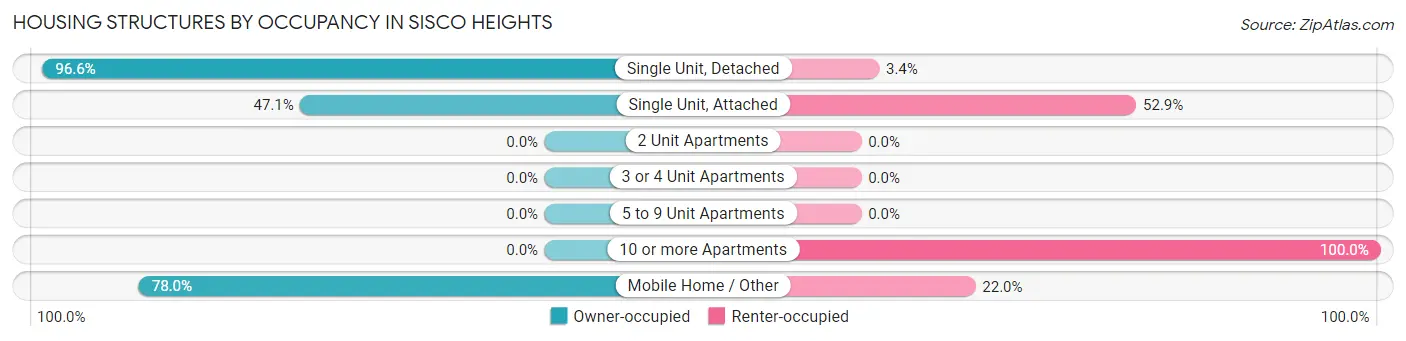
| Structure Type | Owner-occupied | Renter-occupied |
| Single Unit, Detached | 729 (96.6%) | 26 (3.4%) |
| Single Unit, Attached | 8 (47.1%) | 9 (52.9%) |
| 2 Unit Apartments | 0 (0.0%) | 0 (0.0%) |
| 3 or 4 Unit Apartments | 0 (0.0%) | 0 (0.0%) |
| 5 to 9 Unit Apartments | 0 (0.0%) | 0 (0.0%) |
| 10 or more Apartments | 0 (0.0%) | 72 (100.0%) |
| Mobile Home / Other | 149 (78.0%) | 42 (22.0%) |
| Total | 886 (85.6%) | 149 (14.4%) |
Housing Structures by Number of Rooms in Sisco Heights
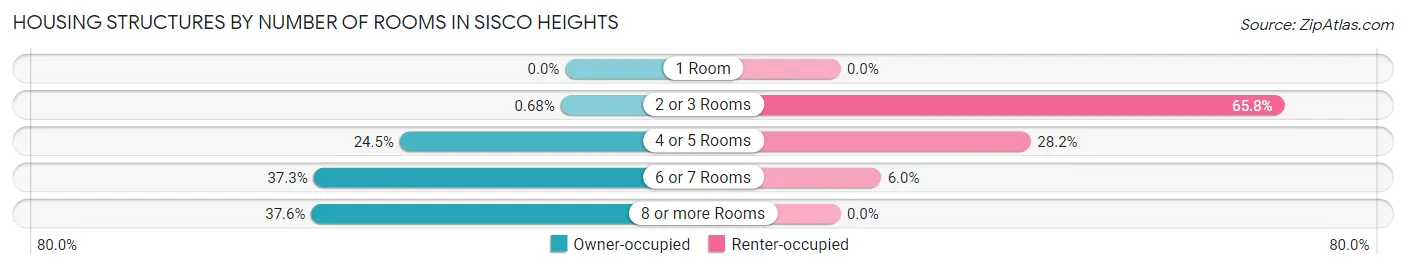
| Number of Rooms | Owner-occupied | Renter-occupied |
| 1 Room | 0 (0.0%) | 0 (0.0%) |
| 2 or 3 Rooms | 6 (0.7%) | 98 (65.8%) |
| 4 or 5 Rooms | 217 (24.5%) | 42 (28.2%) |
| 6 or 7 Rooms | 330 (37.2%) | 9 (6.0%) |
| 8 or more Rooms | 333 (37.6%) | 0 (0.0%) |
| Total | 886 (100.0%) | 149 (100.0%) |
Housing Structure by Heating Type in Sisco Heights
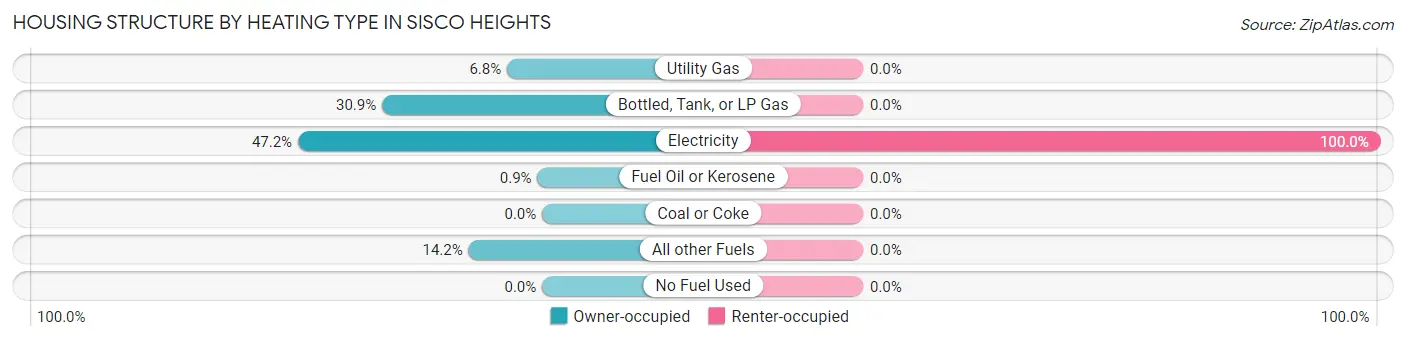
| Heating Type | Owner-occupied | Renter-occupied |
| Utility Gas | 60 (6.8%) | 0 (0.0%) |
| Bottled, Tank, or LP Gas | 274 (30.9%) | 0 (0.0%) |
| Electricity | 418 (47.2%) | 149 (100.0%) |
| Fuel Oil or Kerosene | 8 (0.9%) | 0 (0.0%) |
| Coal or Coke | 0 (0.0%) | 0 (0.0%) |
| All other Fuels | 126 (14.2%) | 0 (0.0%) |
| No Fuel Used | 0 (0.0%) | 0 (0.0%) |
| Total | 886 (100.0%) | 149 (100.0%) |
Household Vehicle Usage in Sisco Heights
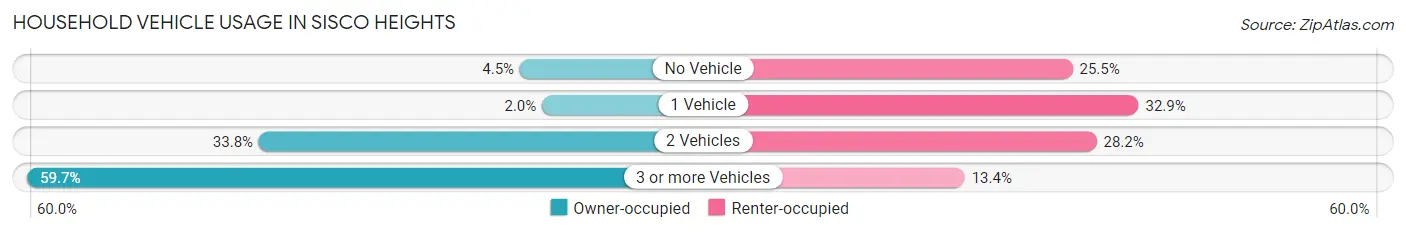
| Vehicles per Household | Owner-occupied | Renter-occupied |
| No Vehicle | 40 (4.5%) | 38 (25.5%) |
| 1 Vehicle | 18 (2.0%) | 49 (32.9%) |
| 2 Vehicles | 299 (33.8%) | 42 (28.2%) |
| 3 or more Vehicles | 529 (59.7%) | 20 (13.4%) |
| Total | 886 (100.0%) | 149 (100.0%) |
Real Estate & Mortgages in Sisco Heights
Real Estate and Mortgage Overview in Sisco Heights
| Characteristic | Without Mortgage | With Mortgage |
| Housing Units | 207 | 679 |
| Median Property Value | $469,500 | $674,800 |
| Median Household Income | $108,750 | $374 |
| Monthly Housing Costs | $897 | $210 |
| Real Estate Taxes | $4,843 | $0 |
Property Value by Mortgage Status in Sisco Heights
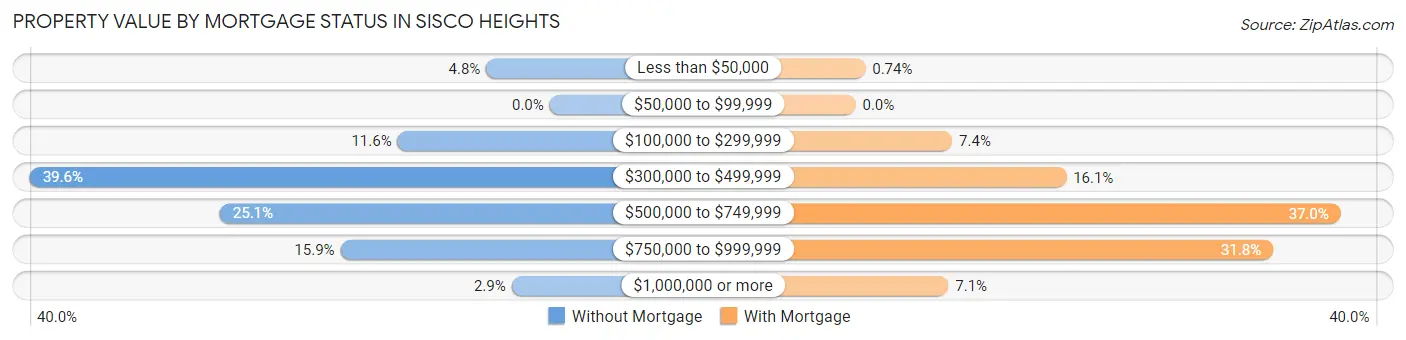
| Property Value | Without Mortgage | With Mortgage |
| Less than $50,000 | 10 (4.8%) | 5 (0.7%) |
| $50,000 to $99,999 | 0 (0.0%) | 0 (0.0%) |
| $100,000 to $299,999 | 24 (11.6%) | 50 (7.4%) |
| $300,000 to $499,999 | 82 (39.6%) | 109 (16.1%) |
| $500,000 to $749,999 | 52 (25.1%) | 251 (37.0%) |
| $750,000 to $999,999 | 33 (15.9%) | 216 (31.8%) |
| $1,000,000 or more | 6 (2.9%) | 48 (7.1%) |
| Total | 207 (100.0%) | 679 (100.0%) |
Household Income by Mortgage Status in Sisco Heights
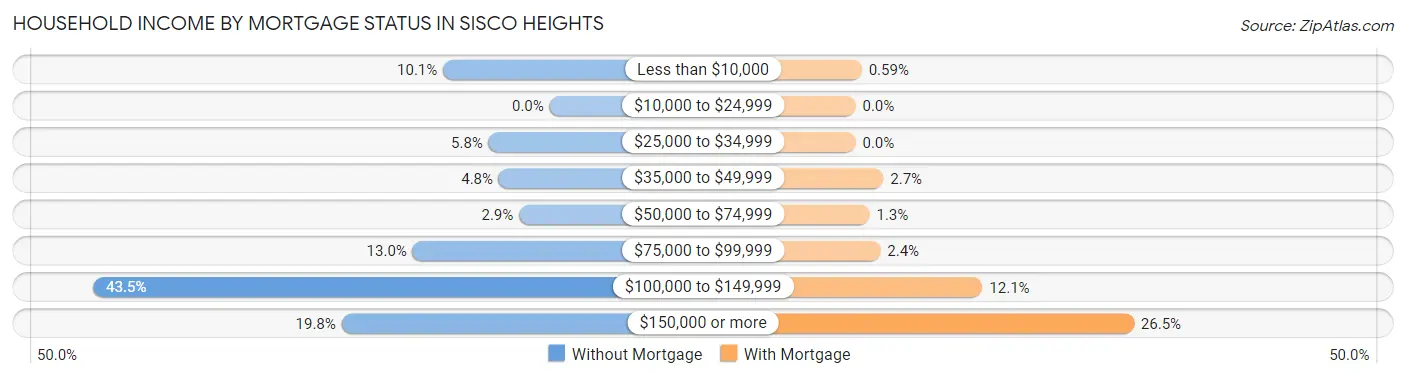
| Household Income | Without Mortgage | With Mortgage |
| Less than $10,000 | 21 (10.1%) | 4 (0.6%) |
| $10,000 to $24,999 | 0 (0.0%) | 0 (0.0%) |
| $25,000 to $34,999 | 12 (5.8%) | 0 (0.0%) |
| $35,000 to $49,999 | 10 (4.8%) | 18 (2.6%) |
| $50,000 to $74,999 | 6 (2.9%) | 9 (1.3%) |
| $75,000 to $99,999 | 27 (13.0%) | 16 (2.4%) |
| $100,000 to $149,999 | 90 (43.5%) | 82 (12.1%) |
| $150,000 or more | 41 (19.8%) | 180 (26.5%) |
| Total | 207 (100.0%) | 679 (100.0%) |
Property Value to Household Income Ratio in Sisco Heights
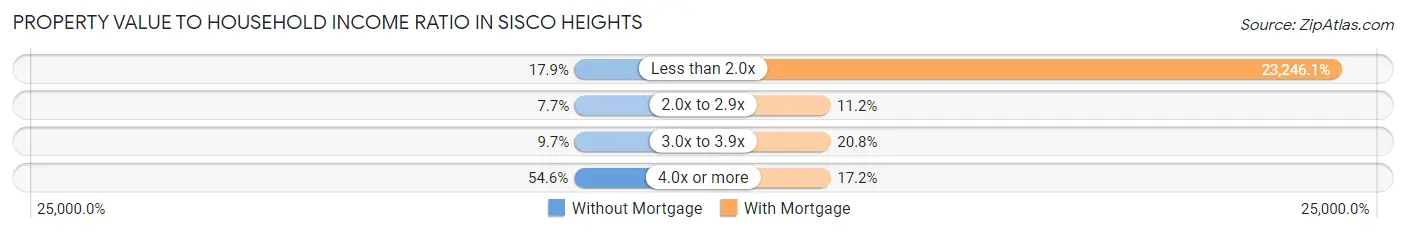
| Value-to-Income Ratio | Without Mortgage | With Mortgage |
| Less than 2.0x | 37 (17.9%) | 157,841 (23,246.1%) |
| 2.0x to 2.9x | 16 (7.7%) | 76 (11.2%) |
| 3.0x to 3.9x | 20 (9.7%) | 141 (20.8%) |
| 4.0x or more | 113 (54.6%) | 117 (17.2%) |
| Total | 207 (100.0%) | 679 (100.0%) |
Real Estate Taxes by Mortgage Status in Sisco Heights
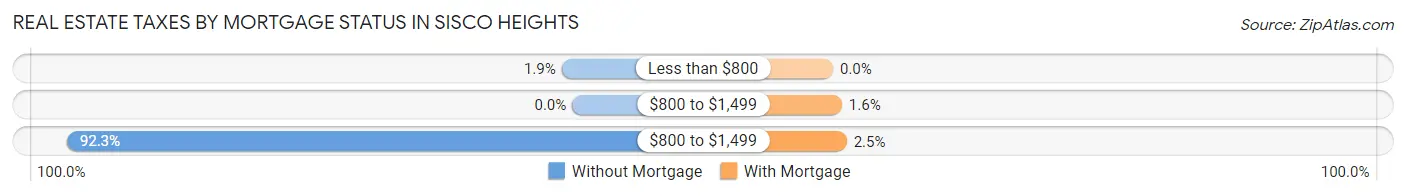
| Property Taxes | Without Mortgage | With Mortgage |
| Less than $800 | 4 (1.9%) | 0 (0.0%) |
| $800 to $1,499 | 0 (0.0%) | 11 (1.6%) |
| $800 to $1,499 | 191 (92.3%) | 17 (2.5%) |
| Total | 207 (100.0%) | 679 (100.0%) |
Health & Disability in Sisco Heights
Health Insurance Coverage by Age in Sisco Heights
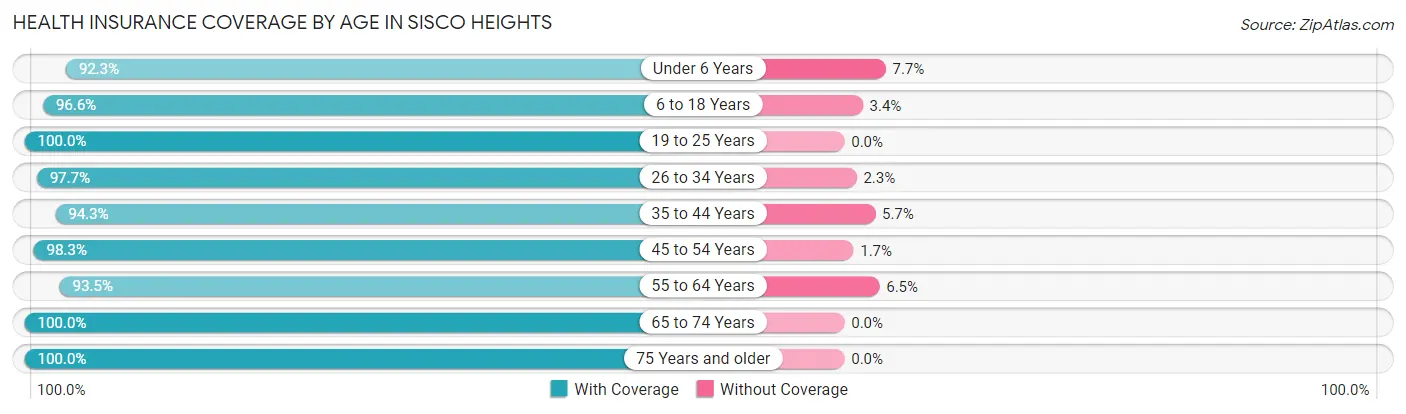
| Age Bracket | With Coverage | Without Coverage |
| Under 6 Years | 204 (92.3%) | 17 (7.7%) |
| 6 to 18 Years | 395 (96.6%) | 14 (3.4%) |
| 19 to 25 Years | 142 (100.0%) | 0 (0.0%) |
| 26 to 34 Years | 301 (97.7%) | 7 (2.3%) |
| 35 to 44 Years | 362 (94.3%) | 22 (5.7%) |
| 45 to 54 Years | 468 (98.3%) | 8 (1.7%) |
| 55 to 64 Years | 617 (93.5%) | 43 (6.5%) |
| 65 to 74 Years | 267 (100.0%) | 0 (0.0%) |
| 75 Years and older | 105 (100.0%) | 0 (0.0%) |
| Total | 2,861 (96.3%) | 111 (3.7%) |
Health Insurance Coverage by Citizenship Status in Sisco Heights
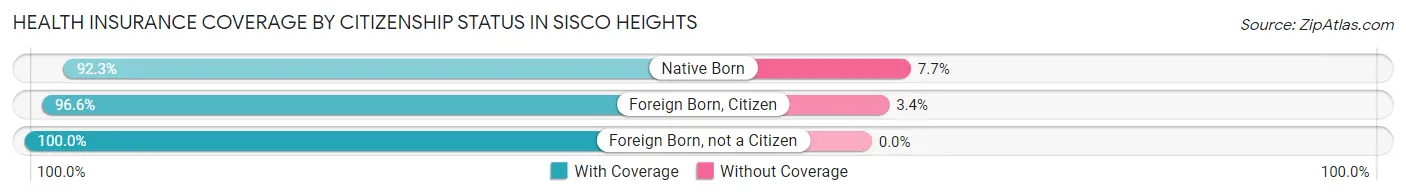
| Citizenship Status | With Coverage | Without Coverage |
| Native Born | 204 (92.3%) | 17 (7.7%) |
| Foreign Born, Citizen | 395 (96.6%) | 14 (3.4%) |
| Foreign Born, not a Citizen | 142 (100.0%) | 0 (0.0%) |
Health Insurance Coverage by Household Income in Sisco Heights
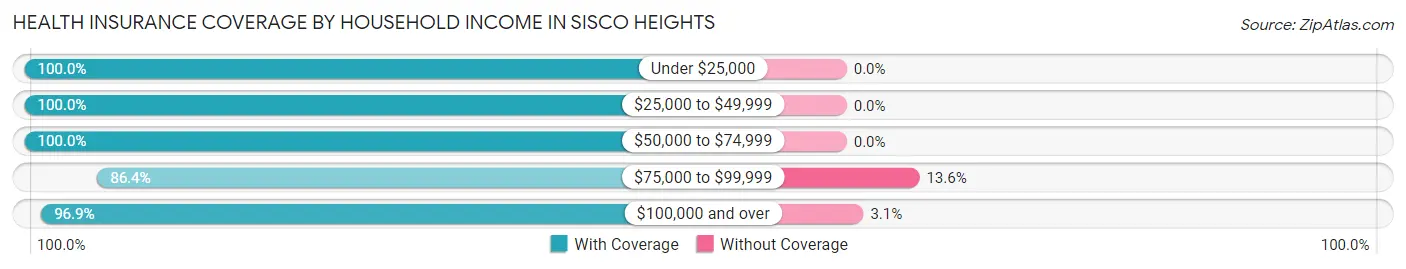
| Household Income | With Coverage | Without Coverage |
| Under $25,000 | 59 (100.0%) | 0 (0.0%) |
| $25,000 to $49,999 | 288 (100.0%) | 0 (0.0%) |
| $50,000 to $74,999 | 156 (100.0%) | 0 (0.0%) |
| $75,000 to $99,999 | 279 (86.4%) | 44 (13.6%) |
| $100,000 and over | 2,079 (96.9%) | 67 (3.1%) |
Public vs Private Health Insurance Coverage by Age in Sisco Heights
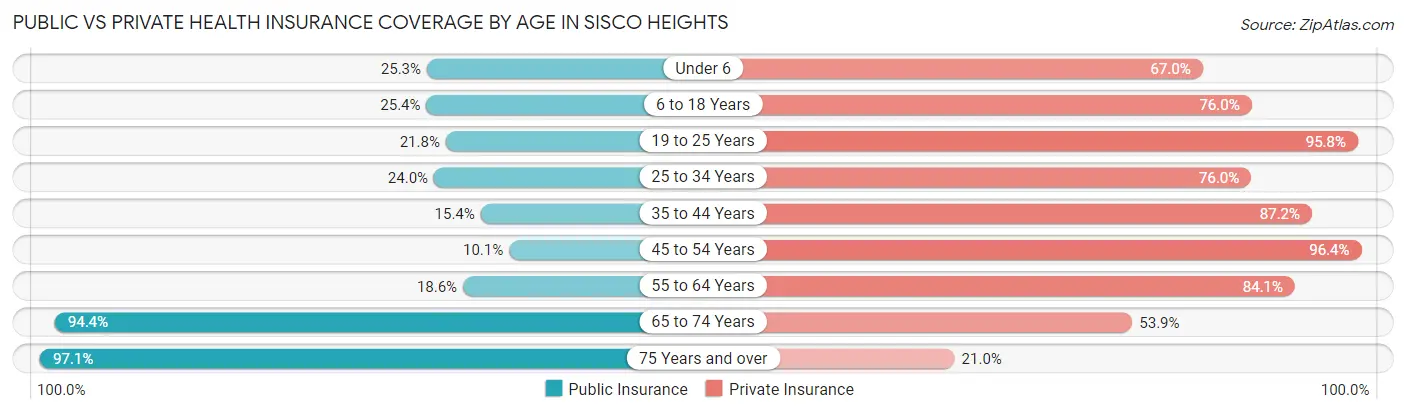
| Age Bracket | Public Insurance | Private Insurance |
| Under 6 | 56 (25.3%) | 148 (67.0%) |
| 6 to 18 Years | 104 (25.4%) | 311 (76.0%) |
| 19 to 25 Years | 31 (21.8%) | 136 (95.8%) |
| 25 to 34 Years | 74 (24.0%) | 234 (76.0%) |
| 35 to 44 Years | 59 (15.4%) | 335 (87.2%) |
| 45 to 54 Years | 48 (10.1%) | 459 (96.4%) |
| 55 to 64 Years | 123 (18.6%) | 555 (84.1%) |
| 65 to 74 Years | 252 (94.4%) | 144 (53.9%) |
| 75 Years and over | 102 (97.1%) | 22 (20.9%) |
| Total | 849 (28.6%) | 2,344 (78.9%) |
Disability Status by Sex by Age in Sisco Heights
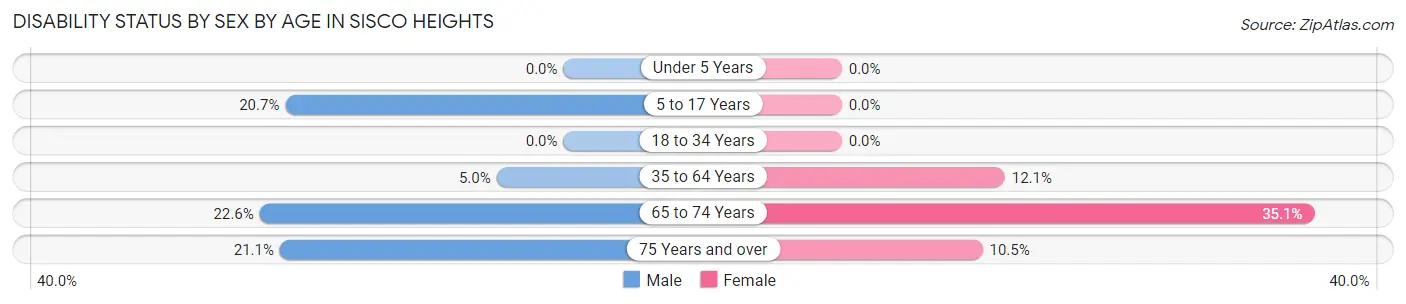
| Age Bracket | Male | Female |
| Under 5 Years | 0 (0.0%) | 0 (0.0%) |
| 5 to 17 Years | 51 (20.6%) | 0 (0.0%) |
| 18 to 34 Years | 0 (0.0%) | 0 (0.0%) |
| 35 to 64 Years | 41 (5.0%) | 84 (12.1%) |
| 65 to 74 Years | 30 (22.6%) | 47 (35.1%) |
| 75 Years and over | 8 (21.0%) | 7 (10.4%) |
Disability Class by Sex by Age in Sisco Heights
Disability Class: Hearing Difficulty
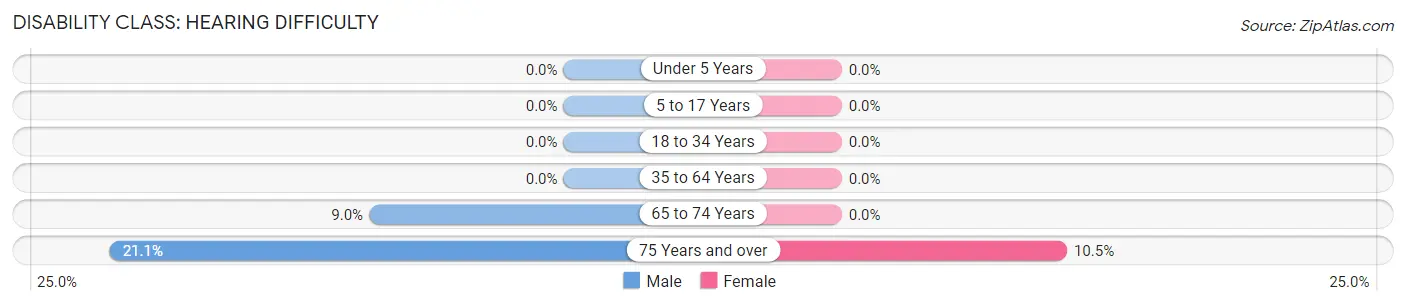
| Age Bracket | Male | Female |
| Under 5 Years | 0 (0.0%) | 0 (0.0%) |
| 5 to 17 Years | 0 (0.0%) | 0 (0.0%) |
| 18 to 34 Years | 0 (0.0%) | 0 (0.0%) |
| 35 to 64 Years | 0 (0.0%) | 0 (0.0%) |
| 65 to 74 Years | 12 (9.0%) | 0 (0.0%) |
| 75 Years and over | 8 (21.0%) | 7 (10.4%) |
Disability Class: Vision Difficulty
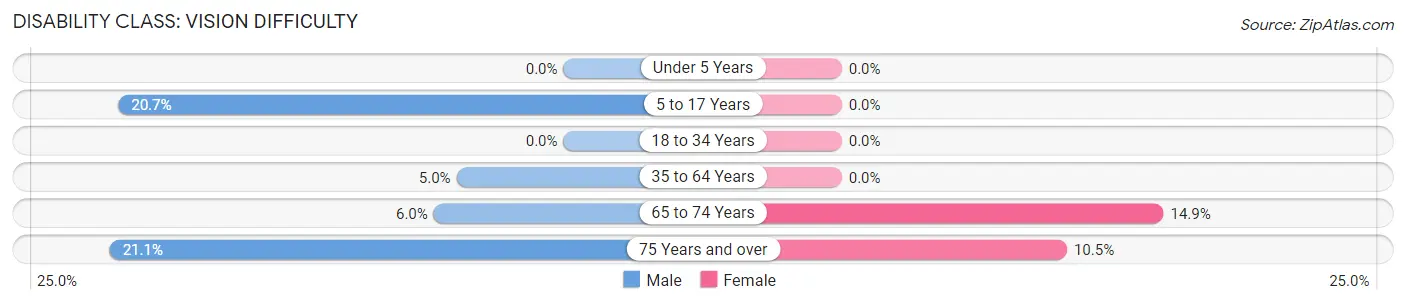
| Age Bracket | Male | Female |
| Under 5 Years | 0 (0.0%) | 0 (0.0%) |
| 5 to 17 Years | 51 (20.6%) | 0 (0.0%) |
| 18 to 34 Years | 0 (0.0%) | 0 (0.0%) |
| 35 to 64 Years | 41 (5.0%) | 0 (0.0%) |
| 65 to 74 Years | 8 (6.0%) | 20 (14.9%) |
| 75 Years and over | 8 (21.0%) | 7 (10.4%) |
Disability Class: Cognitive Difficulty
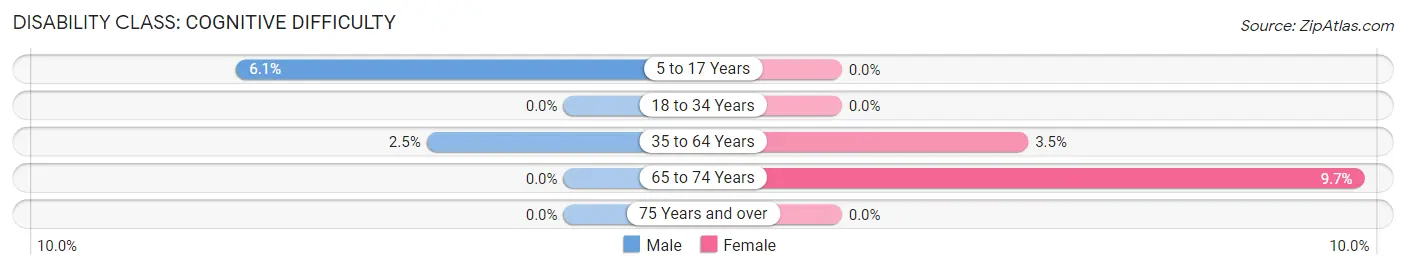
| Age Bracket | Male | Female |
| 5 to 17 Years | 15 (6.1%) | 0 (0.0%) |
| 18 to 34 Years | 0 (0.0%) | 0 (0.0%) |
| 35 to 64 Years | 21 (2.5%) | 24 (3.5%) |
| 65 to 74 Years | 0 (0.0%) | 13 (9.7%) |
| 75 Years and over | 0 (0.0%) | 0 (0.0%) |
Disability Class: Ambulatory Difficulty
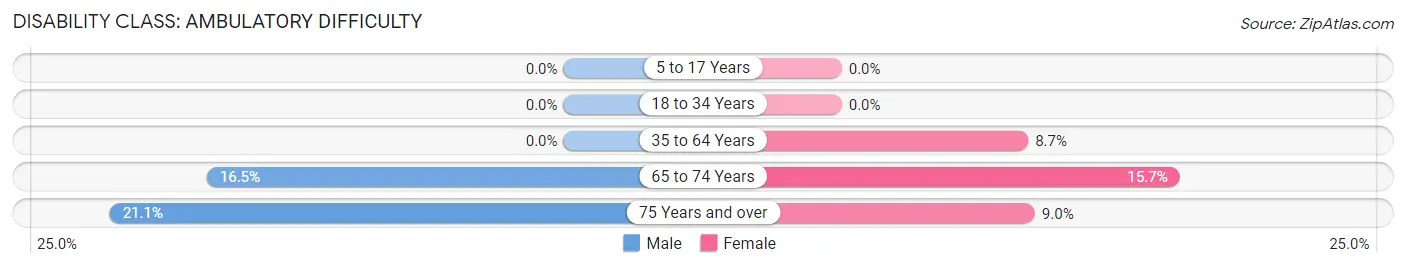
| Age Bracket | Male | Female |
| 5 to 17 Years | 0 (0.0%) | 0 (0.0%) |
| 18 to 34 Years | 0 (0.0%) | 0 (0.0%) |
| 35 to 64 Years | 0 (0.0%) | 60 (8.6%) |
| 65 to 74 Years | 22 (16.5%) | 21 (15.7%) |
| 75 Years and over | 8 (21.0%) | 6 (9.0%) |
Disability Class: Self-Care Difficulty
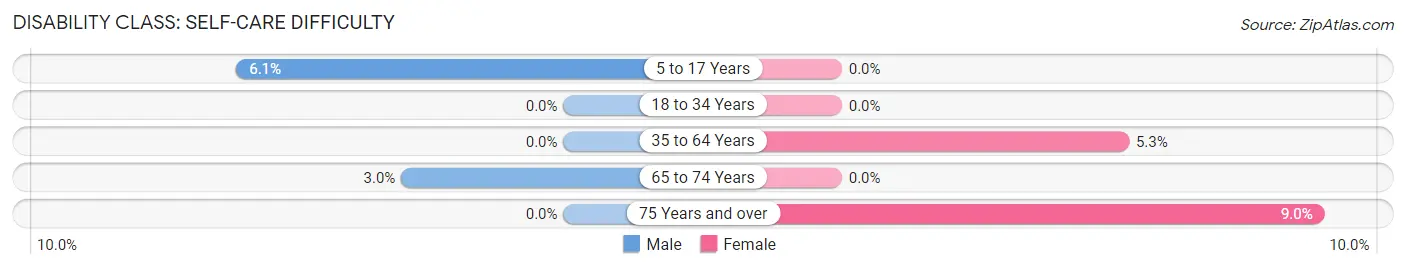
| Age Bracket | Male | Female |
| 5 to 17 Years | 15 (6.1%) | 0 (0.0%) |
| 18 to 34 Years | 0 (0.0%) | 0 (0.0%) |
| 35 to 64 Years | 0 (0.0%) | 37 (5.3%) |
| 65 to 74 Years | 4 (3.0%) | 0 (0.0%) |
| 75 Years and over | 0 (0.0%) | 6 (9.0%) |
Technology Access in Sisco Heights
Computing Device Access in Sisco Heights
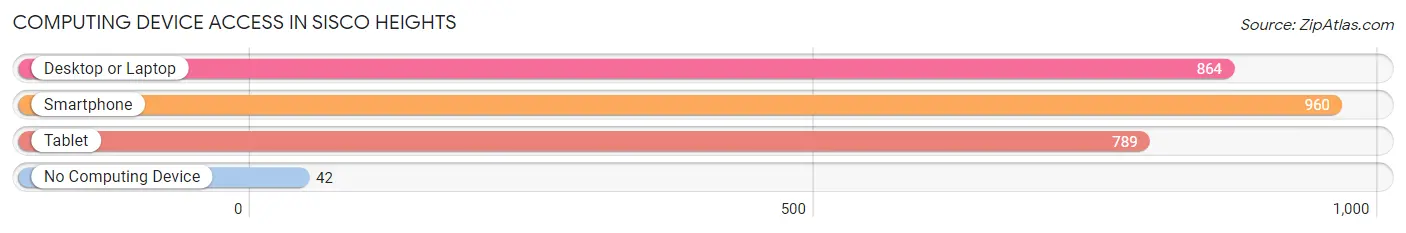
| Device Type | # Households | % Households |
| Desktop or Laptop | 864 | 83.5% |
| Smartphone | 960 | 92.7% |
| Tablet | 789 | 76.2% |
| No Computing Device | 42 | 4.1% |
| Total | 1,035 | 100.0% |
Internet Access in Sisco Heights
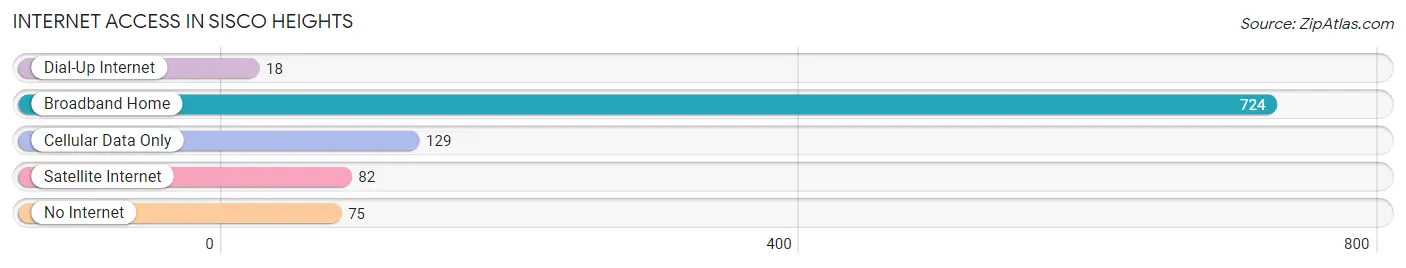
| Internet Type | # Households | % Households |
| Dial-Up Internet | 18 | 1.7% |
| Broadband Home | 724 | 70.0% |
| Cellular Data Only | 129 | 12.5% |
| Satellite Internet | 82 | 7.9% |
| No Internet | 75 | 7.2% |
| Total | 1,035 | 100.0% |
Sisco Heights Summary
Sisco Heights is a small town located in the state of Washington, United States. It is situated in the foothills of the Cascade Mountains, about 25 miles east of Seattle. The town has a population of approximately 1,500 people and is known for its rural charm and scenic beauty.
History
Sisco Heights was founded in the late 1800s by a group of settlers who were looking for a place to settle and start a new life. The town was named after the Sisco family, who were among the first settlers. The town was originally a logging and farming community, but over the years it has become a popular tourist destination.
Geography
Sisco Heights is located in the foothills of the Cascade Mountains, about 25 miles east of Seattle. The town is situated at an elevation of 1,000 feet and is surrounded by lush forests and rolling hills. The climate in Sisco Heights is mild and temperate, with warm summers and cool winters.
Economy
The economy of Sisco Heights is largely based on tourism. The town is home to several popular attractions, including the Sisco Heights Golf Course, the Sisco Heights Winery, and the Sisco Heights Historical Museum. The town also has a number of small businesses, including restaurants, shops, and galleries.
Demographics
As of the 2010 census, the population of Sisco Heights was 1,500. The racial makeup of the town was 94.2% White, 0.7% African American, 0.7% Native American, 0.7% Asian, 0.7% from other races, and 2.7% from two or more races. The median household income was $50,000, and the median age was 40.
Conclusion
Sisco Heights is a small town located in the state of Washington, United States. It is situated in the foothills of the Cascade Mountains, about 25 miles east of Seattle. The town has a population of approximately 1,500 people and is known for its rural charm and scenic beauty. The economy of Sisco Heights is largely based on tourism, and the town is home to several popular attractions. The racial makeup of the town is predominantly White, with a small percentage of African American, Native American, and Asian residents. The median household income is $50,000, and the median age is 40.
Common Questions
What is Per Capita Income in Sisco Heights?
Per Capita income in Sisco Heights is $53,060.
What is the Median Family Income in Sisco Heights?
Median Family Income in Sisco Heights is $121,848.
What is the Median Household income in Sisco Heights?
Median Household Income in Sisco Heights is $119,036.
What is Income or Wage Gap in Sisco Heights?
Income or Wage Gap in Sisco Heights is 45.2%.
Women in Sisco Heights earn 54.8 cents for every dollar earned by a man.
What is Inequality or Gini Index in Sisco Heights?
Inequality or Gini Index in Sisco Heights is 0.40.
What is the Total Population of Sisco Heights?
Total Population of Sisco Heights is 2,972.
What is the Total Male Population of Sisco Heights?
Total Male Population of Sisco Heights is 1,618.
What is the Total Female Population of Sisco Heights?
Total Female Population of Sisco Heights is 1,354.
What is the Ratio of Males per 100 Females in Sisco Heights?
There are 119.50 Males per 100 Females in Sisco Heights.
What is the Ratio of Females per 100 Males in Sisco Heights?
There are 83.68 Females per 100 Males in Sisco Heights.
What is the Median Population Age in Sisco Heights?
Median Population Age in Sisco Heights is 45.6 Years.
What is the Average Family Size in Sisco Heights
Average Family Size in Sisco Heights is 3.2 People.
What is the Average Household Size in Sisco Heights
Average Household Size in Sisco Heights is 2.9 People.
How Large is the Labor Force in Sisco Heights?
There are 1,546 People in the Labor Forcein in Sisco Heights.
What is the Percentage of People in the Labor Force in Sisco Heights?
64.3% of People are in the Labor Force in Sisco Heights.
What is the Unemployment Rate in Sisco Heights?
Unemployment Rate in Sisco Heights is 4.8%.