Zip Codes with the Highest Percentage of Population Employed in Architecture & Engineering in Auburn, WA

RELATED REPORTS & OPTIONS

Architecture & Engineering
Population
Families and Households
Female Fertility
Female Fertility (Unmarried)
Race (Community Size)
Race (Percentage)
Ancestry (Community Size)
AfghanAfricanAlaska NativeAlaskan AthabascanAleutAmericanApacheArabArgentineanArmenianAustrianBangladeshiBelgianBhutaneseBlackfeetBrazilianBritishBritish West IndianBulgarianBurmeseCanadianCentral AmericanCentral American IndianCherokeeChileanChippewaChoctawColombianColvilleCosta RicanCroatianCubanCzechDanishDominicanDutchEastern EuropeanEgyptianEnglishEthiopianEuropeanFijianFinnishFrenchFrench American IndianFrench CanadianGermanGreekGuamanian / ChamorroGuatemalanHonduranHungarianIndian (Asian)IndonesianIraqiIrishIroquoisItalianJamaicanJapaneseKenyanKoreanLatvianLebaneseLithuanianMalaysianMexicanMexican American IndianMoroccanNative HawaiianNavajoNepaleseNicaraguanNigerianNorthern EuropeanNorwegianPakistaniPennsylvania GermanPeruvianPolishPortuguesePuerto RicanPuget Sound SalishRomanianRussianSalvadoranSamoanScandinavianScotch-IrishScottishSiouxSlavicSomaliSouth AmericanSpaniardSpanishSri LankanSubsaharan AfricanSwedishSwissThaiTlingit-HaidaTonganTsimshianTurkishUkrainianWelshYakamaYugoslavian
Ancestry (Percentage)
AfghanAfricanAlaska NativeAlaskan AthabascanAleutAmericanApacheArabArgentineanArmenianAustrianBangladeshiBelgianBhutaneseBlackfeetBrazilianBritishBritish West IndianBulgarianBurmeseCanadianCentral AmericanCentral American IndianCherokeeChileanChippewaChoctawColombianColvilleCosta RicanCroatianCubanCzechDanishDominicanDutchEastern EuropeanEgyptianEnglishEthiopianEuropeanFijianFinnishFrenchFrench American IndianFrench CanadianGermanGreekGuamanian / ChamorroGuatemalanHonduranHungarianIndian (Asian)IndonesianIraqiIrishIroquoisItalianJamaicanJapaneseKenyanKoreanLatvianLebaneseLithuanianMalaysianMexicanMexican American IndianMoroccanNative HawaiianNavajoNepaleseNicaraguanNigerianNorthern EuropeanNorwegianPakistaniPennsylvania GermanPeruvianPolishPortuguesePuerto RicanPuget Sound SalishRomanianRussianSalvadoranSamoanScandinavianScotch-IrishScottishSiouxSlavicSomaliSouth AmericanSpaniardSpanishSri LankanSubsaharan AfricanSwedishSwissThaiTlingit-HaidaTonganTsimshianTurkishUkrainianWelshYakamaYugoslavian
Immigrant Origin (Total)
Immigrant Origin (Percentage)
Income
Income (Families)
Income (Households)
Poverty
Poverty (Families)
Unemployment
Employment Occupations
Employment Industries
Employer Class
Commute Time
Commute Means
School Enrollment
Education by Degree Field
Occupancy
Finances
Physical Characteristics
Auburn
Compare Zip Codes
Comparison Subject

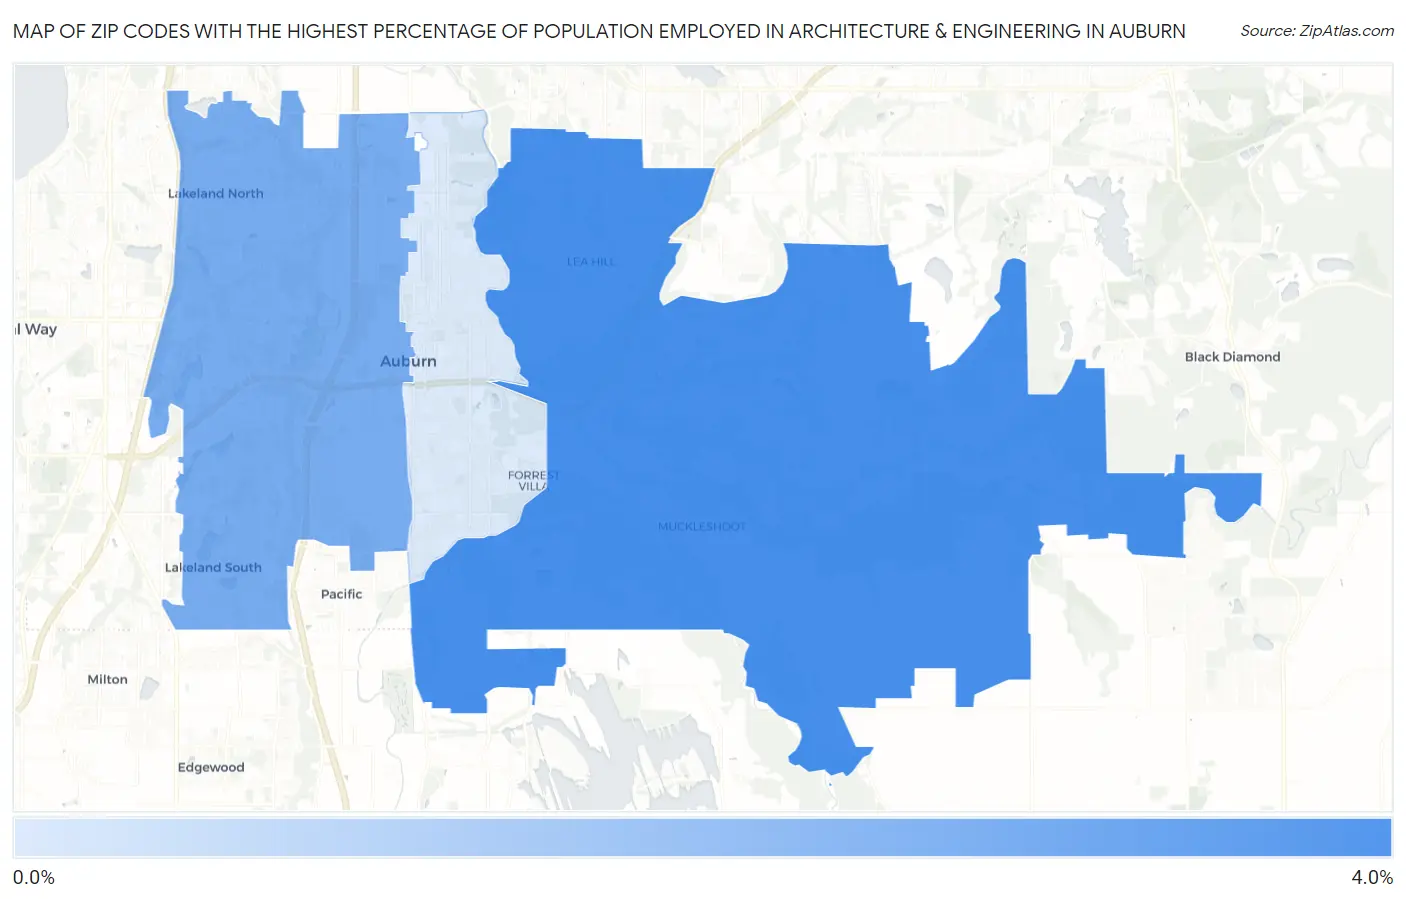
Map of Zip Codes with the Highest Percentage of Population Employed in Architecture & Engineering in Auburn

0.0%
4.0%
Zip Codes with the Highest Percentage of Population Employed in Architecture & Engineering in Auburn Map

Zip Codes with the Highest Percentage of Population Employed in Architecture & Engineering in Auburn, WA

Zip Code % Employed vs State vs National
1.980923.5%2.8%(+0.667)#1102.1%(+1.31)#3,834
2.980012.6%2.8%(-0.174)#1732.1%(+0.468)#6,505
3.980020.83%2.8%(-1.96)#3582.1%(-1.32)#17,899

Common Questions

What are the Top Zip Codes with the Highest Percentage of Population Employed in Architecture & Engineering in Auburn, WA?
Top Zip Codes with the Highest Percentage of Population Employed in Architecture & Engineering in Auburn, WA are:
#1
3.5%
#2
2.6%
#3
0.83%
What zip code has the Highest Percentage of Population Employed in Architecture & Engineering in Auburn, WA?
98092 has the Highest Percentage of Population Employed in Architecture & Engineering in Auburn, WA with 3.5%.
What is the Percentage of Population Employed in Architecture & Engineering in Auburn, WA?
Percentage of Population Employed in Architecture & Engineering in Auburn is 2.4%.
What is the Percentage of Population Employed in Architecture & Engineering in Washington?
Percentage of Population Employed in Architecture & Engineering in Washington is 2.8%.
What is the Percentage of Population Employed in Architecture & Engineering in the United States?
Percentage of Population Employed in Architecture & Engineering in the United States is 2.1%.