West Pasco, WA Map & Demographics
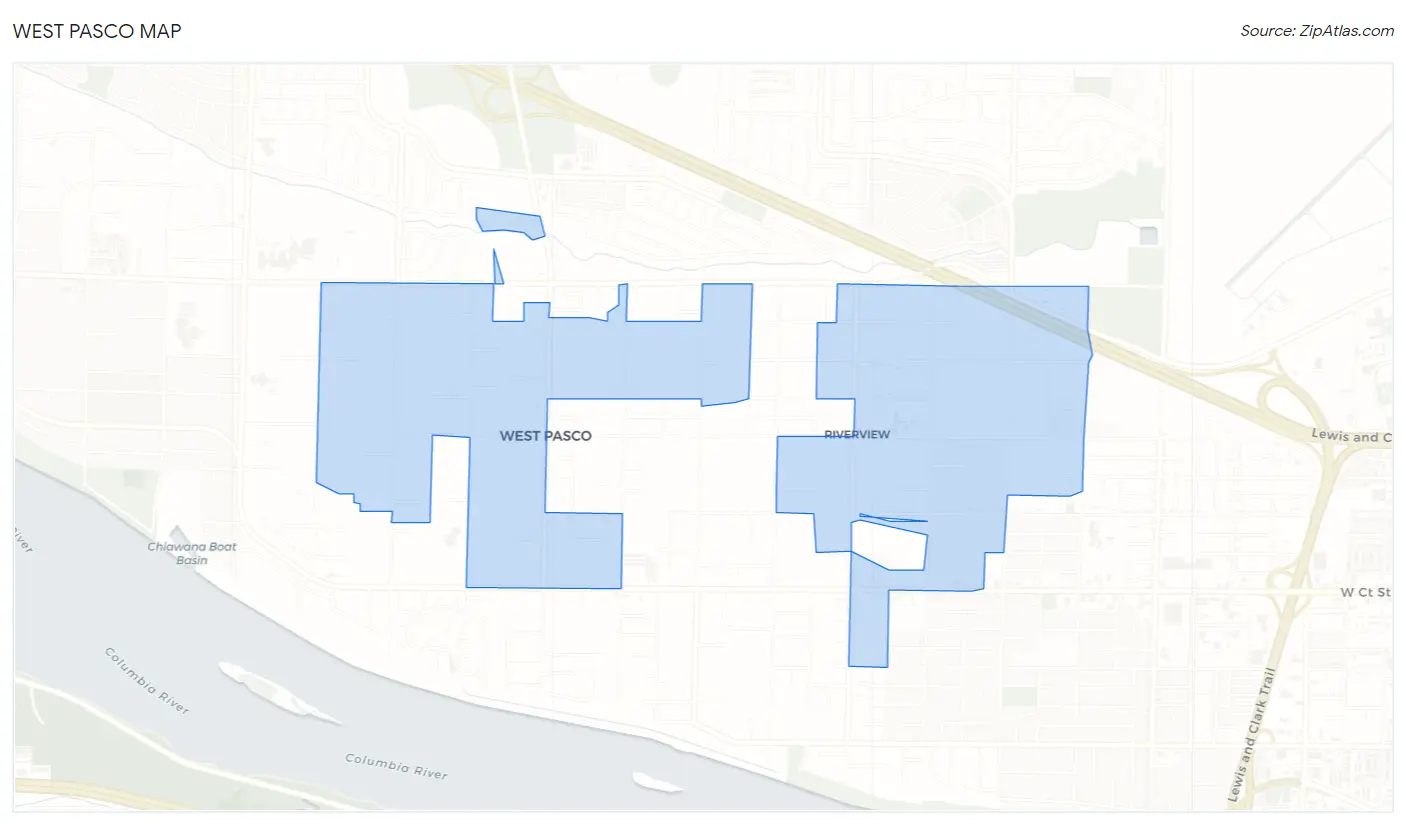
West Pasco Map
West Pasco Overview
$68,834
PER CAPITA INCOME
$196,875
AVG FAMILY INCOME
$147,833
AVG HOUSEHOLD INCOME
34.2%
WAGE / INCOME GAP [ % ]
65.8¢/ $1
WAGE / INCOME GAP [ $ ]
0.54
INEQUALITY / GINI INDEX
1,870
TOTAL POPULATION
967
MALE POPULATION
903
FEMALE POPULATION
107.09
MALES / 100 FEMALES
93.38
FEMALES / 100 MALES
28.0
MEDIAN AGE
4.0
AVG FAMILY SIZE
3.5
AVG HOUSEHOLD SIZE
1,029
LABOR FORCE [ PEOPLE ]
74.0%
PERCENT IN LABOR FORCE
8.2%
UNEMPLOYMENT RATE
Income in West Pasco
Income Overview in West Pasco
Per Capita Income in West Pasco is $68,834, while median incomes of families and households are $196,875 and $147,833 respectively.
| Characteristic | Number | Measure |
| Per Capita Income | 1,870 | $68,834 |
| Median Family Income | 395 | $196,875 |
| Mean Family Income | 395 | $167,020 |
| Median Household Income | 534 | $147,833 |
| Mean Household Income | 534 | $183,541 |
| Income Deficit | 395 | $0 |
| Wage / Income Gap (%) | 1,870 | 34.21% |
| Wage / Income Gap ($) | 1,870 | 65.79¢ per $1 |
| Gini / Inequality Index | 1,870 | 0.54 |
Earnings by Sex in West Pasco
Average Earnings in West Pasco are $60,694, $64,375 for men and $42,353 for women, a difference of 34.2%.
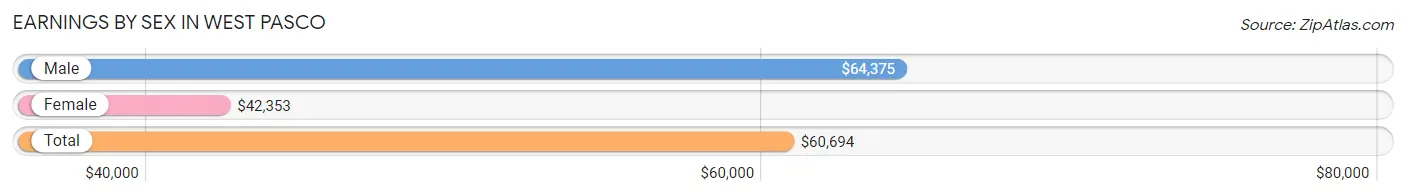
| Sex | Number | Average Earnings |
| Male | 572 (54.9%) | $64,375 |
| Female | 470 (45.1%) | $42,353 |
| Total | 1,042 (100.0%) | $60,694 |
Earnings by Sex by Income Bracket in West Pasco
The most common earnings brackets in West Pasco are $75,000 to $99,999 for men (148 | 25.9%) and $100,000+ for women (115 | 24.5%).
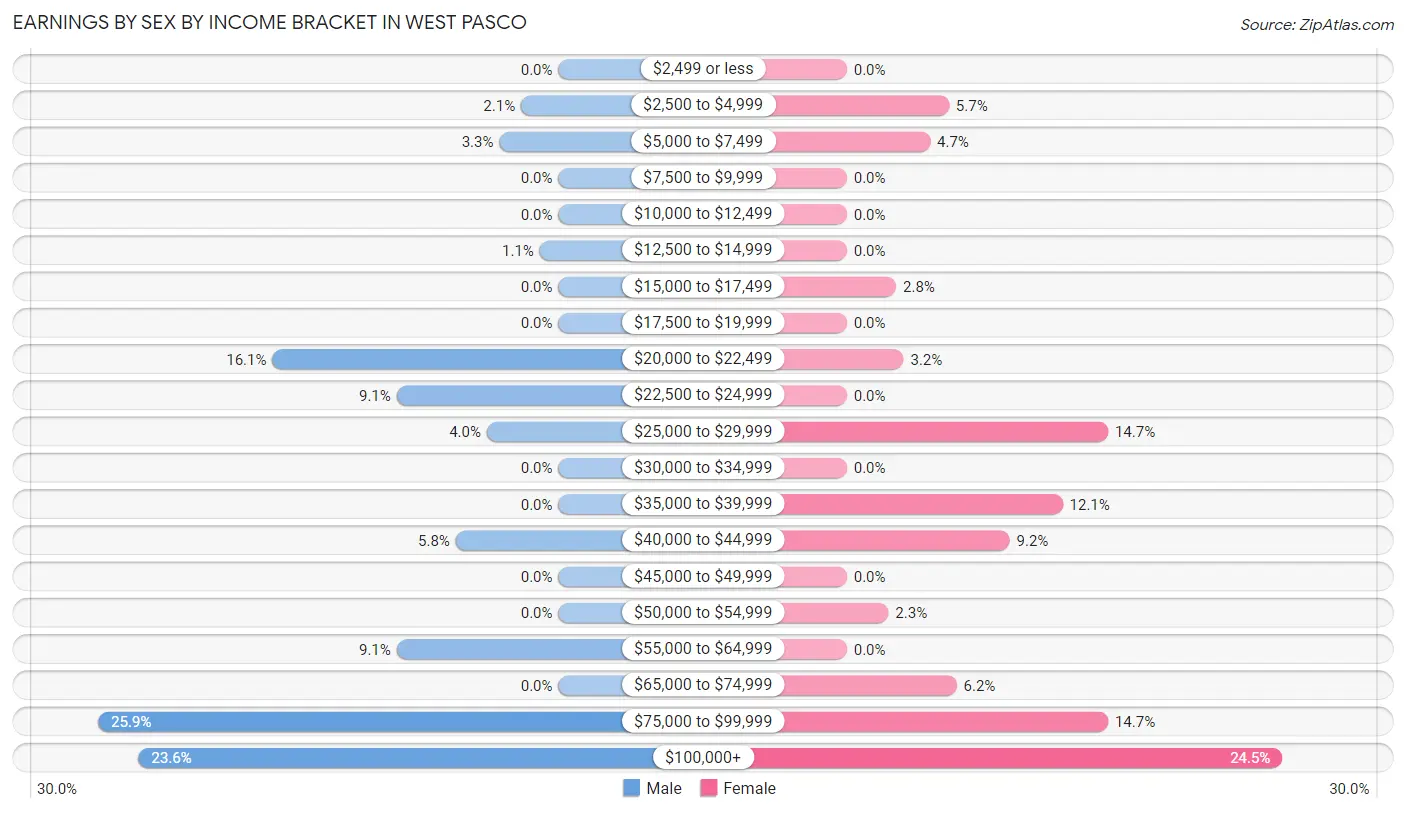
| Income | Male | Female |
| $2,499 or less | 0 (0.0%) | 0 (0.0%) |
| $2,500 to $4,999 | 12 (2.1%) | 27 (5.7%) |
| $5,000 to $7,499 | 19 (3.3%) | 22 (4.7%) |
| $7,500 to $9,999 | 0 (0.0%) | 0 (0.0%) |
| $10,000 to $12,499 | 0 (0.0%) | 0 (0.0%) |
| $12,500 to $14,999 | 6 (1.1%) | 0 (0.0%) |
| $15,000 to $17,499 | 0 (0.0%) | 13 (2.8%) |
| $17,500 to $19,999 | 0 (0.0%) | 0 (0.0%) |
| $20,000 to $22,499 | 92 (16.1%) | 15 (3.2%) |
| $22,500 to $24,999 | 52 (9.1%) | 0 (0.0%) |
| $25,000 to $29,999 | 23 (4.0%) | 69 (14.7%) |
| $30,000 to $34,999 | 0 (0.0%) | 0 (0.0%) |
| $35,000 to $39,999 | 0 (0.0%) | 57 (12.1%) |
| $40,000 to $44,999 | 33 (5.8%) | 43 (9.1%) |
| $45,000 to $49,999 | 0 (0.0%) | 0 (0.0%) |
| $50,000 to $54,999 | 0 (0.0%) | 11 (2.3%) |
| $55,000 to $64,999 | 52 (9.1%) | 0 (0.0%) |
| $65,000 to $74,999 | 0 (0.0%) | 29 (6.2%) |
| $75,000 to $99,999 | 148 (25.9%) | 69 (14.7%) |
| $100,000+ | 135 (23.6%) | 115 (24.5%) |
| Total | 572 (100.0%) | 470 (100.0%) |
Earnings by Sex by Educational Attainment in West Pasco
Average earnings in West Pasco are $87,530 for men and $88,284 for women, a difference of 0.9%. Men with an educational attainment of bachelor's degree enjoy the highest average annual earnings of $127,935, while those with high school diploma education earn the least with $44,018. Women with an educational attainment of graduate degree earn the most with the average annual earnings of $108,929, while those with high school diploma education have the smallest earnings of $40,772.
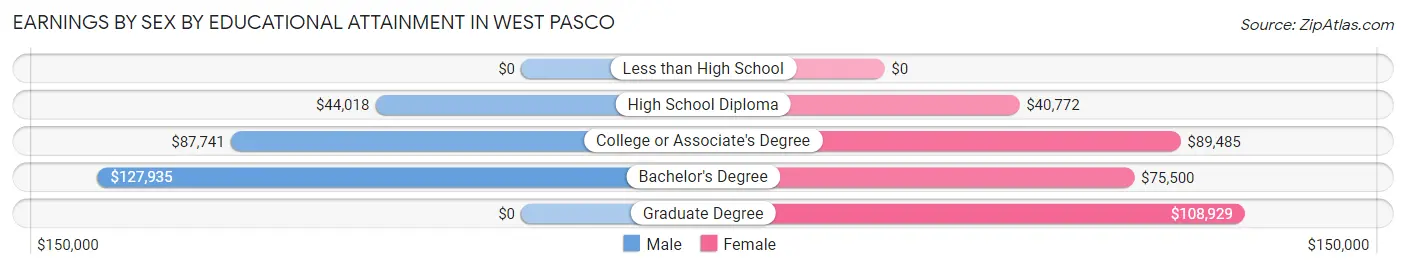
| Educational Attainment | Male Income | Female Income |
| Less than High School | - | - |
| High School Diploma | $44,018 | $40,772 |
| College or Associate's Degree | $87,741 | $89,485 |
| Bachelor's Degree | $127,935 | $75,500 |
| Graduate Degree | - | - |
| Total | $87,530 | $88,284 |
Family Income in West Pasco
Family Income Brackets in West Pasco
According to the West Pasco family income data, there are 194 families falling into the $200,000+ income range, which is the most common income bracket and makes up 49.1% of all families.
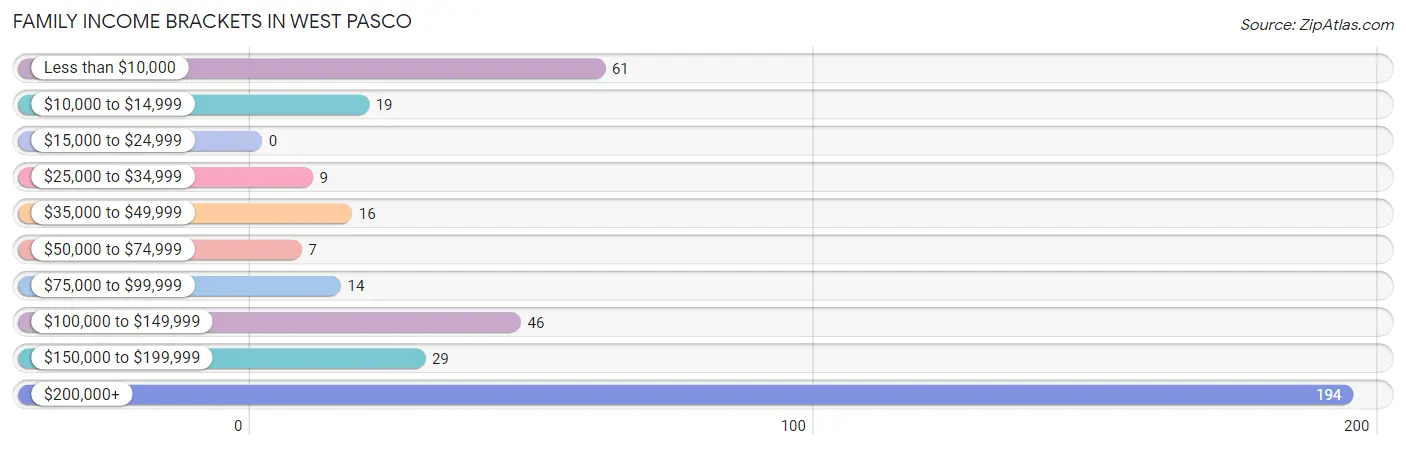
| Income Bracket | # Families | % Families |
| Less than $10,000 | 61 | 15.4% |
| $10,000 to $14,999 | 19 | 4.8% |
| $15,000 to $24,999 | 0 | 0.0% |
| $25,000 to $34,999 | 9 | 2.3% |
| $35,000 to $49,999 | 16 | 4.1% |
| $50,000 to $74,999 | 7 | 1.8% |
| $75,000 to $99,999 | 14 | 3.5% |
| $100,000 to $149,999 | 46 | 11.6% |
| $150,000 to $199,999 | 29 | 7.3% |
| $200,000+ | 194 | 49.1% |
Family Income by Famaliy Size in West Pasco
3-person families (143 | 36.2%) account for the highest median family income in West Pasco with $211,125 per family, while 2-person families (64 | 16.2%) have the highest median income of $86,334 per family member.
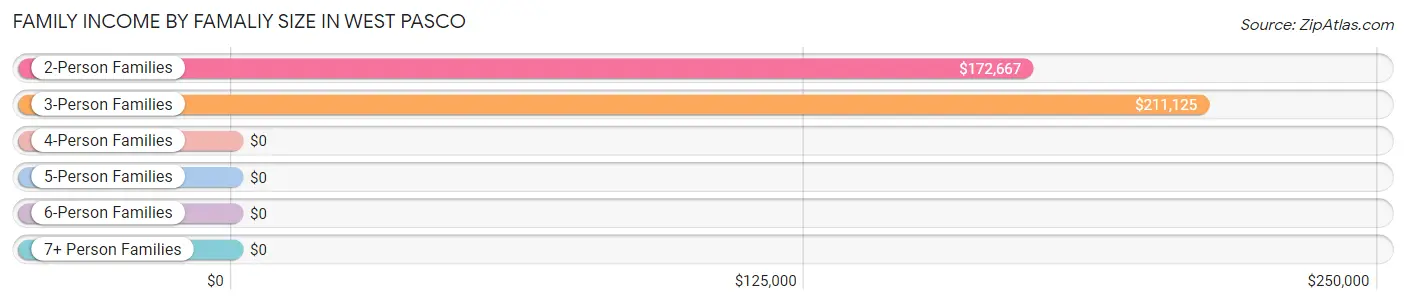
| Income Bracket | # Families | Median Income |
| 2-Person Families | 64 (16.2%) | $172,667 |
| 3-Person Families | 143 (36.2%) | $211,125 |
| 4-Person Families | 44 (11.1%) | $0 |
| 5-Person Families | 62 (15.7%) | $0 |
| 6-Person Families | 73 (18.5%) | $0 |
| 7+ Person Families | 9 (2.3%) | $0 |
| Total | 395 (100.0%) | $196,875 |
Family Income by Number of Earners in West Pasco
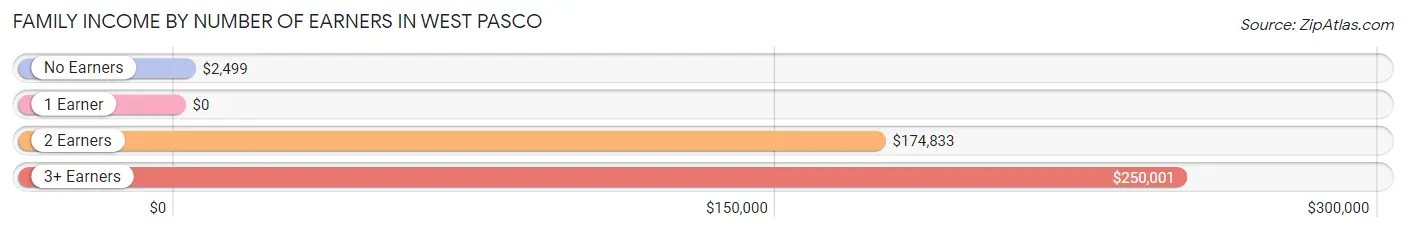
| Number of Earners | # Families | Median Income |
| No Earners | 68 (17.2%) | $2,499 |
| 1 Earner | 25 (6.3%) | $0 |
| 2 Earners | 148 (37.5%) | $174,833 |
| 3+ Earners | 154 (39.0%) | $250,001 |
| Total | 395 (100.0%) | $196,875 |
Household Income in West Pasco
Household Income Brackets in West Pasco
With 212 households falling in the category, the $200,000+ income range is the most frequent in West Pasco, accounting for 39.7% of all households.
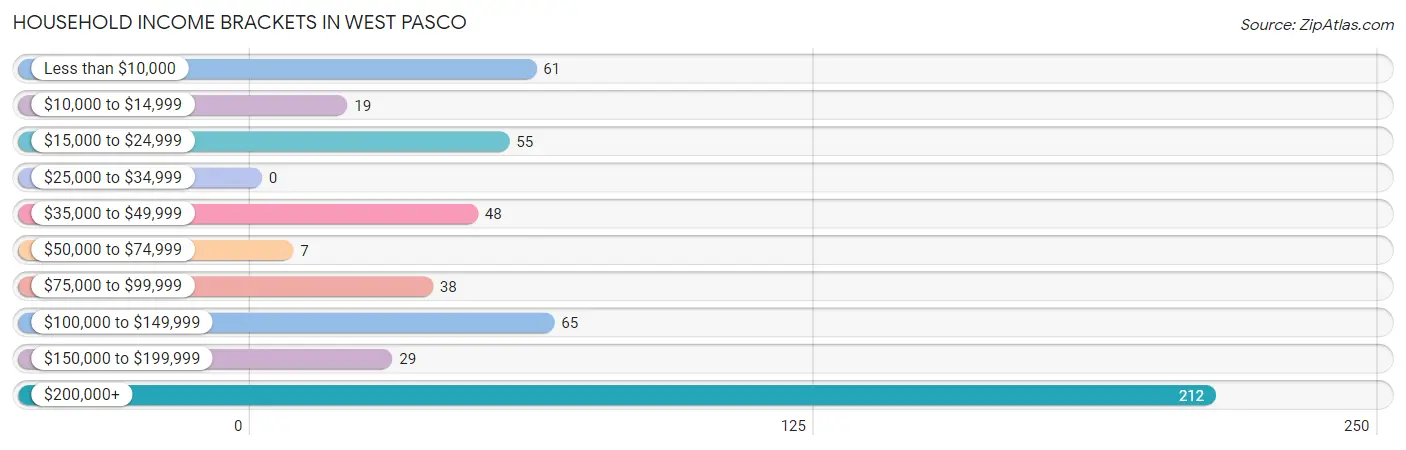
| Income Bracket | # Households | % Households |
| Less than $10,000 | 61 | 11.4% |
| $10,000 to $14,999 | 19 | 3.6% |
| $15,000 to $24,999 | 55 | 10.3% |
| $25,000 to $34,999 | 0 | 0.0% |
| $35,000 to $49,999 | 48 | 9.0% |
| $50,000 to $74,999 | 7 | 1.3% |
| $75,000 to $99,999 | 38 | 7.1% |
| $100,000 to $149,999 | 65 | 12.2% |
| $150,000 to $199,999 | 29 | 5.4% |
| $200,000+ | 212 | 39.7% |
Household Income by Householder Age in West Pasco
The median household income in West Pasco is $147,833, with the highest median household income of $211,208 found in the 45 to 64 years age bracket for the primary householder. A total of 245 households (45.9%) fall into this category.
| Income Bracket | # Households | Median Income |
| 15 to 24 Years | 0 (0.0%) | $0 |
| 25 to 44 Years | 175 (32.8%) | $0 |
| 45 to 64 Years | 245 (45.9%) | $211,208 |
| 65+ Years | 114 (21.3%) | $0 |
| Total | 534 (100.0%) | $147,833 |
Poverty in West Pasco
Income Below Poverty by Sex and Age in West Pasco
With 18.6% poverty level for males and 31.9% for females among the residents of West Pasco, 6 to 11 year old males and 15 year old females are the most vulnerable to poverty, with 84 males (80.8%) and 51 females (100.0%) in their respective age groups living below the poverty level.
| Age Bracket | Male | Female |
| Under 5 Years | 12 (50.0%) | 116 (70.7%) |
| 5 Years | 0 (0.0%) | 0 (0.0%) |
| 6 to 11 Years | 84 (80.8%) | 0 (0.0%) |
| 12 to 14 Years | 24 (70.6%) | 0 (0.0%) |
| 15 Years | 0 (0.0%) | 51 (100.0%) |
| 16 and 17 Years | 0 (0.0%) | 0 (0.0%) |
| 18 to 24 Years | 0 (0.0%) | 18 (12.4%) |
| 25 to 34 Years | 24 (13.6%) | 22 (31.0%) |
| 35 to 44 Years | 0 (0.0%) | 55 (42.0%) |
| 45 to 54 Years | 0 (0.0%) | 7 (6.7%) |
| 55 to 64 Years | 28 (26.2%) | 0 (0.0%) |
| 65 to 74 Years | 0 (0.0%) | 7 (35.0%) |
| 75 Years and over | 8 (34.8%) | 12 (36.4%) |
| Total | 180 (18.6%) | 288 (31.9%) |
Income Above Poverty by Sex and Age in West Pasco
According to the poverty statistics in West Pasco, males aged 5 years and females aged 6 to 11 years are the age groups that are most secure financially, with 100.0% of males and 100.0% of females in these age groups living above the poverty line.
| Age Bracket | Male | Female |
| Under 5 Years | 12 (50.0%) | 48 (29.3%) |
| 5 Years | 12 (100.0%) | 0 (0.0%) |
| 6 to 11 Years | 20 (19.2%) | 27 (100.0%) |
| 12 to 14 Years | 10 (29.4%) | 37 (100.0%) |
| 15 Years | 27 (100.0%) | 0 (0.0%) |
| 16 and 17 Years | 51 (100.0%) | 9 (100.0%) |
| 18 to 24 Years | 105 (100.0%) | 127 (87.6%) |
| 25 to 34 Years | 153 (86.4%) | 49 (69.0%) |
| 35 to 44 Years | 76 (100.0%) | 76 (58.0%) |
| 45 to 54 Years | 130 (100.0%) | 98 (93.3%) |
| 55 to 64 Years | 79 (73.8%) | 110 (100.0%) |
| 65 to 74 Years | 97 (100.0%) | 13 (65.0%) |
| 75 Years and over | 15 (65.2%) | 21 (63.6%) |
| Total | 787 (81.4%) | 615 (68.1%) |
Income Below Poverty Among Married-Couple Families in West Pasco
The poverty statistics for married-couple families in West Pasco show that 7.5% or 25 of the total 331 families live below the poverty line. Families with 1 or 2 children have the highest poverty rate of 11.2%, comprising of 19 families. On the other hand, families with 5 or more children have the lowest poverty rate of 0.0%, which includes 0 families.
| Children | Above Poverty | Below Poverty |
| No Children | 146 (96.1%) | 6 (4.0%) |
| 1 or 2 Children | 151 (88.8%) | 19 (11.2%) |
| 3 or 4 Children | 0 (0.0%) | 0 (0.0%) |
| 5 or more Children | 9 (100.0%) | 0 (0.0%) |
| Total | 306 (92.4%) | 25 (7.5%) |
Income Below Poverty Among Single-Parent Households in West Pasco
According to the poverty data in West Pasco, 100.0% or 9 single-father households and 100.0% or 55 single-mother households are living below the poverty line. Among single-father households, those with 1 or 2 children have the highest poverty rate, with 9 households (100.0%) experiencing poverty. Likewise, among single-mother households, those with 3 or 4 children have the highest poverty rate, with 55 households (100.0%) falling below the poverty line.
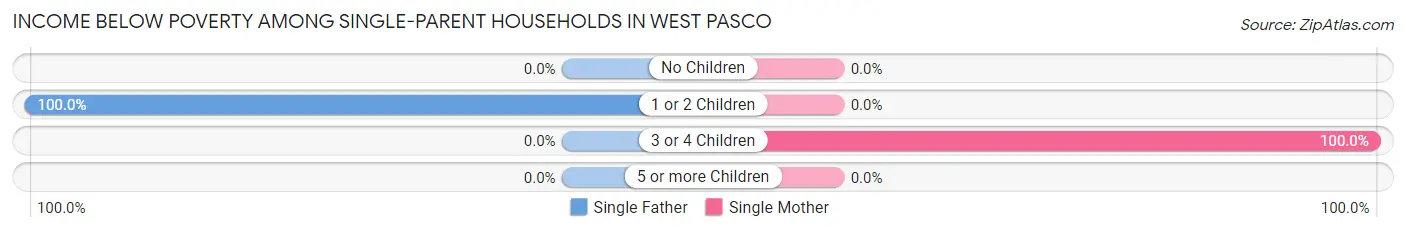
| Children | Single Father | Single Mother |
| No Children | 0 (0.0%) | 0 (0.0%) |
| 1 or 2 Children | 9 (100.0%) | 0 (0.0%) |
| 3 or 4 Children | 0 (0.0%) | 55 (100.0%) |
| 5 or more Children | 0 (0.0%) | 0 (0.0%) |
| Total | 9 (100.0%) | 55 (100.0%) |
Income Below Poverty Among Married-Couple vs Single-Parent Households in West Pasco
The poverty data for West Pasco shows that 25 of the married-couple family households (7.5%) and 64 of the single-parent households (100.0%) are living below the poverty level. Within the married-couple family households, those with 1 or 2 children have the highest poverty rate, with 19 households (11.2%) falling below the poverty line. Among the single-parent households, those with 1 or 2 children have the highest poverty rate, with 9 household (100.0%) living below poverty.
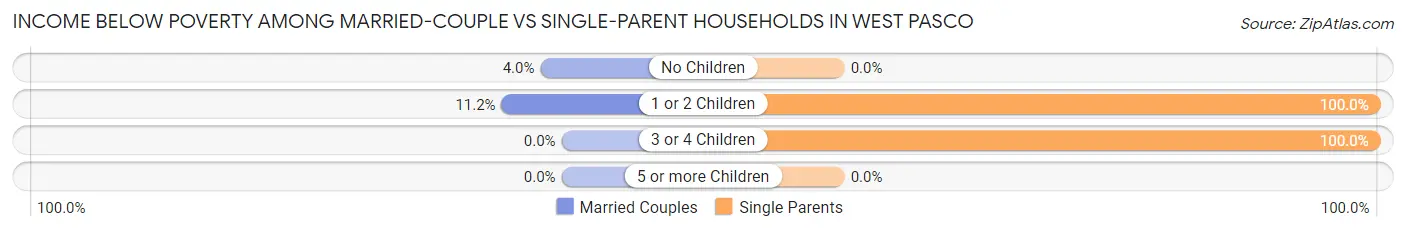
| Children | Married-Couple Families | Single-Parent Households |
| No Children | 6 (4.0%) | 0 (0.0%) |
| 1 or 2 Children | 19 (11.2%) | 9 (100.0%) |
| 3 or 4 Children | 0 (0.0%) | 55 (100.0%) |
| 5 or more Children | 0 (0.0%) | 0 (0.0%) |
| Total | 25 (7.5%) | 64 (100.0%) |
Race in West Pasco
The most populous races in West Pasco are White / Caucasian (1,583 | 84.7%), Hispanic or Latino (610 | 32.6%), and Two or more Races (164 | 8.8%).
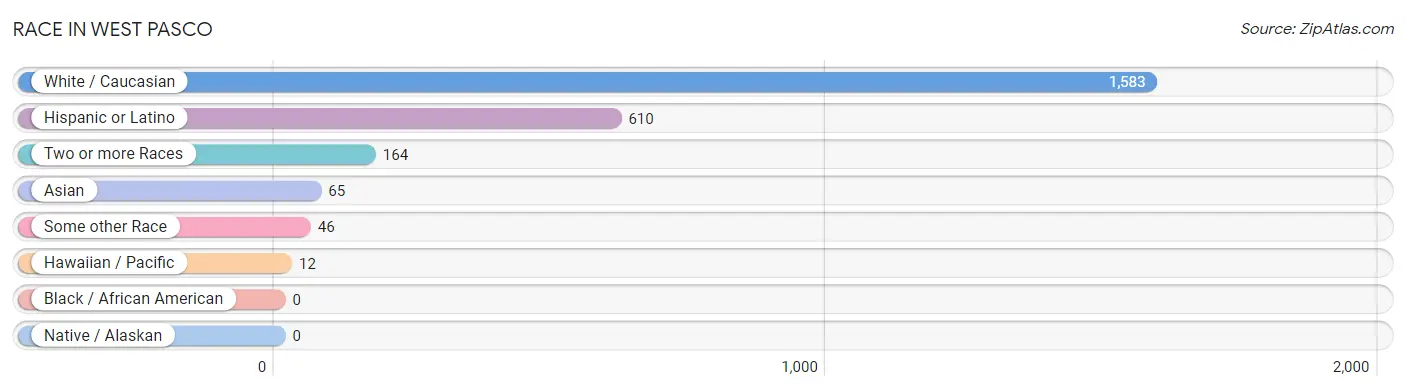
| Race | # Population | % Population |
| Asian | 65 | 3.5% |
| Black / African American | 0 | 0.0% |
| Hawaiian / Pacific | 12 | 0.6% |
| Hispanic or Latino | 610 | 32.6% |
| Native / Alaskan | 0 | 0.0% |
| White / Caucasian | 1,583 | 84.7% |
| Two or more Races | 164 | 8.8% |
| Some other Race | 46 | 2.5% |
| Total | 1,870 | 100.0% |
Ancestry in West Pasco
The most populous ancestries reported in West Pasco are Mexican (567 | 30.3%), German (271 | 14.5%), English (203 | 10.9%), Irish (172 | 9.2%), and American (59 | 3.2%), together accounting for 68.0% of all West Pasco residents.
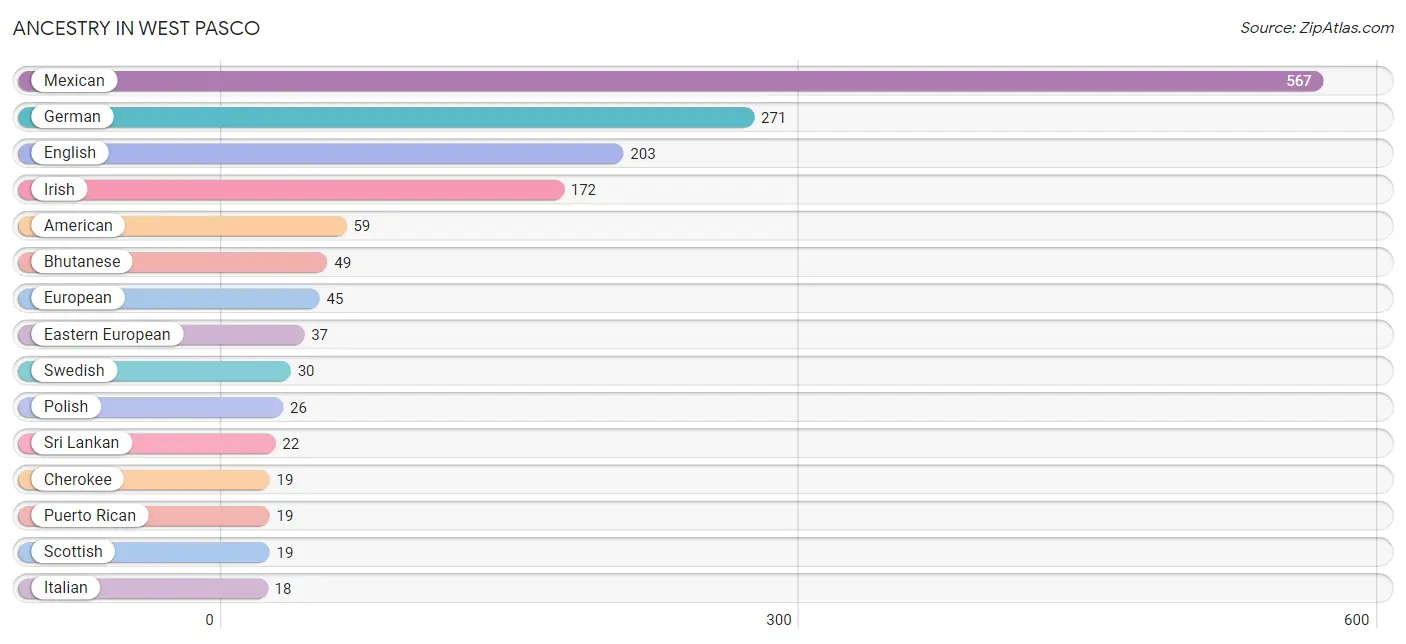
| Ancestry | # Population | % Population |
| American | 59 | 3.2% |
| Bhutanese | 49 | 2.6% |
| Burmese | 9 | 0.5% |
| Cherokee | 19 | 1.0% |
| Danish | 15 | 0.8% |
| Eastern European | 37 | 2.0% |
| English | 203 | 10.9% |
| European | 45 | 2.4% |
| German | 271 | 14.5% |
| Greek | 7 | 0.4% |
| Guamanian / Chamorro | 12 | 0.6% |
| Hungarian | 17 | 0.9% |
| Irish | 172 | 9.2% |
| Italian | 18 | 1.0% |
| Korean | 3 | 0.2% |
| Mexican | 567 | 30.3% |
| Norwegian | 18 | 1.0% |
| Polish | 26 | 1.4% |
| Puerto Rican | 19 | 1.0% |
| Scotch-Irish | 14 | 0.7% |
| Scottish | 19 | 1.0% |
| Sri Lankan | 22 | 1.2% |
| Swedish | 30 | 1.6% | View All 23 Rows |
Immigrants in West Pasco
The most numerous immigrant groups reported in West Pasco came from Central America (55 | 2.9%), Latin America (55 | 2.9%), Mexico (55 | 2.9%), England (9 | 0.5%), and Europe (9 | 0.5%), together accounting for 9.8% of all West Pasco residents.
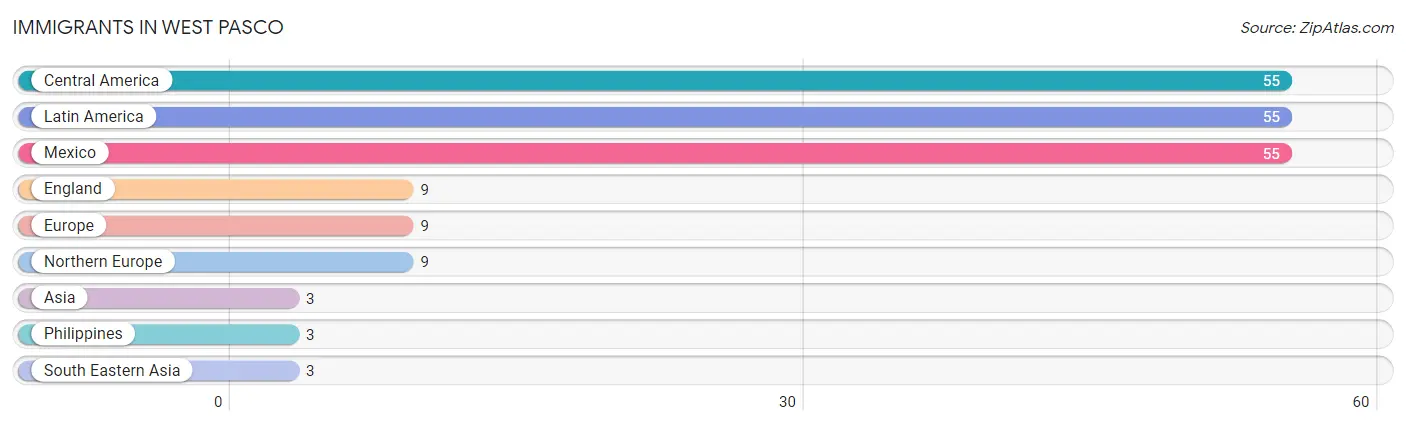
| Immigration Origin | # Population | % Population |
| Asia | 3 | 0.2% |
| Central America | 55 | 2.9% |
| England | 9 | 0.5% |
| Europe | 9 | 0.5% |
| Latin America | 55 | 2.9% |
| Mexico | 55 | 2.9% |
| Northern Europe | 9 | 0.5% |
| Philippines | 3 | 0.2% |
| South Eastern Asia | 3 | 0.2% | View All 9 Rows |
Sex and Age in West Pasco
Sex and Age in West Pasco
The most populous age groups in West Pasco are 25 to 29 Years (133 | 13.8%) for men and Under 5 Years (164 | 18.2%) for women.
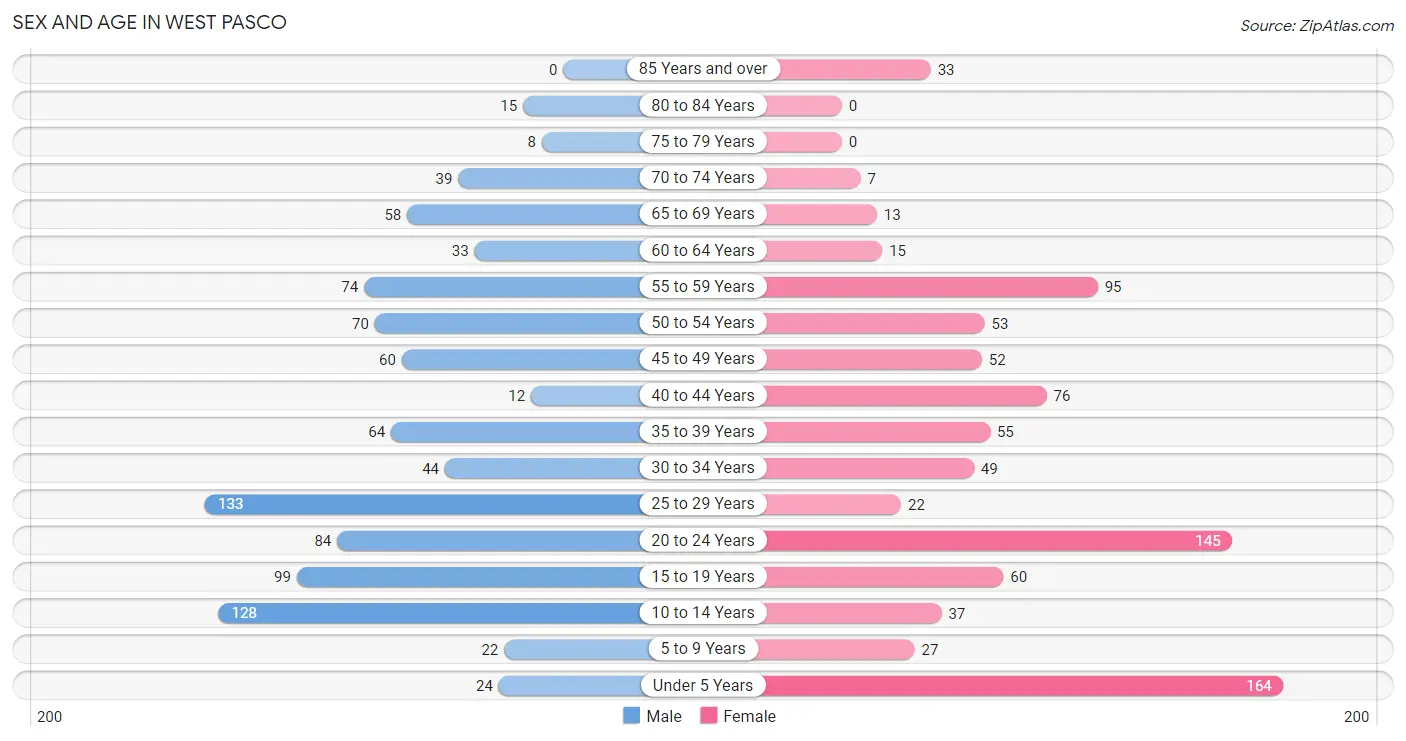
| Age Bracket | Male | Female |
| Under 5 Years | 24 (2.5%) | 164 (18.2%) |
| 5 to 9 Years | 22 (2.3%) | 27 (3.0%) |
| 10 to 14 Years | 128 (13.2%) | 37 (4.1%) |
| 15 to 19 Years | 99 (10.2%) | 60 (6.6%) |
| 20 to 24 Years | 84 (8.7%) | 145 (16.1%) |
| 25 to 29 Years | 133 (13.8%) | 22 (2.4%) |
| 30 to 34 Years | 44 (4.5%) | 49 (5.4%) |
| 35 to 39 Years | 64 (6.6%) | 55 (6.1%) |
| 40 to 44 Years | 12 (1.2%) | 76 (8.4%) |
| 45 to 49 Years | 60 (6.2%) | 52 (5.8%) |
| 50 to 54 Years | 70 (7.2%) | 53 (5.9%) |
| 55 to 59 Years | 74 (7.6%) | 95 (10.5%) |
| 60 to 64 Years | 33 (3.4%) | 15 (1.7%) |
| 65 to 69 Years | 58 (6.0%) | 13 (1.4%) |
| 70 to 74 Years | 39 (4.0%) | 7 (0.8%) |
| 75 to 79 Years | 8 (0.8%) | 0 (0.0%) |
| 80 to 84 Years | 15 (1.5%) | 0 (0.0%) |
| 85 Years and over | 0 (0.0%) | 33 (3.6%) |
| Total | 967 (100.0%) | 903 (100.0%) |
Families and Households in West Pasco
Median Family Size in West Pasco
The median family size in West Pasco is 3.99 persons per family, with single male/father families (9 | 2.3%) accounting for the largest median family size of 7.33 persons per family. On the other hand, married-couple families (331 | 83.8%) represent the smallest median family size with 3.73 persons per family.
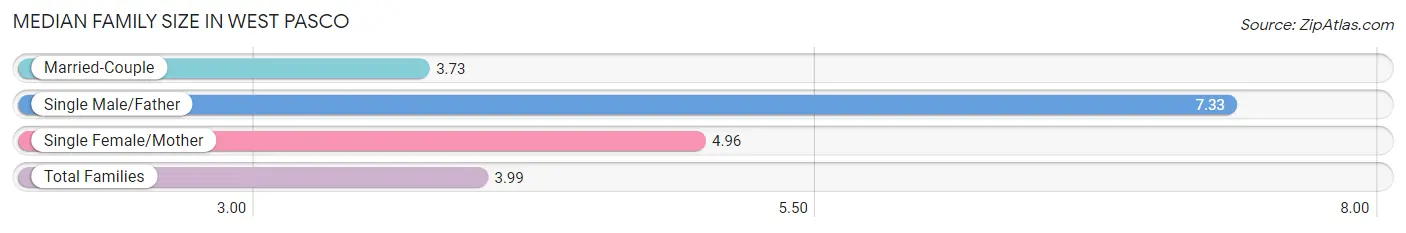
| Family Type | # Families | Family Size |
| Married-Couple | 331 (83.8%) | 3.73 |
| Single Male/Father | 9 (2.3%) | 7.33 |
| Single Female/Mother | 55 (13.9%) | 4.96 |
| Total Families | 395 (100.0%) | 3.99 |
Median Household Size in West Pasco
The median household size in West Pasco is 3.49 persons per household, with single male/father households (9 | 1.7%) accounting for the largest median household size of 10.56 persons per household. non-family households (139 | 26.0%) represent the smallest median household size with 1.22 persons per household.
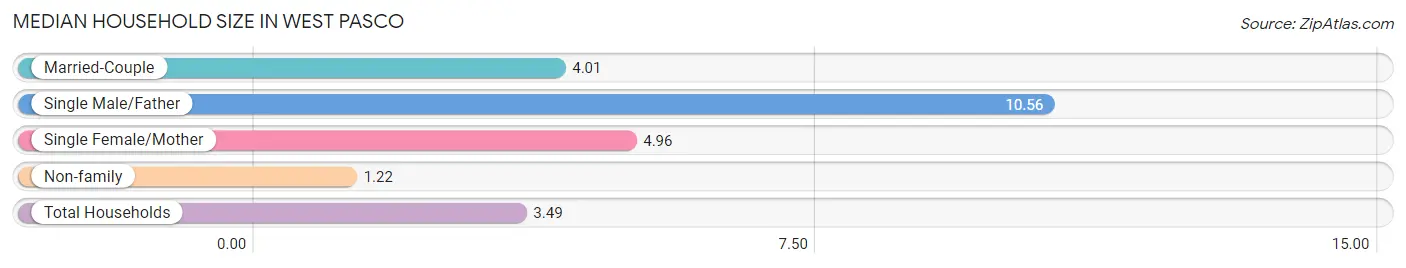
| Household Type | # Households | Household Size |
| Married-Couple | 331 (62.0%) | 4.01 |
| Single Male/Father | 9 (1.7%) | 10.56 |
| Single Female/Mother | 55 (10.3%) | 4.96 |
| Non-family | 139 (26.0%) | 1.22 |
| Total Households | 534 (100.0%) | 3.49 |
Household Size by Marriage Status in West Pasco
Out of a total of 534 households in West Pasco, 395 (74.0%) are family households, while 139 (26.0%) are nonfamily households. The most numerous type of family households are 3-person households, comprising 143, and the most common type of nonfamily households are 1-person households, comprising 110.
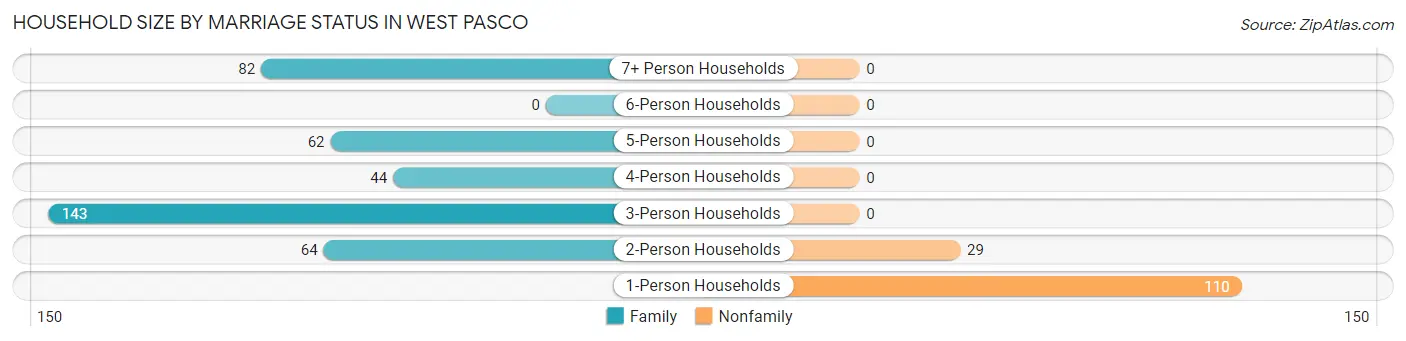
| Household Size | Family Households | Nonfamily Households |
| 1-Person Households | - | 110 (20.6%) |
| 2-Person Households | 64 (12.0%) | 29 (5.4%) |
| 3-Person Households | 143 (26.8%) | 0 (0.0%) |
| 4-Person Households | 44 (8.2%) | 0 (0.0%) |
| 5-Person Households | 62 (11.6%) | 0 (0.0%) |
| 6-Person Households | 0 (0.0%) | 0 (0.0%) |
| 7+ Person Households | 82 (15.4%) | 0 (0.0%) |
| Total | 395 (74.0%) | 139 (26.0%) |
Female Fertility in West Pasco
Fertility by Age in West Pasco
| Age Bracket | Women with Births | Births / 1,000 Women |
| 15 to 19 years | 0 (0.0%) | 0.0 |
| 20 to 34 years | 0 (0.0%) | 0.0 |
| 35 to 50 years | 0 (0.0%) | 0.0 |
| Total | 0 (0.0%) | 0.0 |
Fertility by Age by Marriage Status in West Pasco
| Age Bracket | Married | Unmarried |
| 15 to 19 years | 0 (0.0%) | 0 (0.0%) |
| 20 to 34 years | 0 (0.0%) | 0 (0.0%) |
| 35 to 50 years | 0 (0.0%) | 0 (0.0%) |
| Total | 0 (0.0%) | 0 (0.0%) |
Fertility by Education in West Pasco
| Educational Attainment | Women with Births | Births / 1,000 Women |
| Less than High School | 0 (0.0%) | 0.0 |
| High School Diploma | 0 (0.0%) | 0.0 |
| College or Associate's Degree | 0 (0.0%) | 0.0 |
| Bachelor's Degree | 0 (0.0%) | 0.0 |
| Graduate Degree | 0 (0.0%) | 0.0 |
| Total | 0 (0.0%) | 0.0 |
Fertility by Education by Marriage Status in West Pasco
| Educational Attainment | Married | Unmarried |
| Less than High School | 0 (0.0%) | 0 (0.0%) |
| High School Diploma | 0 (0.0%) | 0 (0.0%) |
| College or Associate's Degree | 0 (0.0%) | 0 (0.0%) |
| Bachelor's Degree | 0 (0.0%) | 0 (0.0%) |
| Graduate Degree | 0 (0.0%) | 0 (0.0%) |
| Total | 0 (0.0%) | 0 (0.0%) |
Employment Characteristics in West Pasco
Employment by Class of Employer in West Pasco
Among the 840 employed individuals in West Pasco, private company employees (567 | 67.5%), local government employees (102 | 12.1%), and not-for-profit organizations (73 | 8.7%) make up the most common classes of employment.
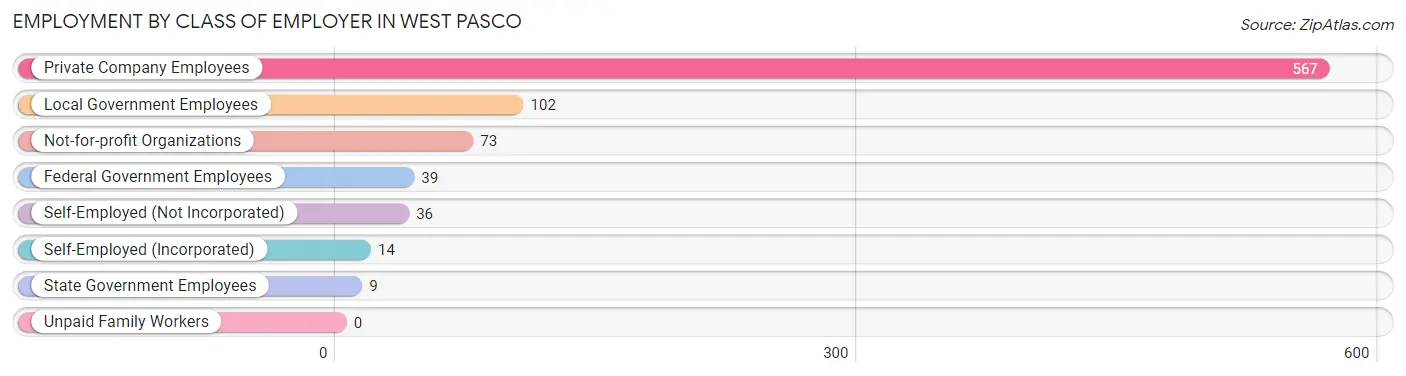
| Employer Class | # Employees | % Employees |
| Private Company Employees | 567 | 67.5% |
| Self-Employed (Incorporated) | 14 | 1.7% |
| Self-Employed (Not Incorporated) | 36 | 4.3% |
| Not-for-profit Organizations | 73 | 8.7% |
| Local Government Employees | 102 | 12.1% |
| State Government Employees | 9 | 1.1% |
| Federal Government Employees | 39 | 4.6% |
| Unpaid Family Workers | 0 | 0.0% |
| Total | 840 | 100.0% |
Employment Status by Age in West Pasco
According to the labor force statistics for West Pasco, out of the total population over 16 years of age (1,390), 74.0% or 1,029 individuals are in the labor force, with 8.2% or 84 of them unemployed. The age group with the highest labor force participation rate is 20 to 24 years, with 100.0% or 229 individuals in the labor force. Within the labor force, the 16 to 19 years age range has the highest percentage of unemployed individuals, with 71.4% or 15 of them being unemployed.
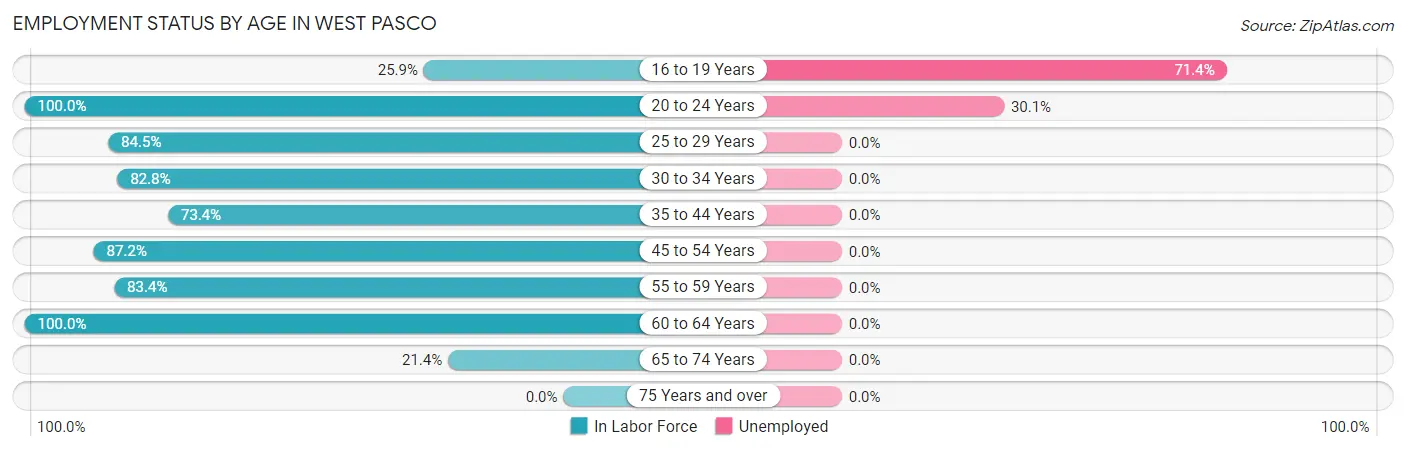
| Age Bracket | In Labor Force | Unemployed |
| 16 to 19 Years | 21 (25.9%) | 15 (71.4%) |
| 20 to 24 Years | 229 (100.0%) | 69 (30.1%) |
| 25 to 29 Years | 131 (84.5%) | 0 (0.0%) |
| 30 to 34 Years | 77 (82.8%) | 0 (0.0%) |
| 35 to 44 Years | 152 (73.4%) | 0 (0.0%) |
| 45 to 54 Years | 205 (87.2%) | 0 (0.0%) |
| 55 to 59 Years | 141 (83.4%) | 0 (0.0%) |
| 60 to 64 Years | 48 (100.0%) | 0 (0.0%) |
| 65 to 74 Years | 25 (21.4%) | 0 (0.0%) |
| 75 Years and over | 0 (0.0%) | 0 (0.0%) |
| Total | 1,029 (74.0%) | 84 (8.2%) |
Employment Status by Educational Attainment in West Pasco
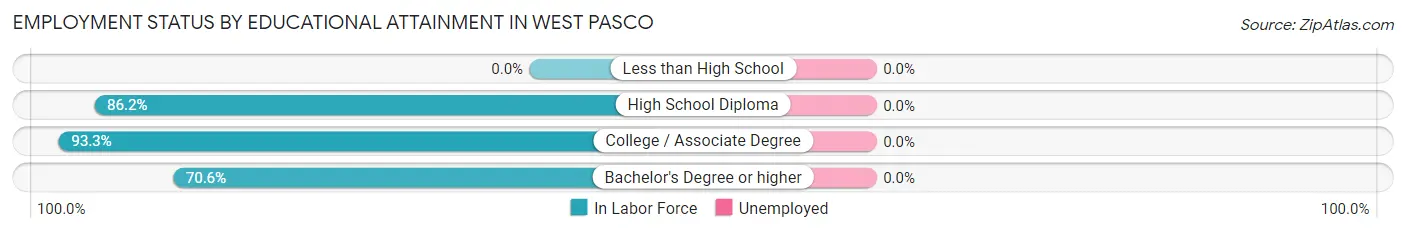
| Educational Attainment | In Labor Force | Unemployed |
| Less than High School | 0 (0.0%) | 0 (0.0%) |
| High School Diploma | 144 (86.2%) | 0 (0.0%) |
| College / Associate Degree | 387 (93.3%) | 0 (0.0%) |
| Bachelor's Degree or higher | 223 (70.6%) | 0 (0.0%) |
| Total | 754 (83.1%) | 0 (0.0%) |
Employment Occupations by Sex in West Pasco
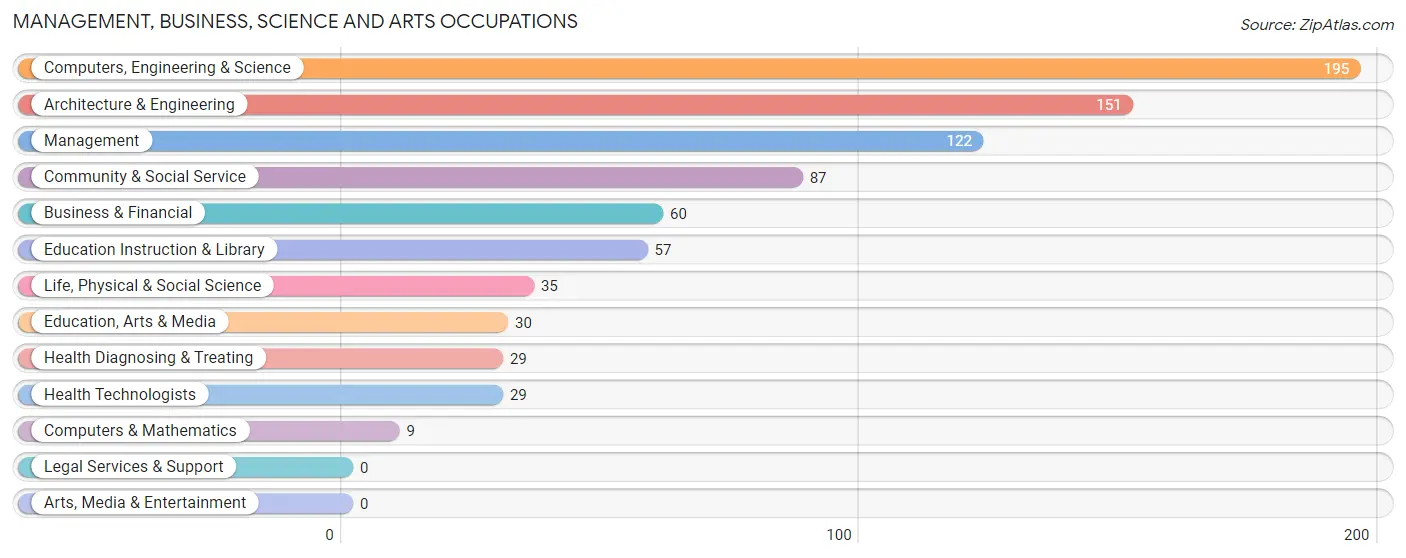
Management, Business, Science and Arts Occupations
The most common Management, Business, Science and Arts occupations in West Pasco are Computers, Engineering & Science (195 | 20.6%), Architecture & Engineering (151 | 16.0%), Management (122 | 12.9%), Community & Social Service (87 | 9.2%), and Business & Financial (60 | 6.4%).
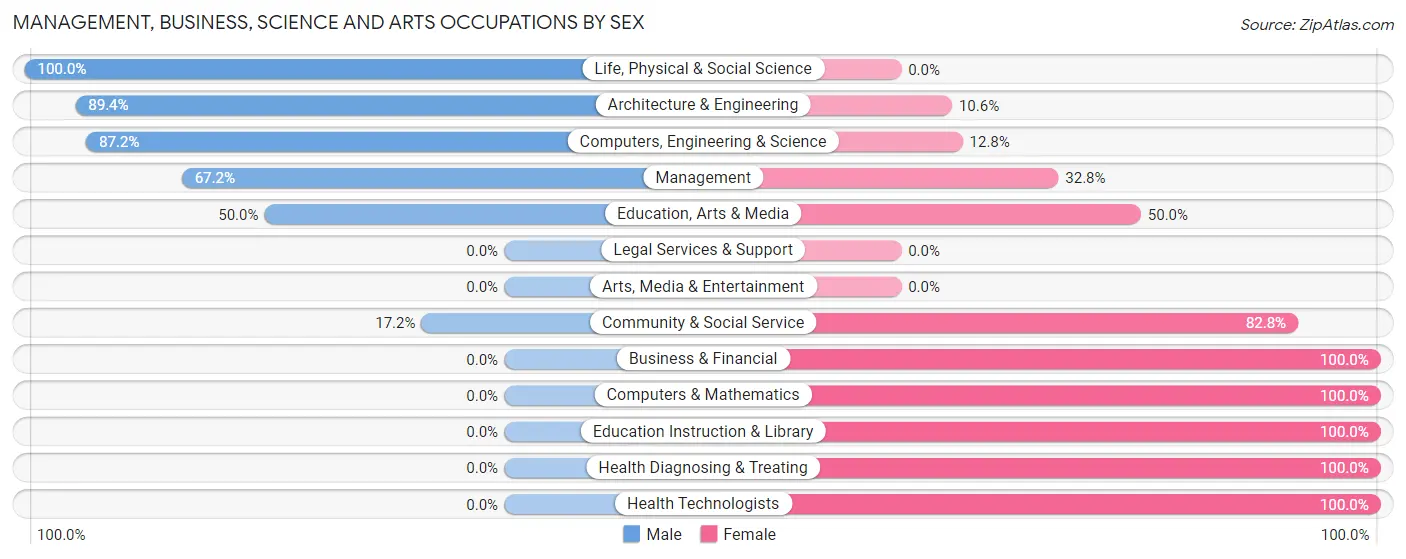
Management, Business, Science and Arts Occupations by Sex
Within the Management, Business, Science and Arts occupations in West Pasco, the most male-oriented occupations are Life, Physical & Social Science (100.0%), Architecture & Engineering (89.4%), and Computers, Engineering & Science (87.2%), while the most female-oriented occupations are Business & Financial (100.0%), Computers & Mathematics (100.0%), and Education Instruction & Library (100.0%).
| Occupation | Male | Female |
| Management | 82 (67.2%) | 40 (32.8%) |
| Business & Financial | 0 (0.0%) | 60 (100.0%) |
| Computers, Engineering & Science | 170 (87.2%) | 25 (12.8%) |
| Computers & Mathematics | 0 (0.0%) | 9 (100.0%) |
| Architecture & Engineering | 135 (89.4%) | 16 (10.6%) |
| Life, Physical & Social Science | 35 (100.0%) | 0 (0.0%) |
| Community & Social Service | 15 (17.2%) | 72 (82.8%) |
| Education, Arts & Media | 15 (50.0%) | 15 (50.0%) |
| Legal Services & Support | 0 (0.0%) | 0 (0.0%) |
| Education Instruction & Library | 0 (0.0%) | 57 (100.0%) |
| Arts, Media & Entertainment | 0 (0.0%) | 0 (0.0%) |
| Health Diagnosing & Treating | 0 (0.0%) | 29 (100.0%) |
| Health Technologists | 0 (0.0%) | 29 (100.0%) |
| Total (Category) | 267 (54.2%) | 226 (45.8%) |
| Total (Overall) | 553 (58.5%) | 392 (41.5%) |
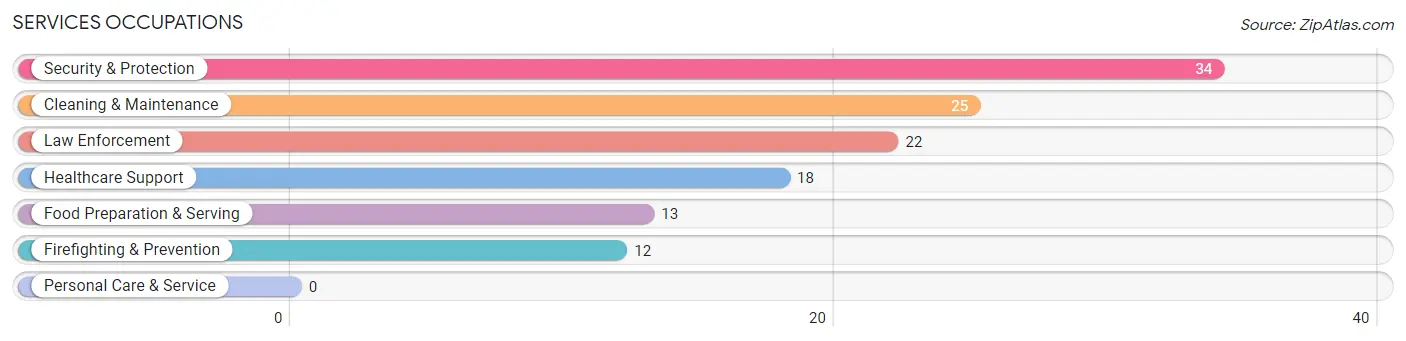
Services Occupations
The most common Services occupations in West Pasco are Security & Protection (34 | 3.6%), Cleaning & Maintenance (25 | 2.6%), Law Enforcement (22 | 2.3%), Healthcare Support (18 | 1.9%), and Food Preparation & Serving (13 | 1.4%).
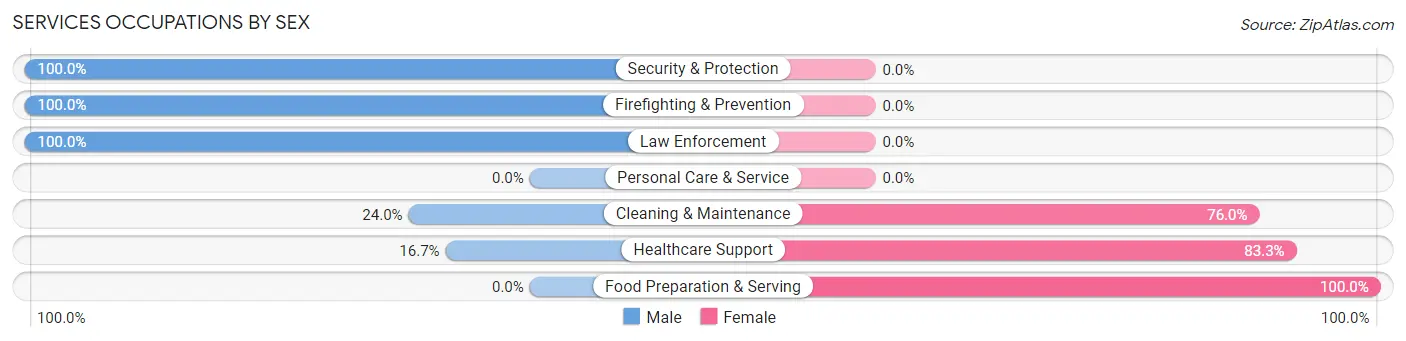
Services Occupations by Sex
Within the Services occupations in West Pasco, the most male-oriented occupations are Security & Protection (100.0%), Firefighting & Prevention (100.0%), and Law Enforcement (100.0%), while the most female-oriented occupations are Food Preparation & Serving (100.0%), Healthcare Support (83.3%), and Cleaning & Maintenance (76.0%).
| Occupation | Male | Female |
| Healthcare Support | 3 (16.7%) | 15 (83.3%) |
| Security & Protection | 34 (100.0%) | 0 (0.0%) |
| Firefighting & Prevention | 12 (100.0%) | 0 (0.0%) |
| Law Enforcement | 22 (100.0%) | 0 (0.0%) |
| Food Preparation & Serving | 0 (0.0%) | 13 (100.0%) |
| Cleaning & Maintenance | 6 (24.0%) | 19 (76.0%) |
| Personal Care & Service | 0 (0.0%) | 0 (0.0%) |
| Total (Category) | 43 (47.8%) | 47 (52.2%) |
| Total (Overall) | 553 (58.5%) | 392 (41.5%) |
Sales and Office Occupations
The most common Sales and Office occupations in West Pasco are Office & Administration (216 | 22.9%), and Sales & Related (55 | 5.8%).
Sales and Office Occupations by Sex
| Occupation | Male | Female |
| Sales & Related | 11 (20.0%) | 44 (80.0%) |
| Office & Administration | 141 (65.3%) | 75 (34.7%) |
| Total (Category) | 152 (56.1%) | 119 (43.9%) |
| Total (Overall) | 553 (58.5%) | 392 (41.5%) |
Natural Resources, Construction and Maintenance Occupations
The most common Natural Resources, Construction and Maintenance occupations in West Pasco are Installation, Maintenance & Repair (42 | 4.4%), and Farming, Fishing & Forestry (12 | 1.3%).
Natural Resources, Construction and Maintenance Occupations by Sex

| Occupation | Male | Female |
| Farming, Fishing & Forestry | 12 (100.0%) | 0 (0.0%) |
| Construction & Extraction | 0 (0.0%) | 0 (0.0%) |
| Installation, Maintenance & Repair | 42 (100.0%) | 0 (0.0%) |
| Total (Category) | 54 (100.0%) | 0 (0.0%) |
| Total (Overall) | 553 (58.5%) | 392 (41.5%) |
Production, Transportation and Moving Occupations
The most common Production, Transportation and Moving occupations in West Pasco are Material Moving (19 | 2.0%), and Production (18 | 1.9%).
Production, Transportation and Moving Occupations by Sex
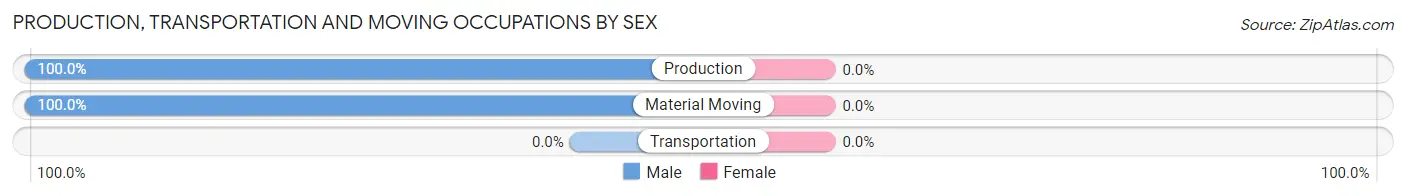
| Occupation | Male | Female |
| Production | 18 (100.0%) | 0 (0.0%) |
| Transportation | 0 (0.0%) | 0 (0.0%) |
| Material Moving | 19 (100.0%) | 0 (0.0%) |
| Total (Category) | 37 (100.0%) | 0 (0.0%) |
| Total (Overall) | 553 (58.5%) | 392 (41.5%) |
Employment Industries by Sex in West Pasco
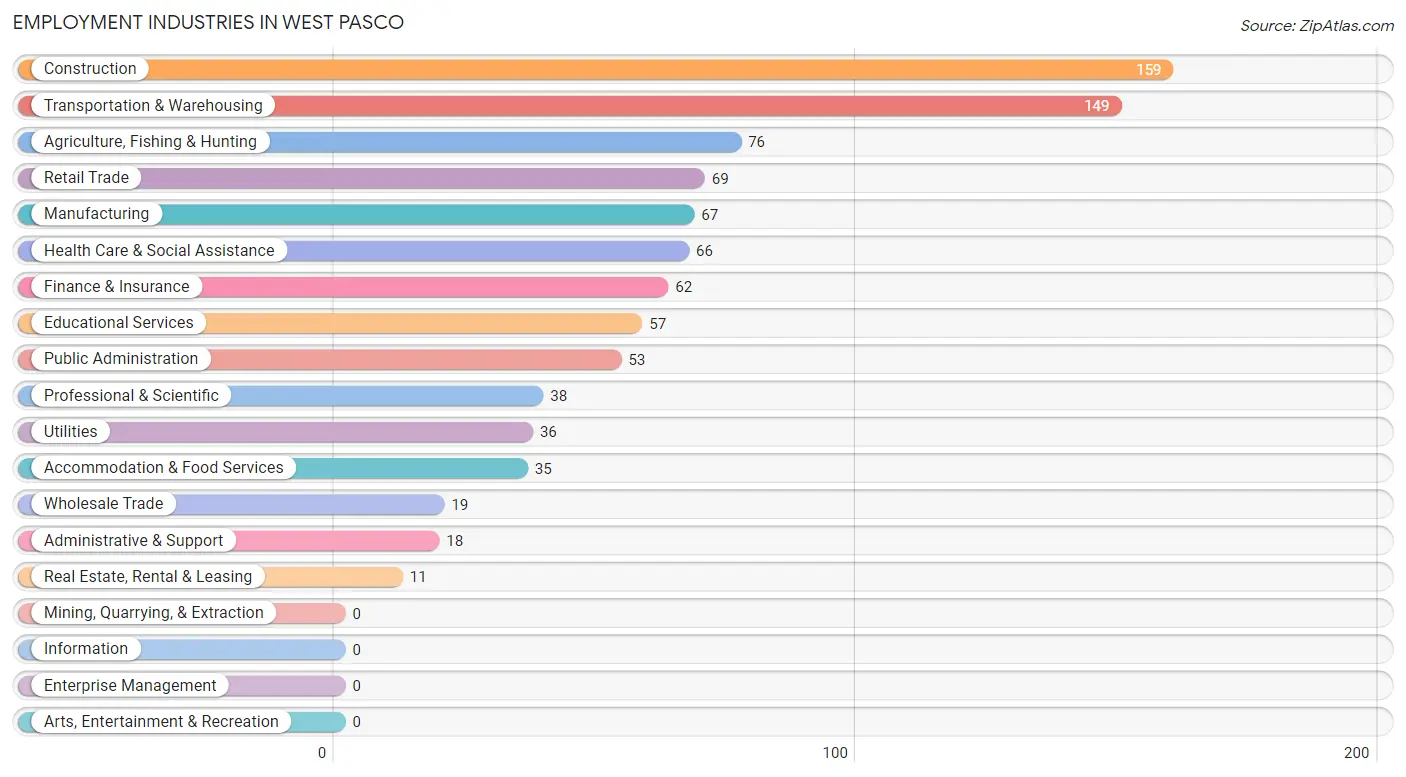
Employment Industries in West Pasco
The major employment industries in West Pasco include Construction (159 | 16.8%), Transportation & Warehousing (149 | 15.8%), Agriculture, Fishing & Hunting (76 | 8.0%), Retail Trade (69 | 7.3%), and Manufacturing (67 | 7.1%).
Employment Industries by Sex in West Pasco
The West Pasco industries that see more men than women are Manufacturing (100.0%), Wholesale Trade (100.0%), and Real Estate, Rental & Leasing (100.0%), whereas the industries that tend to have a higher number of women are Finance & Insurance (100.0%), Educational Services (100.0%), and Accommodation & Food Services (100.0%).
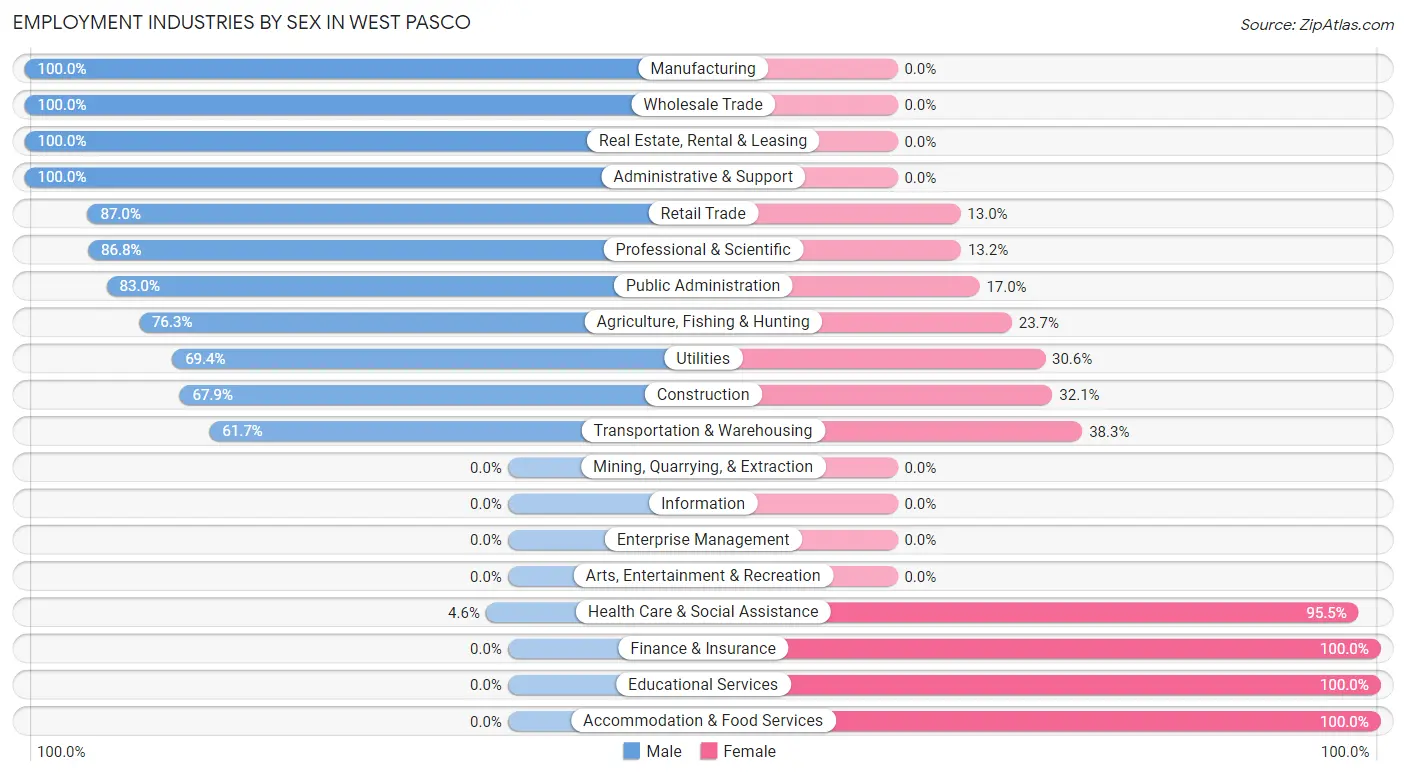
| Industry | Male | Female |
| Agriculture, Fishing & Hunting | 58 (76.3%) | 18 (23.7%) |
| Mining, Quarrying, & Extraction | 0 (0.0%) | 0 (0.0%) |
| Construction | 108 (67.9%) | 51 (32.1%) |
| Manufacturing | 67 (100.0%) | 0 (0.0%) |
| Wholesale Trade | 19 (100.0%) | 0 (0.0%) |
| Retail Trade | 60 (87.0%) | 9 (13.0%) |
| Transportation & Warehousing | 92 (61.7%) | 57 (38.3%) |
| Utilities | 25 (69.4%) | 11 (30.6%) |
| Information | 0 (0.0%) | 0 (0.0%) |
| Finance & Insurance | 0 (0.0%) | 62 (100.0%) |
| Real Estate, Rental & Leasing | 11 (100.0%) | 0 (0.0%) |
| Professional & Scientific | 33 (86.8%) | 5 (13.2%) |
| Enterprise Management | 0 (0.0%) | 0 (0.0%) |
| Administrative & Support | 18 (100.0%) | 0 (0.0%) |
| Educational Services | 0 (0.0%) | 57 (100.0%) |
| Health Care & Social Assistance | 3 (4.5%) | 63 (95.5%) |
| Arts, Entertainment & Recreation | 0 (0.0%) | 0 (0.0%) |
| Accommodation & Food Services | 0 (0.0%) | 35 (100.0%) |
| Public Administration | 44 (83.0%) | 9 (17.0%) |
| Total | 553 (58.5%) | 392 (41.5%) |
Education in West Pasco
School Enrollment in West Pasco
The most common levels of schooling among the 630 students in West Pasco are high school (180 | 28.6%), college / undergraduate (141 | 22.4%), and middle school (114 | 18.1%).
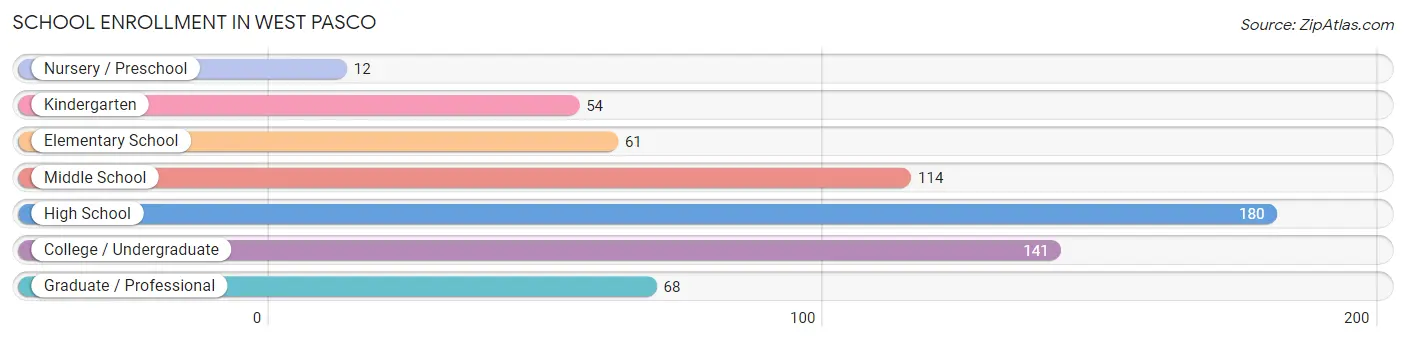
| School Level | # Students | % Students |
| Nursery / Preschool | 12 | 1.9% |
| Kindergarten | 54 | 8.6% |
| Elementary School | 61 | 9.7% |
| Middle School | 114 | 18.1% |
| High School | 180 | 28.6% |
| College / Undergraduate | 141 | 22.4% |
| Graduate / Professional | 68 | 10.8% |
| Total | 630 | 100.0% |
School Enrollment by Age by Funding Source in West Pasco
Out of a total of 630 students who are enrolled in schools in West Pasco, 66 (10.5%) attend a private institution, while the remaining 564 (89.5%) are enrolled in public schools. The age group of 35 years and over has the highest likelihood of being enrolled in private schools, with 44 (78.6% in the age bracket) enrolled. Conversely, the age group of 3 to 4 year olds has the lowest likelihood of being enrolled in a private school, with 54 (100.0% in the age bracket) attending a public institution.
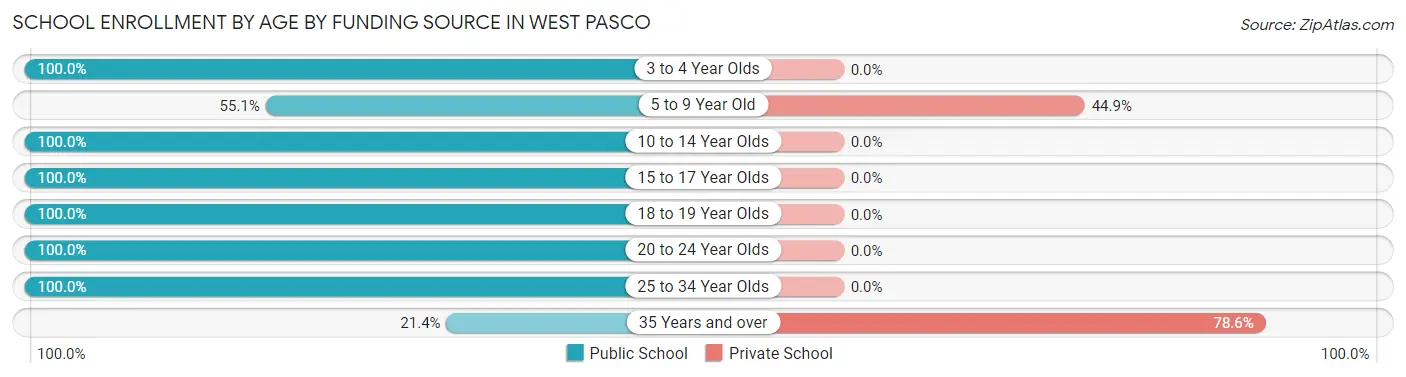
| Age Bracket | Public School | Private School |
| 3 to 4 Year Olds | 54 (100.0%) | 0 (0.0%) |
| 5 to 9 Year Old | 27 (55.1%) | 22 (44.9%) |
| 10 to 14 Year Olds | 165 (100.0%) | 0 (0.0%) |
| 15 to 17 Year Olds | 138 (100.0%) | 0 (0.0%) |
| 18 to 19 Year Olds | 15 (100.0%) | 0 (0.0%) |
| 20 to 24 Year Olds | 49 (100.0%) | 0 (0.0%) |
| 25 to 34 Year Olds | 104 (100.0%) | 0 (0.0%) |
| 35 Years and over | 12 (21.4%) | 44 (78.6%) |
| Total | 564 (89.5%) | 66 (10.5%) |
Educational Attainment by Field of Study in West Pasco
Education (133 | 32.3%), business (82 | 19.9%), engineering (45 | 10.9%), liberal arts & history (44 | 10.7%), and bio, nature & agricultural (19 | 4.6%) are the most common fields of study among 412 individuals in West Pasco who have obtained a bachelor's degree or higher.
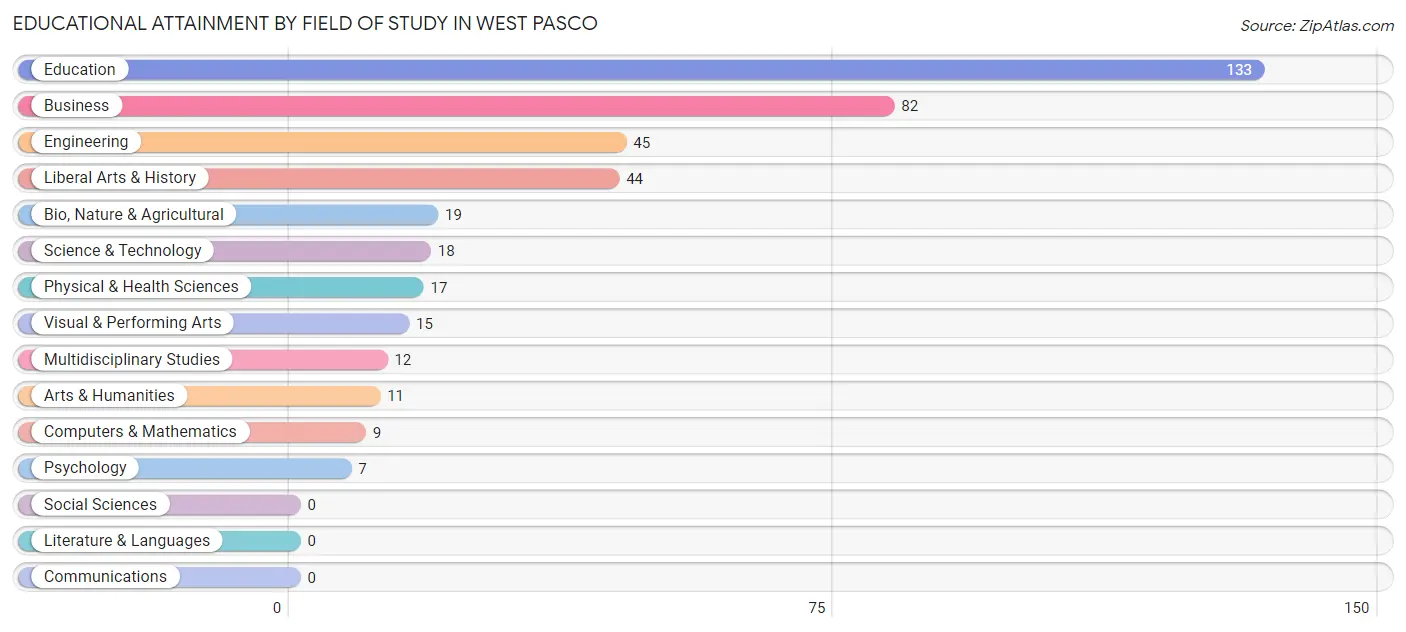
| Field of Study | # Graduates | % Graduates |
| Computers & Mathematics | 9 | 2.2% |
| Bio, Nature & Agricultural | 19 | 4.6% |
| Physical & Health Sciences | 17 | 4.1% |
| Psychology | 7 | 1.7% |
| Social Sciences | 0 | 0.0% |
| Engineering | 45 | 10.9% |
| Multidisciplinary Studies | 12 | 2.9% |
| Science & Technology | 18 | 4.4% |
| Business | 82 | 19.9% |
| Education | 133 | 32.3% |
| Literature & Languages | 0 | 0.0% |
| Liberal Arts & History | 44 | 10.7% |
| Visual & Performing Arts | 15 | 3.6% |
| Communications | 0 | 0.0% |
| Arts & Humanities | 11 | 2.7% |
| Total | 412 | 100.0% |
Transportation & Commute in West Pasco
Vehicle Availability by Sex in West Pasco
The most prevalent vehicle ownership categories in West Pasco are males with 5 or more vehicles (193, accounting for 42.1%) and females with 5 or more vehicles (152, making up 50.9%).
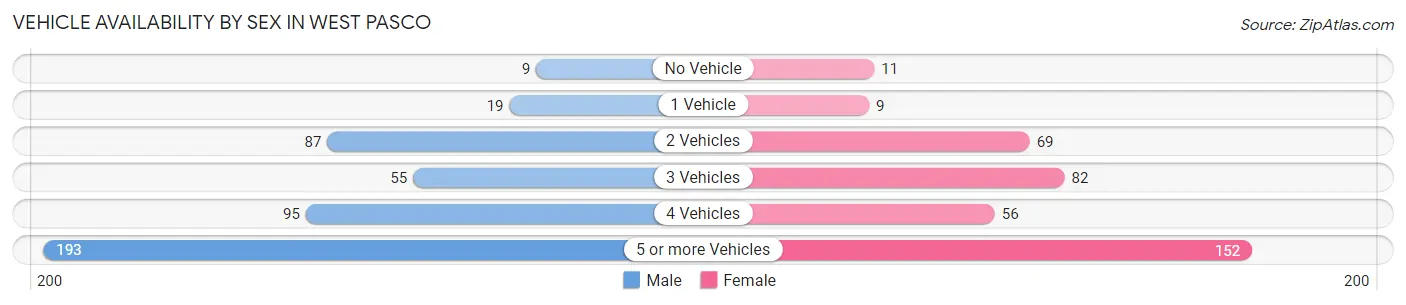
| Vehicles Available | Male | Female |
| No Vehicle | 9 (2.0%) | 11 (2.9%) |
| 1 Vehicle | 19 (4.2%) | 9 (2.4%) |
| 2 Vehicles | 87 (19.0%) | 69 (18.2%) |
| 3 Vehicles | 55 (12.0%) | 82 (21.6%) |
| 4 Vehicles | 95 (20.7%) | 56 (14.8%) |
| 5 or more Vehicles | 193 (42.1%) | 152 (40.1%) |
| Total | 458 (100.0%) | 379 (100.0%) |
Commute Time in West Pasco
The most frequently occuring commute durations in West Pasco are 15 to 19 minutes (250 commuters, 30.4%), 5 to 9 minutes (155 commuters, 18.8%), and 20 to 24 minutes (137 commuters, 16.7%).
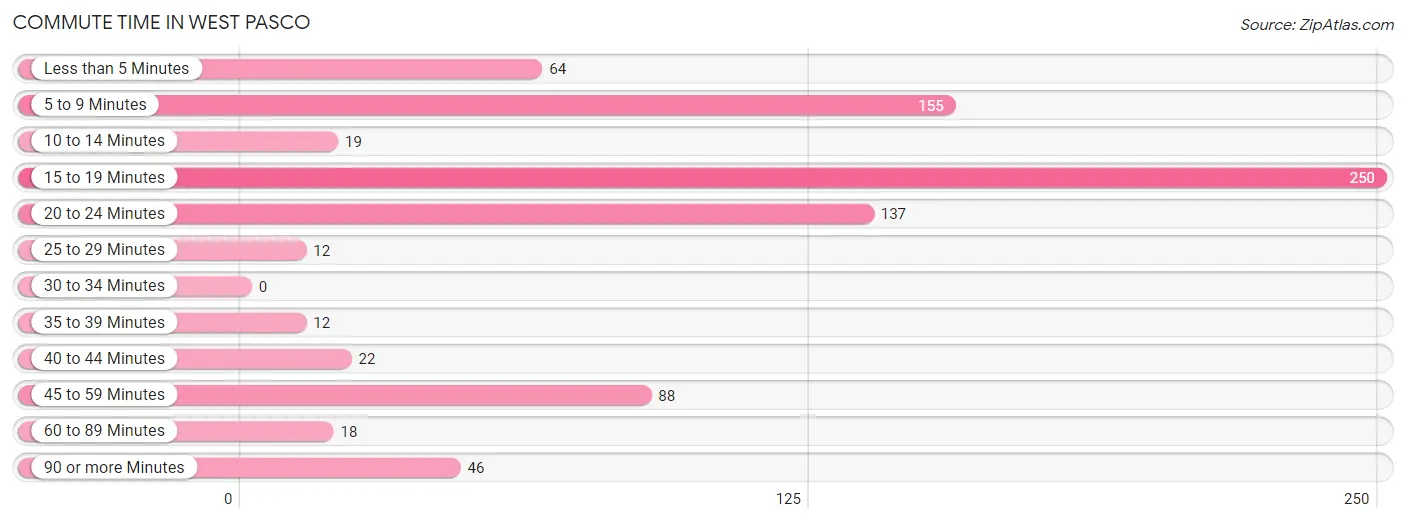
| Commute Time | # Commuters | % Commuters |
| Less than 5 Minutes | 64 | 7.8% |
| 5 to 9 Minutes | 155 | 18.8% |
| 10 to 14 Minutes | 19 | 2.3% |
| 15 to 19 Minutes | 250 | 30.4% |
| 20 to 24 Minutes | 137 | 16.7% |
| 25 to 29 Minutes | 12 | 1.5% |
| 30 to 34 Minutes | 0 | 0.0% |
| 35 to 39 Minutes | 12 | 1.5% |
| 40 to 44 Minutes | 22 | 2.7% |
| 45 to 59 Minutes | 88 | 10.7% |
| 60 to 89 Minutes | 18 | 2.2% |
| 90 or more Minutes | 46 | 5.6% |
Commute Time by Sex in West Pasco
The most common commute times in West Pasco are 15 to 19 minutes (111 commuters, 24.2%) for males and 15 to 19 minutes (139 commuters, 38.1%) for females.
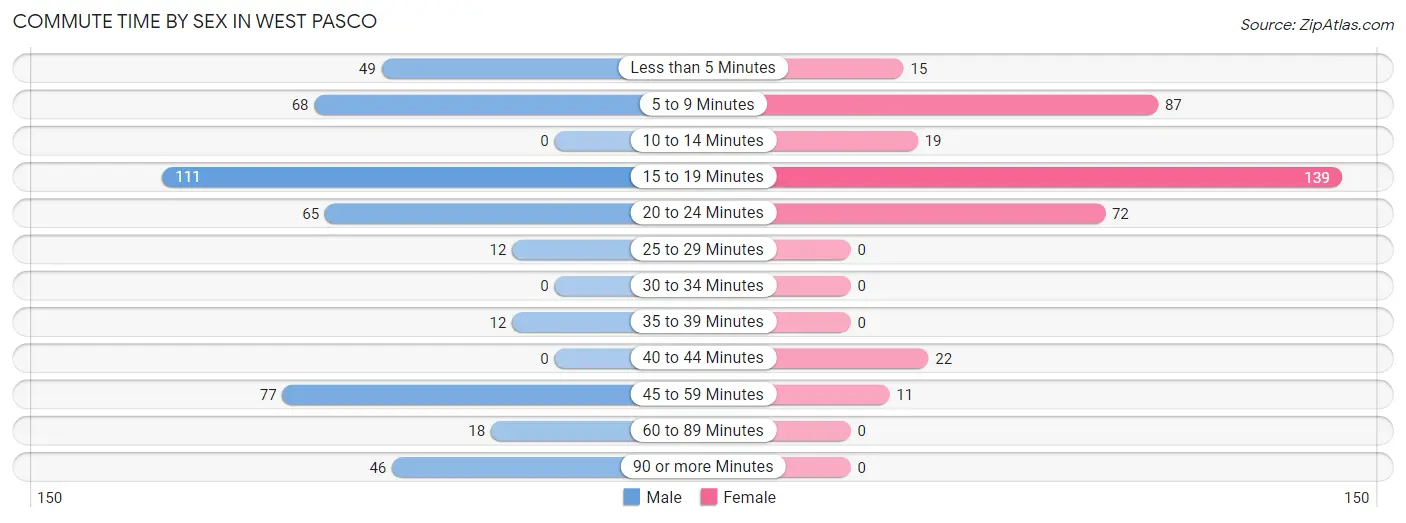
| Commute Time | Male | Female |
| Less than 5 Minutes | 49 (10.7%) | 15 (4.1%) |
| 5 to 9 Minutes | 68 (14.8%) | 87 (23.8%) |
| 10 to 14 Minutes | 0 (0.0%) | 19 (5.2%) |
| 15 to 19 Minutes | 111 (24.2%) | 139 (38.1%) |
| 20 to 24 Minutes | 65 (14.2%) | 72 (19.7%) |
| 25 to 29 Minutes | 12 (2.6%) | 0 (0.0%) |
| 30 to 34 Minutes | 0 (0.0%) | 0 (0.0%) |
| 35 to 39 Minutes | 12 (2.6%) | 0 (0.0%) |
| 40 to 44 Minutes | 0 (0.0%) | 22 (6.0%) |
| 45 to 59 Minutes | 77 (16.8%) | 11 (3.0%) |
| 60 to 89 Minutes | 18 (3.9%) | 0 (0.0%) |
| 90 or more Minutes | 46 (10.0%) | 0 (0.0%) |
Time of Departure to Work by Sex in West Pasco
The most frequent times of departure to work in West Pasco are 7:00 AM to 7:29 AM (129, 28.2%) for males and 8:00 AM to 8:29 AM (69, 18.9%) for females.
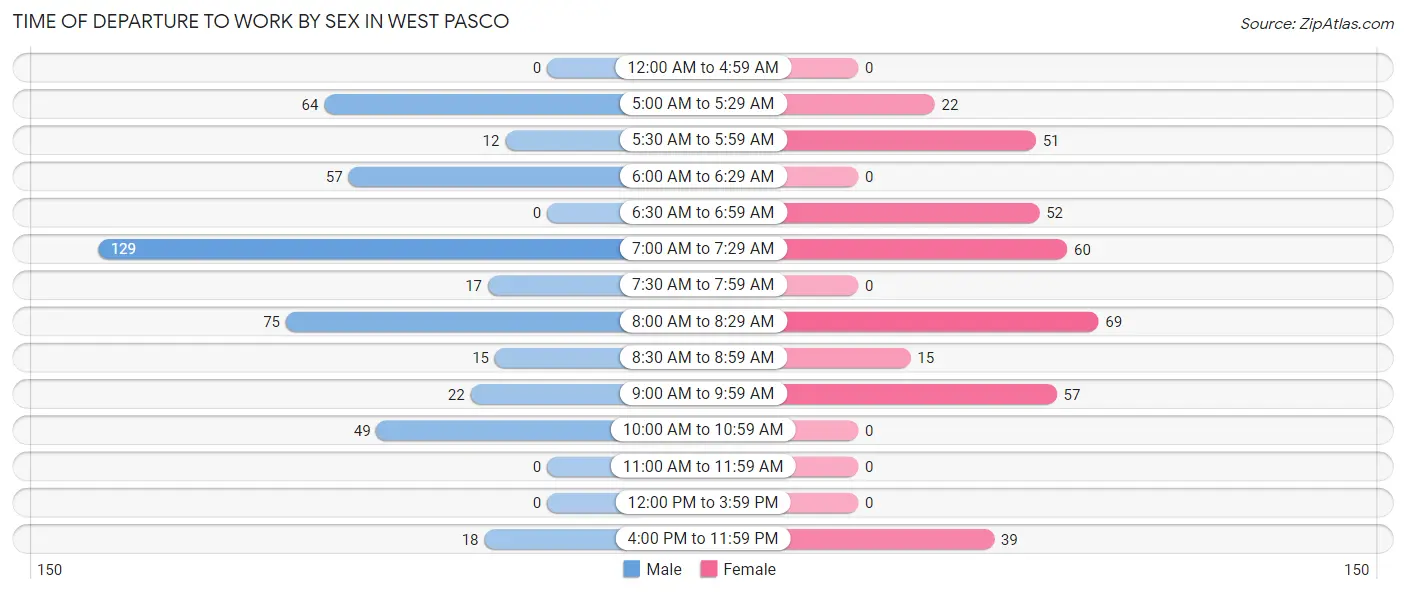
| Time of Departure | Male | Female |
| 12:00 AM to 4:59 AM | 0 (0.0%) | 0 (0.0%) |
| 5:00 AM to 5:29 AM | 64 (14.0%) | 22 (6.0%) |
| 5:30 AM to 5:59 AM | 12 (2.6%) | 51 (14.0%) |
| 6:00 AM to 6:29 AM | 57 (12.4%) | 0 (0.0%) |
| 6:30 AM to 6:59 AM | 0 (0.0%) | 52 (14.2%) |
| 7:00 AM to 7:29 AM | 129 (28.2%) | 60 (16.4%) |
| 7:30 AM to 7:59 AM | 17 (3.7%) | 0 (0.0%) |
| 8:00 AM to 8:29 AM | 75 (16.4%) | 69 (18.9%) |
| 8:30 AM to 8:59 AM | 15 (3.3%) | 15 (4.1%) |
| 9:00 AM to 9:59 AM | 22 (4.8%) | 57 (15.6%) |
| 10:00 AM to 10:59 AM | 49 (10.7%) | 0 (0.0%) |
| 11:00 AM to 11:59 AM | 0 (0.0%) | 0 (0.0%) |
| 12:00 PM to 3:59 PM | 0 (0.0%) | 0 (0.0%) |
| 4:00 PM to 11:59 PM | 18 (3.9%) | 39 (10.7%) |
| Total | 458 (100.0%) | 365 (100.0%) |
Housing Occupancy in West Pasco
Occupancy by Ownership in West Pasco
Of the total 534 dwellings in West Pasco, owner-occupied units account for 479 (89.7%), while renter-occupied units make up 55 (10.3%).
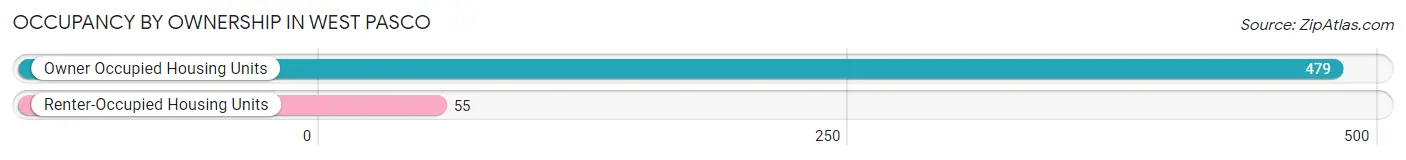
| Occupancy | # Housing Units | % Housing Units |
| Owner Occupied Housing Units | 479 | 89.7% |
| Renter-Occupied Housing Units | 55 | 10.3% |
| Total Occupied Housing Units | 534 | 100.0% |
Occupancy by Household Size in West Pasco
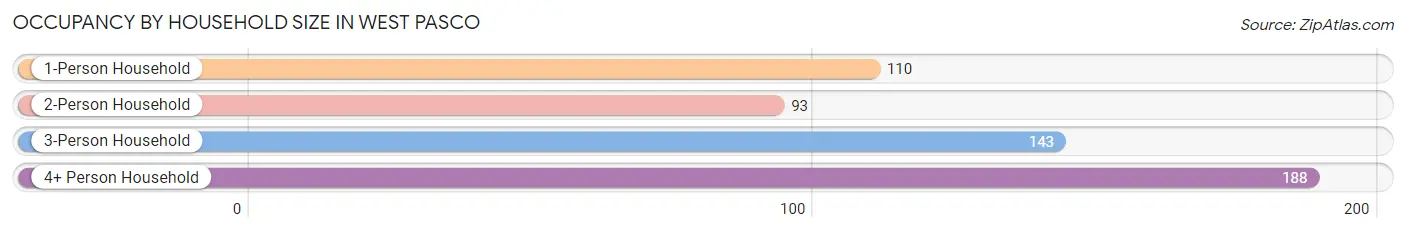
| Household Size | # Housing Units | % Housing Units |
| 1-Person Household | 110 | 20.6% |
| 2-Person Household | 93 | 17.4% |
| 3-Person Household | 143 | 26.8% |
| 4+ Person Household | 188 | 35.2% |
| Total Housing Units | 534 | 100.0% |
Occupancy by Ownership by Household Size in West Pasco
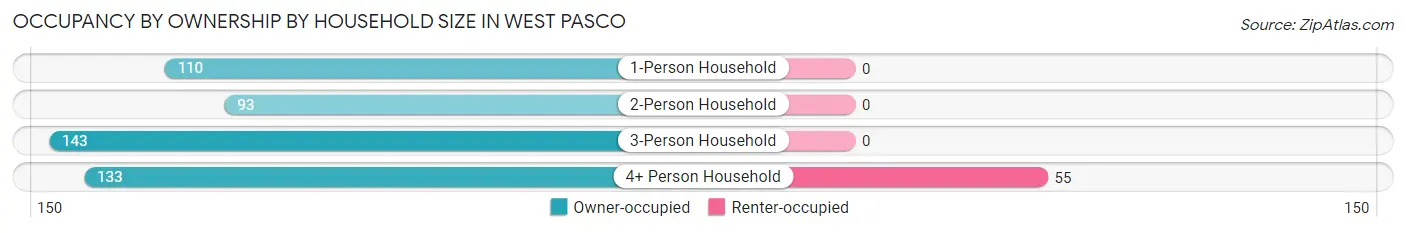
| Household Size | Owner-occupied | Renter-occupied |
| 1-Person Household | 110 (100.0%) | 0 (0.0%) |
| 2-Person Household | 93 (100.0%) | 0 (0.0%) |
| 3-Person Household | 143 (100.0%) | 0 (0.0%) |
| 4+ Person Household | 133 (70.7%) | 55 (29.3%) |
| Total Housing Units | 479 (89.7%) | 55 (10.3%) |
Occupancy by Educational Attainment in West Pasco
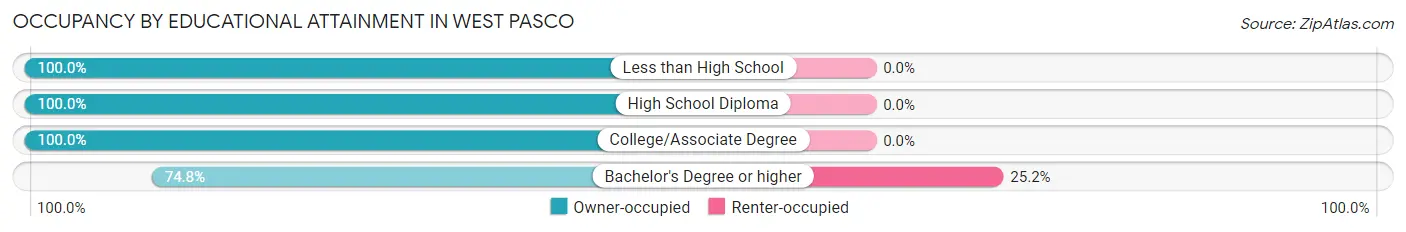
| Household Size | Owner-occupied | Renter-occupied |
| Less than High School | 9 (100.0%) | 0 (0.0%) |
| High School Diploma | 42 (100.0%) | 0 (0.0%) |
| College/Associate Degree | 265 (100.0%) | 0 (0.0%) |
| Bachelor's Degree or higher | 163 (74.8%) | 55 (25.2%) |
Occupancy by Age of Householder in West Pasco
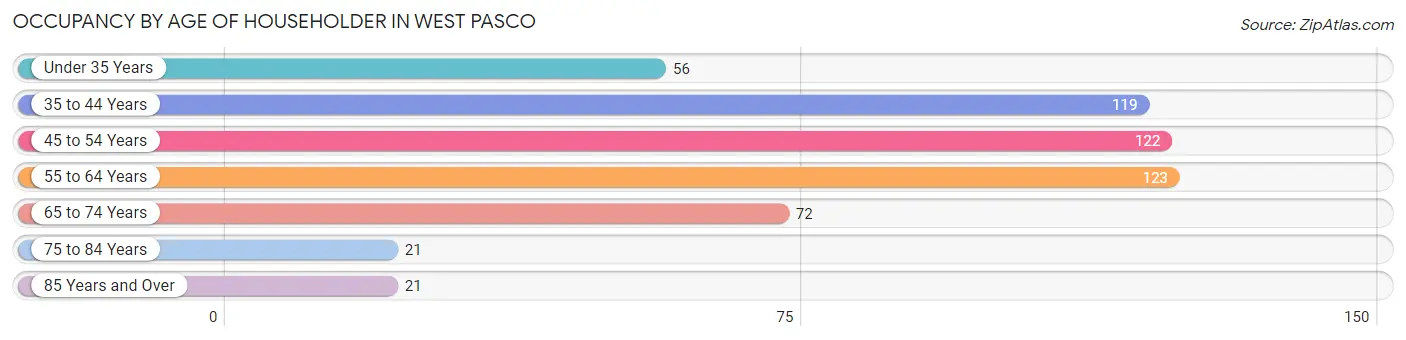
| Age Bracket | # Households | % Households |
| Under 35 Years | 56 | 10.5% |
| 35 to 44 Years | 119 | 22.3% |
| 45 to 54 Years | 122 | 22.9% |
| 55 to 64 Years | 123 | 23.0% |
| 65 to 74 Years | 72 | 13.5% |
| 75 to 84 Years | 21 | 3.9% |
| 85 Years and Over | 21 | 3.9% |
| Total | 534 | 100.0% |
Housing Finances in West Pasco
Median Income by Occupancy in West Pasco
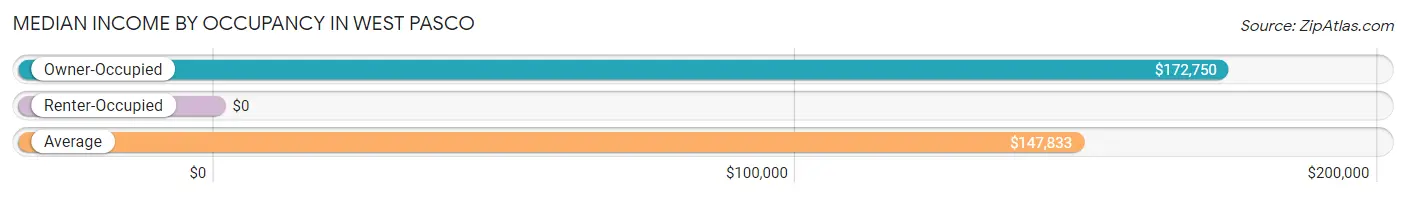
| Occupancy Type | # Households | Median Income |
| Owner-Occupied | 479 (89.7%) | $172,750 |
| Renter-Occupied | 55 (10.3%) | $0 |
| Average | 534 (100.0%) | $147,833 |
Occupancy by Householder Income Bracket in West Pasco
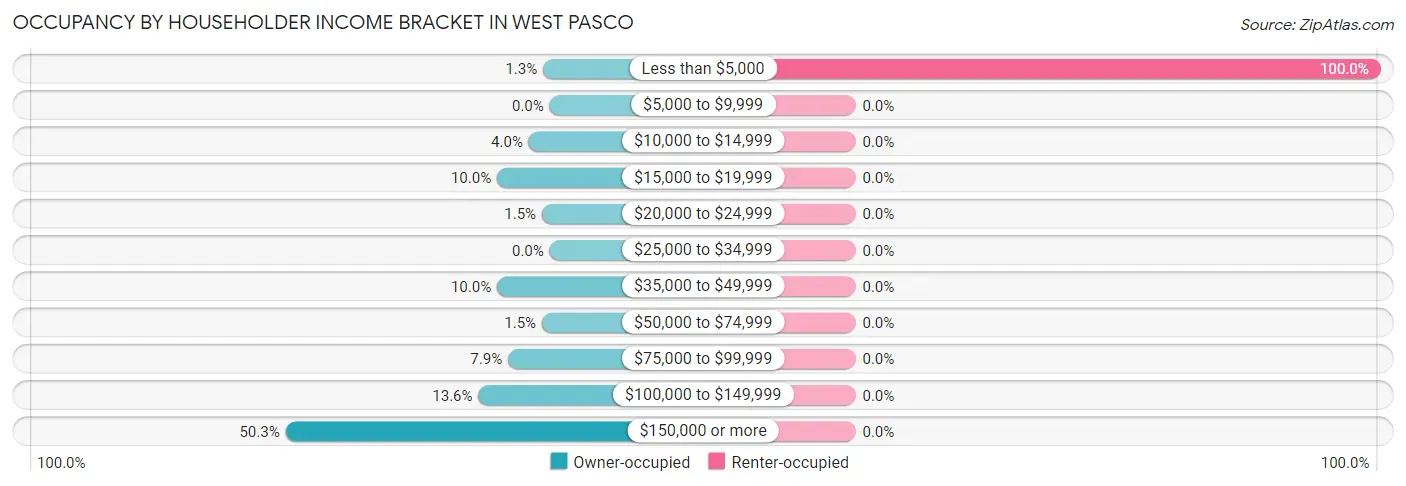
| Income Bracket | Owner-occupied | Renter-occupied |
| Less than $5,000 | 6 (1.3%) | 55 (100.0%) |
| $5,000 to $9,999 | 0 (0.0%) | 0 (0.0%) |
| $10,000 to $14,999 | 19 (4.0%) | 0 (0.0%) |
| $15,000 to $19,999 | 48 (10.0%) | 0 (0.0%) |
| $20,000 to $24,999 | 7 (1.5%) | 0 (0.0%) |
| $25,000 to $34,999 | 0 (0.0%) | 0 (0.0%) |
| $35,000 to $49,999 | 48 (10.0%) | 0 (0.0%) |
| $50,000 to $74,999 | 7 (1.5%) | 0 (0.0%) |
| $75,000 to $99,999 | 38 (7.9%) | 0 (0.0%) |
| $100,000 to $149,999 | 65 (13.6%) | 0 (0.0%) |
| $150,000 or more | 241 (50.3%) | 0 (0.0%) |
| Total | 479 (100.0%) | 55 (100.0%) |
Monthly Housing Cost Tiers in West Pasco
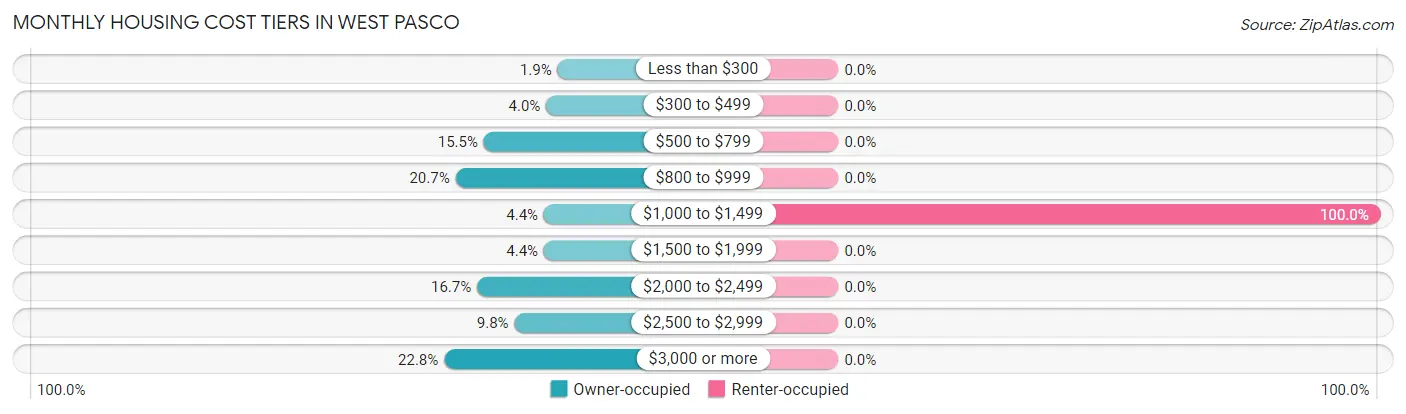
| Monthly Cost | Owner-occupied | Renter-occupied |
| Less than $300 | 9 (1.9%) | 0 (0.0%) |
| $300 to $499 | 19 (4.0%) | 0 (0.0%) |
| $500 to $799 | 74 (15.4%) | 0 (0.0%) |
| $800 to $999 | 99 (20.7%) | 0 (0.0%) |
| $1,000 to $1,499 | 21 (4.4%) | 55 (100.0%) |
| $1,500 to $1,999 | 21 (4.4%) | 0 (0.0%) |
| $2,000 to $2,499 | 80 (16.7%) | 0 (0.0%) |
| $2,500 to $2,999 | 47 (9.8%) | 0 (0.0%) |
| $3,000 or more | 109 (22.8%) | 0 (0.0%) |
| Total | 479 (100.0%) | 55 (100.0%) |
Physical Housing Characteristics in West Pasco
Housing Structures in West Pasco
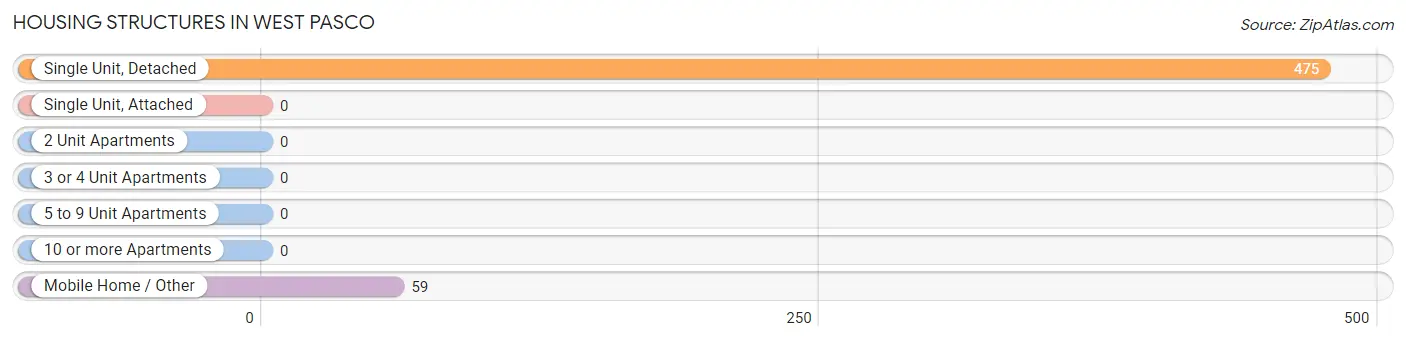
| Structure Type | # Housing Units | % Housing Units |
| Single Unit, Detached | 475 | 88.9% |
| Single Unit, Attached | 0 | 0.0% |
| 2 Unit Apartments | 0 | 0.0% |
| 3 or 4 Unit Apartments | 0 | 0.0% |
| 5 to 9 Unit Apartments | 0 | 0.0% |
| 10 or more Apartments | 0 | 0.0% |
| Mobile Home / Other | 59 | 11.1% |
| Total | 534 | 100.0% |
Housing Structures by Occupancy in West Pasco
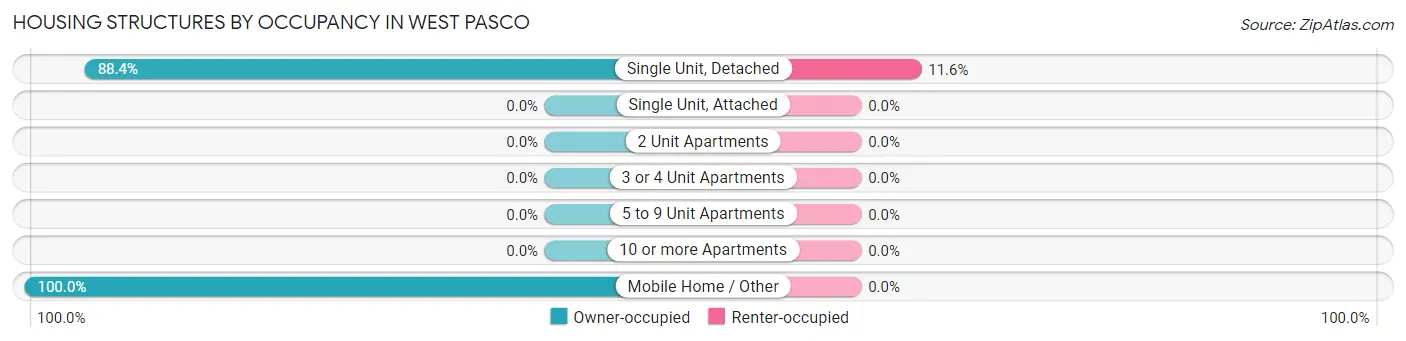
| Structure Type | Owner-occupied | Renter-occupied |
| Single Unit, Detached | 420 (88.4%) | 55 (11.6%) |
| Single Unit, Attached | 0 (0.0%) | 0 (0.0%) |
| 2 Unit Apartments | 0 (0.0%) | 0 (0.0%) |
| 3 or 4 Unit Apartments | 0 (0.0%) | 0 (0.0%) |
| 5 to 9 Unit Apartments | 0 (0.0%) | 0 (0.0%) |
| 10 or more Apartments | 0 (0.0%) | 0 (0.0%) |
| Mobile Home / Other | 59 (100.0%) | 0 (0.0%) |
| Total | 479 (89.7%) | 55 (10.3%) |
Housing Structures by Number of Rooms in West Pasco
| Number of Rooms | Owner-occupied | Renter-occupied |
| 1 Room | 0 (0.0%) | 0 (0.0%) |
| 2 or 3 Rooms | 0 (0.0%) | 0 (0.0%) |
| 4 or 5 Rooms | 103 (21.5%) | 0 (0.0%) |
| 6 or 7 Rooms | 102 (21.3%) | 55 (100.0%) |
| 8 or more Rooms | 274 (57.2%) | 0 (0.0%) |
| Total | 479 (100.0%) | 55 (100.0%) |
Housing Structure by Heating Type in West Pasco
| Heating Type | Owner-occupied | Renter-occupied |
| Utility Gas | 62 (12.9%) | 0 (0.0%) |
| Bottled, Tank, or LP Gas | 0 (0.0%) | 0 (0.0%) |
| Electricity | 399 (83.3%) | 55 (100.0%) |
| Fuel Oil or Kerosene | 0 (0.0%) | 0 (0.0%) |
| Coal or Coke | 9 (1.9%) | 0 (0.0%) |
| All other Fuels | 9 (1.9%) | 0 (0.0%) |
| No Fuel Used | 0 (0.0%) | 0 (0.0%) |
| Total | 479 (100.0%) | 55 (100.0%) |
Household Vehicle Usage in West Pasco
| Vehicles per Household | Owner-occupied | Renter-occupied |
| No Vehicle | 9 (1.9%) | 0 (0.0%) |
| 1 Vehicle | 78 (16.3%) | 55 (100.0%) |
| 2 Vehicles | 140 (29.2%) | 0 (0.0%) |
| 3 or more Vehicles | 252 (52.6%) | 0 (0.0%) |
| Total | 479 (100.0%) | 55 (100.0%) |
Real Estate & Mortgages in West Pasco
Real Estate and Mortgage Overview in West Pasco
| Characteristic | Without Mortgage | With Mortgage |
| Housing Units | 134 | 345 |
| Median Property Value | - | - |
| Median Household Income | - | - |
| Monthly Housing Costs | $713 | $109 |
| Real Estate Taxes | $4,220 | $0 |
Property Value by Mortgage Status in West Pasco
| Property Value | Without Mortgage | With Mortgage |
| Less than $50,000 | 0 (0.0%) | 17 (4.9%) |
| $50,000 to $99,999 | 0 (0.0%) | 0 (0.0%) |
| $100,000 to $299,999 | 69 (51.5%) | 23 (6.7%) |
| $300,000 to $499,999 | 17 (12.7%) | 150 (43.5%) |
| $500,000 to $749,999 | 41 (30.6%) | 109 (31.6%) |
| $750,000 to $999,999 | 0 (0.0%) | 30 (8.7%) |
| $1,000,000 or more | 7 (5.2%) | 16 (4.6%) |
| Total | 134 (100.0%) | 345 (100.0%) |
Household Income by Mortgage Status in West Pasco
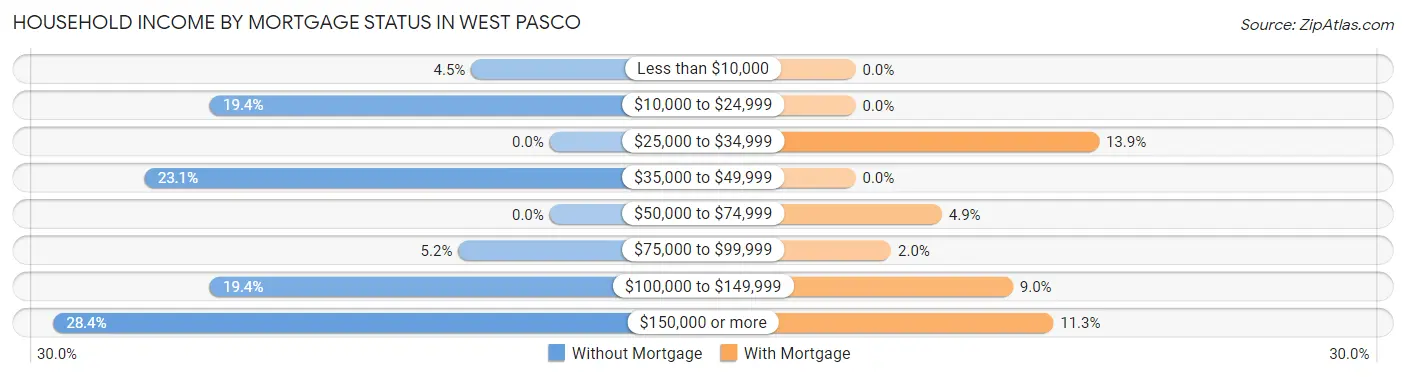
| Household Income | Without Mortgage | With Mortgage |
| Less than $10,000 | 6 (4.5%) | 0 (0.0%) |
| $10,000 to $24,999 | 26 (19.4%) | 0 (0.0%) |
| $25,000 to $34,999 | 0 (0.0%) | 48 (13.9%) |
| $35,000 to $49,999 | 31 (23.1%) | 0 (0.0%) |
| $50,000 to $74,999 | 0 (0.0%) | 17 (4.9%) |
| $75,000 to $99,999 | 7 (5.2%) | 7 (2.0%) |
| $100,000 to $149,999 | 26 (19.4%) | 31 (9.0%) |
| $150,000 or more | 38 (28.4%) | 39 (11.3%) |
| Total | 134 (100.0%) | 345 (100.0%) |
Property Value to Household Income Ratio in West Pasco
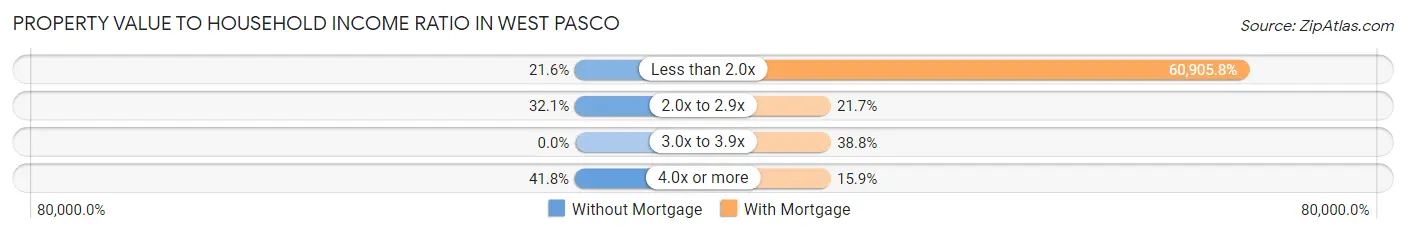
| Value-to-Income Ratio | Without Mortgage | With Mortgage |
| Less than 2.0x | 29 (21.6%) | 210,125 (60,905.8%) |
| 2.0x to 2.9x | 43 (32.1%) | 75 (21.7%) |
| 3.0x to 3.9x | 0 (0.0%) | 134 (38.8%) |
| 4.0x or more | 56 (41.8%) | 55 (15.9%) |
| Total | 134 (100.0%) | 345 (100.0%) |
Real Estate Taxes by Mortgage Status in West Pasco
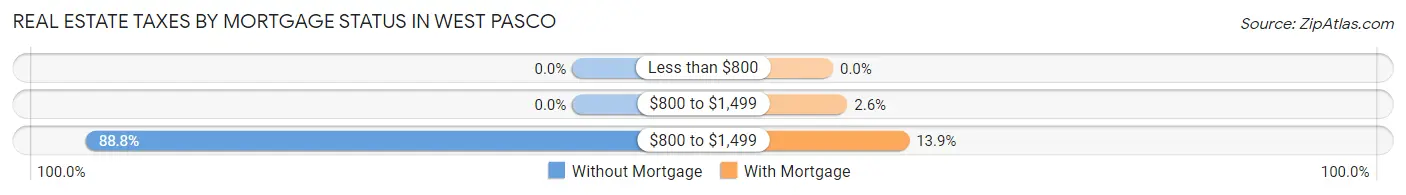
| Property Taxes | Without Mortgage | With Mortgage |
| Less than $800 | 0 (0.0%) | 0 (0.0%) |
| $800 to $1,499 | 0 (0.0%) | 9 (2.6%) |
| $800 to $1,499 | 119 (88.8%) | 48 (13.9%) |
| Total | 134 (100.0%) | 345 (100.0%) |
Health & Disability in West Pasco
Health Insurance Coverage by Age in West Pasco
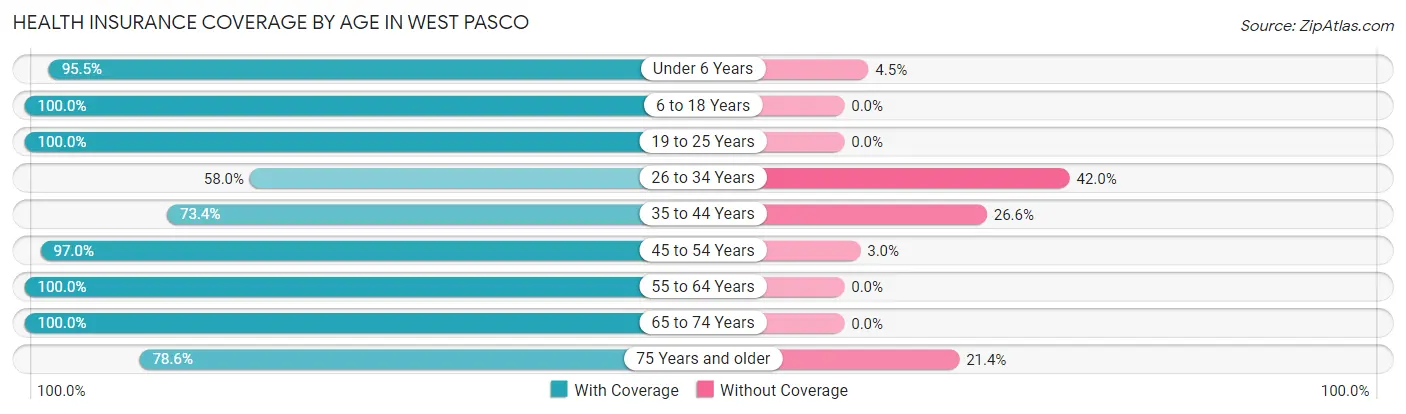
| Age Bracket | With Coverage | Without Coverage |
| Under 6 Years | 191 (95.5%) | 9 (4.5%) |
| 6 to 18 Years | 361 (100.0%) | 0 (0.0%) |
| 19 to 25 Years | 258 (100.0%) | 0 (0.0%) |
| 26 to 34 Years | 127 (58.0%) | 92 (42.0%) |
| 35 to 44 Years | 152 (73.4%) | 55 (26.6%) |
| 45 to 54 Years | 228 (97.0%) | 7 (3.0%) |
| 55 to 64 Years | 217 (100.0%) | 0 (0.0%) |
| 65 to 74 Years | 117 (100.0%) | 0 (0.0%) |
| 75 Years and older | 44 (78.6%) | 12 (21.4%) |
| Total | 1,695 (90.6%) | 175 (9.4%) |
Health Insurance Coverage by Citizenship Status in West Pasco
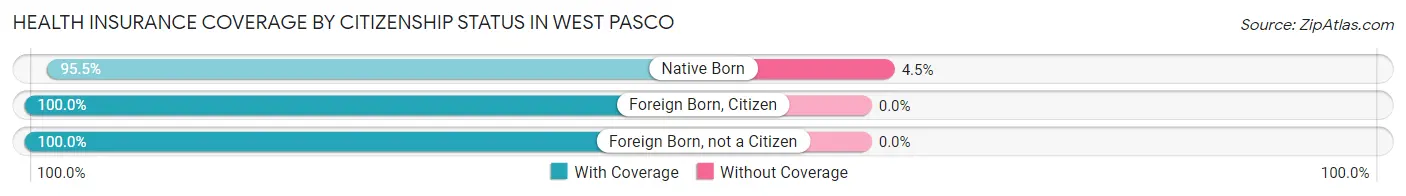
| Citizenship Status | With Coverage | Without Coverage |
| Native Born | 191 (95.5%) | 9 (4.5%) |
| Foreign Born, Citizen | 361 (100.0%) | 0 (0.0%) |
| Foreign Born, not a Citizen | 258 (100.0%) | 0 (0.0%) |
Health Insurance Coverage by Household Income in West Pasco
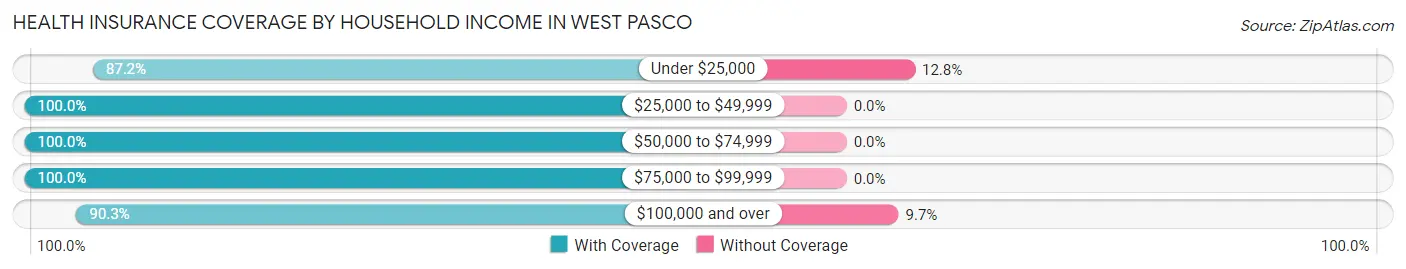
| Household Income | With Coverage | Without Coverage |
| Under $25,000 | 375 (87.2%) | 55 (12.8%) |
| $25,000 to $49,999 | 85 (100.0%) | 0 (0.0%) |
| $50,000 to $74,999 | 20 (100.0%) | 0 (0.0%) |
| $75,000 to $99,999 | 94 (100.0%) | 0 (0.0%) |
| $100,000 and over | 1,116 (90.3%) | 120 (9.7%) |
Public vs Private Health Insurance Coverage by Age in West Pasco
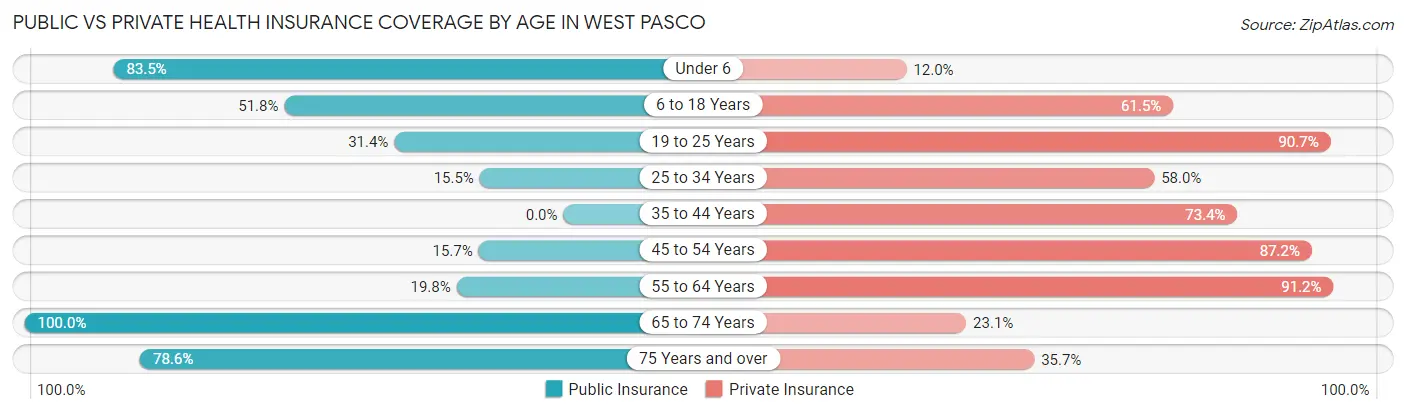
| Age Bracket | Public Insurance | Private Insurance |
| Under 6 | 167 (83.5%) | 24 (12.0%) |
| 6 to 18 Years | 187 (51.8%) | 222 (61.5%) |
| 19 to 25 Years | 81 (31.4%) | 234 (90.7%) |
| 25 to 34 Years | 34 (15.5%) | 127 (58.0%) |
| 35 to 44 Years | 0 (0.0%) | 152 (73.4%) |
| 45 to 54 Years | 37 (15.7%) | 205 (87.2%) |
| 55 to 64 Years | 43 (19.8%) | 198 (91.2%) |
| 65 to 74 Years | 117 (100.0%) | 27 (23.1%) |
| 75 Years and over | 44 (78.6%) | 20 (35.7%) |
| Total | 710 (38.0%) | 1,209 (64.6%) |
Disability Status by Sex by Age in West Pasco
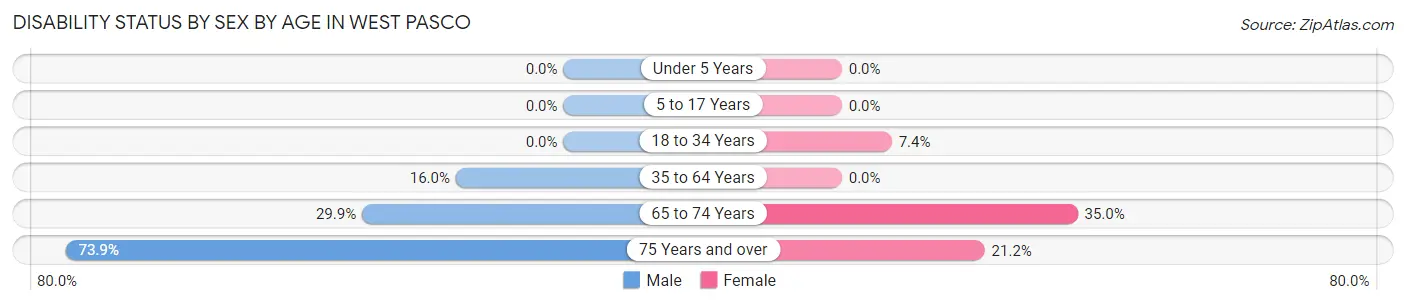
| Age Bracket | Male | Female |
| Under 5 Years | 0 (0.0%) | 0 (0.0%) |
| 5 to 17 Years | 0 (0.0%) | 0 (0.0%) |
| 18 to 34 Years | 0 (0.0%) | 16 (7.4%) |
| 35 to 64 Years | 50 (16.0%) | 0 (0.0%) |
| 65 to 74 Years | 29 (29.9%) | 7 (35.0%) |
| 75 Years and over | 17 (73.9%) | 7 (21.2%) |
Disability Class by Sex by Age in West Pasco
Disability Class: Hearing Difficulty
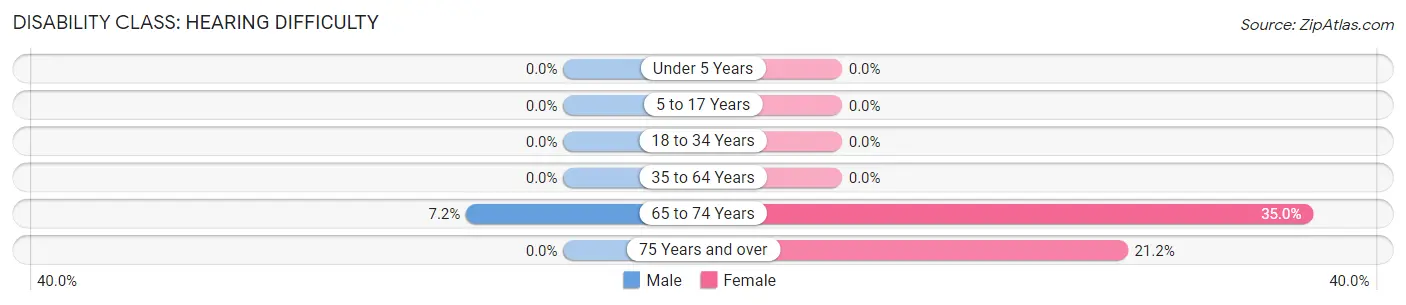
| Age Bracket | Male | Female |
| Under 5 Years | 0 (0.0%) | 0 (0.0%) |
| 5 to 17 Years | 0 (0.0%) | 0 (0.0%) |
| 18 to 34 Years | 0 (0.0%) | 0 (0.0%) |
| 35 to 64 Years | 0 (0.0%) | 0 (0.0%) |
| 65 to 74 Years | 7 (7.2%) | 7 (35.0%) |
| 75 Years and over | 0 (0.0%) | 7 (21.2%) |
Disability Class: Vision Difficulty
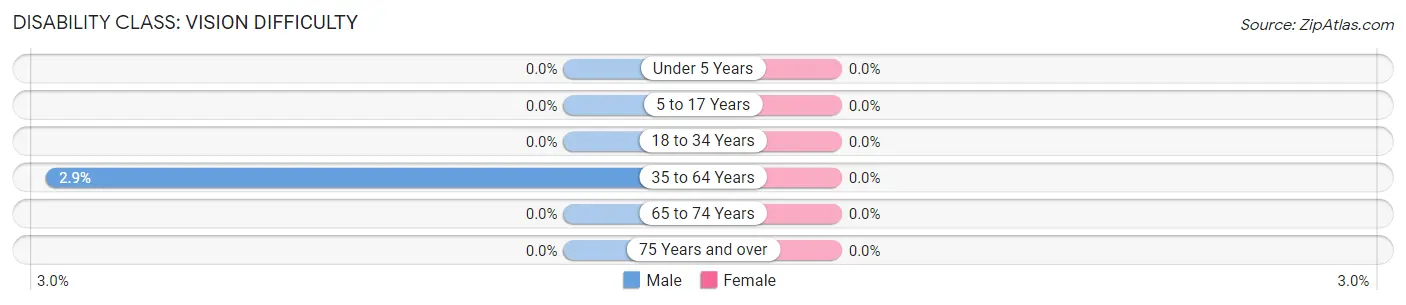
| Age Bracket | Male | Female |
| Under 5 Years | 0 (0.0%) | 0 (0.0%) |
| 5 to 17 Years | 0 (0.0%) | 0 (0.0%) |
| 18 to 34 Years | 0 (0.0%) | 0 (0.0%) |
| 35 to 64 Years | 9 (2.9%) | 0 (0.0%) |
| 65 to 74 Years | 0 (0.0%) | 0 (0.0%) |
| 75 Years and over | 0 (0.0%) | 0 (0.0%) |
Disability Class: Cognitive Difficulty
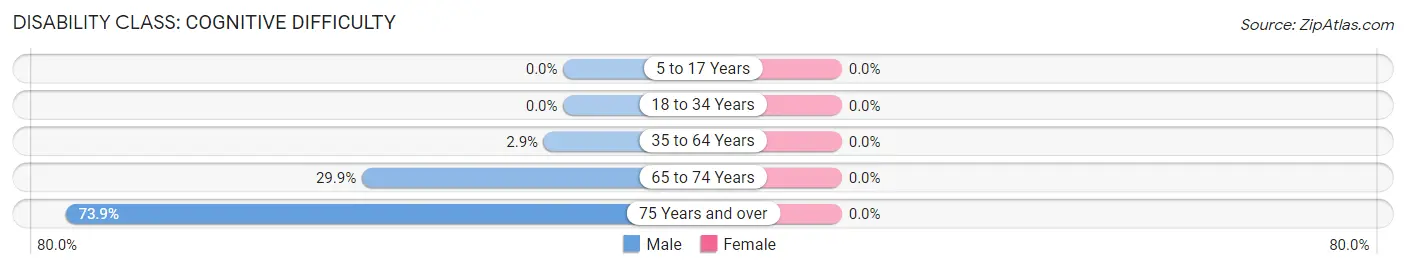
| Age Bracket | Male | Female |
| 5 to 17 Years | 0 (0.0%) | 0 (0.0%) |
| 18 to 34 Years | 0 (0.0%) | 0 (0.0%) |
| 35 to 64 Years | 9 (2.9%) | 0 (0.0%) |
| 65 to 74 Years | 29 (29.9%) | 0 (0.0%) |
| 75 Years and over | 17 (73.9%) | 0 (0.0%) |
Disability Class: Ambulatory Difficulty
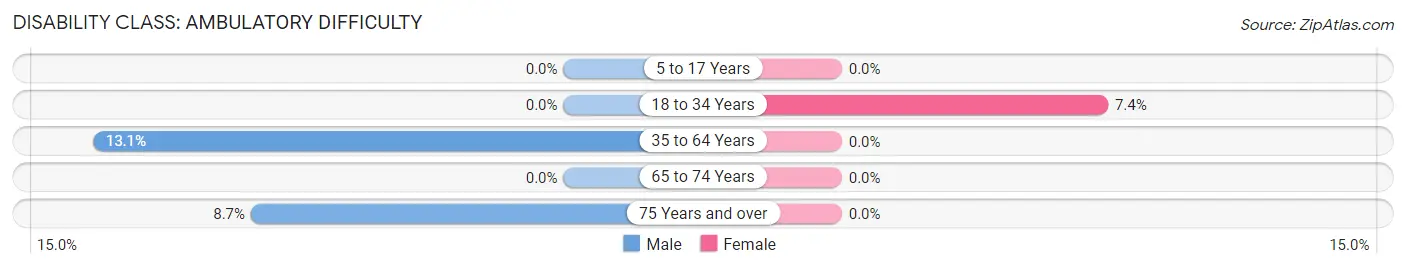
| Age Bracket | Male | Female |
| 5 to 17 Years | 0 (0.0%) | 0 (0.0%) |
| 18 to 34 Years | 0 (0.0%) | 16 (7.4%) |
| 35 to 64 Years | 41 (13.1%) | 0 (0.0%) |
| 65 to 74 Years | 0 (0.0%) | 0 (0.0%) |
| 75 Years and over | 2 (8.7%) | 0 (0.0%) |
Disability Class: Self-Care Difficulty
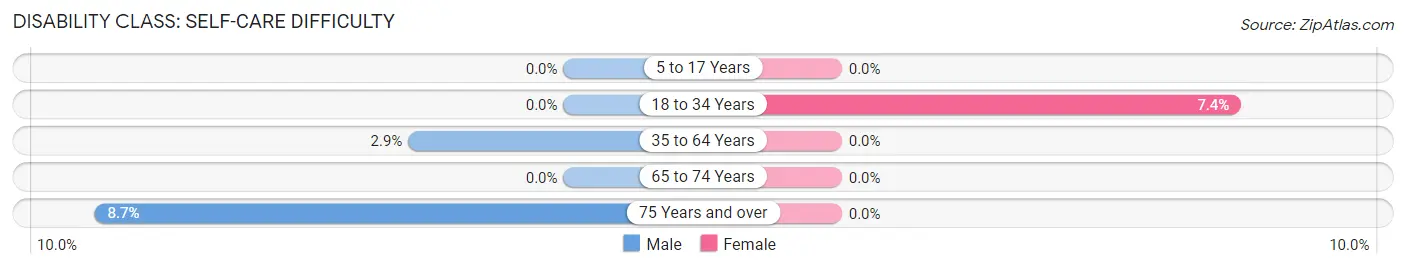
| Age Bracket | Male | Female |
| 5 to 17 Years | 0 (0.0%) | 0 (0.0%) |
| 18 to 34 Years | 0 (0.0%) | 16 (7.4%) |
| 35 to 64 Years | 9 (2.9%) | 0 (0.0%) |
| 65 to 74 Years | 0 (0.0%) | 0 (0.0%) |
| 75 Years and over | 2 (8.7%) | 0 (0.0%) |
Technology Access in West Pasco
Computing Device Access in West Pasco
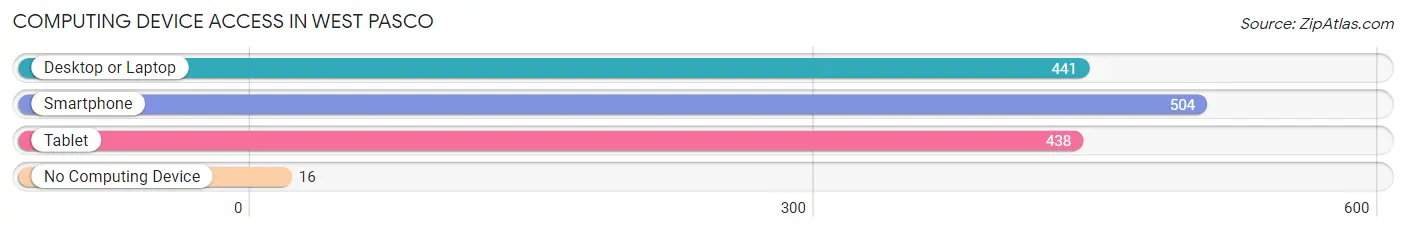
| Device Type | # Households | % Households |
| Desktop or Laptop | 441 | 82.6% |
| Smartphone | 504 | 94.4% |
| Tablet | 438 | 82.0% |
| No Computing Device | 16 | 3.0% |
| Total | 534 | 100.0% |
Internet Access in West Pasco
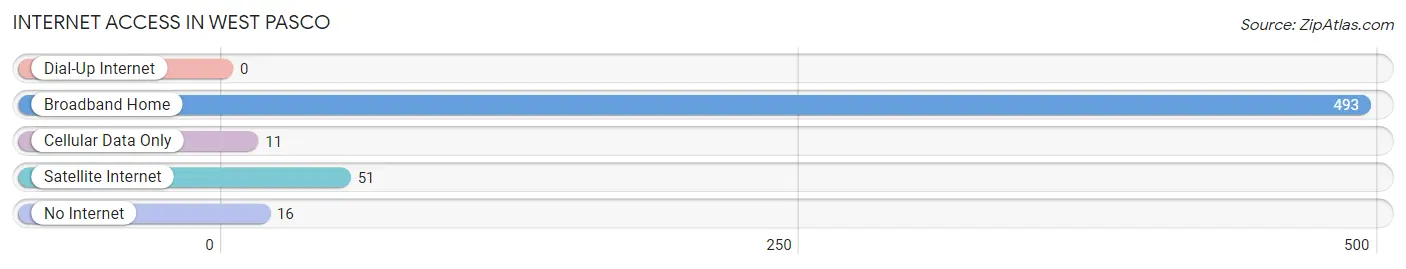
| Internet Type | # Households | % Households |
| Dial-Up Internet | 0 | 0.0% |
| Broadband Home | 493 | 92.3% |
| Cellular Data Only | 11 | 2.1% |
| Satellite Internet | 51 | 9.6% |
| No Internet | 16 | 3.0% |
| Total | 534 | 100.0% |
West Pasco Summary
West Pasco is a small unincorporated community located in Franklin County, Washington, United States. It is situated on the west side of the Columbia River, just south of the city of Pasco. The population of West Pasco was estimated to be 1,845 in 2019.
History
West Pasco was first settled in the late 1800s by settlers from the Midwest. The area was originally known as "West Pasco Station" and was a stop on the Northern Pacific Railroad. The town was officially incorporated in 1909 and was named after the nearby city of Pasco.
In the early 1900s, West Pasco was a thriving agricultural community. The area was known for its wheat, barley, and hops production. The town also had a number of small businesses, including a general store, a blacksmith shop, and a hotel.
In the 1950s, West Pasco began to experience a decline in population as many of its residents moved away in search of better economic opportunities. The town's population continued to decline until the late 1990s, when it began to experience a resurgence.
Geography
West Pasco is located in Franklin County, Washington, on the west side of the Columbia River. The town is situated at an elevation of 441 feet (134 m) above sea level. The area is characterized by rolling hills and open fields.
The climate in West Pasco is semi-arid, with hot summers and cold winters. The average annual temperature is 54°F (12°C), and the average annual precipitation is 11.5 inches (292 mm).
Economy
West Pasco's economy is largely based on agriculture. The area is known for its production of wheat, barley, and hops. The town also has a number of small businesses, including a general store, a blacksmith shop, and a hotel.
In recent years, West Pasco has become a popular destination for tourists. The town is home to a number of attractions, including the Pasco County Fairgrounds, the Pasco County Historical Museum, and the Pasco County Courthouse.
Demographics
As of 2019, the population of West Pasco was estimated to be 1,845. The racial makeup of the town was 94.3% White, 1.2% Hispanic or Latino, 0.7% Asian, 0.5% African American, 0.2% Native American, and 3.1% other.
The median household income in West Pasco was $45,938 in 2019. The median home value was $179,400. The median age of the population was 37.5 years.
Conclusion
West Pasco is a small unincorporated community located in Franklin County, Washington, United States. It is situated on the west side of the Columbia River, just south of the city of Pasco. The population of West Pasco was estimated to be 1,845 in 2019. The town is characterized by rolling hills and open fields, and its economy is largely based on agriculture. The median household income in West Pasco was $45,938 in 2019, and the median home value was $179,400. The racial makeup of the town was 94.3% White, 1.2% Hispanic or Latino, 0.7% Asian, 0.5% African American, 0.2% Native American, and 3.1% other. West Pasco is a popular destination for tourists, and is home to a number of attractions, including the Pasco County Fairgrounds, the Pasco County Historical Museum, and the Pasco County Courthouse.
Common Questions
What is Per Capita Income in West Pasco?
Per Capita income in West Pasco is $68,834.
What is the Median Family Income in West Pasco?
Median Family Income in West Pasco is $196,875.
What is the Median Household income in West Pasco?
Median Household Income in West Pasco is $147,833.
What is Income or Wage Gap in West Pasco?
Income or Wage Gap in West Pasco is 34.2%.
Women in West Pasco earn 65.8 cents for every dollar earned by a man.
What is Inequality or Gini Index in West Pasco?
Inequality or Gini Index in West Pasco is 0.54.
What is the Total Population of West Pasco?
Total Population of West Pasco is 1,870.
What is the Total Male Population of West Pasco?
Total Male Population of West Pasco is 967.
What is the Total Female Population of West Pasco?
Total Female Population of West Pasco is 903.
What is the Ratio of Males per 100 Females in West Pasco?
There are 107.09 Males per 100 Females in West Pasco.
What is the Ratio of Females per 100 Males in West Pasco?
There are 93.38 Females per 100 Males in West Pasco.
What is the Median Population Age in West Pasco?
Median Population Age in West Pasco is 28.0 Years.
What is the Average Family Size in West Pasco
Average Family Size in West Pasco is 4.0 People.
What is the Average Household Size in West Pasco
Average Household Size in West Pasco is 3.5 People.
How Large is the Labor Force in West Pasco?
There are 1,029 People in the Labor Forcein in West Pasco.
What is the Percentage of People in the Labor Force in West Pasco?
74.0% of People are in the Labor Force in West Pasco.
What is the Unemployment Rate in West Pasco?
Unemployment Rate in West Pasco is 8.2%.