Silver Firs, WA Map & Demographics
Silver Firs Map
Silver Firs Overview
$58,733
PER CAPITA INCOME
$158,505
AVG FAMILY INCOME
$150,709
AVG HOUSEHOLD INCOME
48.7%
WAGE / INCOME GAP [ % ]
51.3¢/ $1
WAGE / INCOME GAP [ $ ]
0.35
INEQUALITY / GINI INDEX
22,230
TOTAL POPULATION
11,706
MALE POPULATION
10,524
FEMALE POPULATION
111.23
MALES / 100 FEMALES
89.90
FEMALES / 100 MALES
37.5
MEDIAN AGE
3.2
AVG FAMILY SIZE
3.0
AVG HOUSEHOLD SIZE
12,724
LABOR FORCE [ PEOPLE ]
73.7%
PERCENT IN LABOR FORCE
2.9%
UNEMPLOYMENT RATE
Income in Silver Firs
Income Overview in Silver Firs
Per Capita Income in Silver Firs is $58,733, while median incomes of families and households are $158,505 and $150,709 respectively.
| Characteristic | Number | Measure |
| Per Capita Income | 22,230 | $58,733 |
| Median Family Income | 6,174 | $158,505 |
| Mean Family Income | 6,174 | $180,724 |
| Median Household Income | 7,489 | $150,709 |
| Mean Household Income | 7,489 | $171,607 |
| Income Deficit | 6,174 | $0 |
| Wage / Income Gap (%) | 22,230 | 48.70% |
| Wage / Income Gap ($) | 22,230 | 51.30¢ per $1 |
| Gini / Inequality Index | 22,230 | 0.35 |
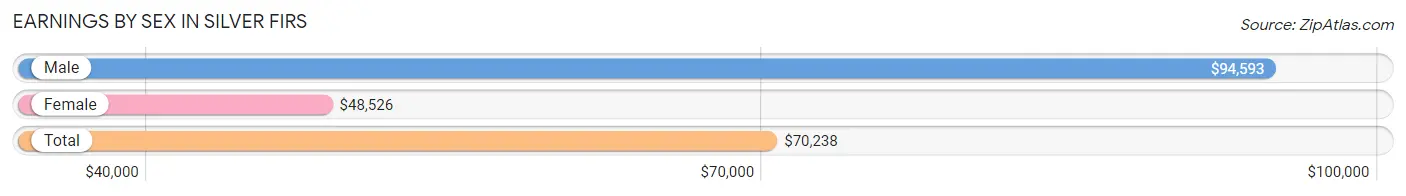
Earnings by Sex in Silver Firs
Average Earnings in Silver Firs are $70,238, $94,593 for men and $48,526 for women, a difference of 48.7%.
| Sex | Number | Average Earnings |
| Male | 7,437 (56.5%) | $94,593 |
| Female | 5,737 (43.5%) | $48,526 |
| Total | 13,174 (100.0%) | $70,238 |
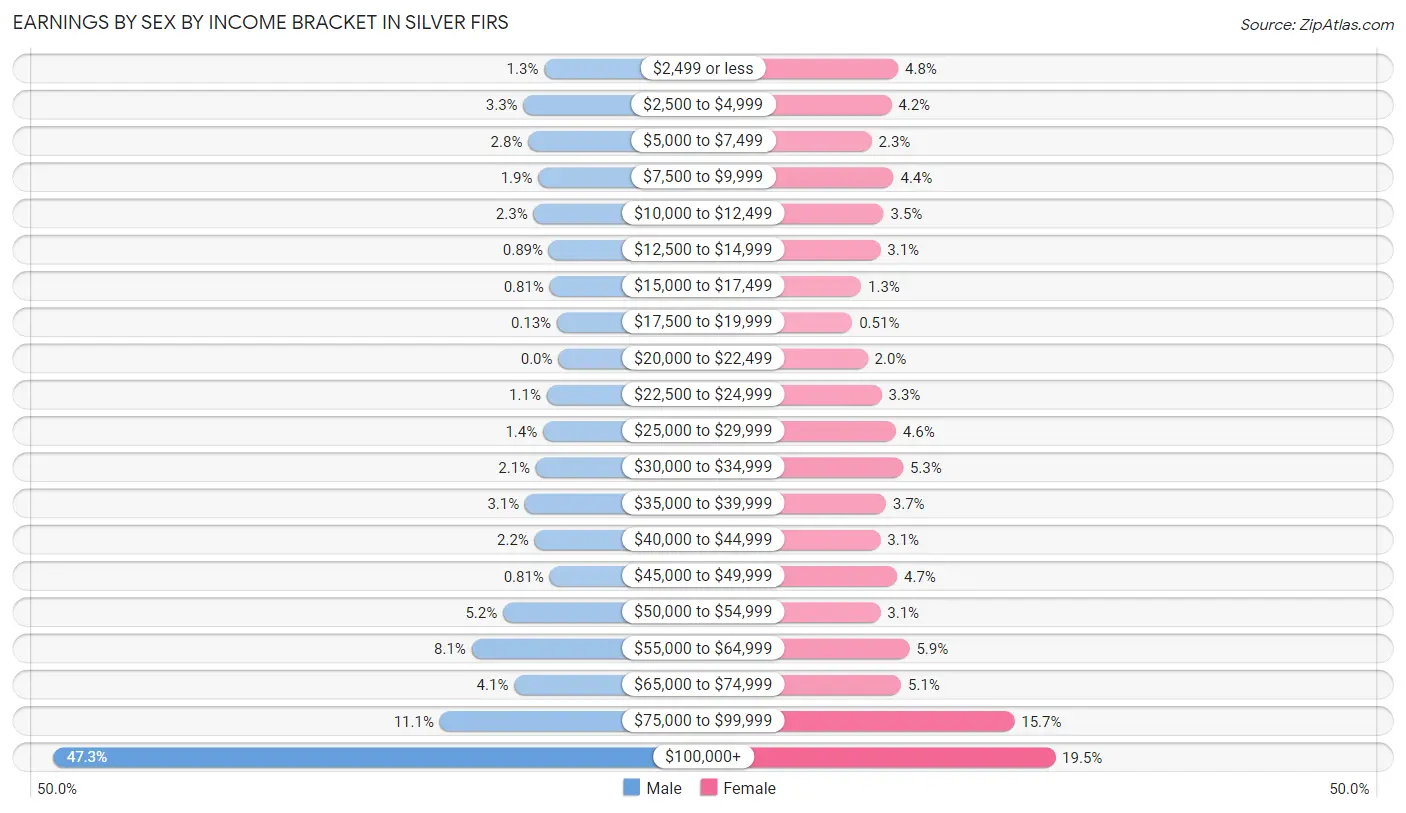
Earnings by Sex by Income Bracket in Silver Firs
The most common earnings brackets in Silver Firs are $100,000+ for men (3,515 | 47.3%) and $100,000+ for women (1,120 | 19.5%).
| Income | Male | Female |
| $2,499 or less | 98 (1.3%) | 276 (4.8%) |
| $2,500 to $4,999 | 243 (3.3%) | 239 (4.2%) |
| $5,000 to $7,499 | 210 (2.8%) | 133 (2.3%) |
| $7,500 to $9,999 | 140 (1.9%) | 251 (4.4%) |
| $10,000 to $12,499 | 173 (2.3%) | 198 (3.5%) |
| $12,500 to $14,999 | 66 (0.9%) | 180 (3.1%) |
| $15,000 to $17,499 | 60 (0.8%) | 77 (1.3%) |
| $17,500 to $19,999 | 10 (0.1%) | 29 (0.5%) |
| $20,000 to $22,499 | 0 (0.0%) | 112 (1.9%) |
| $22,500 to $24,999 | 81 (1.1%) | 187 (3.3%) |
| $25,000 to $29,999 | 106 (1.4%) | 264 (4.6%) |
| $30,000 to $34,999 | 156 (2.1%) | 302 (5.3%) |
| $35,000 to $39,999 | 232 (3.1%) | 210 (3.7%) |
| $40,000 to $44,999 | 165 (2.2%) | 180 (3.1%) |
| $45,000 to $49,999 | 60 (0.8%) | 270 (4.7%) |
| $50,000 to $54,999 | 385 (5.2%) | 180 (3.1%) |
| $55,000 to $64,999 | 604 (8.1%) | 337 (5.9%) |
| $65,000 to $74,999 | 307 (4.1%) | 292 (5.1%) |
| $75,000 to $99,999 | 826 (11.1%) | 900 (15.7%) |
| $100,000+ | 3,515 (47.3%) | 1,120 (19.5%) |
| Total | 7,437 (100.0%) | 5,737 (100.0%) |
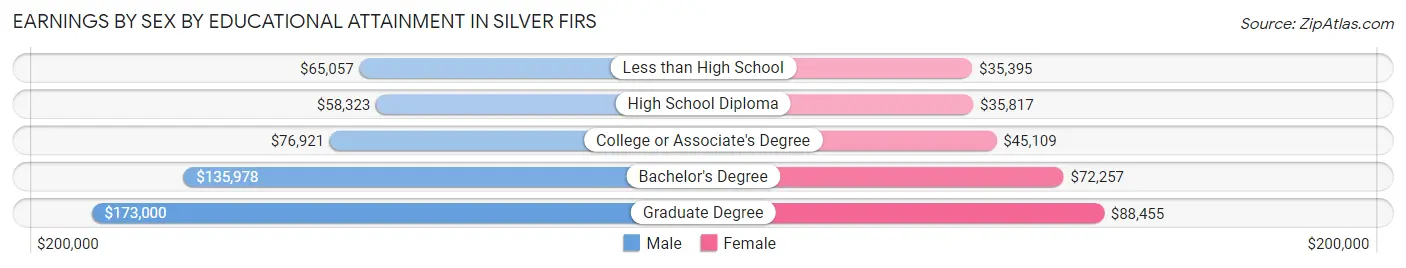
Earnings by Sex by Educational Attainment in Silver Firs
Average earnings in Silver Firs are $104,036 for men and $55,857 for women, a difference of 46.3%. Men with an educational attainment of graduate degree enjoy the highest average annual earnings of $173,000, while those with high school diploma education earn the least with $58,323. Women with an educational attainment of graduate degree earn the most with the average annual earnings of $88,455, while those with less than high school education have the smallest earnings of $35,395.
| Educational Attainment | Male Income | Female Income |
| Less than High School | $65,057 | $35,395 |
| High School Diploma | $58,323 | $35,817 |
| College or Associate's Degree | $76,921 | $45,109 |
| Bachelor's Degree | $135,978 | $72,257 |
| Graduate Degree | $173,000 | $88,455 |
| Total | $104,036 | $55,857 |
Family Income in Silver Firs
Family Income Brackets in Silver Firs
According to the Silver Firs family income data, there are 2,112 families falling into the $200,000+ income range, which is the most common income bracket and makes up 34.2% of all families. Conversely, the less than $10,000 income bracket is the least frequent group with only 43 families (0.7%) belonging to this category.
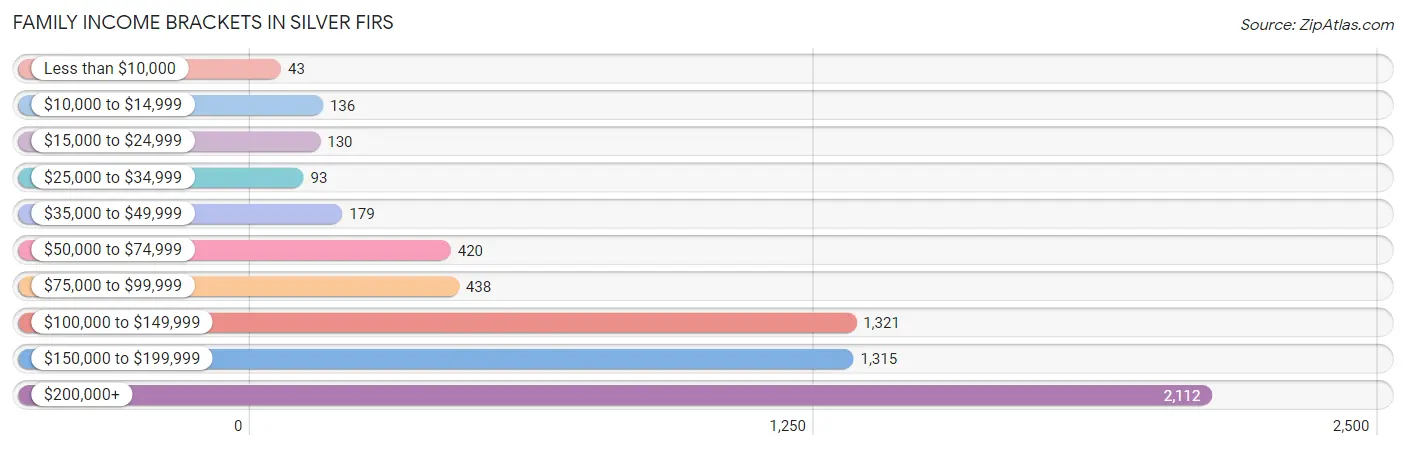
| Income Bracket | # Families | % Families |
| Less than $10,000 | 43 | 0.7% |
| $10,000 to $14,999 | 136 | 2.2% |
| $15,000 to $24,999 | 130 | 2.1% |
| $25,000 to $34,999 | 93 | 1.5% |
| $35,000 to $49,999 | 179 | 2.9% |
| $50,000 to $74,999 | 420 | 6.8% |
| $75,000 to $99,999 | 438 | 7.1% |
| $100,000 to $149,999 | 1,321 | 21.4% |
| $150,000 to $199,999 | 1,315 | 21.3% |
| $200,000+ | 2,112 | 34.2% |
Family Income by Famaliy Size in Silver Firs
4-person families (1,662 | 26.9%) account for the highest median family income in Silver Firs with $200,855 per family, while 2-person families (2,187 | 35.4%) have the highest median income of $63,438 per family member.
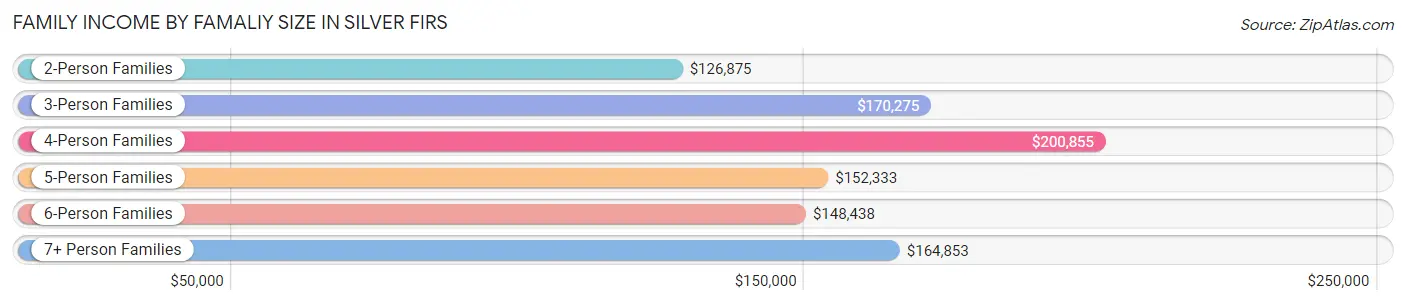
| Income Bracket | # Families | Median Income |
| 2-Person Families | 2,187 (35.4%) | $126,875 |
| 3-Person Families | 1,595 (25.8%) | $170,275 |
| 4-Person Families | 1,662 (26.9%) | $200,855 |
| 5-Person Families | 476 (7.7%) | $152,333 |
| 6-Person Families | 222 (3.6%) | $148,438 |
| 7+ Person Families | 32 (0.5%) | $164,853 |
| Total | 6,174 (100.0%) | $158,505 |
Family Income by Number of Earners in Silver Firs
The median family income in Silver Firs is $158,505, with families comprising 3+ earners (1,040) having the highest median family income of $233,816, while families with no earners (352) have the lowest median family income of $71,364, accounting for 16.8% and 5.7% of families, respectively.
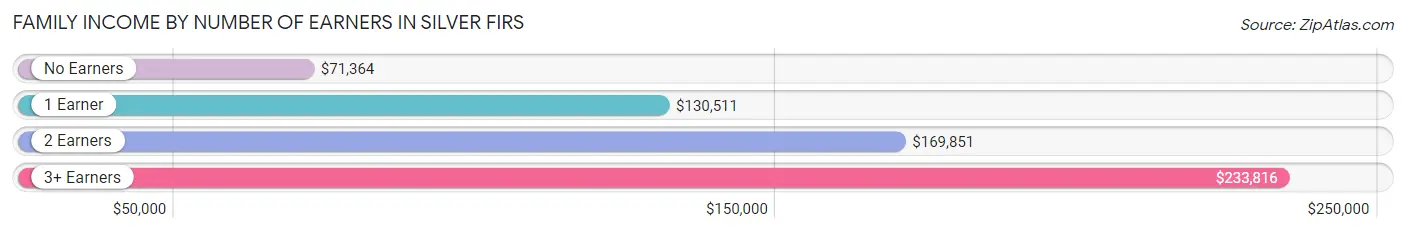
| Number of Earners | # Families | Median Income |
| No Earners | 352 (5.7%) | $71,364 |
| 1 Earner | 1,859 (30.1%) | $130,511 |
| 2 Earners | 2,923 (47.3%) | $169,851 |
| 3+ Earners | 1,040 (16.8%) | $233,816 |
| Total | 6,174 (100.0%) | $158,505 |
Household Income in Silver Firs
Household Income Brackets in Silver Firs
With 2,337 households falling in the category, the $200,000+ income range is the most frequent in Silver Firs, accounting for 31.2% of all households. In contrast, only 45 households (0.6%) fall into the $10,000 to $14,999 income bracket, making it the least populous group.
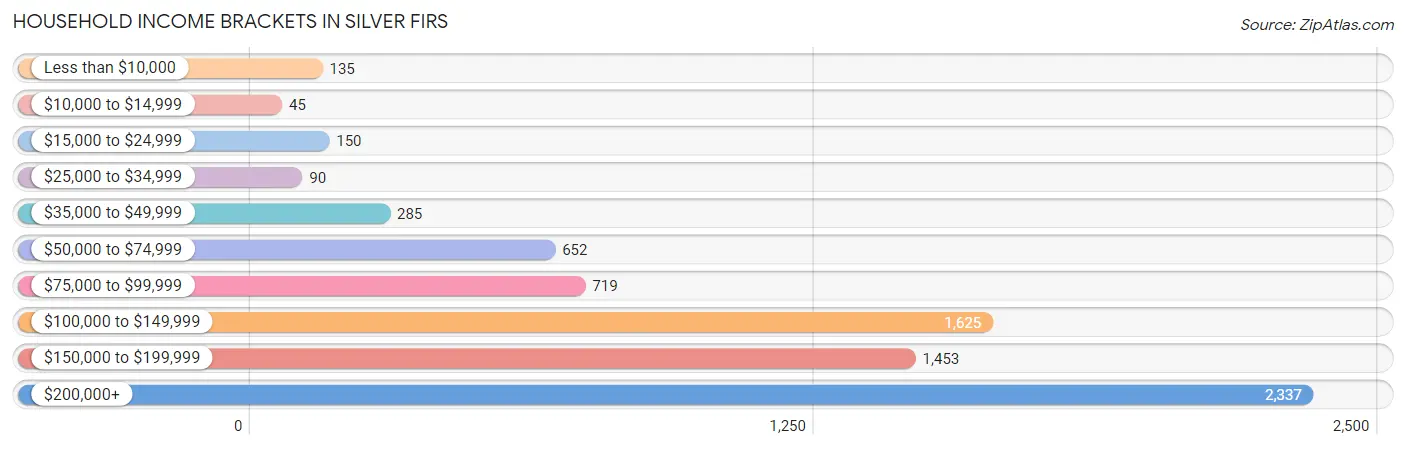
| Income Bracket | # Households | % Households |
| Less than $10,000 | 135 | 1.8% |
| $10,000 to $14,999 | 45 | 0.6% |
| $15,000 to $24,999 | 150 | 2.0% |
| $25,000 to $34,999 | 90 | 1.2% |
| $35,000 to $49,999 | 285 | 3.8% |
| $50,000 to $74,999 | 652 | 8.7% |
| $75,000 to $99,999 | 719 | 9.6% |
| $100,000 to $149,999 | 1,625 | 21.7% |
| $150,000 to $199,999 | 1,453 | 19.4% |
| $200,000+ | 2,337 | 31.2% |
Household Income by Householder Age in Silver Firs
The median household income in Silver Firs is $150,709, with the highest median household income of $161,125 found in the 45 to 64 years age bracket for the primary householder. A total of 3,847 households (51.4%) fall into this category. Meanwhile, the 15 to 24 years age bracket for the primary householder has the lowest median household income of $0, with 32 households (0.4%) in this group.
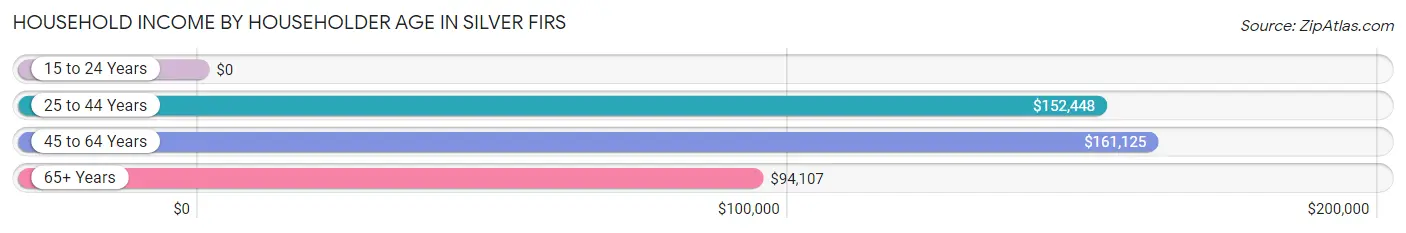
| Income Bracket | # Households | Median Income |
| 15 to 24 Years | 32 (0.4%) | $0 |
| 25 to 44 Years | 2,666 (35.6%) | $152,448 |
| 45 to 64 Years | 3,847 (51.4%) | $161,125 |
| 65+ Years | 944 (12.6%) | $94,107 |
| Total | 7,489 (100.0%) | $150,709 |
Poverty in Silver Firs
Income Below Poverty by Sex and Age in Silver Firs
With 6.0% poverty level for males and 5.6% for females among the residents of Silver Firs, under 5 year old males and 6 to 11 year old females are the most vulnerable to poverty, with 168 males (19.8%) and 113 females (12.3%) in their respective age groups living below the poverty level.
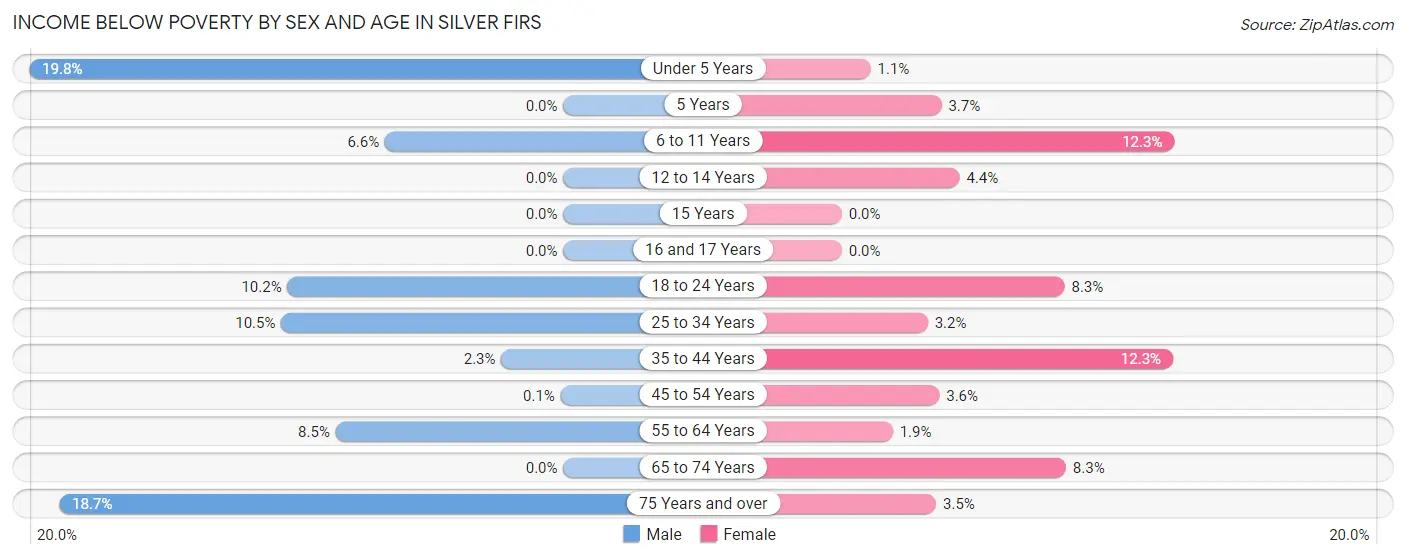
| Age Bracket | Male | Female |
| Under 5 Years | 168 (19.8%) | 7 (1.1%) |
| 5 Years | 0 (0.0%) | 8 (3.7%) |
| 6 to 11 Years | 66 (6.6%) | 113 (12.3%) |
| 12 to 14 Years | 0 (0.0%) | 15 (4.4%) |
| 15 Years | 0 (0.0%) | 0 (0.0%) |
| 16 and 17 Years | 0 (0.0%) | 0 (0.0%) |
| 18 to 24 Years | 93 (10.2%) | 59 (8.3%) |
| 25 to 34 Years | 144 (10.5%) | 43 (3.2%) |
| 35 to 44 Years | 44 (2.3%) | 193 (12.3%) |
| 45 to 54 Years | 2 (0.1%) | 72 (3.6%) |
| 55 to 64 Years | 141 (8.5%) | 28 (1.9%) |
| 65 to 74 Years | 0 (0.0%) | 45 (8.3%) |
| 75 Years and over | 38 (18.7%) | 11 (3.5%) |
| Total | 696 (6.0%) | 594 (5.6%) |
Income Above Poverty by Sex and Age in Silver Firs
According to the poverty statistics in Silver Firs, males aged 5 years and females aged 15 years are the age groups that are most secure financially, with 100.0% of males and 100.0% of females in these age groups living above the poverty line.
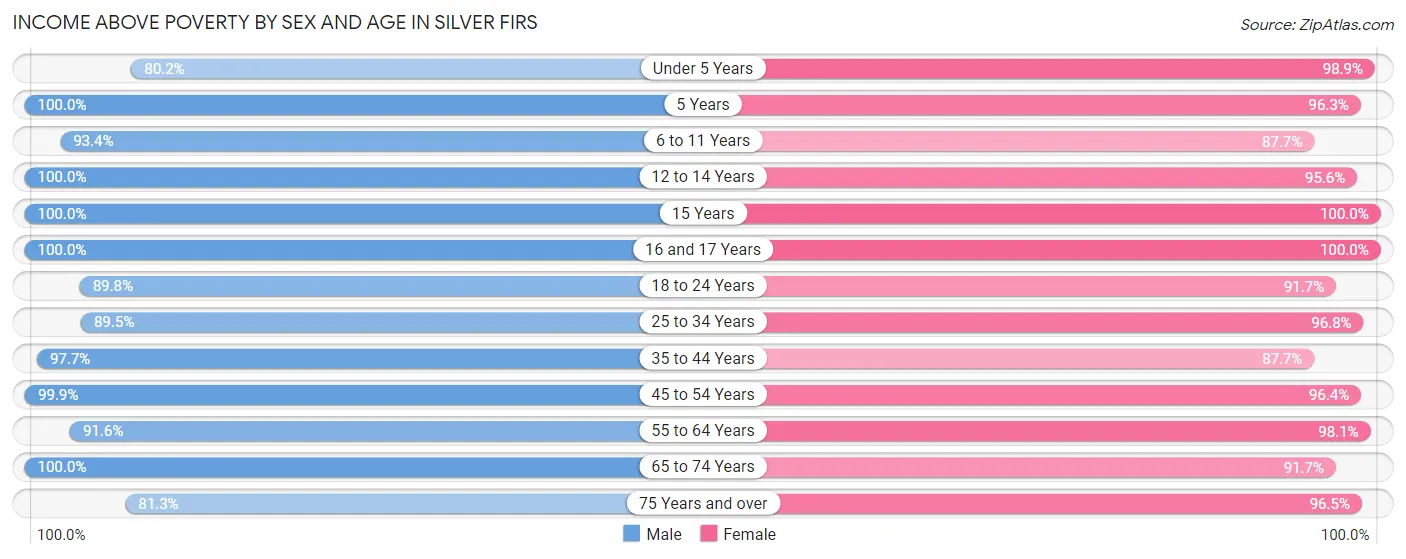
| Age Bracket | Male | Female |
| Under 5 Years | 679 (80.2%) | 647 (98.9%) |
| 5 Years | 132 (100.0%) | 208 (96.3%) |
| 6 to 11 Years | 931 (93.4%) | 803 (87.7%) |
| 12 to 14 Years | 446 (100.0%) | 328 (95.6%) |
| 15 Years | 230 (100.0%) | 167 (100.0%) |
| 16 and 17 Years | 398 (100.0%) | 268 (100.0%) |
| 18 to 24 Years | 815 (89.8%) | 654 (91.7%) |
| 25 to 34 Years | 1,232 (89.5%) | 1,305 (96.8%) |
| 35 to 44 Years | 1,867 (97.7%) | 1,378 (87.7%) |
| 45 to 54 Years | 1,929 (99.9%) | 1,919 (96.4%) |
| 55 to 64 Years | 1,527 (91.5%) | 1,454 (98.1%) |
| 65 to 74 Years | 640 (100.0%) | 496 (91.7%) |
| 75 Years and over | 165 (81.3%) | 303 (96.5%) |
| Total | 10,991 (94.0%) | 9,930 (94.4%) |
Income Below Poverty Among Married-Couple Families in Silver Firs
The poverty statistics for married-couple families in Silver Firs show that 1.4% or 74 of the total 5,316 families live below the poverty line. Families with no children have the highest poverty rate of 2.2%, comprising of 58 families. On the other hand, families with 5 or more children have the lowest poverty rate of 0.0%, which includes 0 families.
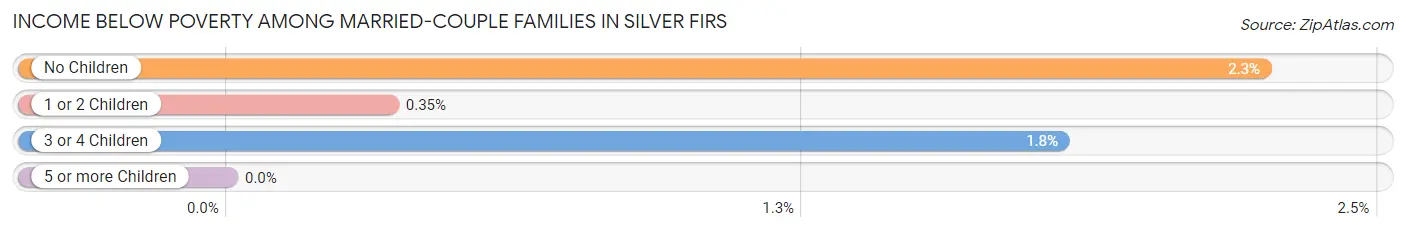
| Children | Above Poverty | Below Poverty |
| No Children | 2,517 (97.8%) | 58 (2.2%) |
| 1 or 2 Children | 2,260 (99.7%) | 8 (0.4%) |
| 3 or 4 Children | 433 (98.2%) | 8 (1.8%) |
| 5 or more Children | 32 (100.0%) | 0 (0.0%) |
| Total | 5,242 (98.6%) | 74 (1.4%) |
Income Below Poverty Among Single-Parent Households in Silver Firs
According to the poverty data in Silver Firs, 4.3% or 8 single-father households and 26.8% or 180 single-mother households are living below the poverty line. Among single-father households, those with 1 or 2 children have the highest poverty rate, with 8 households (7.6%) experiencing poverty. Likewise, among single-mother households, those with 5 or more children have the highest poverty rate, with 26 households (100.0%) falling below the poverty line.
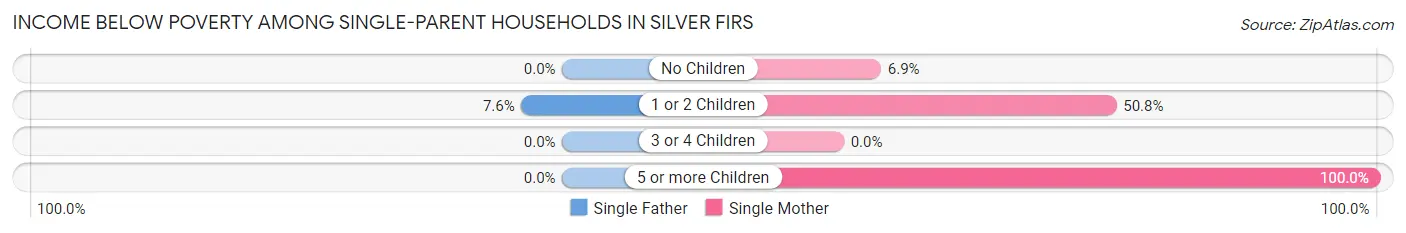
| Children | Single Father | Single Mother |
| No Children | 0 (0.0%) | 23 (6.9%) |
| 1 or 2 Children | 8 (7.6%) | 131 (50.8%) |
| 3 or 4 Children | 0 (0.0%) | 0 (0.0%) |
| 5 or more Children | 0 (0.0%) | 26 (100.0%) |
| Total | 8 (4.3%) | 180 (26.8%) |
Income Below Poverty Among Married-Couple vs Single-Parent Households in Silver Firs
The poverty data for Silver Firs shows that 74 of the married-couple family households (1.4%) and 188 of the single-parent households (21.9%) are living below the poverty level. Within the married-couple family households, those with no children have the highest poverty rate, with 58 households (2.2%) falling below the poverty line. Among the single-parent households, those with 5 or more children have the highest poverty rate, with 26 household (100.0%) living below poverty.
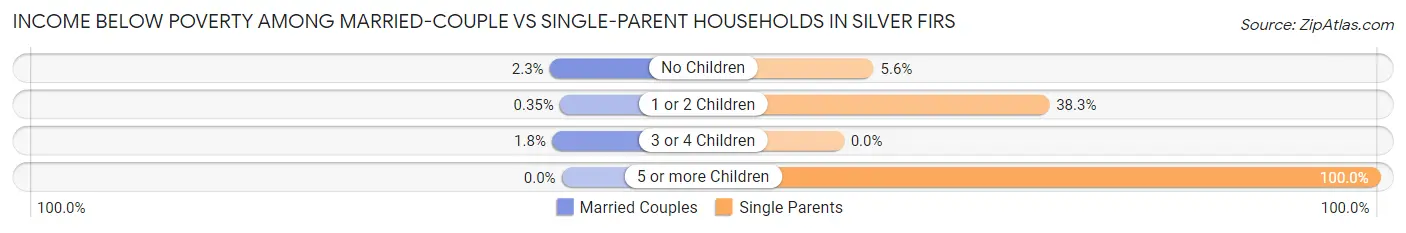
| Children | Married-Couple Families | Single-Parent Households |
| No Children | 58 (2.2%) | 23 (5.6%) |
| 1 or 2 Children | 8 (0.4%) | 139 (38.3%) |
| 3 or 4 Children | 8 (1.8%) | 0 (0.0%) |
| 5 or more Children | 0 (0.0%) | 26 (100.0%) |
| Total | 74 (1.4%) | 188 (21.9%) |
Race in Silver Firs
The most populous races in Silver Firs are White / Caucasian (15,906 | 71.6%), Asian (3,356 | 15.1%), and Hispanic or Latino (1,853 | 8.3%).
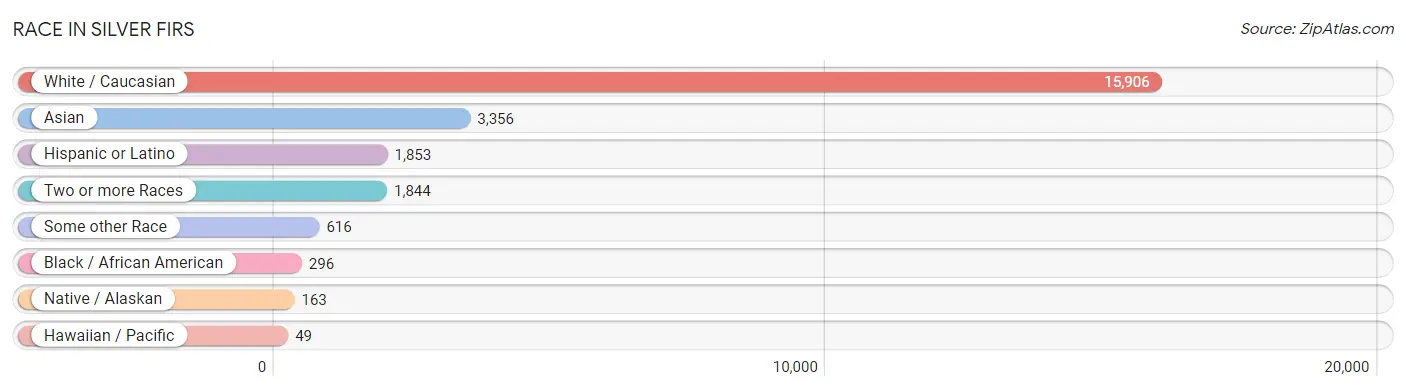
| Race | # Population | % Population |
| Asian | 3,356 | 15.1% |
| Black / African American | 296 | 1.3% |
| Hawaiian / Pacific | 49 | 0.2% |
| Hispanic or Latino | 1,853 | 8.3% |
| Native / Alaskan | 163 | 0.7% |
| White / Caucasian | 15,906 | 71.6% |
| Two or more Races | 1,844 | 8.3% |
| Some other Race | 616 | 2.8% |
| Total | 22,230 | 100.0% |
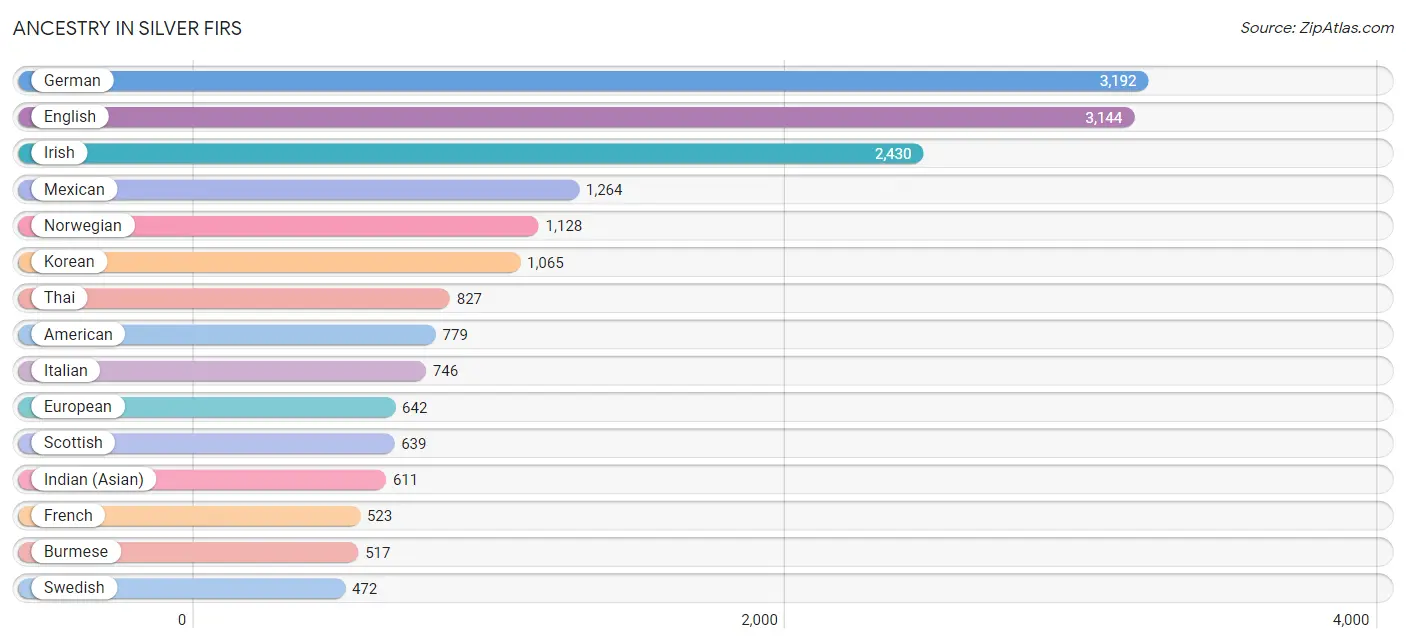
Ancestry in Silver Firs
The most populous ancestries reported in Silver Firs are German (3,192 | 14.4%), English (3,144 | 14.1%), Irish (2,430 | 10.9%), Mexican (1,264 | 5.7%), and Norwegian (1,128 | 5.1%), together accounting for 50.2% of all Silver Firs residents.
| Ancestry | # Population | % Population |
| African | 56 | 0.3% |
| American | 779 | 3.5% |
| Arab | 291 | 1.3% |
| Armenian | 169 | 0.8% |
| Austrian | 41 | 0.2% |
| Bhutanese | 377 | 1.7% |
| Blackfeet | 5 | 0.0% |
| Brazilian | 22 | 0.1% |
| British | 154 | 0.7% |
| Burmese | 517 | 2.3% |
| Canadian | 320 | 1.4% |
| Central American | 104 | 0.5% |
| Cherokee | 33 | 0.2% |
| Choctaw | 25 | 0.1% |
| Colombian | 92 | 0.4% |
| Colville | 1 | 0.0% |
| Costa Rican | 59 | 0.3% |
| Croatian | 60 | 0.3% |
| Cuban | 33 | 0.2% |
| Czech | 34 | 0.2% |
| Czechoslovakian | 7 | 0.0% |
| Danish | 433 | 1.9% |
| Dutch | 164 | 0.7% |
| Eastern European | 148 | 0.7% |
| Ecuadorian | 59 | 0.3% |
| Egyptian | 111 | 0.5% |
| English | 3,144 | 14.1% |
| Estonian | 21 | 0.1% |
| Ethiopian | 26 | 0.1% |
| European | 642 | 2.9% |
| Filipino | 147 | 0.7% |
| Finnish | 26 | 0.1% |
| French | 523 | 2.4% |
| French American Indian | 7 | 0.0% |
| French Canadian | 158 | 0.7% |
| German | 3,192 | 14.4% |
| Greek | 26 | 0.1% |
| Guamanian / Chamorro | 52 | 0.2% |
| Hungarian | 35 | 0.2% |
| Icelander | 18 | 0.1% |
| Indian (Asian) | 611 | 2.8% |
| Inupiat | 23 | 0.1% |
| Iranian | 135 | 0.6% |
| Iraqi | 127 | 0.6% |
| Irish | 2,430 | 10.9% |
| Italian | 746 | 3.4% |
| Jamaican | 60 | 0.3% |
| Japanese | 305 | 1.4% |
| Korean | 1,065 | 4.8% |
| Laotian | 73 | 0.3% |
| Lithuanian | 26 | 0.1% |
| Mexican | 1,264 | 5.7% |
| Mexican American Indian | 86 | 0.4% |
| Moroccan | 24 | 0.1% |
| Native Hawaiian | 83 | 0.4% |
| Nicaraguan | 9 | 0.0% |
| Nigerian | 120 | 0.5% |
| Northern European | 14 | 0.1% |
| Norwegian | 1,128 | 5.1% |
| Pakistani | 107 | 0.5% |
| Panamanian | 16 | 0.1% |
| Peruvian | 106 | 0.5% |
| Polish | 373 | 1.7% |
| Portuguese | 48 | 0.2% |
| Puerto Rican | 44 | 0.2% |
| Puget Sound Salish | 30 | 0.1% |
| Romanian | 71 | 0.3% |
| Russian | 129 | 0.6% |
| Salvadoran | 20 | 0.1% |
| Samoan | 215 | 1.0% |
| Scandinavian | 174 | 0.8% |
| Scotch-Irish | 211 | 0.9% |
| Scottish | 639 | 2.9% |
| Senegalese | 14 | 0.1% |
| Slovak | 16 | 0.1% |
| Slovene | 11 | 0.1% |
| South African | 14 | 0.1% |
| South American | 329 | 1.5% |
| Spaniard | 27 | 0.1% |
| Spanish | 33 | 0.2% |
| Sri Lankan | 360 | 1.6% |
| Subsaharan African | 251 | 1.1% |
| Swedish | 472 | 2.1% |
| Swiss | 78 | 0.4% |
| Syrian | 17 | 0.1% |
| Thai | 827 | 3.7% |
| Tlingit-Haida | 9 | 0.0% |
| Tongan | 179 | 0.8% |
| Turkish | 12 | 0.1% |
| Ukrainian | 130 | 0.6% |
| Venezuelan | 72 | 0.3% |
| Vietnamese | 124 | 0.6% |
| Welsh | 306 | 1.4% |
| Yup'ik | 45 | 0.2% | View All 94 Rows |
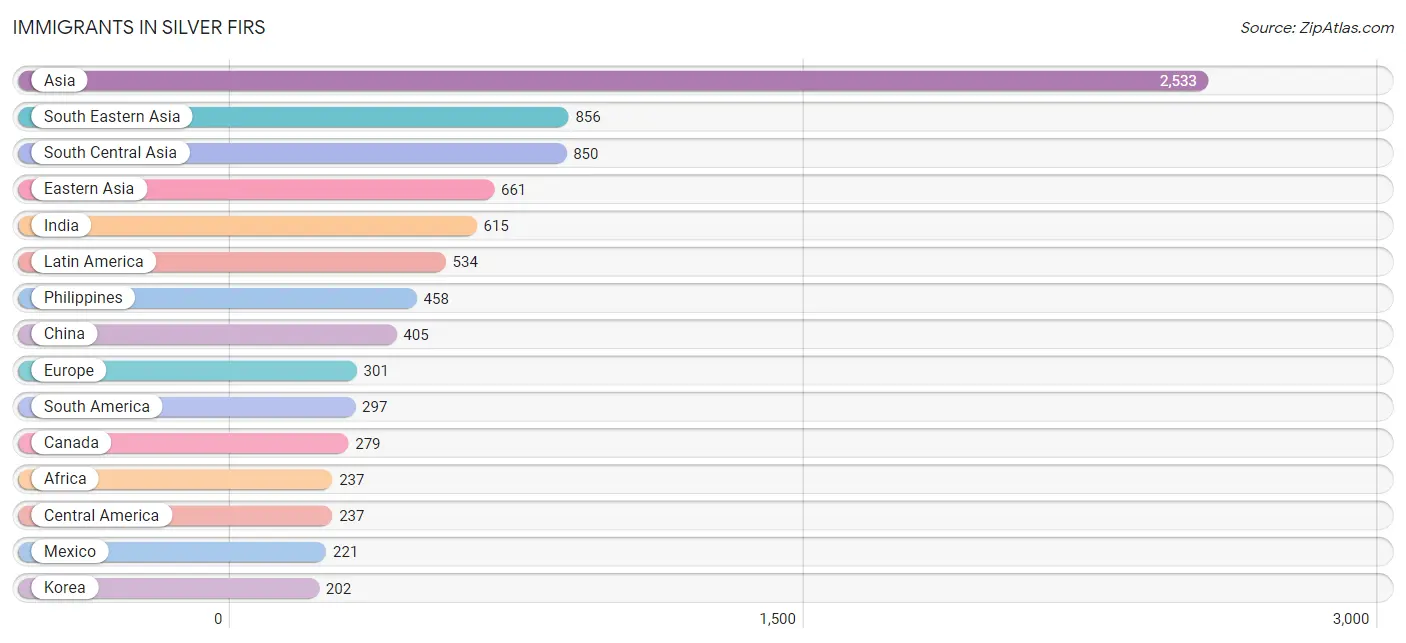
Immigrants in Silver Firs
The most numerous immigrant groups reported in Silver Firs came from Asia (2,533 | 11.4%), South Eastern Asia (856 | 3.8%), South Central Asia (850 | 3.8%), Eastern Asia (661 | 3.0%), and India (615 | 2.8%), together accounting for 24.8% of all Silver Firs residents.
| Immigration Origin | # Population | % Population |
| Africa | 237 | 1.1% |
| Argentina | 37 | 0.2% |
| Armenia | 87 | 0.4% |
| Asia | 2,533 | 11.4% |
| Bangladesh | 82 | 0.4% |
| Brazil | 32 | 0.1% |
| Cambodia | 164 | 0.7% |
| Canada | 279 | 1.3% |
| Central America | 237 | 1.1% |
| China | 405 | 1.8% |
| Colombia | 92 | 0.4% |
| Denmark | 58 | 0.3% |
| Eastern Africa | 37 | 0.2% |
| Eastern Asia | 661 | 3.0% |
| Eastern Europe | 136 | 0.6% |
| Ecuador | 27 | 0.1% |
| Egypt | 55 | 0.3% |
| England | 37 | 0.2% |
| Eritrea | 15 | 0.1% |
| Ethiopia | 14 | 0.1% |
| Europe | 301 | 1.3% |
| France | 24 | 0.1% |
| Hong Kong | 36 | 0.2% |
| India | 615 | 2.8% |
| Indonesia | 56 | 0.3% |
| Iran | 79 | 0.4% |
| Iraq | 61 | 0.3% |
| Israel | 6 | 0.0% |
| Japan | 54 | 0.2% |
| Kenya | 8 | 0.0% |
| Korea | 202 | 0.9% |
| Latin America | 534 | 2.4% |
| Mexico | 221 | 1.0% |
| Moldova | 11 | 0.1% |
| Morocco | 14 | 0.1% |
| Nigeria | 70 | 0.3% |
| Northern Africa | 102 | 0.5% |
| Northern Europe | 141 | 0.6% |
| Pakistan | 74 | 0.3% |
| Panama | 16 | 0.1% |
| Peru | 37 | 0.2% |
| Philippines | 458 | 2.1% |
| Poland | 18 | 0.1% |
| Romania | 41 | 0.2% |
| Russia | 38 | 0.2% |
| Senegal | 14 | 0.1% |
| South Africa | 14 | 0.1% |
| South America | 297 | 1.3% |
| South Central Asia | 850 | 3.8% |
| South Eastern Asia | 856 | 3.8% |
| Taiwan | 100 | 0.4% |
| Thailand | 37 | 0.2% |
| Turkey | 12 | 0.1% |
| Ukraine | 28 | 0.1% |
| Venezuela | 72 | 0.3% |
| Vietnam | 141 | 0.6% |
| Western Africa | 84 | 0.4% |
| Western Asia | 166 | 0.7% |
| Western Europe | 24 | 0.1% | View All 59 Rows |
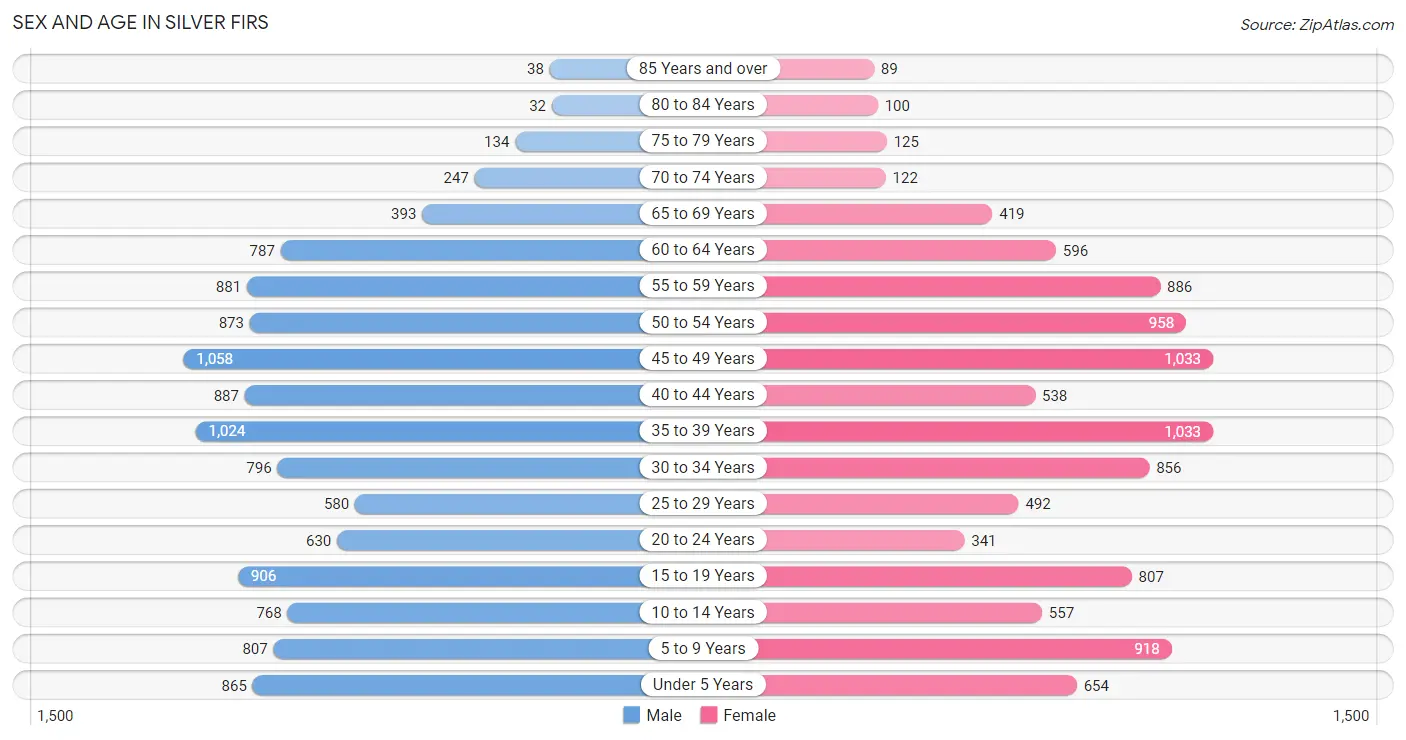
Sex and Age in Silver Firs
Sex and Age in Silver Firs
The most populous age groups in Silver Firs are 45 to 49 Years (1,058 | 9.0%) for men and 35 to 39 Years (1,033 | 9.8%) for women.
| Age Bracket | Male | Female |
| Under 5 Years | 865 (7.4%) | 654 (6.2%) |
| 5 to 9 Years | 807 (6.9%) | 918 (8.7%) |
| 10 to 14 Years | 768 (6.6%) | 557 (5.3%) |
| 15 to 19 Years | 906 (7.7%) | 807 (7.7%) |
| 20 to 24 Years | 630 (5.4%) | 341 (3.2%) |
| 25 to 29 Years | 580 (5.0%) | 492 (4.7%) |
| 30 to 34 Years | 796 (6.8%) | 856 (8.1%) |
| 35 to 39 Years | 1,024 (8.7%) | 1,033 (9.8%) |
| 40 to 44 Years | 887 (7.6%) | 538 (5.1%) |
| 45 to 49 Years | 1,058 (9.0%) | 1,033 (9.8%) |
| 50 to 54 Years | 873 (7.5%) | 958 (9.1%) |
| 55 to 59 Years | 881 (7.5%) | 886 (8.4%) |
| 60 to 64 Years | 787 (6.7%) | 596 (5.7%) |
| 65 to 69 Years | 393 (3.4%) | 419 (4.0%) |
| 70 to 74 Years | 247 (2.1%) | 122 (1.2%) |
| 75 to 79 Years | 134 (1.1%) | 125 (1.2%) |
| 80 to 84 Years | 32 (0.3%) | 100 (0.9%) |
| 85 Years and over | 38 (0.3%) | 89 (0.9%) |
| Total | 11,706 (100.0%) | 10,524 (100.0%) |
Families and Households in Silver Firs
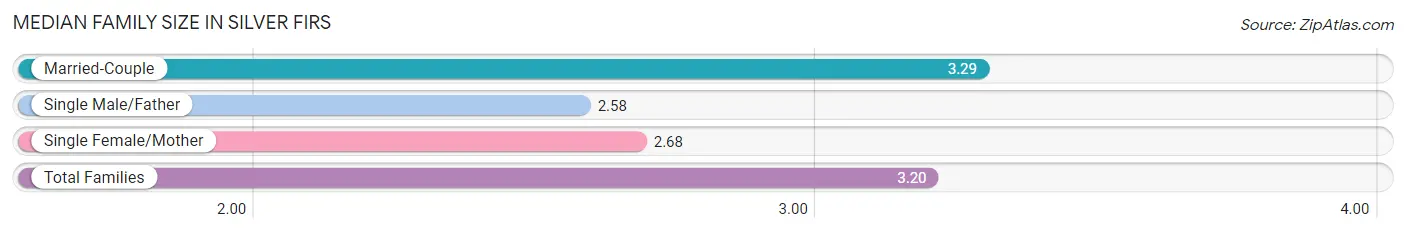
Median Family Size in Silver Firs
The median family size in Silver Firs is 3.20 persons per family, with married-couple families (5,316 | 86.1%) accounting for the largest median family size of 3.29 persons per family. On the other hand, single male/father families (186 | 3.0%) represent the smallest median family size with 2.58 persons per family.
| Family Type | # Families | Family Size |
| Married-Couple | 5,316 (86.1%) | 3.29 |
| Single Male/Father | 186 (3.0%) | 2.58 |
| Single Female/Mother | 672 (10.9%) | 2.68 |
| Total Families | 6,174 (100.0%) | 3.20 |
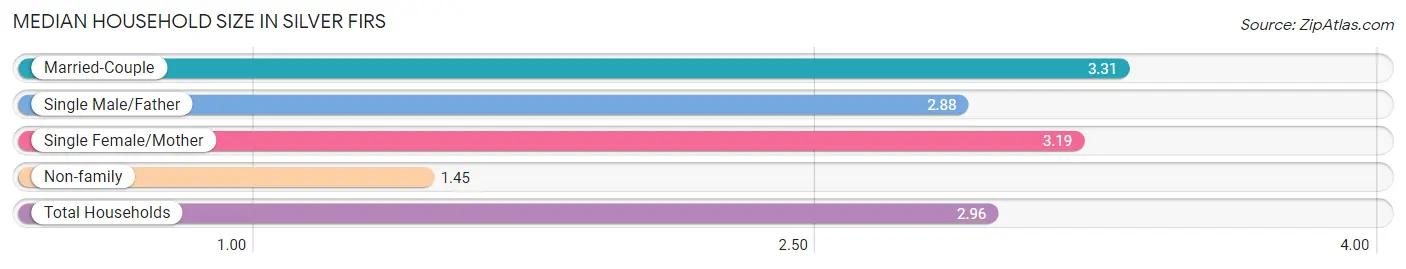
Median Household Size in Silver Firs
The median household size in Silver Firs is 2.96 persons per household, with married-couple households (5,316 | 71.0%) accounting for the largest median household size of 3.31 persons per household. non-family households (1,315 | 17.6%) represent the smallest median household size with 1.45 persons per household.
| Household Type | # Households | Household Size |
| Married-Couple | 5,316 (71.0%) | 3.31 |
| Single Male/Father | 186 (2.5%) | 2.88 |
| Single Female/Mother | 672 (9.0%) | 3.19 |
| Non-family | 1,315 (17.6%) | 1.45 |
| Total Households | 7,489 (100.0%) | 2.96 |
Household Size by Marriage Status in Silver Firs
Out of a total of 7,489 households in Silver Firs, 6,174 (82.4%) are family households, while 1,315 (17.6%) are nonfamily households. The most numerous type of family households are 2-person households, comprising 1,995, and the most common type of nonfamily households are 1-person households, comprising 926.
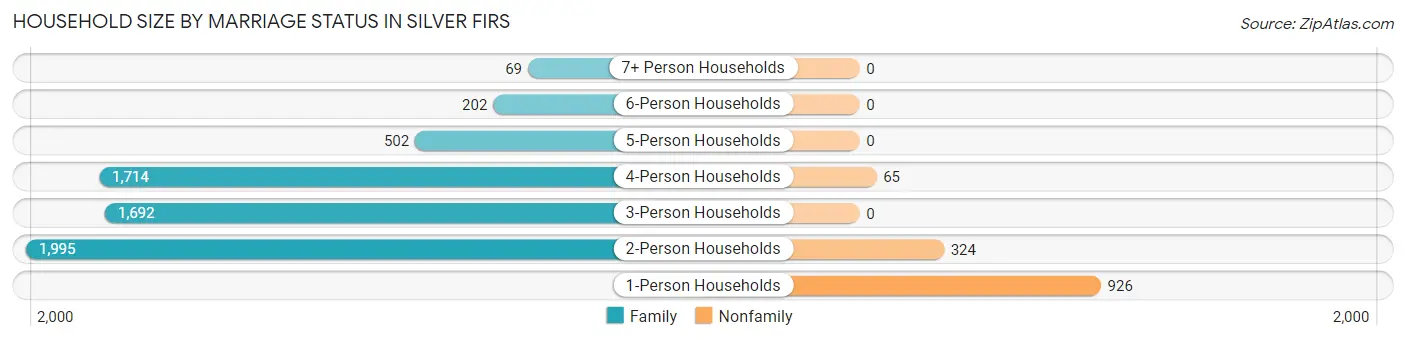
| Household Size | Family Households | Nonfamily Households |
| 1-Person Households | - | 926 (12.4%) |
| 2-Person Households | 1,995 (26.6%) | 324 (4.3%) |
| 3-Person Households | 1,692 (22.6%) | 0 (0.0%) |
| 4-Person Households | 1,714 (22.9%) | 65 (0.9%) |
| 5-Person Households | 502 (6.7%) | 0 (0.0%) |
| 6-Person Households | 202 (2.7%) | 0 (0.0%) |
| 7+ Person Households | 69 (0.9%) | 0 (0.0%) |
| Total | 6,174 (82.4%) | 1,315 (17.6%) |
Female Fertility in Silver Firs
Fertility by Age in Silver Firs
Average fertility rate in Silver Firs is 50.0 births per 1,000 women. Women in the age bracket of 20 to 34 years have the highest fertility rate with 97.0 births per 1,000 women. Women in the age bracket of 20 to 34 years acount for 60.6% of all women with births.
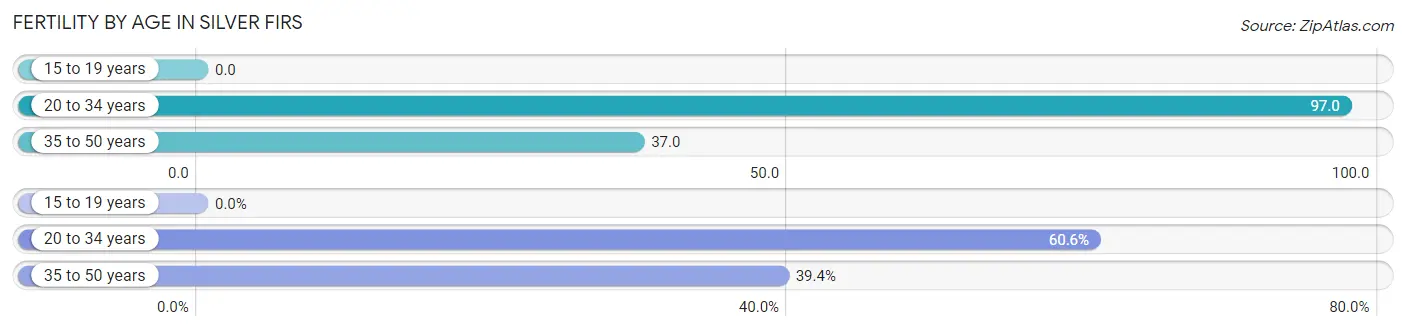
| Age Bracket | Women with Births | Births / 1,000 Women |
| 15 to 19 years | 0 (0.0%) | 0.0 |
| 20 to 34 years | 163 (60.6%) | 97.0 |
| 35 to 50 years | 106 (39.4%) | 37.0 |
| Total | 269 (100.0%) | 50.0 |
Fertility by Age by Marriage Status in Silver Firs
99.6% of women with births (269) in Silver Firs are married. The highest percentage of unmarried women with births falls into 20 to 34 years age bracket with 0.6% of them unmarried at the time of birth, while the lowest percentage of unmarried women with births belong to 35 to 50 years age bracket with 0.0% of them unmarried.
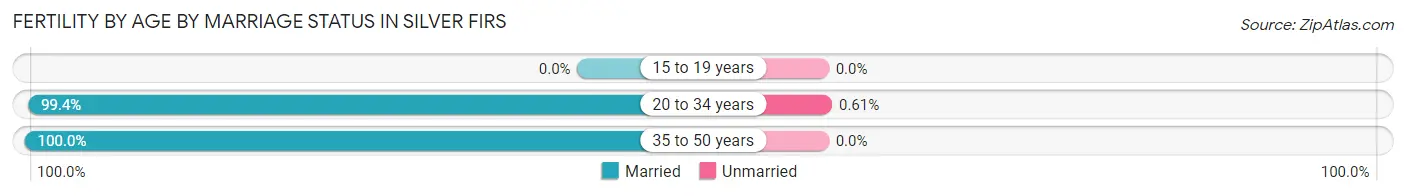
| Age Bracket | Married | Unmarried |
| 15 to 19 years | 0 (0.0%) | 0 (0.0%) |
| 20 to 34 years | 162 (99.4%) | 1 (0.6%) |
| 35 to 50 years | 106 (100.0%) | 0 (0.0%) |
| Total | 268 (99.6%) | 1 (0.4%) |
Fertility by Education in Silver Firs
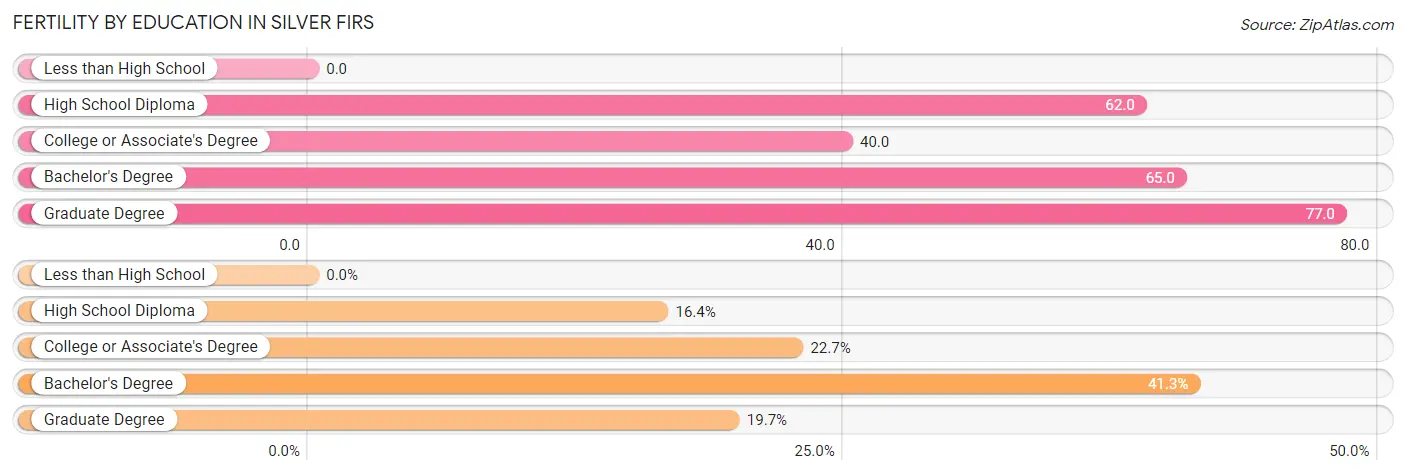
| Educational Attainment | Women with Births | Births / 1,000 Women |
| Less than High School | 0 (0.0%) | 0.0 |
| High School Diploma | 44 (16.4%) | 62.0 |
| College or Associate's Degree | 61 (22.7%) | 40.0 |
| Bachelor's Degree | 111 (41.3%) | 65.0 |
| Graduate Degree | 53 (19.7%) | 77.0 |
| Total | 269 (100.0%) | 50.0 |
Fertility by Education by Marriage Status in Silver Firs
0.4% of women with births in Silver Firs are unmarried. Women with the educational attainment of college or associate's degree are most likely to be married with 100.0% of them married at childbirth, while women with the educational attainment of high school diploma are least likely to be married with 2.3% of them unmarried at childbirth.
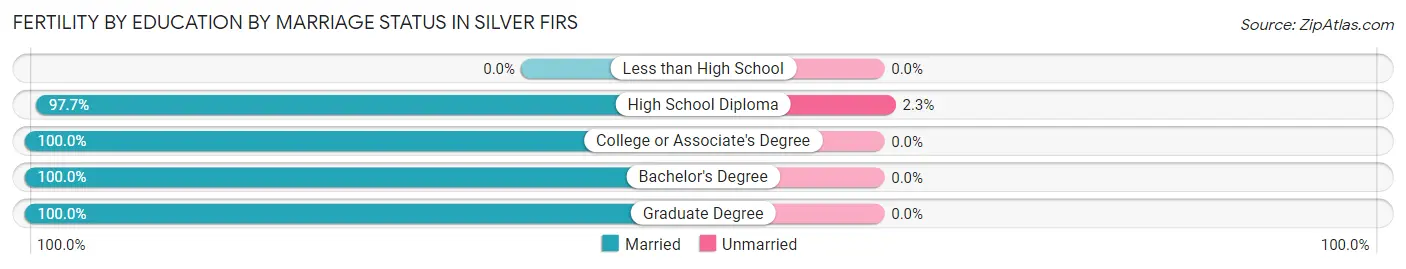
| Educational Attainment | Married | Unmarried |
| Less than High School | 0 (0.0%) | 0 (0.0%) |
| High School Diploma | 43 (97.7%) | 1 (2.3%) |
| College or Associate's Degree | 61 (100.0%) | 0 (0.0%) |
| Bachelor's Degree | 111 (100.0%) | 0 (0.0%) |
| Graduate Degree | 53 (100.0%) | 0 (0.0%) |
| Total | 268 (99.6%) | 1 (0.4%) |
Employment Characteristics in Silver Firs
Employment by Class of Employer in Silver Firs
Among the 12,010 employed individuals in Silver Firs, private company employees (9,328 | 77.7%), not-for-profit organizations (822 | 6.8%), and local government employees (634 | 5.3%) make up the most common classes of employment.
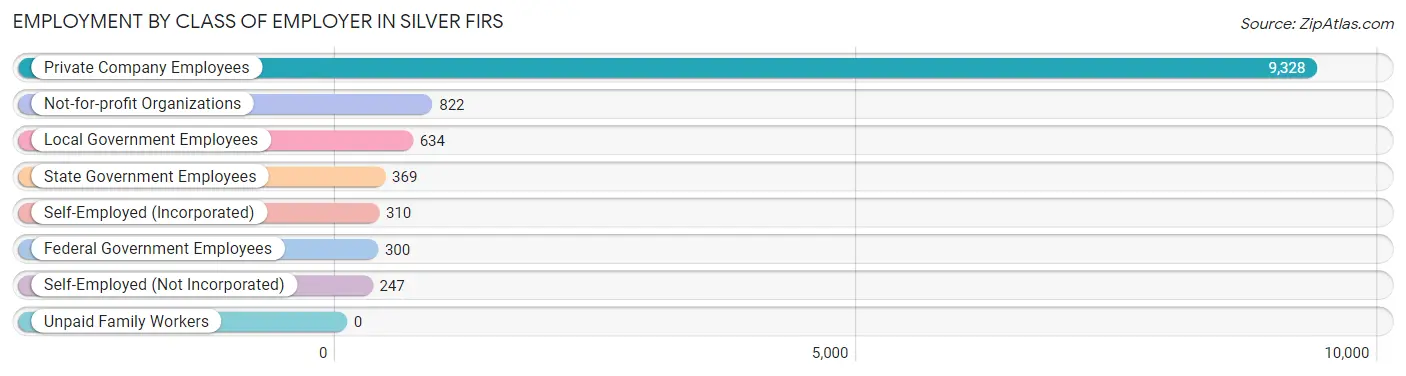
| Employer Class | # Employees | % Employees |
| Private Company Employees | 9,328 | 77.7% |
| Self-Employed (Incorporated) | 310 | 2.6% |
| Self-Employed (Not Incorporated) | 247 | 2.1% |
| Not-for-profit Organizations | 822 | 6.8% |
| Local Government Employees | 634 | 5.3% |
| State Government Employees | 369 | 3.1% |
| Federal Government Employees | 300 | 2.5% |
| Unpaid Family Workers | 0 | 0.0% |
| Total | 12,010 | 100.0% |
Employment Status by Age in Silver Firs
According to the labor force statistics for Silver Firs, out of the total population over 16 years of age (17,264), 73.7% or 12,724 individuals are in the labor force, with 2.9% or 369 of them unemployed. The age group with the highest labor force participation rate is 45 to 54 years, with 90.2% or 3,538 individuals in the labor force. Within the labor force, the 16 to 19 years age range has the highest percentage of unemployed individuals, with 15.1% or 63 of them being unemployed.
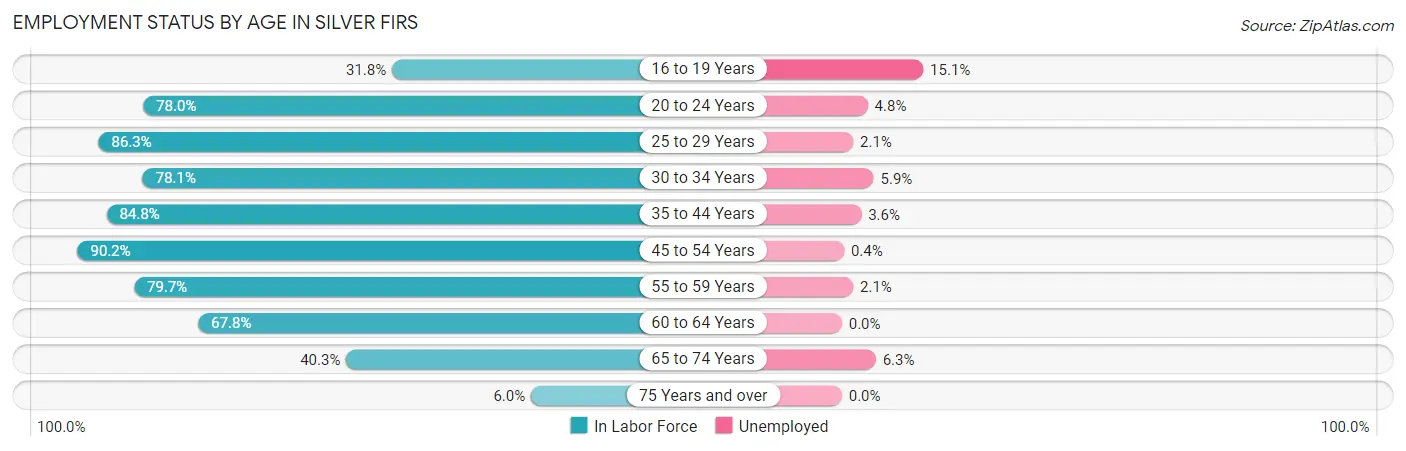
| Age Bracket | In Labor Force | Unemployed |
| 16 to 19 Years | 418 (31.8%) | 63 (15.1%) |
| 20 to 24 Years | 757 (78.0%) | 36 (4.8%) |
| 25 to 29 Years | 925 (86.3%) | 19 (2.1%) |
| 30 to 34 Years | 1,290 (78.1%) | 76 (5.9%) |
| 35 to 44 Years | 2,953 (84.8%) | 106 (3.6%) |
| 45 to 54 Years | 3,538 (90.2%) | 14 (0.4%) |
| 55 to 59 Years | 1,408 (79.7%) | 30 (2.1%) |
| 60 to 64 Years | 938 (67.8%) | 0 (0.0%) |
| 65 to 74 Years | 476 (40.3%) | 30 (6.3%) |
| 75 Years and over | 31 (6.0%) | 0 (0.0%) |
| Total | 12,724 (73.7%) | 369 (2.9%) |
Employment Status by Educational Attainment in Silver Firs
According to labor force statistics for Silver Firs, 83.2% of individuals (11,047) out of the total population between 25 and 64 years of age (13,278) are in the labor force, with 2.2% or 243 of them being unemployed. The group with the highest labor force participation rate are those with the educational attainment of bachelor's degree or higher, with 87.1% or 5,530 individuals in the labor force. Within the labor force, individuals with college / associate degree education have the highest percentage of unemployment, with 3.0% or 106 of them being unemployed.
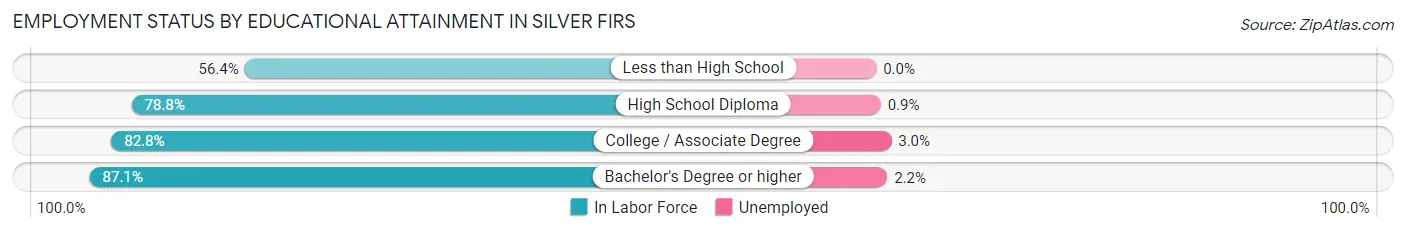
| Educational Attainment | In Labor Force | Unemployed |
| Less than High School | 272 (56.4%) | 0 (0.0%) |
| High School Diploma | 1,727 (78.8%) | 20 (0.9%) |
| College / Associate Degree | 3,523 (82.8%) | 128 (3.0%) |
| Bachelor's Degree or higher | 5,530 (87.1%) | 140 (2.2%) |
| Total | 11,047 (83.2%) | 292 (2.2%) |
Employment Occupations by Sex in Silver Firs
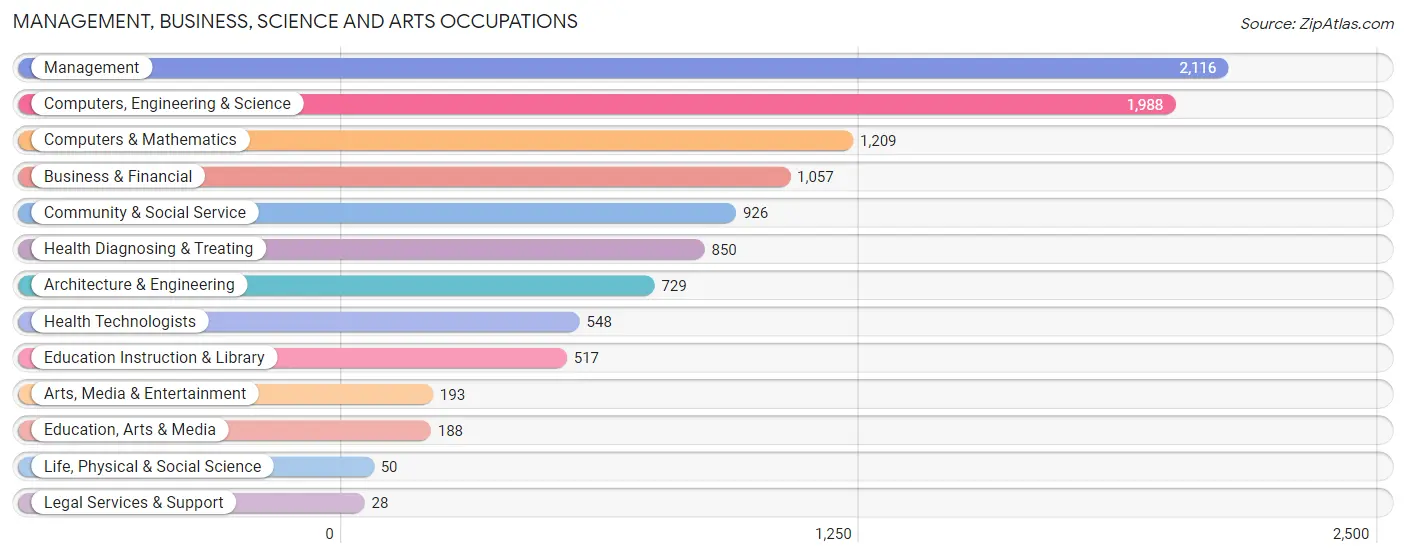
Management, Business, Science and Arts Occupations
The most common Management, Business, Science and Arts occupations in Silver Firs are Management (2,116 | 17.1%), Computers, Engineering & Science (1,988 | 16.1%), Computers & Mathematics (1,209 | 9.8%), Business & Financial (1,057 | 8.6%), and Community & Social Service (926 | 7.5%).
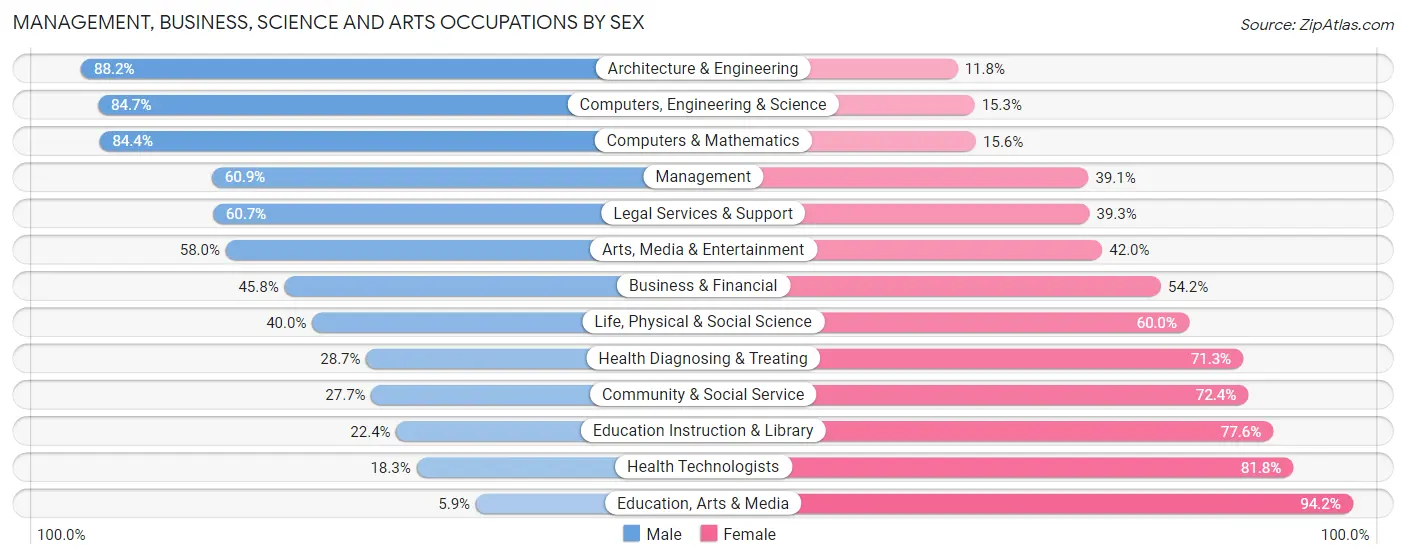
Management, Business, Science and Arts Occupations by Sex
Within the Management, Business, Science and Arts occupations in Silver Firs, the most male-oriented occupations are Architecture & Engineering (88.2%), Computers, Engineering & Science (84.7%), and Computers & Mathematics (84.4%), while the most female-oriented occupations are Education, Arts & Media (94.2%), Health Technologists (81.8%), and Education Instruction & Library (77.6%).
| Occupation | Male | Female |
| Management | 1,289 (60.9%) | 827 (39.1%) |
| Business & Financial | 484 (45.8%) | 573 (54.2%) |
| Computers, Engineering & Science | 1,683 (84.7%) | 305 (15.3%) |
| Computers & Mathematics | 1,020 (84.4%) | 189 (15.6%) |
| Architecture & Engineering | 643 (88.2%) | 86 (11.8%) |
| Life, Physical & Social Science | 20 (40.0%) | 30 (60.0%) |
| Community & Social Service | 256 (27.7%) | 670 (72.4%) |
| Education, Arts & Media | 11 (5.9%) | 177 (94.2%) |
| Legal Services & Support | 17 (60.7%) | 11 (39.3%) |
| Education Instruction & Library | 116 (22.4%) | 401 (77.6%) |
| Arts, Media & Entertainment | 112 (58.0%) | 81 (42.0%) |
| Health Diagnosing & Treating | 244 (28.7%) | 606 (71.3%) |
| Health Technologists | 100 (18.2%) | 448 (81.8%) |
| Total (Category) | 3,956 (57.0%) | 2,981 (43.0%) |
| Total (Overall) | 6,975 (56.4%) | 5,384 (43.6%) |
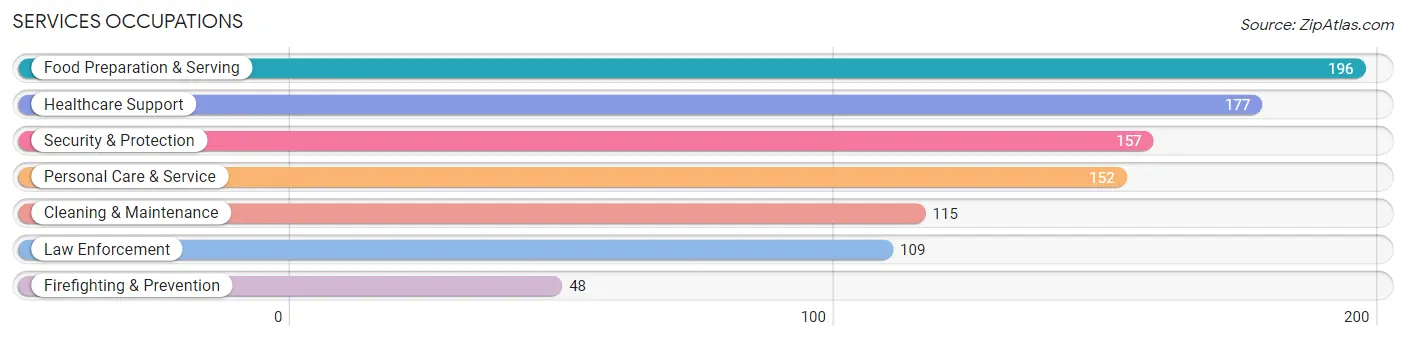
Services Occupations
The most common Services occupations in Silver Firs are Food Preparation & Serving (196 | 1.6%), Healthcare Support (177 | 1.4%), Security & Protection (157 | 1.3%), Personal Care & Service (152 | 1.2%), and Cleaning & Maintenance (115 | 0.9%).
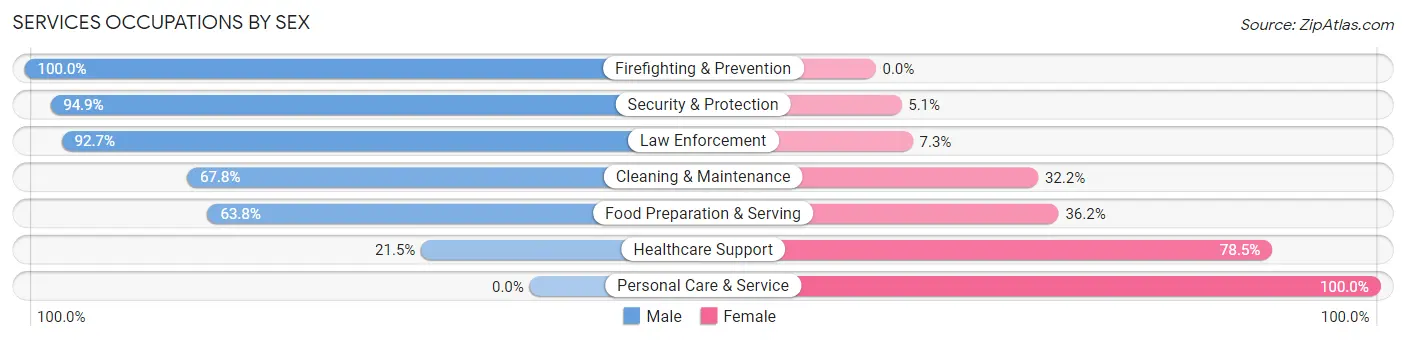
Services Occupations by Sex
Within the Services occupations in Silver Firs, the most male-oriented occupations are Firefighting & Prevention (100.0%), Security & Protection (94.9%), and Law Enforcement (92.7%), while the most female-oriented occupations are Personal Care & Service (100.0%), Healthcare Support (78.5%), and Food Preparation & Serving (36.2%).
| Occupation | Male | Female |
| Healthcare Support | 38 (21.5%) | 139 (78.5%) |
| Security & Protection | 149 (94.9%) | 8 (5.1%) |
| Firefighting & Prevention | 48 (100.0%) | 0 (0.0%) |
| Law Enforcement | 101 (92.7%) | 8 (7.3%) |
| Food Preparation & Serving | 125 (63.8%) | 71 (36.2%) |
| Cleaning & Maintenance | 78 (67.8%) | 37 (32.2%) |
| Personal Care & Service | 0 (0.0%) | 152 (100.0%) |
| Total (Category) | 390 (48.9%) | 407 (51.1%) |
| Total (Overall) | 6,975 (56.4%) | 5,384 (43.6%) |
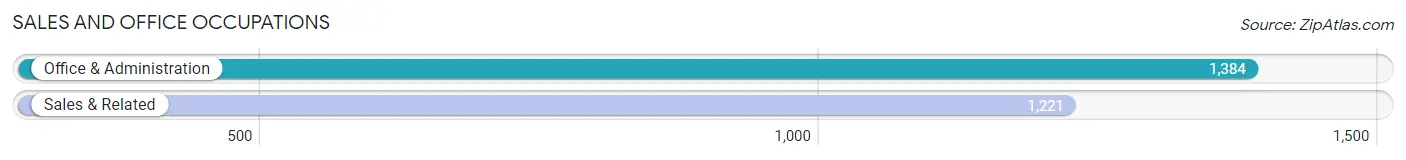
Sales and Office Occupations
The most common Sales and Office occupations in Silver Firs are Office & Administration (1,384 | 11.2%), and Sales & Related (1,221 | 9.9%).
Sales and Office Occupations by Sex
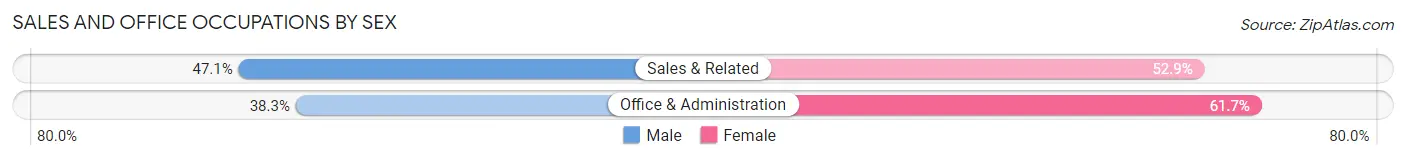
| Occupation | Male | Female |
| Sales & Related | 575 (47.1%) | 646 (52.9%) |
| Office & Administration | 530 (38.3%) | 854 (61.7%) |
| Total (Category) | 1,105 (42.4%) | 1,500 (57.6%) |
| Total (Overall) | 6,975 (56.4%) | 5,384 (43.6%) |
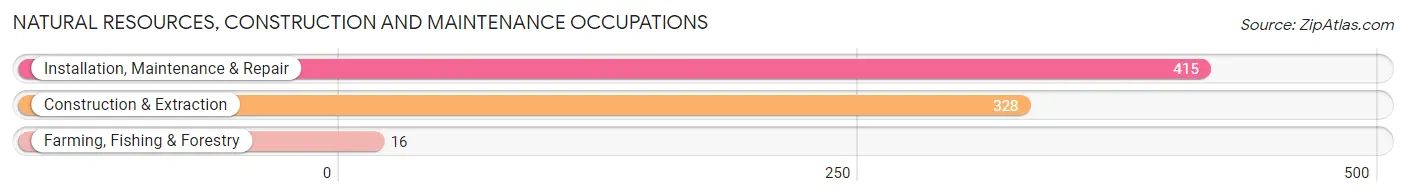
Natural Resources, Construction and Maintenance Occupations
The most common Natural Resources, Construction and Maintenance occupations in Silver Firs are Installation, Maintenance & Repair (415 | 3.4%), Construction & Extraction (328 | 2.6%), and Farming, Fishing & Forestry (16 | 0.1%).
Natural Resources, Construction and Maintenance Occupations by Sex
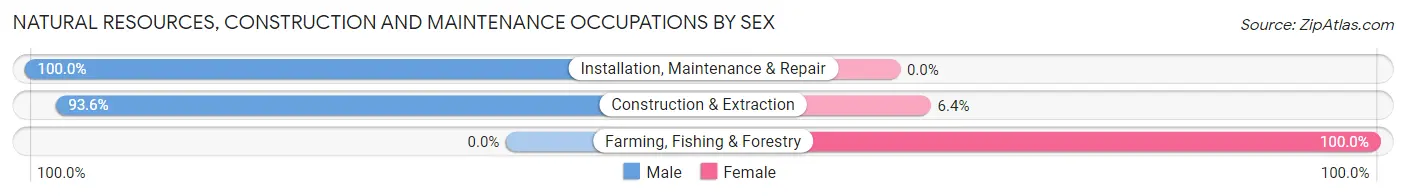
| Occupation | Male | Female |
| Farming, Fishing & Forestry | 0 (0.0%) | 16 (100.0%) |
| Construction & Extraction | 307 (93.6%) | 21 (6.4%) |
| Installation, Maintenance & Repair | 415 (100.0%) | 0 (0.0%) |
| Total (Category) | 722 (95.1%) | 37 (4.9%) |
| Total (Overall) | 6,975 (56.4%) | 5,384 (43.6%) |
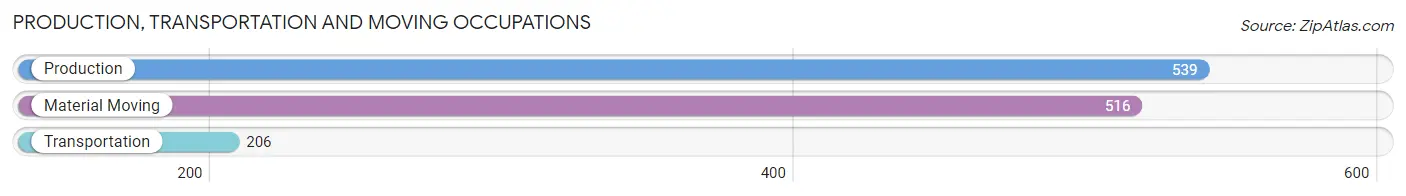
Production, Transportation and Moving Occupations
The most common Production, Transportation and Moving occupations in Silver Firs are Production (539 | 4.4%), Material Moving (516 | 4.2%), and Transportation (206 | 1.7%).
Production, Transportation and Moving Occupations by Sex
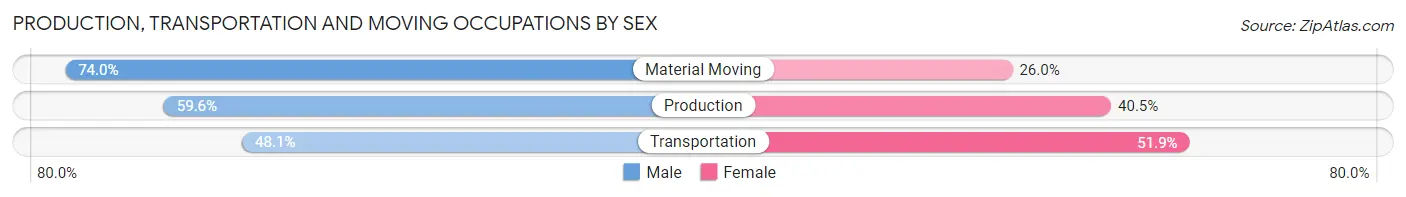
| Occupation | Male | Female |
| Production | 321 (59.6%) | 218 (40.5%) |
| Transportation | 99 (48.1%) | 107 (51.9%) |
| Material Moving | 382 (74.0%) | 134 (26.0%) |
| Total (Category) | 802 (63.6%) | 459 (36.4%) |
| Total (Overall) | 6,975 (56.4%) | 5,384 (43.6%) |
Employment Industries by Sex in Silver Firs
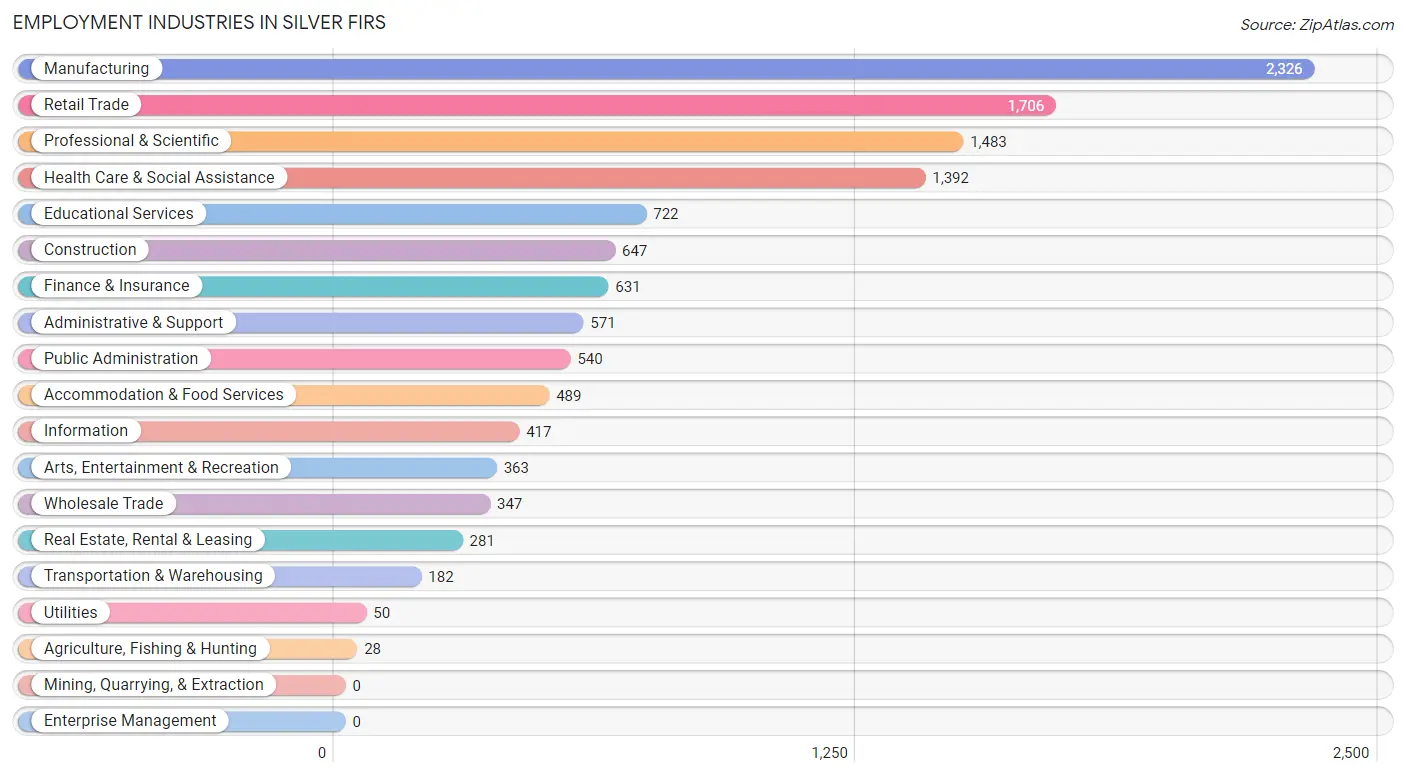
Employment Industries in Silver Firs
The major employment industries in Silver Firs include Manufacturing (2,326 | 18.8%), Retail Trade (1,706 | 13.8%), Professional & Scientific (1,483 | 12.0%), Health Care & Social Assistance (1,392 | 11.3%), and Educational Services (722 | 5.8%).
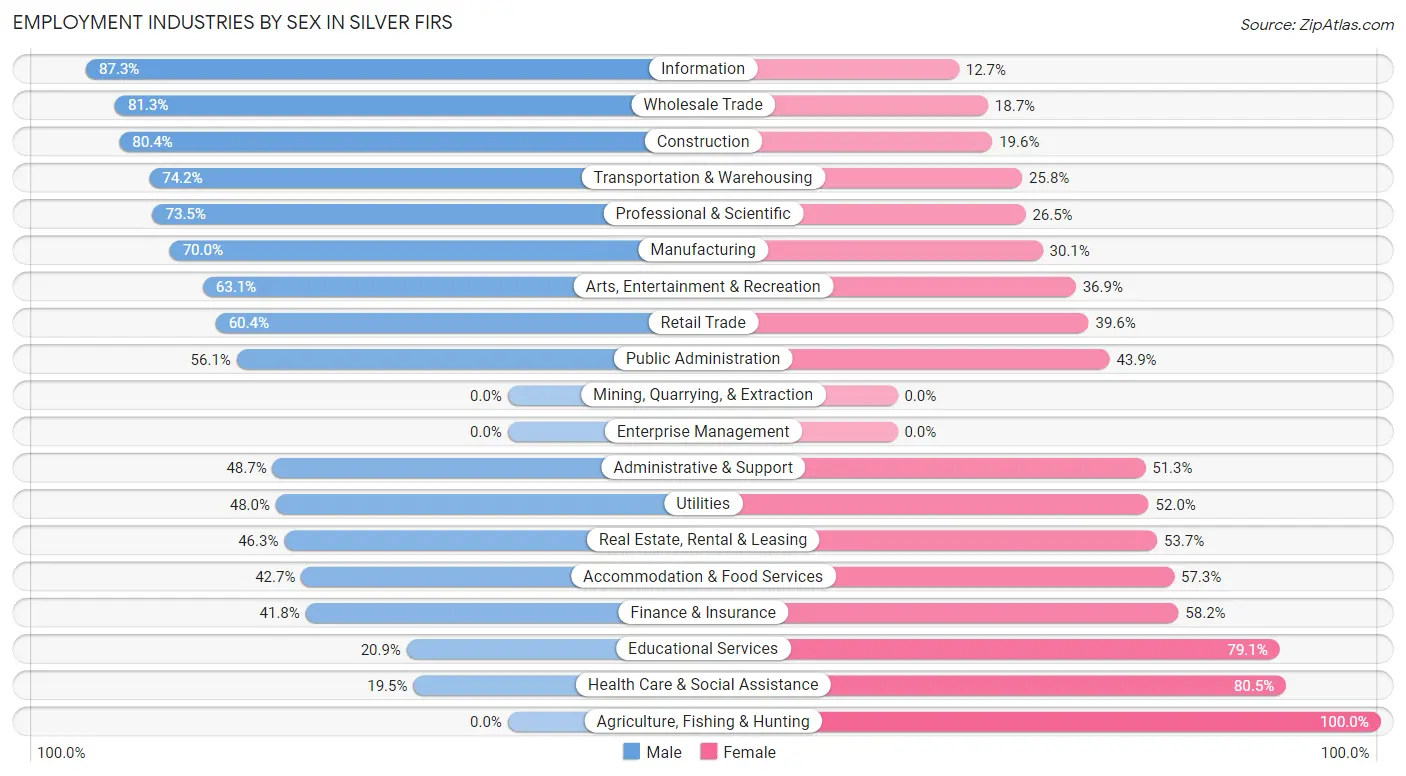
Employment Industries by Sex in Silver Firs
The Silver Firs industries that see more men than women are Information (87.3%), Wholesale Trade (81.3%), and Construction (80.4%), whereas the industries that tend to have a higher number of women are Agriculture, Fishing & Hunting (100.0%), Health Care & Social Assistance (80.5%), and Educational Services (79.1%).
| Industry | Male | Female |
| Agriculture, Fishing & Hunting | 0 (0.0%) | 28 (100.0%) |
| Mining, Quarrying, & Extraction | 0 (0.0%) | 0 (0.0%) |
| Construction | 520 (80.4%) | 127 (19.6%) |
| Manufacturing | 1,627 (70.0%) | 699 (30.0%) |
| Wholesale Trade | 282 (81.3%) | 65 (18.7%) |
| Retail Trade | 1,031 (60.4%) | 675 (39.6%) |
| Transportation & Warehousing | 135 (74.2%) | 47 (25.8%) |
| Utilities | 24 (48.0%) | 26 (52.0%) |
| Information | 364 (87.3%) | 53 (12.7%) |
| Finance & Insurance | 264 (41.8%) | 367 (58.2%) |
| Real Estate, Rental & Leasing | 130 (46.3%) | 151 (53.7%) |
| Professional & Scientific | 1,090 (73.5%) | 393 (26.5%) |
| Enterprise Management | 0 (0.0%) | 0 (0.0%) |
| Administrative & Support | 278 (48.7%) | 293 (51.3%) |
| Educational Services | 151 (20.9%) | 571 (79.1%) |
| Health Care & Social Assistance | 272 (19.5%) | 1,120 (80.5%) |
| Arts, Entertainment & Recreation | 229 (63.1%) | 134 (36.9%) |
| Accommodation & Food Services | 209 (42.7%) | 280 (57.3%) |
| Public Administration | 303 (56.1%) | 237 (43.9%) |
| Total | 6,975 (56.4%) | 5,384 (43.6%) |
Education in Silver Firs
School Enrollment in Silver Firs
The most common levels of schooling among the 6,247 students in Silver Firs are high school (1,469 | 23.5%), elementary school (1,309 | 20.9%), and college / undergraduate (1,140 | 18.2%).
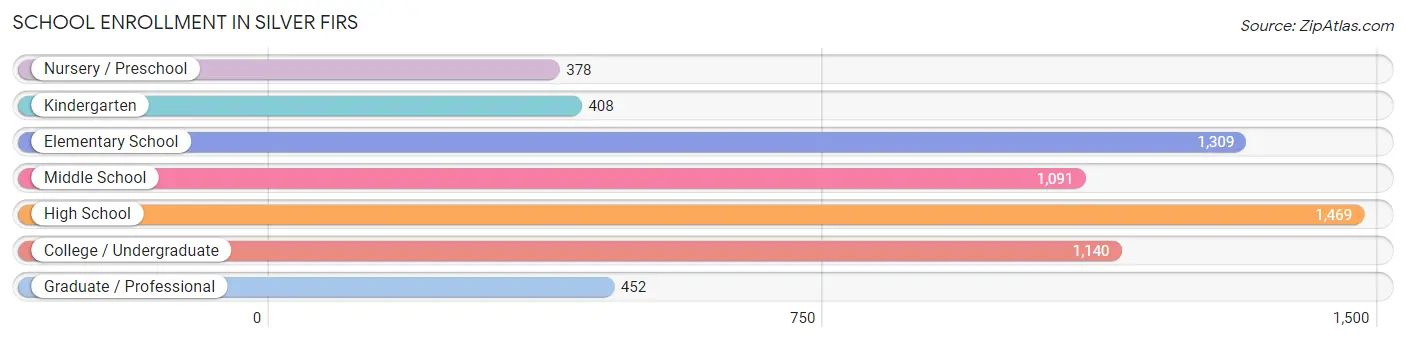
| School Level | # Students | % Students |
| Nursery / Preschool | 378 | 6.0% |
| Kindergarten | 408 | 6.5% |
| Elementary School | 1,309 | 20.9% |
| Middle School | 1,091 | 17.5% |
| High School | 1,469 | 23.5% |
| College / Undergraduate | 1,140 | 18.2% |
| Graduate / Professional | 452 | 7.2% |
| Total | 6,247 | 100.0% |
School Enrollment by Age by Funding Source in Silver Firs
Out of a total of 6,247 students who are enrolled in schools in Silver Firs, 1,012 (16.2%) attend a private institution, while the remaining 5,235 (83.8%) are enrolled in public schools. The age group of 3 to 4 year olds has the highest likelihood of being enrolled in private schools, with 167 (61.4% in the age bracket) enrolled. Conversely, the age group of 15 to 17 year olds has the lowest likelihood of being enrolled in a private school, with 1,021 (96.1% in the age bracket) attending a public institution.
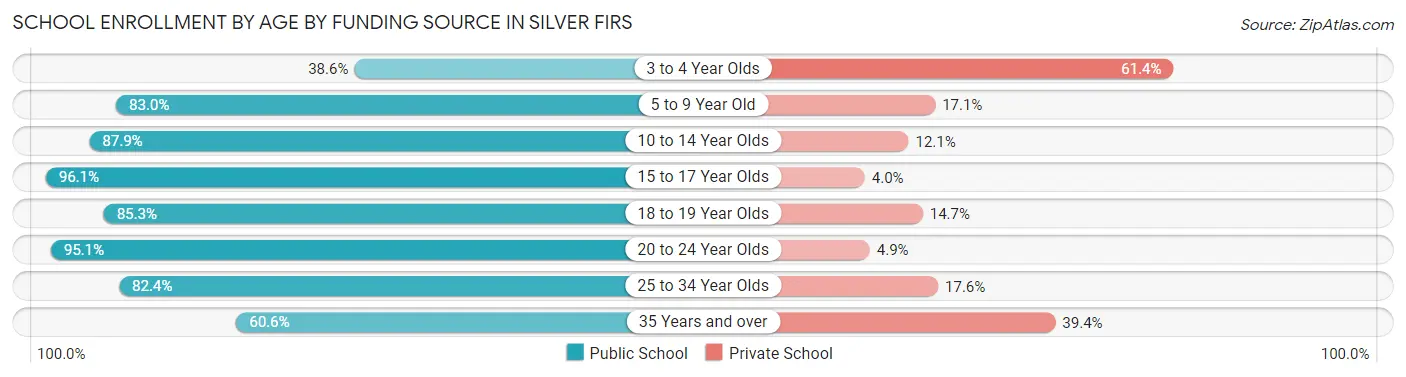
| Age Bracket | Public School | Private School |
| 3 to 4 Year Olds | 105 (38.6%) | 167 (61.4%) |
| 5 to 9 Year Old | 1,377 (83.0%) | 283 (17.1%) |
| 10 to 14 Year Olds | 1,135 (87.9%) | 156 (12.1%) |
| 15 to 17 Year Olds | 1,021 (96.1%) | 42 (4.0%) |
| 18 to 19 Year Olds | 515 (85.3%) | 89 (14.7%) |
| 20 to 24 Year Olds | 487 (95.1%) | 25 (4.9%) |
| 25 to 34 Year Olds | 314 (82.4%) | 67 (17.6%) |
| 35 Years and over | 281 (60.6%) | 183 (39.4%) |
| Total | 5,235 (83.8%) | 1,012 (16.2%) |
Educational Attainment by Field of Study in Silver Firs
Business (1,656 | 21.2%), engineering (1,095 | 14.0%), science & technology (790 | 10.1%), computers & mathematics (542 | 7.0%), and bio, nature & agricultural (447 | 5.7%) are the most common fields of study among 7,804 individuals in Silver Firs who have obtained a bachelor's degree or higher.
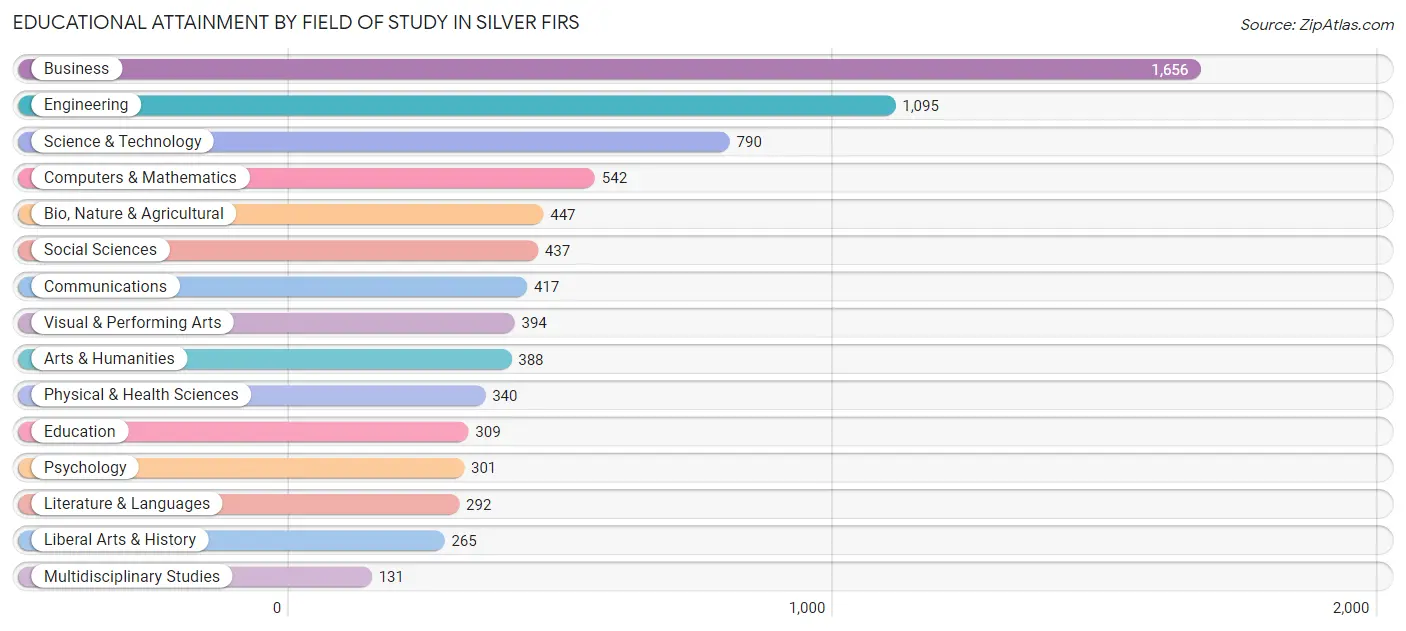
| Field of Study | # Graduates | % Graduates |
| Computers & Mathematics | 542 | 7.0% |
| Bio, Nature & Agricultural | 447 | 5.7% |
| Physical & Health Sciences | 340 | 4.4% |
| Psychology | 301 | 3.9% |
| Social Sciences | 437 | 5.6% |
| Engineering | 1,095 | 14.0% |
| Multidisciplinary Studies | 131 | 1.7% |
| Science & Technology | 790 | 10.1% |
| Business | 1,656 | 21.2% |
| Education | 309 | 4.0% |
| Literature & Languages | 292 | 3.7% |
| Liberal Arts & History | 265 | 3.4% |
| Visual & Performing Arts | 394 | 5.1% |
| Communications | 417 | 5.3% |
| Arts & Humanities | 388 | 5.0% |
| Total | 7,804 | 100.0% |
Transportation & Commute in Silver Firs
Vehicle Availability by Sex in Silver Firs
The most prevalent vehicle ownership categories in Silver Firs are males with 2 vehicles (2,886, accounting for 42.4%) and females with 2 vehicles (2,271, making up 55.5%).
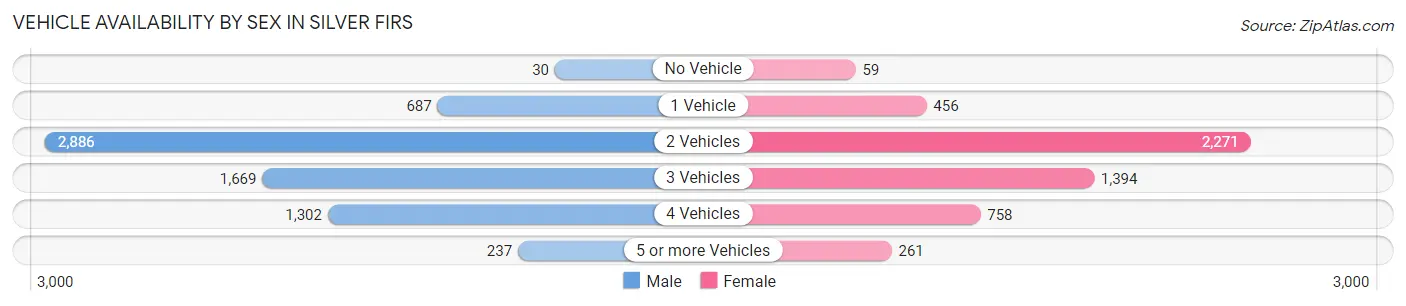
| Vehicles Available | Male | Female |
| No Vehicle | 30 (0.4%) | 59 (1.1%) |
| 1 Vehicle | 687 (10.1%) | 456 (8.8%) |
| 2 Vehicles | 2,886 (42.4%) | 2,271 (43.7%) |
| 3 Vehicles | 1,669 (24.5%) | 1,394 (26.8%) |
| 4 Vehicles | 1,302 (19.1%) | 758 (14.6%) |
| 5 or more Vehicles | 237 (3.5%) | 261 (5.0%) |
| Total | 6,811 (100.0%) | 5,199 (100.0%) |
Commute Time in Silver Firs
The most frequently occuring commute durations in Silver Firs are 30 to 34 minutes (1,723 commuters, 18.3%), 20 to 24 minutes (1,654 commuters, 17.6%), and 60 to 89 minutes (1,086 commuters, 11.6%).
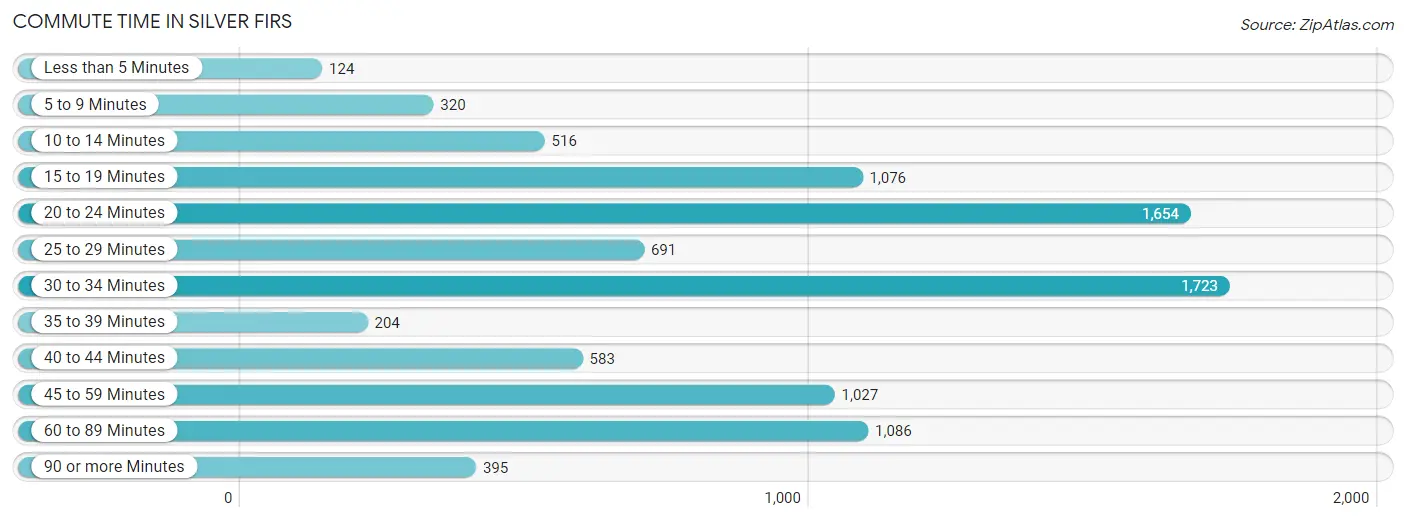
| Commute Time | # Commuters | % Commuters |
| Less than 5 Minutes | 124 | 1.3% |
| 5 to 9 Minutes | 320 | 3.4% |
| 10 to 14 Minutes | 516 | 5.5% |
| 15 to 19 Minutes | 1,076 | 11.5% |
| 20 to 24 Minutes | 1,654 | 17.6% |
| 25 to 29 Minutes | 691 | 7.3% |
| 30 to 34 Minutes | 1,723 | 18.3% |
| 35 to 39 Minutes | 204 | 2.2% |
| 40 to 44 Minutes | 583 | 6.2% |
| 45 to 59 Minutes | 1,027 | 10.9% |
| 60 to 89 Minutes | 1,086 | 11.6% |
| 90 or more Minutes | 395 | 4.2% |
Commute Time by Sex in Silver Firs
The most common commute times in Silver Firs are 30 to 34 minutes (951 commuters, 18.0%) for males and 20 to 24 minutes (781 commuters, 19.0%) for females.
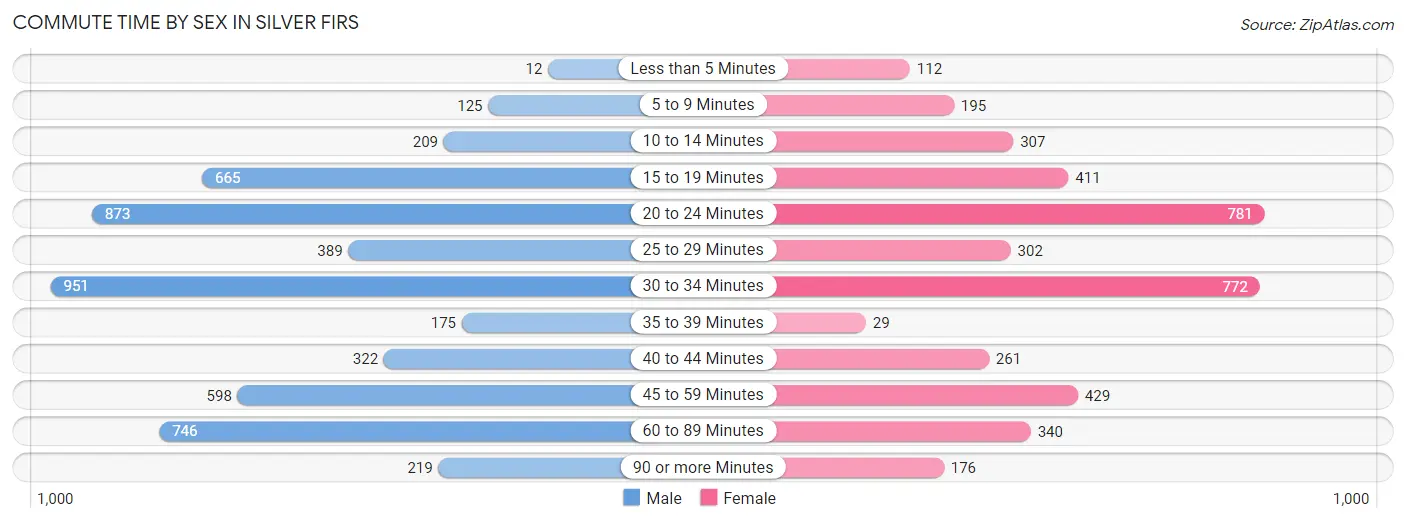
| Commute Time | Male | Female |
| Less than 5 Minutes | 12 (0.2%) | 112 (2.7%) |
| 5 to 9 Minutes | 125 (2.4%) | 195 (4.7%) |
| 10 to 14 Minutes | 209 (4.0%) | 307 (7.5%) |
| 15 to 19 Minutes | 665 (12.6%) | 411 (10.0%) |
| 20 to 24 Minutes | 873 (16.5%) | 781 (19.0%) |
| 25 to 29 Minutes | 389 (7.4%) | 302 (7.3%) |
| 30 to 34 Minutes | 951 (18.0%) | 772 (18.8%) |
| 35 to 39 Minutes | 175 (3.3%) | 29 (0.7%) |
| 40 to 44 Minutes | 322 (6.1%) | 261 (6.3%) |
| 45 to 59 Minutes | 598 (11.3%) | 429 (10.4%) |
| 60 to 89 Minutes | 746 (14.1%) | 340 (8.3%) |
| 90 or more Minutes | 219 (4.1%) | 176 (4.3%) |
Time of Departure to Work by Sex in Silver Firs
The most frequent times of departure to work in Silver Firs are 7:00 AM to 7:29 AM (792, 15.0%) for males and 7:30 AM to 7:59 AM (466, 11.3%) for females.
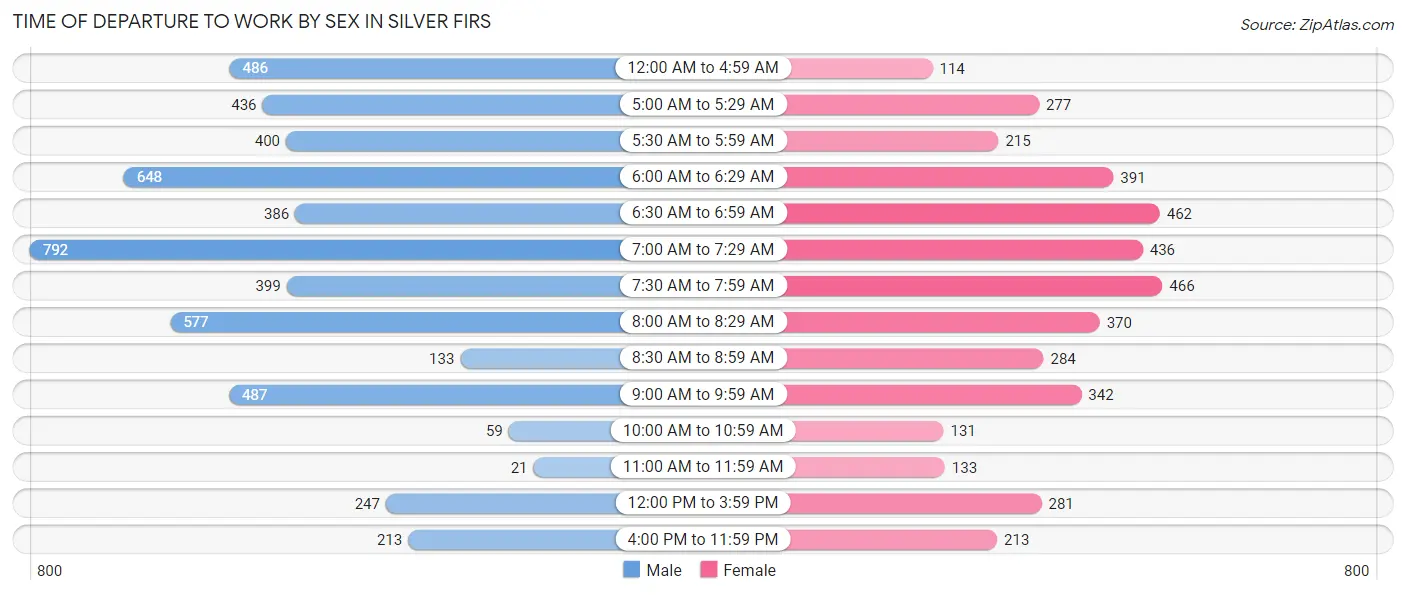
| Time of Departure | Male | Female |
| 12:00 AM to 4:59 AM | 486 (9.2%) | 114 (2.8%) |
| 5:00 AM to 5:29 AM | 436 (8.3%) | 277 (6.7%) |
| 5:30 AM to 5:59 AM | 400 (7.6%) | 215 (5.2%) |
| 6:00 AM to 6:29 AM | 648 (12.3%) | 391 (9.5%) |
| 6:30 AM to 6:59 AM | 386 (7.3%) | 462 (11.2%) |
| 7:00 AM to 7:29 AM | 792 (15.0%) | 436 (10.6%) |
| 7:30 AM to 7:59 AM | 399 (7.5%) | 466 (11.3%) |
| 8:00 AM to 8:29 AM | 577 (10.9%) | 370 (9.0%) |
| 8:30 AM to 8:59 AM | 133 (2.5%) | 284 (6.9%) |
| 9:00 AM to 9:59 AM | 487 (9.2%) | 342 (8.3%) |
| 10:00 AM to 10:59 AM | 59 (1.1%) | 131 (3.2%) |
| 11:00 AM to 11:59 AM | 21 (0.4%) | 133 (3.2%) |
| 12:00 PM to 3:59 PM | 247 (4.7%) | 281 (6.8%) |
| 4:00 PM to 11:59 PM | 213 (4.0%) | 213 (5.2%) |
| Total | 5,284 (100.0%) | 4,115 (100.0%) |
Housing Occupancy in Silver Firs
Occupancy by Ownership in Silver Firs
Of the total 7,489 dwellings in Silver Firs, owner-occupied units account for 6,733 (89.9%), while renter-occupied units make up 756 (10.1%).
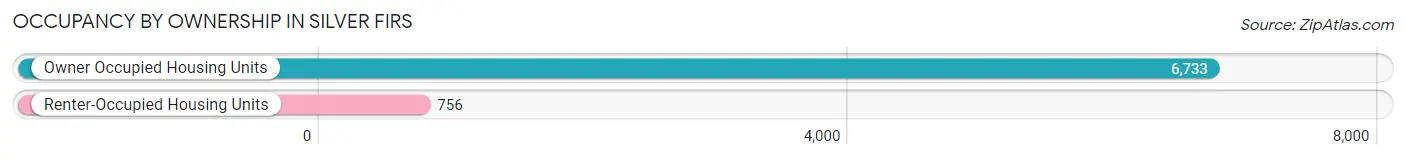
| Occupancy | # Housing Units | % Housing Units |
| Owner Occupied Housing Units | 6,733 | 89.9% |
| Renter-Occupied Housing Units | 756 | 10.1% |
| Total Occupied Housing Units | 7,489 | 100.0% |
Occupancy by Household Size in Silver Firs
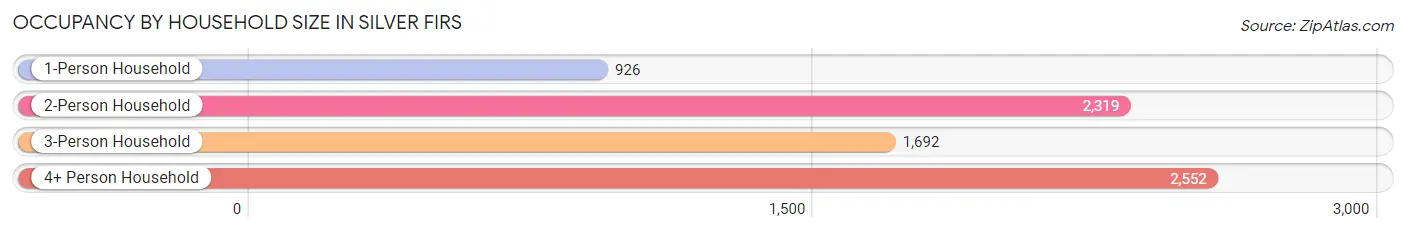
| Household Size | # Housing Units | % Housing Units |
| 1-Person Household | 926 | 12.4% |
| 2-Person Household | 2,319 | 31.0% |
| 3-Person Household | 1,692 | 22.6% |
| 4+ Person Household | 2,552 | 34.1% |
| Total Housing Units | 7,489 | 100.0% |
Occupancy by Ownership by Household Size in Silver Firs
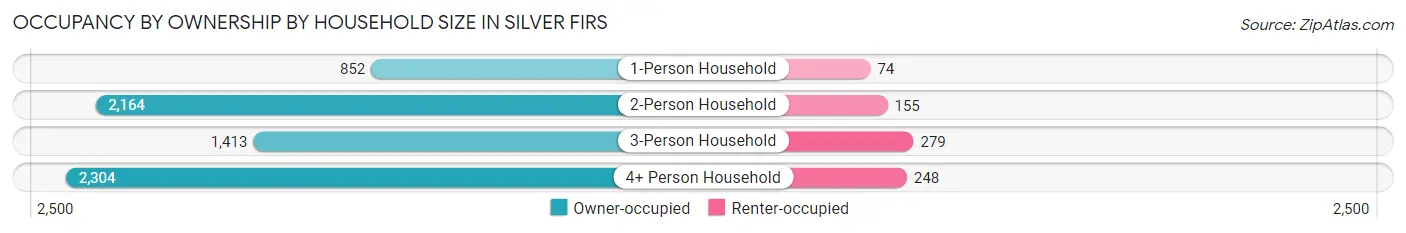
| Household Size | Owner-occupied | Renter-occupied |
| 1-Person Household | 852 (92.0%) | 74 (8.0%) |
| 2-Person Household | 2,164 (93.3%) | 155 (6.7%) |
| 3-Person Household | 1,413 (83.5%) | 279 (16.5%) |
| 4+ Person Household | 2,304 (90.3%) | 248 (9.7%) |
| Total Housing Units | 6,733 (89.9%) | 756 (10.1%) |
Occupancy by Educational Attainment in Silver Firs
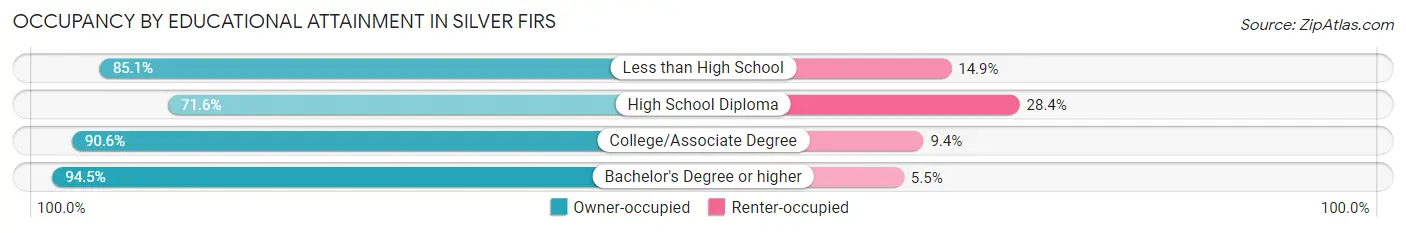
| Household Size | Owner-occupied | Renter-occupied |
| Less than High School | 177 (85.1%) | 31 (14.9%) |
| High School Diploma | 717 (71.6%) | 285 (28.4%) |
| College/Associate Degree | 2,213 (90.6%) | 229 (9.4%) |
| Bachelor's Degree or higher | 3,626 (94.5%) | 211 (5.5%) |
Occupancy by Age of Householder in Silver Firs
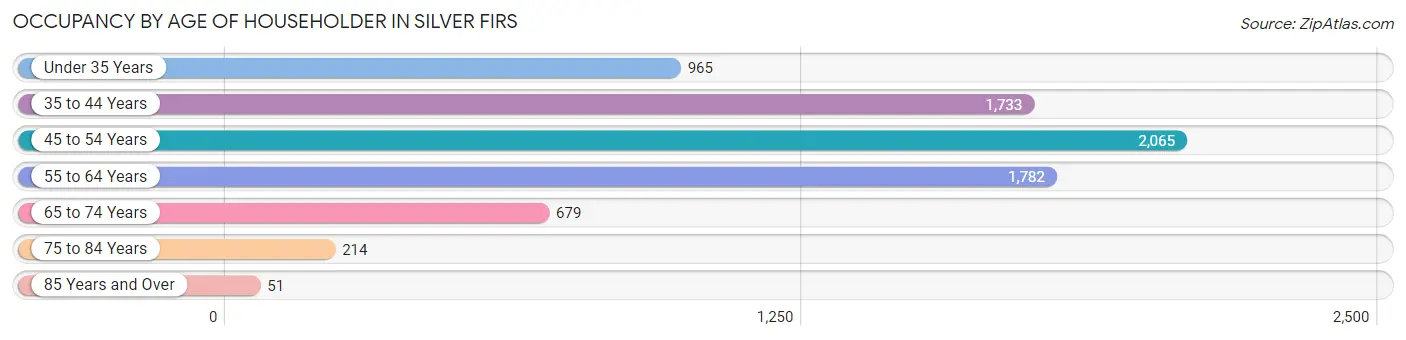
| Age Bracket | # Households | % Households |
| Under 35 Years | 965 | 12.9% |
| 35 to 44 Years | 1,733 | 23.1% |
| 45 to 54 Years | 2,065 | 27.6% |
| 55 to 64 Years | 1,782 | 23.8% |
| 65 to 74 Years | 679 | 9.1% |
| 75 to 84 Years | 214 | 2.9% |
| 85 Years and Over | 51 | 0.7% |
| Total | 7,489 | 100.0% |
Housing Finances in Silver Firs
Median Income by Occupancy in Silver Firs
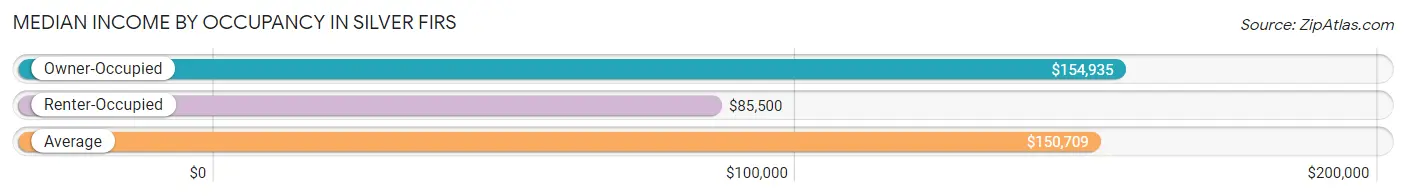
| Occupancy Type | # Households | Median Income |
| Owner-Occupied | 6,733 (89.9%) | $154,935 |
| Renter-Occupied | 756 (10.1%) | $85,500 |
| Average | 7,489 (100.0%) | $150,709 |
Occupancy by Householder Income Bracket in Silver Firs
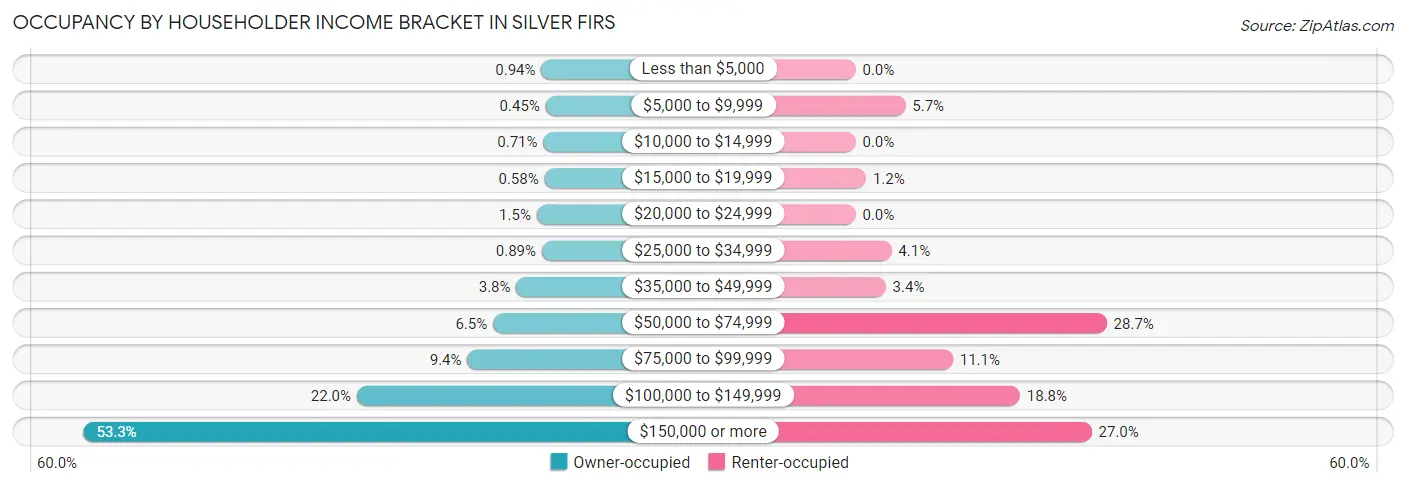
| Income Bracket | Owner-occupied | Renter-occupied |
| Less than $5,000 | 63 (0.9%) | 0 (0.0%) |
| $5,000 to $9,999 | 30 (0.4%) | 43 (5.7%) |
| $10,000 to $14,999 | 48 (0.7%) | 0 (0.0%) |
| $15,000 to $19,999 | 39 (0.6%) | 9 (1.2%) |
| $20,000 to $24,999 | 99 (1.5%) | 0 (0.0%) |
| $25,000 to $34,999 | 60 (0.9%) | 31 (4.1%) |
| $35,000 to $49,999 | 256 (3.8%) | 26 (3.4%) |
| $50,000 to $74,999 | 435 (6.5%) | 217 (28.7%) |
| $75,000 to $99,999 | 633 (9.4%) | 84 (11.1%) |
| $100,000 to $149,999 | 1,483 (22.0%) | 142 (18.8%) |
| $150,000 or more | 3,587 (53.3%) | 204 (27.0%) |
| Total | 6,733 (100.0%) | 756 (100.0%) |
Monthly Housing Cost Tiers in Silver Firs
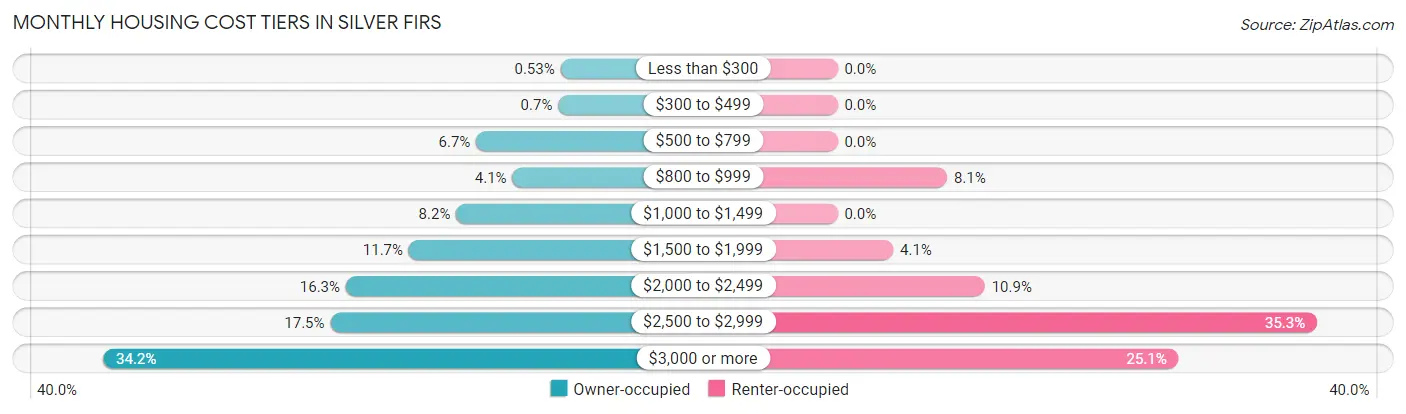
| Monthly Cost | Owner-occupied | Renter-occupied |
| Less than $300 | 36 (0.5%) | 0 (0.0%) |
| $300 to $499 | 47 (0.7%) | 0 (0.0%) |
| $500 to $799 | 454 (6.7%) | 0 (0.0%) |
| $800 to $999 | 274 (4.1%) | 61 (8.1%) |
| $1,000 to $1,499 | 553 (8.2%) | 0 (0.0%) |
| $1,500 to $1,999 | 788 (11.7%) | 31 (4.1%) |
| $2,000 to $2,499 | 1,100 (16.3%) | 82 (10.8%) |
| $2,500 to $2,999 | 1,177 (17.5%) | 267 (35.3%) |
| $3,000 or more | 2,304 (34.2%) | 190 (25.1%) |
| Total | 6,733 (100.0%) | 756 (100.0%) |
Physical Housing Characteristics in Silver Firs
Housing Structures in Silver Firs
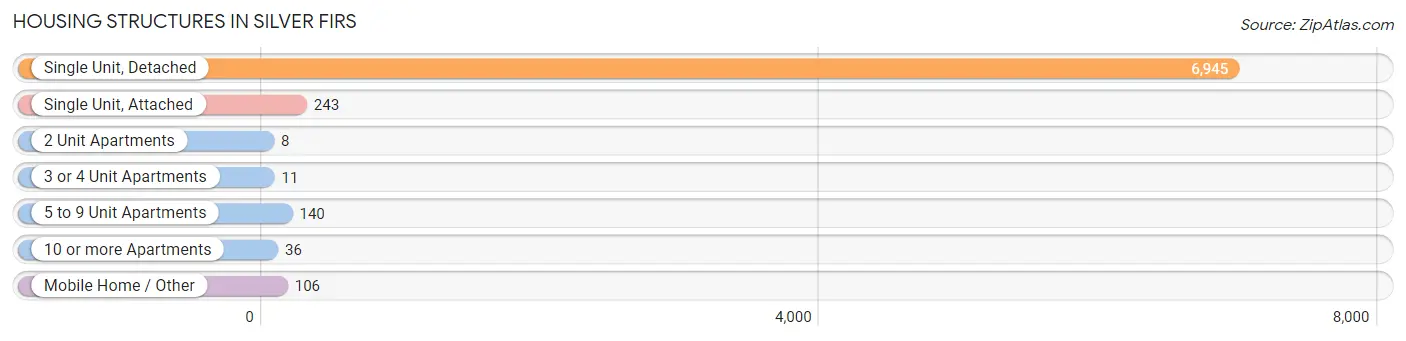
| Structure Type | # Housing Units | % Housing Units |
| Single Unit, Detached | 6,945 | 92.7% |
| Single Unit, Attached | 243 | 3.2% |
| 2 Unit Apartments | 8 | 0.1% |
| 3 or 4 Unit Apartments | 11 | 0.2% |
| 5 to 9 Unit Apartments | 140 | 1.9% |
| 10 or more Apartments | 36 | 0.5% |
| Mobile Home / Other | 106 | 1.4% |
| Total | 7,489 | 100.0% |
Housing Structures by Occupancy in Silver Firs
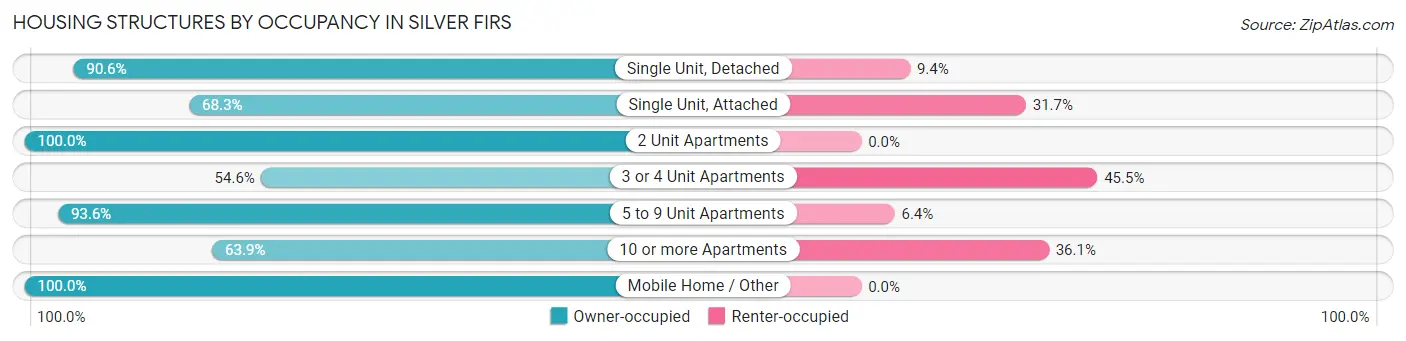
| Structure Type | Owner-occupied | Renter-occupied |
| Single Unit, Detached | 6,293 (90.6%) | 652 (9.4%) |
| Single Unit, Attached | 166 (68.3%) | 77 (31.7%) |
| 2 Unit Apartments | 8 (100.0%) | 0 (0.0%) |
| 3 or 4 Unit Apartments | 6 (54.5%) | 5 (45.5%) |
| 5 to 9 Unit Apartments | 131 (93.6%) | 9 (6.4%) |
| 10 or more Apartments | 23 (63.9%) | 13 (36.1%) |
| Mobile Home / Other | 106 (100.0%) | 0 (0.0%) |
| Total | 6,733 (89.9%) | 756 (10.1%) |
Housing Structures by Number of Rooms in Silver Firs
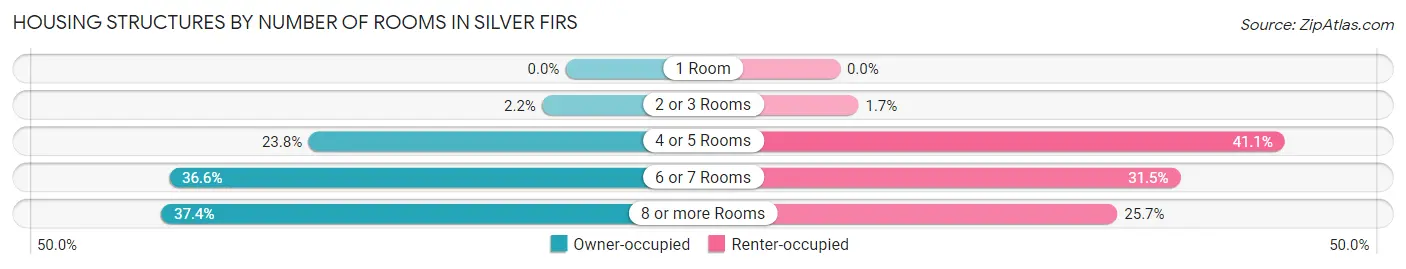
| Number of Rooms | Owner-occupied | Renter-occupied |
| 1 Room | 0 (0.0%) | 0 (0.0%) |
| 2 or 3 Rooms | 147 (2.2%) | 13 (1.7%) |
| 4 or 5 Rooms | 1,602 (23.8%) | 311 (41.1%) |
| 6 or 7 Rooms | 2,467 (36.6%) | 238 (31.5%) |
| 8 or more Rooms | 2,517 (37.4%) | 194 (25.7%) |
| Total | 6,733 (100.0%) | 756 (100.0%) |
Housing Structure by Heating Type in Silver Firs
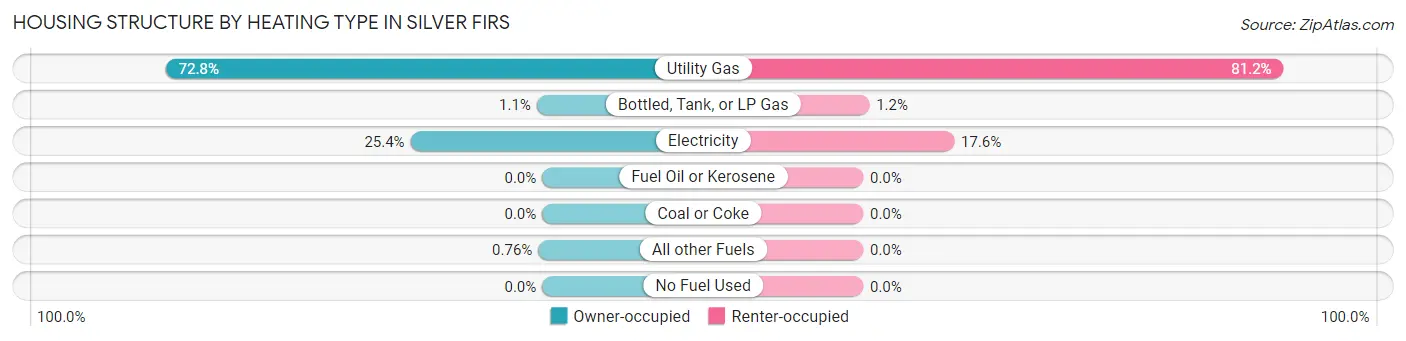
| Heating Type | Owner-occupied | Renter-occupied |
| Utility Gas | 4,898 (72.8%) | 614 (81.2%) |
| Bottled, Tank, or LP Gas | 71 (1.1%) | 9 (1.2%) |
| Electricity | 1,713 (25.4%) | 133 (17.6%) |
| Fuel Oil or Kerosene | 0 (0.0%) | 0 (0.0%) |
| Coal or Coke | 0 (0.0%) | 0 (0.0%) |
| All other Fuels | 51 (0.8%) | 0 (0.0%) |
| No Fuel Used | 0 (0.0%) | 0 (0.0%) |
| Total | 6,733 (100.0%) | 756 (100.0%) |
Household Vehicle Usage in Silver Firs
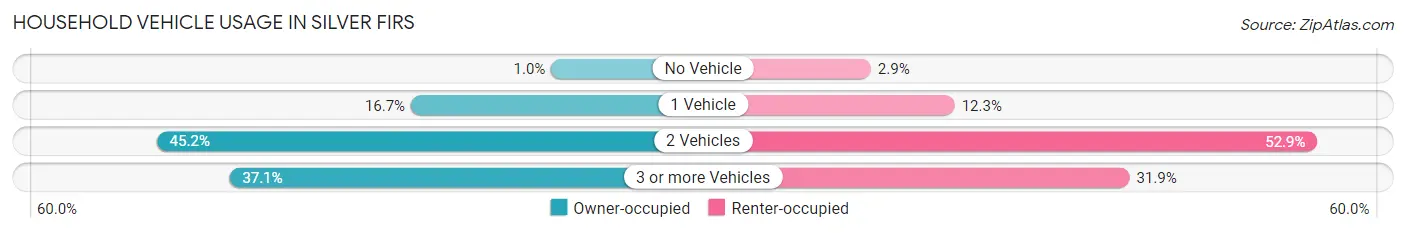
| Vehicles per Household | Owner-occupied | Renter-occupied |
| No Vehicle | 68 (1.0%) | 22 (2.9%) |
| 1 Vehicle | 1,126 (16.7%) | 93 (12.3%) |
| 2 Vehicles | 3,044 (45.2%) | 400 (52.9%) |
| 3 or more Vehicles | 2,495 (37.1%) | 241 (31.9%) |
| Total | 6,733 (100.0%) | 756 (100.0%) |
Real Estate & Mortgages in Silver Firs
Real Estate and Mortgage Overview in Silver Firs
| Characteristic | Without Mortgage | With Mortgage |
| Housing Units | 1,206 | 5,527 |
| Median Property Value | $648,500 | $727,000 |
| Median Household Income | $150,526 | $2,980 |
| Monthly Housing Costs | $854 | $2,304 |
| Real Estate Taxes | $6,374 | $28 |
Property Value by Mortgage Status in Silver Firs
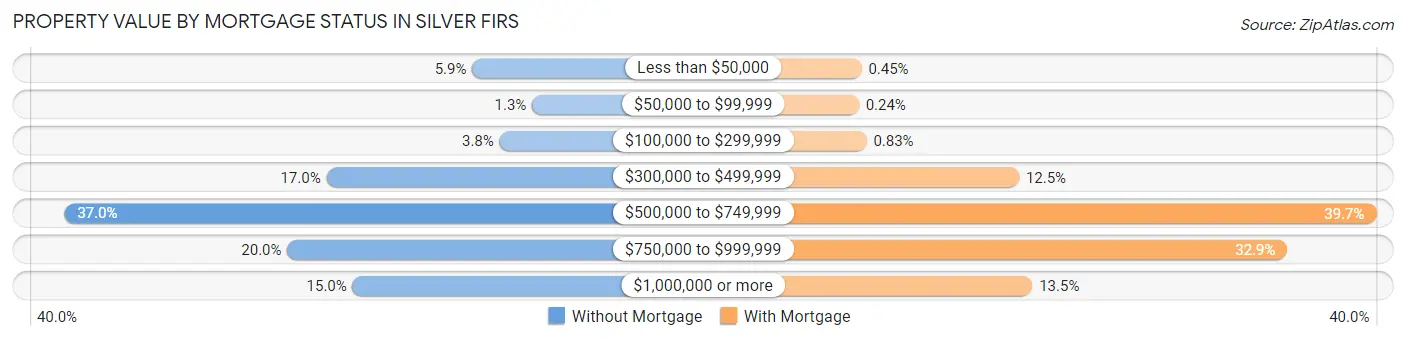
| Property Value | Without Mortgage | With Mortgage |
| Less than $50,000 | 71 (5.9%) | 25 (0.4%) |
| $50,000 to $99,999 | 16 (1.3%) | 13 (0.2%) |
| $100,000 to $299,999 | 46 (3.8%) | 46 (0.8%) |
| $300,000 to $499,999 | 205 (17.0%) | 688 (12.4%) |
| $500,000 to $749,999 | 446 (37.0%) | 2,193 (39.7%) |
| $750,000 to $999,999 | 241 (20.0%) | 1,818 (32.9%) |
| $1,000,000 or more | 181 (15.0%) | 744 (13.5%) |
| Total | 1,206 (100.0%) | 5,527 (100.0%) |
Household Income by Mortgage Status in Silver Firs
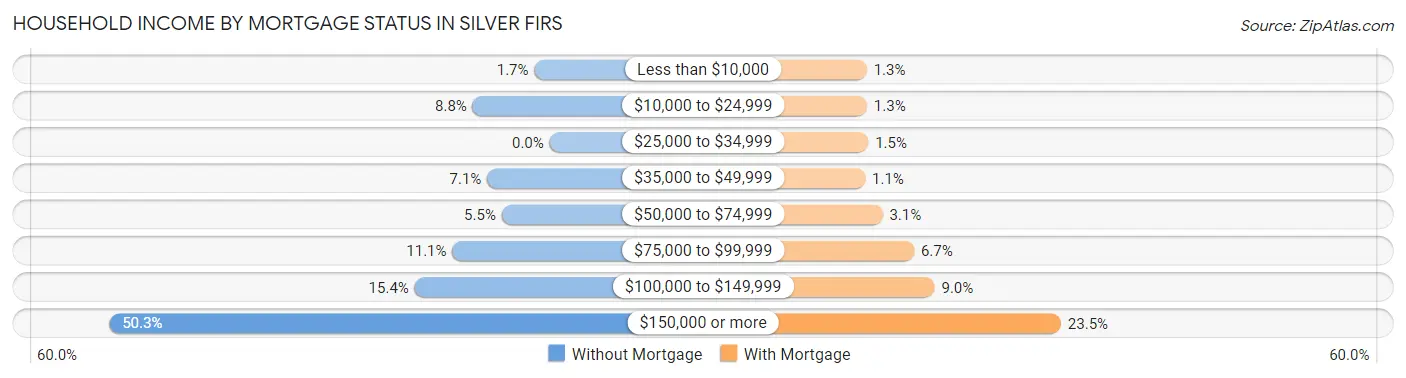
| Household Income | Without Mortgage | With Mortgage |
| Less than $10,000 | 21 (1.7%) | 71 (1.3%) |
| $10,000 to $24,999 | 106 (8.8%) | 72 (1.3%) |
| $25,000 to $34,999 | 0 (0.0%) | 80 (1.5%) |
| $35,000 to $49,999 | 86 (7.1%) | 60 (1.1%) |
| $50,000 to $74,999 | 66 (5.5%) | 170 (3.1%) |
| $75,000 to $99,999 | 134 (11.1%) | 369 (6.7%) |
| $100,000 to $149,999 | 186 (15.4%) | 499 (9.0%) |
| $150,000 or more | 607 (50.3%) | 1,297 (23.5%) |
| Total | 1,206 (100.0%) | 5,527 (100.0%) |
Property Value to Household Income Ratio in Silver Firs
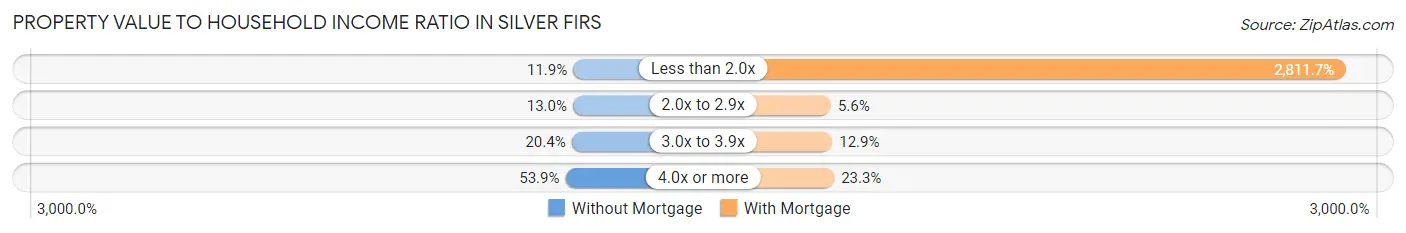
| Value-to-Income Ratio | Without Mortgage | With Mortgage |
| Less than 2.0x | 143 (11.9%) | 155,402 (2,811.7%) |
| 2.0x to 2.9x | 157 (13.0%) | 311 (5.6%) |
| 3.0x to 3.9x | 246 (20.4%) | 714 (12.9%) |
| 4.0x or more | 650 (53.9%) | 1,290 (23.3%) |
| Total | 1,206 (100.0%) | 5,527 (100.0%) |
Real Estate Taxes by Mortgage Status in Silver Firs
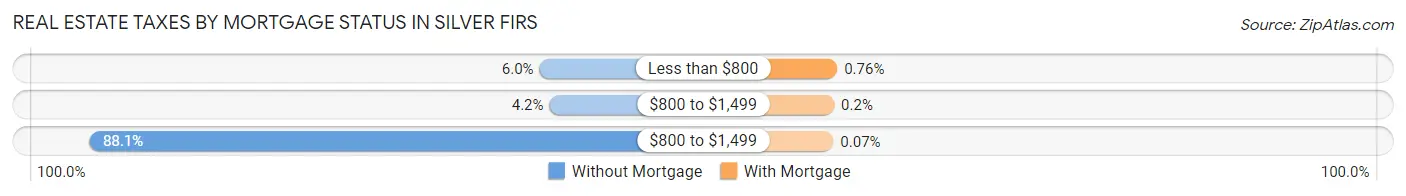
| Property Taxes | Without Mortgage | With Mortgage |
| Less than $800 | 72 (6.0%) | 42 (0.8%) |
| $800 to $1,499 | 50 (4.2%) | 11 (0.2%) |
| $800 to $1,499 | 1,062 (88.1%) | 4 (0.1%) |
| Total | 1,206 (100.0%) | 5,527 (100.0%) |
Health & Disability in Silver Firs
Health Insurance Coverage by Age in Silver Firs
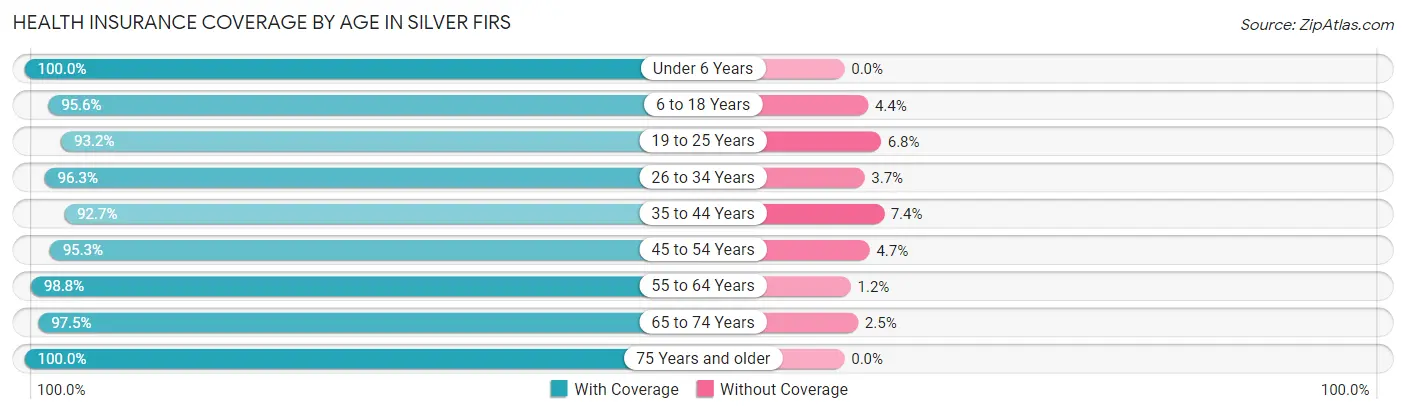
| Age Bracket | With Coverage | Without Coverage |
| Under 6 Years | 1,867 (100.0%) | 0 (0.0%) |
| 6 to 18 Years | 3,985 (95.6%) | 184 (4.4%) |
| 19 to 25 Years | 1,330 (93.2%) | 97 (6.8%) |
| 26 to 34 Years | 2,420 (96.3%) | 94 (3.7%) |
| 35 to 44 Years | 3,226 (92.6%) | 256 (7.3%) |
| 45 to 54 Years | 3,738 (95.3%) | 184 (4.7%) |
| 55 to 64 Years | 3,113 (98.8%) | 37 (1.2%) |
| 65 to 74 Years | 1,151 (97.5%) | 30 (2.5%) |
| 75 Years and older | 517 (100.0%) | 0 (0.0%) |
| Total | 21,347 (96.0%) | 882 (4.0%) |
Health Insurance Coverage by Citizenship Status in Silver Firs
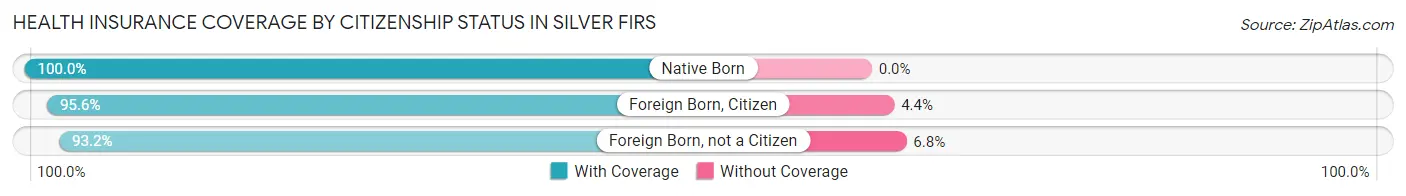
| Citizenship Status | With Coverage | Without Coverage |
| Native Born | 1,867 (100.0%) | 0 (0.0%) |
| Foreign Born, Citizen | 3,985 (95.6%) | 184 (4.4%) |
| Foreign Born, not a Citizen | 1,330 (93.2%) | 97 (6.8%) |
Health Insurance Coverage by Household Income in Silver Firs
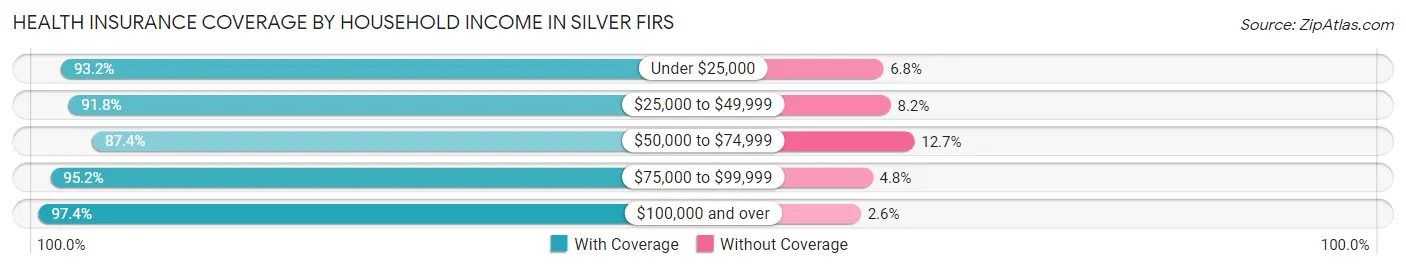
| Household Income | With Coverage | Without Coverage |
| Under $25,000 | 656 (93.2%) | 48 (6.8%) |
| $25,000 to $49,999 | 729 (91.8%) | 65 (8.2%) |
| $50,000 to $74,999 | 1,678 (87.4%) | 243 (12.7%) |
| $75,000 to $99,999 | 1,539 (95.2%) | 78 (4.8%) |
| $100,000 and over | 16,704 (97.4%) | 448 (2.6%) |
Public vs Private Health Insurance Coverage by Age in Silver Firs
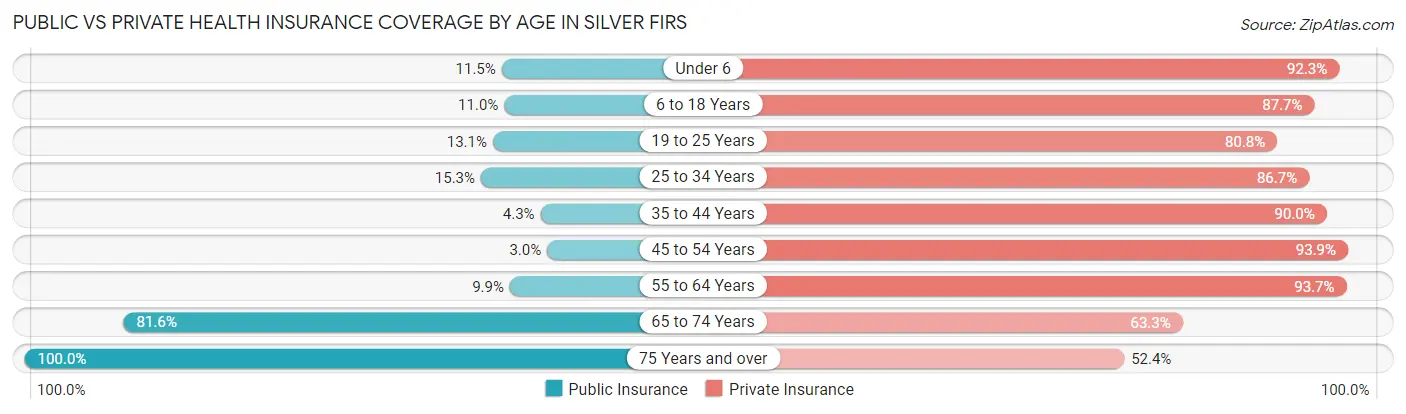
| Age Bracket | Public Insurance | Private Insurance |
| Under 6 | 214 (11.5%) | 1,723 (92.3%) |
| 6 to 18 Years | 458 (11.0%) | 3,656 (87.7%) |
| 19 to 25 Years | 187 (13.1%) | 1,153 (80.8%) |
| 25 to 34 Years | 385 (15.3%) | 2,180 (86.7%) |
| 35 to 44 Years | 148 (4.3%) | 3,133 (90.0%) |
| 45 to 54 Years | 119 (3.0%) | 3,684 (93.9%) |
| 55 to 64 Years | 313 (9.9%) | 2,950 (93.6%) |
| 65 to 74 Years | 964 (81.6%) | 747 (63.2%) |
| 75 Years and over | 517 (100.0%) | 271 (52.4%) |
| Total | 3,305 (14.9%) | 19,497 (87.7%) |
Disability Status by Sex by Age in Silver Firs
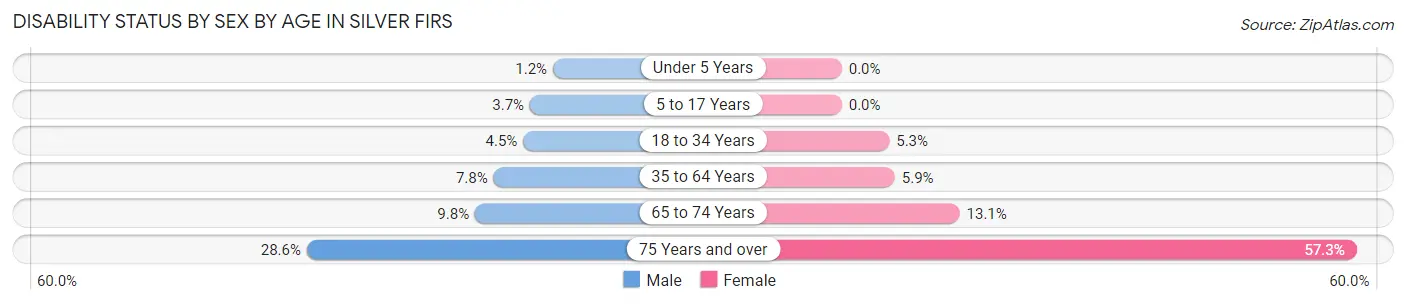
| Age Bracket | Male | Female |
| Under 5 Years | 10 (1.2%) | 0 (0.0%) |
| 5 to 17 Years | 82 (3.7%) | 0 (0.0%) |
| 18 to 34 Years | 102 (4.5%) | 109 (5.3%) |
| 35 to 64 Years | 428 (7.8%) | 298 (5.9%) |
| 65 to 74 Years | 63 (9.8%) | 71 (13.1%) |
| 75 Years and over | 58 (28.6%) | 180 (57.3%) |
Disability Class by Sex by Age in Silver Firs
Disability Class: Hearing Difficulty
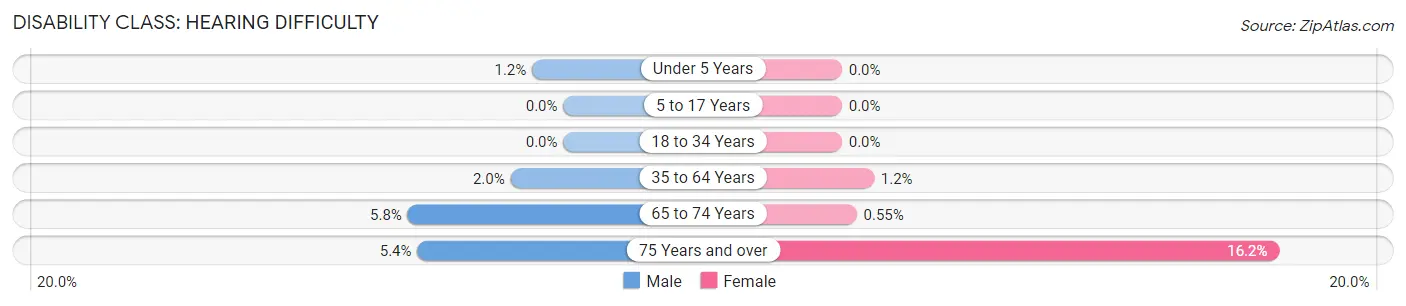
| Age Bracket | Male | Female |
| Under 5 Years | 10 (1.2%) | 0 (0.0%) |
| 5 to 17 Years | 0 (0.0%) | 0 (0.0%) |
| 18 to 34 Years | 0 (0.0%) | 0 (0.0%) |
| 35 to 64 Years | 108 (2.0%) | 60 (1.2%) |
| 65 to 74 Years | 37 (5.8%) | 3 (0.5%) |
| 75 Years and over | 11 (5.4%) | 51 (16.2%) |
Disability Class: Vision Difficulty
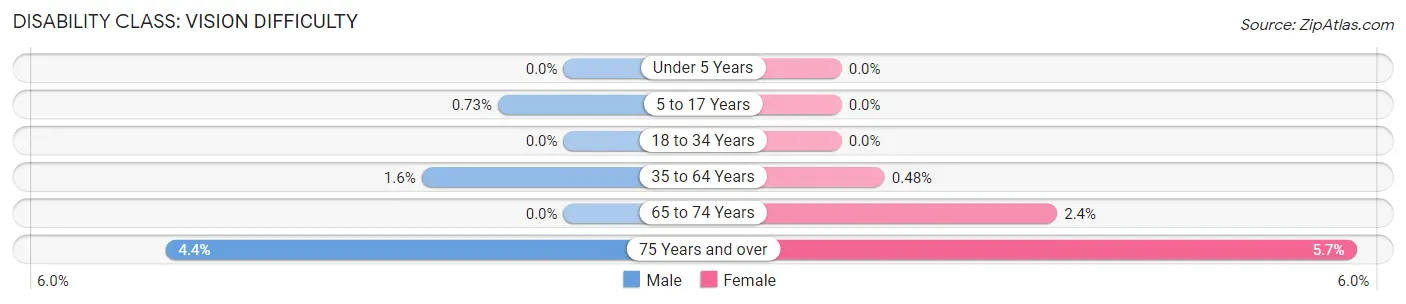
| Age Bracket | Male | Female |
| Under 5 Years | 0 (0.0%) | 0 (0.0%) |
| 5 to 17 Years | 16 (0.7%) | 0 (0.0%) |
| 18 to 34 Years | 0 (0.0%) | 0 (0.0%) |
| 35 to 64 Years | 87 (1.6%) | 24 (0.5%) |
| 65 to 74 Years | 0 (0.0%) | 13 (2.4%) |
| 75 Years and over | 9 (4.4%) | 18 (5.7%) |
Disability Class: Cognitive Difficulty
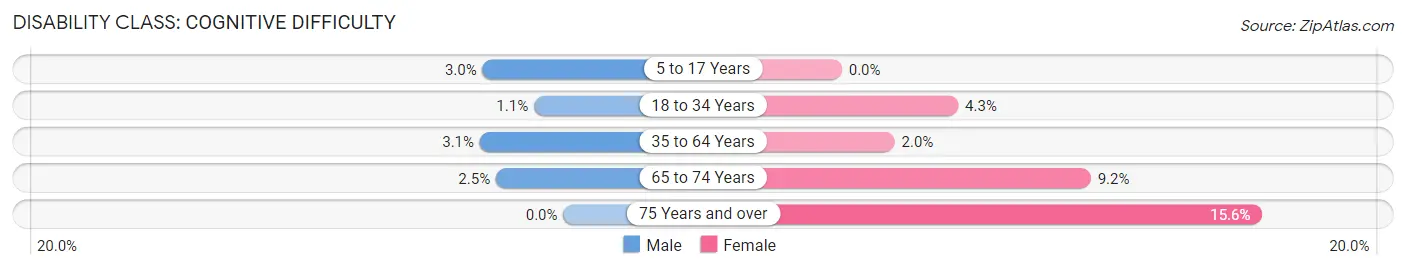
| Age Bracket | Male | Female |
| 5 to 17 Years | 66 (3.0%) | 0 (0.0%) |
| 18 to 34 Years | 25 (1.1%) | 89 (4.3%) |
| 35 to 64 Years | 171 (3.1%) | 99 (2.0%) |
| 65 to 74 Years | 16 (2.5%) | 50 (9.2%) |
| 75 Years and over | 0 (0.0%) | 49 (15.6%) |
Disability Class: Ambulatory Difficulty
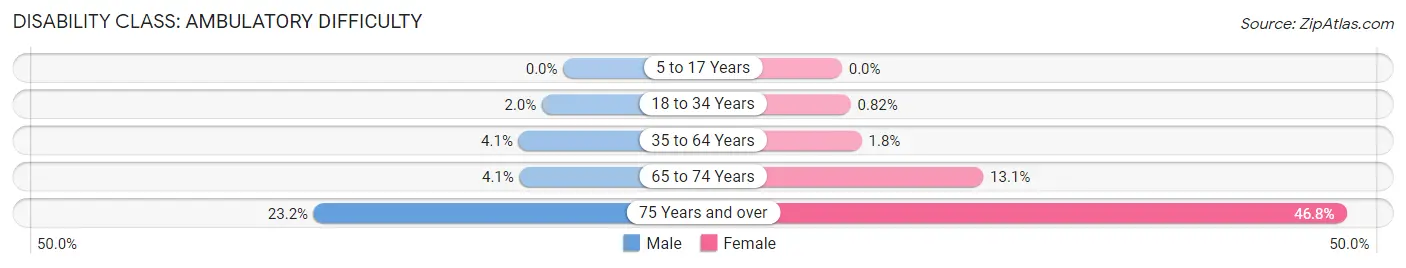
| Age Bracket | Male | Female |
| 5 to 17 Years | 0 (0.0%) | 0 (0.0%) |
| 18 to 34 Years | 45 (2.0%) | 17 (0.8%) |
| 35 to 64 Years | 228 (4.1%) | 93 (1.8%) |
| 65 to 74 Years | 26 (4.1%) | 71 (13.1%) |
| 75 Years and over | 47 (23.2%) | 147 (46.8%) |
Disability Class: Self-Care Difficulty
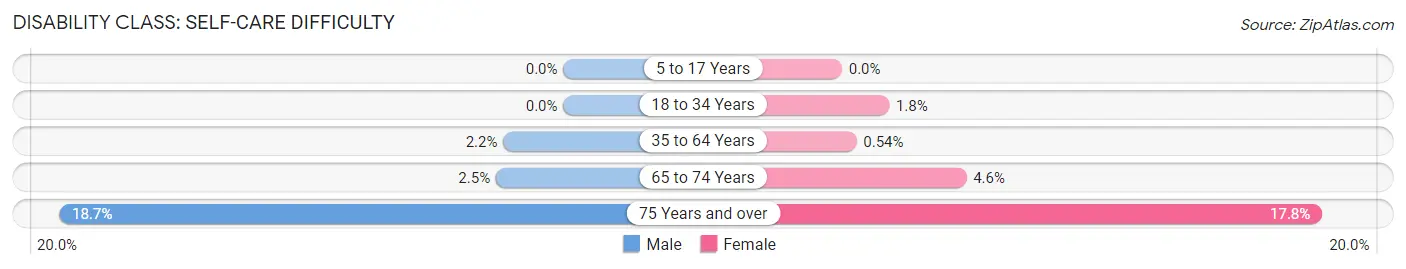
| Age Bracket | Male | Female |
| 5 to 17 Years | 0 (0.0%) | 0 (0.0%) |
| 18 to 34 Years | 0 (0.0%) | 36 (1.8%) |
| 35 to 64 Years | 123 (2.2%) | 27 (0.5%) |
| 65 to 74 Years | 16 (2.5%) | 25 (4.6%) |
| 75 Years and over | 38 (18.7%) | 56 (17.8%) |
Technology Access in Silver Firs
Computing Device Access in Silver Firs
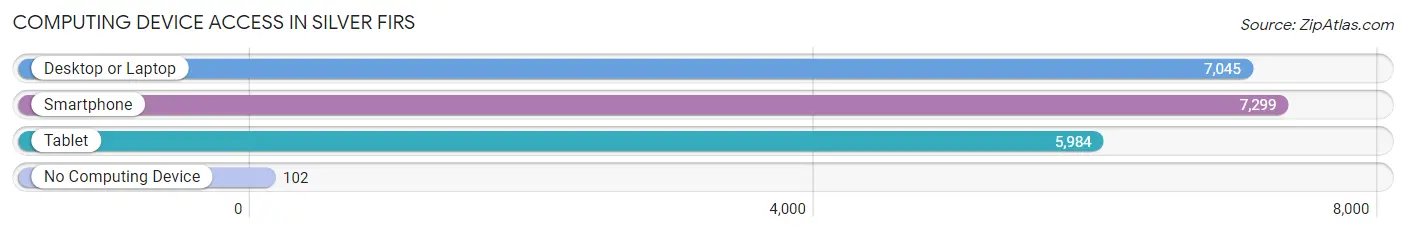
| Device Type | # Households | % Households |
| Desktop or Laptop | 7,045 | 94.1% |
| Smartphone | 7,299 | 97.5% |
| Tablet | 5,984 | 79.9% |
| No Computing Device | 102 | 1.4% |
| Total | 7,489 | 100.0% |
Internet Access in Silver Firs
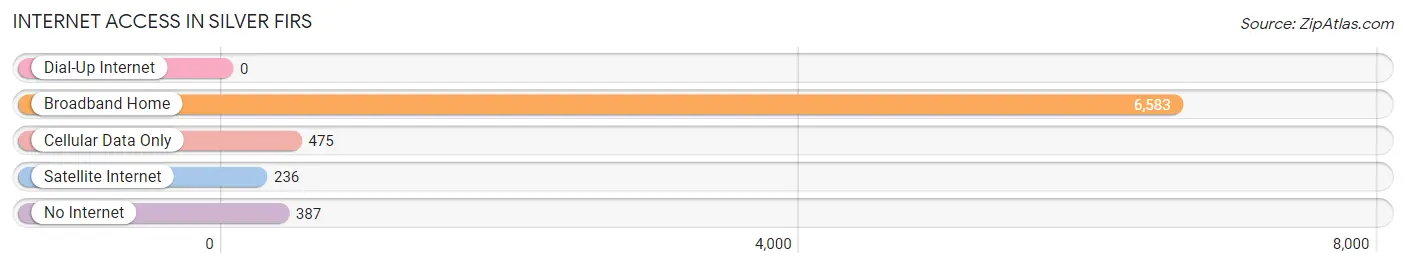
| Internet Type | # Households | % Households |
| Dial-Up Internet | 0 | 0.0% |
| Broadband Home | 6,583 | 87.9% |
| Cellular Data Only | 475 | 6.3% |
| Satellite Internet | 236 | 3.2% |
| No Internet | 387 | 5.2% |
| Total | 7,489 | 100.0% |
Silver Firs Summary
Silver Firs is a small unincorporated community located in Snohomish County, Washington, United States. It is located in the Cascade foothills, approximately 20 miles northeast of Seattle. The population of Silver Firs was estimated to be 4,845 in 2019.
History
The area that is now Silver Firs was first settled in the late 1800s by homesteaders. The first post office was established in 1891 and the community was named after the silver fir trees that grew in the area. The area was primarily used for logging and farming until the 1950s when the population began to grow due to the influx of people moving to the Seattle area.
Geography
Silver Firs is located in the Cascade foothills, approximately 20 miles northeast of Seattle. The area is characterized by rolling hills and dense forests. The climate is mild and wet, with an average annual precipitation of over 40 inches.
Economy
The economy of Silver Firs is primarily driven by the service sector. The area is home to a variety of retail stores, restaurants, and other businesses. The area is also home to a number of technology companies, including Microsoft, Amazon, and Google.
Demographics
The population of Silver Firs was estimated to be 4,845 in 2019. The population is primarily white (83.3%), followed by Asian (7.2%), Hispanic (4.2%), and African American (2.2%). The median household income is $90,845 and the median home value is $521,000.
Conclusion
Silver Firs is a small unincorporated community located in Snohomish County, Washington, United States. It is located in the Cascade foothills, approximately 20 miles northeast of Seattle. The population of Silver Firs was estimated to be 4,845 in 2019. The economy of Silver Firs is primarily driven by the service sector, and the population is primarily white. The median household income is $90,845 and the median home value is $521,000. Silver Firs is a vibrant community with a rich history and a bright future.
Common Questions
What is Per Capita Income in Silver Firs?
Per Capita income in Silver Firs is $58,733.
What is the Median Family Income in Silver Firs?
Median Family Income in Silver Firs is $158,505.
What is the Median Household income in Silver Firs?
Median Household Income in Silver Firs is $150,709.
What is Income or Wage Gap in Silver Firs?
Income or Wage Gap in Silver Firs is 48.7%.
Women in Silver Firs earn 51.3 cents for every dollar earned by a man.
What is Inequality or Gini Index in Silver Firs?
Inequality or Gini Index in Silver Firs is 0.35.
What is the Total Population of Silver Firs?
Total Population of Silver Firs is 22,230.
What is the Total Male Population of Silver Firs?
Total Male Population of Silver Firs is 11,706.
What is the Total Female Population of Silver Firs?
Total Female Population of Silver Firs is 10,524.
What is the Ratio of Males per 100 Females in Silver Firs?
There are 111.23 Males per 100 Females in Silver Firs.
What is the Ratio of Females per 100 Males in Silver Firs?
There are 89.90 Females per 100 Males in Silver Firs.
What is the Median Population Age in Silver Firs?
Median Population Age in Silver Firs is 37.5 Years.
What is the Average Family Size in Silver Firs
Average Family Size in Silver Firs is 3.2 People.
What is the Average Household Size in Silver Firs
Average Household Size in Silver Firs is 3.0 People.
How Large is the Labor Force in Silver Firs?
There are 12,724 People in the Labor Forcein in Silver Firs.
What is the Percentage of People in the Labor Force in Silver Firs?
73.7% of People are in the Labor Force in Silver Firs.
What is the Unemployment Rate in Silver Firs?
Unemployment Rate in Silver Firs is 2.9%.