Larch Way, WA Map & Demographics
Larch Way Map
Larch Way Overview
$54,435
PER CAPITA INCOME
$127,717
AVG FAMILY INCOME
$124,545
AVG HOUSEHOLD INCOME
20.9%
WAGE / INCOME GAP [ % ]
79.1¢/ $1
WAGE / INCOME GAP [ $ ]
0.33
INEQUALITY / GINI INDEX
4,399
TOTAL POPULATION
2,275
MALE POPULATION
2,124
FEMALE POPULATION
107.11
MALES / 100 FEMALES
93.36
FEMALES / 100 MALES
38.9
MEDIAN AGE
3.1
AVG FAMILY SIZE
2.6
AVG HOUSEHOLD SIZE
2,608
LABOR FORCE [ PEOPLE ]
71.6%
PERCENT IN LABOR FORCE
1.0%
UNEMPLOYMENT RATE
Income in Larch Way
Income Overview in Larch Way
Per Capita Income in Larch Way is $54,435, while median incomes of families and households are $127,717 and $124,545 respectively.
| Characteristic | Number | Measure |
| Per Capita Income | 4,399 | $54,435 |
| Median Family Income | 1,204 | $127,717 |
| Mean Family Income | 1,204 | $145,838 |
| Median Household Income | 1,688 | $124,545 |
| Mean Household Income | 1,688 | $138,530 |
| Income Deficit | 1,204 | $0 |
| Wage / Income Gap (%) | 4,399 | 20.87% |
| Wage / Income Gap ($) | 4,399 | 79.13¢ per $1 |
| Gini / Inequality Index | 4,399 | 0.33 |
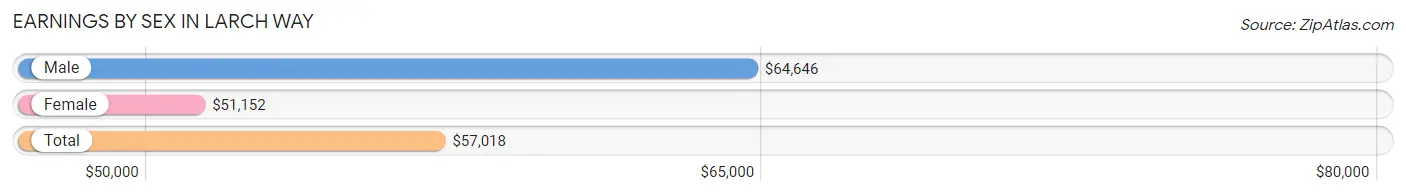
Earnings by Sex in Larch Way
Average Earnings in Larch Way are $57,018, $64,646 for men and $51,152 for women, a difference of 20.9%.
| Sex | Number | Average Earnings |
| Male | 1,665 (59.2%) | $64,646 |
| Female | 1,149 (40.8%) | $51,152 |
| Total | 2,814 (100.0%) | $57,018 |
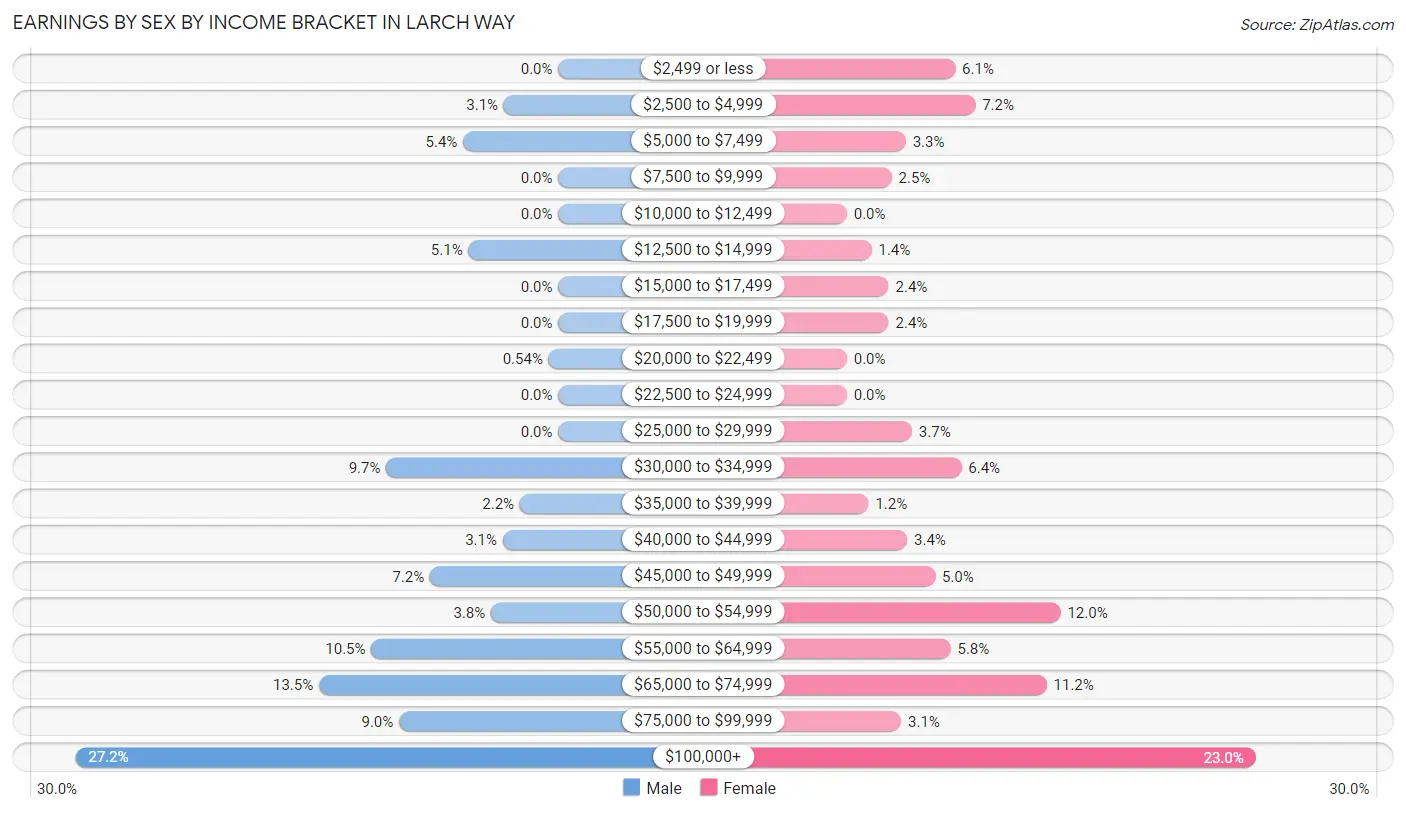
Earnings by Sex by Income Bracket in Larch Way
The most common earnings brackets in Larch Way are $100,000+ for men (452 | 27.2%) and $100,000+ for women (264 | 23.0%).
| Income | Male | Female |
| $2,499 or less | 0 (0.0%) | 70 (6.1%) |
| $2,500 to $4,999 | 51 (3.1%) | 83 (7.2%) |
| $5,000 to $7,499 | 89 (5.3%) | 38 (3.3%) |
| $7,500 to $9,999 | 0 (0.0%) | 29 (2.5%) |
| $10,000 to $12,499 | 0 (0.0%) | 0 (0.0%) |
| $12,500 to $14,999 | 84 (5.1%) | 16 (1.4%) |
| $15,000 to $17,499 | 0 (0.0%) | 27 (2.4%) |
| $17,500 to $19,999 | 0 (0.0%) | 27 (2.4%) |
| $20,000 to $22,499 | 9 (0.5%) | 0 (0.0%) |
| $22,500 to $24,999 | 0 (0.0%) | 0 (0.0%) |
| $25,000 to $29,999 | 0 (0.0%) | 42 (3.7%) |
| $30,000 to $34,999 | 161 (9.7%) | 74 (6.4%) |
| $35,000 to $39,999 | 36 (2.2%) | 14 (1.2%) |
| $40,000 to $44,999 | 52 (3.1%) | 39 (3.4%) |
| $45,000 to $49,999 | 120 (7.2%) | 57 (5.0%) |
| $50,000 to $54,999 | 63 (3.8%) | 138 (12.0%) |
| $55,000 to $64,999 | 175 (10.5%) | 67 (5.8%) |
| $65,000 to $74,999 | 224 (13.5%) | 129 (11.2%) |
| $75,000 to $99,999 | 149 (8.9%) | 35 (3.0%) |
| $100,000+ | 452 (27.2%) | 264 (23.0%) |
| Total | 1,665 (100.0%) | 1,149 (100.0%) |
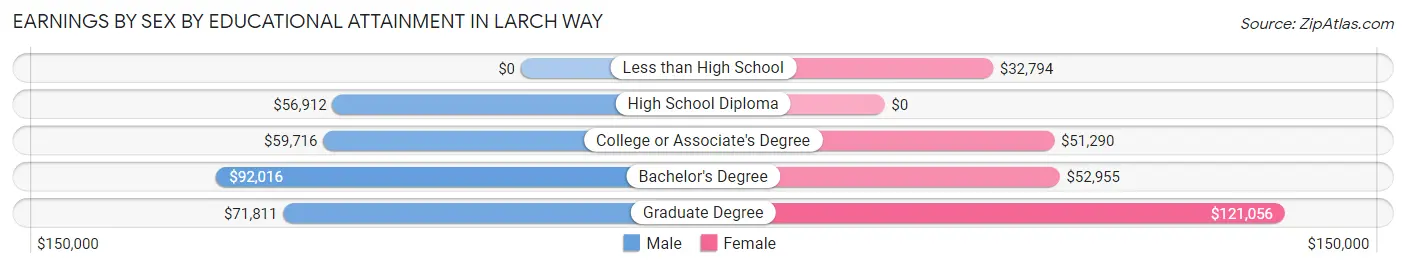
Earnings by Sex by Educational Attainment in Larch Way
Average earnings in Larch Way are $66,181 for men and $52,382 for women, a difference of 20.8%. Men with an educational attainment of bachelor's degree enjoy the highest average annual earnings of $92,016, while those with high school diploma education earn the least with $56,912. Women with an educational attainment of graduate degree earn the most with the average annual earnings of $121,056, while those with less than high school education have the smallest earnings of $32,794.
| Educational Attainment | Male Income | Female Income |
| Less than High School | - | - |
| High School Diploma | $56,912 | $0 |
| College or Associate's Degree | $59,716 | $51,290 |
| Bachelor's Degree | $92,016 | $52,955 |
| Graduate Degree | $71,811 | $121,056 |
| Total | $66,181 | $52,382 |
Family Income in Larch Way
Family Income Brackets in Larch Way
According to the Larch Way family income data, there are 340 families falling into the $100,000 to $149,999 income range, which is the most common income bracket and makes up 28.2% of all families.
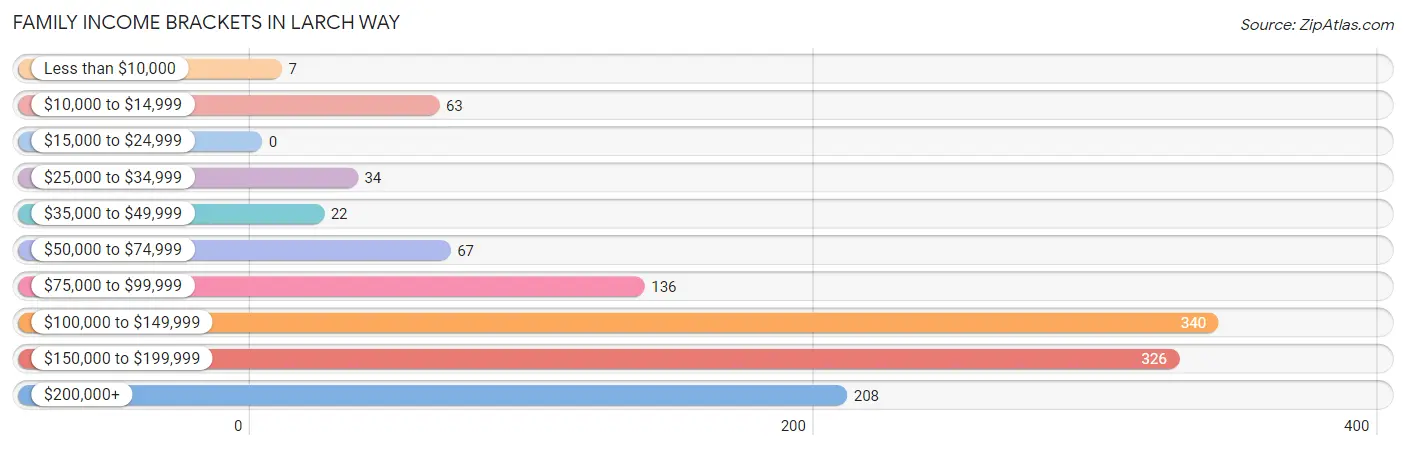
| Income Bracket | # Families | % Families |
| Less than $10,000 | 7 | 0.6% |
| $10,000 to $14,999 | 63 | 5.2% |
| $15,000 to $24,999 | 0 | 0.0% |
| $25,000 to $34,999 | 34 | 2.8% |
| $35,000 to $49,999 | 22 | 1.8% |
| $50,000 to $74,999 | 67 | 5.6% |
| $75,000 to $99,999 | 136 | 11.3% |
| $100,000 to $149,999 | 340 | 28.2% |
| $150,000 to $199,999 | 326 | 27.1% |
| $200,000+ | 208 | 17.3% |
Family Income by Famaliy Size in Larch Way
3-person families (355 | 29.5%) account for the highest median family income in Larch Way with $166,761 per family, while 2-person families (482 | 40.0%) have the highest median income of $60,341 per family member.
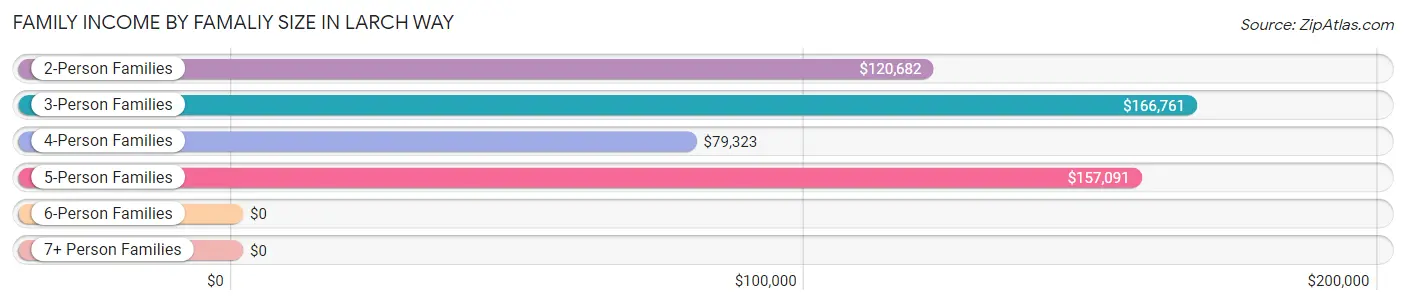
| Income Bracket | # Families | Median Income |
| 2-Person Families | 482 (40.0%) | $120,682 |
| 3-Person Families | 355 (29.5%) | $166,761 |
| 4-Person Families | 249 (20.7%) | $79,323 |
| 5-Person Families | 103 (8.6%) | $157,091 |
| 6-Person Families | 0 (0.0%) | $0 |
| 7+ Person Families | 15 (1.3%) | $0 |
| Total | 1,204 (100.0%) | $127,717 |
Family Income by Number of Earners in Larch Way
The median family income in Larch Way is $127,717, with families comprising 3+ earners (219) having the highest median family income of $165,398, while families with no earners (101) have the lowest median family income of $88,512, accounting for 18.2% and 8.4% of families, respectively.
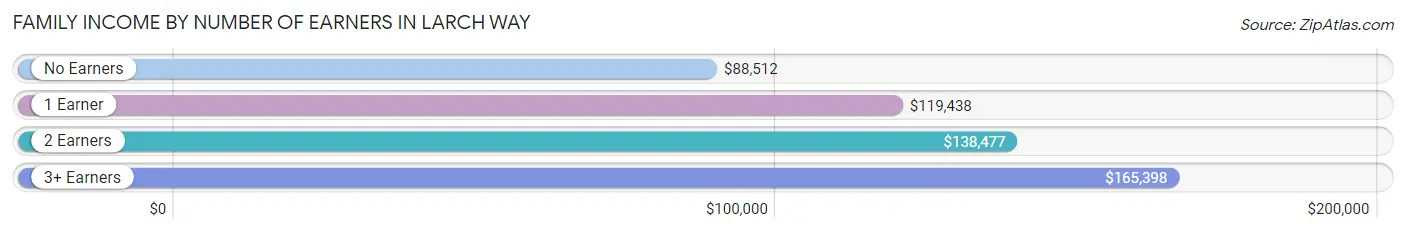
| Number of Earners | # Families | Median Income |
| No Earners | 101 (8.4%) | $88,512 |
| 1 Earner | 187 (15.5%) | $119,438 |
| 2 Earners | 697 (57.9%) | $138,477 |
| 3+ Earners | 219 (18.2%) | $165,398 |
| Total | 1,204 (100.0%) | $127,717 |
Household Income in Larch Way
Household Income Brackets in Larch Way
With 434 households falling in the category, the $100,000 to $149,999 income range is the most frequent in Larch Way, accounting for 25.7% of all households. In contrast, only 14 households (0.8%) fall into the $15,000 to $24,999 income bracket, making it the least populous group.
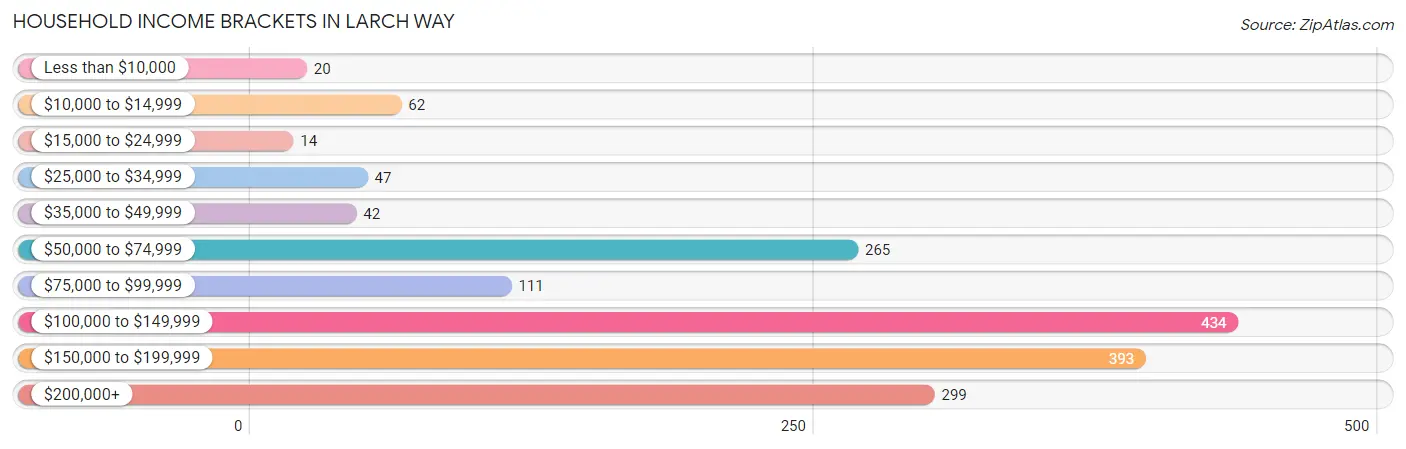
| Income Bracket | # Households | % Households |
| Less than $10,000 | 20 | 1.2% |
| $10,000 to $14,999 | 62 | 3.7% |
| $15,000 to $24,999 | 14 | 0.8% |
| $25,000 to $34,999 | 47 | 2.8% |
| $35,000 to $49,999 | 42 | 2.5% |
| $50,000 to $74,999 | 265 | 15.7% |
| $75,000 to $99,999 | 111 | 6.6% |
| $100,000 to $149,999 | 434 | 25.7% |
| $150,000 to $199,999 | 393 | 23.3% |
| $200,000+ | 299 | 17.7% |
Household Income by Householder Age in Larch Way
The median household income in Larch Way is $124,545, with the highest median household income of $163,505 found in the 45 to 64 years age bracket for the primary householder. A total of 588 households (34.8%) fall into this category. Meanwhile, the 15 to 24 years age bracket for the primary householder has the lowest median household income of $0, with 52 households (3.1%) in this group.
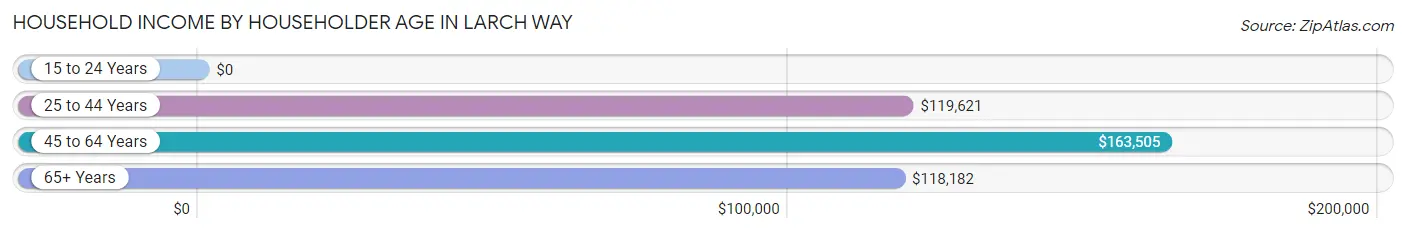
| Income Bracket | # Households | Median Income |
| 15 to 24 Years | 52 (3.1%) | $0 |
| 25 to 44 Years | 744 (44.1%) | $119,621 |
| 45 to 64 Years | 588 (34.8%) | $163,505 |
| 65+ Years | 304 (18.0%) | $118,182 |
| Total | 1,688 (100.0%) | $124,545 |
Poverty in Larch Way
Income Below Poverty by Sex and Age in Larch Way
With 7.2% poverty level for males and 8.8% for females among the residents of Larch Way, 6 to 11 year old males and 18 to 24 year old females are the most vulnerable to poverty, with 77 males (29.2%) and 75 females (40.8%) in their respective age groups living below the poverty level.
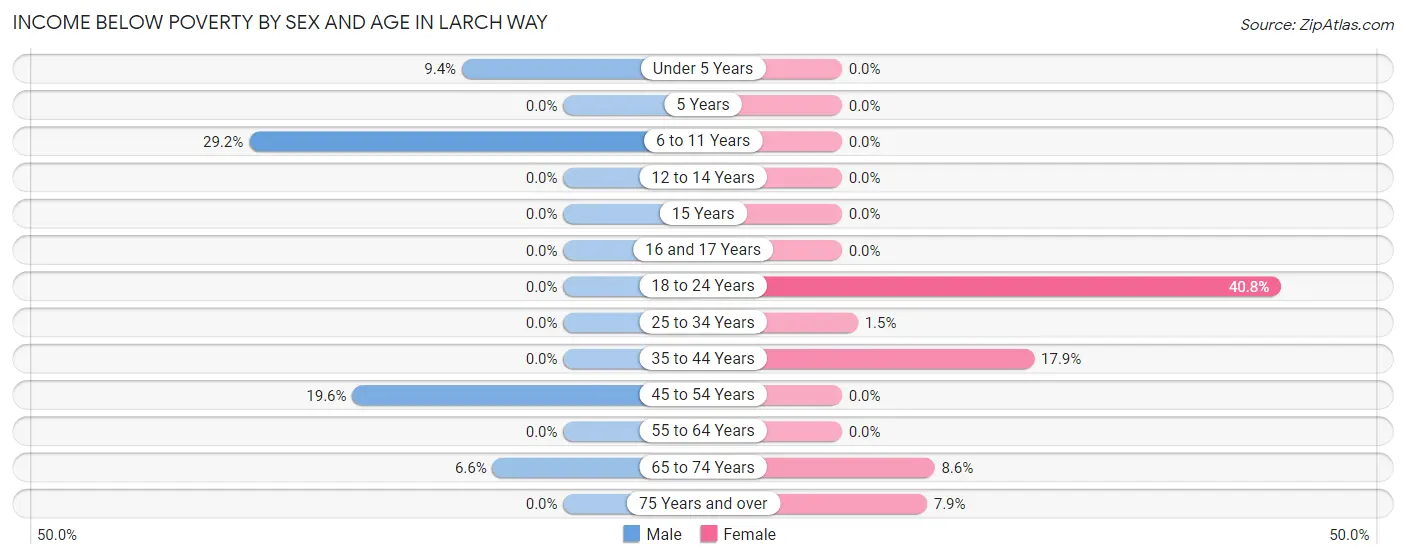
| Age Bracket | Male | Female |
| Under 5 Years | 8 (9.4%) | 0 (0.0%) |
| 5 Years | 0 (0.0%) | 0 (0.0%) |
| 6 to 11 Years | 77 (29.2%) | 0 (0.0%) |
| 12 to 14 Years | 0 (0.0%) | 0 (0.0%) |
| 15 Years | 0 (0.0%) | 0 (0.0%) |
| 16 and 17 Years | 0 (0.0%) | 0 (0.0%) |
| 18 to 24 Years | 0 (0.0%) | 75 (40.8%) |
| 25 to 34 Years | 0 (0.0%) | 4 (1.5%) |
| 35 to 44 Years | 0 (0.0%) | 83 (17.8%) |
| 45 to 54 Years | 66 (19.6%) | 0 (0.0%) |
| 55 to 64 Years | 0 (0.0%) | 0 (0.0%) |
| 65 to 74 Years | 13 (6.6%) | 16 (8.6%) |
| 75 Years and over | 0 (0.0%) | 9 (7.9%) |
| Total | 164 (7.2%) | 187 (8.8%) |
Income Above Poverty by Sex and Age in Larch Way
According to the poverty statistics in Larch Way, males aged 12 to 14 years and females aged under 5 years are the age groups that are most secure financially, with 100.0% of males and 100.0% of females in these age groups living above the poverty line.
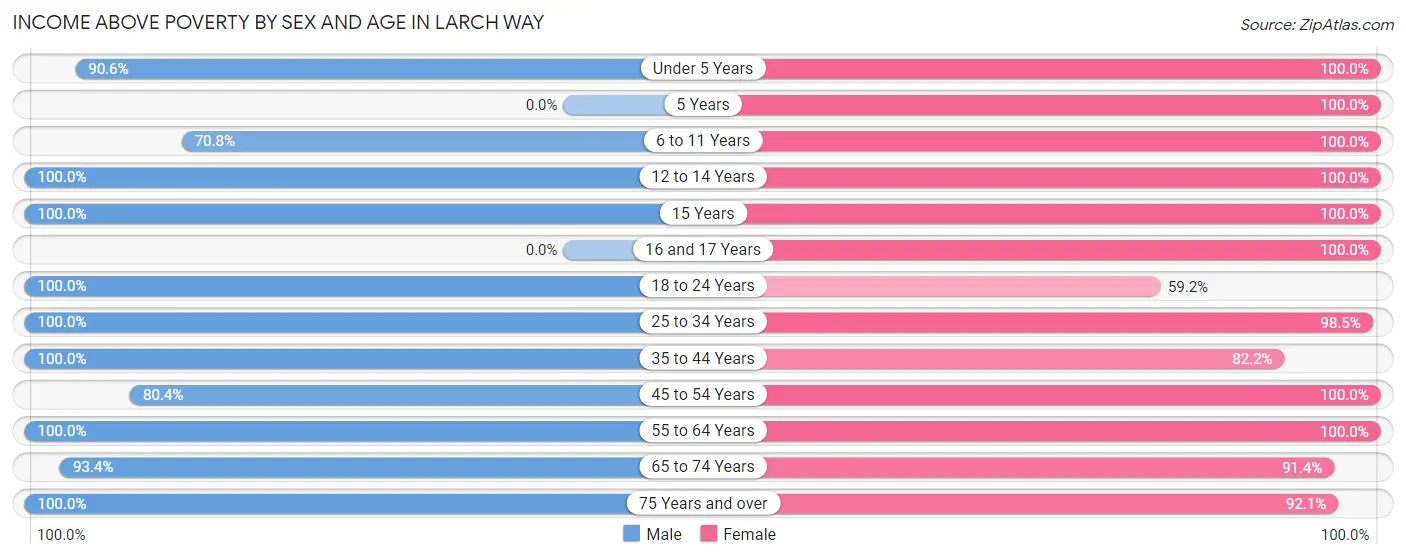
| Age Bracket | Male | Female |
| Under 5 Years | 77 (90.6%) | 43 (100.0%) |
| 5 Years | 0 (0.0%) | 24 (100.0%) |
| 6 to 11 Years | 187 (70.8%) | 182 (100.0%) |
| 12 to 14 Years | 22 (100.0%) | 122 (100.0%) |
| 15 Years | 8 (100.0%) | 6 (100.0%) |
| 16 and 17 Years | 0 (0.0%) | 39 (100.0%) |
| 18 to 24 Years | 59 (100.0%) | 109 (59.2%) |
| 25 to 34 Years | 475 (100.0%) | 267 (98.5%) |
| 35 to 44 Years | 370 (100.0%) | 382 (82.2%) |
| 45 to 54 Years | 271 (80.4%) | 260 (100.0%) |
| 55 to 64 Years | 397 (100.0%) | 228 (100.0%) |
| 65 to 74 Years | 185 (93.4%) | 170 (91.4%) |
| 75 Years and over | 60 (100.0%) | 105 (92.1%) |
| Total | 2,111 (92.8%) | 1,937 (91.2%) |
Income Below Poverty Among Married-Couple Families in Larch Way
The poverty statistics for married-couple families in Larch Way show that 6.2% or 63 of the total 1,017 families live below the poverty line. Families with 1 or 2 children have the highest poverty rate of 16.7%, comprising of 63 families. On the other hand, families with no children have the lowest poverty rate of 0.0%, which includes 0 families.
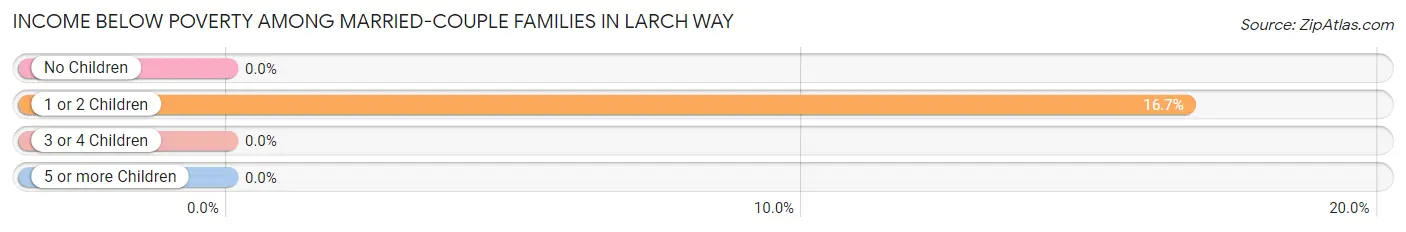
| Children | Above Poverty | Below Poverty |
| No Children | 572 (100.0%) | 0 (0.0%) |
| 1 or 2 Children | 315 (83.3%) | 63 (16.7%) |
| 3 or 4 Children | 67 (100.0%) | 0 (0.0%) |
| 5 or more Children | 0 (0.0%) | 0 (0.0%) |
| Total | 954 (93.8%) | 63 (6.2%) |
Income Below Poverty Among Single-Parent Households in Larch Way
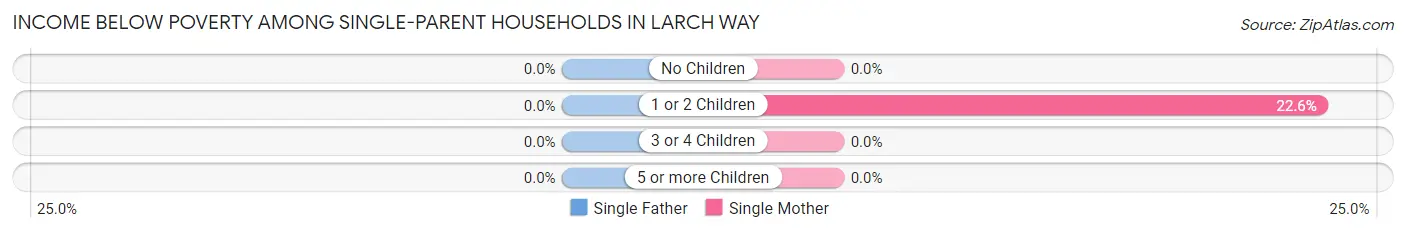
| Children | Single Father | Single Mother |
| No Children | 0 (0.0%) | 0 (0.0%) |
| 1 or 2 Children | 0 (0.0%) | 7 (22.6%) |
| 3 or 4 Children | 0 (0.0%) | 0 (0.0%) |
| 5 or more Children | 0 (0.0%) | 0 (0.0%) |
| Total | 0 (0.0%) | 7 (6.3%) |
Income Below Poverty Among Married-Couple vs Single-Parent Households in Larch Way
The poverty data for Larch Way shows that 63 of the married-couple family households (6.2%) and 7 of the single-parent households (3.7%) are living below the poverty level. Within the married-couple family households, those with 1 or 2 children have the highest poverty rate, with 63 households (16.7%) falling below the poverty line. Among the single-parent households, those with 1 or 2 children have the highest poverty rate, with 7 household (22.6%) living below poverty.
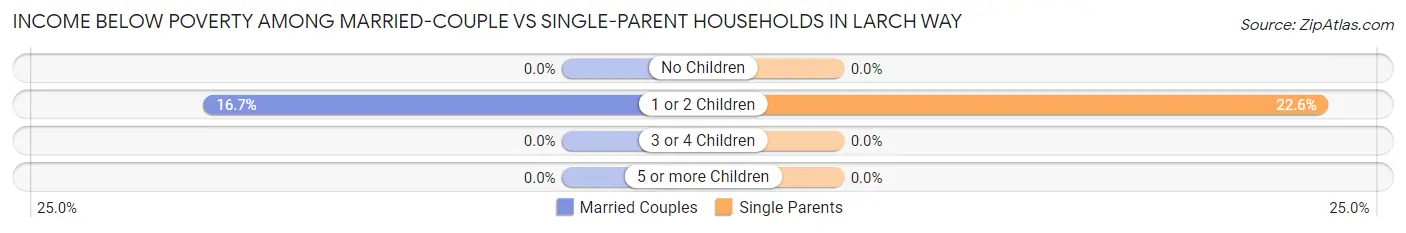
| Children | Married-Couple Families | Single-Parent Households |
| No Children | 0 (0.0%) | 0 (0.0%) |
| 1 or 2 Children | 63 (16.7%) | 7 (22.6%) |
| 3 or 4 Children | 0 (0.0%) | 0 (0.0%) |
| 5 or more Children | 0 (0.0%) | 0 (0.0%) |
| Total | 63 (6.2%) | 7 (3.7%) |
Race in Larch Way
The most populous races in Larch Way are White / Caucasian (1,894 | 43.1%), Asian (1,440 | 32.7%), and Hispanic or Latino (491 | 11.2%).
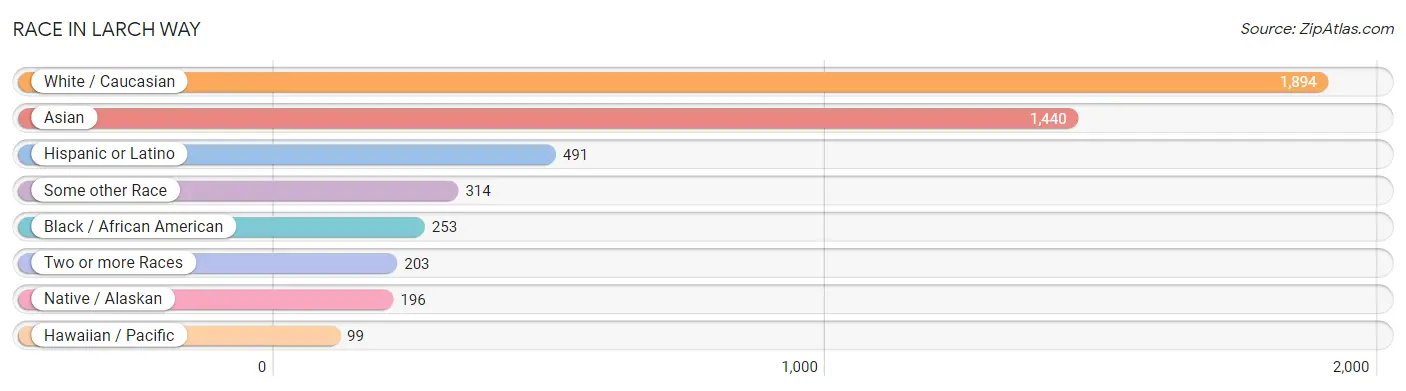
| Race | # Population | % Population |
| Asian | 1,440 | 32.7% |
| Black / African American | 253 | 5.8% |
| Hawaiian / Pacific | 99 | 2.2% |
| Hispanic or Latino | 491 | 11.2% |
| Native / Alaskan | 196 | 4.5% |
| White / Caucasian | 1,894 | 43.1% |
| Two or more Races | 203 | 4.6% |
| Some other Race | 314 | 7.1% |
| Total | 4,399 | 100.0% |
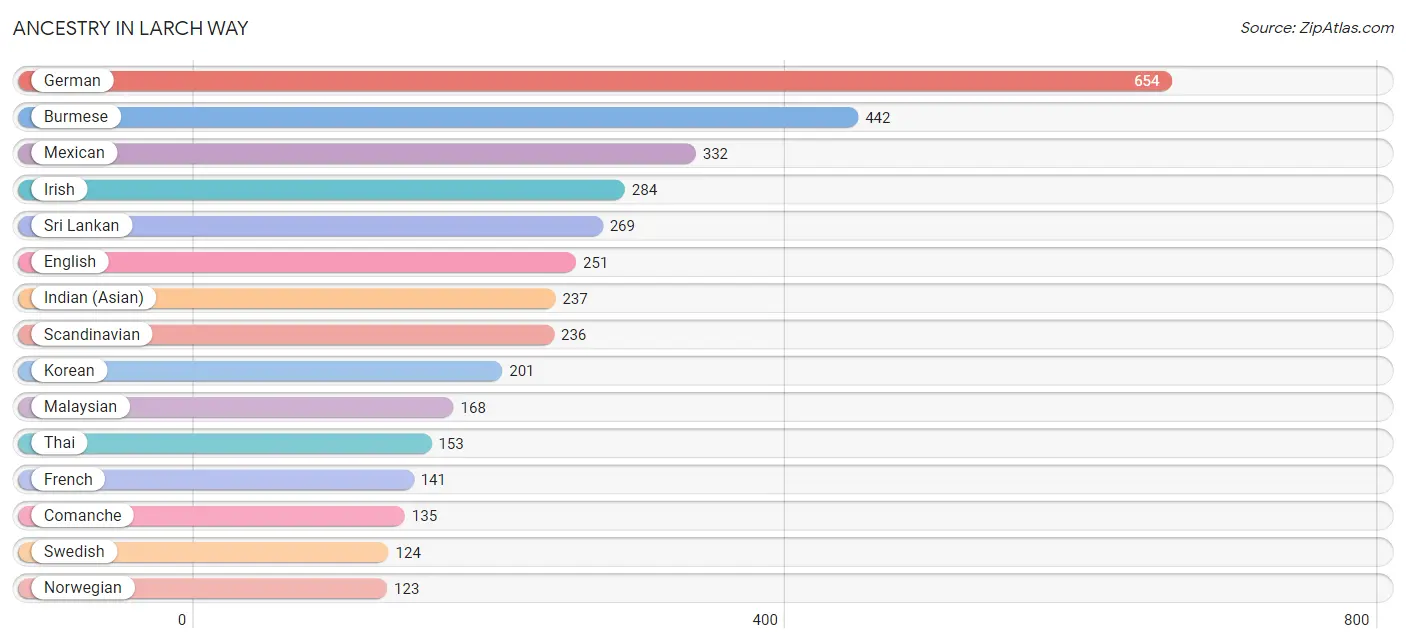
Ancestry in Larch Way
The most populous ancestries reported in Larch Way are German (654 | 14.9%), Burmese (442 | 10.1%), Mexican (332 | 7.5%), Irish (284 | 6.5%), and Sri Lankan (269 | 6.1%), together accounting for 45.0% of all Larch Way residents.
| Ancestry | # Population | % Population |
| American | 38 | 0.9% |
| Arab | 73 | 1.7% |
| Bhutanese | 58 | 1.3% |
| Brazilian | 63 | 1.4% |
| Burmese | 442 | 10.1% |
| Central American | 59 | 1.3% |
| Chippewa | 7 | 0.2% |
| Comanche | 135 | 3.1% |
| Croatian | 20 | 0.4% |
| Czech | 10 | 0.2% |
| Danish | 13 | 0.3% |
| Dutch | 54 | 1.2% |
| Egyptian | 26 | 0.6% |
| English | 251 | 5.7% |
| Ethiopian | 92 | 2.1% |
| European | 30 | 0.7% |
| Filipino | 50 | 1.1% |
| Finnish | 11 | 0.3% |
| French | 141 | 3.2% |
| German | 654 | 14.9% |
| Guatemalan | 28 | 0.6% |
| Indian (Asian) | 237 | 5.4% |
| Irish | 284 | 6.5% |
| Italian | 71 | 1.6% |
| Japanese | 17 | 0.4% |
| Korean | 201 | 4.6% |
| Laotian | 6 | 0.1% |
| Malaysian | 168 | 3.8% |
| Mexican | 332 | 7.5% |
| Native Hawaiian | 77 | 1.8% |
| Northern European | 8 | 0.2% |
| Norwegian | 123 | 2.8% |
| Peruvian | 20 | 0.4% |
| Polish | 81 | 1.8% |
| Russian | 23 | 0.5% |
| Salvadoran | 31 | 0.7% |
| Samoan | 22 | 0.5% |
| Scandinavian | 236 | 5.4% |
| Scottish | 68 | 1.5% |
| Slovak | 10 | 0.2% |
| South American | 100 | 2.3% |
| Sri Lankan | 269 | 6.1% |
| Subsaharan African | 92 | 2.1% |
| Swedish | 124 | 2.8% |
| Swiss | 13 | 0.3% |
| Thai | 153 | 3.5% |
| Tlingit-Haida | 18 | 0.4% |
| Ukrainian | 51 | 1.2% |
| Venezuelan | 80 | 1.8% | View All 49 Rows |
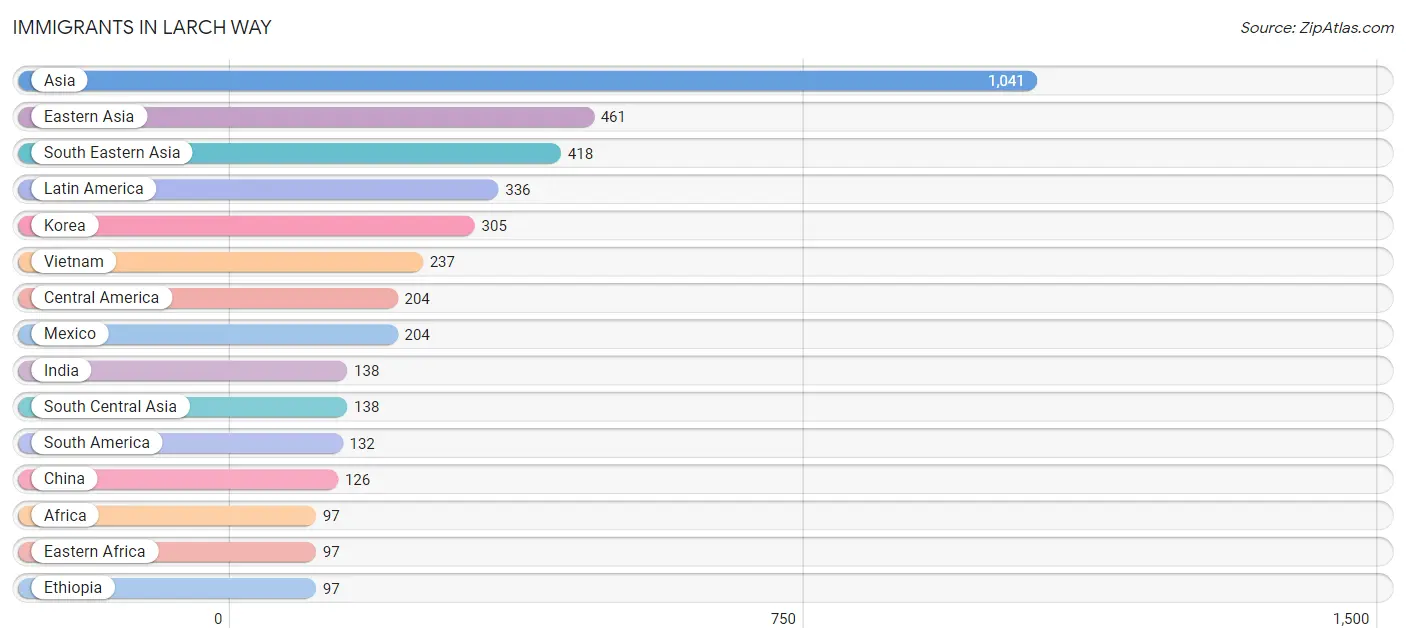
Immigrants in Larch Way
The most numerous immigrant groups reported in Larch Way came from Asia (1,041 | 23.7%), Eastern Asia (461 | 10.5%), South Eastern Asia (418 | 9.5%), Latin America (336 | 7.6%), and Korea (305 | 6.9%), together accounting for 58.2% of all Larch Way residents.
| Immigration Origin | # Population | % Population |
| Africa | 97 | 2.2% |
| Asia | 1,041 | 23.7% |
| Belarus | 23 | 0.5% |
| Brazil | 32 | 0.7% |
| Cambodia | 17 | 0.4% |
| Central America | 204 | 4.6% |
| China | 126 | 2.9% |
| Eastern Africa | 97 | 2.2% |
| Eastern Asia | 461 | 10.5% |
| Eastern Europe | 73 | 1.7% |
| Ethiopia | 97 | 2.2% |
| Europe | 97 | 2.2% |
| Germany | 24 | 0.5% |
| India | 138 | 3.1% |
| Japan | 30 | 0.7% |
| Korea | 305 | 6.9% |
| Laos | 64 | 1.5% |
| Latin America | 336 | 7.6% |
| Mexico | 204 | 4.6% |
| Peru | 20 | 0.4% |
| Philippines | 75 | 1.7% |
| Saudi Arabia | 24 | 0.5% |
| South America | 132 | 3.0% |
| South Central Asia | 138 | 3.1% |
| South Eastern Asia | 418 | 9.5% |
| Taiwan | 35 | 0.8% |
| Thailand | 25 | 0.6% |
| Ukraine | 50 | 1.1% |
| Venezuela | 80 | 1.8% |
| Vietnam | 237 | 5.4% |
| Western Asia | 24 | 0.5% |
| Western Europe | 24 | 0.5% | View All 32 Rows |
Sex and Age in Larch Way
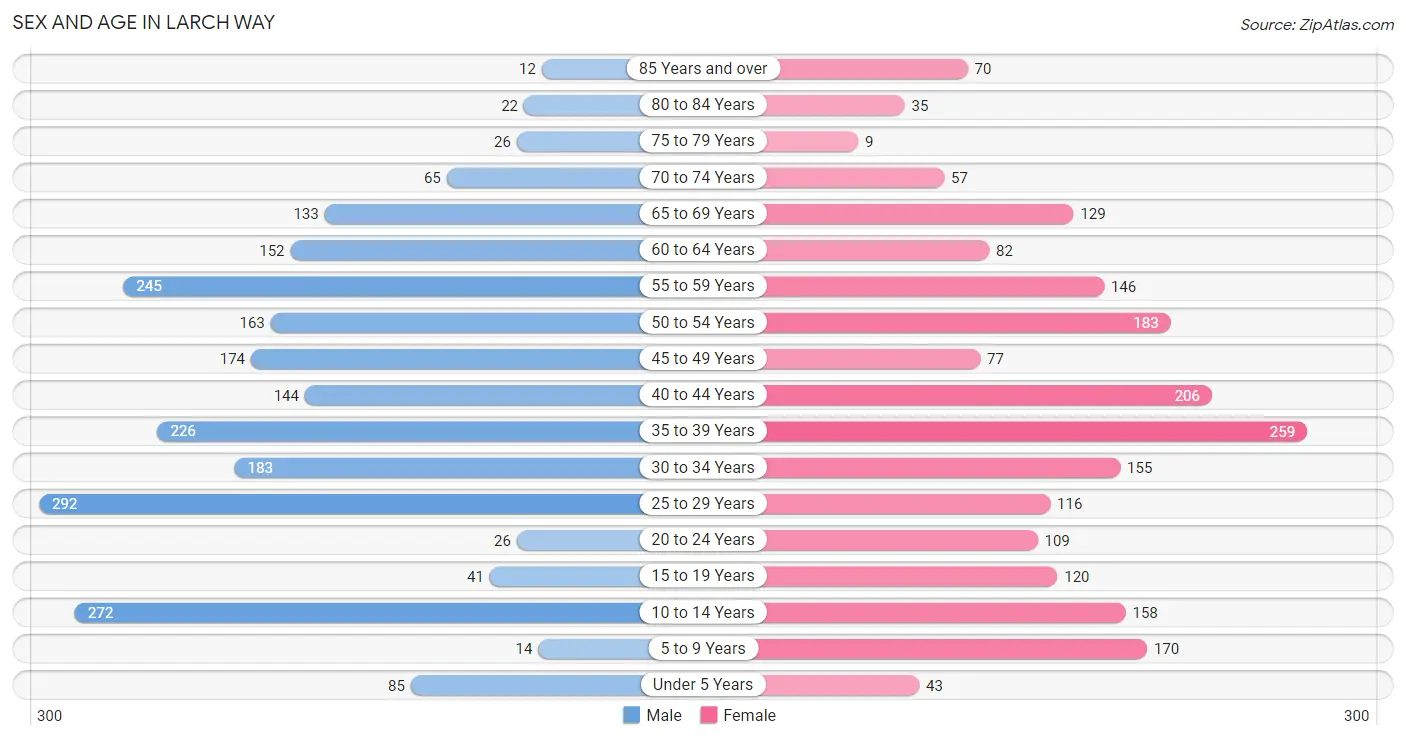
Sex and Age in Larch Way
The most populous age groups in Larch Way are 25 to 29 Years (292 | 12.8%) for men and 35 to 39 Years (259 | 12.2%) for women.
| Age Bracket | Male | Female |
| Under 5 Years | 85 (3.7%) | 43 (2.0%) |
| 5 to 9 Years | 14 (0.6%) | 170 (8.0%) |
| 10 to 14 Years | 272 (12.0%) | 158 (7.4%) |
| 15 to 19 Years | 41 (1.8%) | 120 (5.7%) |
| 20 to 24 Years | 26 (1.1%) | 109 (5.1%) |
| 25 to 29 Years | 292 (12.8%) | 116 (5.5%) |
| 30 to 34 Years | 183 (8.0%) | 155 (7.3%) |
| 35 to 39 Years | 226 (9.9%) | 259 (12.2%) |
| 40 to 44 Years | 144 (6.3%) | 206 (9.7%) |
| 45 to 49 Years | 174 (7.6%) | 77 (3.6%) |
| 50 to 54 Years | 163 (7.2%) | 183 (8.6%) |
| 55 to 59 Years | 245 (10.8%) | 146 (6.9%) |
| 60 to 64 Years | 152 (6.7%) | 82 (3.9%) |
| 65 to 69 Years | 133 (5.9%) | 129 (6.1%) |
| 70 to 74 Years | 65 (2.9%) | 57 (2.7%) |
| 75 to 79 Years | 26 (1.1%) | 9 (0.4%) |
| 80 to 84 Years | 22 (1.0%) | 35 (1.7%) |
| 85 Years and over | 12 (0.5%) | 70 (3.3%) |
| Total | 2,275 (100.0%) | 2,124 (100.0%) |
Families and Households in Larch Way
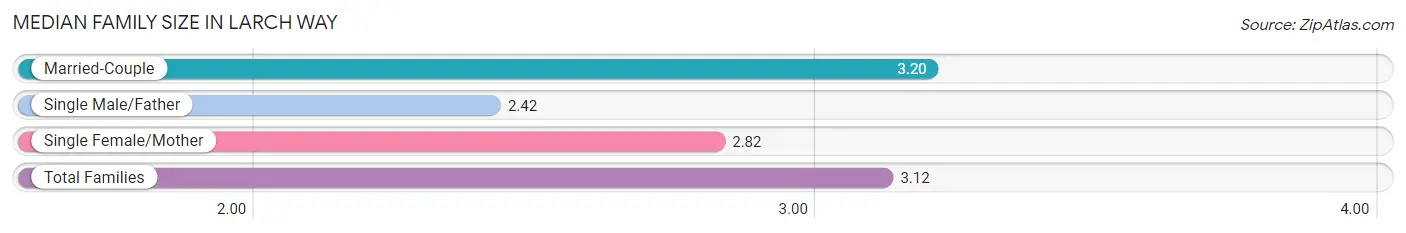
Median Family Size in Larch Way
The median family size in Larch Way is 3.12 persons per family, with married-couple families (1,017 | 84.5%) accounting for the largest median family size of 3.2 persons per family. On the other hand, single male/father families (76 | 6.3%) represent the smallest median family size with 2.42 persons per family.
| Family Type | # Families | Family Size |
| Married-Couple | 1,017 (84.5%) | 3.20 |
| Single Male/Father | 76 (6.3%) | 2.42 |
| Single Female/Mother | 111 (9.2%) | 2.82 |
| Total Families | 1,204 (100.0%) | 3.12 |
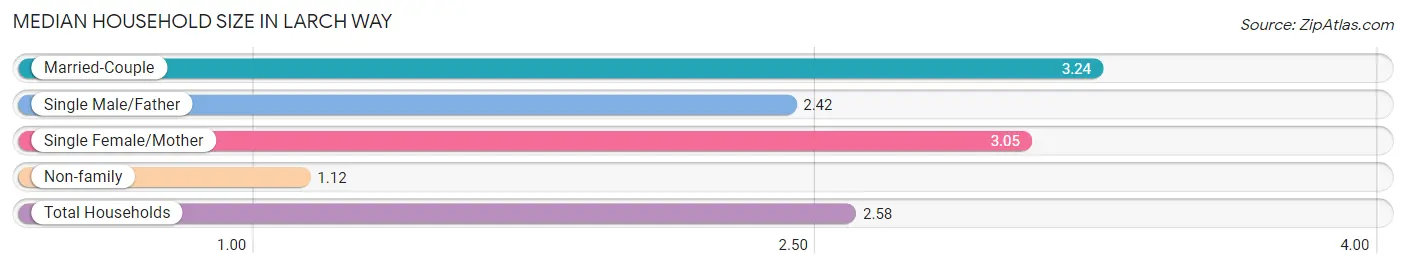
Median Household Size in Larch Way
The median household size in Larch Way is 2.58 persons per household, with married-couple households (1,017 | 60.3%) accounting for the largest median household size of 3.24 persons per household. non-family households (484 | 28.7%) represent the smallest median household size with 1.12 persons per household.
| Household Type | # Households | Household Size |
| Married-Couple | 1,017 (60.3%) | 3.24 |
| Single Male/Father | 76 (4.5%) | 2.42 |
| Single Female/Mother | 111 (6.6%) | 3.05 |
| Non-family | 484 (28.7%) | 1.12 |
| Total Households | 1,688 (100.0%) | 2.58 |
Household Size by Marriage Status in Larch Way
Out of a total of 1,688 households in Larch Way, 1,204 (71.3%) are family households, while 484 (28.7%) are nonfamily households. The most numerous type of family households are 2-person households, comprising 464, and the most common type of nonfamily households are 1-person households, comprising 430.
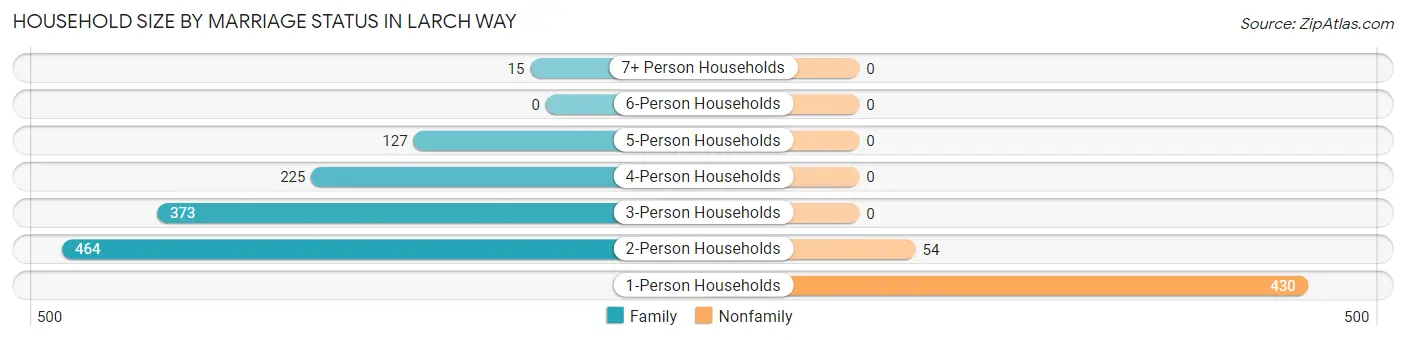
| Household Size | Family Households | Nonfamily Households |
| 1-Person Households | - | 430 (25.5%) |
| 2-Person Households | 464 (27.5%) | 54 (3.2%) |
| 3-Person Households | 373 (22.1%) | 0 (0.0%) |
| 4-Person Households | 225 (13.3%) | 0 (0.0%) |
| 5-Person Households | 127 (7.5%) | 0 (0.0%) |
| 6-Person Households | 0 (0.0%) | 0 (0.0%) |
| 7+ Person Households | 15 (0.9%) | 0 (0.0%) |
| Total | 1,204 (71.3%) | 484 (28.7%) |
Female Fertility in Larch Way
Fertility by Age in Larch Way
Average fertility rate in Larch Way is 25.0 births per 1,000 women. Women in the age bracket of 35 to 50 years have the highest fertility rate with 47.0 births per 1,000 women. Women in the age bracket of 35 to 50 years acount for 100.0% of all women with births.
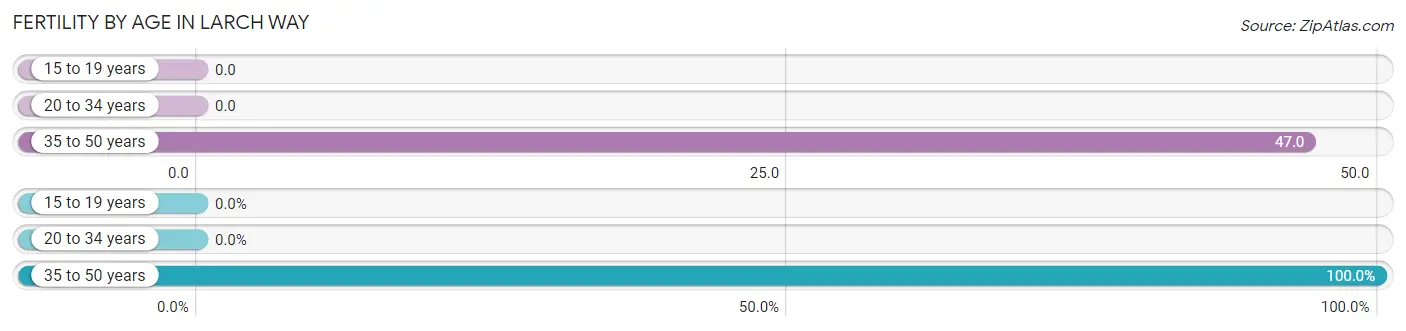
| Age Bracket | Women with Births | Births / 1,000 Women |
| 15 to 19 years | 0 (0.0%) | 0.0 |
| 20 to 34 years | 0 (0.0%) | 0.0 |
| 35 to 50 years | 27 (100.0%) | 47.0 |
| Total | 27 (100.0%) | 25.0 |
Fertility by Age by Marriage Status in Larch Way
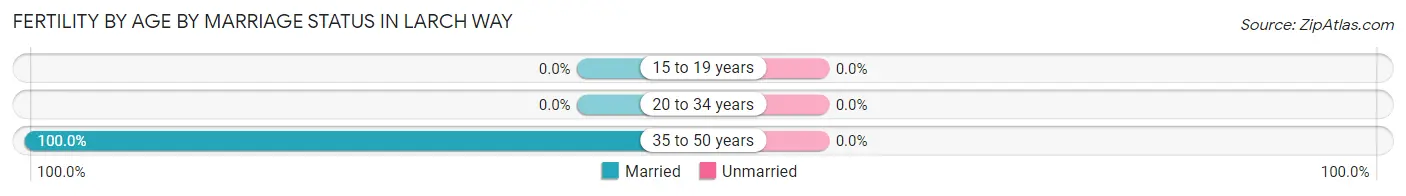
| Age Bracket | Married | Unmarried |
| 15 to 19 years | 0 (0.0%) | 0 (0.0%) |
| 20 to 34 years | 0 (0.0%) | 0 (0.0%) |
| 35 to 50 years | 27 (100.0%) | 0 (0.0%) |
| Total | 27 (100.0%) | 0 (0.0%) |
Fertility by Education in Larch Way
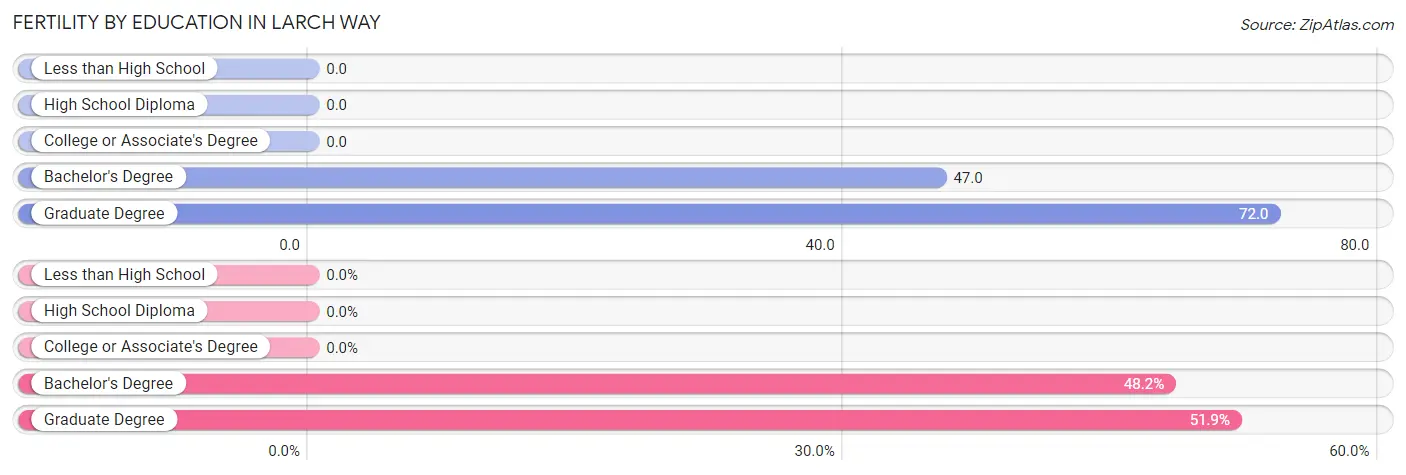
| Educational Attainment | Women with Births | Births / 1,000 Women |
| Less than High School | 0 (0.0%) | 0.0 |
| High School Diploma | 0 (0.0%) | 0.0 |
| College or Associate's Degree | 0 (0.0%) | 0.0 |
| Bachelor's Degree | 13 (48.1%) | 47.0 |
| Graduate Degree | 14 (51.8%) | 72.0 |
| Total | 27 (100.0%) | 25.0 |
Fertility by Education by Marriage Status in Larch Way
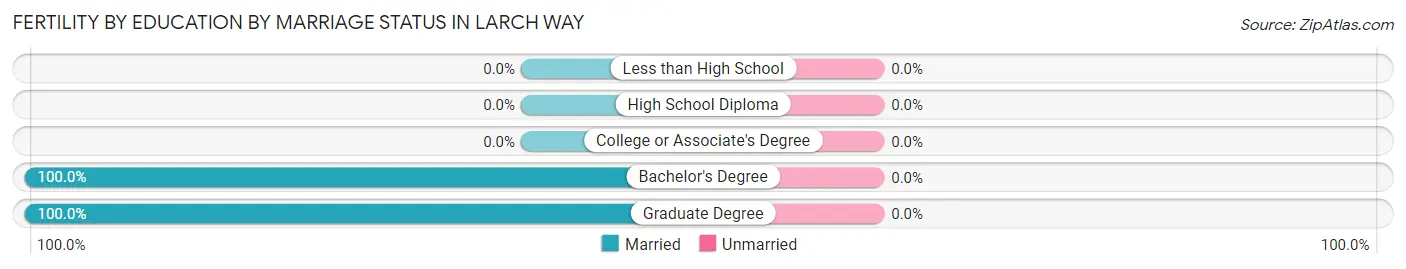
| Educational Attainment | Married | Unmarried |
| Less than High School | 0 (0.0%) | 0 (0.0%) |
| High School Diploma | 0 (0.0%) | 0 (0.0%) |
| College or Associate's Degree | 0 (0.0%) | 0 (0.0%) |
| Bachelor's Degree | 13 (100.0%) | 0 (0.0%) |
| Graduate Degree | 14 (100.0%) | 0 (0.0%) |
| Total | 27 (100.0%) | 0 (0.0%) |
Employment Characteristics in Larch Way
Employment by Class of Employer in Larch Way
Among the 2,497 employed individuals in Larch Way, private company employees (1,543 | 61.8%), local government employees (239 | 9.6%), and self-employed (not incorporated) (204 | 8.2%) make up the most common classes of employment.
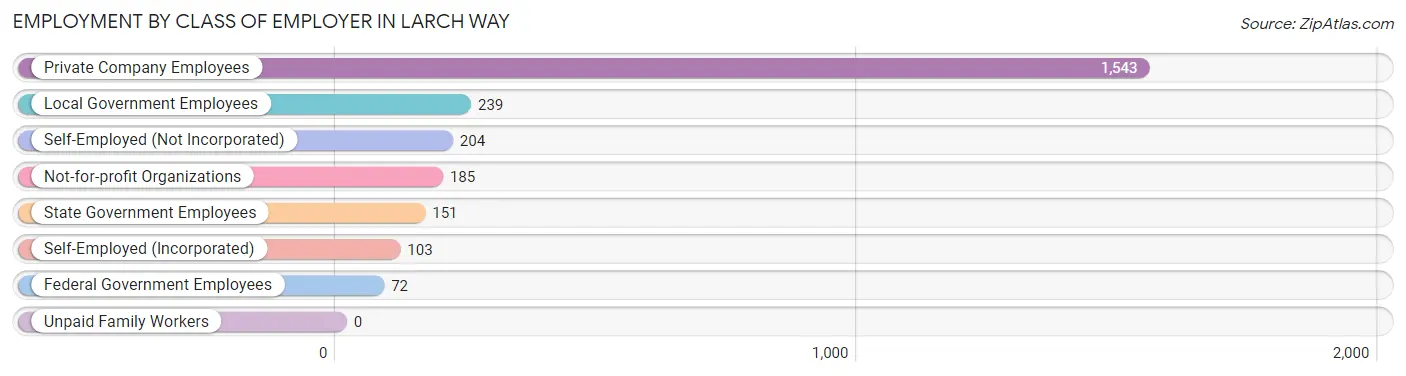
| Employer Class | # Employees | % Employees |
| Private Company Employees | 1,543 | 61.8% |
| Self-Employed (Incorporated) | 103 | 4.1% |
| Self-Employed (Not Incorporated) | 204 | 8.2% |
| Not-for-profit Organizations | 185 | 7.4% |
| Local Government Employees | 239 | 9.6% |
| State Government Employees | 151 | 6.0% |
| Federal Government Employees | 72 | 2.9% |
| Unpaid Family Workers | 0 | 0.0% |
| Total | 2,497 | 100.0% |
Employment Status by Age in Larch Way
According to the labor force statistics for Larch Way, out of the total population over 16 years of age (3,643), 71.6% or 2,608 individuals are in the labor force, with 1.0% or 26 of them unemployed. The age group with the highest labor force participation rate is 35 to 44 years, with 91.0% or 760 individuals in the labor force. Within the labor force, the 45 to 54 years age range has the highest percentage of unemployed individuals, with 4.3% or 23 of them being unemployed.
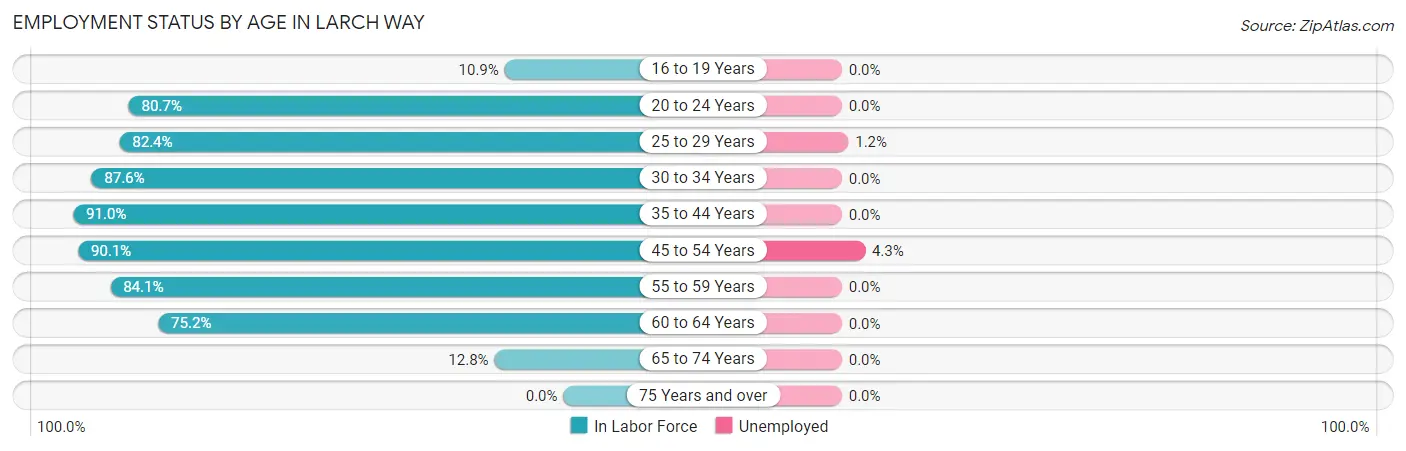
| Age Bracket | In Labor Force | Unemployed |
| 16 to 19 Years | 16 (10.9%) | 0 (0.0%) |
| 20 to 24 Years | 109 (80.7%) | 0 (0.0%) |
| 25 to 29 Years | 336 (82.4%) | 4 (1.2%) |
| 30 to 34 Years | 296 (87.6%) | 0 (0.0%) |
| 35 to 44 Years | 760 (91.0%) | 0 (0.0%) |
| 45 to 54 Years | 538 (90.1%) | 23 (4.3%) |
| 55 to 59 Years | 329 (84.1%) | 0 (0.0%) |
| 60 to 64 Years | 176 (75.2%) | 0 (0.0%) |
| 65 to 74 Years | 49 (12.8%) | 0 (0.0%) |
| 75 Years and over | 0 (0.0%) | 0 (0.0%) |
| Total | 2,608 (71.6%) | 26 (1.0%) |
Employment Status by Educational Attainment in Larch Way
According to labor force statistics for Larch Way, 86.9% of individuals (2,436) out of the total population between 25 and 64 years of age (2,803) are in the labor force, with 1.1% or 27 of them being unemployed. The group with the highest labor force participation rate are those with the educational attainment of less than high school, with 90.8% or 236 individuals in the labor force. Within the labor force, individuals with college / associate degree education have the highest percentage of unemployment, with 2.8% or 23 of them being unemployed.
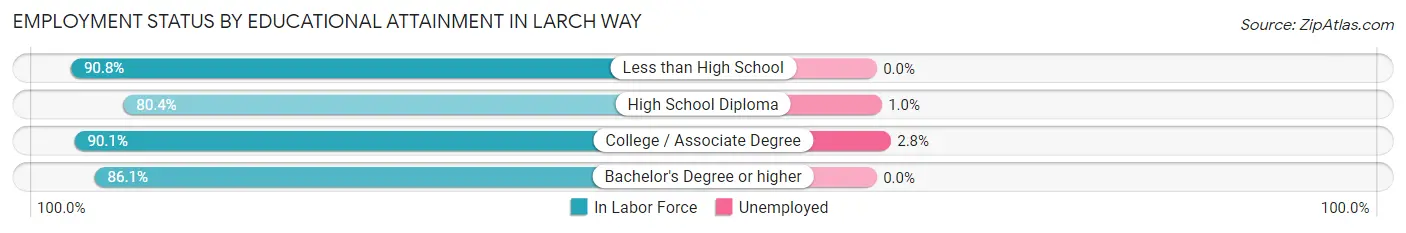
| Educational Attainment | In Labor Force | Unemployed |
| Less than High School | 236 (90.8%) | 0 (0.0%) |
| High School Diploma | 389 (80.4%) | 5 (1.0%) |
| College / Associate Degree | 835 (90.1%) | 26 (2.8%) |
| Bachelor's Degree or higher | 975 (86.1%) | 0 (0.0%) |
| Total | 2,436 (86.9%) | 31 (1.1%) |
Employment Occupations by Sex in Larch Way
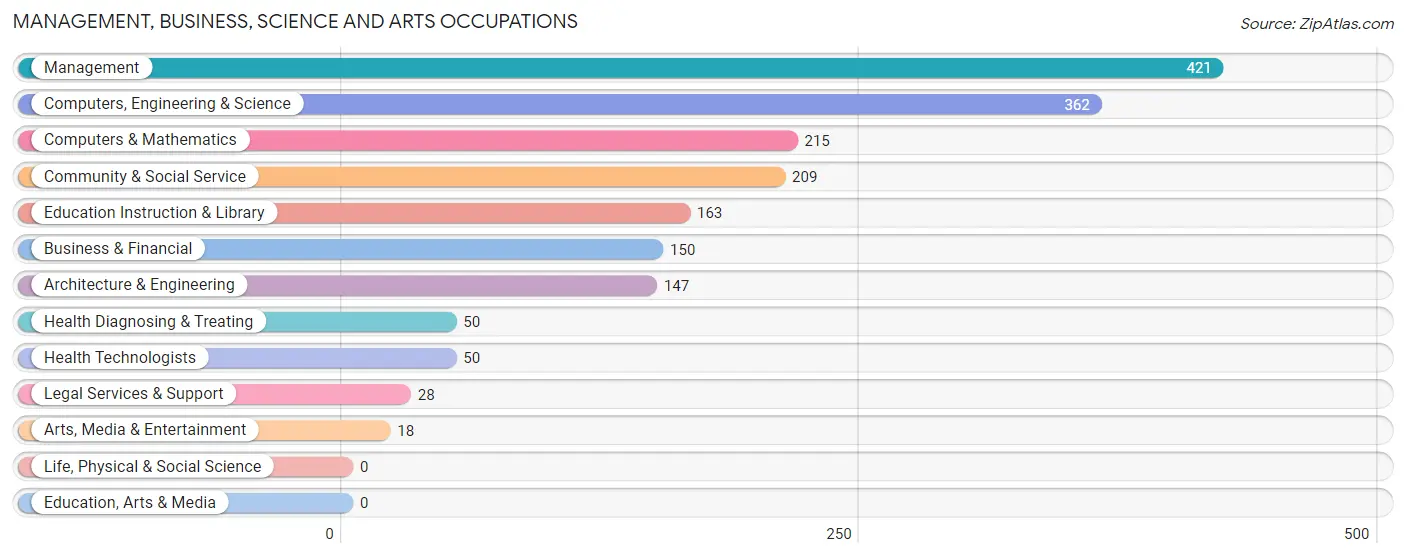
Management, Business, Science and Arts Occupations
The most common Management, Business, Science and Arts occupations in Larch Way are Management (421 | 16.3%), Computers, Engineering & Science (362 | 14.0%), Computers & Mathematics (215 | 8.3%), Community & Social Service (209 | 8.1%), and Education Instruction & Library (163 | 6.3%).
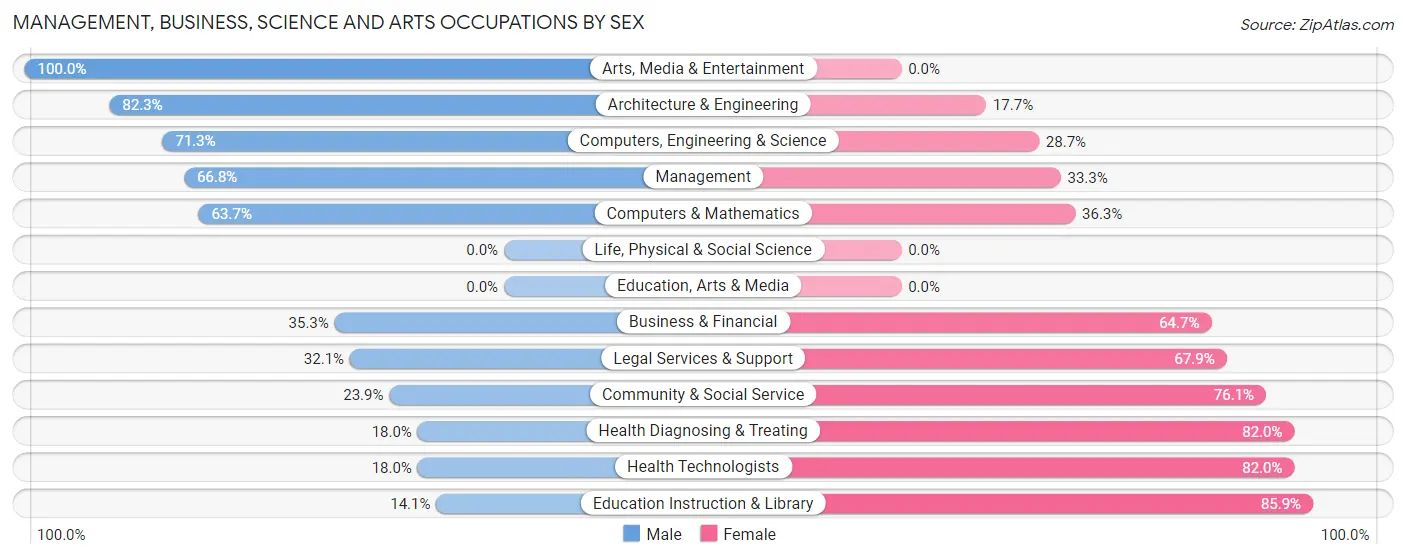
Management, Business, Science and Arts Occupations by Sex
Within the Management, Business, Science and Arts occupations in Larch Way, the most male-oriented occupations are Arts, Media & Entertainment (100.0%), Architecture & Engineering (82.3%), and Computers, Engineering & Science (71.3%), while the most female-oriented occupations are Education Instruction & Library (85.9%), Health Diagnosing & Treating (82.0%), and Health Technologists (82.0%).
| Occupation | Male | Female |
| Management | 281 (66.7%) | 140 (33.3%) |
| Business & Financial | 53 (35.3%) | 97 (64.7%) |
| Computers, Engineering & Science | 258 (71.3%) | 104 (28.7%) |
| Computers & Mathematics | 137 (63.7%) | 78 (36.3%) |
| Architecture & Engineering | 121 (82.3%) | 26 (17.7%) |
| Life, Physical & Social Science | 0 (0.0%) | 0 (0.0%) |
| Community & Social Service | 50 (23.9%) | 159 (76.1%) |
| Education, Arts & Media | 0 (0.0%) | 0 (0.0%) |
| Legal Services & Support | 9 (32.1%) | 19 (67.9%) |
| Education Instruction & Library | 23 (14.1%) | 140 (85.9%) |
| Arts, Media & Entertainment | 18 (100.0%) | 0 (0.0%) |
| Health Diagnosing & Treating | 9 (18.0%) | 41 (82.0%) |
| Health Technologists | 9 (18.0%) | 41 (82.0%) |
| Total (Category) | 651 (54.6%) | 541 (45.4%) |
| Total (Overall) | 1,530 (59.3%) | 1,052 (40.7%) |
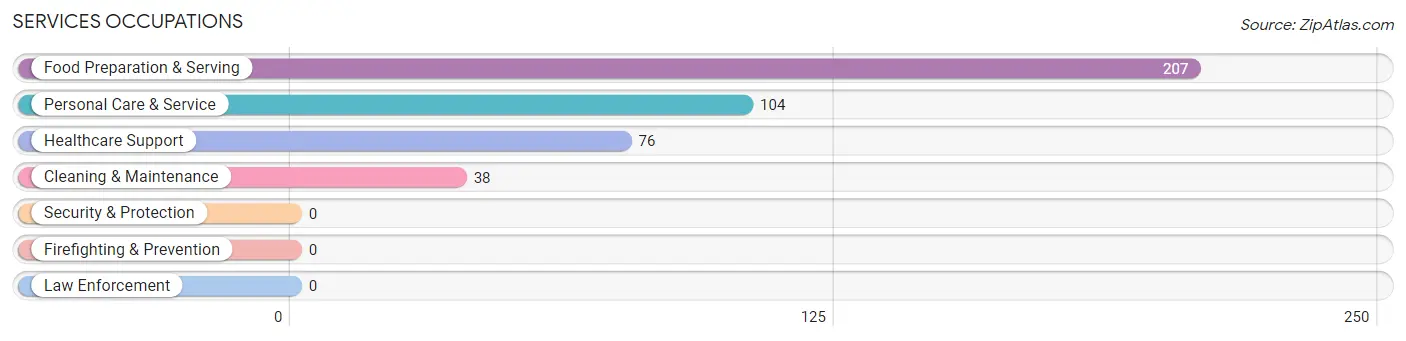
Services Occupations
The most common Services occupations in Larch Way are Food Preparation & Serving (207 | 8.0%), Personal Care & Service (104 | 4.0%), Healthcare Support (76 | 2.9%), and Cleaning & Maintenance (38 | 1.5%).
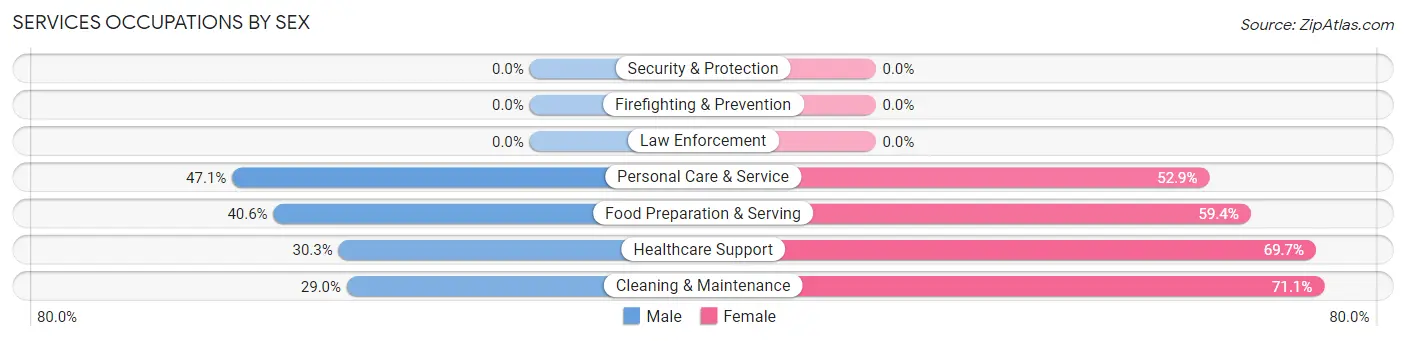
Services Occupations by Sex
Within the Services occupations in Larch Way, the most male-oriented occupations are Personal Care & Service (47.1%), Food Preparation & Serving (40.6%), and Healthcare Support (30.3%), while the most female-oriented occupations are Cleaning & Maintenance (71.1%), Healthcare Support (69.7%), and Food Preparation & Serving (59.4%).
| Occupation | Male | Female |
| Healthcare Support | 23 (30.3%) | 53 (69.7%) |
| Security & Protection | 0 (0.0%) | 0 (0.0%) |
| Firefighting & Prevention | 0 (0.0%) | 0 (0.0%) |
| Law Enforcement | 0 (0.0%) | 0 (0.0%) |
| Food Preparation & Serving | 84 (40.6%) | 123 (59.4%) |
| Cleaning & Maintenance | 11 (28.9%) | 27 (71.1%) |
| Personal Care & Service | 49 (47.1%) | 55 (52.9%) |
| Total (Category) | 167 (39.3%) | 258 (60.7%) |
| Total (Overall) | 1,530 (59.3%) | 1,052 (40.7%) |
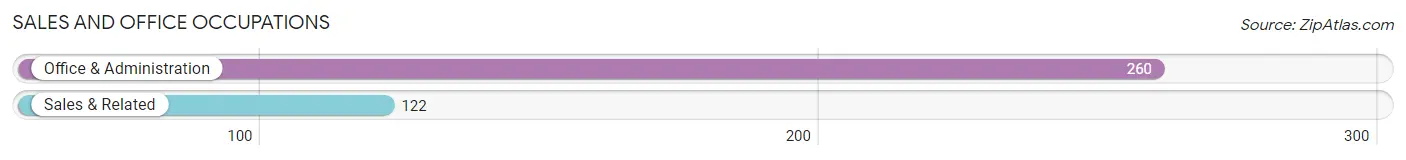
Sales and Office Occupations
The most common Sales and Office occupations in Larch Way are Office & Administration (260 | 10.1%), and Sales & Related (122 | 4.7%).
Sales and Office Occupations by Sex
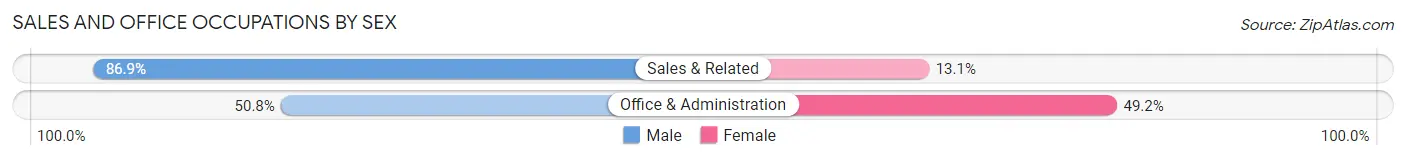
| Occupation | Male | Female |
| Sales & Related | 106 (86.9%) | 16 (13.1%) |
| Office & Administration | 132 (50.8%) | 128 (49.2%) |
| Total (Category) | 238 (62.3%) | 144 (37.7%) |
| Total (Overall) | 1,530 (59.3%) | 1,052 (40.7%) |
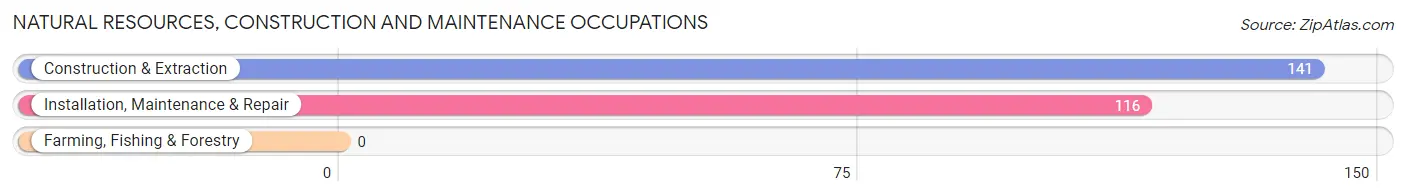
Natural Resources, Construction and Maintenance Occupations
The most common Natural Resources, Construction and Maintenance occupations in Larch Way are Construction & Extraction (141 | 5.5%), and Installation, Maintenance & Repair (116 | 4.5%).
Natural Resources, Construction and Maintenance Occupations by Sex
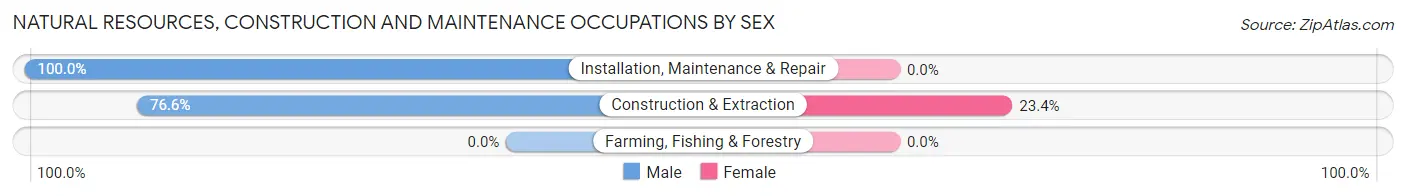
| Occupation | Male | Female |
| Farming, Fishing & Forestry | 0 (0.0%) | 0 (0.0%) |
| Construction & Extraction | 108 (76.6%) | 33 (23.4%) |
| Installation, Maintenance & Repair | 116 (100.0%) | 0 (0.0%) |
| Total (Category) | 224 (87.2%) | 33 (12.8%) |
| Total (Overall) | 1,530 (59.3%) | 1,052 (40.7%) |
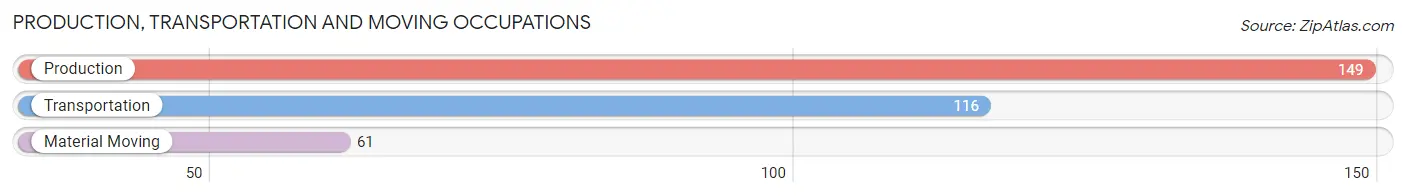
Production, Transportation and Moving Occupations
The most common Production, Transportation and Moving occupations in Larch Way are Production (149 | 5.8%), Transportation (116 | 4.5%), and Material Moving (61 | 2.4%).
Production, Transportation and Moving Occupations by Sex
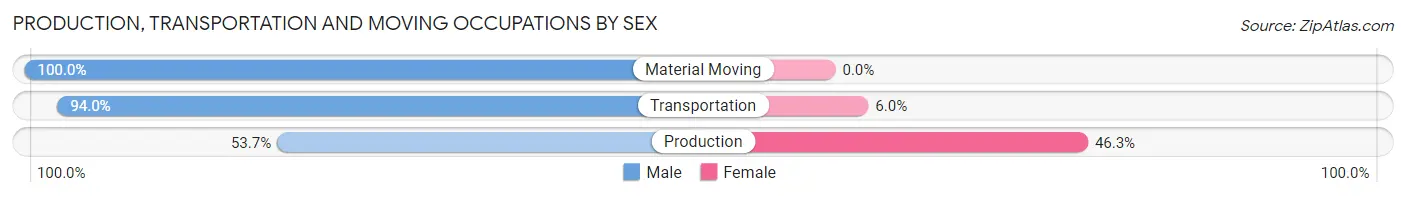
| Occupation | Male | Female |
| Production | 80 (53.7%) | 69 (46.3%) |
| Transportation | 109 (94.0%) | 7 (6.0%) |
| Material Moving | 61 (100.0%) | 0 (0.0%) |
| Total (Category) | 250 (76.7%) | 76 (23.3%) |
| Total (Overall) | 1,530 (59.3%) | 1,052 (40.7%) |
Employment Industries by Sex in Larch Way
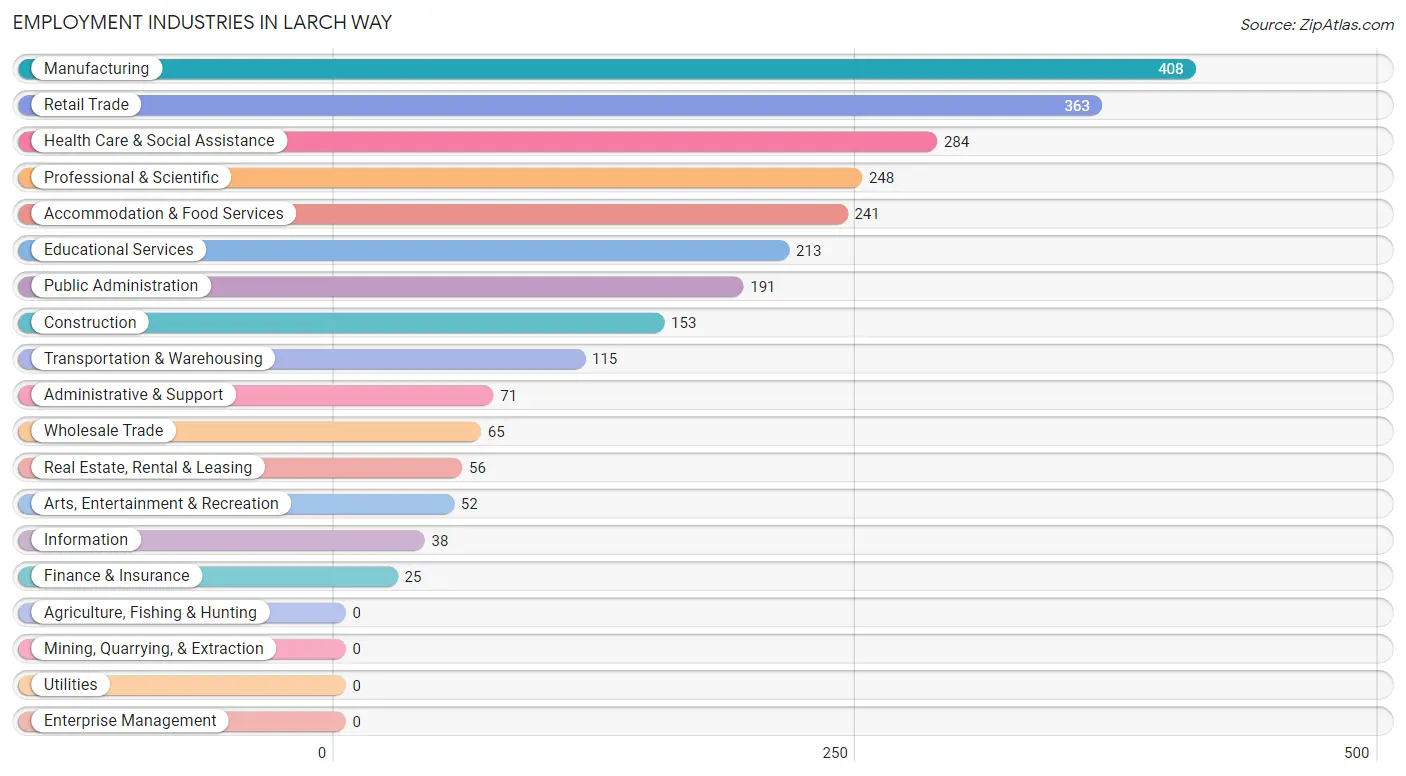
Employment Industries in Larch Way
The major employment industries in Larch Way include Manufacturing (408 | 15.8%), Retail Trade (363 | 14.1%), Health Care & Social Assistance (284 | 11.0%), Professional & Scientific (248 | 9.6%), and Accommodation & Food Services (241 | 9.3%).
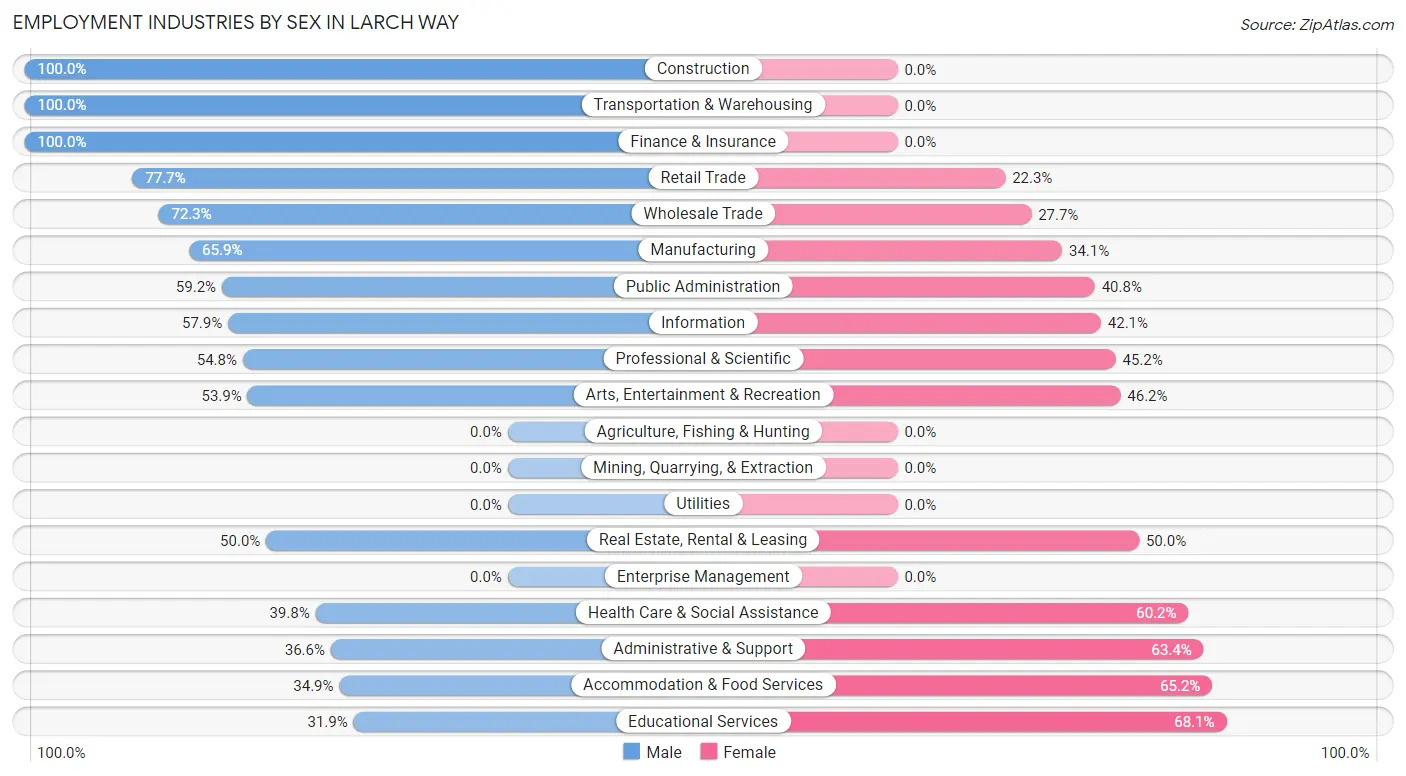
Employment Industries by Sex in Larch Way
The Larch Way industries that see more men than women are Construction (100.0%), Transportation & Warehousing (100.0%), and Finance & Insurance (100.0%), whereas the industries that tend to have a higher number of women are Educational Services (68.1%), Accommodation & Food Services (65.1%), and Administrative & Support (63.4%).
| Industry | Male | Female |
| Agriculture, Fishing & Hunting | 0 (0.0%) | 0 (0.0%) |
| Mining, Quarrying, & Extraction | 0 (0.0%) | 0 (0.0%) |
| Construction | 153 (100.0%) | 0 (0.0%) |
| Manufacturing | 269 (65.9%) | 139 (34.1%) |
| Wholesale Trade | 47 (72.3%) | 18 (27.7%) |
| Retail Trade | 282 (77.7%) | 81 (22.3%) |
| Transportation & Warehousing | 115 (100.0%) | 0 (0.0%) |
| Utilities | 0 (0.0%) | 0 (0.0%) |
| Information | 22 (57.9%) | 16 (42.1%) |
| Finance & Insurance | 25 (100.0%) | 0 (0.0%) |
| Real Estate, Rental & Leasing | 28 (50.0%) | 28 (50.0%) |
| Professional & Scientific | 136 (54.8%) | 112 (45.2%) |
| Enterprise Management | 0 (0.0%) | 0 (0.0%) |
| Administrative & Support | 26 (36.6%) | 45 (63.4%) |
| Educational Services | 68 (31.9%) | 145 (68.1%) |
| Health Care & Social Assistance | 113 (39.8%) | 171 (60.2%) |
| Arts, Entertainment & Recreation | 28 (53.8%) | 24 (46.2%) |
| Accommodation & Food Services | 84 (34.8%) | 157 (65.1%) |
| Public Administration | 113 (59.2%) | 78 (40.8%) |
| Total | 1,530 (59.3%) | 1,052 (40.7%) |
Education in Larch Way
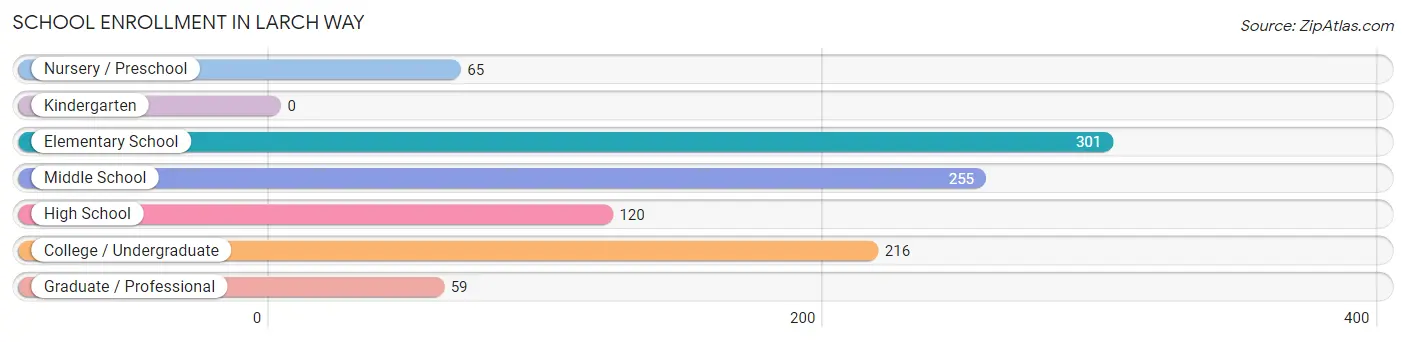
School Enrollment in Larch Way
The most common levels of schooling among the 1,016 students in Larch Way are elementary school (301 | 29.6%), middle school (255 | 25.1%), and college / undergraduate (216 | 21.3%).
| School Level | # Students | % Students |
| Nursery / Preschool | 65 | 6.4% |
| Kindergarten | 0 | 0.0% |
| Elementary School | 301 | 29.6% |
| Middle School | 255 | 25.1% |
| High School | 120 | 11.8% |
| College / Undergraduate | 216 | 21.3% |
| Graduate / Professional | 59 | 5.8% |
| Total | 1,016 | 100.0% |
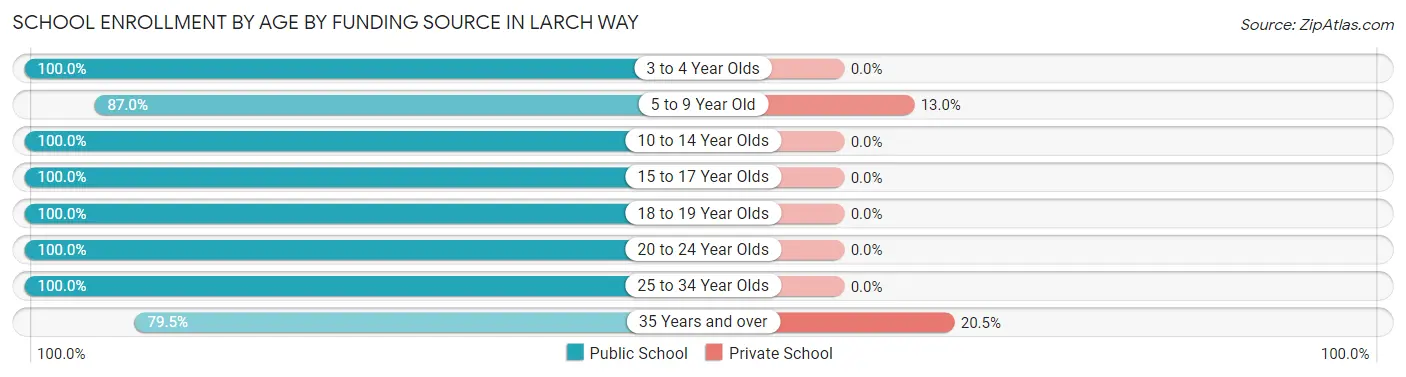
School Enrollment by Age by Funding Source in Larch Way
Out of a total of 1,016 students who are enrolled in schools in Larch Way, 31 (3.1%) attend a private institution, while the remaining 985 (96.9%) are enrolled in public schools. The age group of 35 years and over has the highest likelihood of being enrolled in private schools, with 8 (20.5% in the age bracket) enrolled. Conversely, the age group of 3 to 4 year olds has the lowest likelihood of being enrolled in a private school, with 41 (100.0% in the age bracket) attending a public institution.
| Age Bracket | Public School | Private School |
| 3 to 4 Year Olds | 41 (100.0%) | 0 (0.0%) |
| 5 to 9 Year Old | 160 (87.0%) | 24 (13.0%) |
| 10 to 14 Year Olds | 430 (100.0%) | 0 (0.0%) |
| 15 to 17 Year Olds | 53 (100.0%) | 0 (0.0%) |
| 18 to 19 Year Olds | 108 (100.0%) | 0 (0.0%) |
| 20 to 24 Year Olds | 95 (100.0%) | 0 (0.0%) |
| 25 to 34 Year Olds | 66 (100.0%) | 0 (0.0%) |
| 35 Years and over | 31 (79.5%) | 8 (20.5%) |
| Total | 985 (96.9%) | 31 (3.1%) |
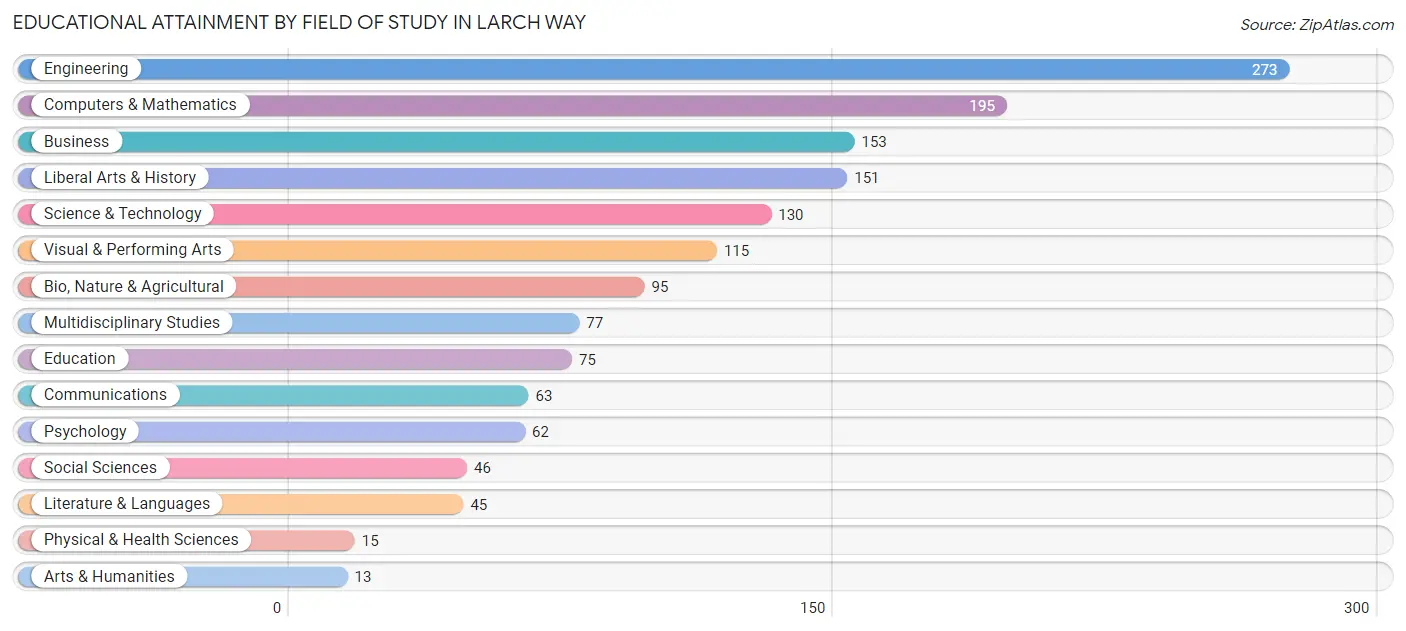
Educational Attainment by Field of Study in Larch Way
Engineering (273 | 18.1%), computers & mathematics (195 | 12.9%), business (153 | 10.2%), liberal arts & history (151 | 10.0%), and science & technology (130 | 8.6%) are the most common fields of study among 1,508 individuals in Larch Way who have obtained a bachelor's degree or higher.
| Field of Study | # Graduates | % Graduates |
| Computers & Mathematics | 195 | 12.9% |
| Bio, Nature & Agricultural | 95 | 6.3% |
| Physical & Health Sciences | 15 | 1.0% |
| Psychology | 62 | 4.1% |
| Social Sciences | 46 | 3.0% |
| Engineering | 273 | 18.1% |
| Multidisciplinary Studies | 77 | 5.1% |
| Science & Technology | 130 | 8.6% |
| Business | 153 | 10.2% |
| Education | 75 | 5.0% |
| Literature & Languages | 45 | 3.0% |
| Liberal Arts & History | 151 | 10.0% |
| Visual & Performing Arts | 115 | 7.6% |
| Communications | 63 | 4.2% |
| Arts & Humanities | 13 | 0.9% |
| Total | 1,508 | 100.0% |
Transportation & Commute in Larch Way
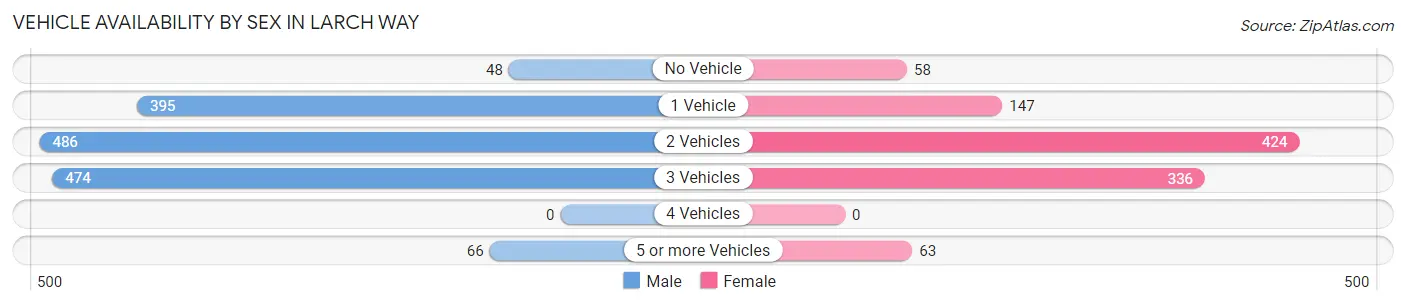
Vehicle Availability by Sex in Larch Way
The most prevalent vehicle ownership categories in Larch Way are males with 2 vehicles (486, accounting for 33.1%) and females with 2 vehicles (424, making up 47.3%).
| Vehicles Available | Male | Female |
| No Vehicle | 48 (3.3%) | 58 (5.6%) |
| 1 Vehicle | 395 (26.9%) | 147 (14.3%) |
| 2 Vehicles | 486 (33.1%) | 424 (41.2%) |
| 3 Vehicles | 474 (32.3%) | 336 (32.7%) |
| 4 Vehicles | 0 (0.0%) | 0 (0.0%) |
| 5 or more Vehicles | 66 (4.5%) | 63 (6.1%) |
| Total | 1,469 (100.0%) | 1,028 (100.0%) |
Commute Time in Larch Way
The most frequently occuring commute durations in Larch Way are 45 to 59 minutes (316 commuters, 15.5%), 10 to 14 minutes (257 commuters, 12.6%), and 20 to 24 minutes (255 commuters, 12.5%).
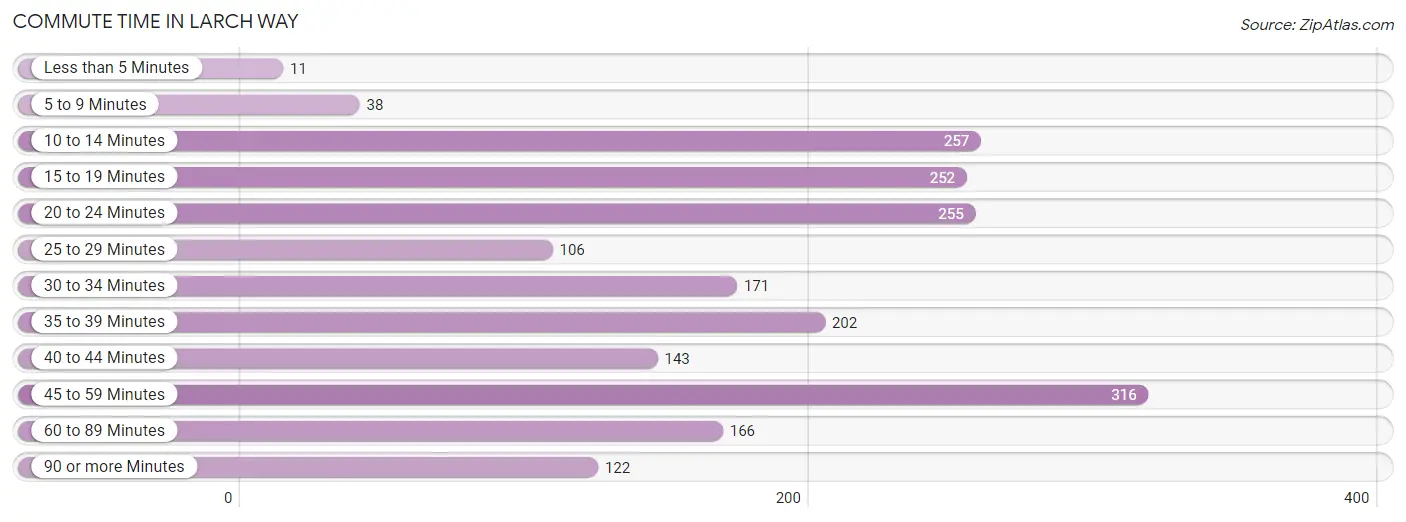
| Commute Time | # Commuters | % Commuters |
| Less than 5 Minutes | 11 | 0.5% |
| 5 to 9 Minutes | 38 | 1.9% |
| 10 to 14 Minutes | 257 | 12.6% |
| 15 to 19 Minutes | 252 | 12.4% |
| 20 to 24 Minutes | 255 | 12.5% |
| 25 to 29 Minutes | 106 | 5.2% |
| 30 to 34 Minutes | 171 | 8.4% |
| 35 to 39 Minutes | 202 | 9.9% |
| 40 to 44 Minutes | 143 | 7.0% |
| 45 to 59 Minutes | 316 | 15.5% |
| 60 to 89 Minutes | 166 | 8.1% |
| 90 or more Minutes | 122 | 6.0% |
Commute Time by Sex in Larch Way
The most common commute times in Larch Way are 45 to 59 minutes (189 commuters, 16.4%) for males and 30 to 34 minutes (146 commuters, 16.5%) for females.
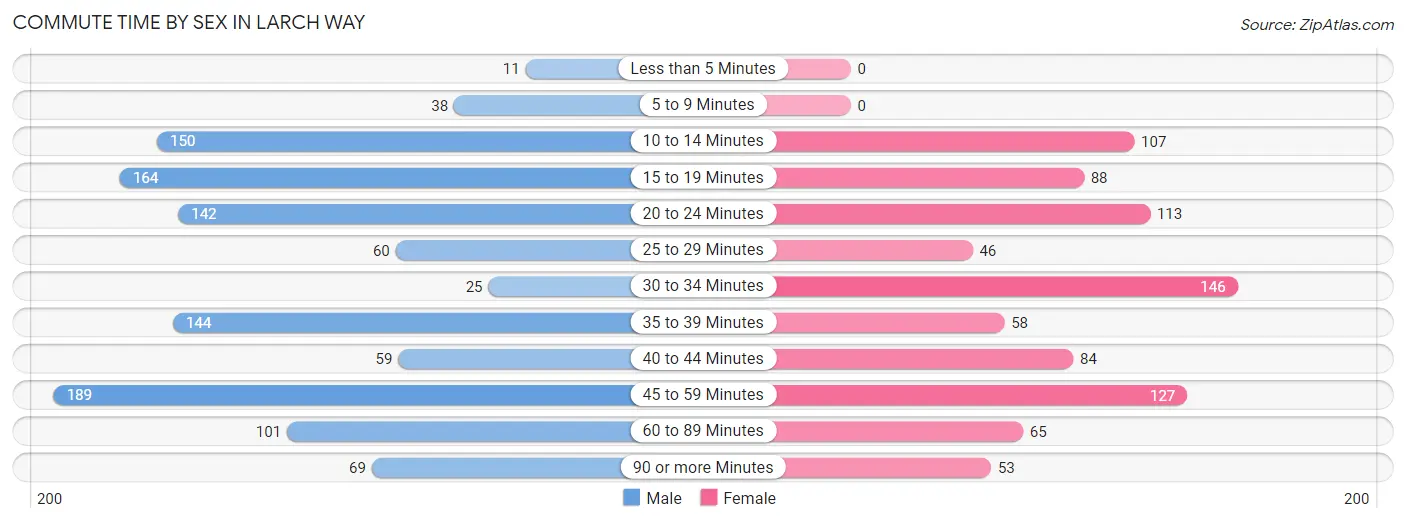
| Commute Time | Male | Female |
| Less than 5 Minutes | 11 (0.9%) | 0 (0.0%) |
| 5 to 9 Minutes | 38 (3.3%) | 0 (0.0%) |
| 10 to 14 Minutes | 150 (13.0%) | 107 (12.1%) |
| 15 to 19 Minutes | 164 (14.2%) | 88 (9.9%) |
| 20 to 24 Minutes | 142 (12.3%) | 113 (12.7%) |
| 25 to 29 Minutes | 60 (5.2%) | 46 (5.2%) |
| 30 to 34 Minutes | 25 (2.2%) | 146 (16.5%) |
| 35 to 39 Minutes | 144 (12.5%) | 58 (6.5%) |
| 40 to 44 Minutes | 59 (5.1%) | 84 (9.5%) |
| 45 to 59 Minutes | 189 (16.4%) | 127 (14.3%) |
| 60 to 89 Minutes | 101 (8.8%) | 65 (7.3%) |
| 90 or more Minutes | 69 (6.0%) | 53 (6.0%) |
Time of Departure to Work by Sex in Larch Way
The most frequent times of departure to work in Larch Way are 6:00 AM to 6:29 AM (177, 15.4%) for males and 9:00 AM to 9:59 AM (137, 15.4%) for females.
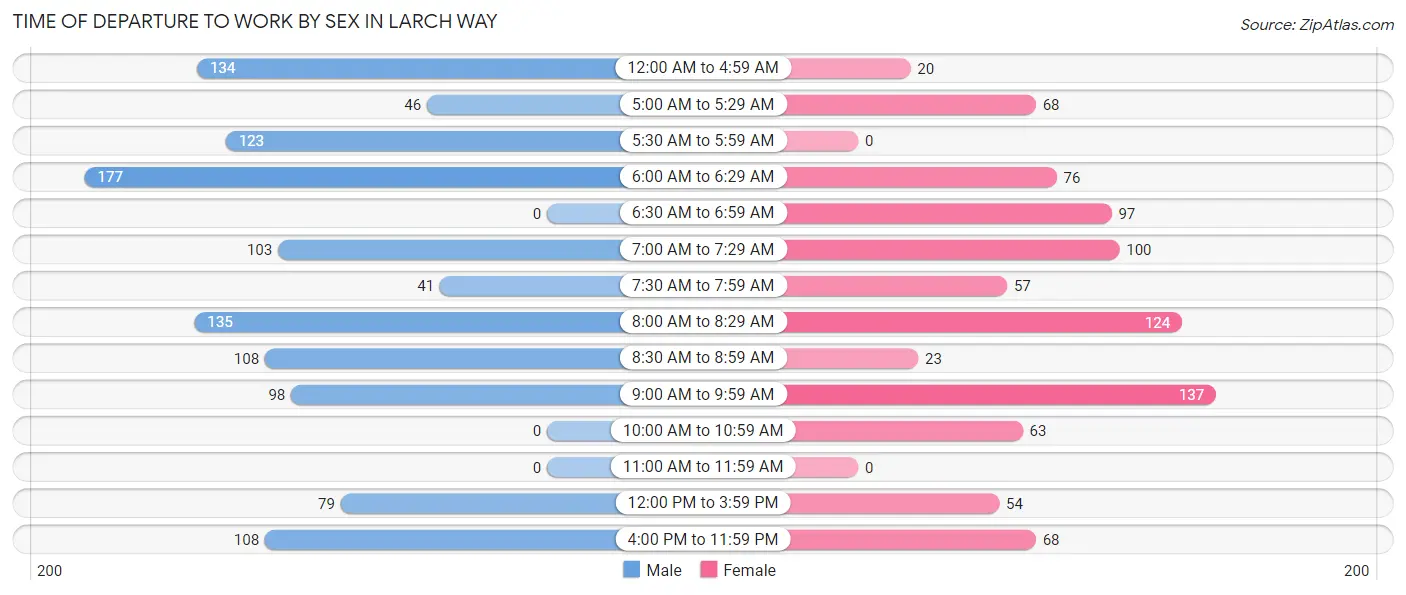
| Time of Departure | Male | Female |
| 12:00 AM to 4:59 AM | 134 (11.6%) | 20 (2.2%) |
| 5:00 AM to 5:29 AM | 46 (4.0%) | 68 (7.7%) |
| 5:30 AM to 5:59 AM | 123 (10.7%) | 0 (0.0%) |
| 6:00 AM to 6:29 AM | 177 (15.4%) | 76 (8.6%) |
| 6:30 AM to 6:59 AM | 0 (0.0%) | 97 (10.9%) |
| 7:00 AM to 7:29 AM | 103 (8.9%) | 100 (11.3%) |
| 7:30 AM to 7:59 AM | 41 (3.6%) | 57 (6.4%) |
| 8:00 AM to 8:29 AM | 135 (11.7%) | 124 (14.0%) |
| 8:30 AM to 8:59 AM | 108 (9.4%) | 23 (2.6%) |
| 9:00 AM to 9:59 AM | 98 (8.5%) | 137 (15.4%) |
| 10:00 AM to 10:59 AM | 0 (0.0%) | 63 (7.1%) |
| 11:00 AM to 11:59 AM | 0 (0.0%) | 0 (0.0%) |
| 12:00 PM to 3:59 PM | 79 (6.9%) | 54 (6.1%) |
| 4:00 PM to 11:59 PM | 108 (9.4%) | 68 (7.7%) |
| Total | 1,152 (100.0%) | 887 (100.0%) |
Housing Occupancy in Larch Way
Occupancy by Ownership in Larch Way
Of the total 1,688 dwellings in Larch Way, owner-occupied units account for 1,064 (63.0%), while renter-occupied units make up 624 (37.0%).
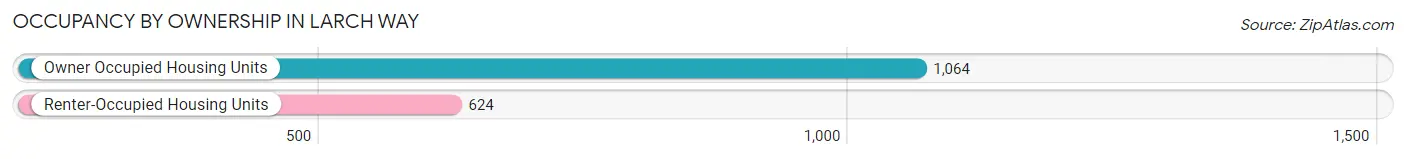
| Occupancy | # Housing Units | % Housing Units |
| Owner Occupied Housing Units | 1,064 | 63.0% |
| Renter-Occupied Housing Units | 624 | 37.0% |
| Total Occupied Housing Units | 1,688 | 100.0% |
Occupancy by Household Size in Larch Way
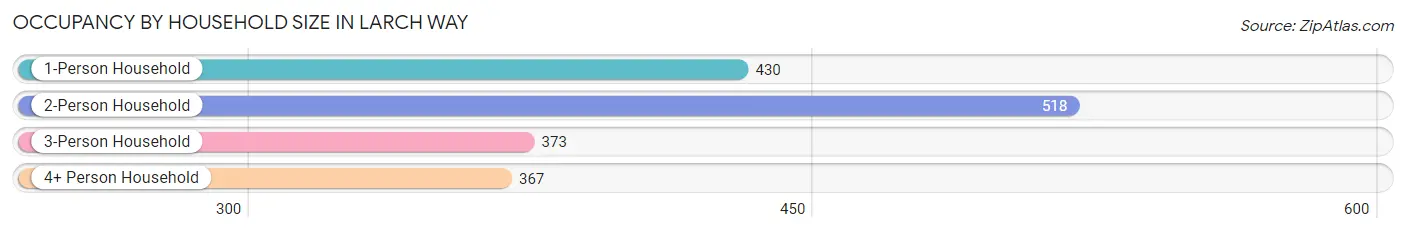
| Household Size | # Housing Units | % Housing Units |
| 1-Person Household | 430 | 25.5% |
| 2-Person Household | 518 | 30.7% |
| 3-Person Household | 373 | 22.1% |
| 4+ Person Household | 367 | 21.7% |
| Total Housing Units | 1,688 | 100.0% |
Occupancy by Ownership by Household Size in Larch Way
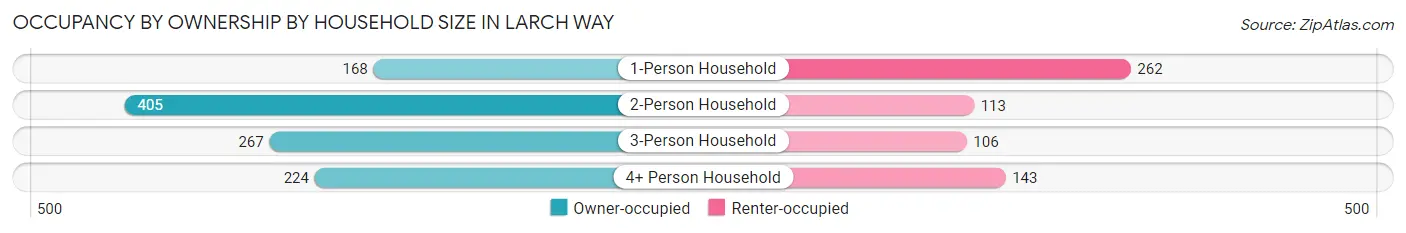
| Household Size | Owner-occupied | Renter-occupied |
| 1-Person Household | 168 (39.1%) | 262 (60.9%) |
| 2-Person Household | 405 (78.2%) | 113 (21.8%) |
| 3-Person Household | 267 (71.6%) | 106 (28.4%) |
| 4+ Person Household | 224 (61.0%) | 143 (39.0%) |
| Total Housing Units | 1,064 (63.0%) | 624 (37.0%) |
Occupancy by Educational Attainment in Larch Way
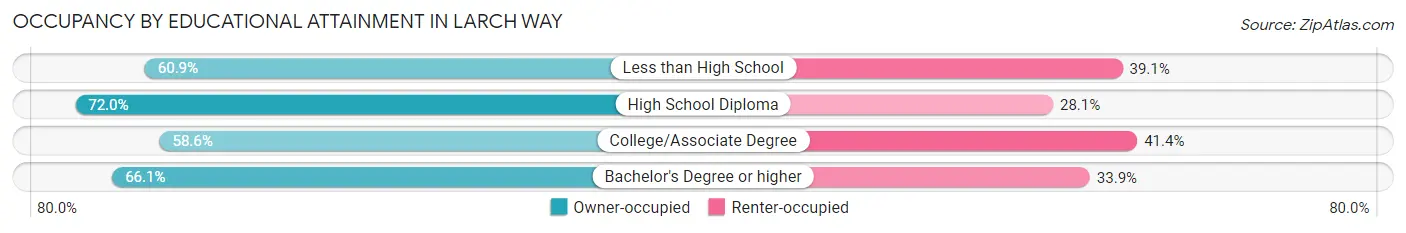
| Household Size | Owner-occupied | Renter-occupied |
| Less than High School | 53 (60.9%) | 34 (39.1%) |
| High School Diploma | 59 (72.0%) | 23 (28.1%) |
| College/Associate Degree | 406 (58.6%) | 287 (41.4%) |
| Bachelor's Degree or higher | 546 (66.1%) | 280 (33.9%) |
Occupancy by Age of Householder in Larch Way
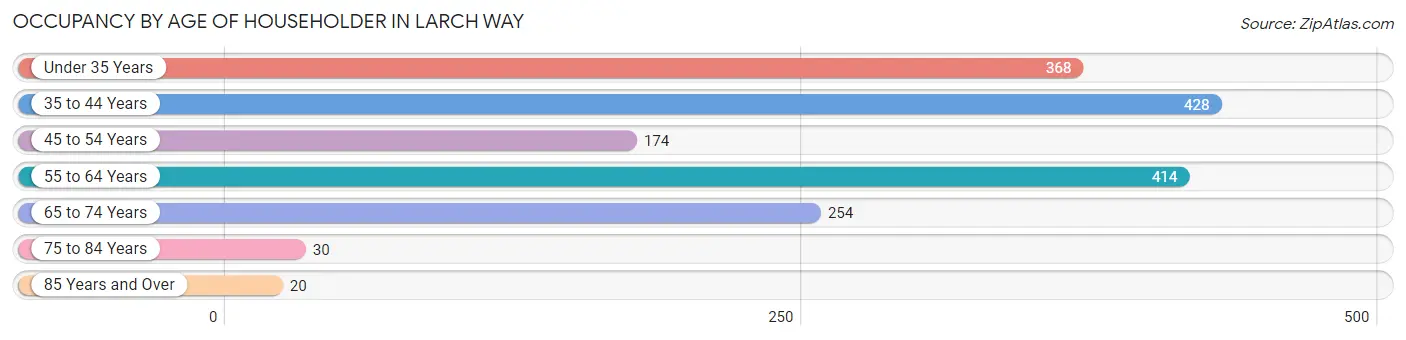
| Age Bracket | # Households | % Households |
| Under 35 Years | 368 | 21.8% |
| 35 to 44 Years | 428 | 25.4% |
| 45 to 54 Years | 174 | 10.3% |
| 55 to 64 Years | 414 | 24.5% |
| 65 to 74 Years | 254 | 15.0% |
| 75 to 84 Years | 30 | 1.8% |
| 85 Years and Over | 20 | 1.2% |
| Total | 1,688 | 100.0% |
Housing Finances in Larch Way
Median Income by Occupancy in Larch Way
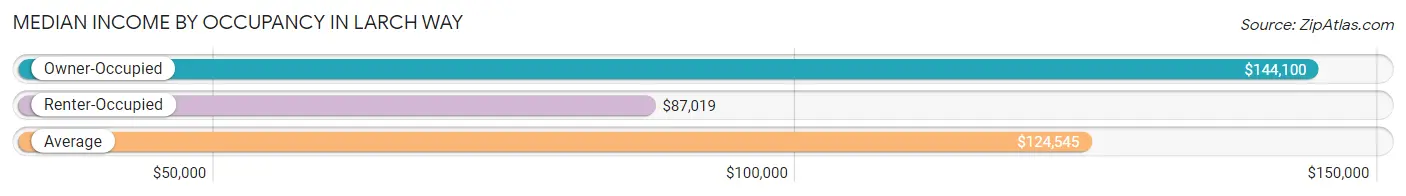
| Occupancy Type | # Households | Median Income |
| Owner-Occupied | 1,064 (63.0%) | $144,100 |
| Renter-Occupied | 624 (37.0%) | $87,019 |
| Average | 1,688 (100.0%) | $124,545 |
Occupancy by Householder Income Bracket in Larch Way
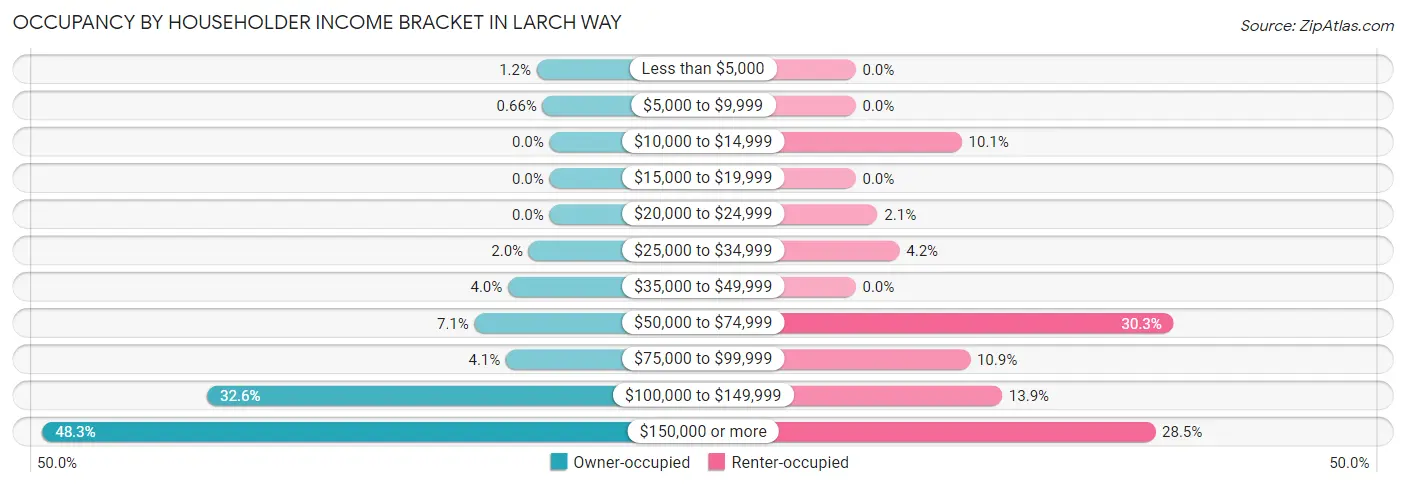
| Income Bracket | Owner-occupied | Renter-occupied |
| Less than $5,000 | 13 (1.2%) | 0 (0.0%) |
| $5,000 to $9,999 | 7 (0.7%) | 0 (0.0%) |
| $10,000 to $14,999 | 0 (0.0%) | 63 (10.1%) |
| $15,000 to $19,999 | 0 (0.0%) | 0 (0.0%) |
| $20,000 to $24,999 | 0 (0.0%) | 13 (2.1%) |
| $25,000 to $34,999 | 21 (2.0%) | 26 (4.2%) |
| $35,000 to $49,999 | 42 (4.0%) | 0 (0.0%) |
| $50,000 to $74,999 | 76 (7.1%) | 189 (30.3%) |
| $75,000 to $99,999 | 44 (4.1%) | 68 (10.9%) |
| $100,000 to $149,999 | 347 (32.6%) | 87 (13.9%) |
| $150,000 or more | 514 (48.3%) | 178 (28.5%) |
| Total | 1,064 (100.0%) | 624 (100.0%) |
Monthly Housing Cost Tiers in Larch Way
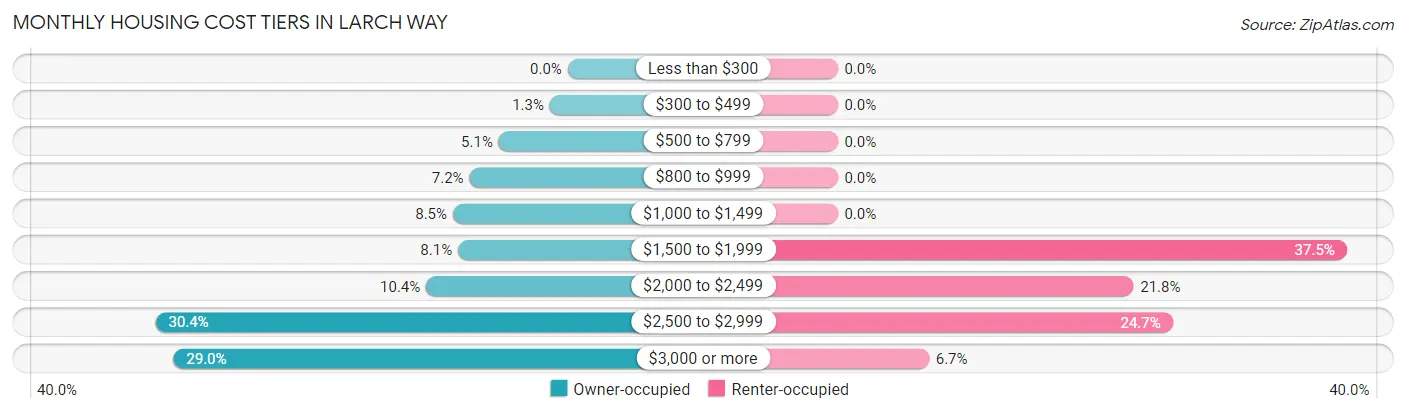
| Monthly Cost | Owner-occupied | Renter-occupied |
| Less than $300 | 0 (0.0%) | 0 (0.0%) |
| $300 to $499 | 14 (1.3%) | 0 (0.0%) |
| $500 to $799 | 54 (5.1%) | 0 (0.0%) |
| $800 to $999 | 77 (7.2%) | 0 (0.0%) |
| $1,000 to $1,499 | 90 (8.5%) | 0 (0.0%) |
| $1,500 to $1,999 | 86 (8.1%) | 234 (37.5%) |
| $2,000 to $2,499 | 111 (10.4%) | 136 (21.8%) |
| $2,500 to $2,999 | 323 (30.4%) | 154 (24.7%) |
| $3,000 or more | 309 (29.0%) | 42 (6.7%) |
| Total | 1,064 (100.0%) | 624 (100.0%) |
Physical Housing Characteristics in Larch Way
Housing Structures in Larch Way
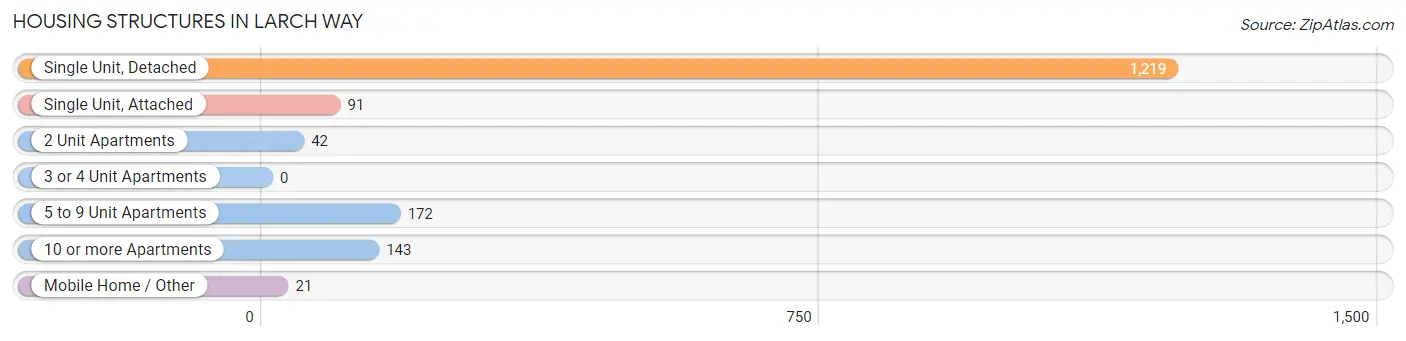
| Structure Type | # Housing Units | % Housing Units |
| Single Unit, Detached | 1,219 | 72.2% |
| Single Unit, Attached | 91 | 5.4% |
| 2 Unit Apartments | 42 | 2.5% |
| 3 or 4 Unit Apartments | 0 | 0.0% |
| 5 to 9 Unit Apartments | 172 | 10.2% |
| 10 or more Apartments | 143 | 8.5% |
| Mobile Home / Other | 21 | 1.2% |
| Total | 1,688 | 100.0% |
Housing Structures by Occupancy in Larch Way
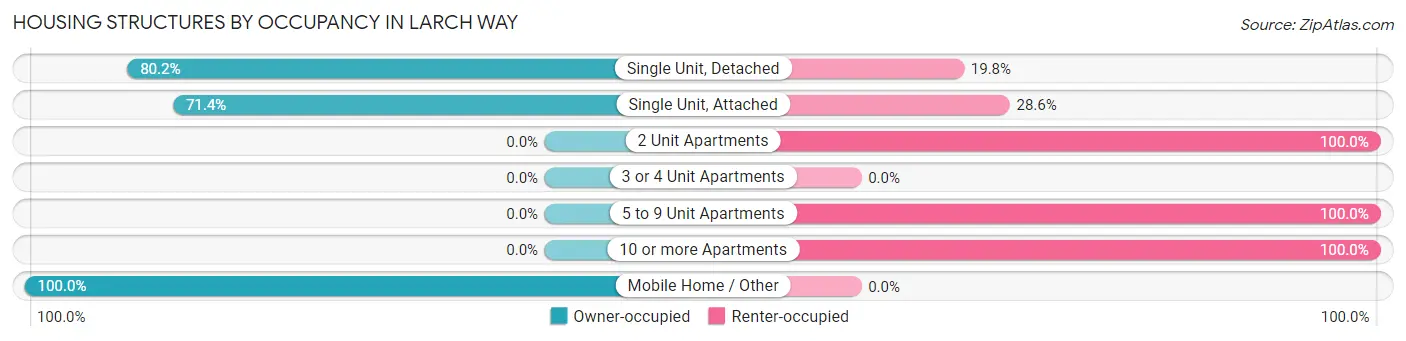
| Structure Type | Owner-occupied | Renter-occupied |
| Single Unit, Detached | 978 (80.2%) | 241 (19.8%) |
| Single Unit, Attached | 65 (71.4%) | 26 (28.6%) |
| 2 Unit Apartments | 0 (0.0%) | 42 (100.0%) |
| 3 or 4 Unit Apartments | 0 (0.0%) | 0 (0.0%) |
| 5 to 9 Unit Apartments | 0 (0.0%) | 172 (100.0%) |
| 10 or more Apartments | 0 (0.0%) | 143 (100.0%) |
| Mobile Home / Other | 21 (100.0%) | 0 (0.0%) |
| Total | 1,064 (63.0%) | 624 (37.0%) |
Housing Structures by Number of Rooms in Larch Way
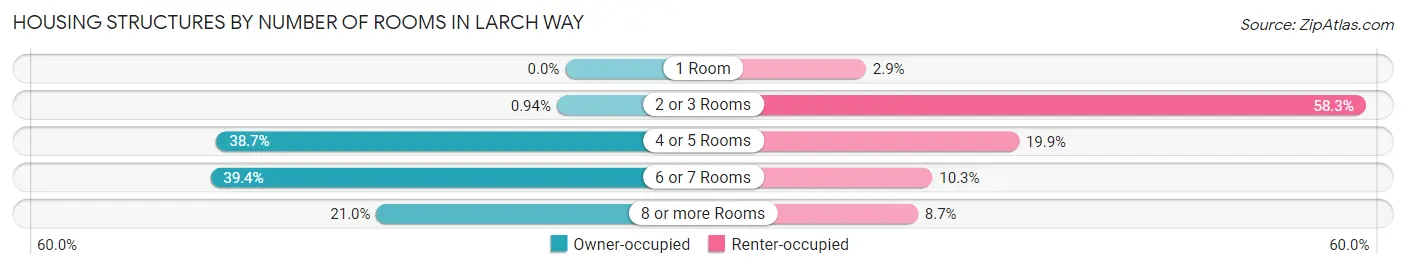
| Number of Rooms | Owner-occupied | Renter-occupied |
| 1 Room | 0 (0.0%) | 18 (2.9%) |
| 2 or 3 Rooms | 10 (0.9%) | 364 (58.3%) |
| 4 or 5 Rooms | 412 (38.7%) | 124 (19.9%) |
| 6 or 7 Rooms | 419 (39.4%) | 64 (10.3%) |
| 8 or more Rooms | 223 (21.0%) | 54 (8.6%) |
| Total | 1,064 (100.0%) | 624 (100.0%) |
Housing Structure by Heating Type in Larch Way
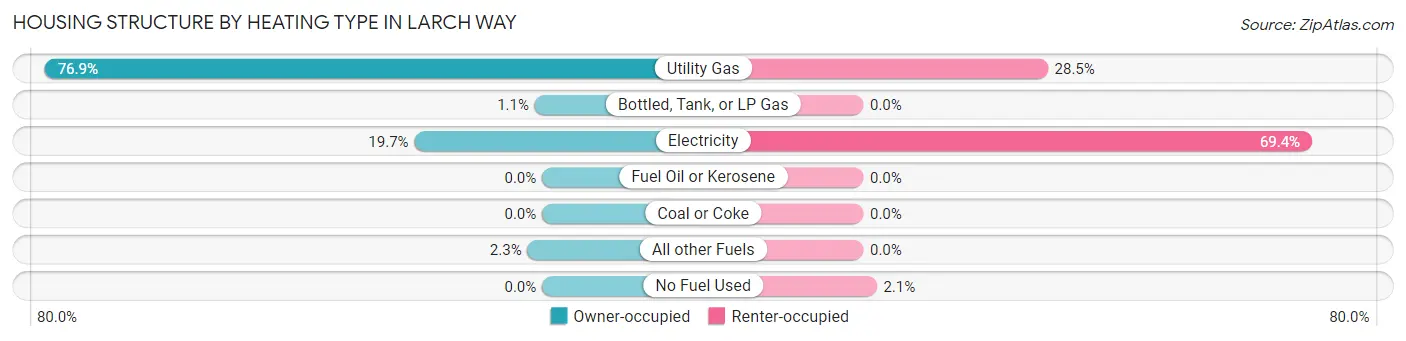
| Heating Type | Owner-occupied | Renter-occupied |
| Utility Gas | 818 (76.9%) | 178 (28.5%) |
| Bottled, Tank, or LP Gas | 12 (1.1%) | 0 (0.0%) |
| Electricity | 210 (19.7%) | 433 (69.4%) |
| Fuel Oil or Kerosene | 0 (0.0%) | 0 (0.0%) |
| Coal or Coke | 0 (0.0%) | 0 (0.0%) |
| All other Fuels | 24 (2.3%) | 0 (0.0%) |
| No Fuel Used | 0 (0.0%) | 13 (2.1%) |
| Total | 1,064 (100.0%) | 624 (100.0%) |
Household Vehicle Usage in Larch Way
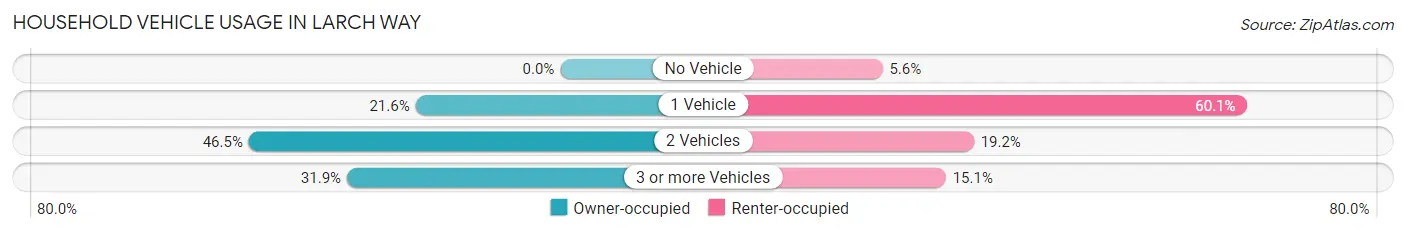
| Vehicles per Household | Owner-occupied | Renter-occupied |
| No Vehicle | 0 (0.0%) | 35 (5.6%) |
| 1 Vehicle | 230 (21.6%) | 375 (60.1%) |
| 2 Vehicles | 495 (46.5%) | 120 (19.2%) |
| 3 or more Vehicles | 339 (31.9%) | 94 (15.1%) |
| Total | 1,064 (100.0%) | 624 (100.0%) |
Real Estate & Mortgages in Larch Way
Real Estate and Mortgage Overview in Larch Way
| Characteristic | Without Mortgage | With Mortgage |
| Housing Units | 229 | 835 |
| Median Property Value | $758,600 | $699,300 |
| Median Household Income | $127,841 | $409 |
| Monthly Housing Costs | $867 | $309 |
| Real Estate Taxes | $6,683 | $37 |
Property Value by Mortgage Status in Larch Way
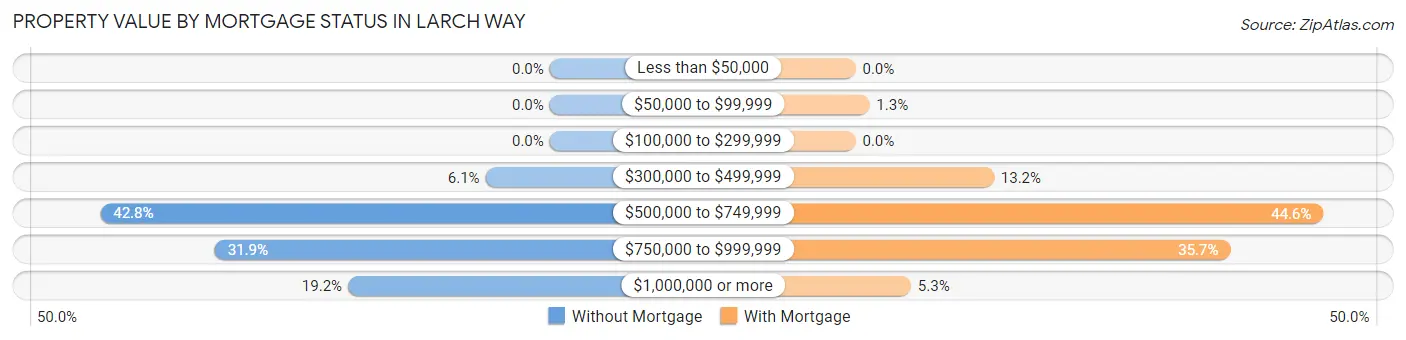
| Property Value | Without Mortgage | With Mortgage |
| Less than $50,000 | 0 (0.0%) | 0 (0.0%) |
| $50,000 to $99,999 | 0 (0.0%) | 11 (1.3%) |
| $100,000 to $299,999 | 0 (0.0%) | 0 (0.0%) |
| $300,000 to $499,999 | 14 (6.1%) | 110 (13.2%) |
| $500,000 to $749,999 | 98 (42.8%) | 372 (44.6%) |
| $750,000 to $999,999 | 73 (31.9%) | 298 (35.7%) |
| $1,000,000 or more | 44 (19.2%) | 44 (5.3%) |
| Total | 229 (100.0%) | 835 (100.0%) |
Household Income by Mortgage Status in Larch Way
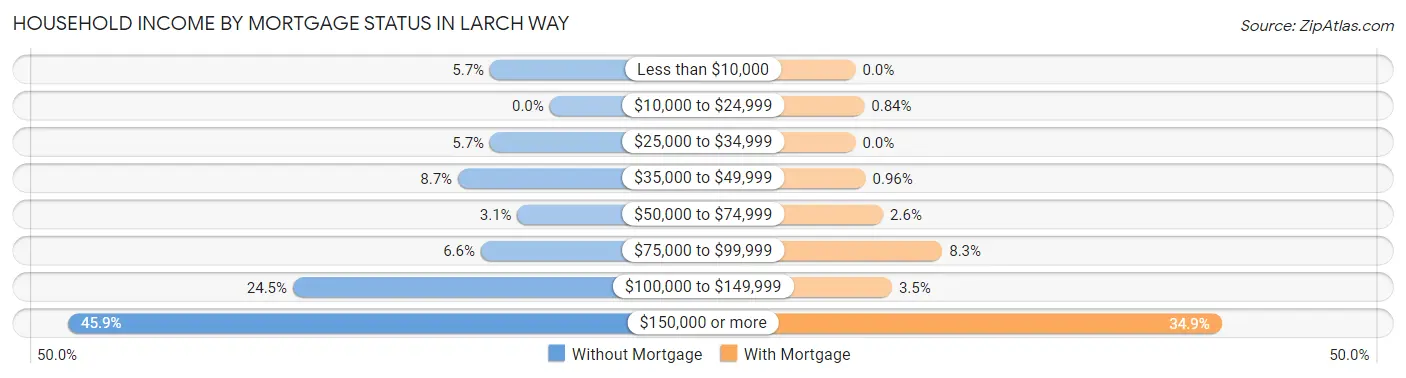
| Household Income | Without Mortgage | With Mortgage |
| Less than $10,000 | 13 (5.7%) | 0 (0.0%) |
| $10,000 to $24,999 | 0 (0.0%) | 7 (0.8%) |
| $25,000 to $34,999 | 13 (5.7%) | 0 (0.0%) |
| $35,000 to $49,999 | 20 (8.7%) | 8 (1.0%) |
| $50,000 to $74,999 | 7 (3.1%) | 22 (2.6%) |
| $75,000 to $99,999 | 15 (6.6%) | 69 (8.3%) |
| $100,000 to $149,999 | 56 (24.4%) | 29 (3.5%) |
| $150,000 or more | 105 (45.9%) | 291 (34.8%) |
| Total | 229 (100.0%) | 835 (100.0%) |
Property Value to Household Income Ratio in Larch Way
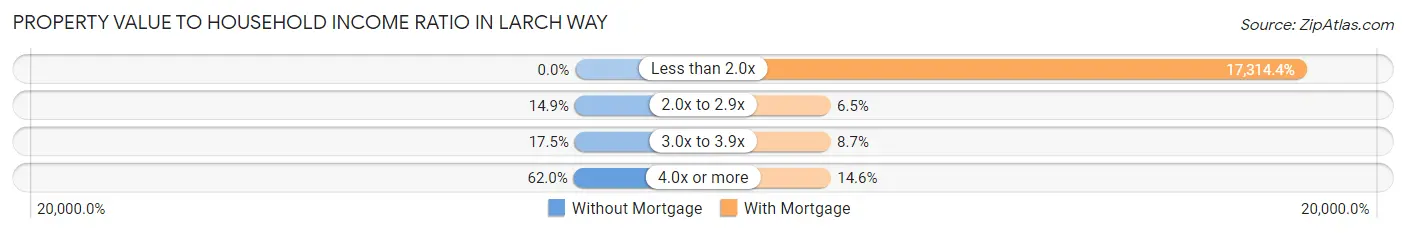
| Value-to-Income Ratio | Without Mortgage | With Mortgage |
| Less than 2.0x | 0 (0.0%) | 144,575 (17,314.4%) |
| 2.0x to 2.9x | 34 (14.8%) | 54 (6.5%) |
| 3.0x to 3.9x | 40 (17.5%) | 73 (8.7%) |
| 4.0x or more | 142 (62.0%) | 122 (14.6%) |
| Total | 229 (100.0%) | 835 (100.0%) |
Real Estate Taxes by Mortgage Status in Larch Way
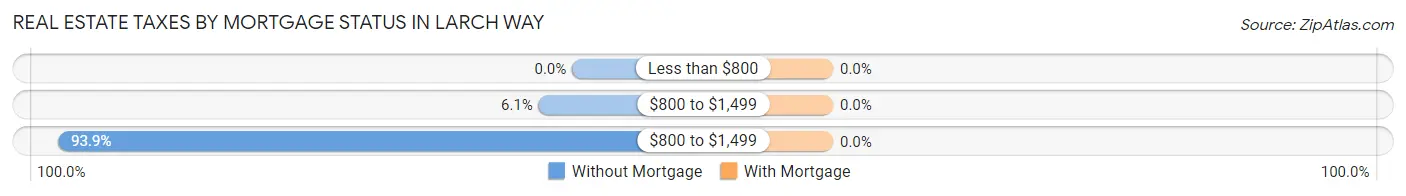
| Property Taxes | Without Mortgage | With Mortgage |
| Less than $800 | 0 (0.0%) | 0 (0.0%) |
| $800 to $1,499 | 14 (6.1%) | 0 (0.0%) |
| $800 to $1,499 | 215 (93.9%) | 0 (0.0%) |
| Total | 229 (100.0%) | 835 (100.0%) |
Health & Disability in Larch Way
Health Insurance Coverage by Age in Larch Way
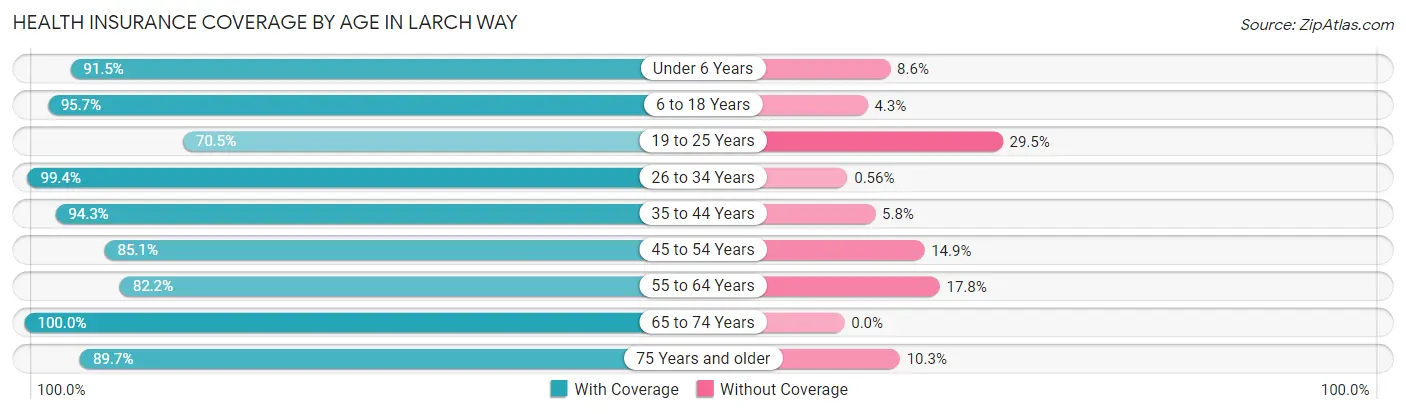
| Age Bracket | With Coverage | Without Coverage |
| Under 6 Years | 139 (91.4%) | 13 (8.6%) |
| 6 to 18 Years | 709 (95.7%) | 32 (4.3%) |
| 19 to 25 Years | 129 (70.5%) | 54 (29.5%) |
| 26 to 34 Years | 704 (99.4%) | 4 (0.6%) |
| 35 to 44 Years | 787 (94.3%) | 48 (5.8%) |
| 45 to 54 Years | 508 (85.1%) | 89 (14.9%) |
| 55 to 64 Years | 514 (82.2%) | 111 (17.8%) |
| 65 to 74 Years | 384 (100.0%) | 0 (0.0%) |
| 75 Years and older | 156 (89.7%) | 18 (10.3%) |
| Total | 4,030 (91.6%) | 369 (8.4%) |
Health Insurance Coverage by Citizenship Status in Larch Way
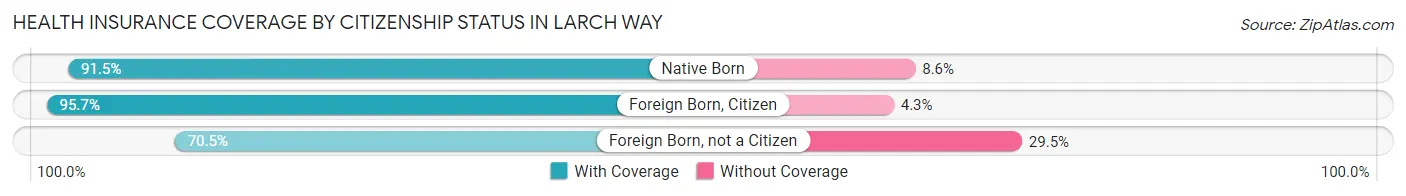
| Citizenship Status | With Coverage | Without Coverage |
| Native Born | 139 (91.4%) | 13 (8.6%) |
| Foreign Born, Citizen | 709 (95.7%) | 32 (4.3%) |
| Foreign Born, not a Citizen | 129 (70.5%) | 54 (29.5%) |
Health Insurance Coverage by Household Income in Larch Way
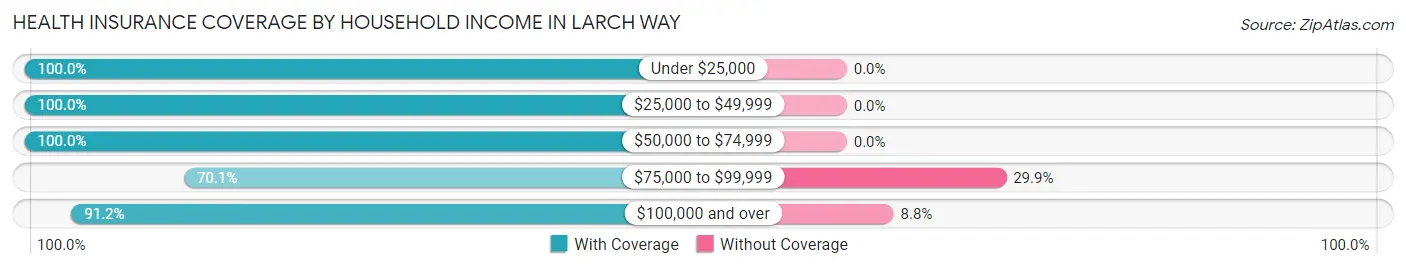
| Household Income | With Coverage | Without Coverage |
| Under $25,000 | 322 (100.0%) | 0 (0.0%) |
| $25,000 to $49,999 | 173 (100.0%) | 0 (0.0%) |
| $50,000 to $74,999 | 414 (100.0%) | 0 (0.0%) |
| $75,000 to $99,999 | 209 (70.1%) | 89 (29.9%) |
| $100,000 and over | 2,872 (91.2%) | 276 (8.8%) |
Public vs Private Health Insurance Coverage by Age in Larch Way
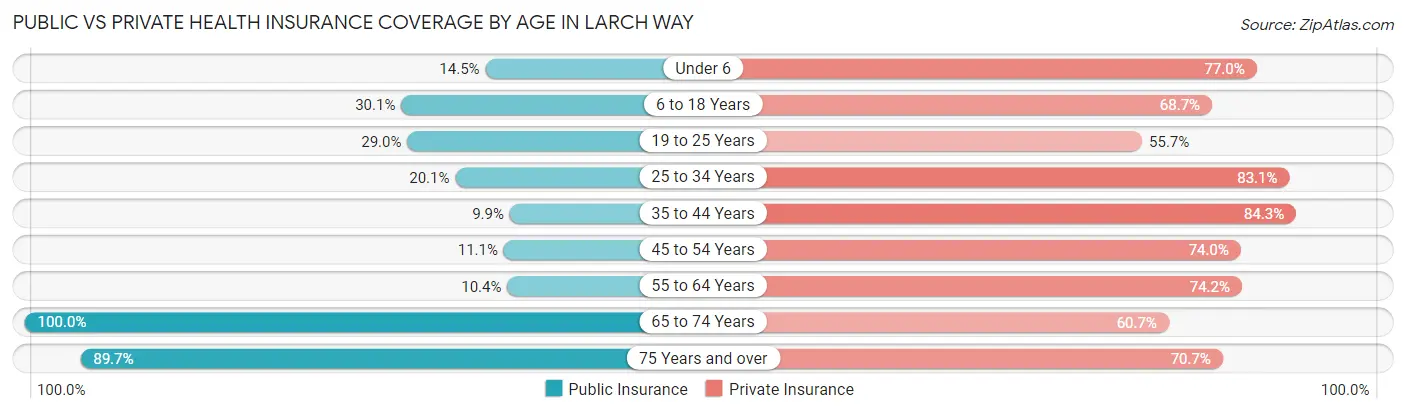
| Age Bracket | Public Insurance | Private Insurance |
| Under 6 | 22 (14.5%) | 117 (77.0%) |
| 6 to 18 Years | 223 (30.1%) | 509 (68.7%) |
| 19 to 25 Years | 53 (29.0%) | 102 (55.7%) |
| 25 to 34 Years | 142 (20.1%) | 588 (83.1%) |
| 35 to 44 Years | 83 (9.9%) | 704 (84.3%) |
| 45 to 54 Years | 66 (11.1%) | 442 (74.0%) |
| 55 to 64 Years | 65 (10.4%) | 464 (74.2%) |
| 65 to 74 Years | 384 (100.0%) | 233 (60.7%) |
| 75 Years and over | 156 (89.7%) | 123 (70.7%) |
| Total | 1,194 (27.1%) | 3,282 (74.6%) |
Disability Status by Sex by Age in Larch Way
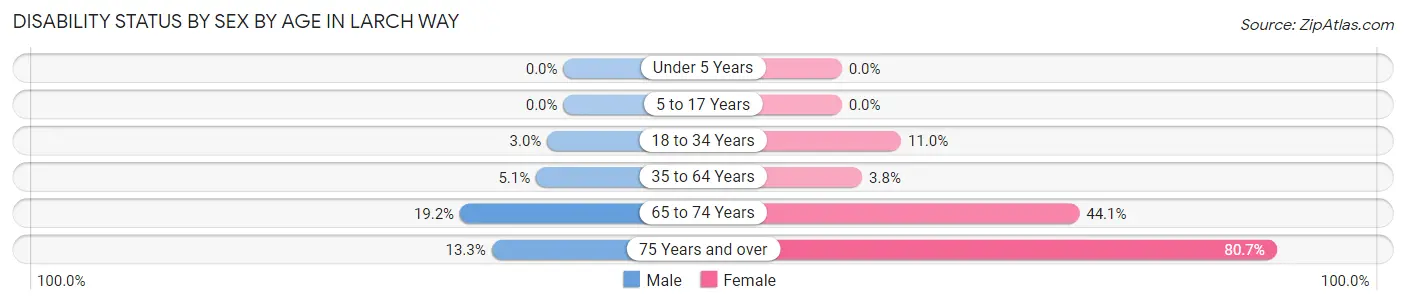
| Age Bracket | Male | Female |
| Under 5 Years | 0 (0.0%) | 0 (0.0%) |
| 5 to 17 Years | 0 (0.0%) | 0 (0.0%) |
| 18 to 34 Years | 16 (3.0%) | 50 (11.0%) |
| 35 to 64 Years | 56 (5.1%) | 36 (3.8%) |
| 65 to 74 Years | 38 (19.2%) | 82 (44.1%) |
| 75 Years and over | 8 (13.3%) | 92 (80.7%) |
Disability Class by Sex by Age in Larch Way
Disability Class: Hearing Difficulty
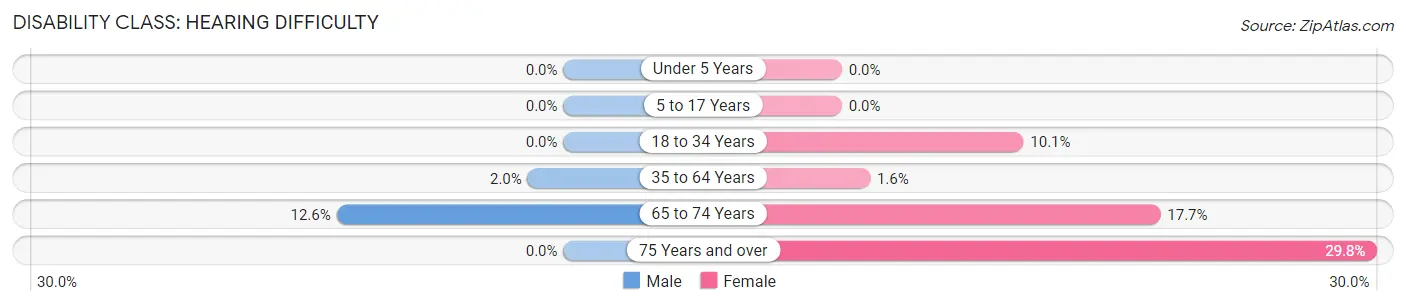
| Age Bracket | Male | Female |
| Under 5 Years | 0 (0.0%) | 0 (0.0%) |
| 5 to 17 Years | 0 (0.0%) | 0 (0.0%) |
| 18 to 34 Years | 0 (0.0%) | 46 (10.1%) |
| 35 to 64 Years | 22 (2.0%) | 15 (1.6%) |
| 65 to 74 Years | 25 (12.6%) | 33 (17.7%) |
| 75 Years and over | 0 (0.0%) | 34 (29.8%) |
Disability Class: Vision Difficulty
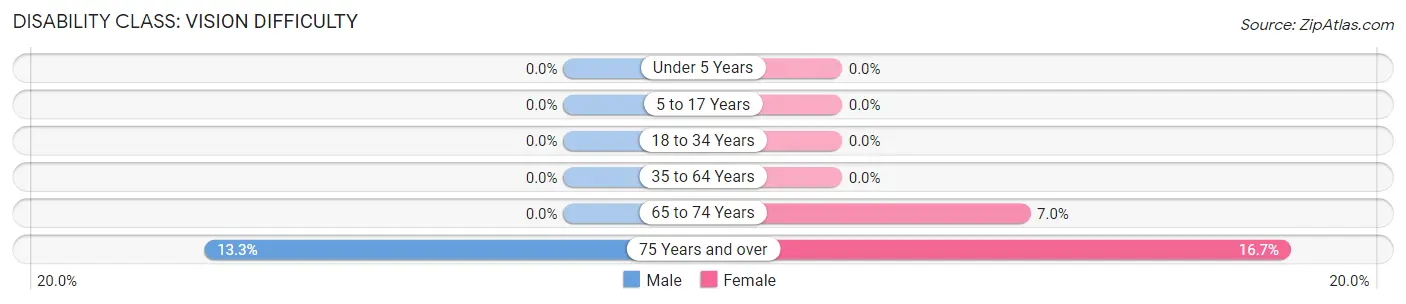
| Age Bracket | Male | Female |
| Under 5 Years | 0 (0.0%) | 0 (0.0%) |
| 5 to 17 Years | 0 (0.0%) | 0 (0.0%) |
| 18 to 34 Years | 0 (0.0%) | 0 (0.0%) |
| 35 to 64 Years | 0 (0.0%) | 0 (0.0%) |
| 65 to 74 Years | 0 (0.0%) | 13 (7.0%) |
| 75 Years and over | 8 (13.3%) | 19 (16.7%) |
Disability Class: Cognitive Difficulty
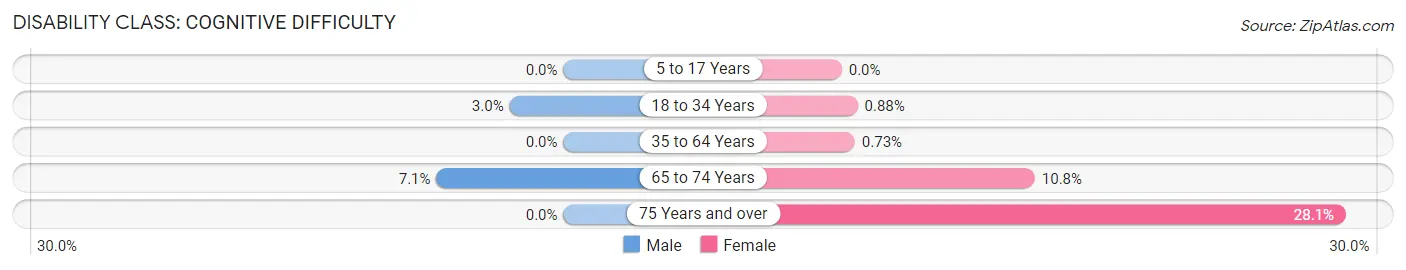
| Age Bracket | Male | Female |
| 5 to 17 Years | 0 (0.0%) | 0 (0.0%) |
| 18 to 34 Years | 16 (3.0%) | 4 (0.9%) |
| 35 to 64 Years | 0 (0.0%) | 7 (0.7%) |
| 65 to 74 Years | 14 (7.1%) | 20 (10.7%) |
| 75 Years and over | 0 (0.0%) | 32 (28.1%) |
Disability Class: Ambulatory Difficulty
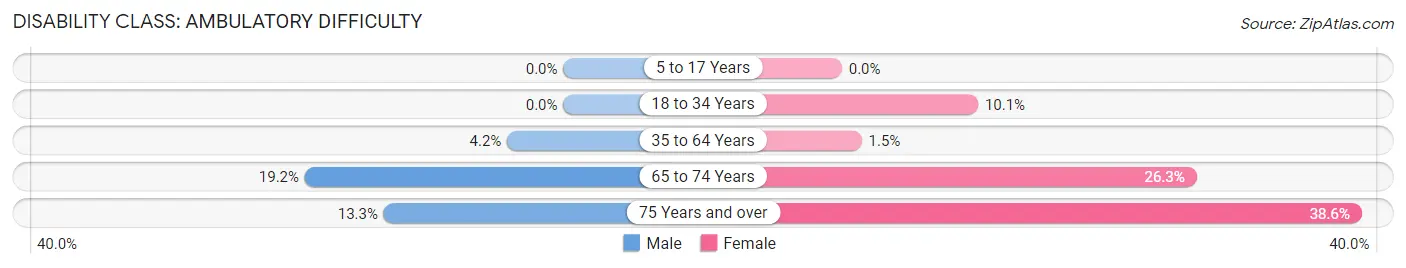
| Age Bracket | Male | Female |
| 5 to 17 Years | 0 (0.0%) | 0 (0.0%) |
| 18 to 34 Years | 0 (0.0%) | 46 (10.1%) |
| 35 to 64 Years | 46 (4.2%) | 14 (1.5%) |
| 65 to 74 Years | 38 (19.2%) | 49 (26.3%) |
| 75 Years and over | 8 (13.3%) | 44 (38.6%) |
Disability Class: Self-Care Difficulty
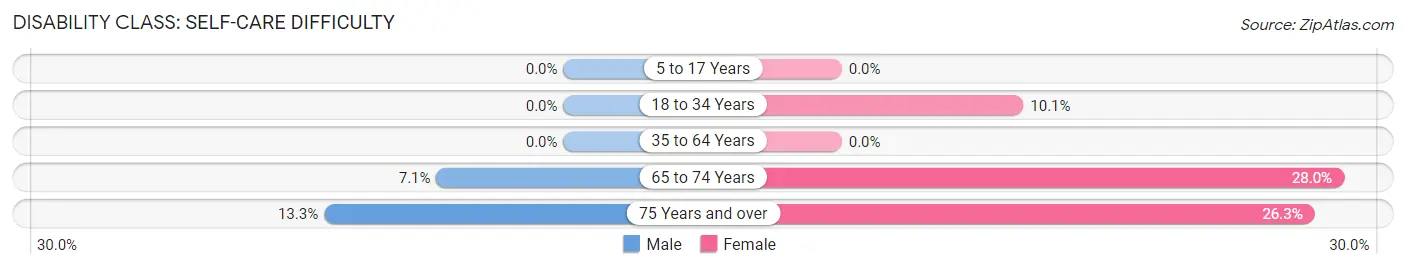
| Age Bracket | Male | Female |
| 5 to 17 Years | 0 (0.0%) | 0 (0.0%) |
| 18 to 34 Years | 0 (0.0%) | 46 (10.1%) |
| 35 to 64 Years | 0 (0.0%) | 0 (0.0%) |
| 65 to 74 Years | 14 (7.1%) | 52 (28.0%) |
| 75 Years and over | 8 (13.3%) | 30 (26.3%) |
Technology Access in Larch Way
Computing Device Access in Larch Way
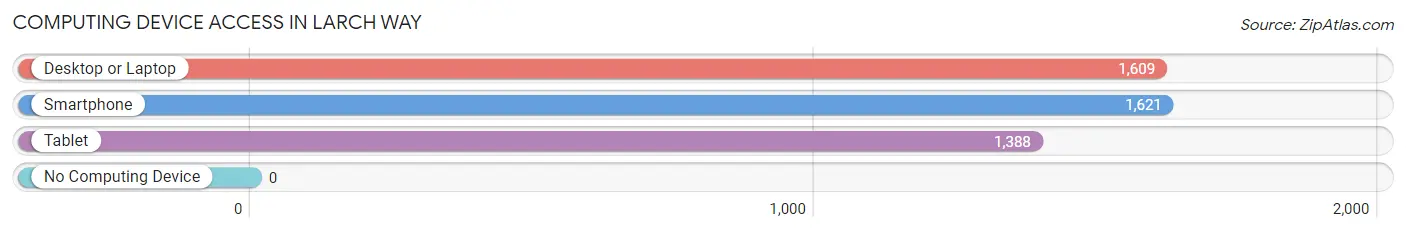
| Device Type | # Households | % Households |
| Desktop or Laptop | 1,609 | 95.3% |
| Smartphone | 1,621 | 96.0% |
| Tablet | 1,388 | 82.2% |
| No Computing Device | 0 | 0.0% |
| Total | 1,688 | 100.0% |
Internet Access in Larch Way
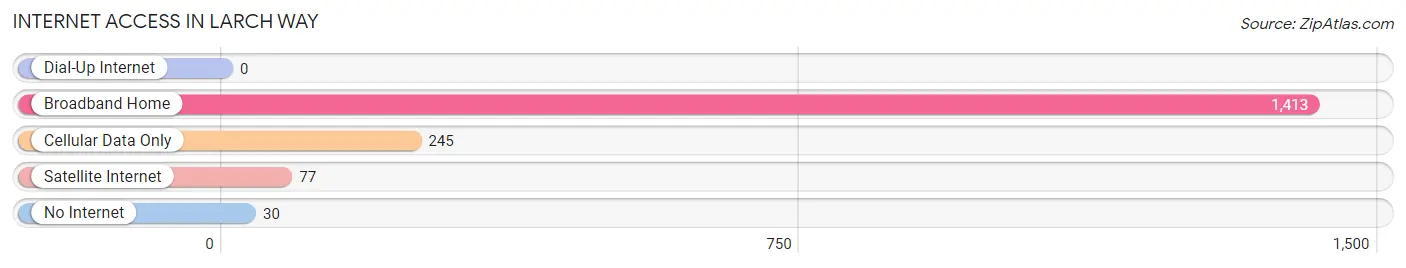
| Internet Type | # Households | % Households |
| Dial-Up Internet | 0 | 0.0% |
| Broadband Home | 1,413 | 83.7% |
| Cellular Data Only | 245 | 14.5% |
| Satellite Internet | 77 | 4.6% |
| No Internet | 30 | 1.8% |
| Total | 1,688 | 100.0% |
Larch Way Summary
Larch Way is a small town located in the state of Washington, United States. It is situated in the foothills of the Cascade Mountains, approximately 30 miles east of Seattle. The town has a population of approximately 1,500 people and is known for its rural charm and small-town atmosphere.
History
Larch Way was founded in the late 1800s by a group of settlers who were looking for a place to settle and start a new life. The town was originally called “Larchville”, but the name was changed to Larch Way in the early 1900s. The town was originally a logging and farming community, but over the years it has become a popular tourist destination due to its proximity to Seattle and its scenic beauty.
Geography
Larch Way is located in the foothills of the Cascade Mountains, approximately 30 miles east of Seattle. The town is situated at an elevation of 1,000 feet and is surrounded by lush forests and rolling hills. The town is located in the Snohomish County and is part of the Seattle-Tacoma-Bellevue metropolitan area.
Economy
Larch Way’s economy is largely based on tourism and agriculture. The town is home to several small businesses, including restaurants, shops, and galleries. The town also has a small airport, which serves as a hub for private and commercial flights.
Demographics
As of the 2010 census, the population of Larch Way was 1,500 people. The racial makeup of the town was 94.2% White, 0.7% African American, 0.7% Native American, 0.7% Asian, 0.7% from other races, and 2.7% from two or more races. The median household income was $50,000 and the median family income was $60,000.
Conclusion
Larch Way is a small town located in the state of Washington, United States. It is situated in the foothills of the Cascade Mountains, approximately 30 miles east of Seattle. The town has a population of approximately 1,500 people and is known for its rural charm and small-town atmosphere. The town’s economy is largely based on tourism and agriculture, and it is home to several small businesses. The racial makeup of the town is predominantly White, with a small percentage of African American, Native American, and Asian residents.
Common Questions
What is Per Capita Income in Larch Way?
Per Capita income in Larch Way is $54,435.
What is the Median Family Income in Larch Way?
Median Family Income in Larch Way is $127,717.
What is the Median Household income in Larch Way?
Median Household Income in Larch Way is $124,545.
What is Income or Wage Gap in Larch Way?
Income or Wage Gap in Larch Way is 20.9%.
Women in Larch Way earn 79.1 cents for every dollar earned by a man.
What is Inequality or Gini Index in Larch Way?
Inequality or Gini Index in Larch Way is 0.33.
What is the Total Population of Larch Way?
Total Population of Larch Way is 4,399.
What is the Total Male Population of Larch Way?
Total Male Population of Larch Way is 2,275.
What is the Total Female Population of Larch Way?
Total Female Population of Larch Way is 2,124.
What is the Ratio of Males per 100 Females in Larch Way?
There are 107.11 Males per 100 Females in Larch Way.
What is the Ratio of Females per 100 Males in Larch Way?
There are 93.36 Females per 100 Males in Larch Way.
What is the Median Population Age in Larch Way?
Median Population Age in Larch Way is 38.9 Years.
What is the Average Family Size in Larch Way
Average Family Size in Larch Way is 3.1 People.
What is the Average Household Size in Larch Way
Average Household Size in Larch Way is 2.6 People.
How Large is the Labor Force in Larch Way?
There are 2,608 People in the Labor Forcein in Larch Way.
What is the Percentage of People in the Labor Force in Larch Way?
71.6% of People are in the Labor Force in Larch Way.
What is the Unemployment Rate in Larch Way?
Unemployment Rate in Larch Way is 1.0%.