Bay View, WA Map & Demographics
Bay View Map
Bay View Overview
$52,205
PER CAPITA INCOME
$121,964
AVG FAMILY INCOME
$96,450
AVG HOUSEHOLD INCOME
49.2%
WAGE / INCOME GAP [ % ]
50.8¢/ $1
WAGE / INCOME GAP [ $ ]
0.38
INEQUALITY / GINI INDEX
635
TOTAL POPULATION
310
MALE POPULATION
325
FEMALE POPULATION
95.38
MALES / 100 FEMALES
104.84
FEMALES / 100 MALES
58.9
MEDIAN AGE
2.6
AVG FAMILY SIZE
2.4
AVG HOUSEHOLD SIZE
320
LABOR FORCE [ PEOPLE ]
57.3%
PERCENT IN LABOR FORCE
Income in Bay View
Income Overview in Bay View
Per Capita Income in Bay View is $52,205, while median incomes of families and households are $121,964 and $96,450 respectively.
| Characteristic | Number | Measure |
| Per Capita Income | 635 | $52,205 |
| Median Family Income | 177 | $121,964 |
| Mean Family Income | 177 | $136,887 |
| Median Household Income | 259 | $96,450 |
| Mean Household Income | 259 | $127,270 |
| Income Deficit | 177 | $0 |
| Wage / Income Gap (%) | 635 | 49.16% |
| Wage / Income Gap ($) | 635 | 50.84¢ per $1 |
| Gini / Inequality Index | 635 | 0.38 |
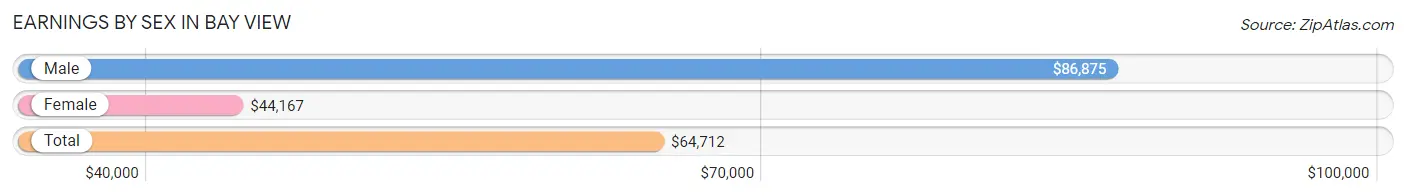
Earnings by Sex in Bay View
Average Earnings in Bay View are $64,712, $86,875 for men and $44,167 for women, a difference of 49.2%.
| Sex | Number | Average Earnings |
| Male | 195 (57.9%) | $86,875 |
| Female | 142 (42.1%) | $44,167 |
| Total | 337 (100.0%) | $64,712 |
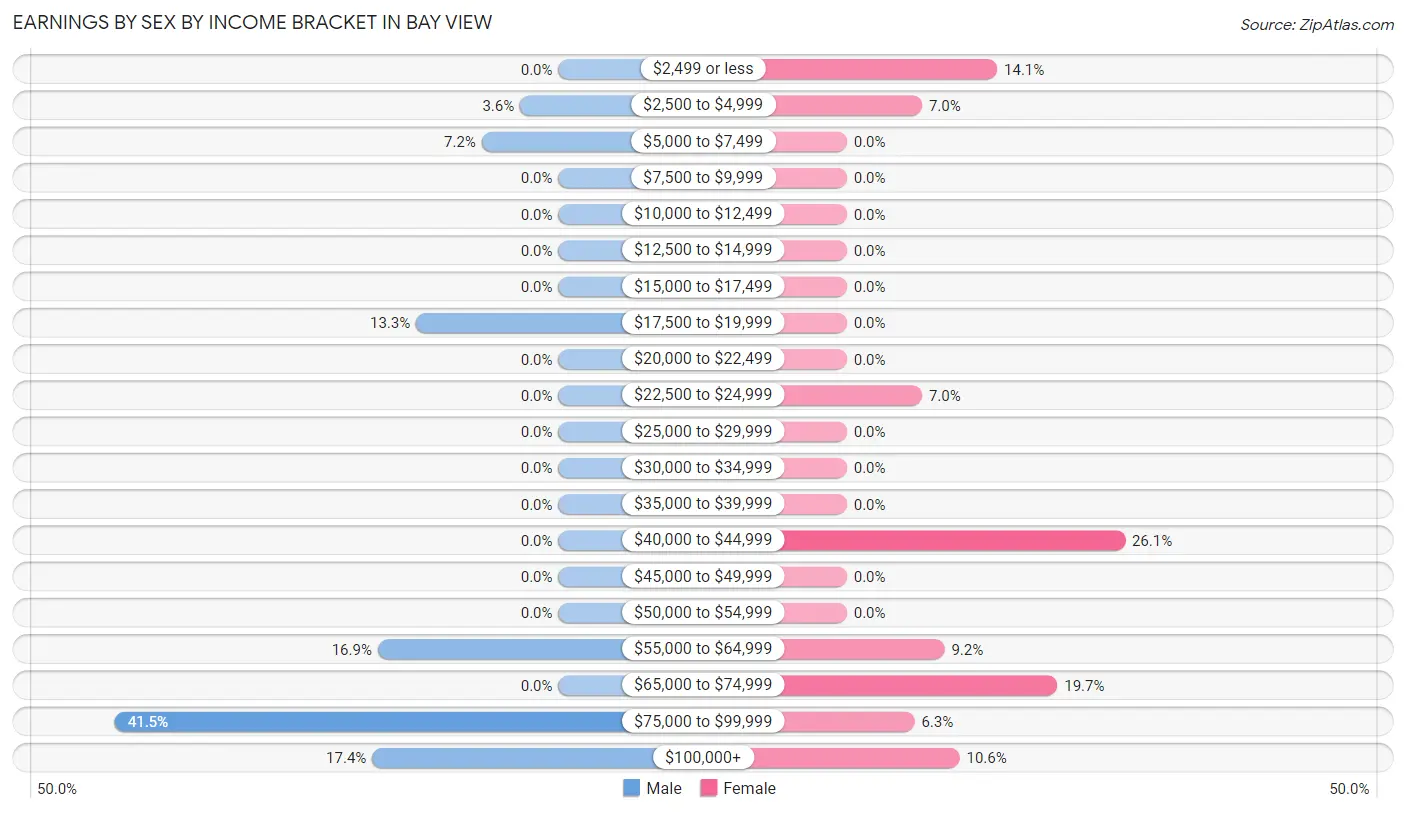
Earnings by Sex by Income Bracket in Bay View
The most common earnings brackets in Bay View are $75,000 to $99,999 for men (81 | 41.5%) and $40,000 to $44,999 for women (37 | 26.1%).
| Income | Male | Female |
| $2,499 or less | 0 (0.0%) | 20 (14.1%) |
| $2,500 to $4,999 | 7 (3.6%) | 10 (7.0%) |
| $5,000 to $7,499 | 14 (7.2%) | 0 (0.0%) |
| $7,500 to $9,999 | 0 (0.0%) | 0 (0.0%) |
| $10,000 to $12,499 | 0 (0.0%) | 0 (0.0%) |
| $12,500 to $14,999 | 0 (0.0%) | 0 (0.0%) |
| $15,000 to $17,499 | 0 (0.0%) | 0 (0.0%) |
| $17,500 to $19,999 | 26 (13.3%) | 0 (0.0%) |
| $20,000 to $22,499 | 0 (0.0%) | 0 (0.0%) |
| $22,500 to $24,999 | 0 (0.0%) | 10 (7.0%) |
| $25,000 to $29,999 | 0 (0.0%) | 0 (0.0%) |
| $30,000 to $34,999 | 0 (0.0%) | 0 (0.0%) |
| $35,000 to $39,999 | 0 (0.0%) | 0 (0.0%) |
| $40,000 to $44,999 | 0 (0.0%) | 37 (26.1%) |
| $45,000 to $49,999 | 0 (0.0%) | 0 (0.0%) |
| $50,000 to $54,999 | 0 (0.0%) | 0 (0.0%) |
| $55,000 to $64,999 | 33 (16.9%) | 13 (9.1%) |
| $65,000 to $74,999 | 0 (0.0%) | 28 (19.7%) |
| $75,000 to $99,999 | 81 (41.5%) | 9 (6.3%) |
| $100,000+ | 34 (17.4%) | 15 (10.6%) |
| Total | 195 (100.0%) | 142 (100.0%) |
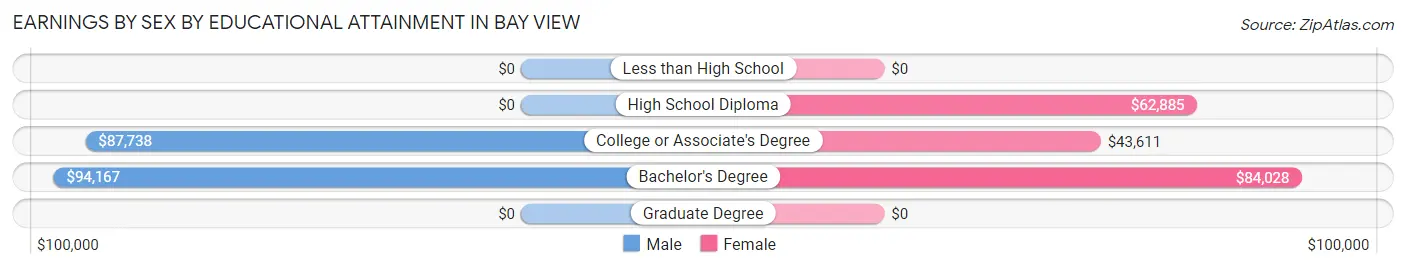
Earnings by Sex by Educational Attainment in Bay View
Average earnings in Bay View are $88,333 for men and $63,269 for women, a difference of 28.4%. Men with an educational attainment of bachelor's degree enjoy the highest average annual earnings of $94,167, while those with college or associate's degree education earn the least with $87,738. Women with an educational attainment of bachelor's degree earn the most with the average annual earnings of $84,028, while those with college or associate's degree education have the smallest earnings of $43,611.
| Educational Attainment | Male Income | Female Income |
| Less than High School | - | - |
| High School Diploma | - | - |
| College or Associate's Degree | $87,738 | $43,611 |
| Bachelor's Degree | $94,167 | $84,028 |
| Graduate Degree | - | - |
| Total | $88,333 | $63,269 |
Family Income in Bay View
Family Income Brackets in Bay View
According to the Bay View family income data, there are 48 families falling into the $150,000 to $199,999 income range, which is the most common income bracket and makes up 27.1% of all families.
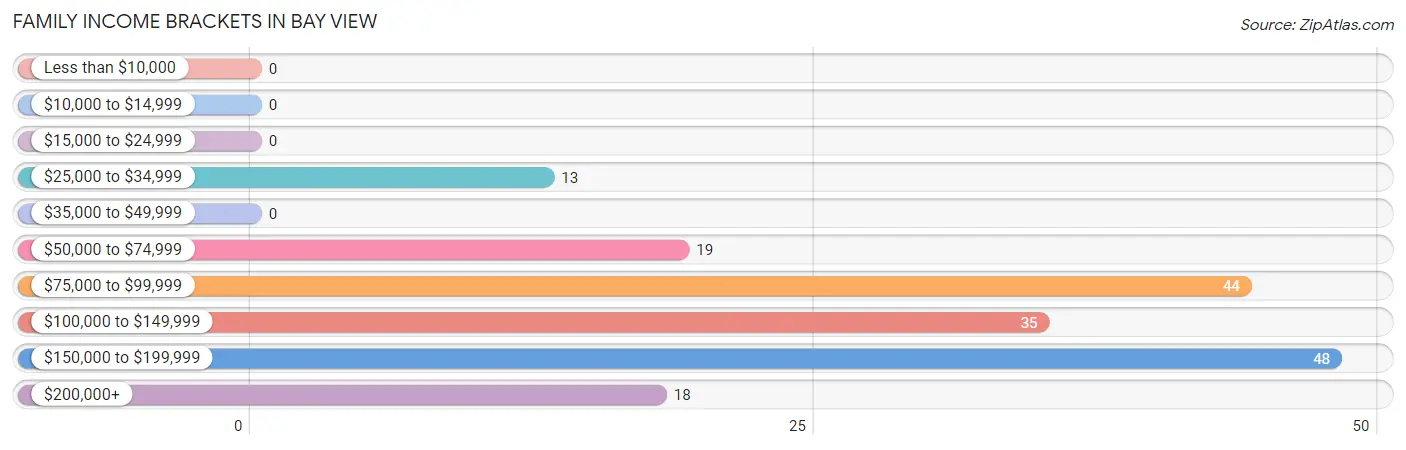
| Income Bracket | # Families | % Families |
| Less than $10,000 | 0 | 0.0% |
| $10,000 to $14,999 | 0 | 0.0% |
| $15,000 to $24,999 | 0 | 0.0% |
| $25,000 to $34,999 | 13 | 7.3% |
| $35,000 to $49,999 | 0 | 0.0% |
| $50,000 to $74,999 | 19 | 10.7% |
| $75,000 to $99,999 | 44 | 24.9% |
| $100,000 to $149,999 | 35 | 19.8% |
| $150,000 to $199,999 | 48 | 27.1% |
| $200,000+ | 18 | 10.2% |
Family Income by Famaliy Size in Bay View
2-person families (123 | 69.5%) account for the highest median family income in Bay View with $109,107 per family, while 2-person families (123 | 69.5%) have the highest median income of $54,554 per family member.
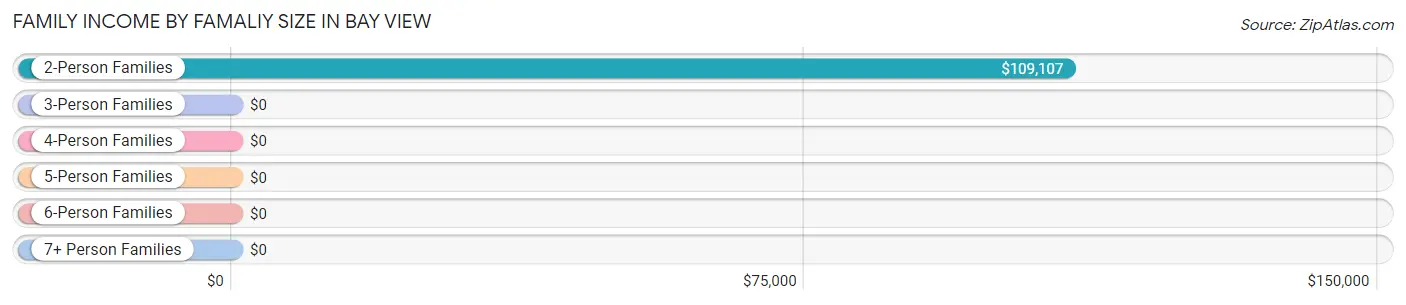
| Income Bracket | # Families | Median Income |
| 2-Person Families | 123 (69.5%) | $109,107 |
| 3-Person Families | 24 (13.6%) | $0 |
| 4-Person Families | 0 (0.0%) | $0 |
| 5-Person Families | 20 (11.3%) | $0 |
| 6-Person Families | 10 (5.7%) | $0 |
| 7+ Person Families | 0 (0.0%) | $0 |
| Total | 177 (100.0%) | $121,964 |
Family Income by Number of Earners in Bay View
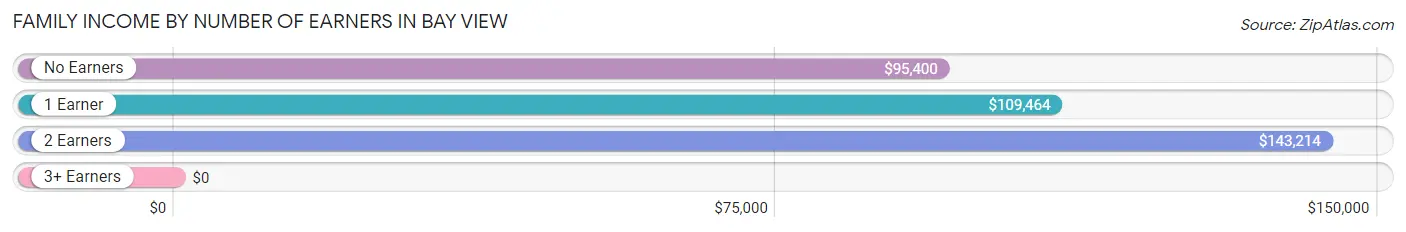
| Number of Earners | # Families | Median Income |
| No Earners | 58 (32.8%) | $95,400 |
| 1 Earner | 25 (14.1%) | $109,464 |
| 2 Earners | 84 (47.5%) | $143,214 |
| 3+ Earners | 10 (5.7%) | $0 |
| Total | 177 (100.0%) | $121,964 |
Household Income in Bay View
Household Income Brackets in Bay View
With 62 households falling in the category, the $75,000 to $99,999 income range is the most frequent in Bay View, accounting for 23.9% of all households.
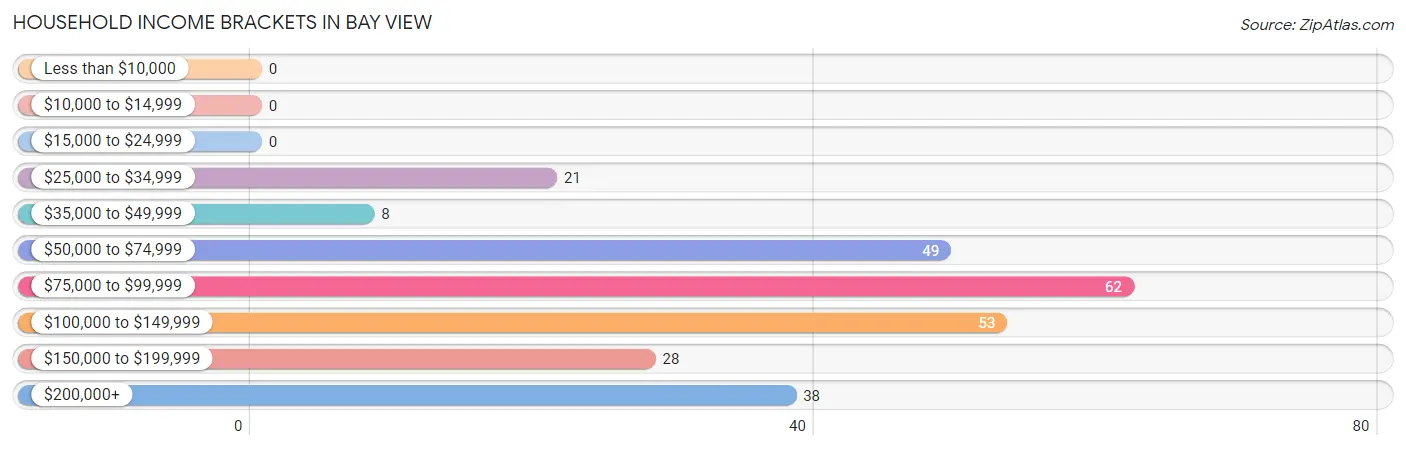
| Income Bracket | # Households | % Households |
| Less than $10,000 | 0 | 0.0% |
| $10,000 to $14,999 | 0 | 0.0% |
| $15,000 to $24,999 | 0 | 0.0% |
| $25,000 to $34,999 | 21 | 8.1% |
| $35,000 to $49,999 | 8 | 3.1% |
| $50,000 to $74,999 | 49 | 18.9% |
| $75,000 to $99,999 | 62 | 23.9% |
| $100,000 to $149,999 | 53 | 20.5% |
| $150,000 to $199,999 | 28 | 10.8% |
| $200,000+ | 38 | 14.7% |
Household Income by Householder Age in Bay View
The median household income in Bay View is $96,450, with the highest median household income of $170,694 found in the 45 to 64 years age bracket for the primary householder. A total of 33 households (12.7%) fall into this category. Meanwhile, the 15 to 24 years age bracket for the primary householder has the lowest median household income of $0, with 19 households (7.3%) in this group.
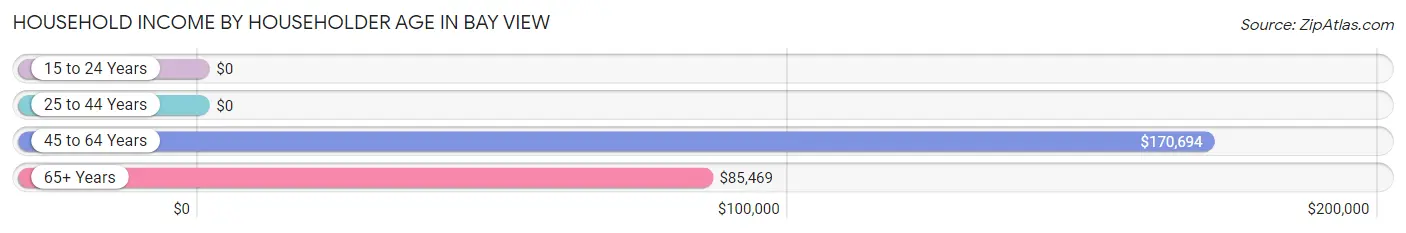
| Income Bracket | # Households | Median Income |
| 15 to 24 Years | 19 (7.3%) | $0 |
| 25 to 44 Years | 48 (18.5%) | $0 |
| 45 to 64 Years | 33 (12.7%) | $170,694 |
| 65+ Years | 159 (61.4%) | $85,469 |
| Total | 259 (100.0%) | $96,450 |
Poverty in Bay View
Income Below Poverty by Sex and Age in Bay View
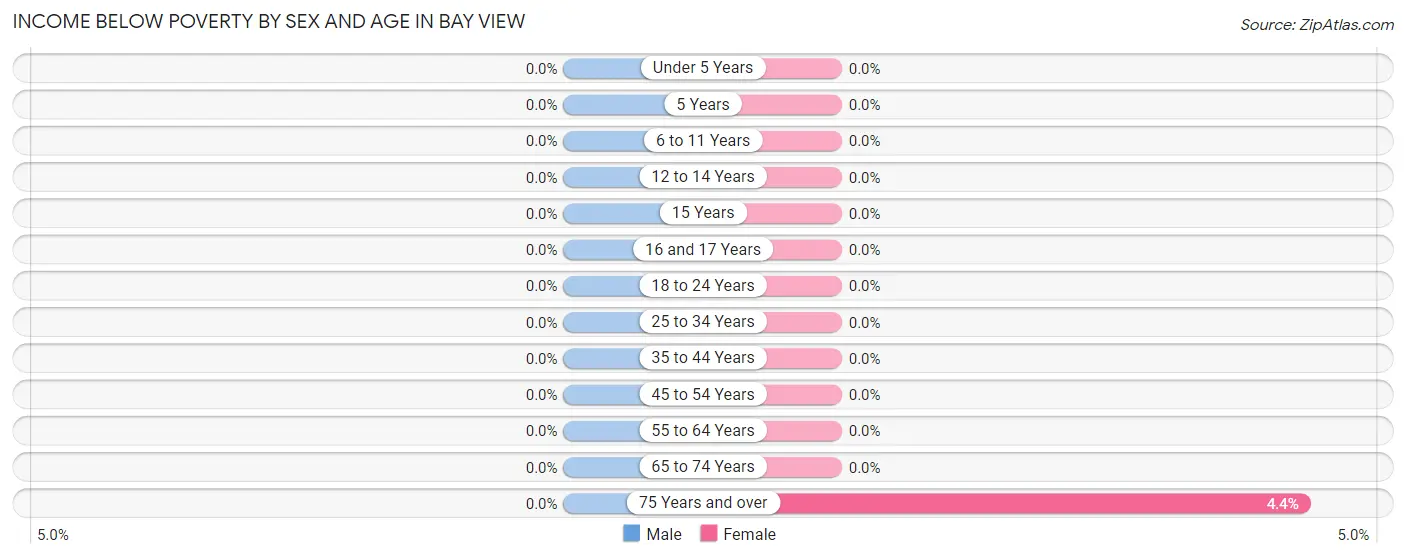
| Age Bracket | Male | Female |
| Under 5 Years | 0 (0.0%) | 0 (0.0%) |
| 5 Years | 0 (0.0%) | 0 (0.0%) |
| 6 to 11 Years | 0 (0.0%) | 0 (0.0%) |
| 12 to 14 Years | 0 (0.0%) | 0 (0.0%) |
| 15 Years | 0 (0.0%) | 0 (0.0%) |
| 16 and 17 Years | 0 (0.0%) | 0 (0.0%) |
| 18 to 24 Years | 0 (0.0%) | 0 (0.0%) |
| 25 to 34 Years | 0 (0.0%) | 0 (0.0%) |
| 35 to 44 Years | 0 (0.0%) | 0 (0.0%) |
| 45 to 54 Years | 0 (0.0%) | 0 (0.0%) |
| 55 to 64 Years | 0 (0.0%) | 0 (0.0%) |
| 65 to 74 Years | 0 (0.0%) | 0 (0.0%) |
| 75 Years and over | 0 (0.0%) | 3 (4.3%) |
| Total | 0 (0.0%) | 3 (0.9%) |
Income Above Poverty by Sex and Age in Bay View
According to the poverty statistics in Bay View, males aged under 5 years and females aged under 5 years are the age groups that are most secure financially, with 100.0% of males and 100.0% of females in these age groups living above the poverty line.
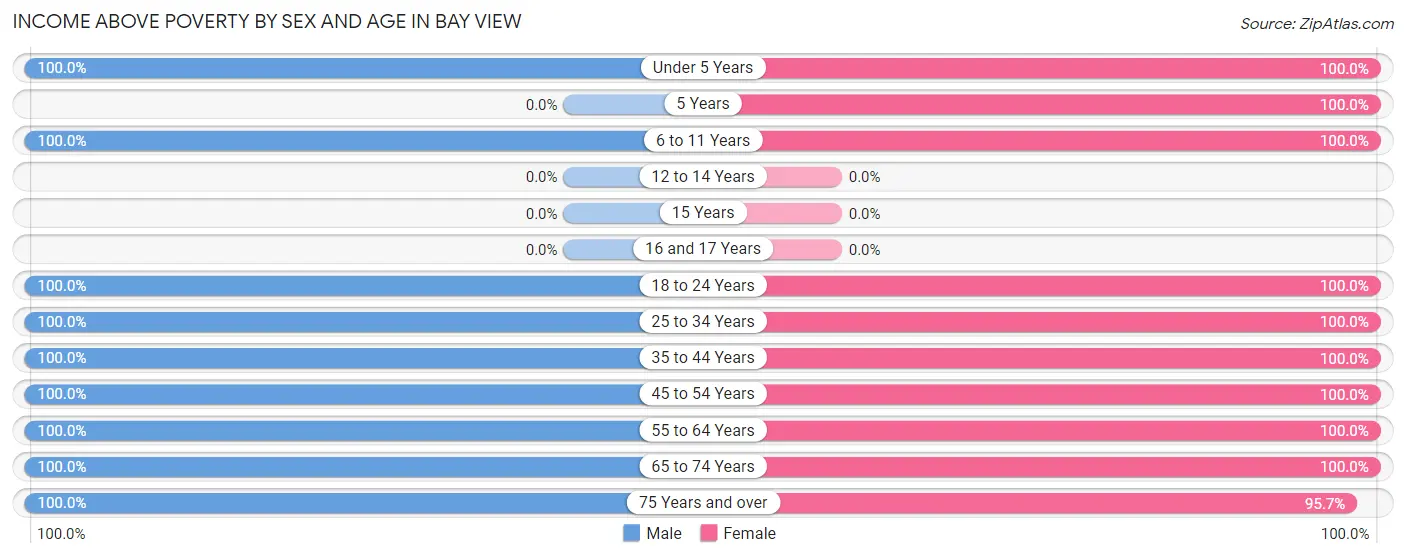
| Age Bracket | Male | Female |
| Under 5 Years | 3 (100.0%) | 10 (100.0%) |
| 5 Years | 0 (0.0%) | 8 (100.0%) |
| 6 to 11 Years | 20 (100.0%) | 36 (100.0%) |
| 12 to 14 Years | 0 (0.0%) | 0 (0.0%) |
| 15 Years | 0 (0.0%) | 0 (0.0%) |
| 16 and 17 Years | 0 (0.0%) | 0 (0.0%) |
| 18 to 24 Years | 19 (100.0%) | 20 (100.0%) |
| 25 to 34 Years | 41 (100.0%) | 10 (100.0%) |
| 35 to 44 Years | 40 (100.0%) | 57 (100.0%) |
| 45 to 54 Years | 10 (100.0%) | 13 (100.0%) |
| 55 to 64 Years | 43 (100.0%) | 58 (100.0%) |
| 65 to 74 Years | 99 (100.0%) | 44 (100.0%) |
| 75 Years and over | 35 (100.0%) | 66 (95.7%) |
| Total | 310 (100.0%) | 322 (99.1%) |
Income Below Poverty Among Married-Couple Families in Bay View
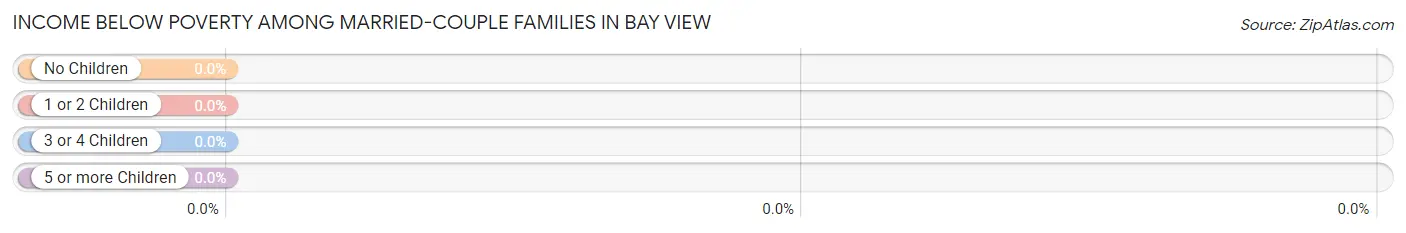
| Children | Above Poverty | Below Poverty |
| No Children | 128 (100.0%) | 0 (0.0%) |
| 1 or 2 Children | 29 (100.0%) | 0 (0.0%) |
| 3 or 4 Children | 20 (100.0%) | 0 (0.0%) |
| 5 or more Children | 0 (0.0%) | 0 (0.0%) |
| Total | 177 (100.0%) | 0 (0.0%) |
Income Below Poverty Among Single-Parent Households in Bay View
| Children | Single Father | Single Mother |
| No Children | 0 (0.0%) | 0 (0.0%) |
| 1 or 2 Children | 0 (0.0%) | 0 (0.0%) |
| 3 or 4 Children | 0 (0.0%) | 0 (0.0%) |
| 5 or more Children | 0 (0.0%) | 0 (0.0%) |
| Total | 0 (0.0%) | 0 (0.0%) |
Income Below Poverty Among Married-Couple vs Single-Parent Households in Bay View
| Children | Married-Couple Families | Single-Parent Households |
| No Children | 0 (0.0%) | 0 (0.0%) |
| 1 or 2 Children | 0 (0.0%) | 0 (0.0%) |
| 3 or 4 Children | 0 (0.0%) | 0 (0.0%) |
| 5 or more Children | 0 (0.0%) | 0 (0.0%) |
| Total | 0 (0.0%) | 0 (0.0%) |
Race in Bay View
The most populous races in Bay View are White / Caucasian (631 | 99.4%), Two or more Races (3 | 0.5%), and Asian (1 | 0.2%).
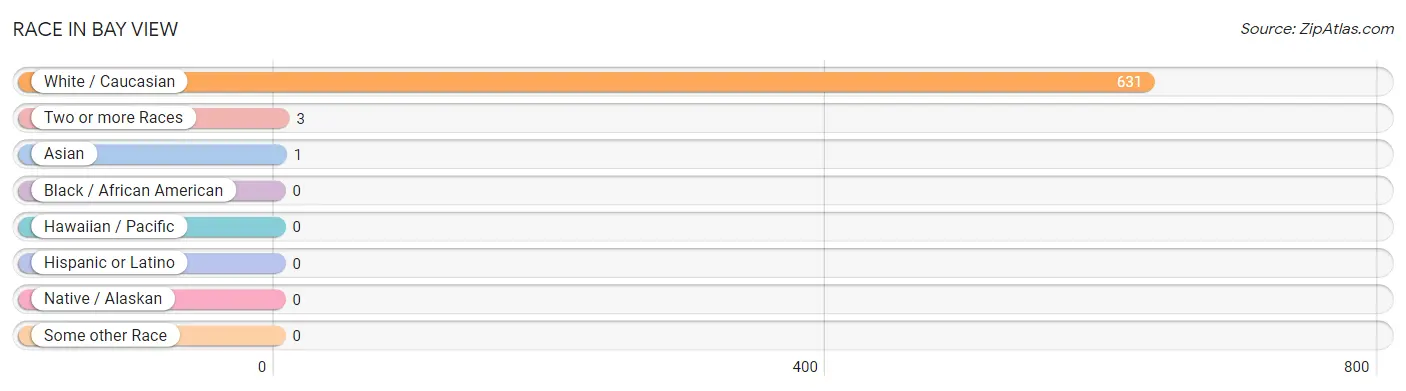
| Race | # Population | % Population |
| Asian | 1 | 0.2% |
| Black / African American | 0 | 0.0% |
| Hawaiian / Pacific | 0 | 0.0% |
| Hispanic or Latino | 0 | 0.0% |
| Native / Alaskan | 0 | 0.0% |
| White / Caucasian | 631 | 99.4% |
| Two or more Races | 3 | 0.5% |
| Some other Race | 0 | 0.0% |
| Total | 635 | 100.0% |
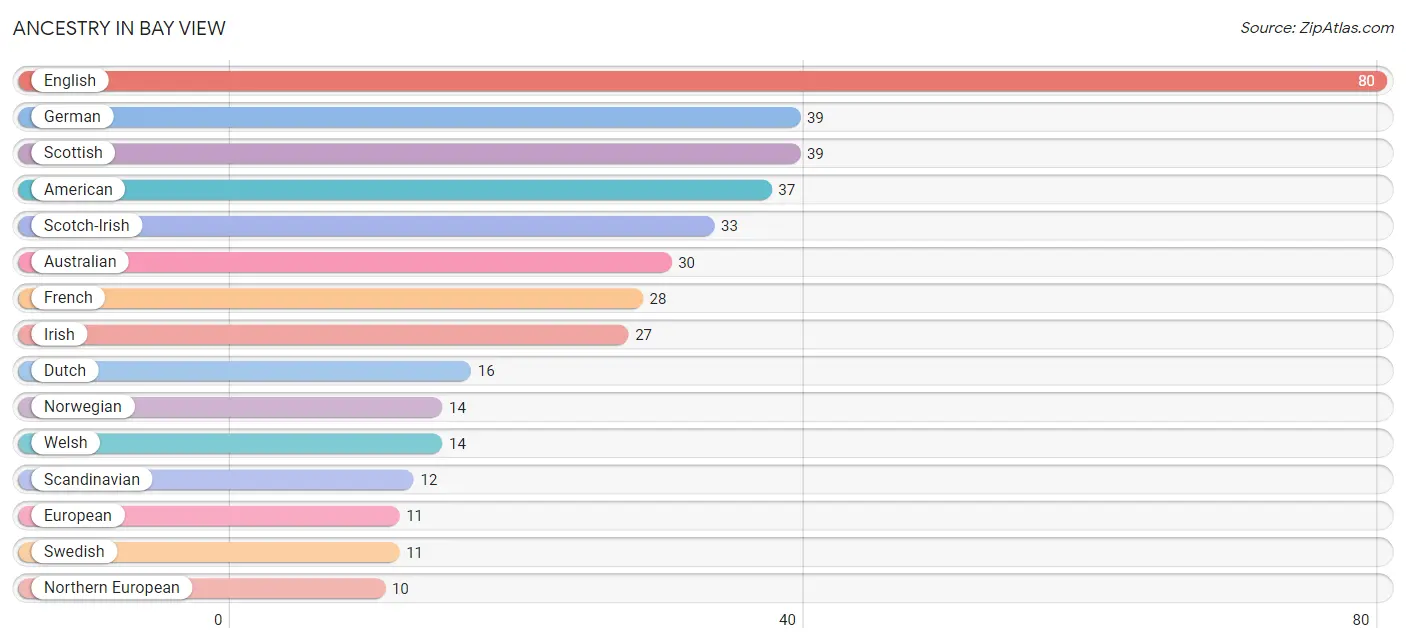
Ancestry in Bay View
The most populous ancestries reported in Bay View are English (80 | 12.6%), German (39 | 6.1%), Scottish (39 | 6.1%), American (37 | 5.8%), and Scotch-Irish (33 | 5.2%), together accounting for 35.9% of all Bay View residents.
| Ancestry | # Population | % Population |
| American | 37 | 5.8% |
| Australian | 30 | 4.7% |
| Danish | 8 | 1.3% |
| Dutch | 16 | 2.5% |
| English | 80 | 12.6% |
| European | 11 | 1.7% |
| French | 28 | 4.4% |
| French American Indian | 3 | 0.5% |
| German | 39 | 6.1% |
| Irish | 27 | 4.3% |
| Italian | 6 | 0.9% |
| Northern European | 10 | 1.6% |
| Norwegian | 14 | 2.2% |
| Russian | 8 | 1.3% |
| Scandinavian | 12 | 1.9% |
| Scotch-Irish | 33 | 5.2% |
| Scottish | 39 | 6.1% |
| Sri Lankan | 1 | 0.2% |
| Swedish | 11 | 1.7% |
| Swiss | 6 | 0.9% |
| Welsh | 14 | 2.2% | View All 21 Rows |
Immigrants in Bay View
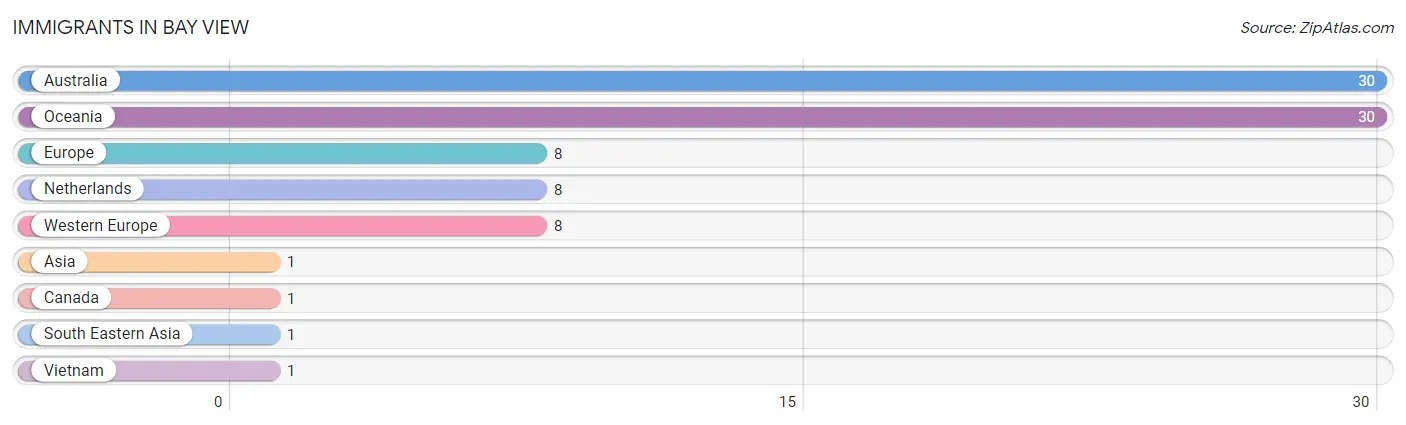
The most numerous immigrant groups reported in Bay View came from Australia (30 | 4.7%), Oceania (30 | 4.7%), Europe (8 | 1.3%), Netherlands (8 | 1.3%), and Western Europe (8 | 1.3%), together accounting for 13.2% of all Bay View residents.
| Immigration Origin | # Population | % Population |
| Asia | 1 | 0.2% |
| Australia | 30 | 4.7% |
| Canada | 1 | 0.2% |
| Europe | 8 | 1.3% |
| Netherlands | 8 | 1.3% |
| Oceania | 30 | 4.7% |
| South Eastern Asia | 1 | 0.2% |
| Vietnam | 1 | 0.2% |
| Western Europe | 8 | 1.3% | View All 9 Rows |
Sex and Age in Bay View
Sex and Age in Bay View
The most populous age groups in Bay View are 70 to 74 Years (74 | 23.9%) for men and 35 to 39 Years (57 | 17.5%) for women.
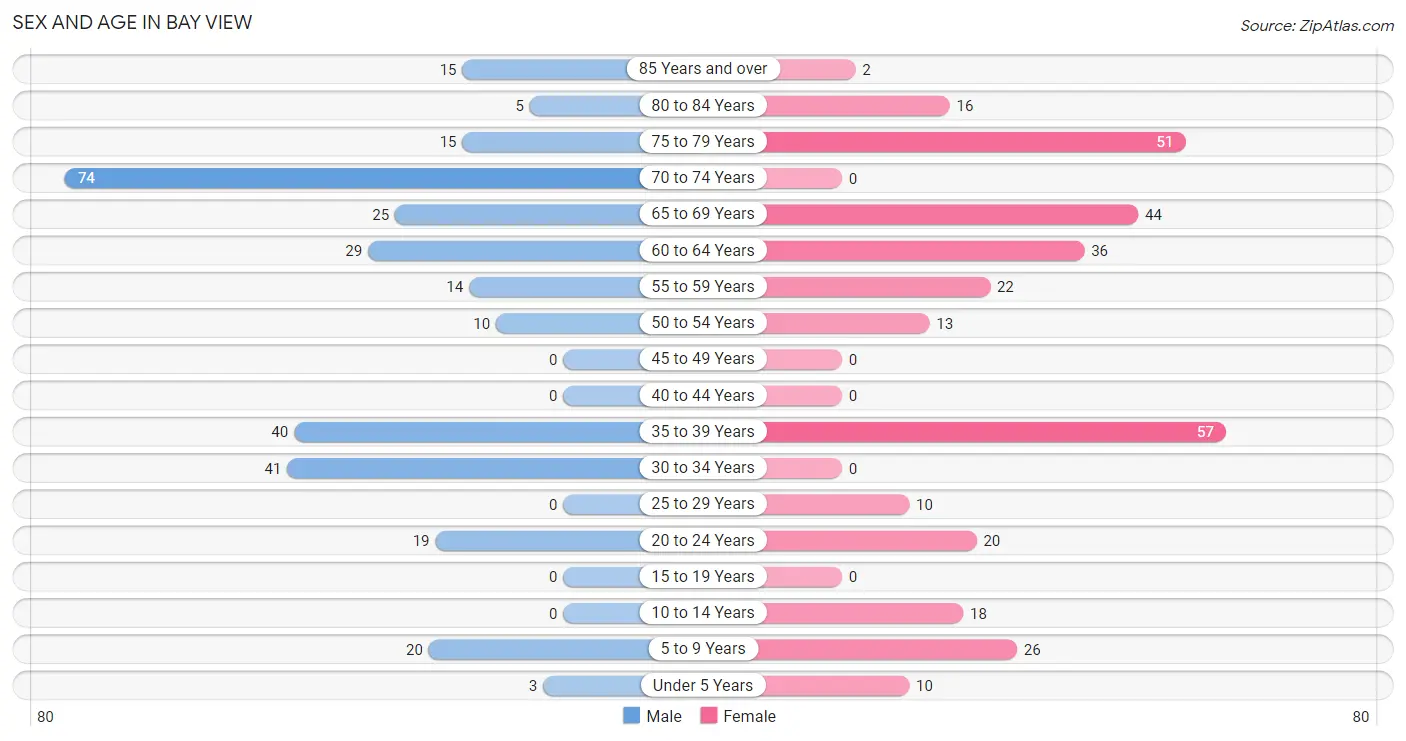
| Age Bracket | Male | Female |
| Under 5 Years | 3 (1.0%) | 10 (3.1%) |
| 5 to 9 Years | 20 (6.5%) | 26 (8.0%) |
| 10 to 14 Years | 0 (0.0%) | 18 (5.5%) |
| 15 to 19 Years | 0 (0.0%) | 0 (0.0%) |
| 20 to 24 Years | 19 (6.1%) | 20 (6.1%) |
| 25 to 29 Years | 0 (0.0%) | 10 (3.1%) |
| 30 to 34 Years | 41 (13.2%) | 0 (0.0%) |
| 35 to 39 Years | 40 (12.9%) | 57 (17.5%) |
| 40 to 44 Years | 0 (0.0%) | 0 (0.0%) |
| 45 to 49 Years | 0 (0.0%) | 0 (0.0%) |
| 50 to 54 Years | 10 (3.2%) | 13 (4.0%) |
| 55 to 59 Years | 14 (4.5%) | 22 (6.8%) |
| 60 to 64 Years | 29 (9.3%) | 36 (11.1%) |
| 65 to 69 Years | 25 (8.1%) | 44 (13.5%) |
| 70 to 74 Years | 74 (23.9%) | 0 (0.0%) |
| 75 to 79 Years | 15 (4.8%) | 51 (15.7%) |
| 80 to 84 Years | 5 (1.6%) | 16 (4.9%) |
| 85 Years and over | 15 (4.8%) | 2 (0.6%) |
| Total | 310 (100.0%) | 325 (100.0%) |
Families and Households in Bay View
Median Family Size in Bay View
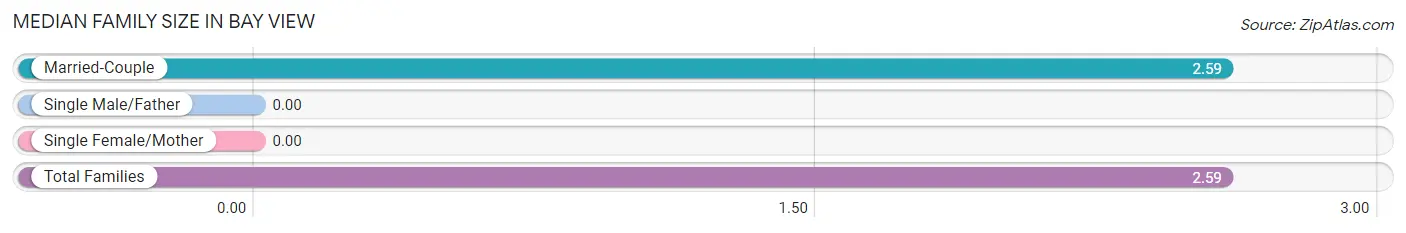
| Family Type | # Families | Family Size |
| Married-Couple | 177 (100.0%) | 2.59 |
| Single Male/Father | 0 (0.0%) | - |
| Single Female/Mother | 0 (0.0%) | - |
| Total Families | 177 (100.0%) | 2.59 |
Median Household Size in Bay View

| Household Type | # Households | Household Size |
| Married-Couple | 177 (68.3%) | 2.80 |
| Single Male/Father | 0 (0.0%) | - |
| Single Female/Mother | 0 (0.0%) | - |
| Non-family | 82 (31.7%) | 1.66 |
| Total Households | 259 (100.0%) | 2.44 |
Household Size by Marriage Status in Bay View
Out of a total of 259 households in Bay View, 177 (68.3%) are family households, while 82 (31.7%) are nonfamily households. The most numerous type of family households are 2-person households, comprising 123, and the most common type of nonfamily households are 2-person households, comprising 56.
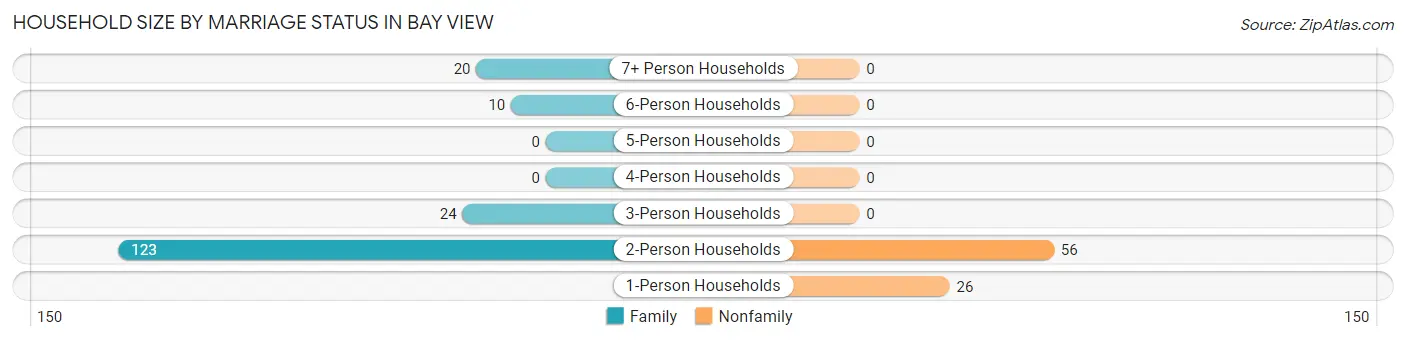
| Household Size | Family Households | Nonfamily Households |
| 1-Person Households | - | 26 (10.0%) |
| 2-Person Households | 123 (47.5%) | 56 (21.6%) |
| 3-Person Households | 24 (9.3%) | 0 (0.0%) |
| 4-Person Households | 0 (0.0%) | 0 (0.0%) |
| 5-Person Households | 0 (0.0%) | 0 (0.0%) |
| 6-Person Households | 10 (3.9%) | 0 (0.0%) |
| 7+ Person Households | 20 (7.7%) | 0 (0.0%) |
| Total | 177 (68.3%) | 82 (31.7%) |
Female Fertility in Bay View
Fertility by Age in Bay View
Average fertility rate in Bay View is 230.0 births per 1,000 women. Women in the age bracket of 20 to 34 years have the highest fertility rate with 667.0 births per 1,000 women. Women in the age bracket of 20 to 34 years acount for 100.0% of all women with births.
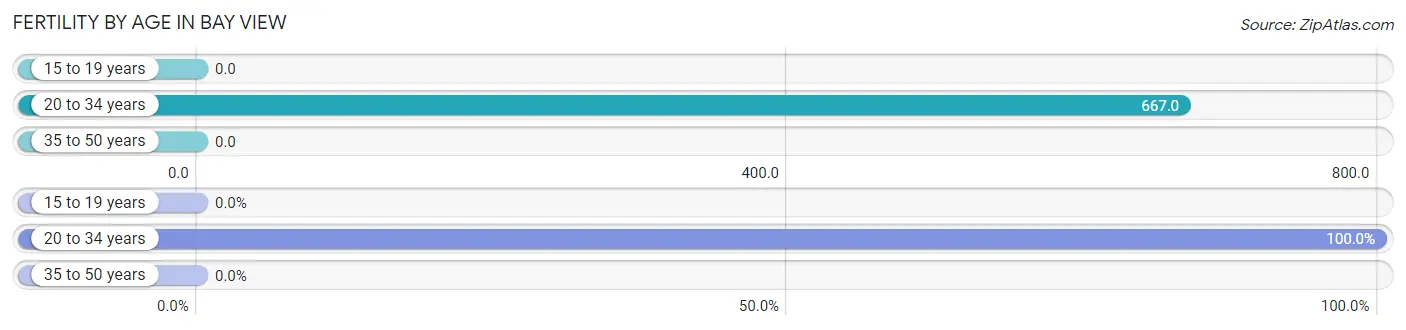
| Age Bracket | Women with Births | Births / 1,000 Women |
| 15 to 19 years | 0 (0.0%) | 0.0 |
| 20 to 34 years | 20 (100.0%) | 667.0 |
| 35 to 50 years | 0 (0.0%) | 0.0 |
| Total | 20 (100.0%) | 230.0 |
Fertility by Age by Marriage Status in Bay View
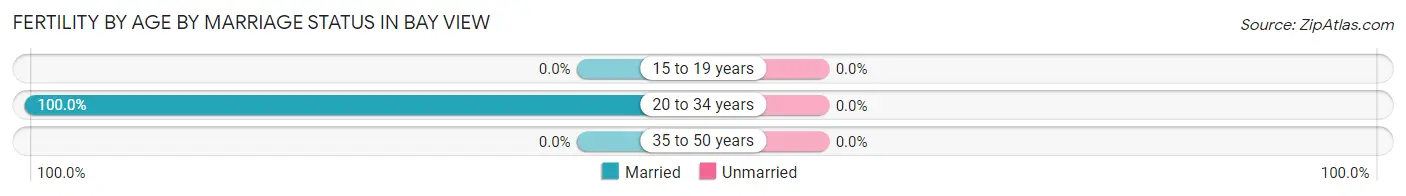
| Age Bracket | Married | Unmarried |
| 15 to 19 years | 0 (0.0%) | 0 (0.0%) |
| 20 to 34 years | 20 (100.0%) | 0 (0.0%) |
| 35 to 50 years | 0 (0.0%) | 0 (0.0%) |
| Total | 20 (100.0%) | 0 (0.0%) |
Fertility by Education in Bay View
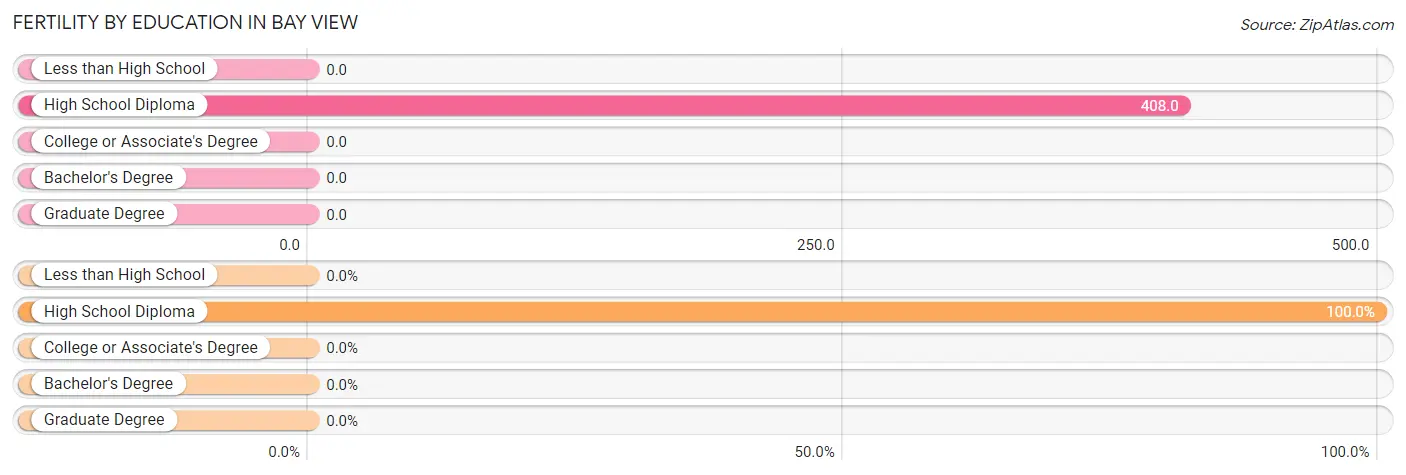
| Educational Attainment | Women with Births | Births / 1,000 Women |
| Less than High School | 0 (0.0%) | 0.0 |
| High School Diploma | 20 (100.0%) | 408.0 |
| College or Associate's Degree | 0 (0.0%) | 0.0 |
| Bachelor's Degree | 0 (0.0%) | 0.0 |
| Graduate Degree | 0 (0.0%) | 0.0 |
| Total | 20 (100.0%) | 230.0 |
Fertility by Education by Marriage Status in Bay View
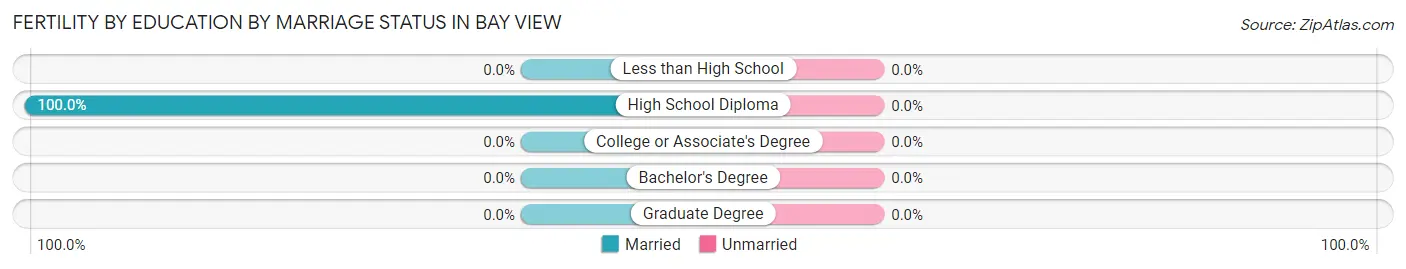
| Educational Attainment | Married | Unmarried |
| Less than High School | 0 (0.0%) | 0 (0.0%) |
| High School Diploma | 20 (100.0%) | 0 (0.0%) |
| College or Associate's Degree | 0 (0.0%) | 0 (0.0%) |
| Bachelor's Degree | 0 (0.0%) | 0 (0.0%) |
| Graduate Degree | 0 (0.0%) | 0 (0.0%) |
| Total | 20 (100.0%) | 0 (0.0%) |
Employment Characteristics in Bay View
Employment by Class of Employer in Bay View
Among the 320 employed individuals in Bay View, private company employees (188 | 58.8%), local government employees (72 | 22.5%), and self-employed (not incorporated) (25 | 7.8%) make up the most common classes of employment.
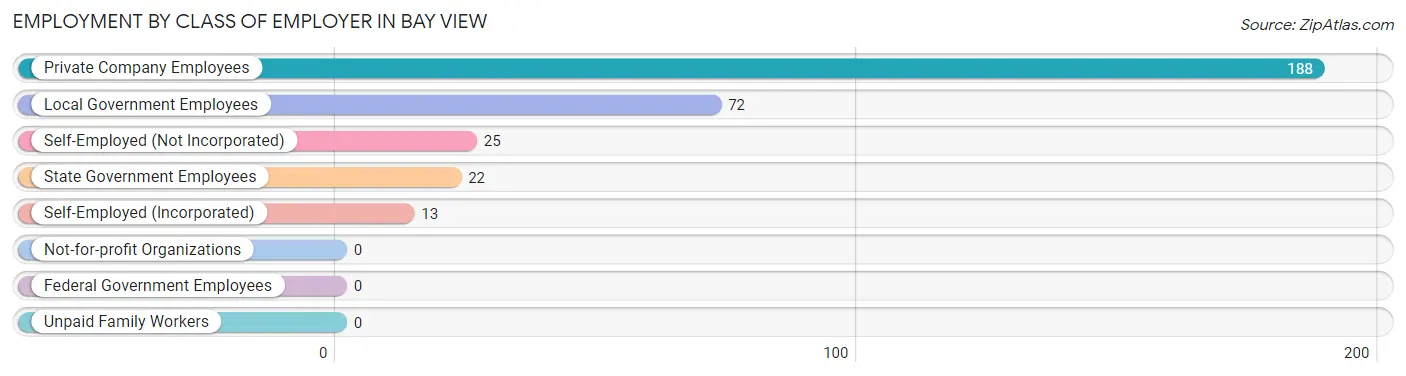
| Employer Class | # Employees | % Employees |
| Private Company Employees | 188 | 58.8% |
| Self-Employed (Incorporated) | 13 | 4.1% |
| Self-Employed (Not Incorporated) | 25 | 7.8% |
| Not-for-profit Organizations | 0 | 0.0% |
| Local Government Employees | 72 | 22.5% |
| State Government Employees | 22 | 6.9% |
| Federal Government Employees | 0 | 0.0% |
| Unpaid Family Workers | 0 | 0.0% |
| Total | 320 | 100.0% |
Employment Status by Age in Bay View
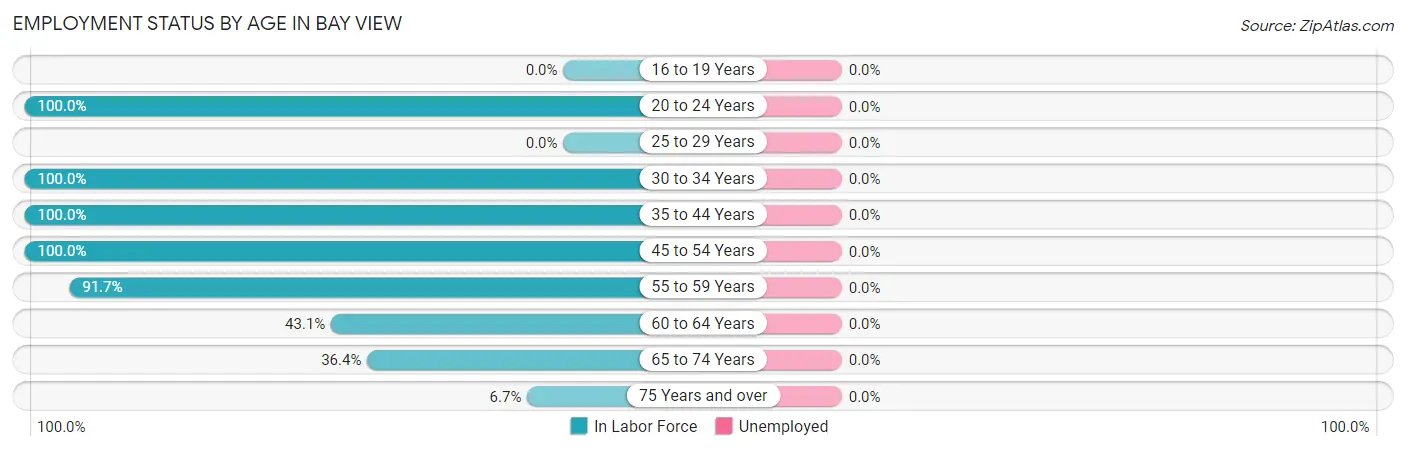
| Age Bracket | In Labor Force | Unemployed |
| 16 to 19 Years | 0 (0.0%) | 0 (0.0%) |
| 20 to 24 Years | 39 (100.0%) | 0 (0.0%) |
| 25 to 29 Years | 0 (0.0%) | 0 (0.0%) |
| 30 to 34 Years | 41 (100.0%) | 0 (0.0%) |
| 35 to 44 Years | 97 (100.0%) | 0 (0.0%) |
| 45 to 54 Years | 23 (100.0%) | 0 (0.0%) |
| 55 to 59 Years | 33 (91.7%) | 0 (0.0%) |
| 60 to 64 Years | 28 (43.1%) | 0 (0.0%) |
| 65 to 74 Years | 52 (36.4%) | 0 (0.0%) |
| 75 Years and over | 7 (6.7%) | 0 (0.0%) |
| Total | 320 (57.3%) | 0 (0.0%) |
Employment Status by Educational Attainment in Bay View
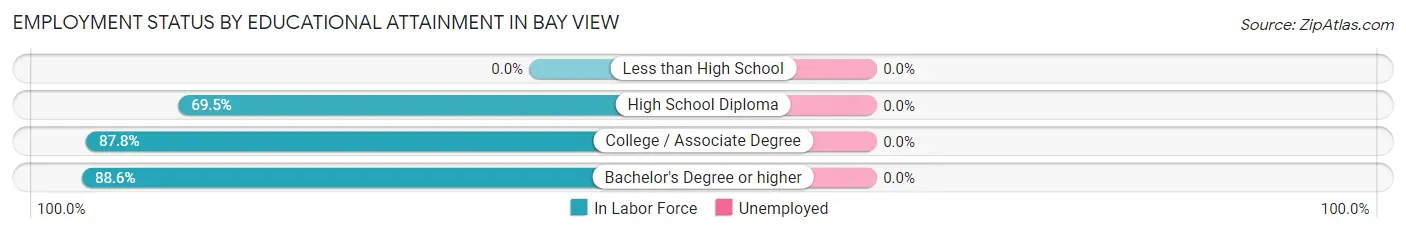
| Educational Attainment | In Labor Force | Unemployed |
| Less than High School | 0 (0.0%) | 0 (0.0%) |
| High School Diploma | 66 (69.5%) | 0 (0.0%) |
| College / Associate Degree | 86 (87.8%) | 0 (0.0%) |
| Bachelor's Degree or higher | 70 (88.6%) | 0 (0.0%) |
| Total | 222 (81.6%) | 0 (0.0%) |
Employment Occupations by Sex in Bay View
Management, Business, Science and Arts Occupations
The most common Management, Business, Science and Arts occupations in Bay View are Community & Social Service (65 | 20.3%), Education Instruction & Library (65 | 20.3%), Management (35 | 10.9%), Computers, Engineering & Science (27 | 8.4%), and Architecture & Engineering (18 | 5.6%).
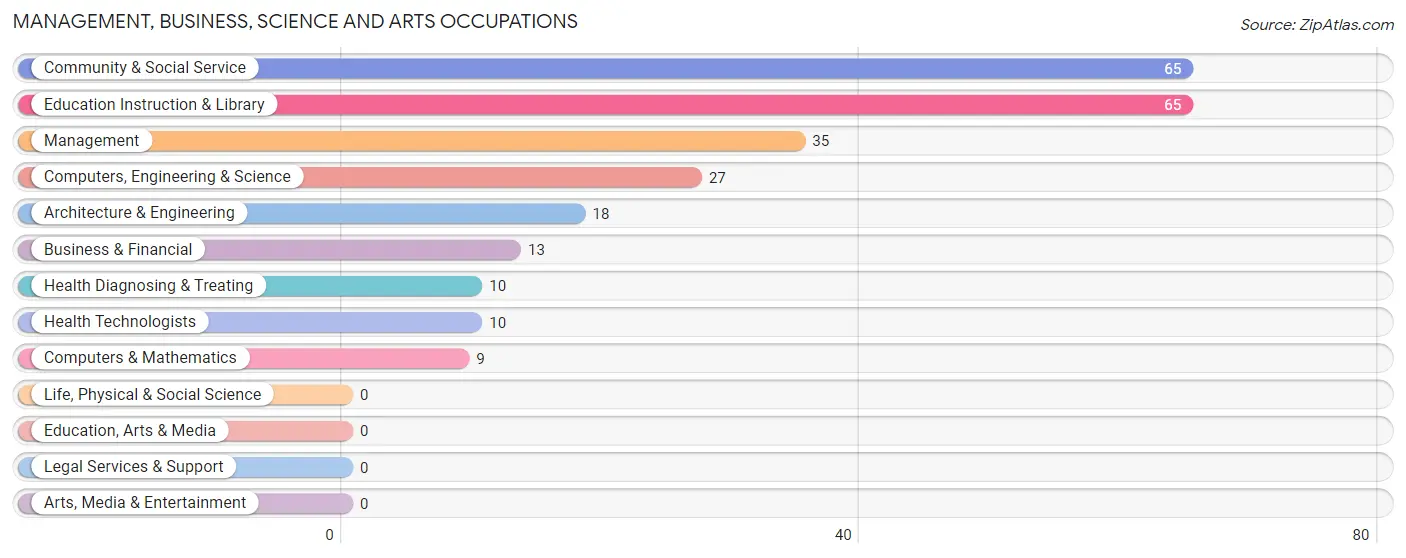
Management, Business, Science and Arts Occupations by Sex
Within the Management, Business, Science and Arts occupations in Bay View, the most male-oriented occupations are Architecture & Engineering (100.0%), Management (71.4%), and Computers, Engineering & Science (66.7%), while the most female-oriented occupations are Business & Financial (100.0%), Computers & Mathematics (100.0%), and Health Diagnosing & Treating (100.0%).
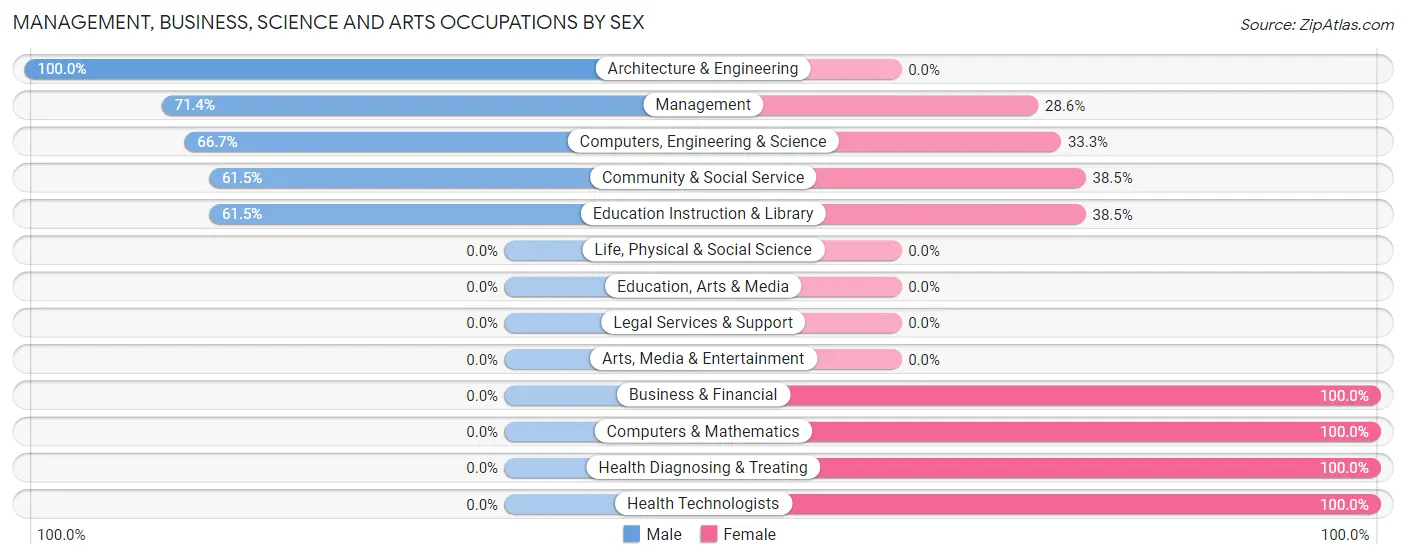
| Occupation | Male | Female |
| Management | 25 (71.4%) | 10 (28.6%) |
| Business & Financial | 0 (0.0%) | 13 (100.0%) |
| Computers, Engineering & Science | 18 (66.7%) | 9 (33.3%) |
| Computers & Mathematics | 0 (0.0%) | 9 (100.0%) |
| Architecture & Engineering | 18 (100.0%) | 0 (0.0%) |
| Life, Physical & Social Science | 0 (0.0%) | 0 (0.0%) |
| Community & Social Service | 40 (61.5%) | 25 (38.5%) |
| Education, Arts & Media | 0 (0.0%) | 0 (0.0%) |
| Legal Services & Support | 0 (0.0%) | 0 (0.0%) |
| Education Instruction & Library | 40 (61.5%) | 25 (38.5%) |
| Arts, Media & Entertainment | 0 (0.0%) | 0 (0.0%) |
| Health Diagnosing & Treating | 0 (0.0%) | 10 (100.0%) |
| Health Technologists | 0 (0.0%) | 10 (100.0%) |
| Total (Category) | 83 (55.3%) | 67 (44.7%) |
| Total (Overall) | 188 (58.8%) | 132 (41.2%) |
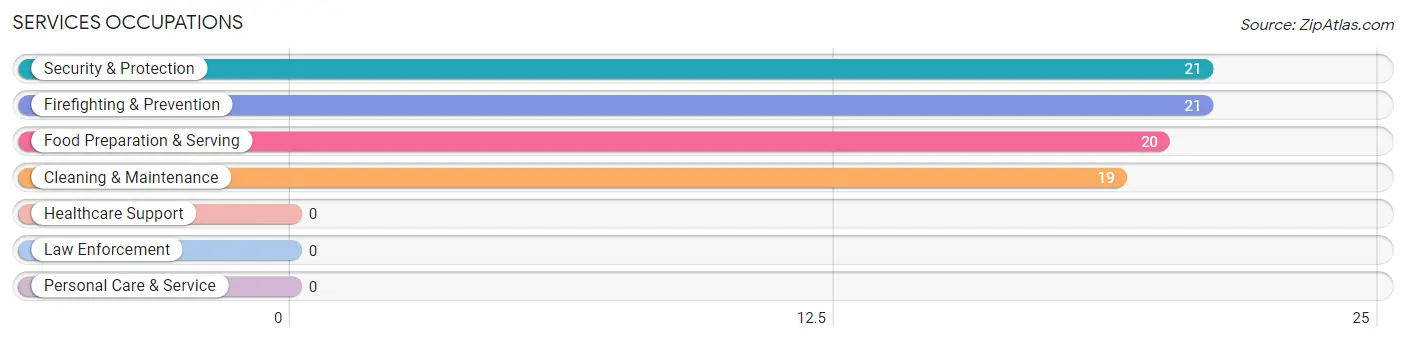
Services Occupations
The most common Services occupations in Bay View are Security & Protection (21 | 6.6%), Firefighting & Prevention (21 | 6.6%), Food Preparation & Serving (20 | 6.2%), and Cleaning & Maintenance (19 | 5.9%).
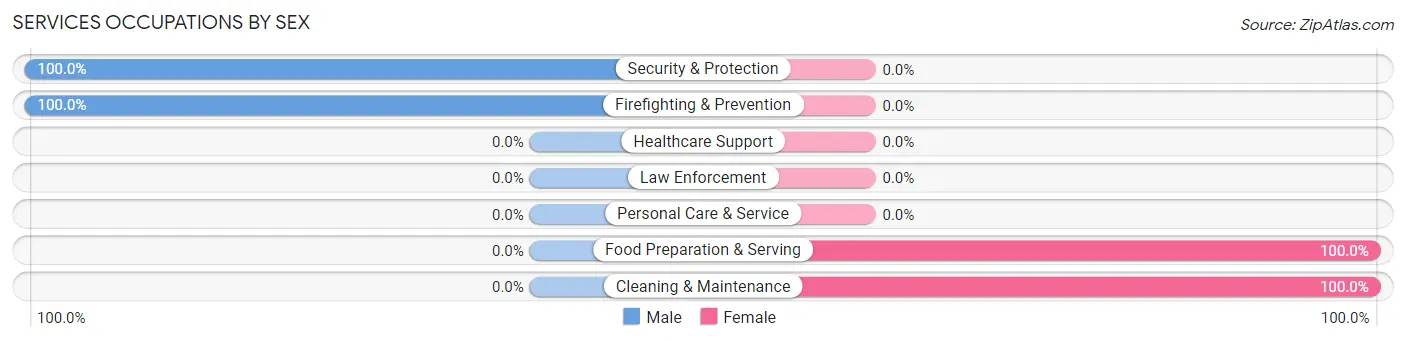
Services Occupations by Sex
Within the Services occupations in Bay View, the most male-oriented occupations are Security & Protection (100.0%), and Firefighting & Prevention (100.0%), while the most female-oriented occupations are Food Preparation & Serving (100.0%), and Cleaning & Maintenance (100.0%).
| Occupation | Male | Female |
| Healthcare Support | 0 (0.0%) | 0 (0.0%) |
| Security & Protection | 21 (100.0%) | 0 (0.0%) |
| Firefighting & Prevention | 21 (100.0%) | 0 (0.0%) |
| Law Enforcement | 0 (0.0%) | 0 (0.0%) |
| Food Preparation & Serving | 0 (0.0%) | 20 (100.0%) |
| Cleaning & Maintenance | 0 (0.0%) | 19 (100.0%) |
| Personal Care & Service | 0 (0.0%) | 0 (0.0%) |
| Total (Category) | 21 (35.0%) | 39 (65.0%) |
| Total (Overall) | 188 (58.8%) | 132 (41.2%) |
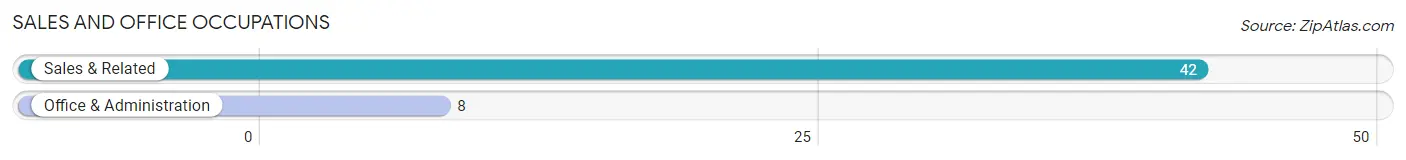
Sales and Office Occupations
The most common Sales and Office occupations in Bay View are Sales & Related (42 | 13.1%), and Office & Administration (8 | 2.5%).
Sales and Office Occupations by Sex

| Occupation | Male | Female |
| Sales & Related | 24 (57.1%) | 18 (42.9%) |
| Office & Administration | 0 (0.0%) | 8 (100.0%) |
| Total (Category) | 24 (48.0%) | 26 (52.0%) |
| Total (Overall) | 188 (58.8%) | 132 (41.2%) |
Natural Resources, Construction and Maintenance Occupations
The most common Natural Resources, Construction and Maintenance occupations in Bay View are , and Installation, Maintenance & Repair (21 | 6.6%).
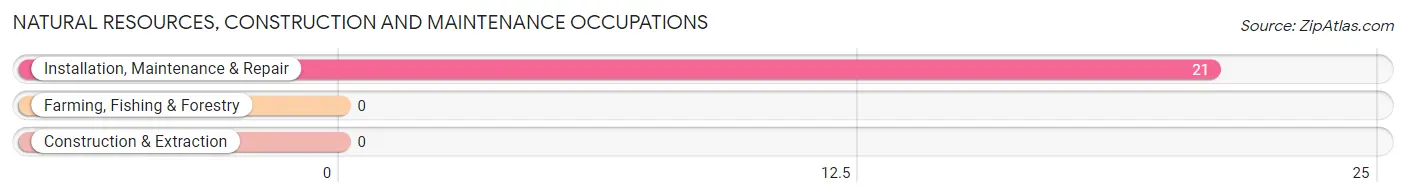
Natural Resources, Construction and Maintenance Occupations by Sex

| Occupation | Male | Female |
| Farming, Fishing & Forestry | 0 (0.0%) | 0 (0.0%) |
| Construction & Extraction | 0 (0.0%) | 0 (0.0%) |
| Installation, Maintenance & Repair | 21 (100.0%) | 0 (0.0%) |
| Total (Category) | 21 (100.0%) | 0 (0.0%) |
| Total (Overall) | 188 (58.8%) | 132 (41.2%) |
Production, Transportation and Moving Occupations
The most common Production, Transportation and Moving occupations in Bay View are Material Moving (19 | 5.9%), Production (10 | 3.1%), and Transportation (10 | 3.1%).
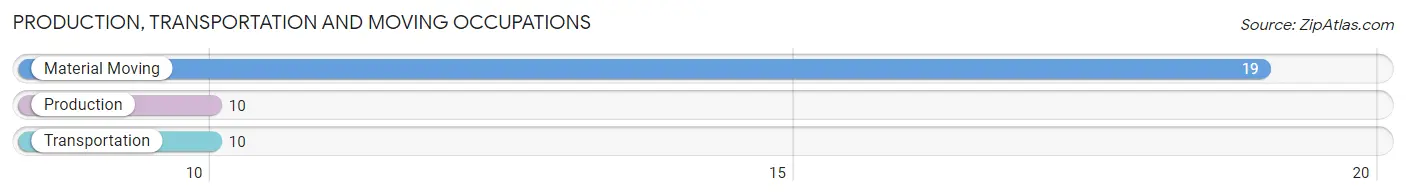
Production, Transportation and Moving Occupations by Sex
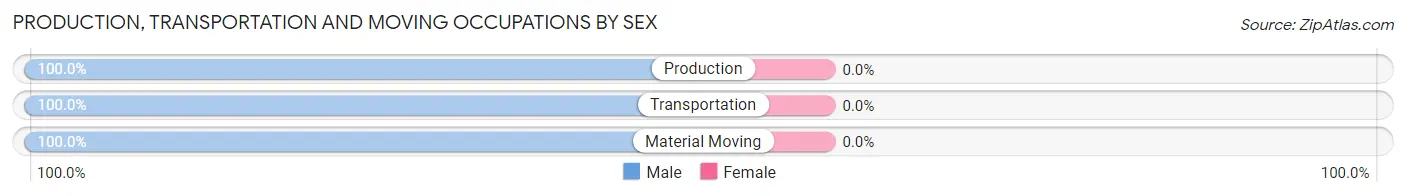
| Occupation | Male | Female |
| Production | 10 (100.0%) | 0 (0.0%) |
| Transportation | 10 (100.0%) | 0 (0.0%) |
| Material Moving | 19 (100.0%) | 0 (0.0%) |
| Total (Category) | 39 (100.0%) | 0 (0.0%) |
| Total (Overall) | 188 (58.8%) | 132 (41.2%) |
Employment Industries by Sex in Bay View
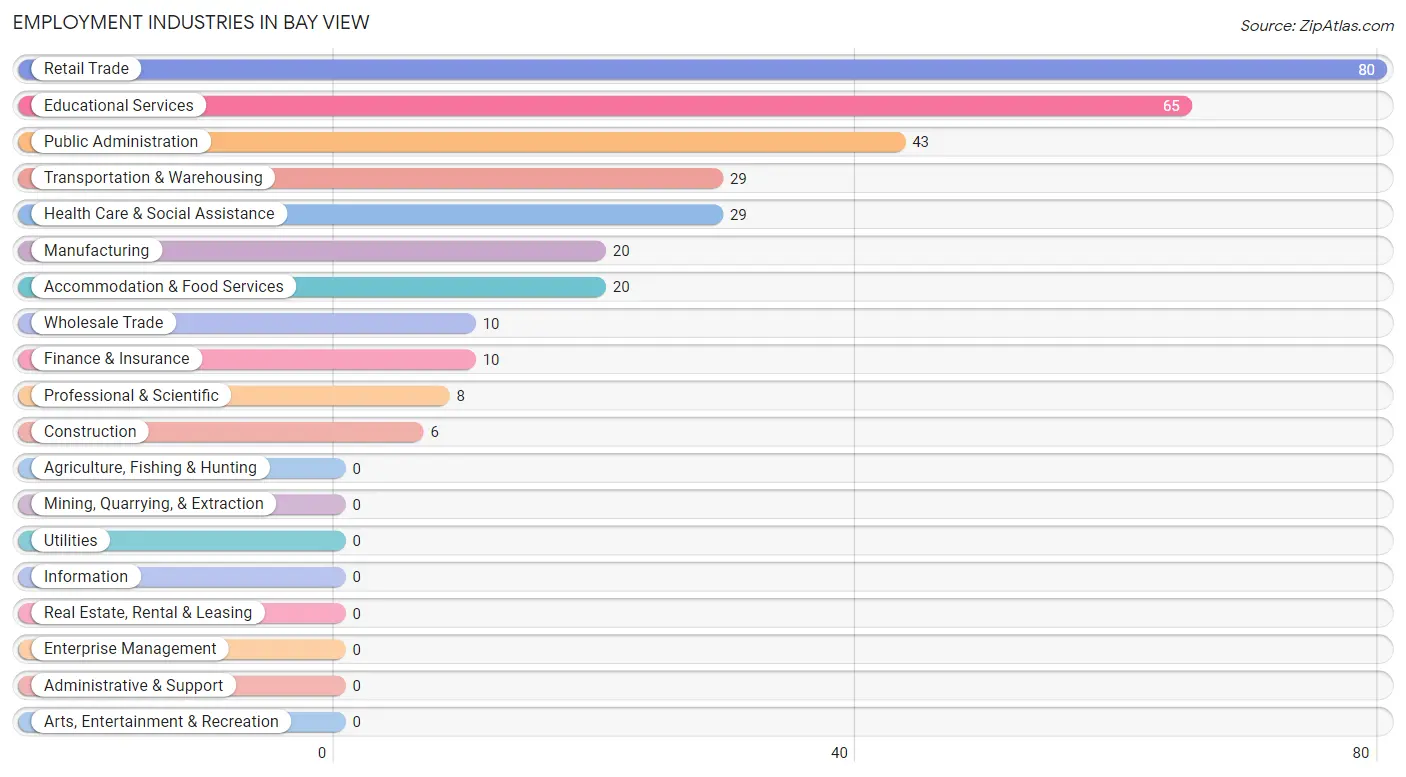
Employment Industries in Bay View
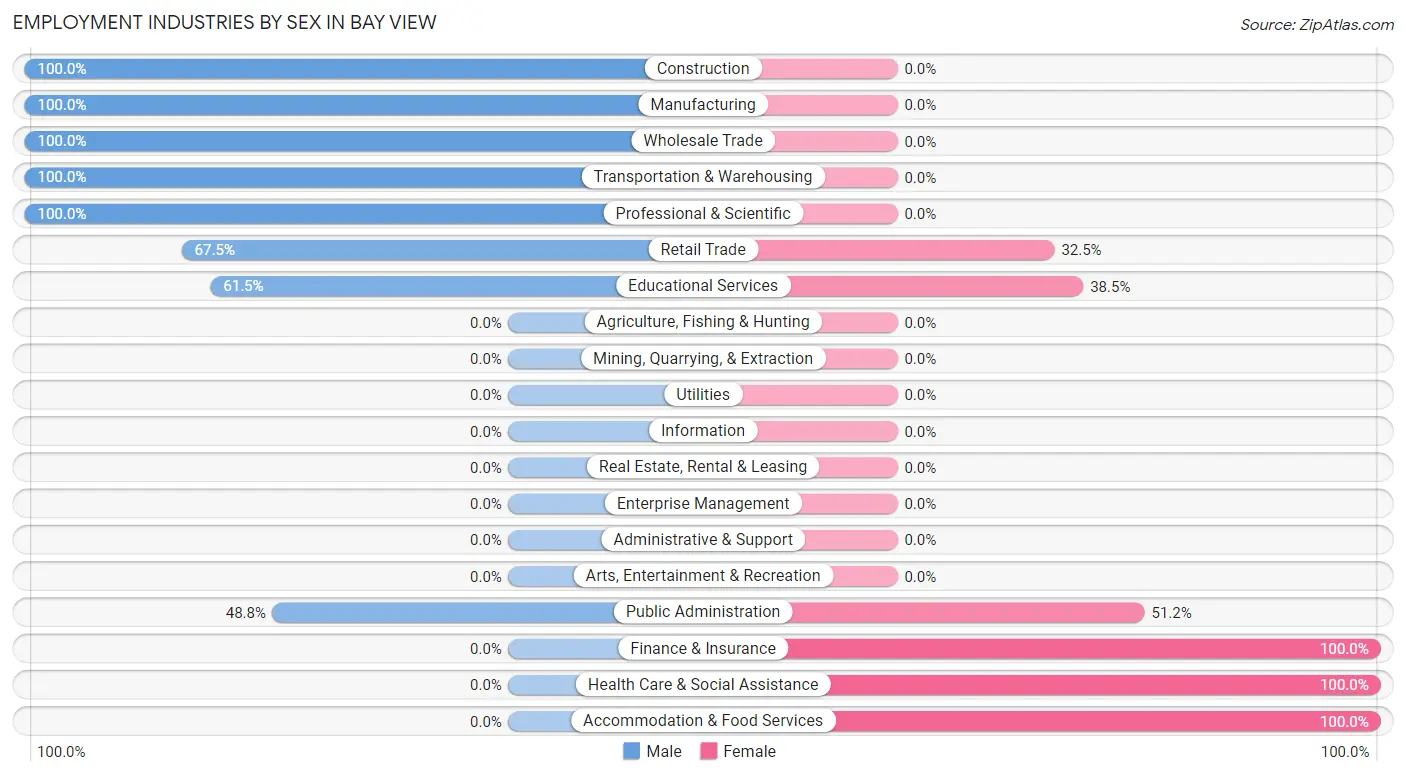
The major employment industries in Bay View include Retail Trade (80 | 25.0%), Educational Services (65 | 20.3%), Public Administration (43 | 13.4%), Transportation & Warehousing (29 | 9.1%), and Health Care & Social Assistance (29 | 9.1%).
Employment Industries by Sex in Bay View
The Bay View industries that see more men than women are Construction (100.0%), Manufacturing (100.0%), and Wholesale Trade (100.0%), whereas the industries that tend to have a higher number of women are Finance & Insurance (100.0%), Health Care & Social Assistance (100.0%), and Accommodation & Food Services (100.0%).
| Industry | Male | Female |
| Agriculture, Fishing & Hunting | 0 (0.0%) | 0 (0.0%) |
| Mining, Quarrying, & Extraction | 0 (0.0%) | 0 (0.0%) |
| Construction | 6 (100.0%) | 0 (0.0%) |
| Manufacturing | 20 (100.0%) | 0 (0.0%) |
| Wholesale Trade | 10 (100.0%) | 0 (0.0%) |
| Retail Trade | 54 (67.5%) | 26 (32.5%) |
| Transportation & Warehousing | 29 (100.0%) | 0 (0.0%) |
| Utilities | 0 (0.0%) | 0 (0.0%) |
| Information | 0 (0.0%) | 0 (0.0%) |
| Finance & Insurance | 0 (0.0%) | 10 (100.0%) |
| Real Estate, Rental & Leasing | 0 (0.0%) | 0 (0.0%) |
| Professional & Scientific | 8 (100.0%) | 0 (0.0%) |
| Enterprise Management | 0 (0.0%) | 0 (0.0%) |
| Administrative & Support | 0 (0.0%) | 0 (0.0%) |
| Educational Services | 40 (61.5%) | 25 (38.5%) |
| Health Care & Social Assistance | 0 (0.0%) | 29 (100.0%) |
| Arts, Entertainment & Recreation | 0 (0.0%) | 0 (0.0%) |
| Accommodation & Food Services | 0 (0.0%) | 20 (100.0%) |
| Public Administration | 21 (48.8%) | 22 (51.2%) |
| Total | 188 (58.8%) | 132 (41.2%) |
Education in Bay View
School Enrollment in Bay View
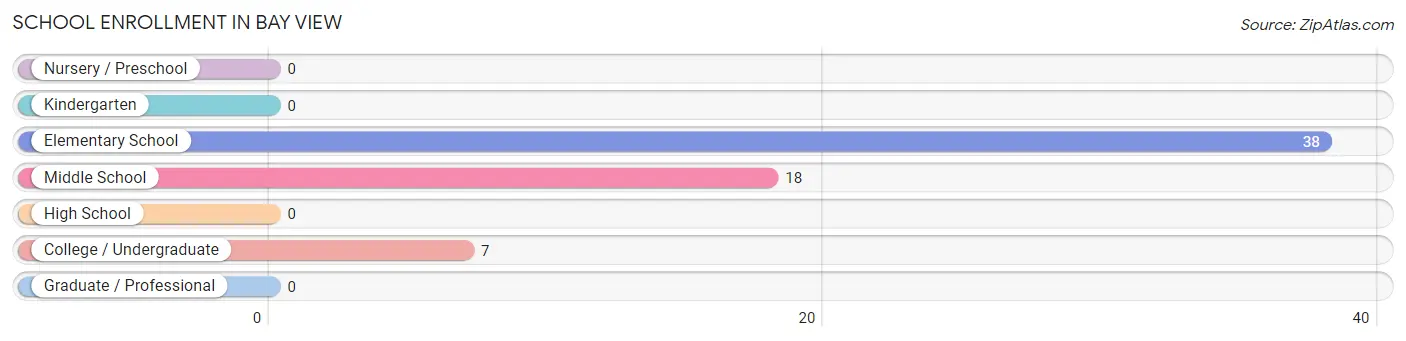
The most common levels of schooling among the 63 students in Bay View are elementary school (38 | 60.3%), middle school (18 | 28.6%), and college / undergraduate (7 | 11.1%).
| School Level | # Students | % Students |
| Nursery / Preschool | 0 | 0.0% |
| Kindergarten | 0 | 0.0% |
| Elementary School | 38 | 60.3% |
| Middle School | 18 | 28.6% |
| High School | 0 | 0.0% |
| College / Undergraduate | 7 | 11.1% |
| Graduate / Professional | 0 | 0.0% |
| Total | 63 | 100.0% |
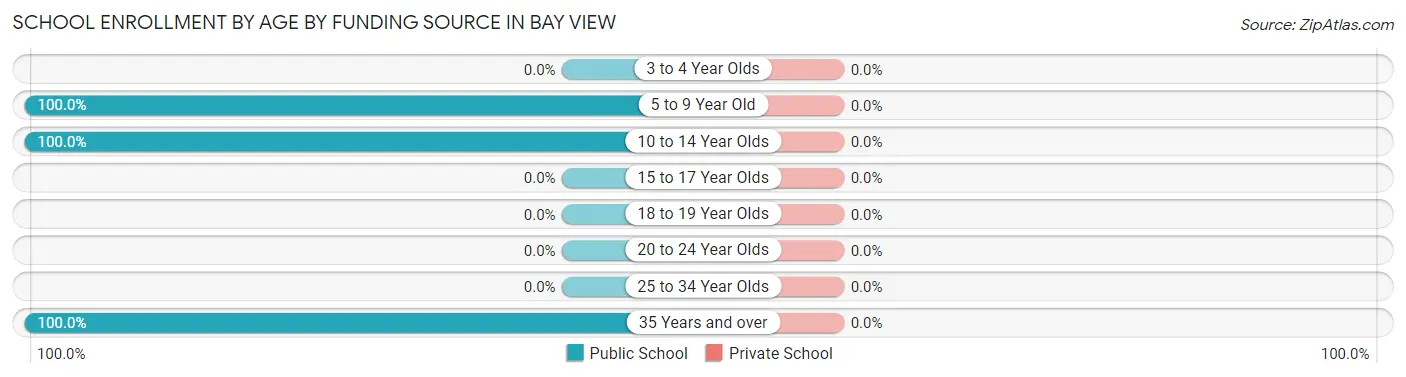
School Enrollment by Age by Funding Source in Bay View
| Age Bracket | Public School | Private School |
| 3 to 4 Year Olds | 0 (0.0%) | 0 (0.0%) |
| 5 to 9 Year Old | 38 (100.0%) | 0 (0.0%) |
| 10 to 14 Year Olds | 18 (100.0%) | 0 (0.0%) |
| 15 to 17 Year Olds | 0 (0.0%) | 0 (0.0%) |
| 18 to 19 Year Olds | 0 (0.0%) | 0 (0.0%) |
| 20 to 24 Year Olds | 0 (0.0%) | 0 (0.0%) |
| 25 to 34 Year Olds | 0 (0.0%) | 0 (0.0%) |
| 35 Years and over | 7 (100.0%) | 0 (0.0%) |
| Total | 63 (100.0%) | 0 (0.0%) |
Educational Attainment by Field of Study in Bay View
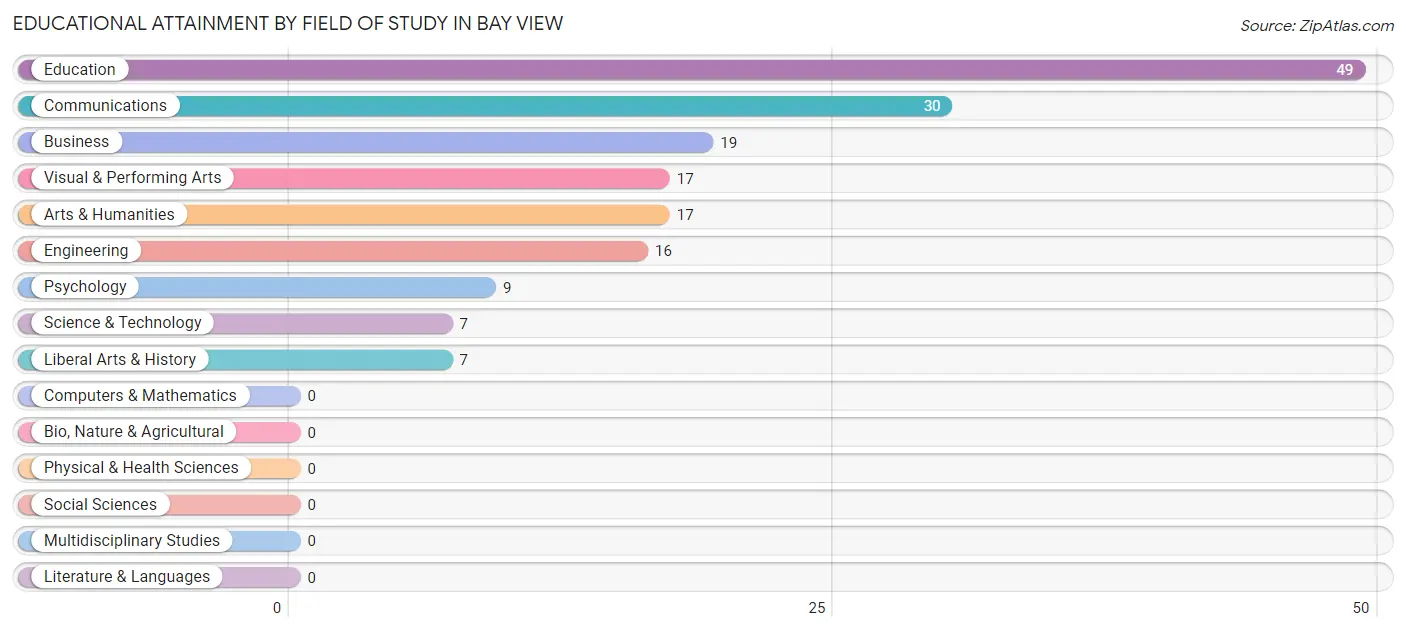
Education (49 | 28.6%), communications (30 | 17.5%), business (19 | 11.1%), visual & performing arts (17 | 9.9%), and arts & humanities (17 | 9.9%) are the most common fields of study among 171 individuals in Bay View who have obtained a bachelor's degree or higher.
| Field of Study | # Graduates | % Graduates |
| Computers & Mathematics | 0 | 0.0% |
| Bio, Nature & Agricultural | 0 | 0.0% |
| Physical & Health Sciences | 0 | 0.0% |
| Psychology | 9 | 5.3% |
| Social Sciences | 0 | 0.0% |
| Engineering | 16 | 9.4% |
| Multidisciplinary Studies | 0 | 0.0% |
| Science & Technology | 7 | 4.1% |
| Business | 19 | 11.1% |
| Education | 49 | 28.6% |
| Literature & Languages | 0 | 0.0% |
| Liberal Arts & History | 7 | 4.1% |
| Visual & Performing Arts | 17 | 9.9% |
| Communications | 30 | 17.5% |
| Arts & Humanities | 17 | 9.9% |
| Total | 171 | 100.0% |
Transportation & Commute in Bay View
Vehicle Availability by Sex in Bay View
The most prevalent vehicle ownership categories in Bay View are males with 3 vehicles (91, accounting for 48.4%) and females with 3 vehicles (96, making up 68.9%).
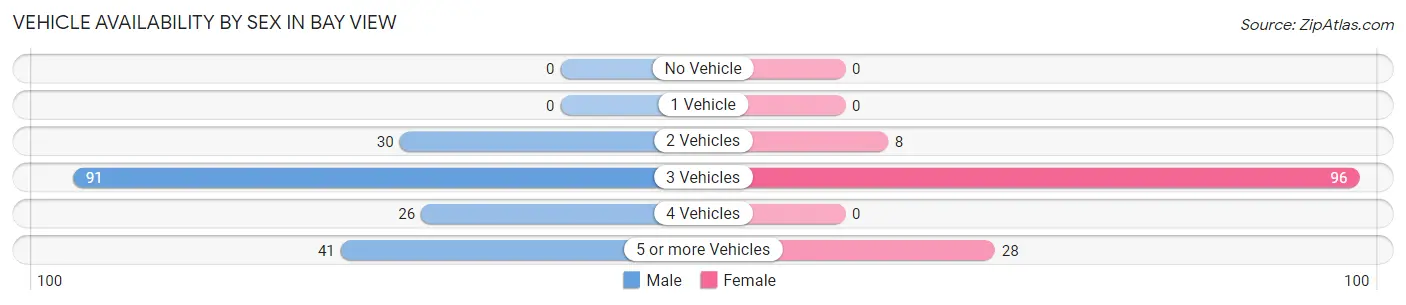
| Vehicles Available | Male | Female |
| No Vehicle | 0 (0.0%) | 0 (0.0%) |
| 1 Vehicle | 0 (0.0%) | 0 (0.0%) |
| 2 Vehicles | 30 (16.0%) | 8 (6.1%) |
| 3 Vehicles | 91 (48.4%) | 96 (72.7%) |
| 4 Vehicles | 26 (13.8%) | 0 (0.0%) |
| 5 or more Vehicles | 41 (21.8%) | 28 (21.2%) |
| Total | 188 (100.0%) | 132 (100.0%) |
Commute Time in Bay View
The most frequently occuring commute durations in Bay View are 45 to 59 minutes (80 commuters, 25.6%), 15 to 19 minutes (69 commuters, 22.0%), and 10 to 14 minutes (57 commuters, 18.2%).
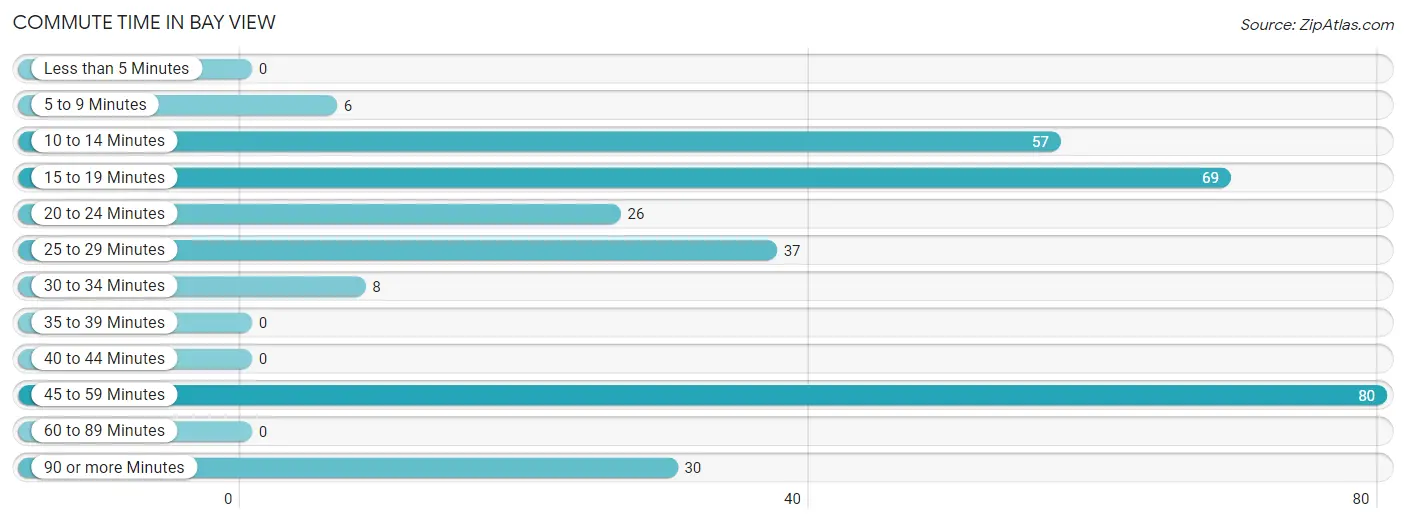
| Commute Time | # Commuters | % Commuters |
| Less than 5 Minutes | 0 | 0.0% |
| 5 to 9 Minutes | 6 | 1.9% |
| 10 to 14 Minutes | 57 | 18.2% |
| 15 to 19 Minutes | 69 | 22.0% |
| 20 to 24 Minutes | 26 | 8.3% |
| 25 to 29 Minutes | 37 | 11.8% |
| 30 to 34 Minutes | 8 | 2.6% |
| 35 to 39 Minutes | 0 | 0.0% |
| 40 to 44 Minutes | 0 | 0.0% |
| 45 to 59 Minutes | 80 | 25.6% |
| 60 to 89 Minutes | 0 | 0.0% |
| 90 or more Minutes | 30 | 9.6% |
Commute Time by Sex in Bay View
The most common commute times in Bay View are 45 to 59 minutes (80 commuters, 44.2%) for males and 15 to 19 minutes (69 commuters, 52.3%) for females.
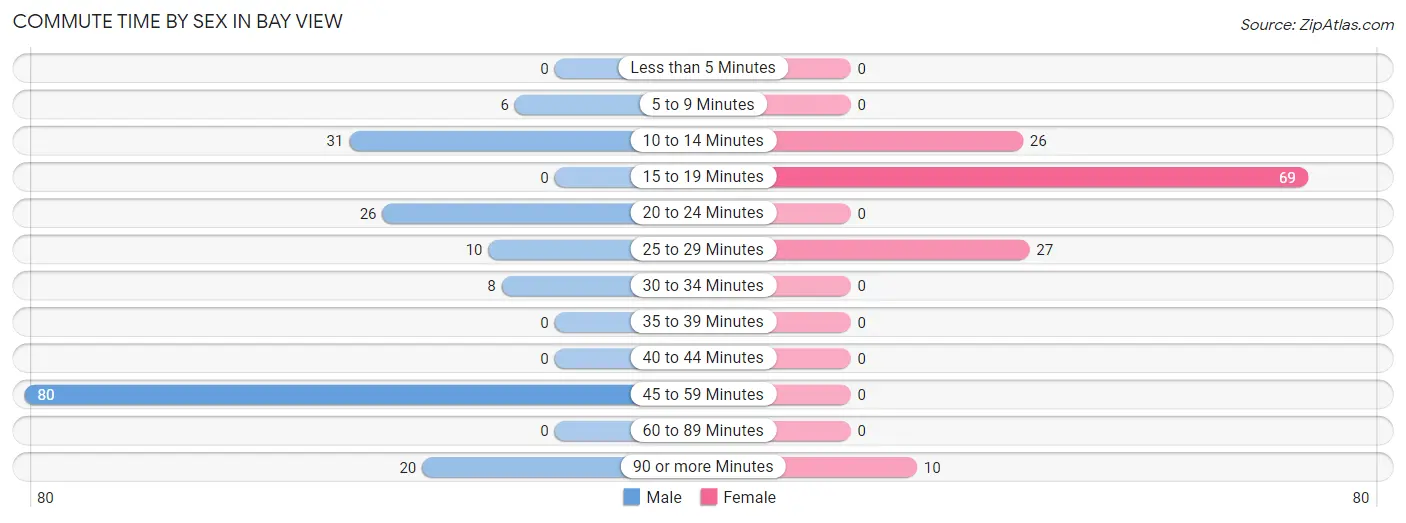
| Commute Time | Male | Female |
| Less than 5 Minutes | 0 (0.0%) | 0 (0.0%) |
| 5 to 9 Minutes | 6 (3.3%) | 0 (0.0%) |
| 10 to 14 Minutes | 31 (17.1%) | 26 (19.7%) |
| 15 to 19 Minutes | 0 (0.0%) | 69 (52.3%) |
| 20 to 24 Minutes | 26 (14.4%) | 0 (0.0%) |
| 25 to 29 Minutes | 10 (5.5%) | 27 (20.4%) |
| 30 to 34 Minutes | 8 (4.4%) | 0 (0.0%) |
| 35 to 39 Minutes | 0 (0.0%) | 0 (0.0%) |
| 40 to 44 Minutes | 0 (0.0%) | 0 (0.0%) |
| 45 to 59 Minutes | 80 (44.2%) | 0 (0.0%) |
| 60 to 89 Minutes | 0 (0.0%) | 0 (0.0%) |
| 90 or more Minutes | 20 (11.1%) | 10 (7.6%) |
Time of Departure to Work by Sex in Bay View
The most frequent times of departure to work in Bay View are 6:30 AM to 6:59 AM (35, 19.3%) for males and 8:00 AM to 8:29 AM (77, 58.3%) for females.
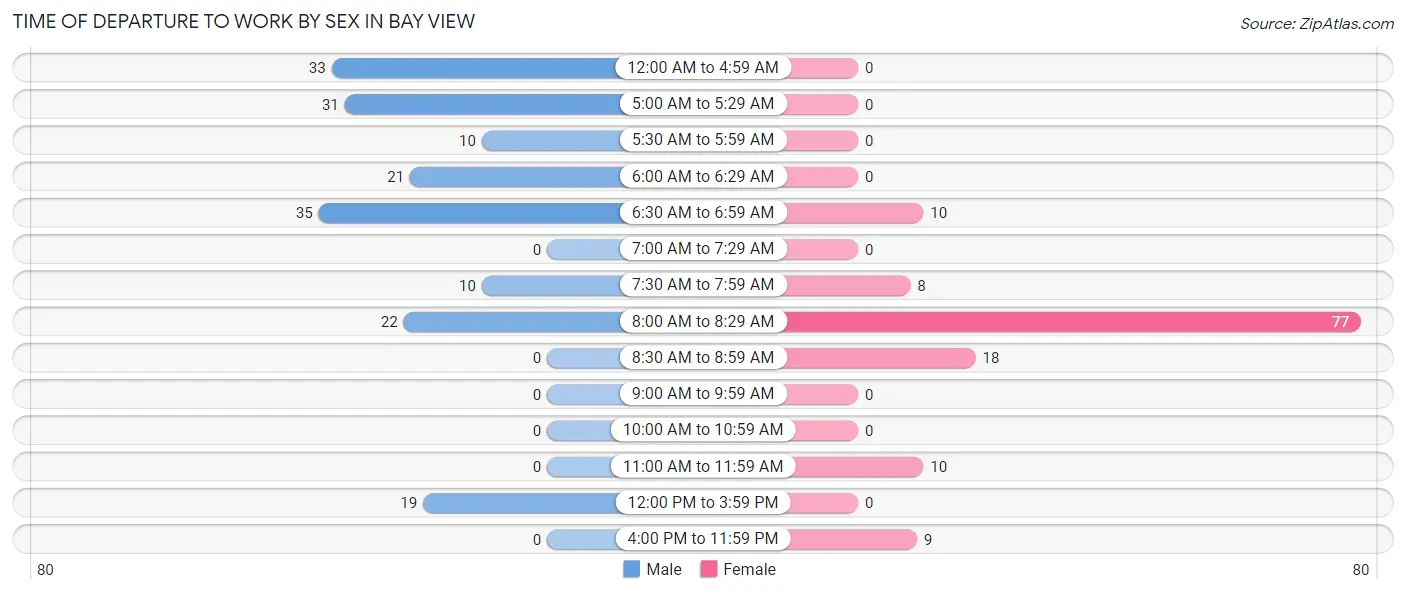
| Time of Departure | Male | Female |
| 12:00 AM to 4:59 AM | 33 (18.2%) | 0 (0.0%) |
| 5:00 AM to 5:29 AM | 31 (17.1%) | 0 (0.0%) |
| 5:30 AM to 5:59 AM | 10 (5.5%) | 0 (0.0%) |
| 6:00 AM to 6:29 AM | 21 (11.6%) | 0 (0.0%) |
| 6:30 AM to 6:59 AM | 35 (19.3%) | 10 (7.6%) |
| 7:00 AM to 7:29 AM | 0 (0.0%) | 0 (0.0%) |
| 7:30 AM to 7:59 AM | 10 (5.5%) | 8 (6.1%) |
| 8:00 AM to 8:29 AM | 22 (12.1%) | 77 (58.3%) |
| 8:30 AM to 8:59 AM | 0 (0.0%) | 18 (13.6%) |
| 9:00 AM to 9:59 AM | 0 (0.0%) | 0 (0.0%) |
| 10:00 AM to 10:59 AM | 0 (0.0%) | 0 (0.0%) |
| 11:00 AM to 11:59 AM | 0 (0.0%) | 10 (7.6%) |
| 12:00 PM to 3:59 PM | 19 (10.5%) | 0 (0.0%) |
| 4:00 PM to 11:59 PM | 0 (0.0%) | 9 (6.8%) |
| Total | 181 (100.0%) | 132 (100.0%) |
Housing Occupancy in Bay View
Occupancy by Ownership in Bay View
Of the total 259 dwellings in Bay View, owner-occupied units account for 232 (89.6%), while renter-occupied units make up 27 (10.4%).
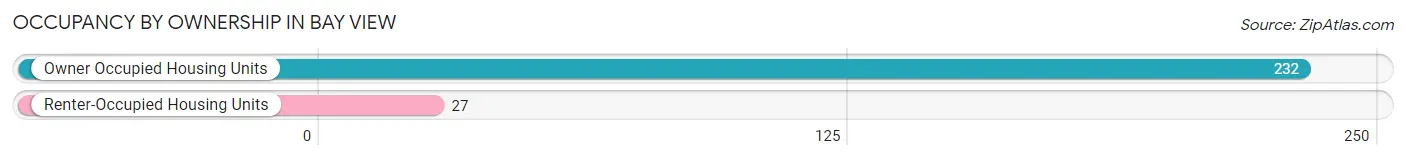
| Occupancy | # Housing Units | % Housing Units |
| Owner Occupied Housing Units | 232 | 89.6% |
| Renter-Occupied Housing Units | 27 | 10.4% |
| Total Occupied Housing Units | 259 | 100.0% |
Occupancy by Household Size in Bay View
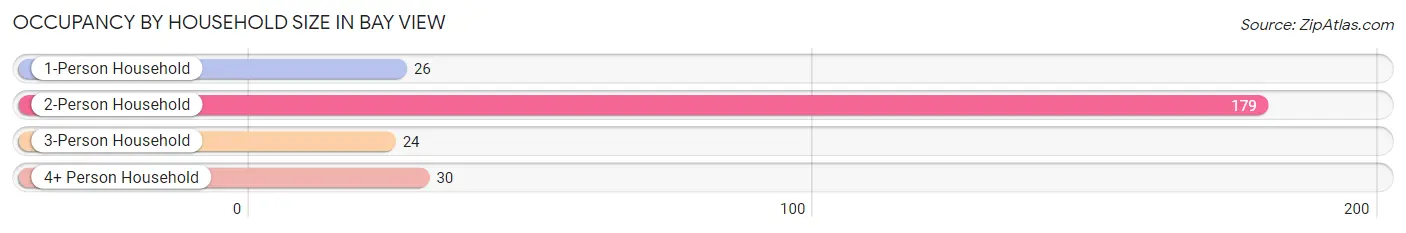
| Household Size | # Housing Units | % Housing Units |
| 1-Person Household | 26 | 10.0% |
| 2-Person Household | 179 | 69.1% |
| 3-Person Household | 24 | 9.3% |
| 4+ Person Household | 30 | 11.6% |
| Total Housing Units | 259 | 100.0% |
Occupancy by Ownership by Household Size in Bay View
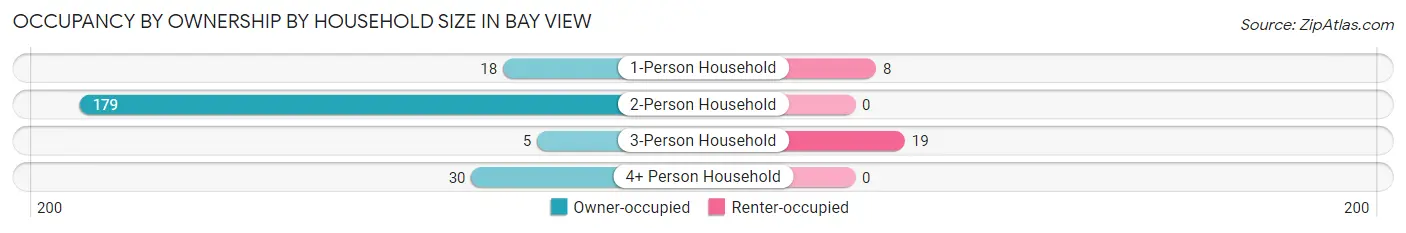
| Household Size | Owner-occupied | Renter-occupied |
| 1-Person Household | 18 (69.2%) | 8 (30.8%) |
| 2-Person Household | 179 (100.0%) | 0 (0.0%) |
| 3-Person Household | 5 (20.8%) | 19 (79.2%) |
| 4+ Person Household | 30 (100.0%) | 0 (0.0%) |
| Total Housing Units | 232 (89.6%) | 27 (10.4%) |
Occupancy by Educational Attainment in Bay View
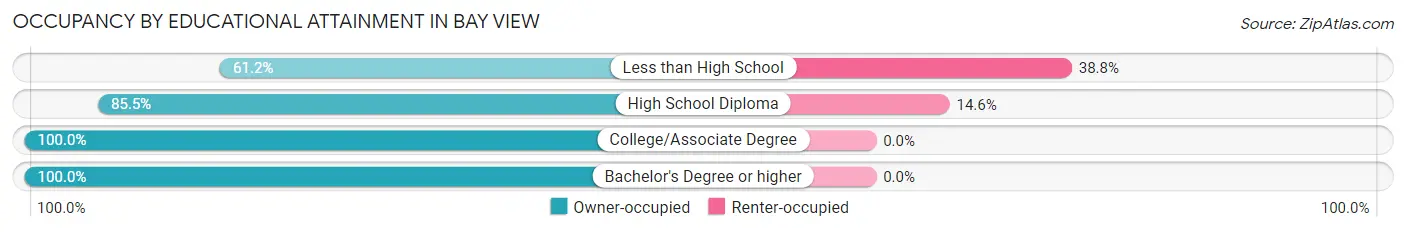
| Household Size | Owner-occupied | Renter-occupied |
| Less than High School | 30 (61.2%) | 19 (38.8%) |
| High School Diploma | 47 (85.5%) | 8 (14.5%) |
| College/Associate Degree | 80 (100.0%) | 0 (0.0%) |
| Bachelor's Degree or higher | 75 (100.0%) | 0 (0.0%) |
Occupancy by Age of Householder in Bay View
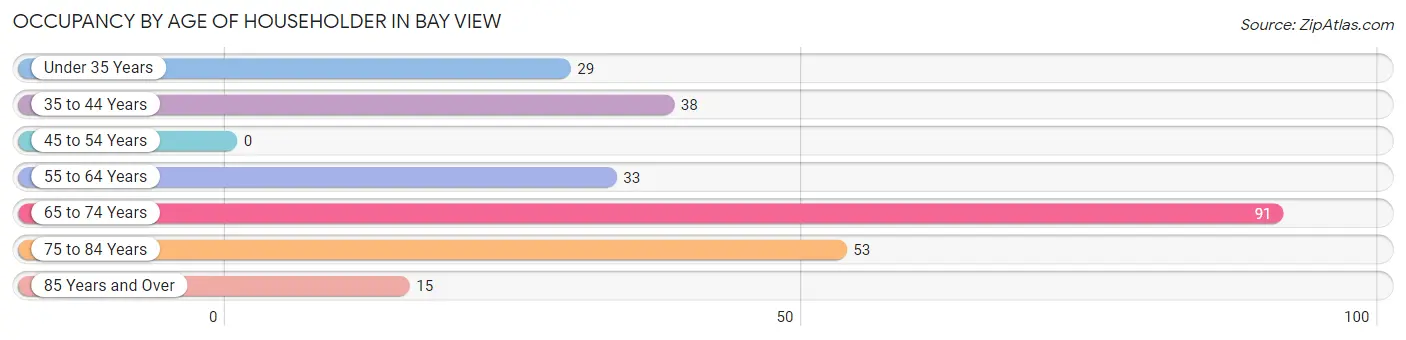
| Age Bracket | # Households | % Households |
| Under 35 Years | 29 | 11.2% |
| 35 to 44 Years | 38 | 14.7% |
| 45 to 54 Years | 0 | 0.0% |
| 55 to 64 Years | 33 | 12.7% |
| 65 to 74 Years | 91 | 35.1% |
| 75 to 84 Years | 53 | 20.5% |
| 85 Years and Over | 15 | 5.8% |
| Total | 259 | 100.0% |
Housing Finances in Bay View
Median Income by Occupancy in Bay View
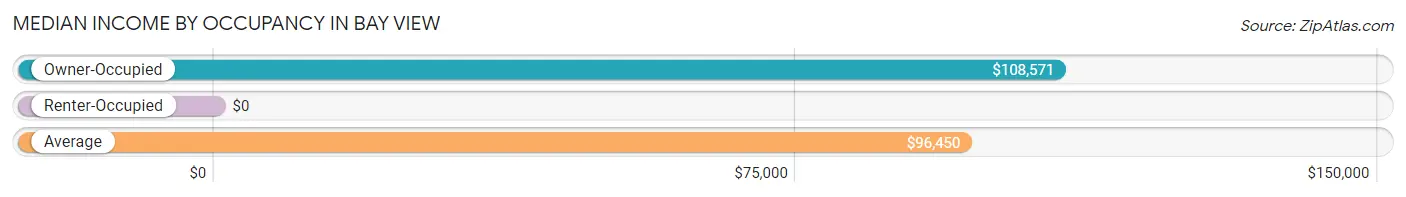
| Occupancy Type | # Households | Median Income |
| Owner-Occupied | 232 (89.6%) | $108,571 |
| Renter-Occupied | 27 (10.4%) | $0 |
| Average | 259 (100.0%) | $96,450 |
Occupancy by Householder Income Bracket in Bay View
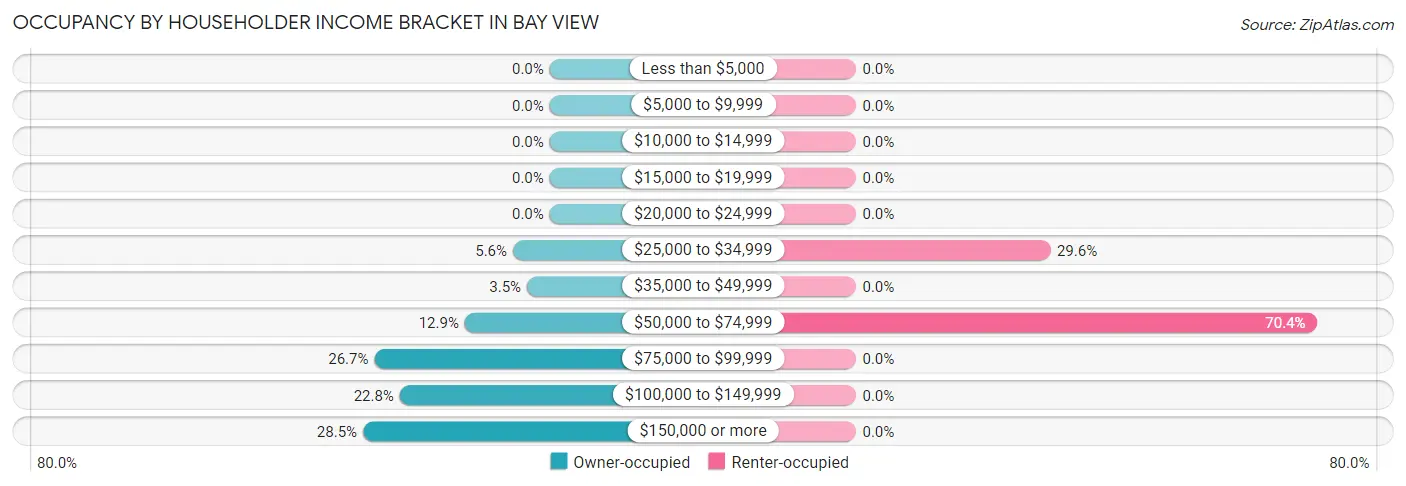
| Income Bracket | Owner-occupied | Renter-occupied |
| Less than $5,000 | 0 (0.0%) | 0 (0.0%) |
| $5,000 to $9,999 | 0 (0.0%) | 0 (0.0%) |
| $10,000 to $14,999 | 0 (0.0%) | 0 (0.0%) |
| $15,000 to $19,999 | 0 (0.0%) | 0 (0.0%) |
| $20,000 to $24,999 | 0 (0.0%) | 0 (0.0%) |
| $25,000 to $34,999 | 13 (5.6%) | 8 (29.6%) |
| $35,000 to $49,999 | 8 (3.5%) | 0 (0.0%) |
| $50,000 to $74,999 | 30 (12.9%) | 19 (70.4%) |
| $75,000 to $99,999 | 62 (26.7%) | 0 (0.0%) |
| $100,000 to $149,999 | 53 (22.8%) | 0 (0.0%) |
| $150,000 or more | 66 (28.4%) | 0 (0.0%) |
| Total | 232 (100.0%) | 27 (100.0%) |
Monthly Housing Cost Tiers in Bay View
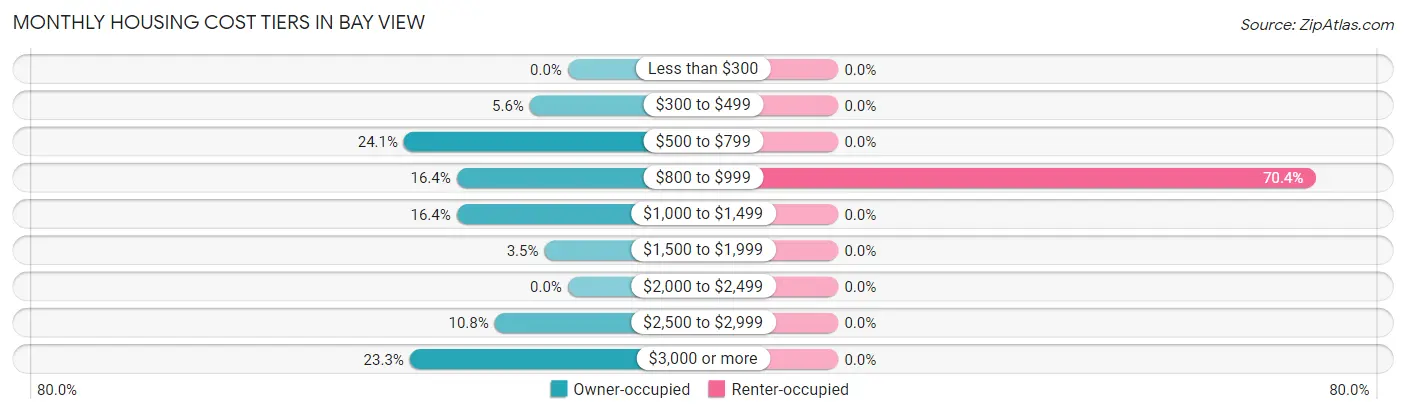
| Monthly Cost | Owner-occupied | Renter-occupied |
| Less than $300 | 0 (0.0%) | 0 (0.0%) |
| $300 to $499 | 13 (5.6%) | 0 (0.0%) |
| $500 to $799 | 56 (24.1%) | 0 (0.0%) |
| $800 to $999 | 38 (16.4%) | 19 (70.4%) |
| $1,000 to $1,499 | 38 (16.4%) | 0 (0.0%) |
| $1,500 to $1,999 | 8 (3.5%) | 0 (0.0%) |
| $2,000 to $2,499 | 0 (0.0%) | 0 (0.0%) |
| $2,500 to $2,999 | 25 (10.8%) | 0 (0.0%) |
| $3,000 or more | 54 (23.3%) | 0 (0.0%) |
| Total | 232 (100.0%) | 27 (100.0%) |
Physical Housing Characteristics in Bay View
Housing Structures in Bay View
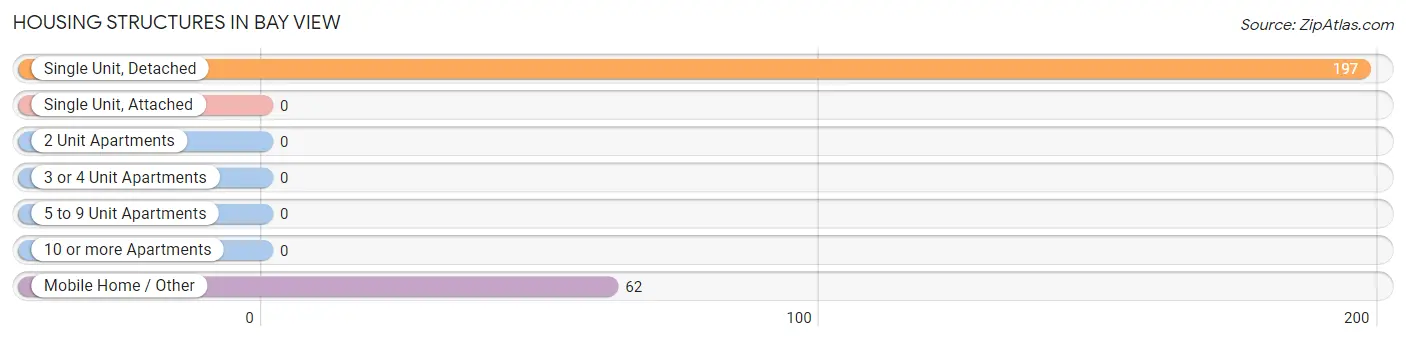
| Structure Type | # Housing Units | % Housing Units |
| Single Unit, Detached | 197 | 76.1% |
| Single Unit, Attached | 0 | 0.0% |
| 2 Unit Apartments | 0 | 0.0% |
| 3 or 4 Unit Apartments | 0 | 0.0% |
| 5 to 9 Unit Apartments | 0 | 0.0% |
| 10 or more Apartments | 0 | 0.0% |
| Mobile Home / Other | 62 | 23.9% |
| Total | 259 | 100.0% |
Housing Structures by Occupancy in Bay View
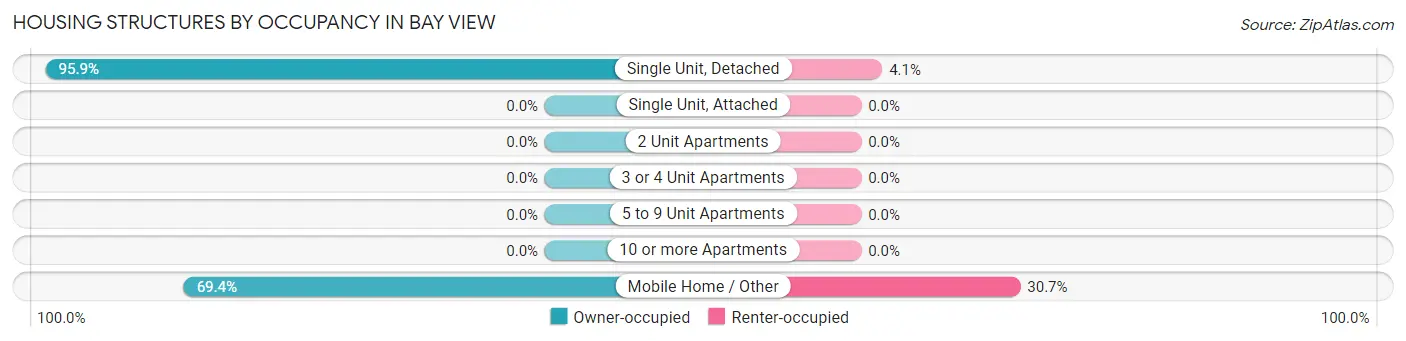
| Structure Type | Owner-occupied | Renter-occupied |
| Single Unit, Detached | 189 (95.9%) | 8 (4.1%) |
| Single Unit, Attached | 0 (0.0%) | 0 (0.0%) |
| 2 Unit Apartments | 0 (0.0%) | 0 (0.0%) |
| 3 or 4 Unit Apartments | 0 (0.0%) | 0 (0.0%) |
| 5 to 9 Unit Apartments | 0 (0.0%) | 0 (0.0%) |
| 10 or more Apartments | 0 (0.0%) | 0 (0.0%) |
| Mobile Home / Other | 43 (69.4%) | 19 (30.6%) |
| Total | 232 (89.6%) | 27 (10.4%) |
Housing Structures by Number of Rooms in Bay View
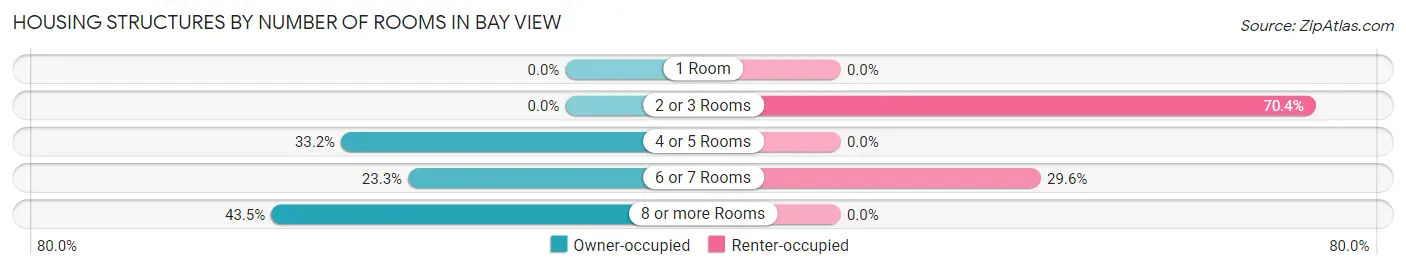
| Number of Rooms | Owner-occupied | Renter-occupied |
| 1 Room | 0 (0.0%) | 0 (0.0%) |
| 2 or 3 Rooms | 0 (0.0%) | 19 (70.4%) |
| 4 or 5 Rooms | 77 (33.2%) | 0 (0.0%) |
| 6 or 7 Rooms | 54 (23.3%) | 8 (29.6%) |
| 8 or more Rooms | 101 (43.5%) | 0 (0.0%) |
| Total | 232 (100.0%) | 27 (100.0%) |
Housing Structure by Heating Type in Bay View
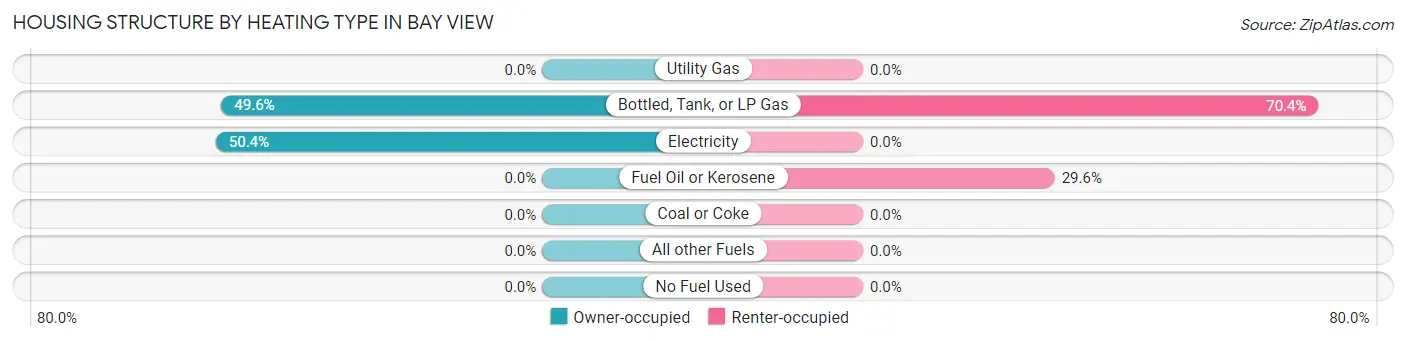
| Heating Type | Owner-occupied | Renter-occupied |
| Utility Gas | 0 (0.0%) | 0 (0.0%) |
| Bottled, Tank, or LP Gas | 115 (49.6%) | 19 (70.4%) |
| Electricity | 117 (50.4%) | 0 (0.0%) |
| Fuel Oil or Kerosene | 0 (0.0%) | 8 (29.6%) |
| Coal or Coke | 0 (0.0%) | 0 (0.0%) |
| All other Fuels | 0 (0.0%) | 0 (0.0%) |
| No Fuel Used | 0 (0.0%) | 0 (0.0%) |
| Total | 232 (100.0%) | 27 (100.0%) |
Household Vehicle Usage in Bay View
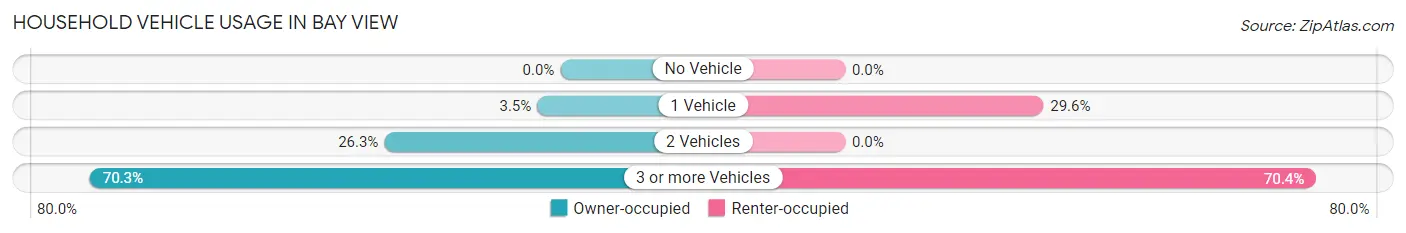
| Vehicles per Household | Owner-occupied | Renter-occupied |
| No Vehicle | 0 (0.0%) | 0 (0.0%) |
| 1 Vehicle | 8 (3.5%) | 8 (29.6%) |
| 2 Vehicles | 61 (26.3%) | 0 (0.0%) |
| 3 or more Vehicles | 163 (70.3%) | 19 (70.4%) |
| Total | 232 (100.0%) | 27 (100.0%) |
Real Estate & Mortgages in Bay View
Real Estate and Mortgage Overview in Bay View
| Characteristic | Without Mortgage | With Mortgage |
| Housing Units | 153 | 79 |
| Median Property Value | $562,500 | $875,000 |
| Median Household Income | $85,903 | $47 |
| Monthly Housing Costs | $820 | $54 |
| Real Estate Taxes | $4,100 | $0 |
Property Value by Mortgage Status in Bay View
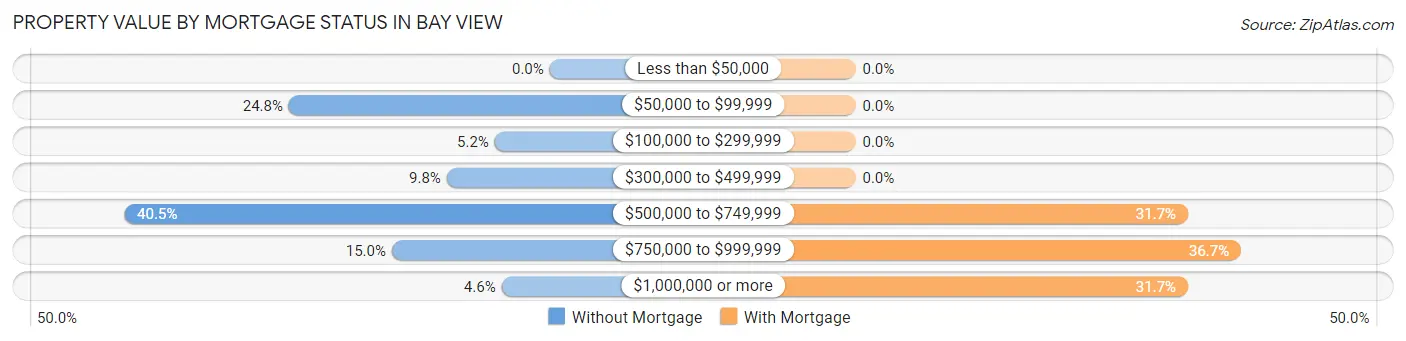
| Property Value | Without Mortgage | With Mortgage |
| Less than $50,000 | 0 (0.0%) | 0 (0.0%) |
| $50,000 to $99,999 | 38 (24.8%) | 0 (0.0%) |
| $100,000 to $299,999 | 8 (5.2%) | 0 (0.0%) |
| $300,000 to $499,999 | 15 (9.8%) | 0 (0.0%) |
| $500,000 to $749,999 | 62 (40.5%) | 25 (31.7%) |
| $750,000 to $999,999 | 23 (15.0%) | 29 (36.7%) |
| $1,000,000 or more | 7 (4.6%) | 25 (31.7%) |
| Total | 153 (100.0%) | 79 (100.0%) |
Household Income by Mortgage Status in Bay View
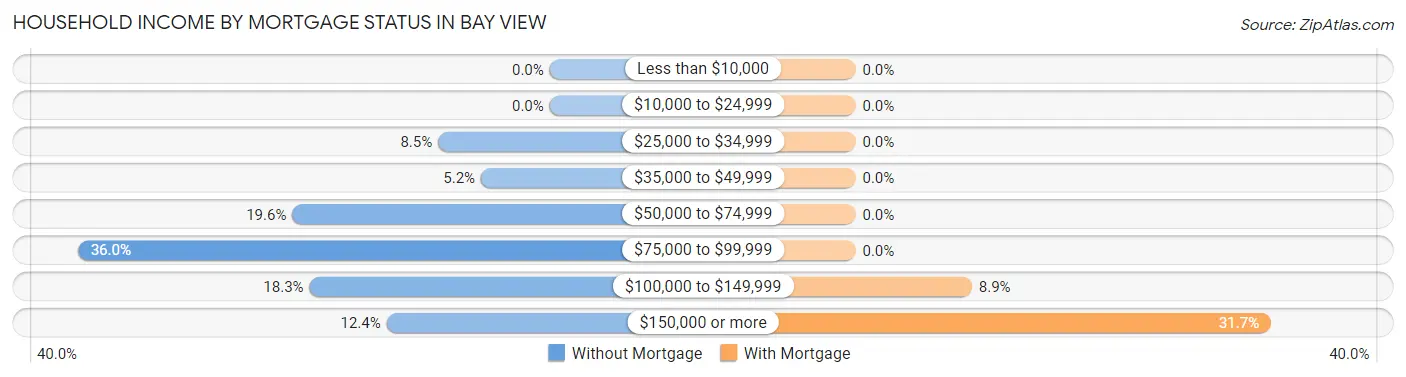
| Household Income | Without Mortgage | With Mortgage |
| Less than $10,000 | 0 (0.0%) | 0 (0.0%) |
| $10,000 to $24,999 | 0 (0.0%) | 0 (0.0%) |
| $25,000 to $34,999 | 13 (8.5%) | 0 (0.0%) |
| $35,000 to $49,999 | 8 (5.2%) | 0 (0.0%) |
| $50,000 to $74,999 | 30 (19.6%) | 0 (0.0%) |
| $75,000 to $99,999 | 55 (35.9%) | 0 (0.0%) |
| $100,000 to $149,999 | 28 (18.3%) | 7 (8.9%) |
| $150,000 or more | 19 (12.4%) | 25 (31.7%) |
| Total | 153 (100.0%) | 79 (100.0%) |
Property Value to Household Income Ratio in Bay View
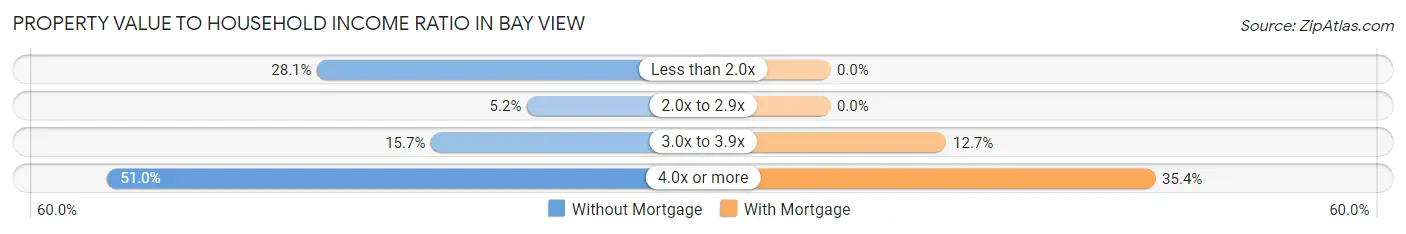
| Value-to-Income Ratio | Without Mortgage | With Mortgage |
| Less than 2.0x | 43 (28.1%) | 0 (0.0%) |
| 2.0x to 2.9x | 8 (5.2%) | 0 (0.0%) |
| 3.0x to 3.9x | 24 (15.7%) | 10 (12.7%) |
| 4.0x or more | 78 (51.0%) | 28 (35.4%) |
| Total | 153 (100.0%) | 79 (100.0%) |
Real Estate Taxes by Mortgage Status in Bay View
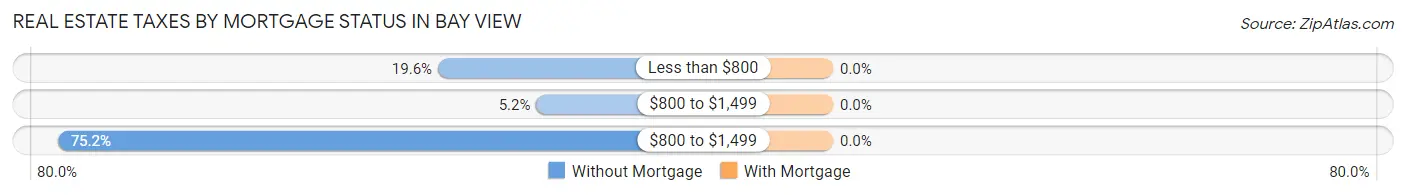
| Property Taxes | Without Mortgage | With Mortgage |
| Less than $800 | 30 (19.6%) | 0 (0.0%) |
| $800 to $1,499 | 8 (5.2%) | 0 (0.0%) |
| $800 to $1,499 | 115 (75.2%) | 0 (0.0%) |
| Total | 153 (100.0%) | 79 (100.0%) |
Health & Disability in Bay View
Health Insurance Coverage by Age in Bay View
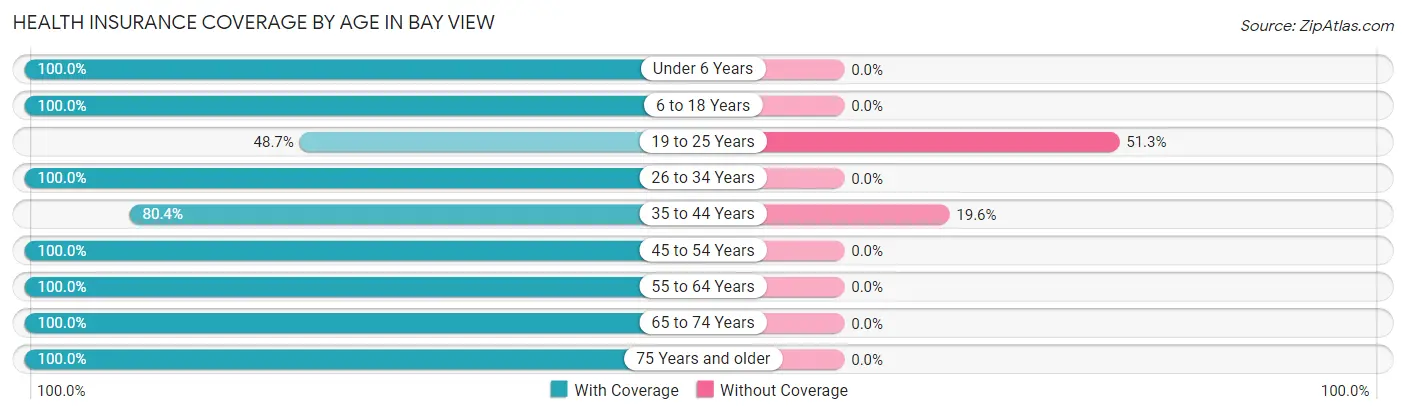
| Age Bracket | With Coverage | Without Coverage |
| Under 6 Years | 21 (100.0%) | 0 (0.0%) |
| 6 to 18 Years | 56 (100.0%) | 0 (0.0%) |
| 19 to 25 Years | 19 (48.7%) | 20 (51.3%) |
| 26 to 34 Years | 51 (100.0%) | 0 (0.0%) |
| 35 to 44 Years | 78 (80.4%) | 19 (19.6%) |
| 45 to 54 Years | 23 (100.0%) | 0 (0.0%) |
| 55 to 64 Years | 101 (100.0%) | 0 (0.0%) |
| 65 to 74 Years | 143 (100.0%) | 0 (0.0%) |
| 75 Years and older | 104 (100.0%) | 0 (0.0%) |
| Total | 596 (93.9%) | 39 (6.1%) |
Health Insurance Coverage by Citizenship Status in Bay View
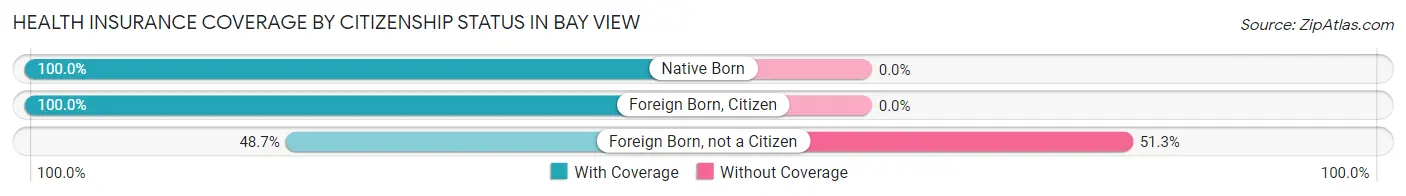
| Citizenship Status | With Coverage | Without Coverage |
| Native Born | 21 (100.0%) | 0 (0.0%) |
| Foreign Born, Citizen | 56 (100.0%) | 0 (0.0%) |
| Foreign Born, not a Citizen | 19 (48.7%) | 20 (51.3%) |
Health Insurance Coverage by Household Income in Bay View
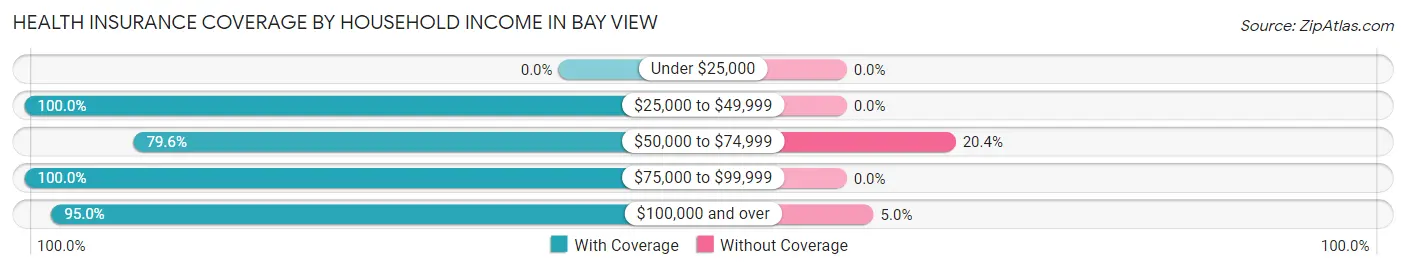
| Household Income | With Coverage | Without Coverage |
| Under $25,000 | 0 (0.0%) | 0 (0.0%) |
| $25,000 to $49,999 | 49 (100.0%) | 0 (0.0%) |
| $50,000 to $74,999 | 78 (79.6%) | 20 (20.4%) |
| $75,000 to $99,999 | 107 (100.0%) | 0 (0.0%) |
| $100,000 and over | 359 (95.0%) | 19 (5.0%) |
Public vs Private Health Insurance Coverage by Age in Bay View
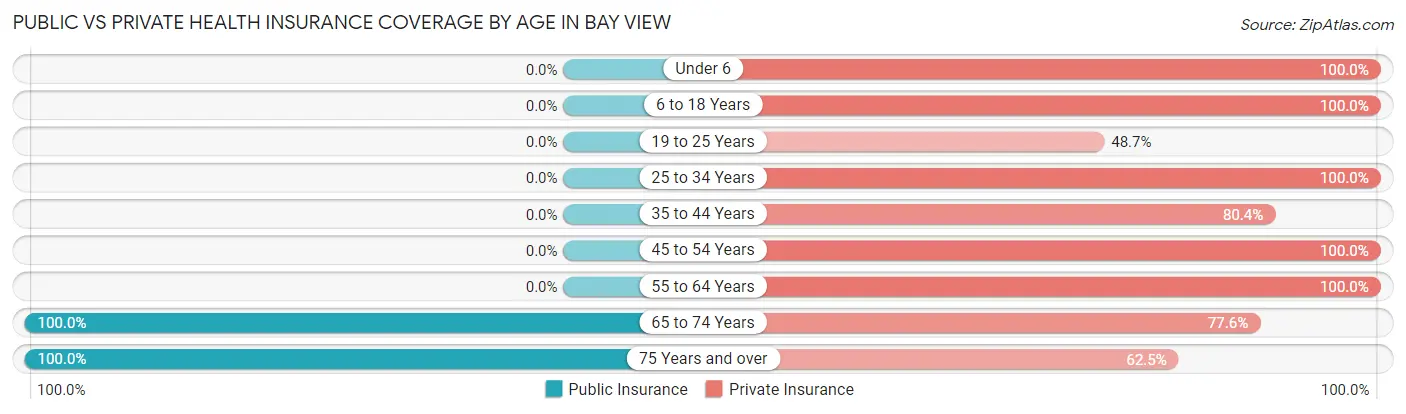
| Age Bracket | Public Insurance | Private Insurance |
| Under 6 | 0 (0.0%) | 21 (100.0%) |
| 6 to 18 Years | 0 (0.0%) | 56 (100.0%) |
| 19 to 25 Years | 0 (0.0%) | 19 (48.7%) |
| 25 to 34 Years | 0 (0.0%) | 51 (100.0%) |
| 35 to 44 Years | 0 (0.0%) | 78 (80.4%) |
| 45 to 54 Years | 0 (0.0%) | 23 (100.0%) |
| 55 to 64 Years | 0 (0.0%) | 101 (100.0%) |
| 65 to 74 Years | 143 (100.0%) | 111 (77.6%) |
| 75 Years and over | 104 (100.0%) | 65 (62.5%) |
| Total | 247 (38.9%) | 525 (82.7%) |
Disability Status by Sex by Age in Bay View
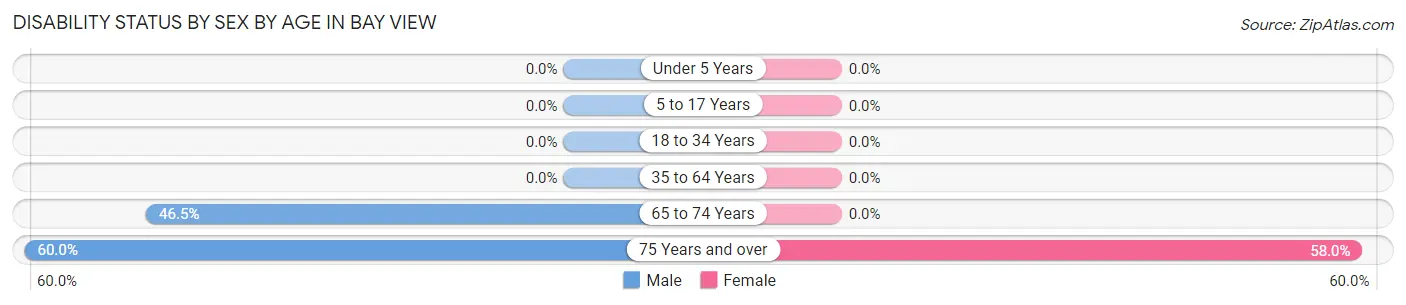
| Age Bracket | Male | Female |
| Under 5 Years | 0 (0.0%) | 0 (0.0%) |
| 5 to 17 Years | 0 (0.0%) | 0 (0.0%) |
| 18 to 34 Years | 0 (0.0%) | 0 (0.0%) |
| 35 to 64 Years | 0 (0.0%) | 0 (0.0%) |
| 65 to 74 Years | 46 (46.5%) | 0 (0.0%) |
| 75 Years and over | 21 (60.0%) | 40 (58.0%) |
Disability Class by Sex by Age in Bay View
Disability Class: Hearing Difficulty
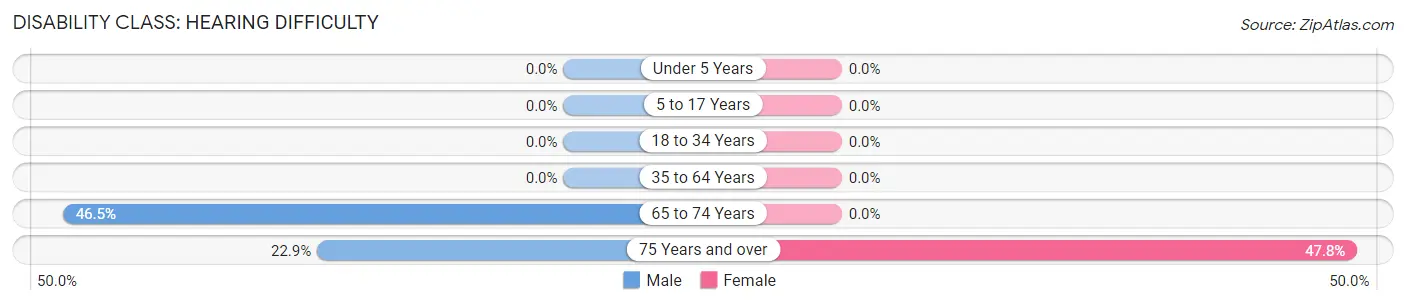
| Age Bracket | Male | Female |
| Under 5 Years | 0 (0.0%) | 0 (0.0%) |
| 5 to 17 Years | 0 (0.0%) | 0 (0.0%) |
| 18 to 34 Years | 0 (0.0%) | 0 (0.0%) |
| 35 to 64 Years | 0 (0.0%) | 0 (0.0%) |
| 65 to 74 Years | 46 (46.5%) | 0 (0.0%) |
| 75 Years and over | 8 (22.9%) | 33 (47.8%) |
Disability Class: Vision Difficulty
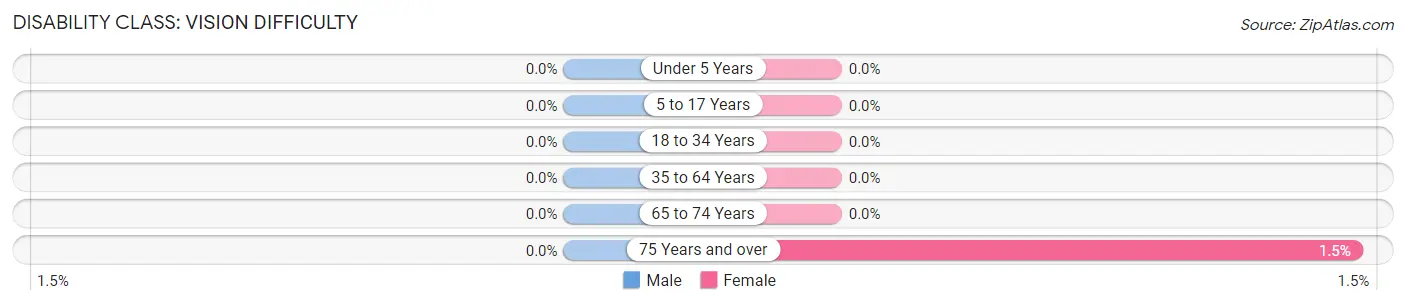
| Age Bracket | Male | Female |
| Under 5 Years | 0 (0.0%) | 0 (0.0%) |
| 5 to 17 Years | 0 (0.0%) | 0 (0.0%) |
| 18 to 34 Years | 0 (0.0%) | 0 (0.0%) |
| 35 to 64 Years | 0 (0.0%) | 0 (0.0%) |
| 65 to 74 Years | 0 (0.0%) | 0 (0.0%) |
| 75 Years and over | 0 (0.0%) | 1 (1.5%) |
Disability Class: Cognitive Difficulty
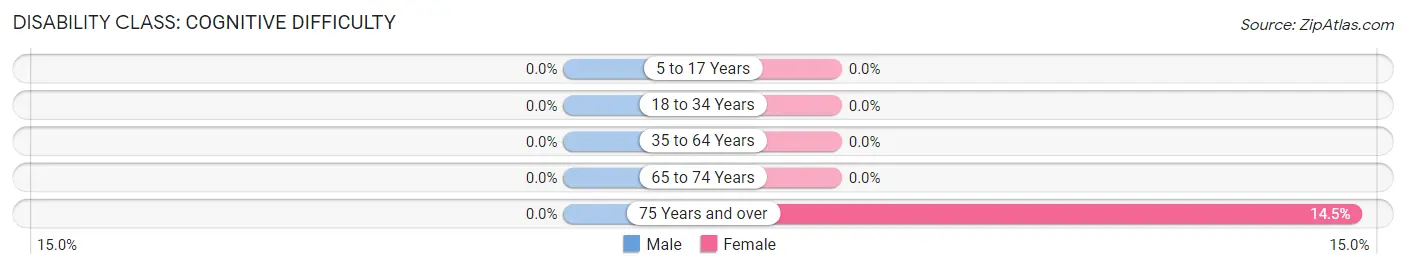
| Age Bracket | Male | Female |
| 5 to 17 Years | 0 (0.0%) | 0 (0.0%) |
| 18 to 34 Years | 0 (0.0%) | 0 (0.0%) |
| 35 to 64 Years | 0 (0.0%) | 0 (0.0%) |
| 65 to 74 Years | 0 (0.0%) | 0 (0.0%) |
| 75 Years and over | 0 (0.0%) | 10 (14.5%) |
Disability Class: Ambulatory Difficulty
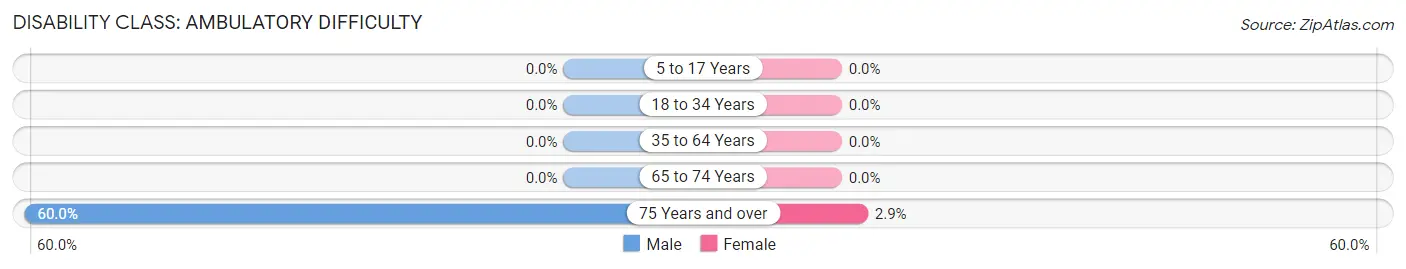
| Age Bracket | Male | Female |
| 5 to 17 Years | 0 (0.0%) | 0 (0.0%) |
| 18 to 34 Years | 0 (0.0%) | 0 (0.0%) |
| 35 to 64 Years | 0 (0.0%) | 0 (0.0%) |
| 65 to 74 Years | 0 (0.0%) | 0 (0.0%) |
| 75 Years and over | 21 (60.0%) | 2 (2.9%) |
Disability Class: Self-Care Difficulty
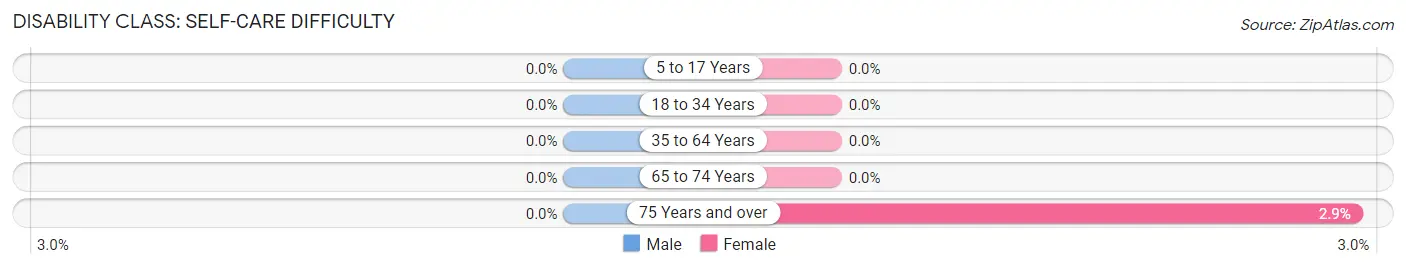
| Age Bracket | Male | Female |
| 5 to 17 Years | 0 (0.0%) | 0 (0.0%) |
| 18 to 34 Years | 0 (0.0%) | 0 (0.0%) |
| 35 to 64 Years | 0 (0.0%) | 0 (0.0%) |
| 65 to 74 Years | 0 (0.0%) | 0 (0.0%) |
| 75 Years and over | 0 (0.0%) | 2 (2.9%) |
Technology Access in Bay View
Computing Device Access in Bay View
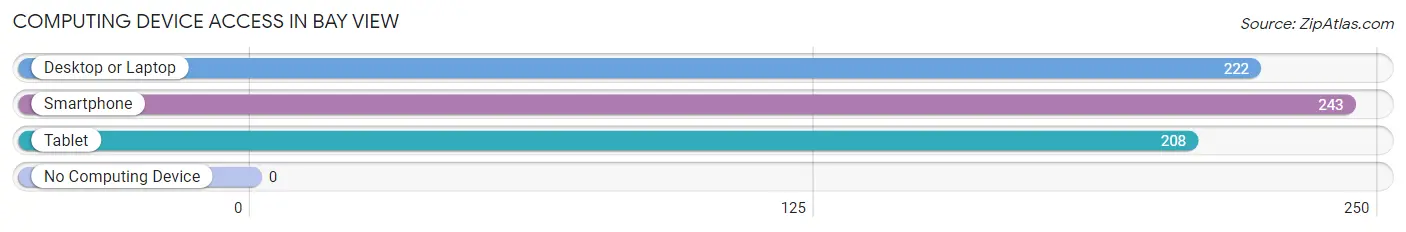
| Device Type | # Households | % Households |
| Desktop or Laptop | 222 | 85.7% |
| Smartphone | 243 | 93.8% |
| Tablet | 208 | 80.3% |
| No Computing Device | 0 | 0.0% |
| Total | 259 | 100.0% |
Internet Access in Bay View
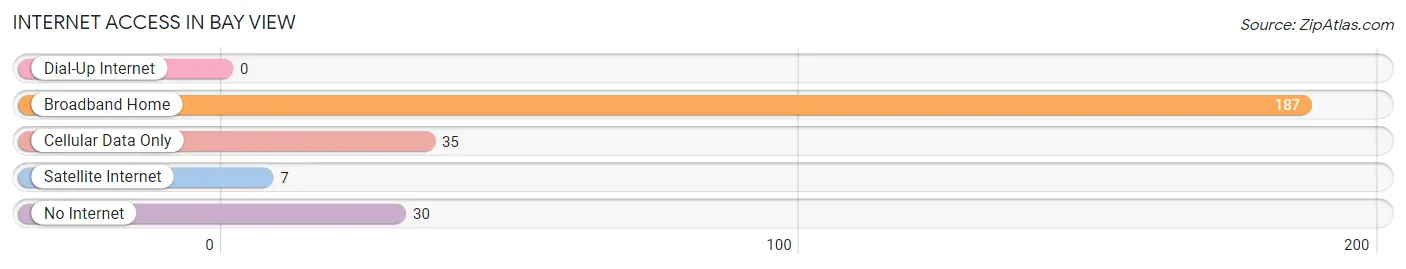
| Internet Type | # Households | % Households |
| Dial-Up Internet | 0 | 0.0% |
| Broadband Home | 187 | 72.2% |
| Cellular Data Only | 35 | 13.5% |
| Satellite Internet | 7 | 2.7% |
| No Internet | 30 | 11.6% |
| Total | 259 | 100.0% |
Bay View Summary
Bay View is a small unincorporated community located in Island County, Washington, United States. It is situated on the western shore of Whidbey Island, approximately 25 miles north of Seattle. The community is home to a population of approximately 1,000 people, and is a popular tourist destination due to its proximity to the Puget Sound and its picturesque views of the Olympic Mountains.
History
The area now known as Bay View was first settled by the Snohomish people, who lived in the area for thousands of years before the arrival of European settlers. The first European settlers arrived in the area in the late 19th century, and the community was officially established in 1891. The community was named after the bay that it overlooks, which was named by Captain George Vancouver in 1792.
In the early 20th century, Bay View was a popular destination for tourists, who came to enjoy the area’s natural beauty and its proximity to the Puget Sound. The community was also home to a number of resorts, which attracted visitors from all over the country.
In the 1950s, Bay View began to experience a decline in tourism, as more people began to visit other parts of the Puget Sound. This decline was further exacerbated by the construction of the Deception Pass Bridge in 1935, which made it easier for people to travel to other parts of the island.
Geography
Bay View is located on the western shore of Whidbey Island, approximately 25 miles north of Seattle. The community is situated on a small peninsula, which is surrounded by the waters of the Puget Sound. The area is characterized by its rugged coastline, which is dotted with rocky outcroppings and small islands. The area is also home to a number of small coves and bays, which provide shelter for boats and other watercraft.
The climate in Bay View is mild and temperate, with warm summers and cool winters. The average annual temperature is around 50 degrees Fahrenheit, and the average annual precipitation is around 40 inches.
Economy
The economy of Bay View is largely based on tourism, as the area is a popular destination for visitors from all over the country. The community is home to a number of resorts, which attract visitors from all over the world. The area is also home to a number of small businesses, including restaurants, shops, and galleries.
In addition to tourism, Bay View is also home to a number of small-scale agricultural operations, which produce a variety of fruits and vegetables. The area is also home to a number of oyster farms, which produce oysters for sale in local markets.
Demographics
As of the 2010 census, the population of Bay View was 1,000 people. The racial makeup of the community was 94.2% White, 0.7% African American, 0.7% Native American, 0.7% Asian, 0.7% Pacific Islander, and 2.7% from other races. The median household income was $50,000, and the median age was 44 years.
Conclusion
Bay View is a small unincorporated community located in Island County, Washington, United States. It is situated on the western shore of Whidbey Island, approximately 25 miles north of Seattle. The community is home to a population of approximately 1,000 people, and is a popular tourist destination due to its proximity to the Puget Sound and its picturesque views of the Olympic Mountains. The economy of Bay View is largely based on tourism, as the area is a popular destination for visitors from all over the country. The area is also home to a number of small businesses, including restaurants, shops, and galleries. As of the 2010 census, the population of Bay View was 1,000 people. The racial makeup of the community was 94.2% White, 0.7% African American, 0.7% Native American, 0.7% Asian, 0.7% Pacific Islander, and 2.7% from other races. The median household income was $50,000, and the median age was 44 years.
Common Questions
What is Per Capita Income in Bay View?
Per Capita income in Bay View is $52,205.
What is the Median Family Income in Bay View?
Median Family Income in Bay View is $121,964.
What is the Median Household income in Bay View?
Median Household Income in Bay View is $96,450.
What is Income or Wage Gap in Bay View?
Income or Wage Gap in Bay View is 49.2%.
Women in Bay View earn 50.8 cents for every dollar earned by a man.
What is Inequality or Gini Index in Bay View?
Inequality or Gini Index in Bay View is 0.38.
What is the Total Population of Bay View?
Total Population of Bay View is 635.
What is the Total Male Population of Bay View?
Total Male Population of Bay View is 310.
What is the Total Female Population of Bay View?
Total Female Population of Bay View is 325.
What is the Ratio of Males per 100 Females in Bay View?
There are 95.38 Males per 100 Females in Bay View.
What is the Ratio of Females per 100 Males in Bay View?
There are 104.84 Females per 100 Males in Bay View.
What is the Median Population Age in Bay View?
Median Population Age in Bay View is 58.9 Years.
What is the Average Family Size in Bay View
Average Family Size in Bay View is 2.6 People.
What is the Average Household Size in Bay View
Average Household Size in Bay View is 2.4 People.
How Large is the Labor Force in Bay View?
There are 320 People in the Labor Forcein in Bay View.
What is the Percentage of People in the Labor Force in Bay View?
57.3% of People are in the Labor Force in Bay View.