Stansberry Lake, WA Map & Demographics
Stansberry Lake Map
Stansberry Lake Overview
$48,457
PER CAPITA INCOME
$141,302
AVG FAMILY INCOME
$121,029
AVG HOUSEHOLD INCOME
13.3%
WAGE / INCOME GAP [ % ]
86.7¢/ $1
WAGE / INCOME GAP [ $ ]
0.39
INEQUALITY / GINI INDEX
1,810
TOTAL POPULATION
952
MALE POPULATION
858
FEMALE POPULATION
110.96
MALES / 100 FEMALES
90.13
FEMALES / 100 MALES
38.3
MEDIAN AGE
3.1
AVG FAMILY SIZE
2.6
AVG HOUSEHOLD SIZE
896
LABOR FORCE [ PEOPLE ]
61.5%
PERCENT IN LABOR FORCE
6.3%
UNEMPLOYMENT RATE
Income in Stansberry Lake
Income Overview in Stansberry Lake
Per Capita Income in Stansberry Lake is $48,457, while median incomes of families and households are $141,302 and $121,029 respectively.
| Characteristic | Number | Measure |
| Per Capita Income | 1,810 | $48,457 |
| Median Family Income | 511 | $141,302 |
| Mean Family Income | 511 | $155,164 |
| Median Household Income | 686 | $121,029 |
| Mean Household Income | 686 | $130,379 |
| Income Deficit | 511 | $0 |
| Wage / Income Gap (%) | 1,810 | 13.33% |
| Wage / Income Gap ($) | 1,810 | 86.67¢ per $1 |
| Gini / Inequality Index | 1,810 | 0.39 |
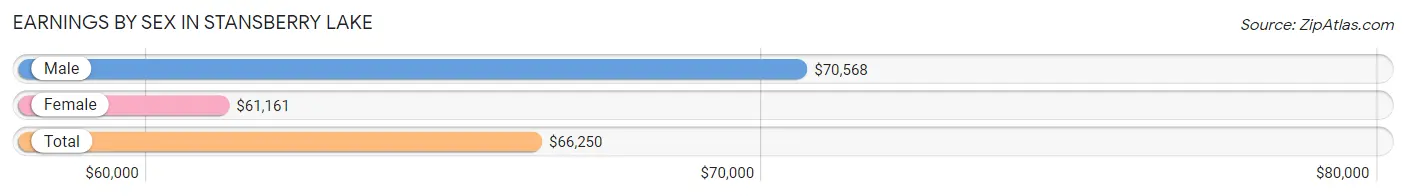
Earnings by Sex in Stansberry Lake
Average Earnings in Stansberry Lake are $66,250, $70,568 for men and $61,161 for women, a difference of 13.3%.
| Sex | Number | Average Earnings |
| Male | 509 (53.1%) | $70,568 |
| Female | 449 (46.9%) | $61,161 |
| Total | 958 (100.0%) | $66,250 |
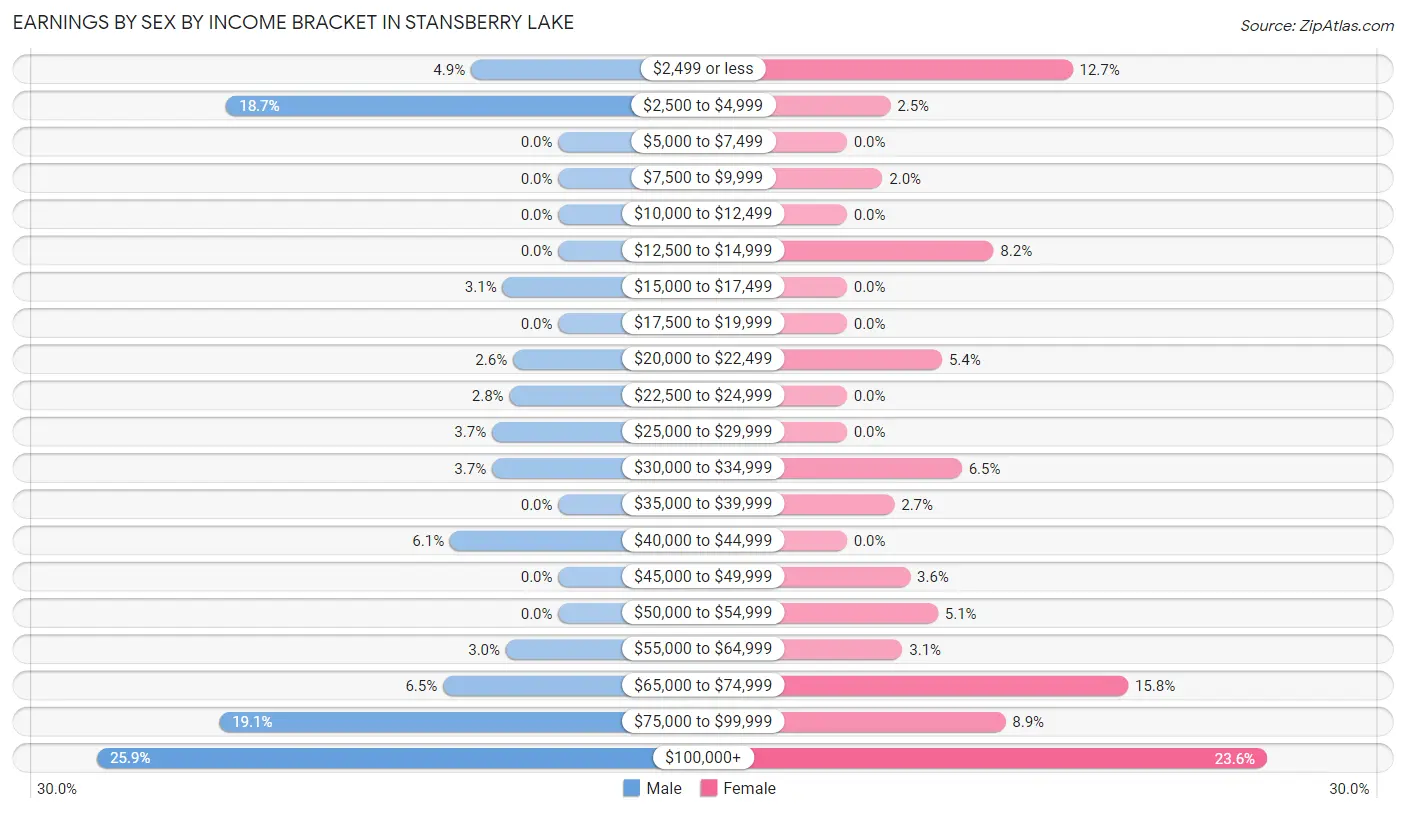
Earnings by Sex by Income Bracket in Stansberry Lake
The most common earnings brackets in Stansberry Lake are $100,000+ for men (132 | 25.9%) and $100,000+ for women (106 | 23.6%).
| Income | Male | Female |
| $2,499 or less | 25 (4.9%) | 57 (12.7%) |
| $2,500 to $4,999 | 95 (18.7%) | 11 (2.5%) |
| $5,000 to $7,499 | 0 (0.0%) | 0 (0.0%) |
| $7,500 to $9,999 | 0 (0.0%) | 9 (2.0%) |
| $10,000 to $12,499 | 0 (0.0%) | 0 (0.0%) |
| $12,500 to $14,999 | 0 (0.0%) | 37 (8.2%) |
| $15,000 to $17,499 | 16 (3.1%) | 0 (0.0%) |
| $17,500 to $19,999 | 0 (0.0%) | 0 (0.0%) |
| $20,000 to $22,499 | 13 (2.5%) | 24 (5.3%) |
| $22,500 to $24,999 | 14 (2.8%) | 0 (0.0%) |
| $25,000 to $29,999 | 19 (3.7%) | 0 (0.0%) |
| $30,000 to $34,999 | 19 (3.7%) | 29 (6.5%) |
| $35,000 to $39,999 | 0 (0.0%) | 12 (2.7%) |
| $40,000 to $44,999 | 31 (6.1%) | 0 (0.0%) |
| $45,000 to $49,999 | 0 (0.0%) | 16 (3.6%) |
| $50,000 to $54,999 | 0 (0.0%) | 23 (5.1%) |
| $55,000 to $64,999 | 15 (2.9%) | 14 (3.1%) |
| $65,000 to $74,999 | 33 (6.5%) | 71 (15.8%) |
| $75,000 to $99,999 | 97 (19.1%) | 40 (8.9%) |
| $100,000+ | 132 (25.9%) | 106 (23.6%) |
| Total | 509 (100.0%) | 449 (100.0%) |
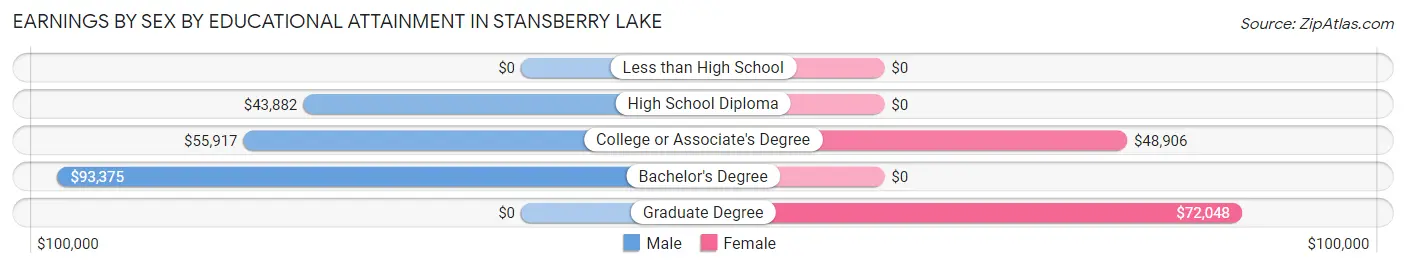
Earnings by Sex by Educational Attainment in Stansberry Lake
Average earnings in Stansberry Lake are $72,197 for men and $70,370 for women, a difference of 2.5%. Men with an educational attainment of bachelor's degree enjoy the highest average annual earnings of $93,375, while those with high school diploma education earn the least with $43,882. Women with an educational attainment of graduate degree earn the most with the average annual earnings of $72,048, while those with college or associate's degree education have the smallest earnings of $48,906.
| Educational Attainment | Male Income | Female Income |
| Less than High School | - | - |
| High School Diploma | $43,882 | $0 |
| College or Associate's Degree | $55,917 | $48,906 |
| Bachelor's Degree | $93,375 | $0 |
| Graduate Degree | - | - |
| Total | $72,197 | $70,370 |
Family Income in Stansberry Lake
Family Income Brackets in Stansberry Lake
According to the Stansberry Lake family income data, there are 144 families falling into the $200,000+ income range, which is the most common income bracket and makes up 28.2% of all families.
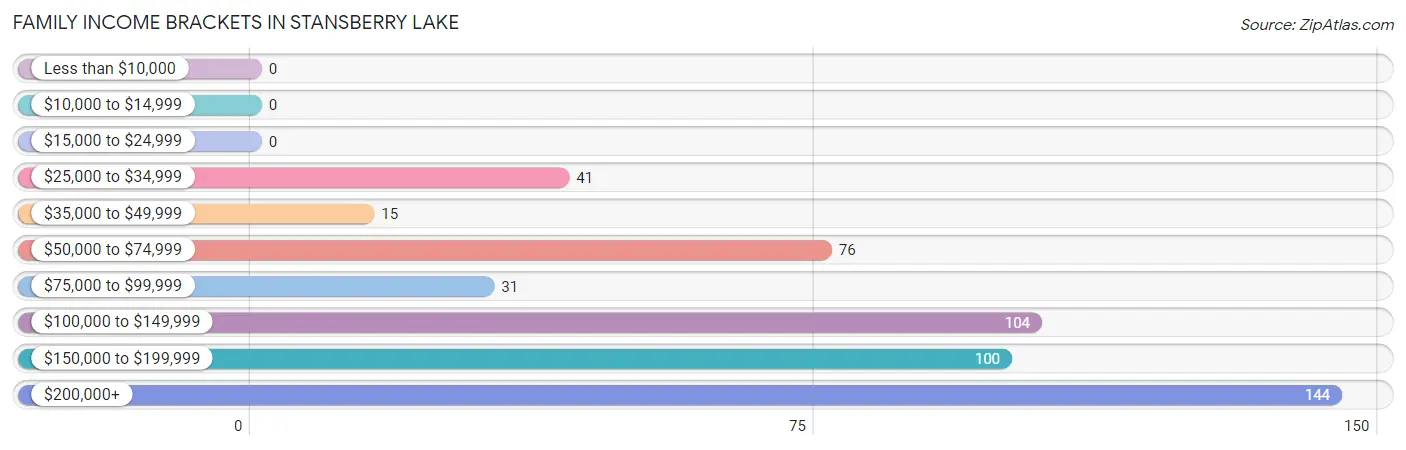
| Income Bracket | # Families | % Families |
| Less than $10,000 | 0 | 0.0% |
| $10,000 to $14,999 | 0 | 0.0% |
| $15,000 to $24,999 | 0 | 0.0% |
| $25,000 to $34,999 | 41 | 8.0% |
| $35,000 to $49,999 | 15 | 2.9% |
| $50,000 to $74,999 | 76 | 14.9% |
| $75,000 to $99,999 | 31 | 6.1% |
| $100,000 to $149,999 | 104 | 20.4% |
| $150,000 to $199,999 | 100 | 19.6% |
| $200,000+ | 144 | 28.2% |
Family Income by Famaliy Size in Stansberry Lake
3-person families (75 | 14.7%) account for the highest median family income in Stansberry Lake with $211,058 per family, while 3-person families (75 | 14.7%) have the highest median income of $70,353 per family member.
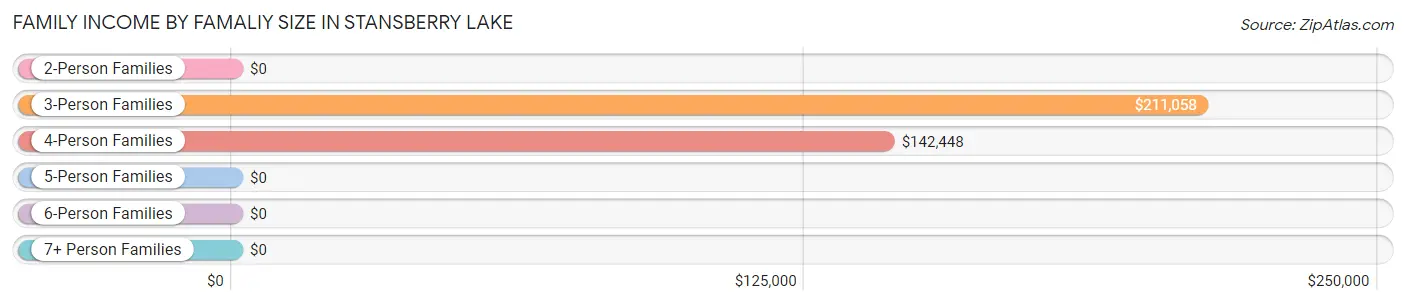
| Income Bracket | # Families | Median Income |
| 2-Person Families | 261 (51.1%) | $0 |
| 3-Person Families | 75 (14.7%) | $211,058 |
| 4-Person Families | 101 (19.8%) | $142,448 |
| 5-Person Families | 18 (3.5%) | $0 |
| 6-Person Families | 36 (7.0%) | $0 |
| 7+ Person Families | 20 (3.9%) | $0 |
| Total | 511 (100.0%) | $141,302 |
Family Income by Number of Earners in Stansberry Lake
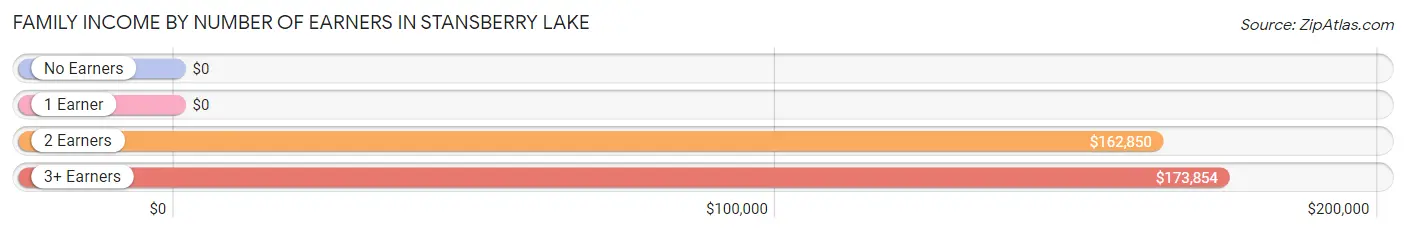
| Number of Earners | # Families | Median Income |
| No Earners | 94 (18.4%) | $0 |
| 1 Earner | 74 (14.5%) | $0 |
| 2 Earners | 296 (57.9%) | $162,850 |
| 3+ Earners | 47 (9.2%) | $173,854 |
| Total | 511 (100.0%) | $141,302 |
Household Income in Stansberry Lake
Household Income Brackets in Stansberry Lake
With 162 households falling in the category, the $200,000+ income range is the most frequent in Stansberry Lake, accounting for 23.6% of all households.
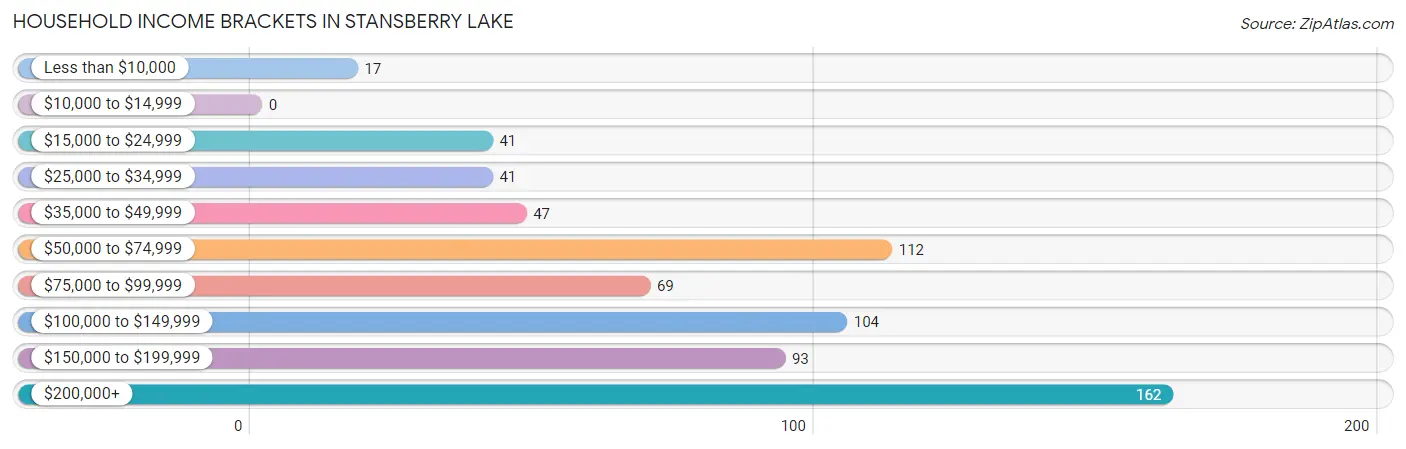
| Income Bracket | # Households | % Households |
| Less than $10,000 | 17 | 2.5% |
| $10,000 to $14,999 | 0 | 0.0% |
| $15,000 to $24,999 | 41 | 6.0% |
| $25,000 to $34,999 | 41 | 6.0% |
| $35,000 to $49,999 | 47 | 6.9% |
| $50,000 to $74,999 | 112 | 16.3% |
| $75,000 to $99,999 | 69 | 10.1% |
| $100,000 to $149,999 | 104 | 15.2% |
| $150,000 to $199,999 | 93 | 13.6% |
| $200,000+ | 162 | 23.6% |
Household Income by Householder Age in Stansberry Lake
The median household income in Stansberry Lake is $121,029, with the highest median household income of $163,250 found in the 25 to 44 years age bracket for the primary householder. A total of 318 households (46.4%) fall into this category.
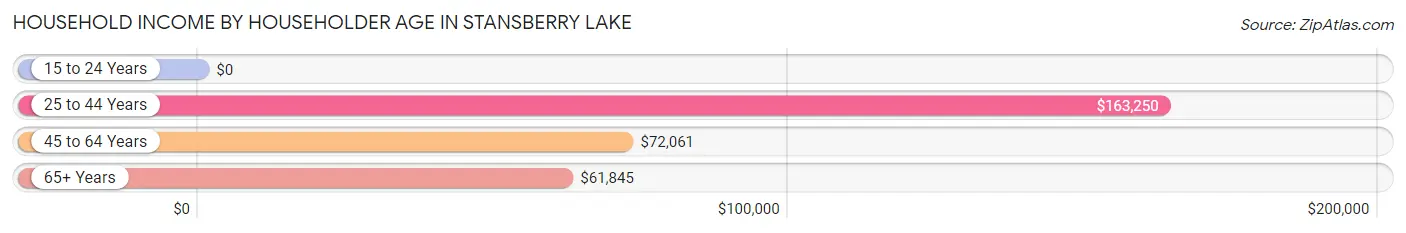
| Income Bracket | # Households | Median Income |
| 15 to 24 Years | 0 (0.0%) | $0 |
| 25 to 44 Years | 318 (46.4%) | $163,250 |
| 45 to 64 Years | 161 (23.5%) | $72,061 |
| 65+ Years | 207 (30.2%) | $61,845 |
| Total | 686 (100.0%) | $121,029 |
Poverty in Stansberry Lake
Income Below Poverty by Sex and Age in Stansberry Lake
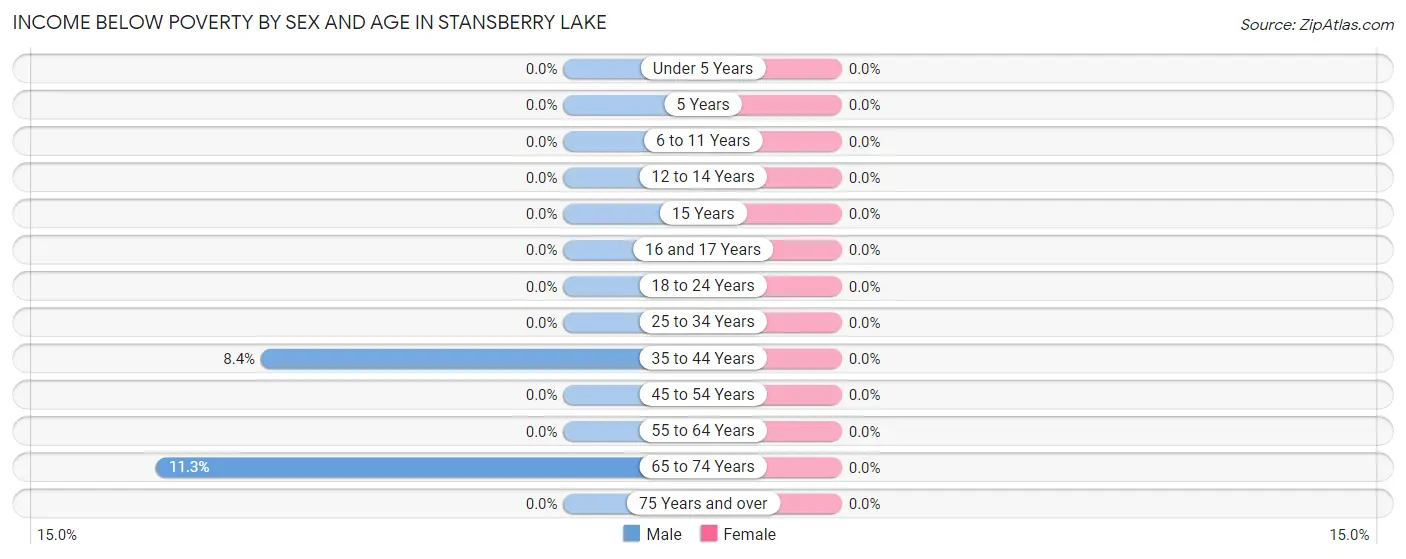
| Age Bracket | Male | Female |
| Under 5 Years | 0 (0.0%) | 0 (0.0%) |
| 5 Years | 0 (0.0%) | 0 (0.0%) |
| 6 to 11 Years | 0 (0.0%) | 0 (0.0%) |
| 12 to 14 Years | 0 (0.0%) | 0 (0.0%) |
| 15 Years | 0 (0.0%) | 0 (0.0%) |
| 16 and 17 Years | 0 (0.0%) | 0 (0.0%) |
| 18 to 24 Years | 0 (0.0%) | 0 (0.0%) |
| 25 to 34 Years | 0 (0.0%) | 0 (0.0%) |
| 35 to 44 Years | 17 (8.4%) | 0 (0.0%) |
| 45 to 54 Years | 0 (0.0%) | 0 (0.0%) |
| 55 to 64 Years | 0 (0.0%) | 0 (0.0%) |
| 65 to 74 Years | 22 (11.3%) | 0 (0.0%) |
| 75 Years and over | 0 (0.0%) | 0 (0.0%) |
| Total | 39 (4.1%) | 0 (0.0%) |
Income Above Poverty by Sex and Age in Stansberry Lake
According to the poverty statistics in Stansberry Lake, males aged under 5 years and females aged under 5 years are the age groups that are most secure financially, with 100.0% of males and 100.0% of females in these age groups living above the poverty line.
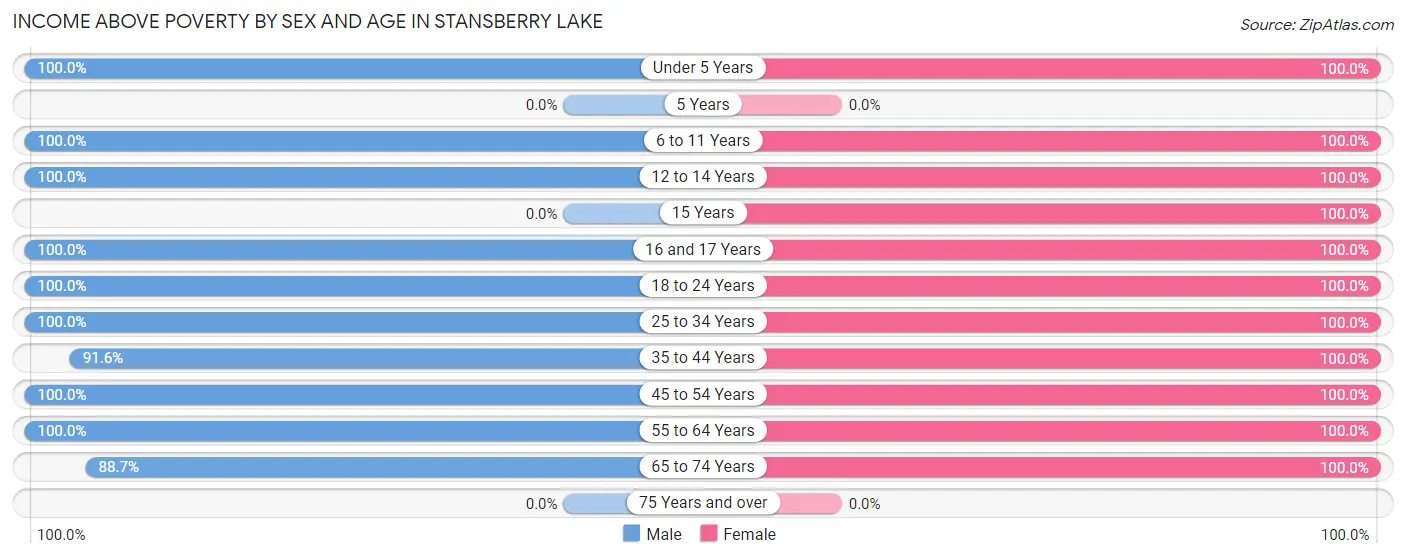
| Age Bracket | Male | Female |
| Under 5 Years | 16 (100.0%) | 54 (100.0%) |
| 5 Years | 0 (0.0%) | 0 (0.0%) |
| 6 to 11 Years | 146 (100.0%) | 43 (100.0%) |
| 12 to 14 Years | 29 (100.0%) | 43 (100.0%) |
| 15 Years | 0 (0.0%) | 22 (100.0%) |
| 16 and 17 Years | 37 (100.0%) | 29 (100.0%) |
| 18 to 24 Years | 43 (100.0%) | 49 (100.0%) |
| 25 to 34 Years | 196 (100.0%) | 130 (100.0%) |
| 35 to 44 Years | 185 (91.6%) | 137 (100.0%) |
| 45 to 54 Years | 32 (100.0%) | 42 (100.0%) |
| 55 to 64 Years | 57 (100.0%) | 166 (100.0%) |
| 65 to 74 Years | 172 (88.7%) | 143 (100.0%) |
| 75 Years and over | 0 (0.0%) | 0 (0.0%) |
| Total | 913 (95.9%) | 858 (100.0%) |
Income Below Poverty Among Married-Couple Families in Stansberry Lake
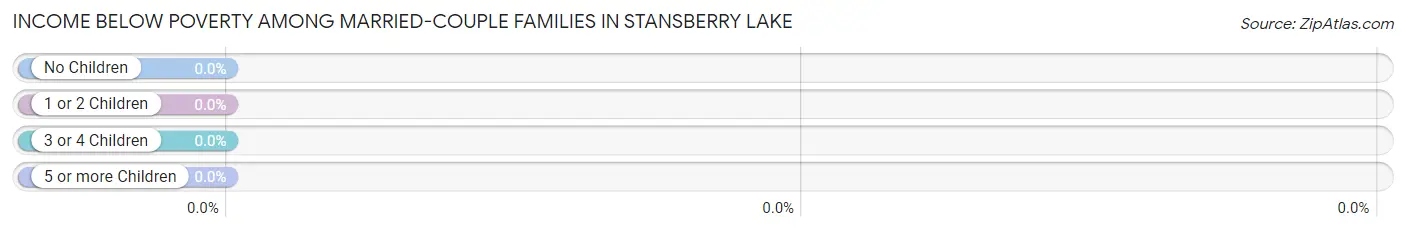
| Children | Above Poverty | Below Poverty |
| No Children | 309 (100.0%) | 0 (0.0%) |
| 1 or 2 Children | 128 (100.0%) | 0 (0.0%) |
| 3 or 4 Children | 36 (100.0%) | 0 (0.0%) |
| 5 or more Children | 20 (100.0%) | 0 (0.0%) |
| Total | 493 (100.0%) | 0 (0.0%) |
Income Below Poverty Among Single-Parent Households in Stansberry Lake
| Children | Single Father | Single Mother |
| No Children | 0 (0.0%) | 0 (0.0%) |
| 1 or 2 Children | 0 (0.0%) | 0 (0.0%) |
| 3 or 4 Children | 0 (0.0%) | 0 (0.0%) |
| 5 or more Children | 0 (0.0%) | 0 (0.0%) |
| Total | 0 (0.0%) | 0 (0.0%) |
Income Below Poverty Among Married-Couple vs Single-Parent Households in Stansberry Lake
| Children | Married-Couple Families | Single-Parent Households |
| No Children | 0 (0.0%) | 0 (0.0%) |
| 1 or 2 Children | 0 (0.0%) | 0 (0.0%) |
| 3 or 4 Children | 0 (0.0%) | 0 (0.0%) |
| 5 or more Children | 0 (0.0%) | 0 (0.0%) |
| Total | 0 (0.0%) | 0 (0.0%) |
Race in Stansberry Lake
The most populous races in Stansberry Lake are White / Caucasian (1,618 | 89.4%), Two or more Races (100 | 5.5%), and Asian (76 | 4.2%).
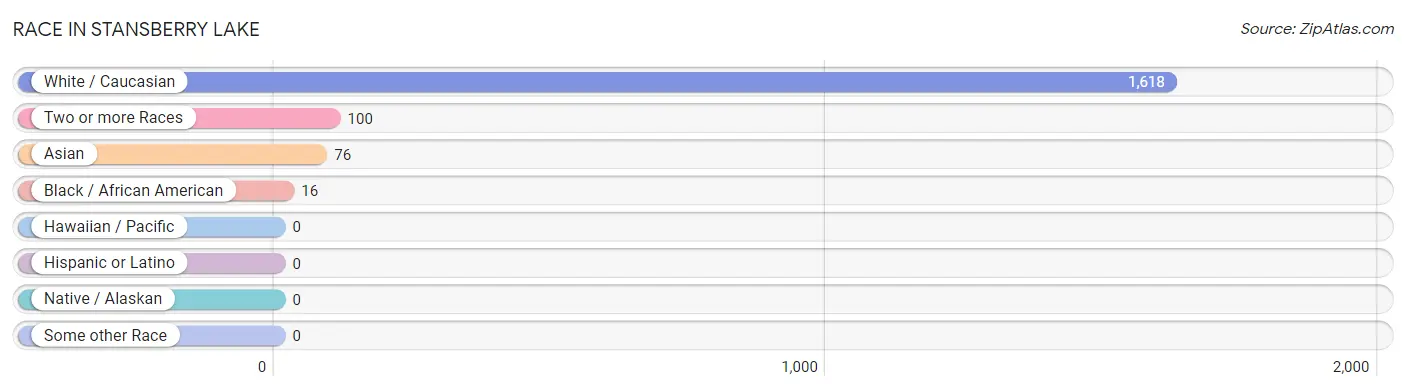
| Race | # Population | % Population |
| Asian | 76 | 4.2% |
| Black / African American | 16 | 0.9% |
| Hawaiian / Pacific | 0 | 0.0% |
| Hispanic or Latino | 0 | 0.0% |
| Native / Alaskan | 0 | 0.0% |
| White / Caucasian | 1,618 | 89.4% |
| Two or more Races | 100 | 5.5% |
| Some other Race | 0 | 0.0% |
| Total | 1,810 | 100.0% |
Ancestry in Stansberry Lake
The most populous ancestries reported in Stansberry Lake are German (503 | 27.8%), Irish (342 | 18.9%), English (264 | 14.6%), Polish (133 | 7.3%), and Scottish (126 | 7.0%), together accounting for 75.6% of all Stansberry Lake residents.
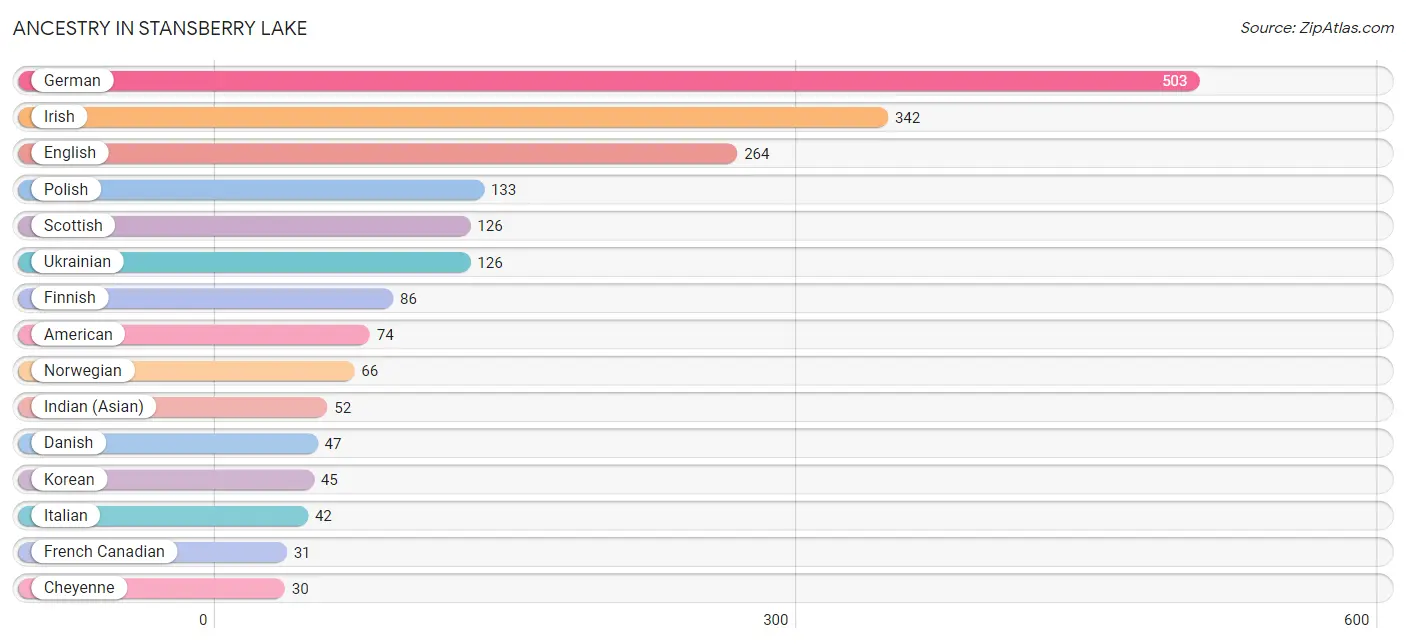
| Ancestry | # Population | % Population |
| American | 74 | 4.1% |
| Bhutanese | 24 | 1.3% |
| Cheyenne | 30 | 1.7% |
| Croatian | 19 | 1.1% |
| Danish | 47 | 2.6% |
| English | 264 | 14.6% |
| European | 23 | 1.3% |
| Finnish | 86 | 4.8% |
| French Canadian | 31 | 1.7% |
| German | 503 | 27.8% |
| Hungarian | 29 | 1.6% |
| Indian (Asian) | 52 | 2.9% |
| Irish | 342 | 18.9% |
| Italian | 42 | 2.3% |
| Korean | 45 | 2.5% |
| Norwegian | 66 | 3.6% |
| Polish | 133 | 7.3% |
| Scottish | 126 | 7.0% |
| Ukrainian | 126 | 7.0% |
| Yugoslavian | 12 | 0.7% | View All 20 Rows |
Immigrants in Stansberry Lake
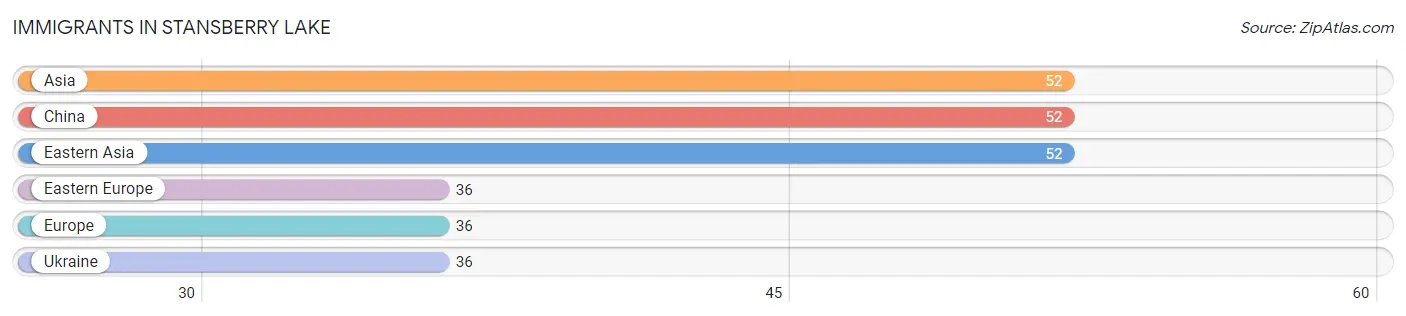
The most numerous immigrant groups reported in Stansberry Lake came from Asia (52 | 2.9%), China (52 | 2.9%), Eastern Asia (52 | 2.9%), Eastern Europe (36 | 2.0%), and Europe (36 | 2.0%), together accounting for 12.6% of all Stansberry Lake residents.
| Immigration Origin | # Population | % Population |
| Asia | 52 | 2.9% |
| China | 52 | 2.9% |
| Eastern Asia | 52 | 2.9% |
| Eastern Europe | 36 | 2.0% |
| Europe | 36 | 2.0% |
| Ukraine | 36 | 2.0% | View All 6 Rows |
Sex and Age in Stansberry Lake
Sex and Age in Stansberry Lake
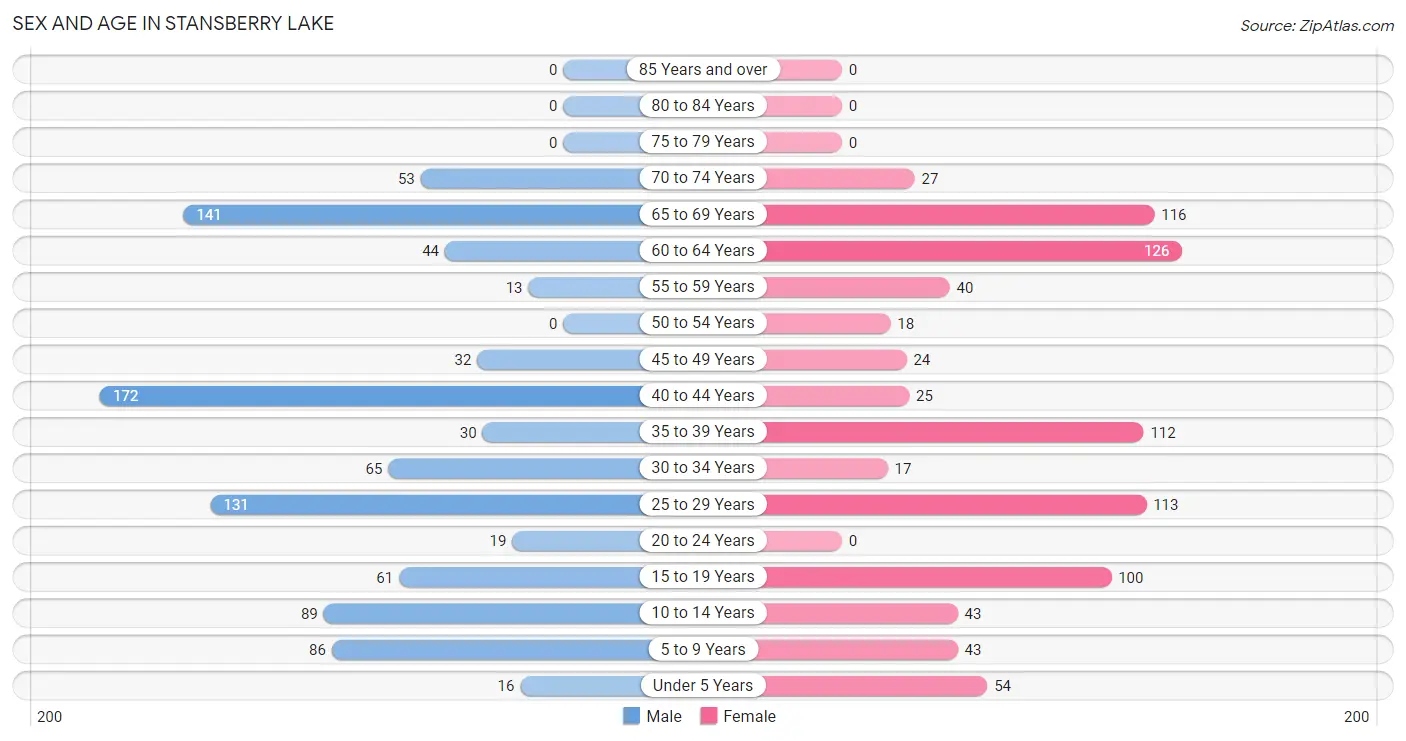
The most populous age groups in Stansberry Lake are 40 to 44 Years (172 | 18.1%) for men and 60 to 64 Years (126 | 14.7%) for women.
| Age Bracket | Male | Female |
| Under 5 Years | 16 (1.7%) | 54 (6.3%) |
| 5 to 9 Years | 86 (9.0%) | 43 (5.0%) |
| 10 to 14 Years | 89 (9.3%) | 43 (5.0%) |
| 15 to 19 Years | 61 (6.4%) | 100 (11.7%) |
| 20 to 24 Years | 19 (2.0%) | 0 (0.0%) |
| 25 to 29 Years | 131 (13.8%) | 113 (13.2%) |
| 30 to 34 Years | 65 (6.8%) | 17 (2.0%) |
| 35 to 39 Years | 30 (3.2%) | 112 (13.1%) |
| 40 to 44 Years | 172 (18.1%) | 25 (2.9%) |
| 45 to 49 Years | 32 (3.4%) | 24 (2.8%) |
| 50 to 54 Years | 0 (0.0%) | 18 (2.1%) |
| 55 to 59 Years | 13 (1.4%) | 40 (4.7%) |
| 60 to 64 Years | 44 (4.6%) | 126 (14.7%) |
| 65 to 69 Years | 141 (14.8%) | 116 (13.5%) |
| 70 to 74 Years | 53 (5.6%) | 27 (3.2%) |
| 75 to 79 Years | 0 (0.0%) | 0 (0.0%) |
| 80 to 84 Years | 0 (0.0%) | 0 (0.0%) |
| 85 Years and over | 0 (0.0%) | 0 (0.0%) |
| Total | 952 (100.0%) | 858 (100.0%) |
Families and Households in Stansberry Lake
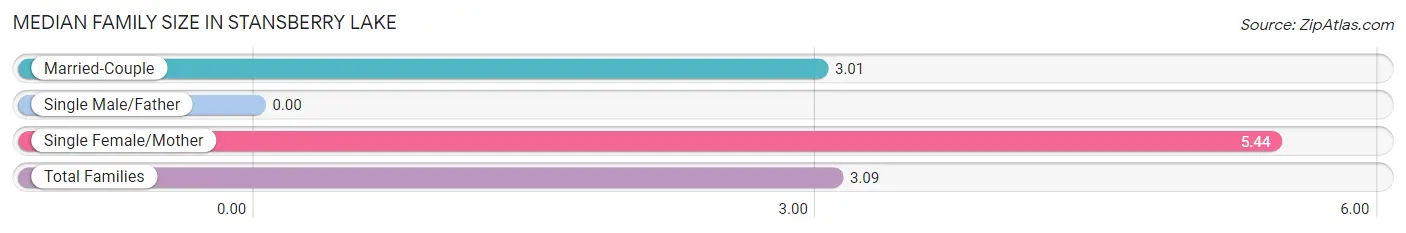
Median Family Size in Stansberry Lake
| Family Type | # Families | Family Size |
| Married-Couple | 493 (96.5%) | 3.01 |
| Single Male/Father | 0 (0.0%) | - |
| Single Female/Mother | 18 (3.5%) | 5.44 |
| Total Families | 511 (100.0%) | 3.09 |
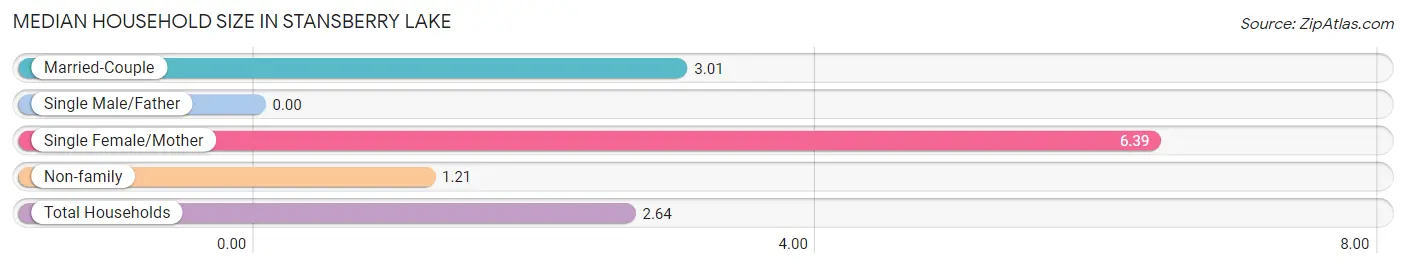
Median Household Size in Stansberry Lake
| Household Type | # Households | Household Size |
| Married-Couple | 493 (71.9%) | 3.01 |
| Single Male/Father | 0 (0.0%) | - |
| Single Female/Mother | 18 (2.6%) | 6.39 |
| Non-family | 175 (25.5%) | 1.21 |
| Total Households | 686 (100.0%) | 2.64 |
Household Size by Marriage Status in Stansberry Lake
Out of a total of 686 households in Stansberry Lake, 511 (74.5%) are family households, while 175 (25.5%) are nonfamily households. The most numerous type of family households are 2-person households, comprising 261, and the most common type of nonfamily households are 1-person households, comprising 142.
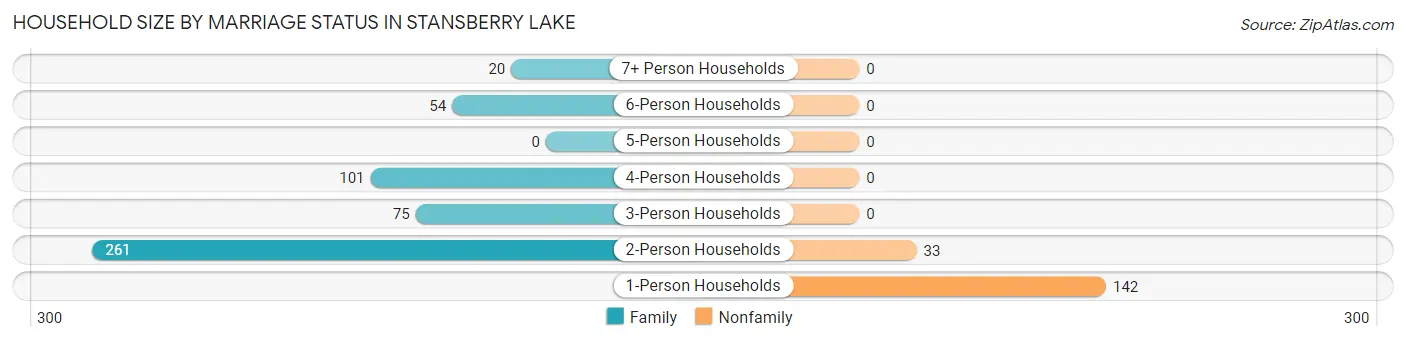
| Household Size | Family Households | Nonfamily Households |
| 1-Person Households | - | 142 (20.7%) |
| 2-Person Households | 261 (38.1%) | 33 (4.8%) |
| 3-Person Households | 75 (10.9%) | 0 (0.0%) |
| 4-Person Households | 101 (14.7%) | 0 (0.0%) |
| 5-Person Households | 0 (0.0%) | 0 (0.0%) |
| 6-Person Households | 54 (7.9%) | 0 (0.0%) |
| 7+ Person Households | 20 (2.9%) | 0 (0.0%) |
| Total | 511 (74.5%) | 175 (25.5%) |
Female Fertility in Stansberry Lake
Fertility by Age in Stansberry Lake
| Age Bracket | Women with Births | Births / 1,000 Women |
| 15 to 19 years | 0 (0.0%) | 0.0 |
| 20 to 34 years | 0 (0.0%) | 0.0 |
| 35 to 50 years | 0 (0.0%) | 0.0 |
| Total | 0 (0.0%) | 0.0 |
Fertility by Age by Marriage Status in Stansberry Lake
| Age Bracket | Married | Unmarried |
| 15 to 19 years | 0 (0.0%) | 0 (0.0%) |
| 20 to 34 years | 0 (0.0%) | 0 (0.0%) |
| 35 to 50 years | 0 (0.0%) | 0 (0.0%) |
| Total | 0 (0.0%) | 0 (0.0%) |
Fertility by Education in Stansberry Lake
| Educational Attainment | Women with Births | Births / 1,000 Women |
| Less than High School | 0 (0.0%) | 0.0 |
| High School Diploma | 0 (0.0%) | 0.0 |
| College or Associate's Degree | 0 (0.0%) | 0.0 |
| Bachelor's Degree | 0 (0.0%) | 0.0 |
| Graduate Degree | 0 (0.0%) | 0.0 |
| Total | 0 (0.0%) | 0.0 |
Fertility by Education by Marriage Status in Stansberry Lake
| Educational Attainment | Married | Unmarried |
| Less than High School | 0 (0.0%) | 0 (0.0%) |
| High School Diploma | 0 (0.0%) | 0 (0.0%) |
| College or Associate's Degree | 0 (0.0%) | 0 (0.0%) |
| Bachelor's Degree | 0 (0.0%) | 0 (0.0%) |
| Graduate Degree | 0 (0.0%) | 0 (0.0%) |
| Total | 0 (0.0%) | 0 (0.0%) |
Employment Characteristics in Stansberry Lake
Employment by Class of Employer in Stansberry Lake
Among the 773 employed individuals in Stansberry Lake, private company employees (441 | 57.1%), federal government employees (193 | 25.0%), and state government employees (58 | 7.5%) make up the most common classes of employment.
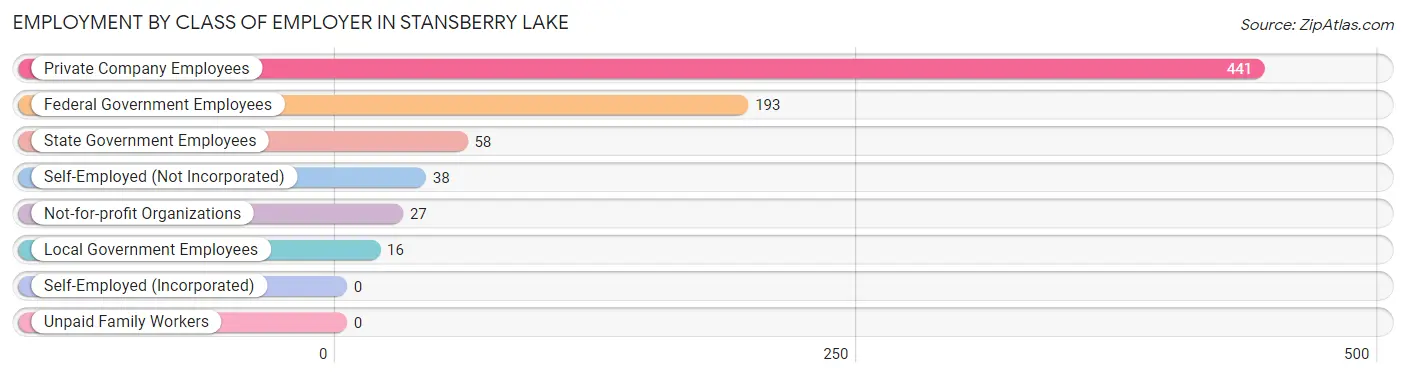
| Employer Class | # Employees | % Employees |
| Private Company Employees | 441 | 57.1% |
| Self-Employed (Incorporated) | 0 | 0.0% |
| Self-Employed (Not Incorporated) | 38 | 4.9% |
| Not-for-profit Organizations | 27 | 3.5% |
| Local Government Employees | 16 | 2.1% |
| State Government Employees | 58 | 7.5% |
| Federal Government Employees | 193 | 25.0% |
| Unpaid Family Workers | 0 | 0.0% |
| Total | 773 | 100.0% |
Employment Status by Age in Stansberry Lake
According to the labor force statistics for Stansberry Lake, out of the total population over 16 years of age (1,457), 61.5% or 896 individuals are in the labor force, with 6.3% or 56 of them unemployed. The age group with the highest labor force participation rate is 20 to 24 years, with 100.0% or 19 individuals in the labor force. Within the labor force, the 55 to 59 years age range has the highest percentage of unemployed individuals, with 24.5% or 13 of them being unemployed.
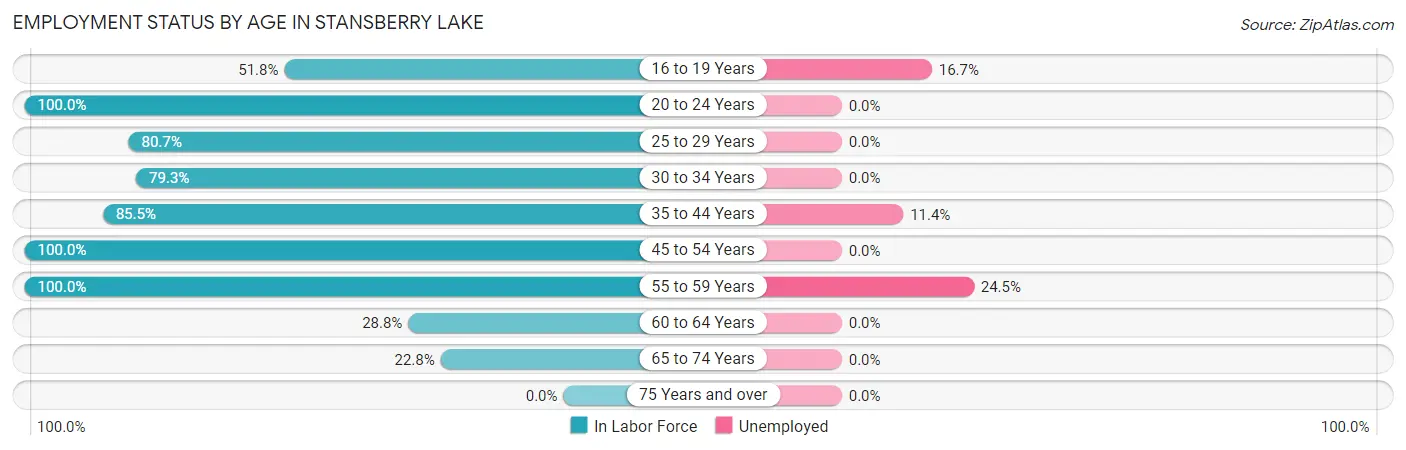
| Age Bracket | In Labor Force | Unemployed |
| 16 to 19 Years | 72 (51.8%) | 12 (16.7%) |
| 20 to 24 Years | 19 (100.0%) | 0 (0.0%) |
| 25 to 29 Years | 197 (80.7%) | 0 (0.0%) |
| 30 to 34 Years | 65 (79.3%) | 0 (0.0%) |
| 35 to 44 Years | 290 (85.5%) | 33 (11.4%) |
| 45 to 54 Years | 74 (100.0%) | 0 (0.0%) |
| 55 to 59 Years | 53 (100.0%) | 13 (24.5%) |
| 60 to 64 Years | 49 (28.8%) | 0 (0.0%) |
| 65 to 74 Years | 77 (22.8%) | 0 (0.0%) |
| 75 Years and over | 0 (0.0%) | 0 (0.0%) |
| Total | 896 (61.5%) | 56 (6.3%) |
Employment Status by Educational Attainment in Stansberry Lake
According to labor force statistics for Stansberry Lake, 75.7% of individuals (728) out of the total population between 25 and 64 years of age (962) are in the labor force, with 6.1% or 44 of them being unemployed. The group with the highest labor force participation rate are those with the educational attainment of high school diploma, with 100.0% or 140 individuals in the labor force. Within the labor force, individuals with high school diploma education have the highest percentage of unemployment, with 20.7% or 29 of them being unemployed.
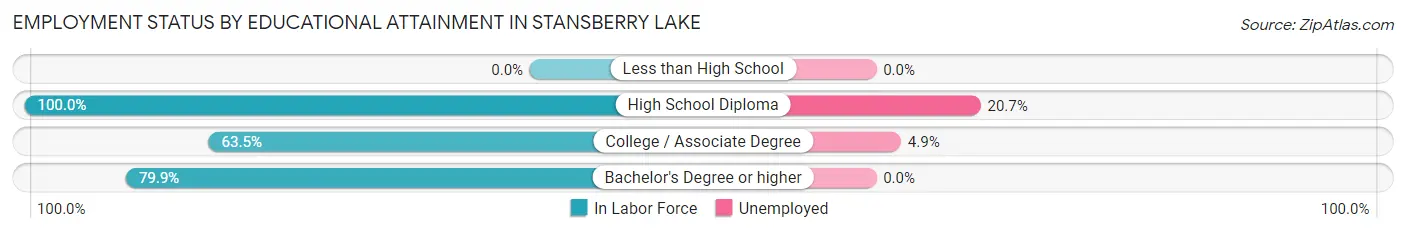
| Educational Attainment | In Labor Force | Unemployed |
| Less than High School | 0 (0.0%) | 0 (0.0%) |
| High School Diploma | 140 (100.0%) | 29 (20.7%) |
| College / Associate Degree | 266 (63.5%) | 21 (4.9%) |
| Bachelor's Degree or higher | 322 (79.9%) | 0 (0.0%) |
| Total | 728 (75.7%) | 59 (6.1%) |
Employment Occupations by Sex in Stansberry Lake
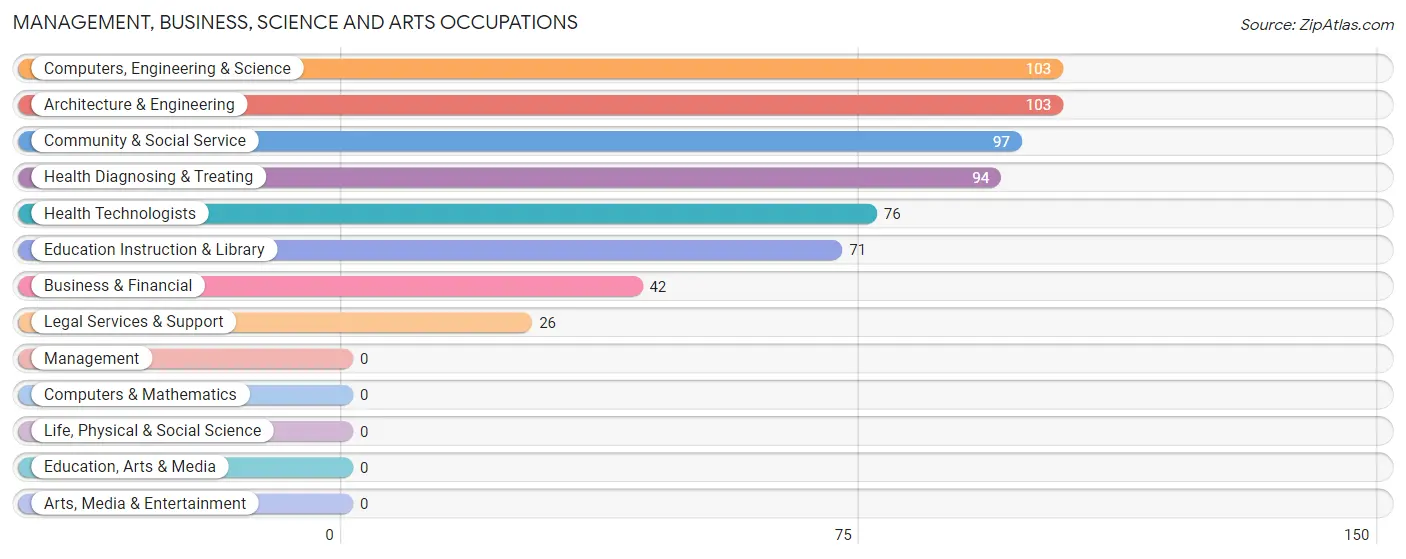
Management, Business, Science and Arts Occupations
The most common Management, Business, Science and Arts occupations in Stansberry Lake are Computers, Engineering & Science (103 | 12.8%), Architecture & Engineering (103 | 12.8%), Community & Social Service (97 | 12.0%), Health Diagnosing & Treating (94 | 11.7%), and Health Technologists (76 | 9.4%).
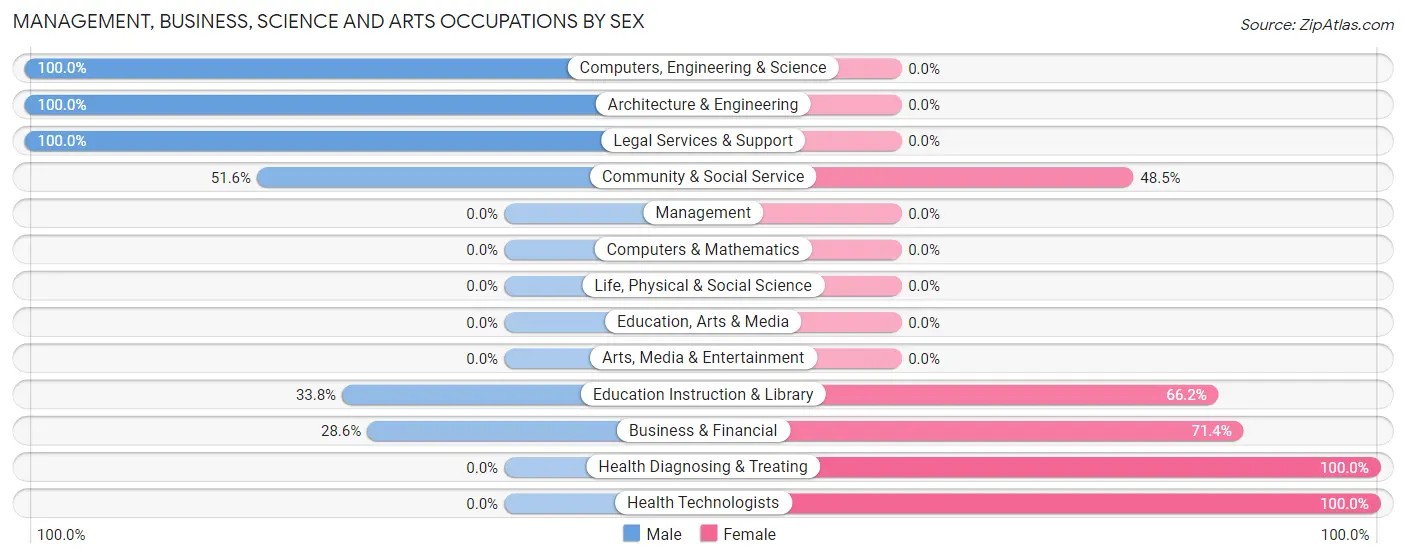
Management, Business, Science and Arts Occupations by Sex
Within the Management, Business, Science and Arts occupations in Stansberry Lake, the most male-oriented occupations are Computers, Engineering & Science (100.0%), Architecture & Engineering (100.0%), and Legal Services & Support (100.0%), while the most female-oriented occupations are Health Diagnosing & Treating (100.0%), Health Technologists (100.0%), and Business & Financial (71.4%).
| Occupation | Male | Female |
| Management | 0 (0.0%) | 0 (0.0%) |
| Business & Financial | 12 (28.6%) | 30 (71.4%) |
| Computers, Engineering & Science | 103 (100.0%) | 0 (0.0%) |
| Computers & Mathematics | 0 (0.0%) | 0 (0.0%) |
| Architecture & Engineering | 103 (100.0%) | 0 (0.0%) |
| Life, Physical & Social Science | 0 (0.0%) | 0 (0.0%) |
| Community & Social Service | 50 (51.5%) | 47 (48.4%) |
| Education, Arts & Media | 0 (0.0%) | 0 (0.0%) |
| Legal Services & Support | 26 (100.0%) | 0 (0.0%) |
| Education Instruction & Library | 24 (33.8%) | 47 (66.2%) |
| Arts, Media & Entertainment | 0 (0.0%) | 0 (0.0%) |
| Health Diagnosing & Treating | 0 (0.0%) | 94 (100.0%) |
| Health Technologists | 0 (0.0%) | 76 (100.0%) |
| Total (Category) | 165 (49.1%) | 171 (50.9%) |
| Total (Overall) | 398 (49.4%) | 408 (50.6%) |
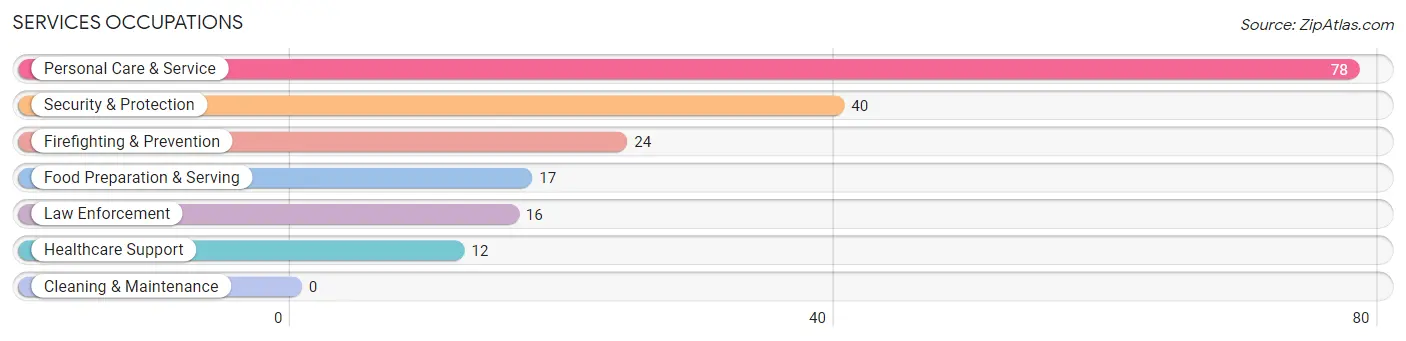
Services Occupations
The most common Services occupations in Stansberry Lake are Personal Care & Service (78 | 9.7%), Security & Protection (40 | 5.0%), Firefighting & Prevention (24 | 3.0%), Food Preparation & Serving (17 | 2.1%), and Law Enforcement (16 | 2.0%).
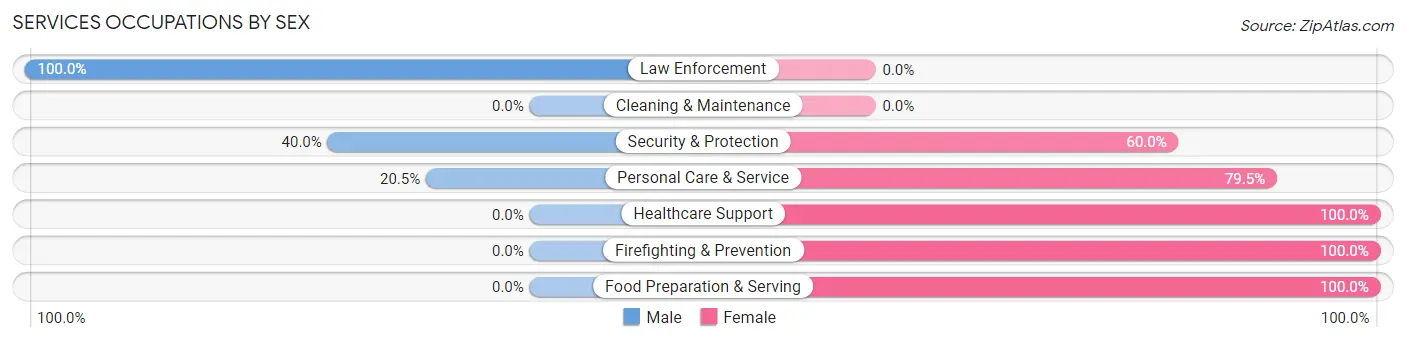
Services Occupations by Sex
Within the Services occupations in Stansberry Lake, the most male-oriented occupations are Law Enforcement (100.0%), Security & Protection (40.0%), and Personal Care & Service (20.5%), while the most female-oriented occupations are Healthcare Support (100.0%), Firefighting & Prevention (100.0%), and Food Preparation & Serving (100.0%).
| Occupation | Male | Female |
| Healthcare Support | 0 (0.0%) | 12 (100.0%) |
| Security & Protection | 16 (40.0%) | 24 (60.0%) |
| Firefighting & Prevention | 0 (0.0%) | 24 (100.0%) |
| Law Enforcement | 16 (100.0%) | 0 (0.0%) |
| Food Preparation & Serving | 0 (0.0%) | 17 (100.0%) |
| Cleaning & Maintenance | 0 (0.0%) | 0 (0.0%) |
| Personal Care & Service | 16 (20.5%) | 62 (79.5%) |
| Total (Category) | 32 (21.8%) | 115 (78.2%) |
| Total (Overall) | 398 (49.4%) | 408 (50.6%) |
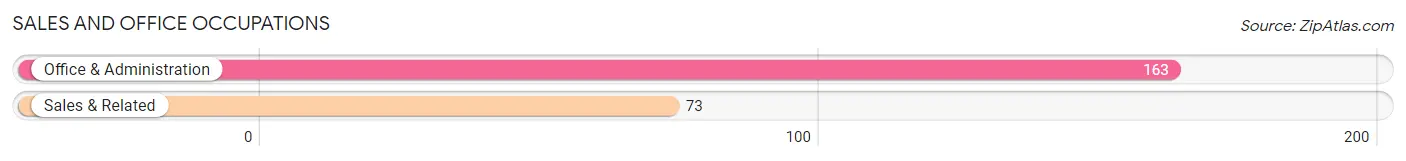
Sales and Office Occupations
The most common Sales and Office occupations in Stansberry Lake are Office & Administration (163 | 20.2%), and Sales & Related (73 | 9.1%).
Sales and Office Occupations by Sex
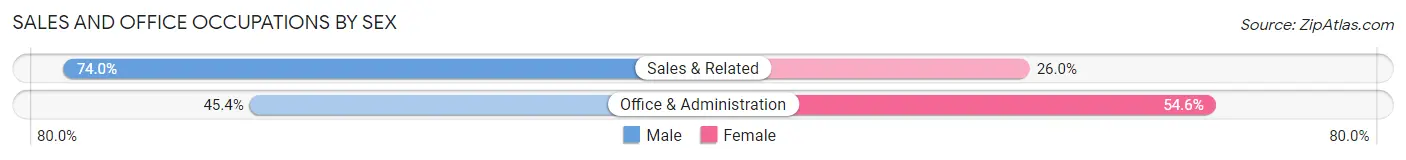
| Occupation | Male | Female |
| Sales & Related | 54 (74.0%) | 19 (26.0%) |
| Office & Administration | 74 (45.4%) | 89 (54.6%) |
| Total (Category) | 128 (54.2%) | 108 (45.8%) |
| Total (Overall) | 398 (49.4%) | 408 (50.6%) |
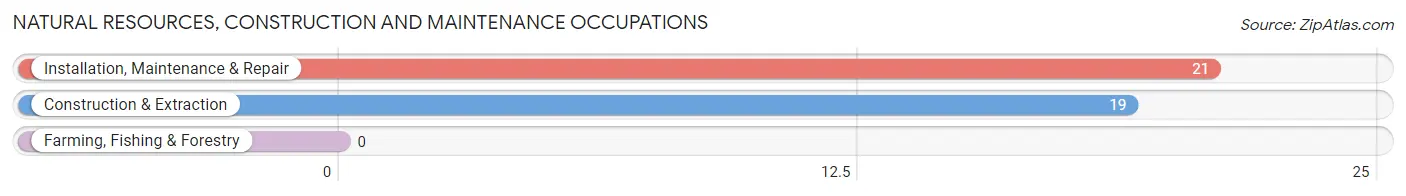
Natural Resources, Construction and Maintenance Occupations
The most common Natural Resources, Construction and Maintenance occupations in Stansberry Lake are Installation, Maintenance & Repair (21 | 2.6%), and Construction & Extraction (19 | 2.4%).
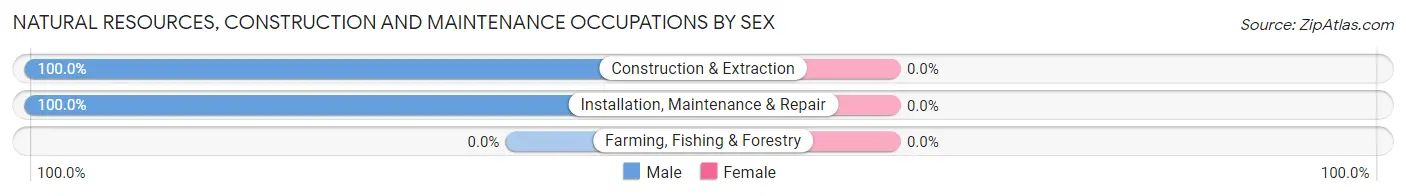
Natural Resources, Construction and Maintenance Occupations by Sex
| Occupation | Male | Female |
| Farming, Fishing & Forestry | 0 (0.0%) | 0 (0.0%) |
| Construction & Extraction | 19 (100.0%) | 0 (0.0%) |
| Installation, Maintenance & Repair | 21 (100.0%) | 0 (0.0%) |
| Total (Category) | 40 (100.0%) | 0 (0.0%) |
| Total (Overall) | 398 (49.4%) | 408 (50.6%) |
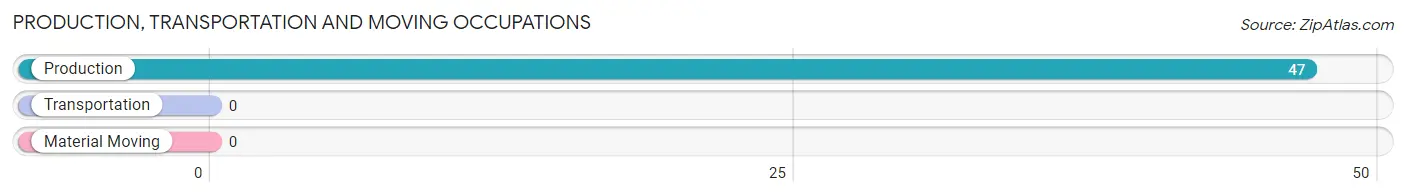
Production, Transportation and Moving Occupations
The most common Production, Transportation and Moving occupations in Stansberry Lake are , and Production (47 | 5.8%).
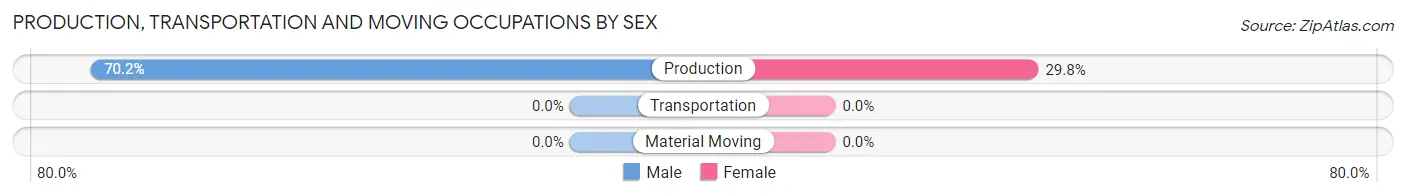
Production, Transportation and Moving Occupations by Sex
| Occupation | Male | Female |
| Production | 33 (70.2%) | 14 (29.8%) |
| Transportation | 0 (0.0%) | 0 (0.0%) |
| Material Moving | 0 (0.0%) | 0 (0.0%) |
| Total (Category) | 33 (70.2%) | 14 (29.8%) |
| Total (Overall) | 398 (49.4%) | 408 (50.6%) |
Employment Industries by Sex in Stansberry Lake
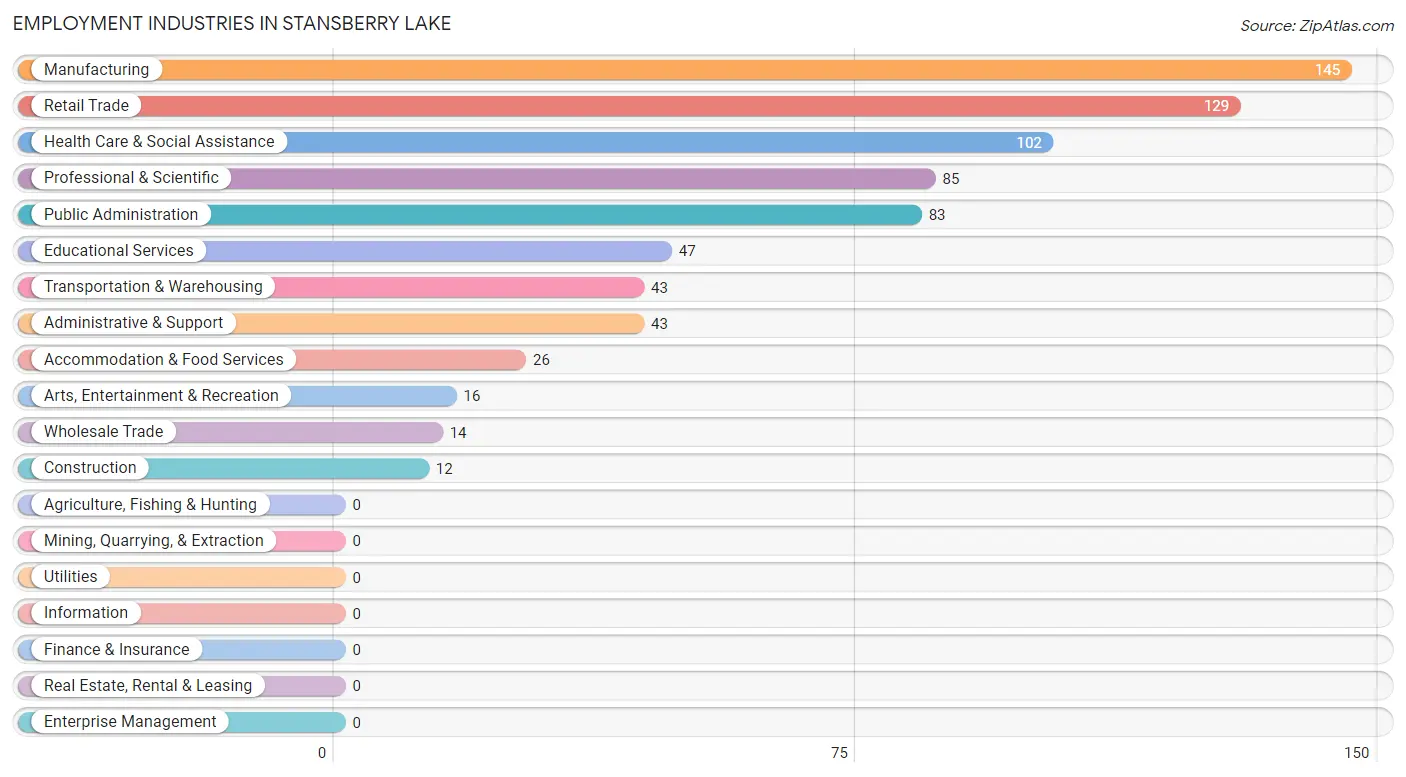
Employment Industries in Stansberry Lake
The major employment industries in Stansberry Lake include Manufacturing (145 | 18.0%), Retail Trade (129 | 16.0%), Health Care & Social Assistance (102 | 12.7%), Professional & Scientific (85 | 10.5%), and Public Administration (83 | 10.3%).
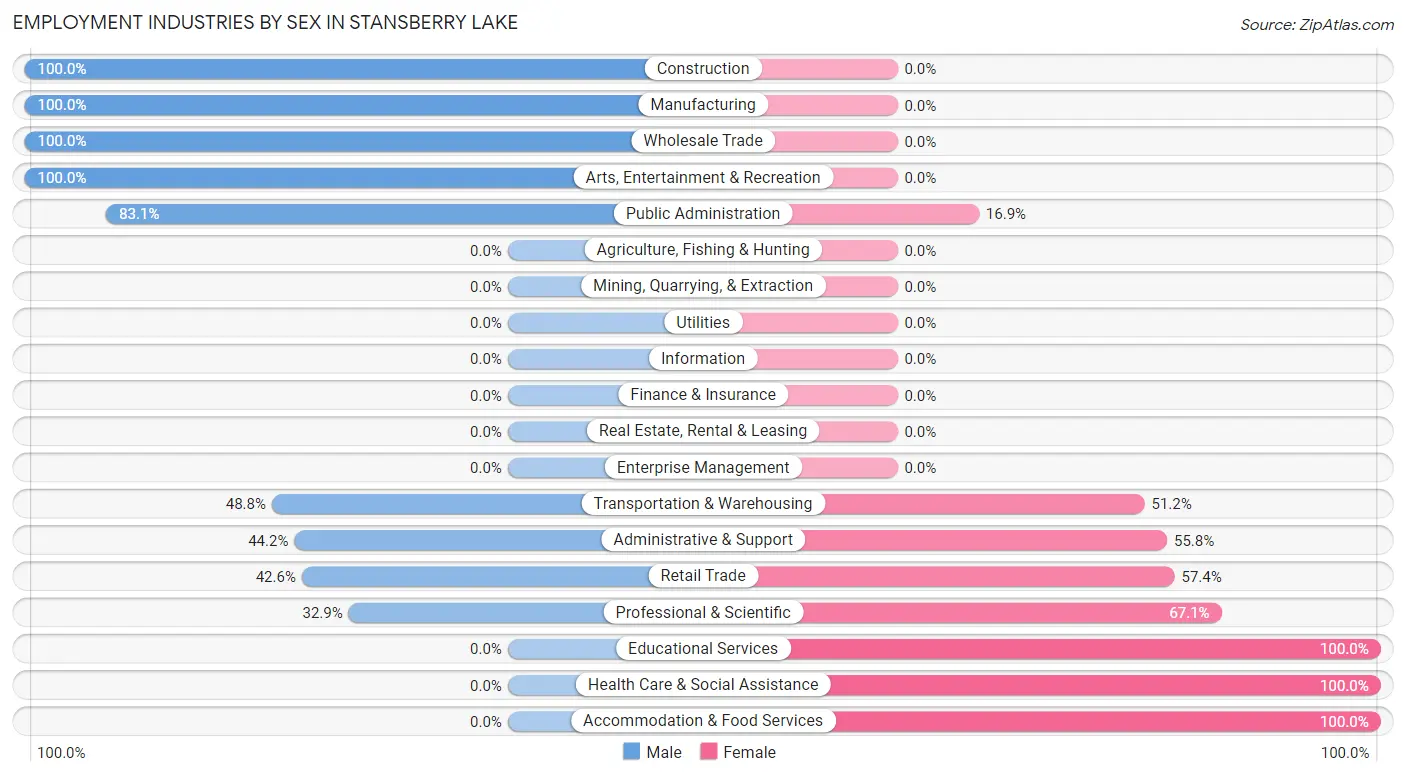
Employment Industries by Sex in Stansberry Lake
The Stansberry Lake industries that see more men than women are Construction (100.0%), Manufacturing (100.0%), and Wholesale Trade (100.0%), whereas the industries that tend to have a higher number of women are Educational Services (100.0%), Health Care & Social Assistance (100.0%), and Accommodation & Food Services (100.0%).
| Industry | Male | Female |
| Agriculture, Fishing & Hunting | 0 (0.0%) | 0 (0.0%) |
| Mining, Quarrying, & Extraction | 0 (0.0%) | 0 (0.0%) |
| Construction | 12 (100.0%) | 0 (0.0%) |
| Manufacturing | 145 (100.0%) | 0 (0.0%) |
| Wholesale Trade | 14 (100.0%) | 0 (0.0%) |
| Retail Trade | 55 (42.6%) | 74 (57.4%) |
| Transportation & Warehousing | 21 (48.8%) | 22 (51.2%) |
| Utilities | 0 (0.0%) | 0 (0.0%) |
| Information | 0 (0.0%) | 0 (0.0%) |
| Finance & Insurance | 0 (0.0%) | 0 (0.0%) |
| Real Estate, Rental & Leasing | 0 (0.0%) | 0 (0.0%) |
| Professional & Scientific | 28 (32.9%) | 57 (67.1%) |
| Enterprise Management | 0 (0.0%) | 0 (0.0%) |
| Administrative & Support | 19 (44.2%) | 24 (55.8%) |
| Educational Services | 0 (0.0%) | 47 (100.0%) |
| Health Care & Social Assistance | 0 (0.0%) | 102 (100.0%) |
| Arts, Entertainment & Recreation | 16 (100.0%) | 0 (0.0%) |
| Accommodation & Food Services | 0 (0.0%) | 26 (100.0%) |
| Public Administration | 69 (83.1%) | 14 (16.9%) |
| Total | 398 (49.4%) | 408 (50.6%) |
Education in Stansberry Lake
School Enrollment in Stansberry Lake
The most common levels of schooling among the 533 students in Stansberry Lake are high school (152 | 28.5%), elementary school (143 | 26.8%), and middle school (102 | 19.1%).
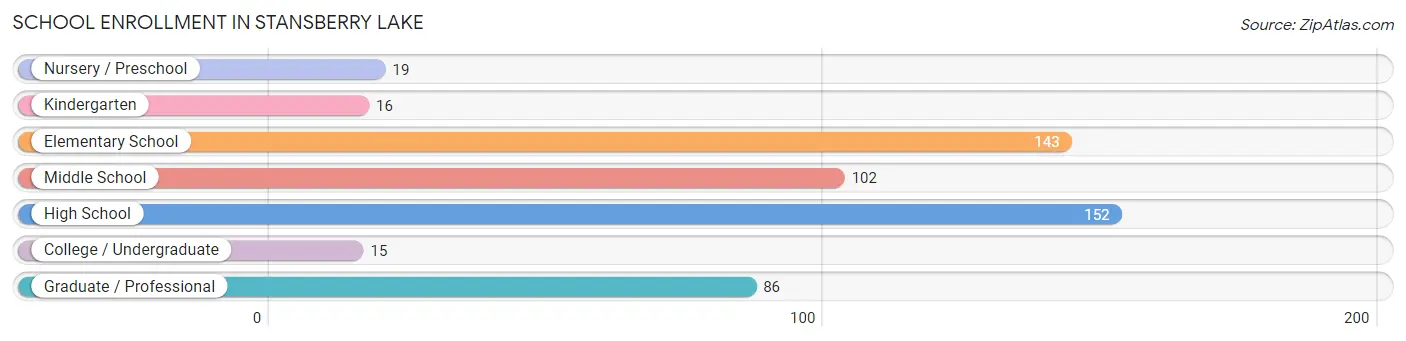
| School Level | # Students | % Students |
| Nursery / Preschool | 19 | 3.6% |
| Kindergarten | 16 | 3.0% |
| Elementary School | 143 | 26.8% |
| Middle School | 102 | 19.1% |
| High School | 152 | 28.5% |
| College / Undergraduate | 15 | 2.8% |
| Graduate / Professional | 86 | 16.1% |
| Total | 533 | 100.0% |
School Enrollment by Age by Funding Source in Stansberry Lake
Out of a total of 533 students who are enrolled in schools in Stansberry Lake, 99 (18.6%) attend a private institution, while the remaining 434 (81.4%) are enrolled in public schools. The age group of 35 years and over has the highest likelihood of being enrolled in private schools, with 39 (100.0% in the age bracket) enrolled. Conversely, the age group of 3 to 4 year olds has the lowest likelihood of being enrolled in a private school, with 19 (100.0% in the age bracket) attending a public institution.
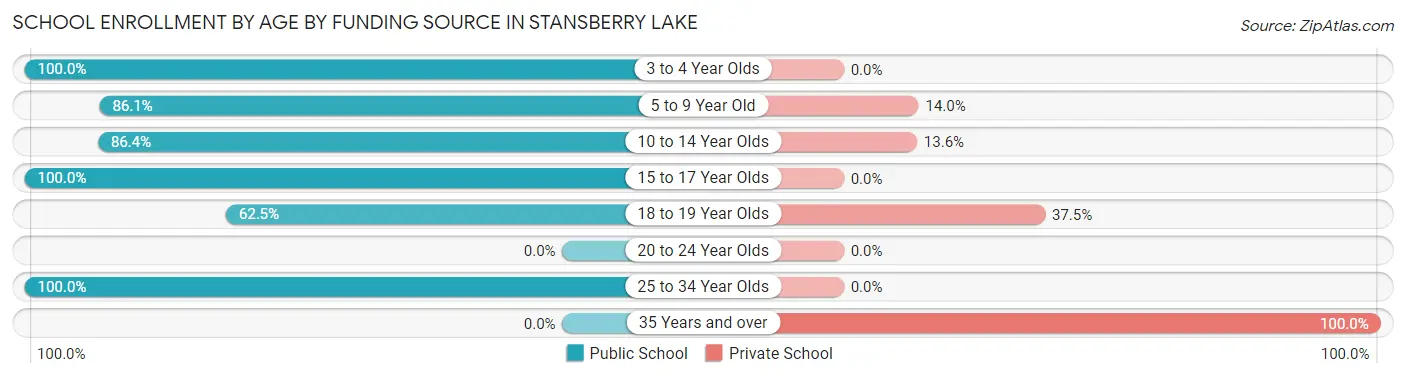
| Age Bracket | Public School | Private School |
| 3 to 4 Year Olds | 19 (100.0%) | 0 (0.0%) |
| 5 to 9 Year Old | 111 (86.1%) | 18 (14.0%) |
| 10 to 14 Year Olds | 114 (86.4%) | 18 (13.6%) |
| 15 to 17 Year Olds | 88 (100.0%) | 0 (0.0%) |
| 18 to 19 Year Olds | 40 (62.5%) | 24 (37.5%) |
| 20 to 24 Year Olds | 0 (0.0%) | 0 (0.0%) |
| 25 to 34 Year Olds | 62 (100.0%) | 0 (0.0%) |
| 35 Years and over | 0 (0.0%) | 39 (100.0%) |
| Total | 434 (81.4%) | 99 (18.6%) |
Educational Attainment by Field of Study in Stansberry Lake
Engineering (86 | 16.3%), education (74 | 14.0%), science & technology (72 | 13.6%), bio, nature & agricultural (62 | 11.7%), and literature & languages (55 | 10.4%) are the most common fields of study among 529 individuals in Stansberry Lake who have obtained a bachelor's degree or higher.
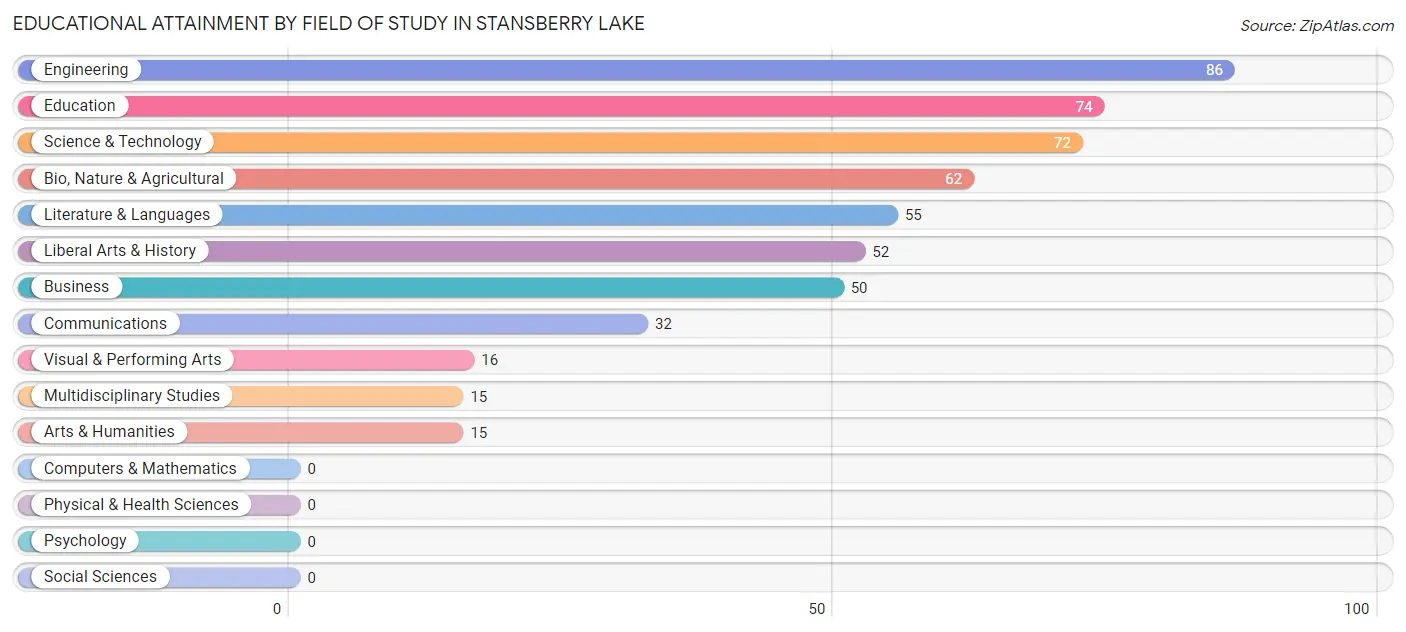
| Field of Study | # Graduates | % Graduates |
| Computers & Mathematics | 0 | 0.0% |
| Bio, Nature & Agricultural | 62 | 11.7% |
| Physical & Health Sciences | 0 | 0.0% |
| Psychology | 0 | 0.0% |
| Social Sciences | 0 | 0.0% |
| Engineering | 86 | 16.3% |
| Multidisciplinary Studies | 15 | 2.8% |
| Science & Technology | 72 | 13.6% |
| Business | 50 | 9.5% |
| Education | 74 | 14.0% |
| Literature & Languages | 55 | 10.4% |
| Liberal Arts & History | 52 | 9.8% |
| Visual & Performing Arts | 16 | 3.0% |
| Communications | 32 | 6.0% |
| Arts & Humanities | 15 | 2.8% |
| Total | 529 | 100.0% |
Transportation & Commute in Stansberry Lake
Vehicle Availability by Sex in Stansberry Lake
The most prevalent vehicle ownership categories in Stansberry Lake are males with 3 vehicles (132, accounting for 33.7%) and females with 3 vehicles (133, making up 34.6%).
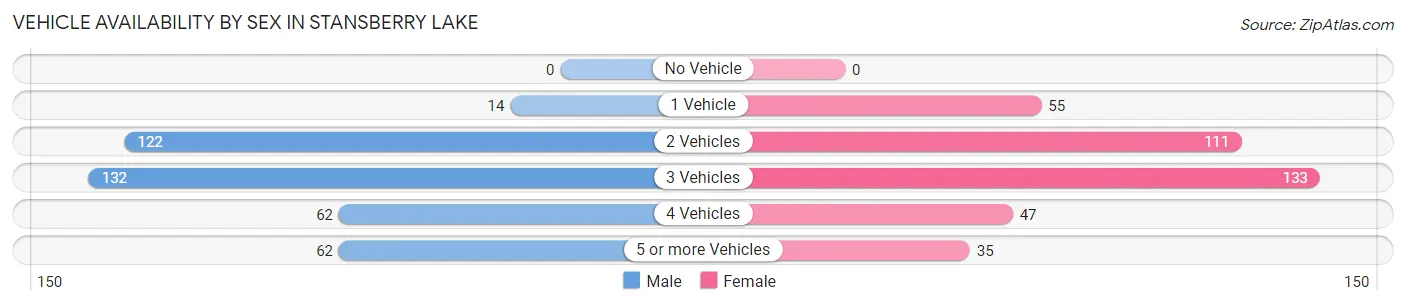
| Vehicles Available | Male | Female |
| No Vehicle | 0 (0.0%) | 0 (0.0%) |
| 1 Vehicle | 14 (3.6%) | 55 (14.4%) |
| 2 Vehicles | 122 (31.1%) | 111 (29.1%) |
| 3 Vehicles | 132 (33.7%) | 133 (34.9%) |
| 4 Vehicles | 62 (15.8%) | 47 (12.3%) |
| 5 or more Vehicles | 62 (15.8%) | 35 (9.2%) |
| Total | 392 (100.0%) | 381 (100.0%) |
Commute Time in Stansberry Lake
The most frequently occuring commute durations in Stansberry Lake are 60 to 89 minutes (164 commuters, 23.1%), 20 to 24 minutes (137 commuters, 19.3%), and 30 to 34 minutes (110 commuters, 15.5%).
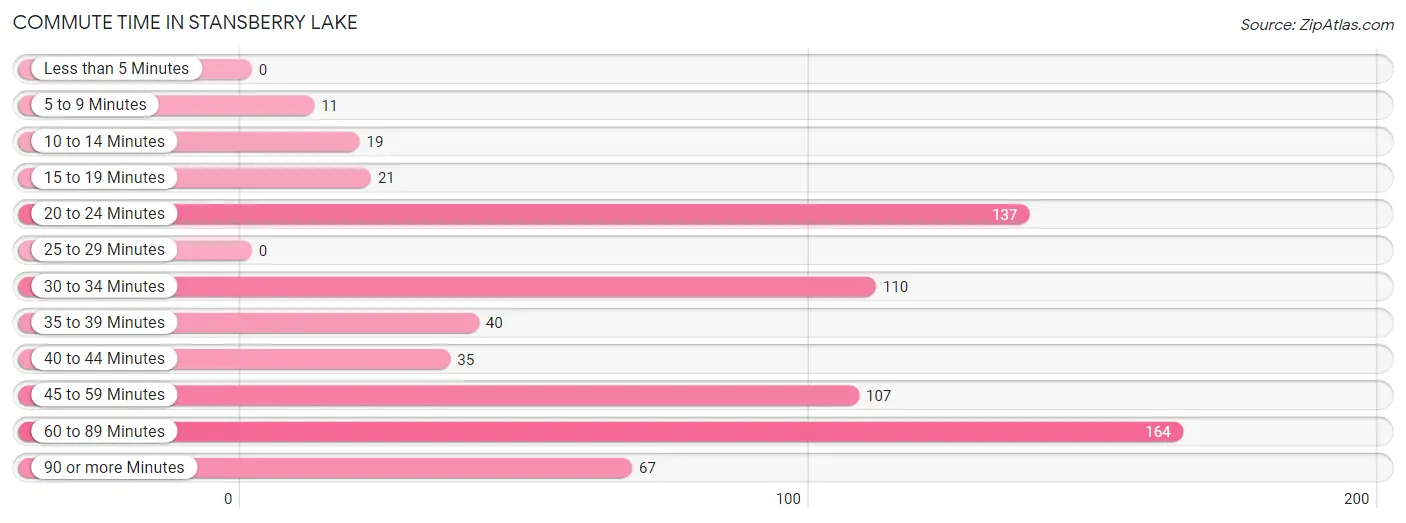
| Commute Time | # Commuters | % Commuters |
| Less than 5 Minutes | 0 | 0.0% |
| 5 to 9 Minutes | 11 | 1.5% |
| 10 to 14 Minutes | 19 | 2.7% |
| 15 to 19 Minutes | 21 | 2.9% |
| 20 to 24 Minutes | 137 | 19.3% |
| 25 to 29 Minutes | 0 | 0.0% |
| 30 to 34 Minutes | 110 | 15.5% |
| 35 to 39 Minutes | 40 | 5.6% |
| 40 to 44 Minutes | 35 | 4.9% |
| 45 to 59 Minutes | 107 | 15.0% |
| 60 to 89 Minutes | 164 | 23.1% |
| 90 or more Minutes | 67 | 9.4% |
Commute Time by Sex in Stansberry Lake
The most common commute times in Stansberry Lake are 60 to 89 minutes (126 commuters, 34.8%) for males and 20 to 24 minutes (124 commuters, 35.5%) for females.
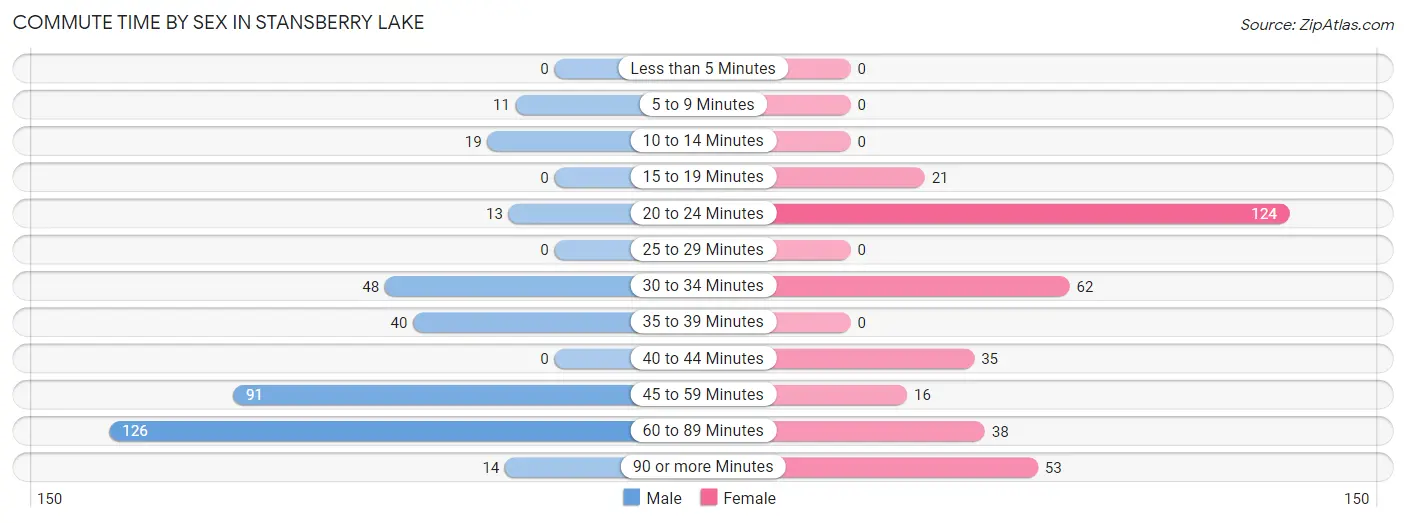
| Commute Time | Male | Female |
| Less than 5 Minutes | 0 (0.0%) | 0 (0.0%) |
| 5 to 9 Minutes | 11 (3.0%) | 0 (0.0%) |
| 10 to 14 Minutes | 19 (5.2%) | 0 (0.0%) |
| 15 to 19 Minutes | 0 (0.0%) | 21 (6.0%) |
| 20 to 24 Minutes | 13 (3.6%) | 124 (35.5%) |
| 25 to 29 Minutes | 0 (0.0%) | 0 (0.0%) |
| 30 to 34 Minutes | 48 (13.3%) | 62 (17.8%) |
| 35 to 39 Minutes | 40 (11.1%) | 0 (0.0%) |
| 40 to 44 Minutes | 0 (0.0%) | 35 (10.0%) |
| 45 to 59 Minutes | 91 (25.1%) | 16 (4.6%) |
| 60 to 89 Minutes | 126 (34.8%) | 38 (10.9%) |
| 90 or more Minutes | 14 (3.9%) | 53 (15.2%) |
Time of Departure to Work by Sex in Stansberry Lake
The most frequent times of departure to work in Stansberry Lake are 8:00 AM to 8:29 AM (106, 29.3%) for males and 8:00 AM to 8:29 AM (73, 20.9%) for females.
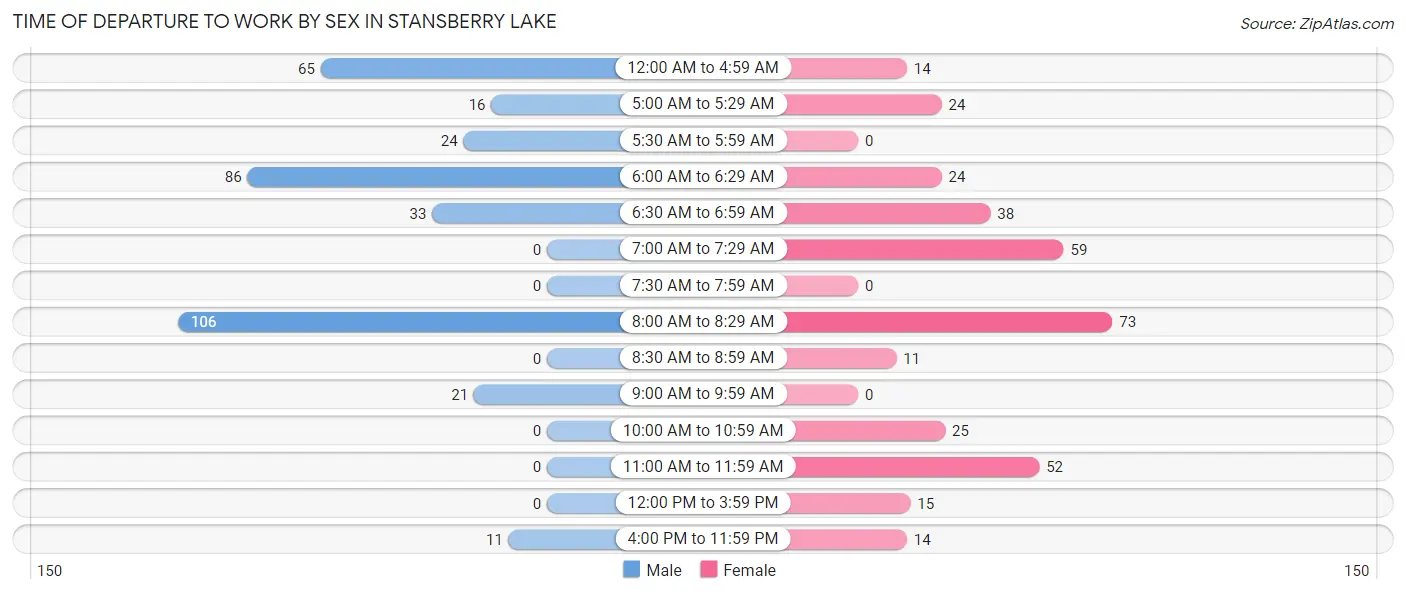
| Time of Departure | Male | Female |
| 12:00 AM to 4:59 AM | 65 (18.0%) | 14 (4.0%) |
| 5:00 AM to 5:29 AM | 16 (4.4%) | 24 (6.9%) |
| 5:30 AM to 5:59 AM | 24 (6.6%) | 0 (0.0%) |
| 6:00 AM to 6:29 AM | 86 (23.8%) | 24 (6.9%) |
| 6:30 AM to 6:59 AM | 33 (9.1%) | 38 (10.9%) |
| 7:00 AM to 7:29 AM | 0 (0.0%) | 59 (16.9%) |
| 7:30 AM to 7:59 AM | 0 (0.0%) | 0 (0.0%) |
| 8:00 AM to 8:29 AM | 106 (29.3%) | 73 (20.9%) |
| 8:30 AM to 8:59 AM | 0 (0.0%) | 11 (3.2%) |
| 9:00 AM to 9:59 AM | 21 (5.8%) | 0 (0.0%) |
| 10:00 AM to 10:59 AM | 0 (0.0%) | 25 (7.2%) |
| 11:00 AM to 11:59 AM | 0 (0.0%) | 52 (14.9%) |
| 12:00 PM to 3:59 PM | 0 (0.0%) | 15 (4.3%) |
| 4:00 PM to 11:59 PM | 11 (3.0%) | 14 (4.0%) |
| Total | 362 (100.0%) | 349 (100.0%) |
Housing Occupancy in Stansberry Lake
Occupancy by Ownership in Stansberry Lake
Of the total 686 dwellings in Stansberry Lake, owner-occupied units account for 604 (88.0%), while renter-occupied units make up 82 (11.9%).
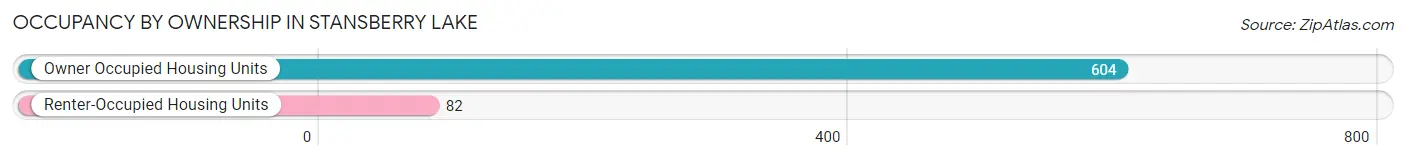
| Occupancy | # Housing Units | % Housing Units |
| Owner Occupied Housing Units | 604 | 88.0% |
| Renter-Occupied Housing Units | 82 | 11.9% |
| Total Occupied Housing Units | 686 | 100.0% |
Occupancy by Household Size in Stansberry Lake
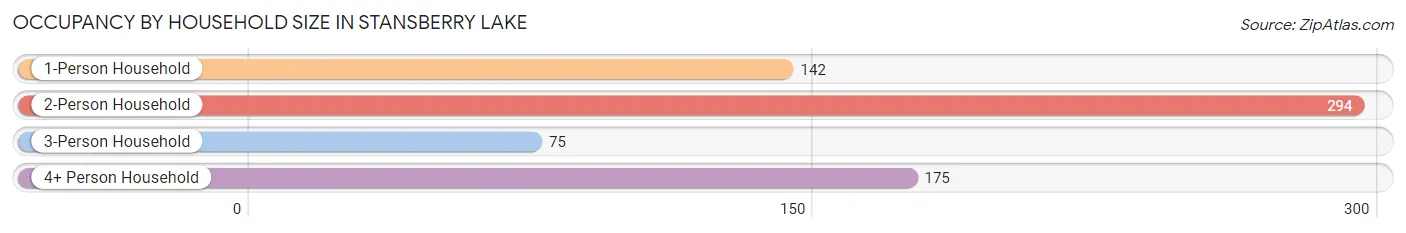
| Household Size | # Housing Units | % Housing Units |
| 1-Person Household | 142 | 20.7% |
| 2-Person Household | 294 | 42.9% |
| 3-Person Household | 75 | 10.9% |
| 4+ Person Household | 175 | 25.5% |
| Total Housing Units | 686 | 100.0% |
Occupancy by Ownership by Household Size in Stansberry Lake
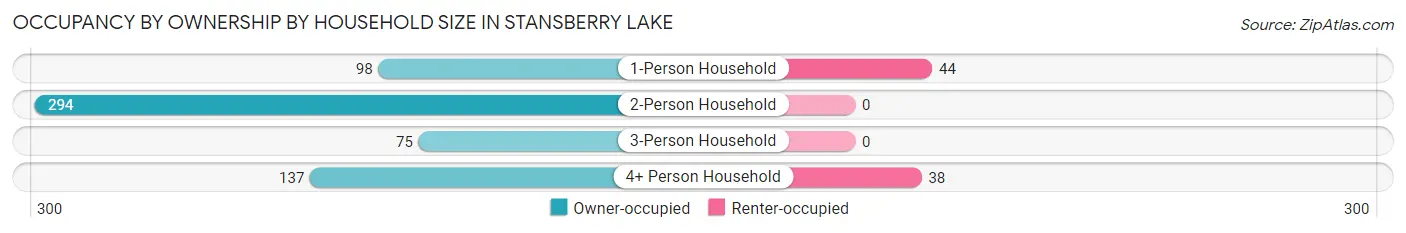
| Household Size | Owner-occupied | Renter-occupied |
| 1-Person Household | 98 (69.0%) | 44 (31.0%) |
| 2-Person Household | 294 (100.0%) | 0 (0.0%) |
| 3-Person Household | 75 (100.0%) | 0 (0.0%) |
| 4+ Person Household | 137 (78.3%) | 38 (21.7%) |
| Total Housing Units | 604 (88.0%) | 82 (11.9%) |
Occupancy by Educational Attainment in Stansberry Lake
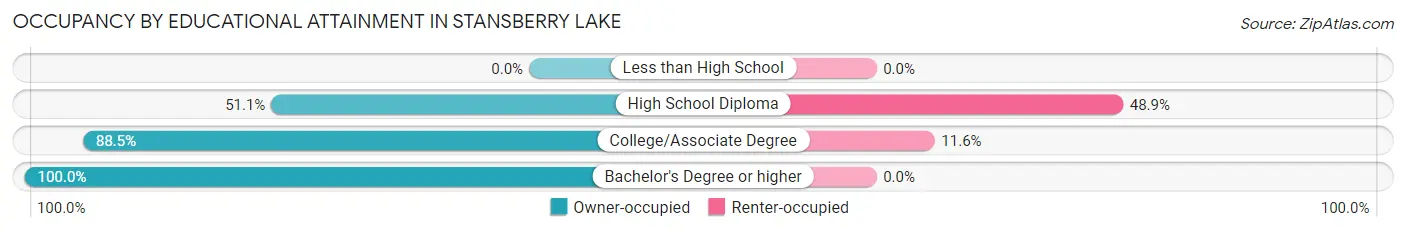
| Household Size | Owner-occupied | Renter-occupied |
| Less than High School | 0 (0.0%) | 0 (0.0%) |
| High School Diploma | 46 (51.1%) | 44 (48.9%) |
| College/Associate Degree | 291 (88.4%) | 38 (11.6%) |
| Bachelor's Degree or higher | 267 (100.0%) | 0 (0.0%) |
Occupancy by Age of Householder in Stansberry Lake
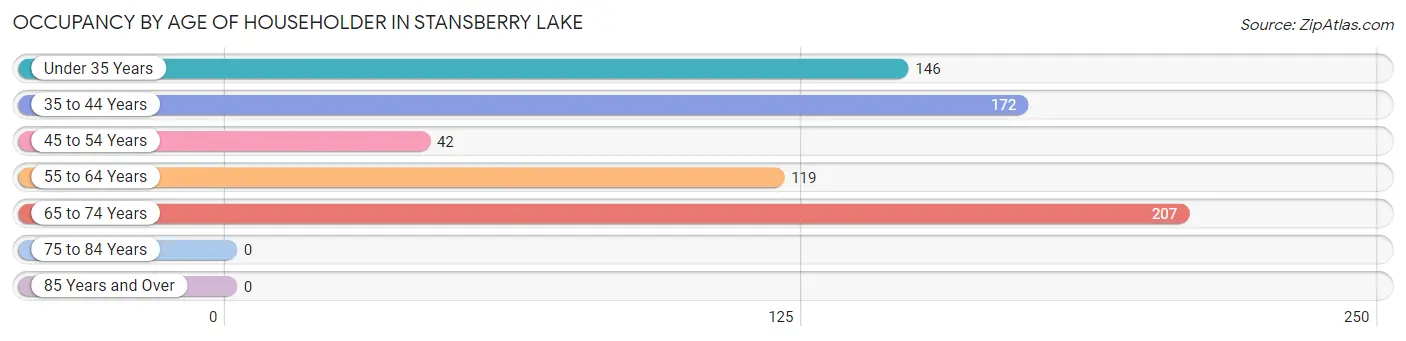
| Age Bracket | # Households | % Households |
| Under 35 Years | 146 | 21.3% |
| 35 to 44 Years | 172 | 25.1% |
| 45 to 54 Years | 42 | 6.1% |
| 55 to 64 Years | 119 | 17.3% |
| 65 to 74 Years | 207 | 30.2% |
| 75 to 84 Years | 0 | 0.0% |
| 85 Years and Over | 0 | 0.0% |
| Total | 686 | 100.0% |
Housing Finances in Stansberry Lake
Median Income by Occupancy in Stansberry Lake
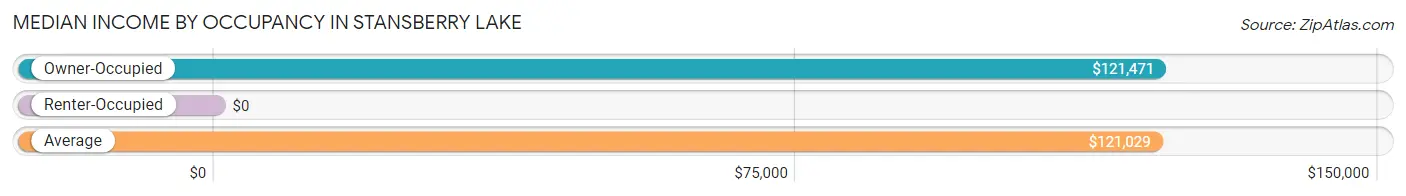
| Occupancy Type | # Households | Median Income |
| Owner-Occupied | 604 (88.0%) | $121,471 |
| Renter-Occupied | 82 (11.9%) | $0 |
| Average | 686 (100.0%) | $121,029 |
Occupancy by Householder Income Bracket in Stansberry Lake
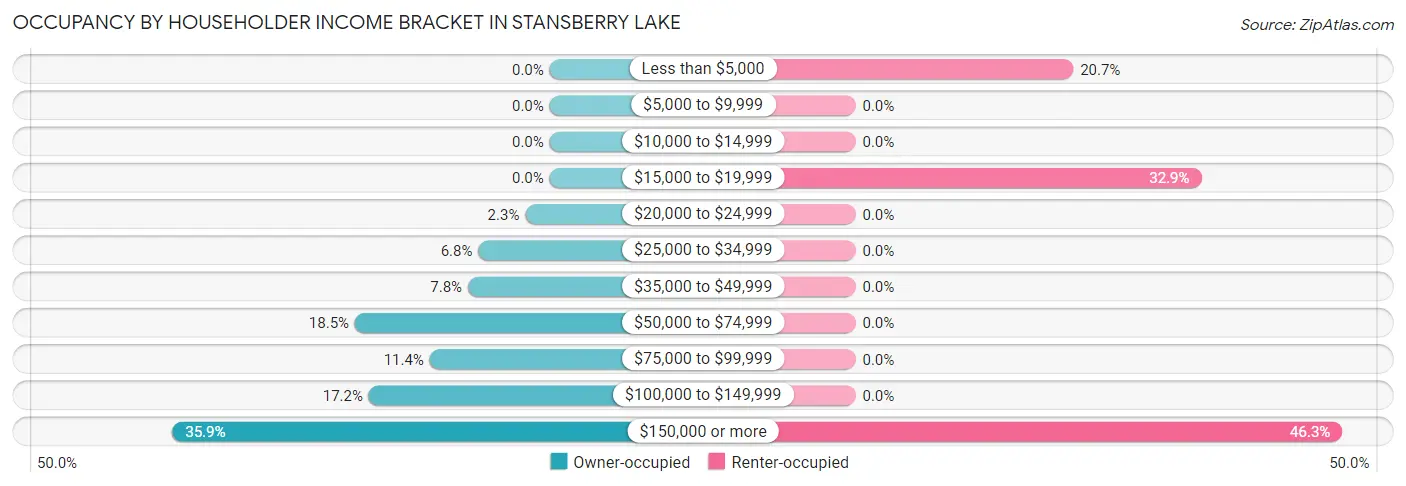
| Income Bracket | Owner-occupied | Renter-occupied |
| Less than $5,000 | 0 (0.0%) | 17 (20.7%) |
| $5,000 to $9,999 | 0 (0.0%) | 0 (0.0%) |
| $10,000 to $14,999 | 0 (0.0%) | 0 (0.0%) |
| $15,000 to $19,999 | 0 (0.0%) | 27 (32.9%) |
| $20,000 to $24,999 | 14 (2.3%) | 0 (0.0%) |
| $25,000 to $34,999 | 41 (6.8%) | 0 (0.0%) |
| $35,000 to $49,999 | 47 (7.8%) | 0 (0.0%) |
| $50,000 to $74,999 | 112 (18.5%) | 0 (0.0%) |
| $75,000 to $99,999 | 69 (11.4%) | 0 (0.0%) |
| $100,000 to $149,999 | 104 (17.2%) | 0 (0.0%) |
| $150,000 or more | 217 (35.9%) | 38 (46.3%) |
| Total | 604 (100.0%) | 82 (100.0%) |
Monthly Housing Cost Tiers in Stansberry Lake
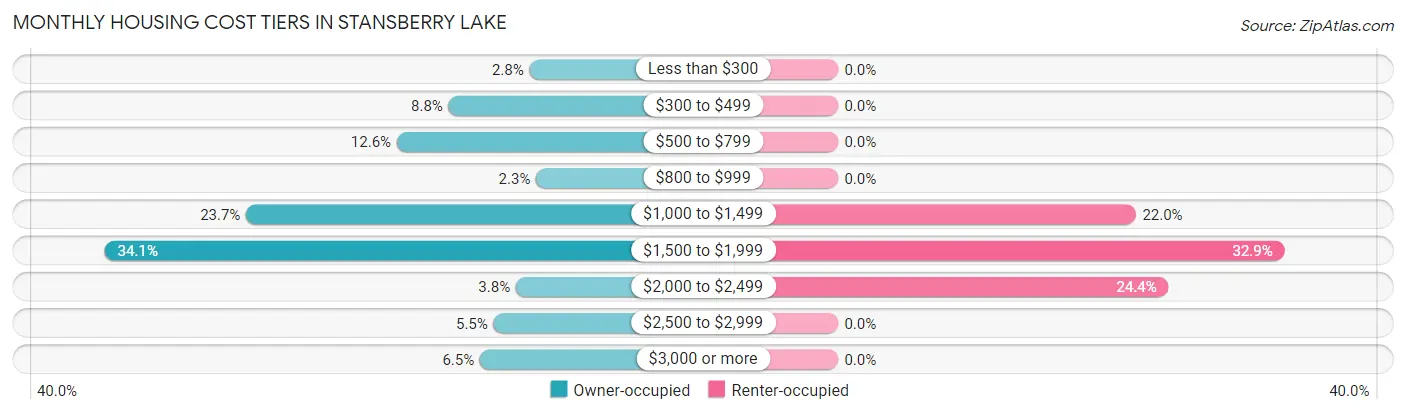
| Monthly Cost | Owner-occupied | Renter-occupied |
| Less than $300 | 17 (2.8%) | 0 (0.0%) |
| $300 to $499 | 53 (8.8%) | 0 (0.0%) |
| $500 to $799 | 76 (12.6%) | 0 (0.0%) |
| $800 to $999 | 14 (2.3%) | 0 (0.0%) |
| $1,000 to $1,499 | 143 (23.7%) | 18 (22.0%) |
| $1,500 to $1,999 | 206 (34.1%) | 27 (32.9%) |
| $2,000 to $2,499 | 23 (3.8%) | 20 (24.4%) |
| $2,500 to $2,999 | 33 (5.5%) | 0 (0.0%) |
| $3,000 or more | 39 (6.5%) | 0 (0.0%) |
| Total | 604 (100.0%) | 82 (100.0%) |
Physical Housing Characteristics in Stansberry Lake
Housing Structures in Stansberry Lake
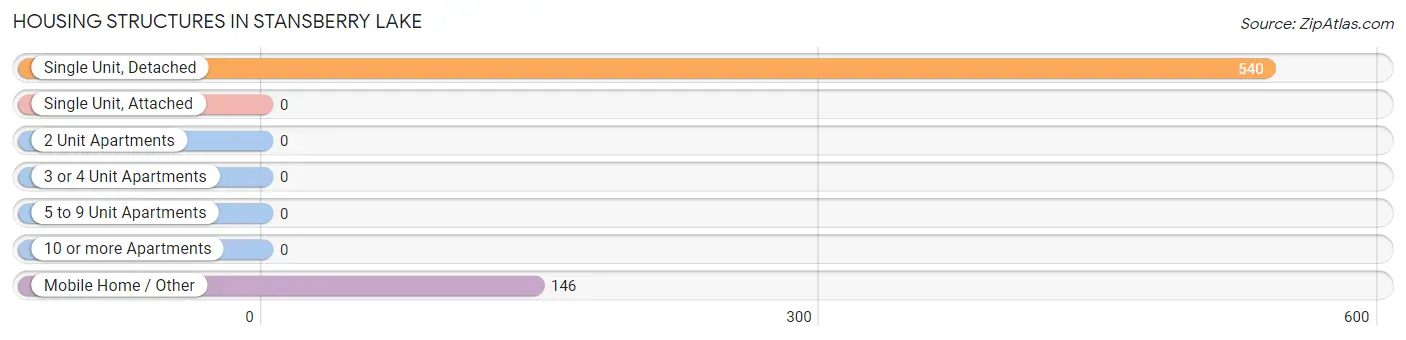
| Structure Type | # Housing Units | % Housing Units |
| Single Unit, Detached | 540 | 78.7% |
| Single Unit, Attached | 0 | 0.0% |
| 2 Unit Apartments | 0 | 0.0% |
| 3 or 4 Unit Apartments | 0 | 0.0% |
| 5 to 9 Unit Apartments | 0 | 0.0% |
| 10 or more Apartments | 0 | 0.0% |
| Mobile Home / Other | 146 | 21.3% |
| Total | 686 | 100.0% |
Housing Structures by Occupancy in Stansberry Lake
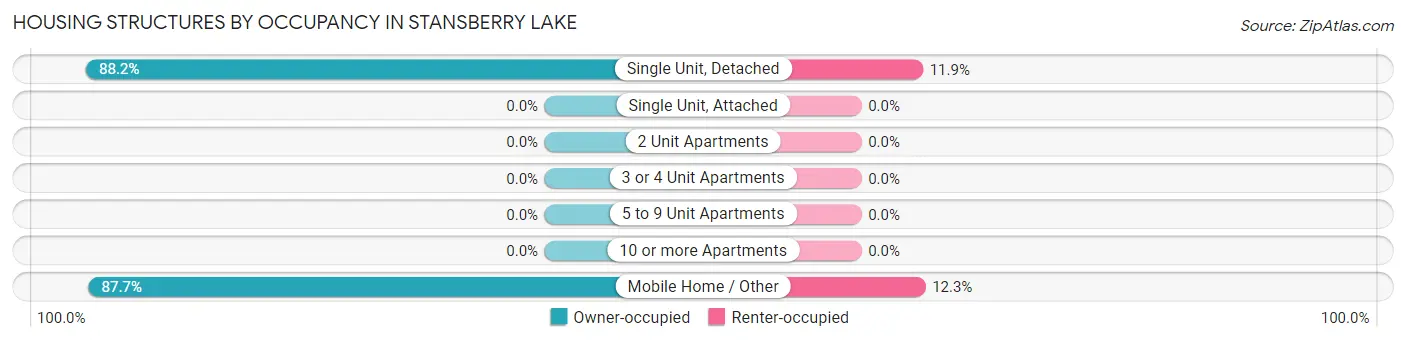
| Structure Type | Owner-occupied | Renter-occupied |
| Single Unit, Detached | 476 (88.1%) | 64 (11.8%) |
| Single Unit, Attached | 0 (0.0%) | 0 (0.0%) |
| 2 Unit Apartments | 0 (0.0%) | 0 (0.0%) |
| 3 or 4 Unit Apartments | 0 (0.0%) | 0 (0.0%) |
| 5 to 9 Unit Apartments | 0 (0.0%) | 0 (0.0%) |
| 10 or more Apartments | 0 (0.0%) | 0 (0.0%) |
| Mobile Home / Other | 128 (87.7%) | 18 (12.3%) |
| Total | 604 (88.0%) | 82 (11.9%) |
Housing Structures by Number of Rooms in Stansberry Lake
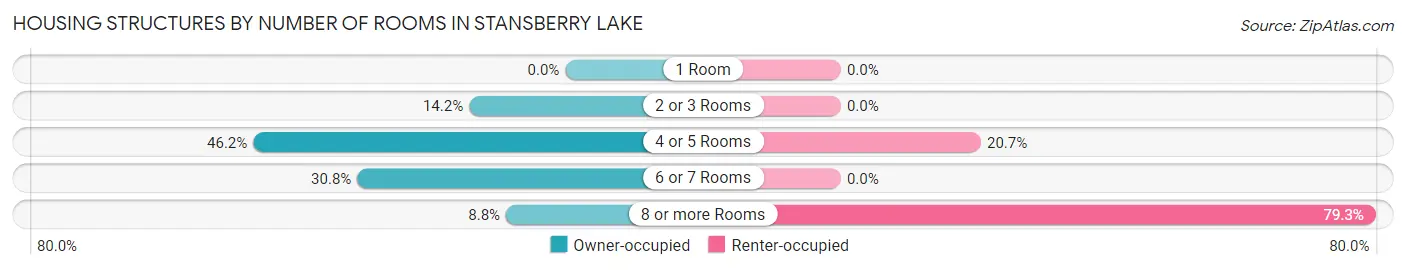
| Number of Rooms | Owner-occupied | Renter-occupied |
| 1 Room | 0 (0.0%) | 0 (0.0%) |
| 2 or 3 Rooms | 86 (14.2%) | 0 (0.0%) |
| 4 or 5 Rooms | 279 (46.2%) | 17 (20.7%) |
| 6 or 7 Rooms | 186 (30.8%) | 0 (0.0%) |
| 8 or more Rooms | 53 (8.8%) | 65 (79.3%) |
| Total | 604 (100.0%) | 82 (100.0%) |
Housing Structure by Heating Type in Stansberry Lake
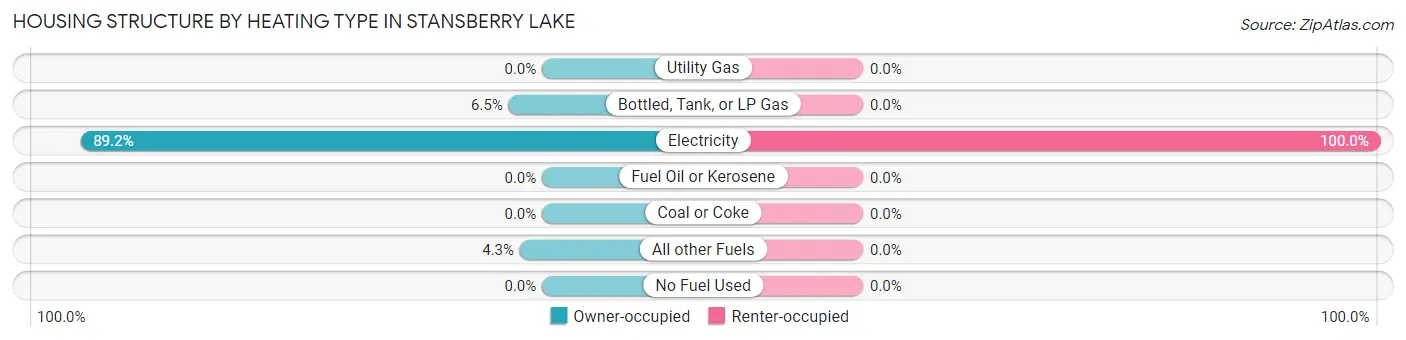
| Heating Type | Owner-occupied | Renter-occupied |
| Utility Gas | 0 (0.0%) | 0 (0.0%) |
| Bottled, Tank, or LP Gas | 39 (6.5%) | 0 (0.0%) |
| Electricity | 539 (89.2%) | 82 (100.0%) |
| Fuel Oil or Kerosene | 0 (0.0%) | 0 (0.0%) |
| Coal or Coke | 0 (0.0%) | 0 (0.0%) |
| All other Fuels | 26 (4.3%) | 0 (0.0%) |
| No Fuel Used | 0 (0.0%) | 0 (0.0%) |
| Total | 604 (100.0%) | 82 (100.0%) |
Household Vehicle Usage in Stansberry Lake
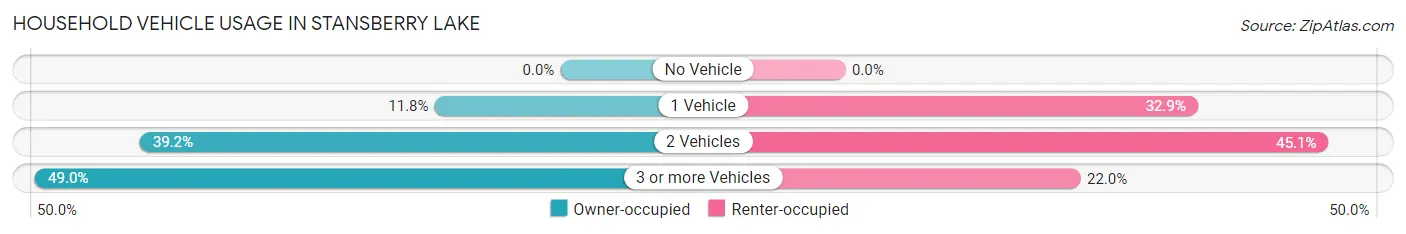
| Vehicles per Household | Owner-occupied | Renter-occupied |
| No Vehicle | 0 (0.0%) | 0 (0.0%) |
| 1 Vehicle | 71 (11.7%) | 27 (32.9%) |
| 2 Vehicles | 237 (39.2%) | 37 (45.1%) |
| 3 or more Vehicles | 296 (49.0%) | 18 (22.0%) |
| Total | 604 (100.0%) | 82 (100.0%) |
Real Estate & Mortgages in Stansberry Lake
Real Estate and Mortgage Overview in Stansberry Lake
| Characteristic | Without Mortgage | With Mortgage |
| Housing Units | 149 | 455 |
| Median Property Value | $316,700 | $366,900 |
| Median Household Income | $71,926 | $193 |
| Monthly Housing Costs | $535 | $39 |
| Real Estate Taxes | $2,710 | $0 |
Property Value by Mortgage Status in Stansberry Lake
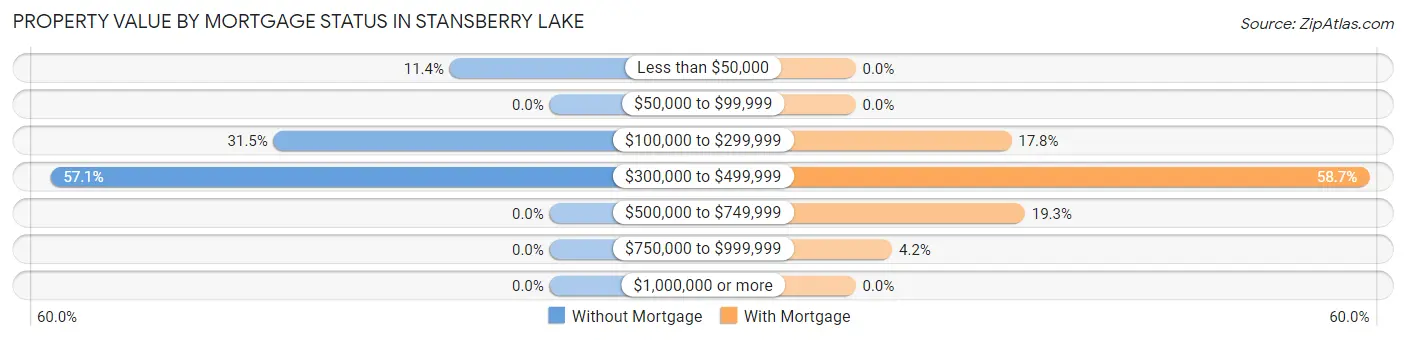
| Property Value | Without Mortgage | With Mortgage |
| Less than $50,000 | 17 (11.4%) | 0 (0.0%) |
| $50,000 to $99,999 | 0 (0.0%) | 0 (0.0%) |
| $100,000 to $299,999 | 47 (31.5%) | 81 (17.8%) |
| $300,000 to $499,999 | 85 (57.1%) | 267 (58.7%) |
| $500,000 to $749,999 | 0 (0.0%) | 88 (19.3%) |
| $750,000 to $999,999 | 0 (0.0%) | 19 (4.2%) |
| $1,000,000 or more | 0 (0.0%) | 0 (0.0%) |
| Total | 149 (100.0%) | 455 (100.0%) |
Household Income by Mortgage Status in Stansberry Lake
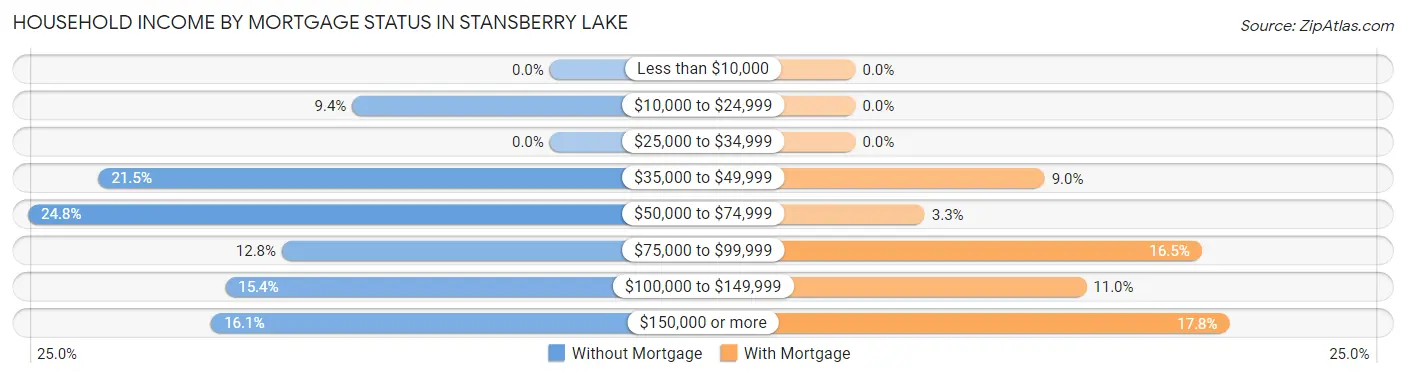
| Household Income | Without Mortgage | With Mortgage |
| Less than $10,000 | 0 (0.0%) | 0 (0.0%) |
| $10,000 to $24,999 | 14 (9.4%) | 0 (0.0%) |
| $25,000 to $34,999 | 0 (0.0%) | 0 (0.0%) |
| $35,000 to $49,999 | 32 (21.5%) | 41 (9.0%) |
| $50,000 to $74,999 | 37 (24.8%) | 15 (3.3%) |
| $75,000 to $99,999 | 19 (12.8%) | 75 (16.5%) |
| $100,000 to $149,999 | 23 (15.4%) | 50 (11.0%) |
| $150,000 or more | 24 (16.1%) | 81 (17.8%) |
| Total | 149 (100.0%) | 455 (100.0%) |
Property Value to Household Income Ratio in Stansberry Lake
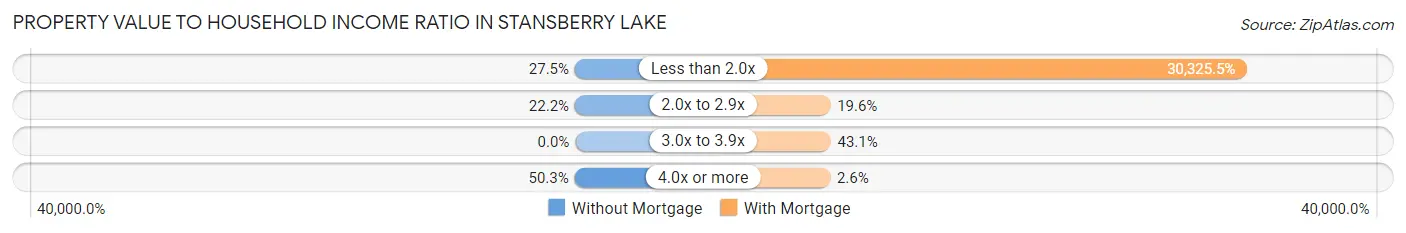
| Value-to-Income Ratio | Without Mortgage | With Mortgage |
| Less than 2.0x | 41 (27.5%) | 137,981 (30,325.5%) |
| 2.0x to 2.9x | 33 (22.2%) | 89 (19.6%) |
| 3.0x to 3.9x | 0 (0.0%) | 196 (43.1%) |
| 4.0x or more | 75 (50.3%) | 12 (2.6%) |
| Total | 149 (100.0%) | 455 (100.0%) |
Real Estate Taxes by Mortgage Status in Stansberry Lake
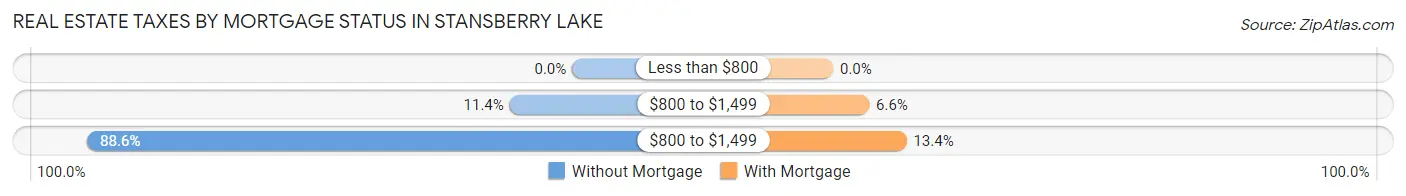
| Property Taxes | Without Mortgage | With Mortgage |
| Less than $800 | 0 (0.0%) | 0 (0.0%) |
| $800 to $1,499 | 17 (11.4%) | 30 (6.6%) |
| $800 to $1,499 | 132 (88.6%) | 61 (13.4%) |
| Total | 149 (100.0%) | 455 (100.0%) |
Health & Disability in Stansberry Lake
Health Insurance Coverage by Age in Stansberry Lake
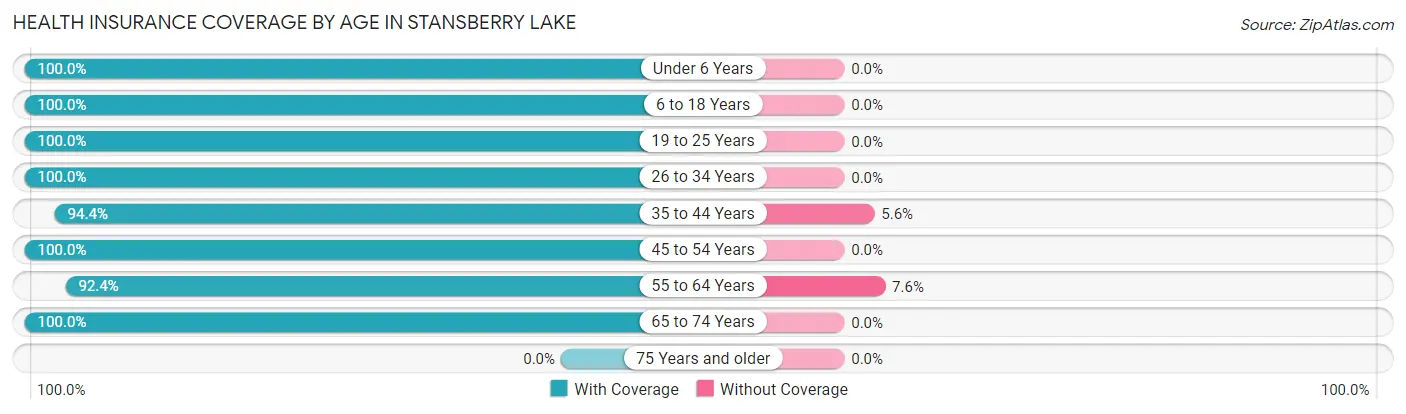
| Age Bracket | With Coverage | Without Coverage |
| Under 6 Years | 70 (100.0%) | 0 (0.0%) |
| 6 to 18 Years | 374 (100.0%) | 0 (0.0%) |
| 19 to 25 Years | 128 (100.0%) | 0 (0.0%) |
| 26 to 34 Years | 265 (100.0%) | 0 (0.0%) |
| 35 to 44 Years | 286 (94.4%) | 17 (5.6%) |
| 45 to 54 Years | 74 (100.0%) | 0 (0.0%) |
| 55 to 64 Years | 206 (92.4%) | 17 (7.6%) |
| 65 to 74 Years | 337 (100.0%) | 0 (0.0%) |
| 75 Years and older | 0 (0.0%) | 0 (0.0%) |
| Total | 1,740 (98.1%) | 34 (1.9%) |
Health Insurance Coverage by Citizenship Status in Stansberry Lake
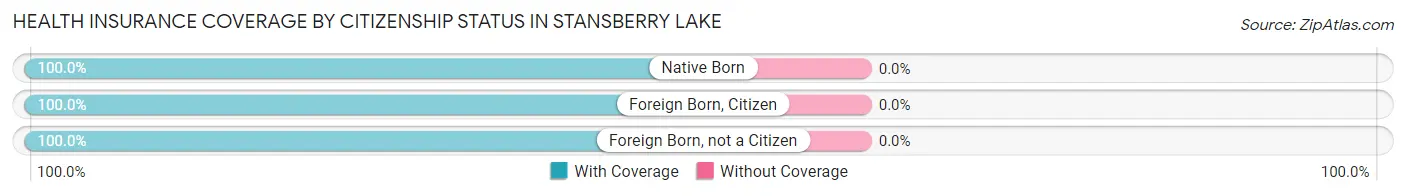
| Citizenship Status | With Coverage | Without Coverage |
| Native Born | 70 (100.0%) | 0 (0.0%) |
| Foreign Born, Citizen | 374 (100.0%) | 0 (0.0%) |
| Foreign Born, not a Citizen | 128 (100.0%) | 0 (0.0%) |
Health Insurance Coverage by Household Income in Stansberry Lake
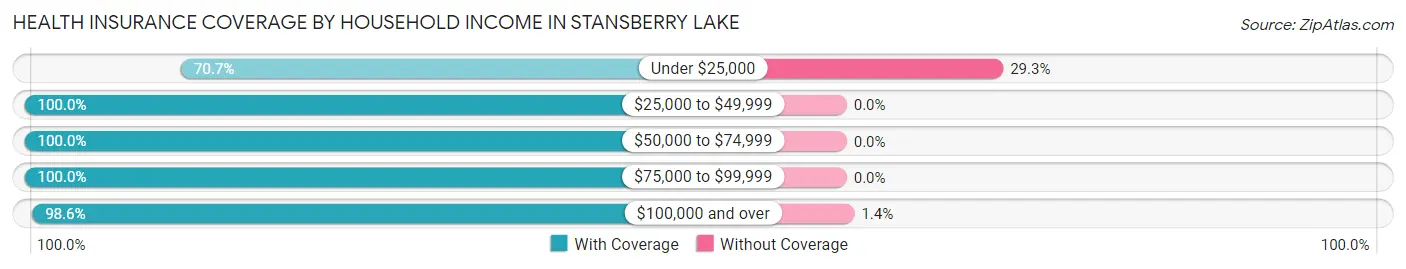
| Household Income | With Coverage | Without Coverage |
| Under $25,000 | 41 (70.7%) | 17 (29.3%) |
| $25,000 to $49,999 | 146 (100.0%) | 0 (0.0%) |
| $50,000 to $74,999 | 268 (100.0%) | 0 (0.0%) |
| $75,000 to $99,999 | 122 (100.0%) | 0 (0.0%) |
| $100,000 and over | 1,163 (98.6%) | 17 (1.4%) |
Public vs Private Health Insurance Coverage by Age in Stansberry Lake
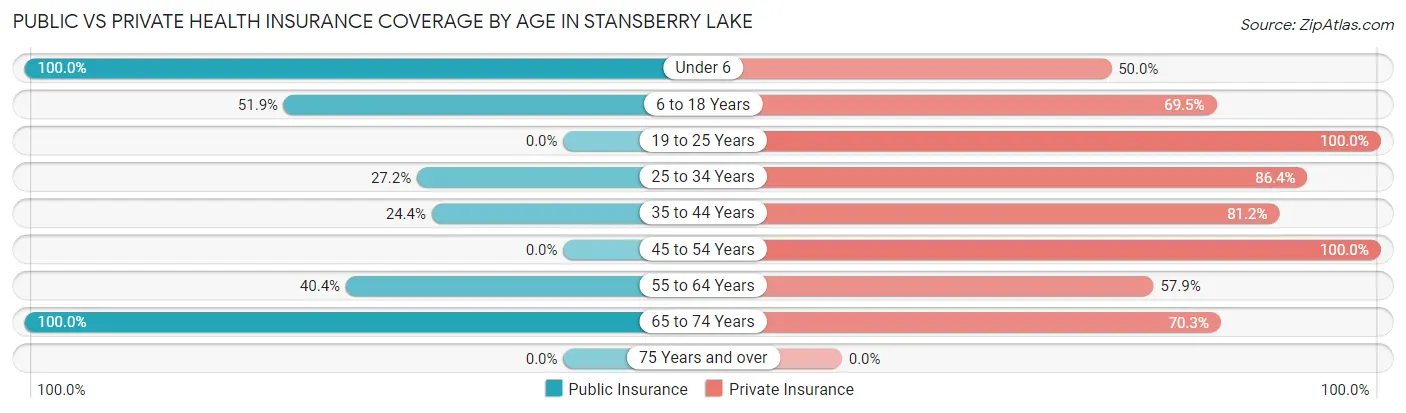
| Age Bracket | Public Insurance | Private Insurance |
| Under 6 | 70 (100.0%) | 35 (50.0%) |
| 6 to 18 Years | 194 (51.9%) | 260 (69.5%) |
| 19 to 25 Years | 0 (0.0%) | 128 (100.0%) |
| 25 to 34 Years | 72 (27.2%) | 229 (86.4%) |
| 35 to 44 Years | 74 (24.4%) | 246 (81.2%) |
| 45 to 54 Years | 0 (0.0%) | 74 (100.0%) |
| 55 to 64 Years | 90 (40.4%) | 129 (57.9%) |
| 65 to 74 Years | 337 (100.0%) | 237 (70.3%) |
| 75 Years and over | 0 (0.0%) | 0 (0.0%) |
| Total | 837 (47.2%) | 1,338 (75.4%) |
Disability Status by Sex by Age in Stansberry Lake
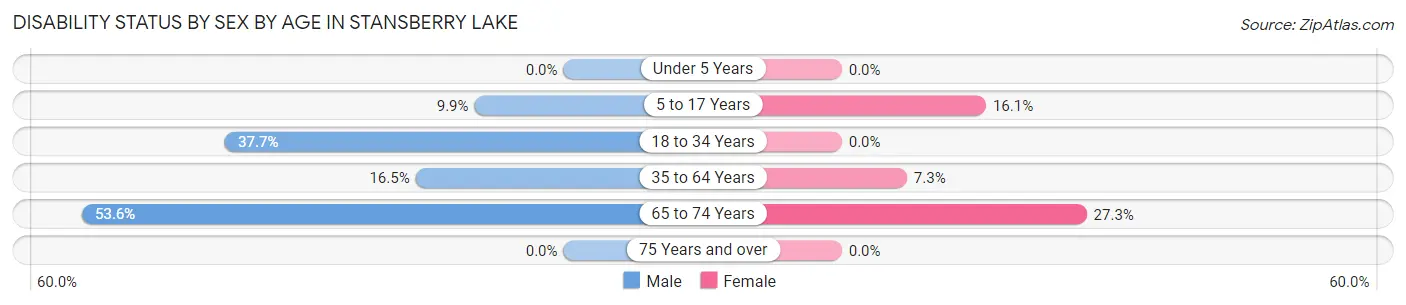
| Age Bracket | Male | Female |
| Under 5 Years | 0 (0.0%) | 0 (0.0%) |
| 5 to 17 Years | 21 (9.9%) | 22 (16.1%) |
| 18 to 34 Years | 90 (37.7%) | 0 (0.0%) |
| 35 to 64 Years | 42 (16.5%) | 25 (7.2%) |
| 65 to 74 Years | 104 (53.6%) | 39 (27.3%) |
| 75 Years and over | 0 (0.0%) | 0 (0.0%) |
Disability Class by Sex by Age in Stansberry Lake
Disability Class: Hearing Difficulty
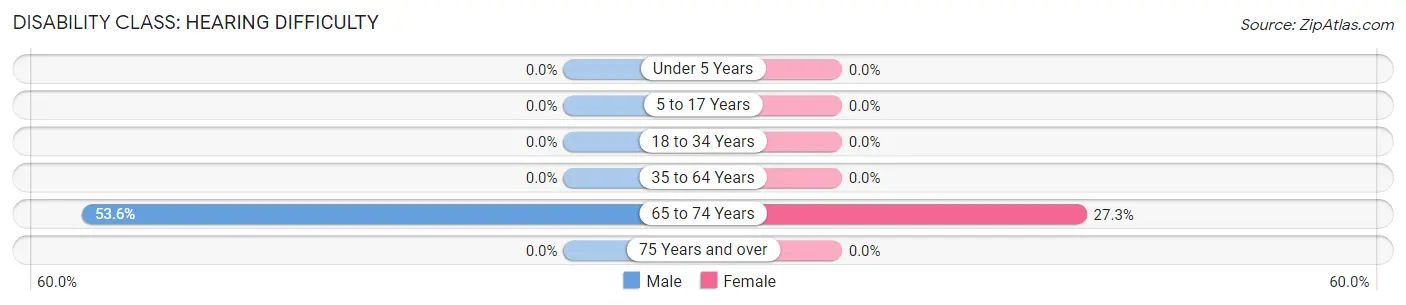
| Age Bracket | Male | Female |
| Under 5 Years | 0 (0.0%) | 0 (0.0%) |
| 5 to 17 Years | 0 (0.0%) | 0 (0.0%) |
| 18 to 34 Years | 0 (0.0%) | 0 (0.0%) |
| 35 to 64 Years | 0 (0.0%) | 0 (0.0%) |
| 65 to 74 Years | 104 (53.6%) | 39 (27.3%) |
| 75 Years and over | 0 (0.0%) | 0 (0.0%) |
Disability Class: Vision Difficulty
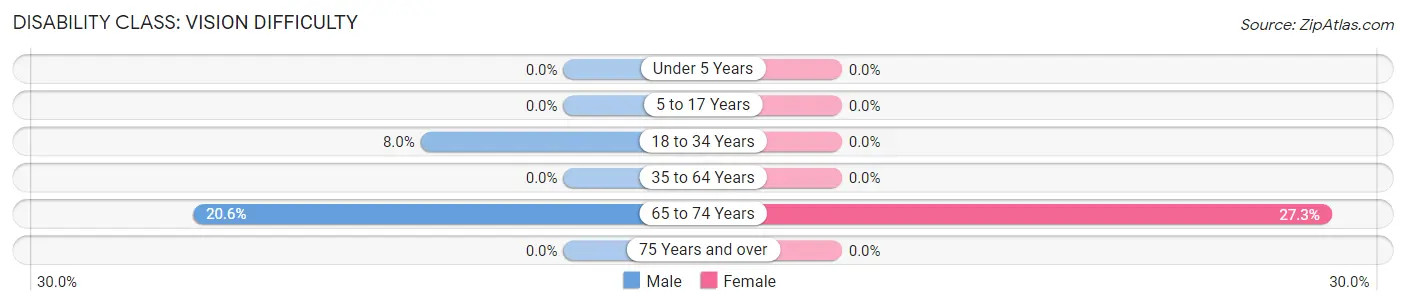
| Age Bracket | Male | Female |
| Under 5 Years | 0 (0.0%) | 0 (0.0%) |
| 5 to 17 Years | 0 (0.0%) | 0 (0.0%) |
| 18 to 34 Years | 19 (8.0%) | 0 (0.0%) |
| 35 to 64 Years | 0 (0.0%) | 0 (0.0%) |
| 65 to 74 Years | 40 (20.6%) | 39 (27.3%) |
| 75 Years and over | 0 (0.0%) | 0 (0.0%) |
Disability Class: Cognitive Difficulty
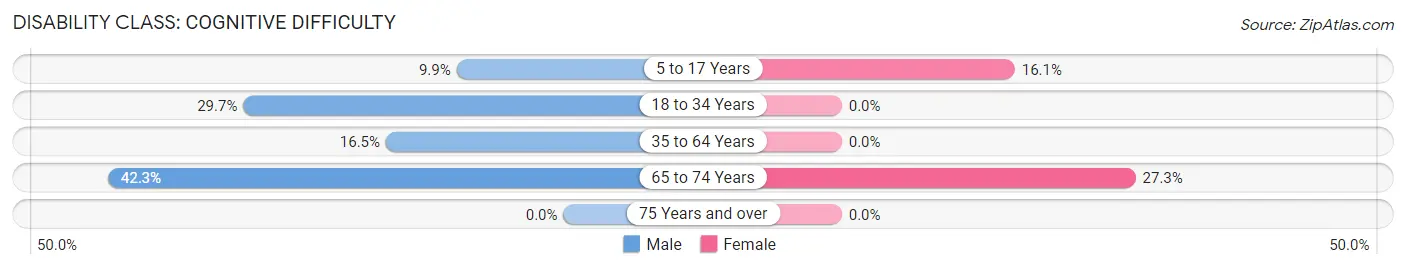
| Age Bracket | Male | Female |
| 5 to 17 Years | 21 (9.9%) | 22 (16.1%) |
| 18 to 34 Years | 71 (29.7%) | 0 (0.0%) |
| 35 to 64 Years | 42 (16.5%) | 0 (0.0%) |
| 65 to 74 Years | 82 (42.3%) | 39 (27.3%) |
| 75 Years and over | 0 (0.0%) | 0 (0.0%) |
Disability Class: Ambulatory Difficulty
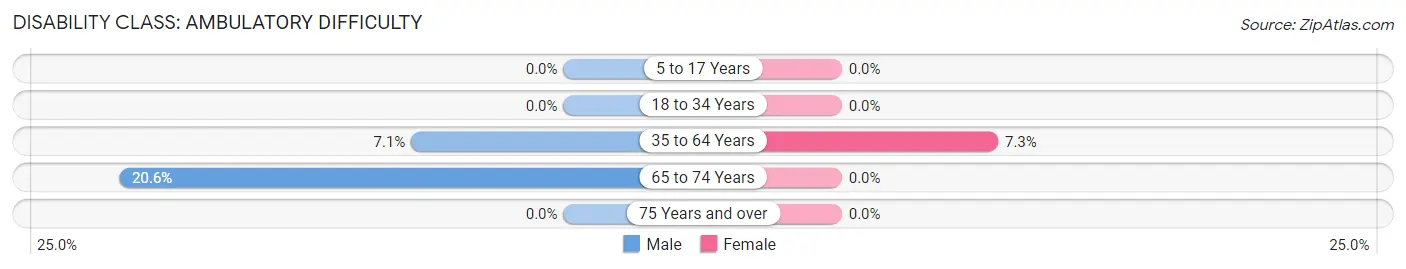
| Age Bracket | Male | Female |
| 5 to 17 Years | 0 (0.0%) | 0 (0.0%) |
| 18 to 34 Years | 0 (0.0%) | 0 (0.0%) |
| 35 to 64 Years | 18 (7.1%) | 25 (7.2%) |
| 65 to 74 Years | 40 (20.6%) | 0 (0.0%) |
| 75 Years and over | 0 (0.0%) | 0 (0.0%) |
Disability Class: Self-Care Difficulty

| Age Bracket | Male | Female |
| 5 to 17 Years | 0 (0.0%) | 0 (0.0%) |
| 18 to 34 Years | 0 (0.0%) | 0 (0.0%) |
| 35 to 64 Years | 18 (7.1%) | 25 (7.2%) |
| 65 to 74 Years | 40 (20.6%) | 0 (0.0%) |
| 75 Years and over | 0 (0.0%) | 0 (0.0%) |
Technology Access in Stansberry Lake
Computing Device Access in Stansberry Lake
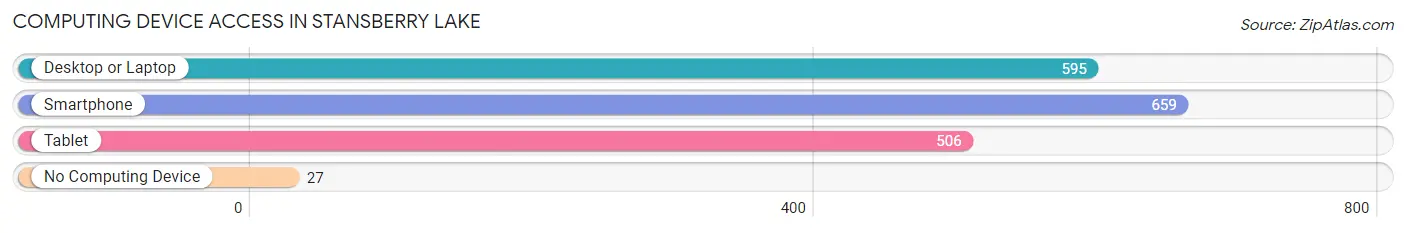
| Device Type | # Households | % Households |
| Desktop or Laptop | 595 | 86.7% |
| Smartphone | 659 | 96.1% |
| Tablet | 506 | 73.8% |
| No Computing Device | 27 | 3.9% |
| Total | 686 | 100.0% |
Internet Access in Stansberry Lake
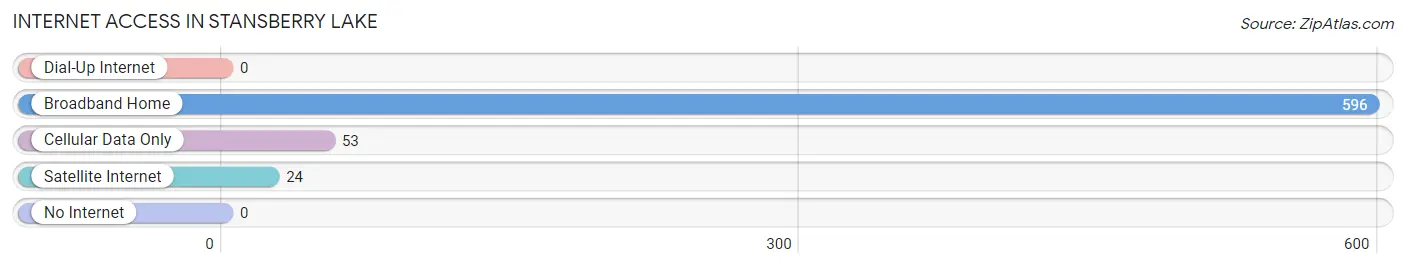
| Internet Type | # Households | % Households |
| Dial-Up Internet | 0 | 0.0% |
| Broadband Home | 596 | 86.9% |
| Cellular Data Only | 53 | 7.7% |
| Satellite Internet | 24 | 3.5% |
| No Internet | 0 | 0.0% |
| Total | 686 | 100.0% |
Stansberry Lake Summary
Stansberry Lake is a small lake located in the Cascade Mountains of Washington State. It is located in the Okanogan County, approximately 30 miles east of the city of Wenatchee. The lake is a popular destination for fishing, camping, and other outdoor activities.
Geography
Stansberry Lake is located in the Cascade Mountains of Washington State. It is located in the Okanogan County, approximately 30 miles east of the city of Wenatchee. The lake is situated at an elevation of 2,890 feet and has a surface area of approximately 1,000 acres. The lake is fed by several small streams and is surrounded by a dense forest of Douglas fir, western hemlock, and western red cedar. The lake is also home to a variety of wildlife, including deer, elk, bear, and bald eagles.
History
Stansberry Lake has been a popular destination for fishing, camping, and other outdoor activities for many years. The lake was first settled by Native Americans, who used the lake for fishing and hunting. In the late 1800s, the lake was used by settlers for logging and farming. In the early 1900s, the lake was used for recreational activities such as fishing and camping. In the 1950s, the lake was developed for recreational use, with the construction of a boat launch, campground, and picnic area.
Economy
Stansberry Lake is a popular destination for fishing, camping, and other outdoor activities. The lake is home to a variety of fish species, including rainbow trout, cutthroat trout, and kokanee salmon. The lake is also a popular destination for boating, swimming, and other water sports. The lake is surrounded by a dense forest, which provides opportunities for hunting, hiking, and other outdoor activities.
Demographics
Stansberry Lake is located in a rural area of Washington State. The population of the area is approximately 1,000 people. The majority of the population is white, with a small percentage of Native American and Hispanic residents. The median household income in the area is approximately $50,000. The area is served by several small towns, including Twisp, Winthrop, and Mazama.
Conclusion
Stansberry Lake is a small lake located in the Cascade Mountains of Washington State. It is a popular destination for fishing, camping, and other outdoor activities. The lake is surrounded by a dense forest and is home to a variety of wildlife. The area is served by several small towns and has a population of approximately 1,000 people. The lake is a popular destination for fishing, camping, and other outdoor activities, and provides opportunities for hunting, hiking, and other outdoor activities.
Common Questions
What is Per Capita Income in Stansberry Lake?
Per Capita income in Stansberry Lake is $48,457.
What is the Median Family Income in Stansberry Lake?
Median Family Income in Stansberry Lake is $141,302.
What is the Median Household income in Stansberry Lake?
Median Household Income in Stansberry Lake is $121,029.
What is Income or Wage Gap in Stansberry Lake?
Income or Wage Gap in Stansberry Lake is 13.3%.
Women in Stansberry Lake earn 86.7 cents for every dollar earned by a man.
What is Inequality or Gini Index in Stansberry Lake?
Inequality or Gini Index in Stansberry Lake is 0.39.
What is the Total Population of Stansberry Lake?
Total Population of Stansberry Lake is 1,810.
What is the Total Male Population of Stansberry Lake?
Total Male Population of Stansberry Lake is 952.
What is the Total Female Population of Stansberry Lake?
Total Female Population of Stansberry Lake is 858.
What is the Ratio of Males per 100 Females in Stansberry Lake?
There are 110.96 Males per 100 Females in Stansberry Lake.
What is the Ratio of Females per 100 Males in Stansberry Lake?
There are 90.13 Females per 100 Males in Stansberry Lake.
What is the Median Population Age in Stansberry Lake?
Median Population Age in Stansberry Lake is 38.3 Years.
What is the Average Family Size in Stansberry Lake
Average Family Size in Stansberry Lake is 3.1 People.
What is the Average Household Size in Stansberry Lake
Average Household Size in Stansberry Lake is 2.6 People.
How Large is the Labor Force in Stansberry Lake?
There are 896 People in the Labor Forcein in Stansberry Lake.
What is the Percentage of People in the Labor Force in Stansberry Lake?
61.5% of People are in the Labor Force in Stansberry Lake.
What is the Unemployment Rate in Stansberry Lake?
Unemployment Rate in Stansberry Lake is 6.3%.