Marietta Alderwood, WA Map & Demographics
Marietta Alderwood Map
Marietta Alderwood Overview
$49,467
PER CAPITA INCOME
$89,042
AVG FAMILY INCOME
$83,507
AVG HOUSEHOLD INCOME
18.9%
WAGE / INCOME GAP [ % ]
81.1¢/ $1
WAGE / INCOME GAP [ $ ]
$14,164
FAMILY INCOME DEFICIT
0.47
INEQUALITY / GINI INDEX
3,304
TOTAL POPULATION
1,650
MALE POPULATION
1,654
FEMALE POPULATION
99.76
MALES / 100 FEMALES
100.24
FEMALES / 100 MALES
41.1
MEDIAN AGE
2.6
AVG FAMILY SIZE
2.2
AVG HOUSEHOLD SIZE
1,806
LABOR FORCE [ PEOPLE ]
65.2%
PERCENT IN LABOR FORCE
4.3%
UNEMPLOYMENT RATE
Income in Marietta Alderwood
Income Overview in Marietta Alderwood
Per Capita Income in Marietta Alderwood is $49,467, while median incomes of families and households are $89,042 and $83,507 respectively.
| Characteristic | Number | Measure |
| Per Capita Income | 3,304 | $49,467 |
| Median Family Income | 835 | $89,042 |
| Mean Family Income | 835 | $126,728 |
| Median Household Income | 1,477 | $83,507 |
| Mean Household Income | 1,477 | $102,825 |
| Income Deficit | 835 | $14,164 |
| Wage / Income Gap (%) | 3,304 | 18.86% |
| Wage / Income Gap ($) | 3,304 | 81.14¢ per $1 |
| Gini / Inequality Index | 3,304 | 0.47 |
Earnings by Sex in Marietta Alderwood
Average Earnings in Marietta Alderwood are $52,917, $58,432 for men and $47,412 for women, a difference of 18.9%.
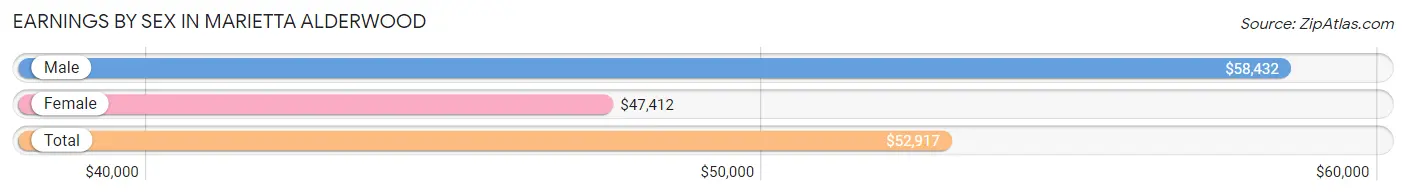
| Sex | Number | Average Earnings |
| Male | 913 (49.7%) | $58,432 |
| Female | 923 (50.3%) | $47,412 |
| Total | 1,836 (100.0%) | $52,917 |
Earnings by Sex by Income Bracket in Marietta Alderwood
The most common earnings brackets in Marietta Alderwood are $55,000 to $64,999 for men (201 | 22.0%) and $55,000 to $64,999 for women (213 | 23.1%).
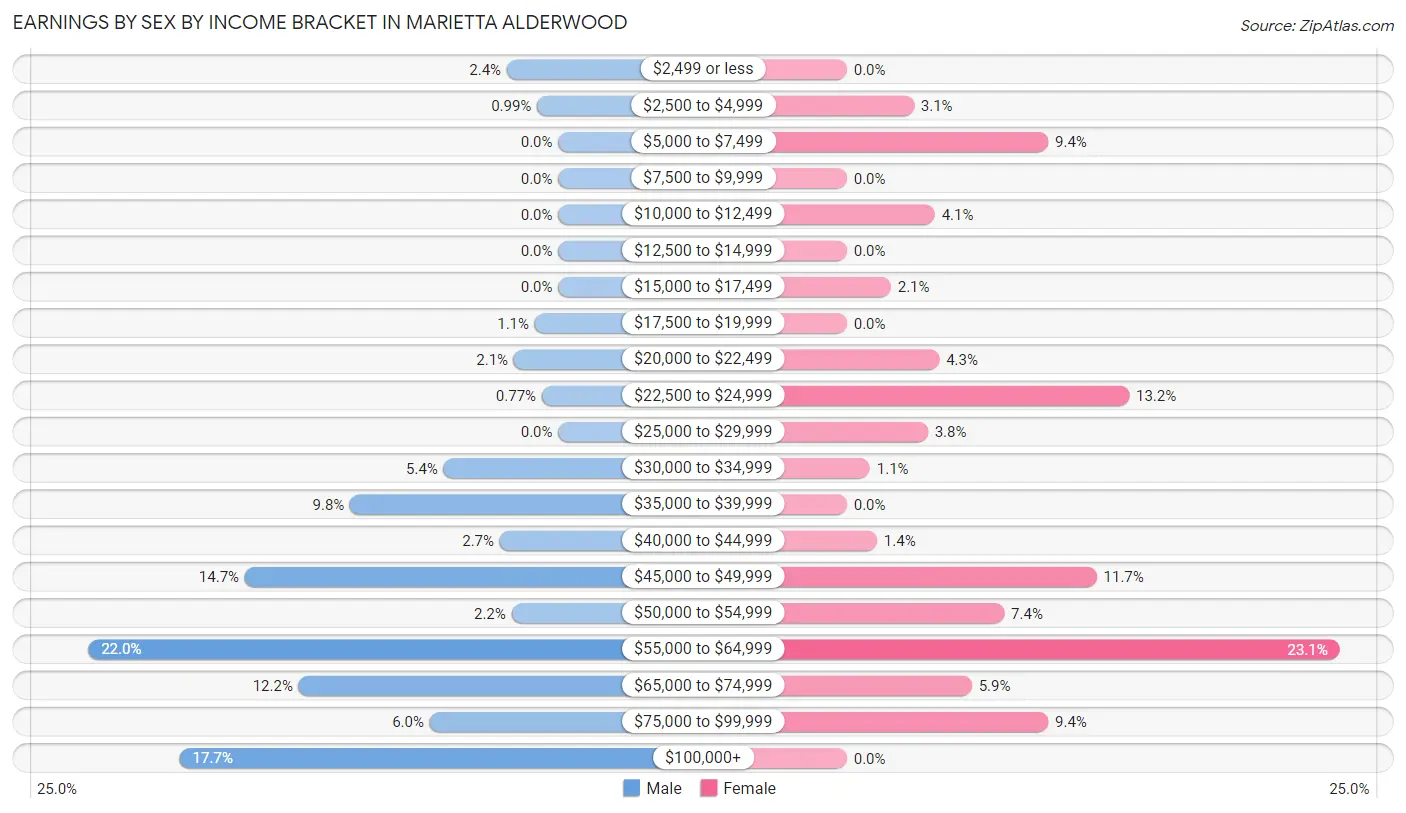
| Income | Male | Female |
| $2,499 or less | 22 (2.4%) | 0 (0.0%) |
| $2,500 to $4,999 | 9 (1.0%) | 29 (3.1%) |
| $5,000 to $7,499 | 0 (0.0%) | 87 (9.4%) |
| $7,500 to $9,999 | 0 (0.0%) | 0 (0.0%) |
| $10,000 to $12,499 | 0 (0.0%) | 38 (4.1%) |
| $12,500 to $14,999 | 0 (0.0%) | 0 (0.0%) |
| $15,000 to $17,499 | 0 (0.0%) | 19 (2.1%) |
| $17,500 to $19,999 | 10 (1.1%) | 0 (0.0%) |
| $20,000 to $22,499 | 19 (2.1%) | 40 (4.3%) |
| $22,500 to $24,999 | 7 (0.8%) | 122 (13.2%) |
| $25,000 to $29,999 | 0 (0.0%) | 35 (3.8%) |
| $30,000 to $34,999 | 49 (5.4%) | 10 (1.1%) |
| $35,000 to $39,999 | 89 (9.8%) | 0 (0.0%) |
| $40,000 to $44,999 | 25 (2.7%) | 13 (1.4%) |
| $45,000 to $49,999 | 134 (14.7%) | 108 (11.7%) |
| $50,000 to $54,999 | 20 (2.2%) | 68 (7.4%) |
| $55,000 to $64,999 | 201 (22.0%) | 213 (23.1%) |
| $65,000 to $74,999 | 111 (12.2%) | 54 (5.9%) |
| $75,000 to $99,999 | 55 (6.0%) | 87 (9.4%) |
| $100,000+ | 162 (17.7%) | 0 (0.0%) |
| Total | 913 (100.0%) | 923 (100.0%) |
Earnings by Sex by Educational Attainment in Marietta Alderwood
Average earnings in Marietta Alderwood are $58,284 for men and $47,394 for women, a difference of 18.7%. Men with an educational attainment of bachelor's degree enjoy the highest average annual earnings of $67,784, while those with high school diploma education earn the least with $48,750. Women with an educational attainment of bachelor's degree earn the most with the average annual earnings of $60,625, while those with college or associate's degree education have the smallest earnings of $46,864.
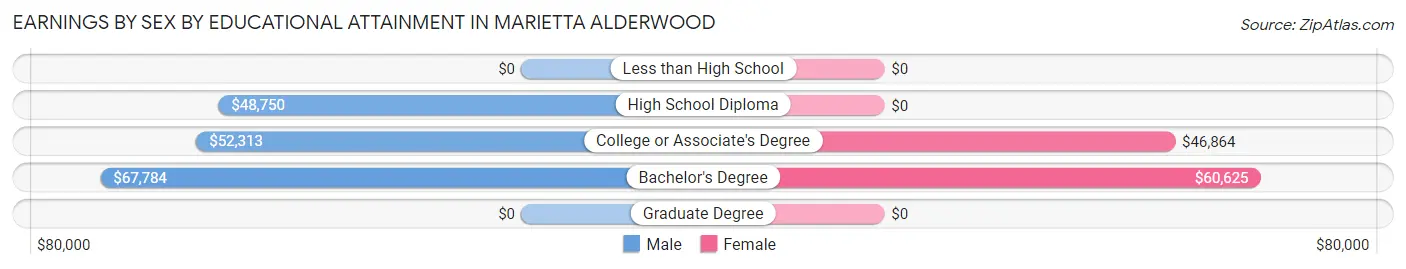
| Educational Attainment | Male Income | Female Income |
| Less than High School | - | - |
| High School Diploma | $48,750 | $0 |
| College or Associate's Degree | $52,313 | $46,864 |
| Bachelor's Degree | $67,784 | $60,625 |
| Graduate Degree | - | - |
| Total | $58,284 | $47,394 |
Family Income in Marietta Alderwood
Family Income Brackets in Marietta Alderwood
According to the Marietta Alderwood family income data, there are 203 families falling into the $75,000 to $99,999 income range, which is the most common income bracket and makes up 24.3% of all families.
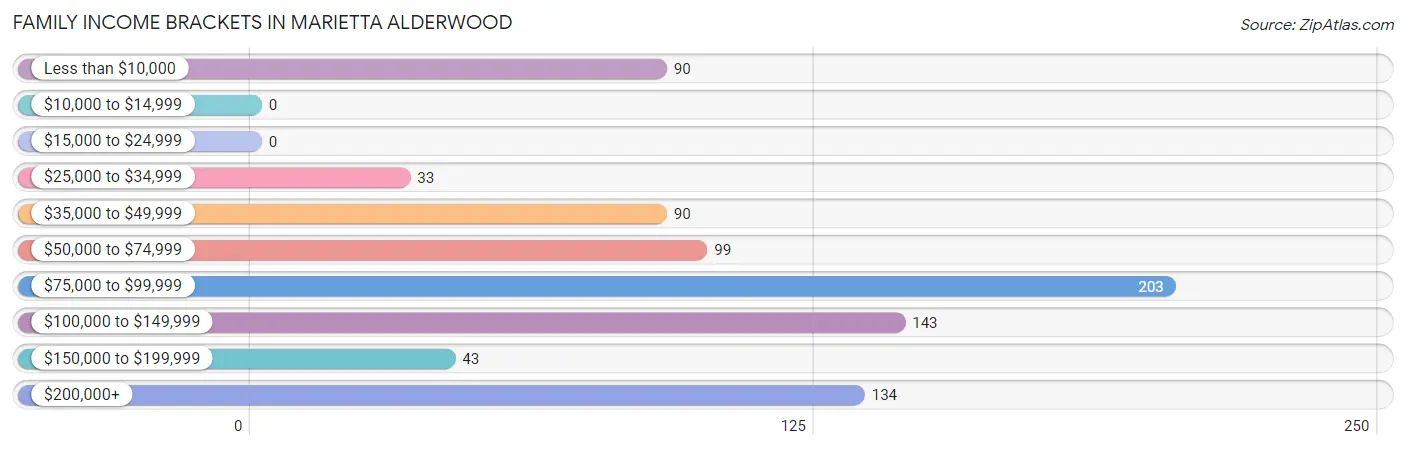
| Income Bracket | # Families | % Families |
| Less than $10,000 | 90 | 10.8% |
| $10,000 to $14,999 | 0 | 0.0% |
| $15,000 to $24,999 | 0 | 0.0% |
| $25,000 to $34,999 | 33 | 4.0% |
| $35,000 to $49,999 | 90 | 10.8% |
| $50,000 to $74,999 | 99 | 11.9% |
| $75,000 to $99,999 | 203 | 24.3% |
| $100,000 to $149,999 | 143 | 17.1% |
| $150,000 to $199,999 | 43 | 5.1% |
| $200,000+ | 134 | 16.0% |
Family Income by Famaliy Size in Marietta Alderwood
5-person families (67 | 8.0%) account for the highest median family income in Marietta Alderwood with $127,961 per family, while 2-person families (514 | 61.6%) have the highest median income of $44,375 per family member.
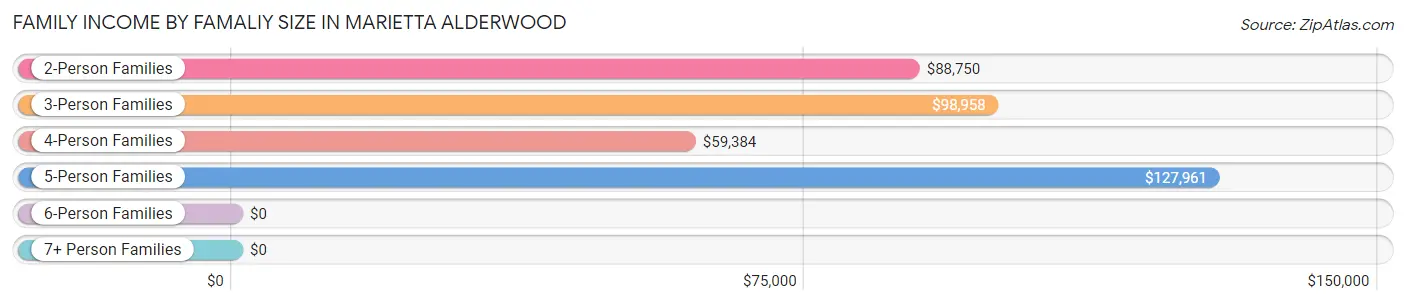
| Income Bracket | # Families | Median Income |
| 2-Person Families | 514 (61.6%) | $88,750 |
| 3-Person Families | 127 (15.2%) | $98,958 |
| 4-Person Families | 127 (15.2%) | $59,384 |
| 5-Person Families | 67 (8.0%) | $127,961 |
| 6-Person Families | 0 (0.0%) | $0 |
| 7+ Person Families | 0 (0.0%) | $0 |
| Total | 835 (100.0%) | $89,042 |
Family Income by Number of Earners in Marietta Alderwood
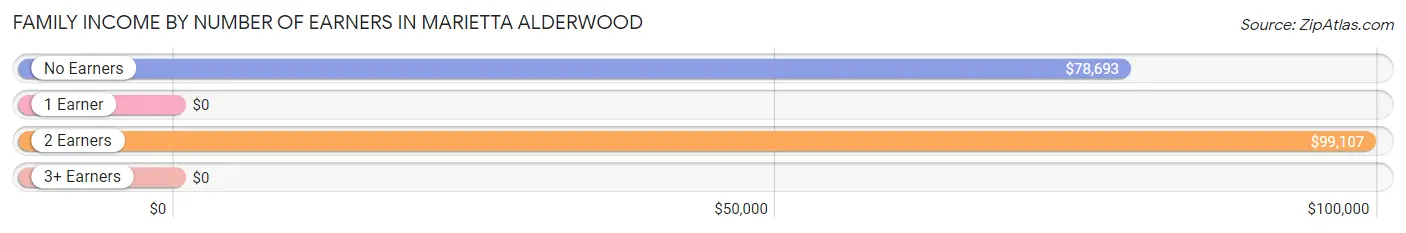
| Number of Earners | # Families | Median Income |
| No Earners | 243 (29.1%) | $78,693 |
| 1 Earner | 163 (19.5%) | $0 |
| 2 Earners | 422 (50.5%) | $99,107 |
| 3+ Earners | 7 (0.8%) | $0 |
| Total | 835 (100.0%) | $89,042 |
Household Income in Marietta Alderwood
Household Income Brackets in Marietta Alderwood
With 318 households falling in the category, the $100,000 to $149,999 income range is the most frequent in Marietta Alderwood, accounting for 21.5% of all households. In contrast, only 44 households (3.0%) fall into the $10,000 to $14,999 income bracket, making it the least populous group.
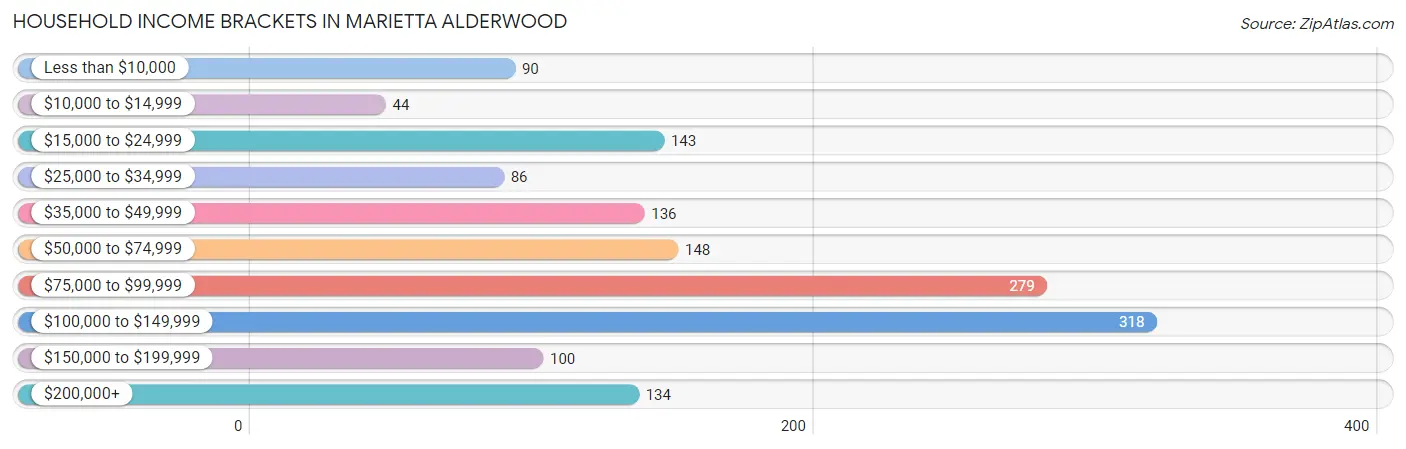
| Income Bracket | # Households | % Households |
| Less than $10,000 | 90 | 6.1% |
| $10,000 to $14,999 | 44 | 3.0% |
| $15,000 to $24,999 | 143 | 9.7% |
| $25,000 to $34,999 | 86 | 5.8% |
| $35,000 to $49,999 | 136 | 9.2% |
| $50,000 to $74,999 | 148 | 10.0% |
| $75,000 to $99,999 | 279 | 18.9% |
| $100,000 to $149,999 | 318 | 21.5% |
| $150,000 to $199,999 | 100 | 6.8% |
| $200,000+ | 134 | 9.1% |
Household Income by Householder Age in Marietta Alderwood
The median household income in Marietta Alderwood is $83,507, with the highest median household income of $86,500 found in the 65+ years age bracket for the primary householder. A total of 448 households (30.3%) fall into this category. Meanwhile, the 15 to 24 years age bracket for the primary householder has the lowest median household income of $0, with 211 households (14.3%) in this group.
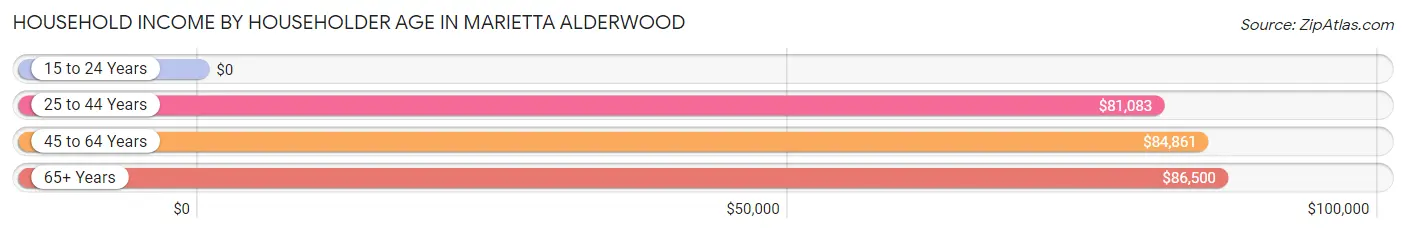
| Income Bracket | # Households | Median Income |
| 15 to 24 Years | 211 (14.3%) | $0 |
| 25 to 44 Years | 424 (28.7%) | $81,083 |
| 45 to 64 Years | 394 (26.7%) | $84,861 |
| 65+ Years | 448 (30.3%) | $86,500 |
| Total | 1,477 (100.0%) | $83,507 |
Poverty in Marietta Alderwood
Income Below Poverty by Sex and Age in Marietta Alderwood
With 6.9% poverty level for males and 16.3% for females among the residents of Marietta Alderwood, 12 to 14 year old males and 6 to 11 year old females are the most vulnerable to poverty, with 36 males (32.1%) and 44 females (67.7%) in their respective age groups living below the poverty level.
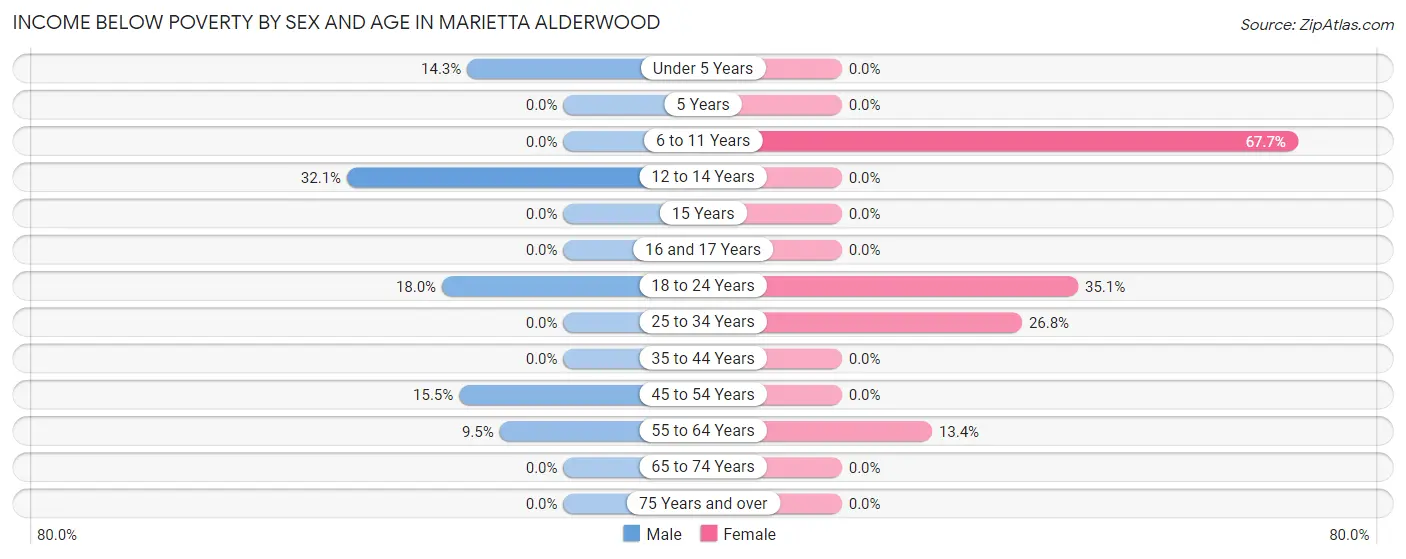
| Age Bracket | Male | Female |
| Under 5 Years | 12 (14.3%) | 0 (0.0%) |
| 5 Years | 0 (0.0%) | 0 (0.0%) |
| 6 to 11 Years | 0 (0.0%) | 44 (67.7%) |
| 12 to 14 Years | 36 (32.1%) | 0 (0.0%) |
| 15 Years | 0 (0.0%) | 0 (0.0%) |
| 16 and 17 Years | 0 (0.0%) | 0 (0.0%) |
| 18 to 24 Years | 22 (18.0%) | 134 (35.1%) |
| 25 to 34 Years | 0 (0.0%) | 61 (26.8%) |
| 35 to 44 Years | 0 (0.0%) | 0 (0.0%) |
| 45 to 54 Years | 26 (15.5%) | 0 (0.0%) |
| 55 to 64 Years | 18 (9.5%) | 30 (13.4%) |
| 65 to 74 Years | 0 (0.0%) | 0 (0.0%) |
| 75 Years and over | 0 (0.0%) | 0 (0.0%) |
| Total | 114 (6.9%) | 269 (16.3%) |
Income Above Poverty by Sex and Age in Marietta Alderwood
According to the poverty statistics in Marietta Alderwood, males aged 6 to 11 years and females aged under 5 years are the age groups that are most secure financially, with 100.0% of males and 100.0% of females in these age groups living above the poverty line.
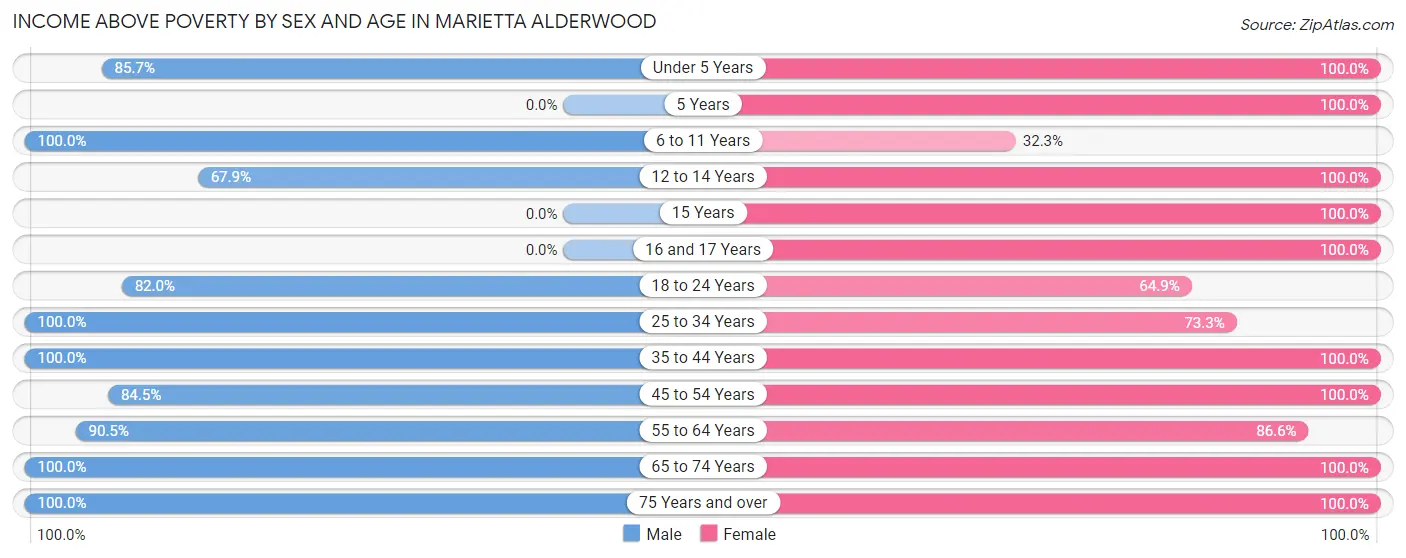
| Age Bracket | Male | Female |
| Under 5 Years | 72 (85.7%) | 30 (100.0%) |
| 5 Years | 0 (0.0%) | 33 (100.0%) |
| 6 to 11 Years | 127 (100.0%) | 21 (32.3%) |
| 12 to 14 Years | 76 (67.9%) | 22 (100.0%) |
| 15 Years | 0 (0.0%) | 61 (100.0%) |
| 16 and 17 Years | 0 (0.0%) | 8 (100.0%) |
| 18 to 24 Years | 100 (82.0%) | 248 (64.9%) |
| 25 to 34 Years | 109 (100.0%) | 167 (73.3%) |
| 35 to 44 Years | 346 (100.0%) | 153 (100.0%) |
| 45 to 54 Years | 142 (84.5%) | 144 (100.0%) |
| 55 to 64 Years | 172 (90.5%) | 194 (86.6%) |
| 65 to 74 Years | 237 (100.0%) | 190 (100.0%) |
| 75 Years and over | 155 (100.0%) | 114 (100.0%) |
| Total | 1,536 (93.1%) | 1,385 (83.7%) |
Income Below Poverty Among Married-Couple Families in Marietta Alderwood
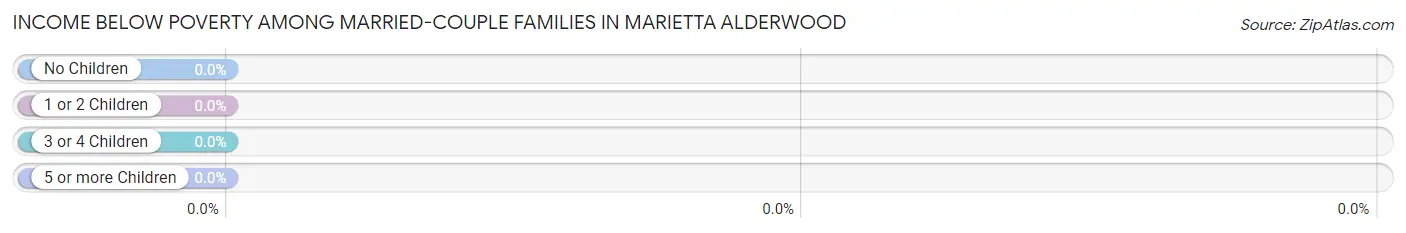
| Children | Above Poverty | Below Poverty |
| No Children | 384 (100.0%) | 0 (0.0%) |
| 1 or 2 Children | 185 (100.0%) | 0 (0.0%) |
| 3 or 4 Children | 49 (100.0%) | 0 (0.0%) |
| 5 or more Children | 0 (0.0%) | 0 (0.0%) |
| Total | 618 (100.0%) | 0 (0.0%) |
Income Below Poverty Among Single-Parent Households in Marietta Alderwood
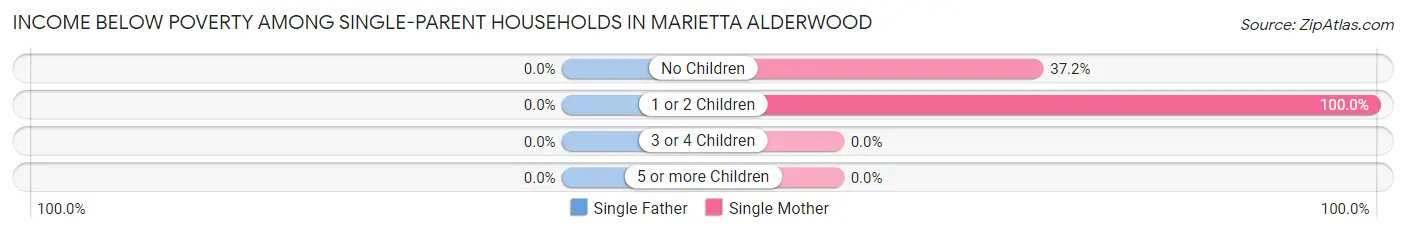
| Children | Single Father | Single Mother |
| No Children | 0 (0.0%) | 29 (37.2%) |
| 1 or 2 Children | 0 (0.0%) | 61 (100.0%) |
| 3 or 4 Children | 0 (0.0%) | 0 (0.0%) |
| 5 or more Children | 0 (0.0%) | 0 (0.0%) |
| Total | 0 (0.0%) | 90 (64.7%) |
Income Below Poverty Among Married-Couple vs Single-Parent Households in Marietta Alderwood
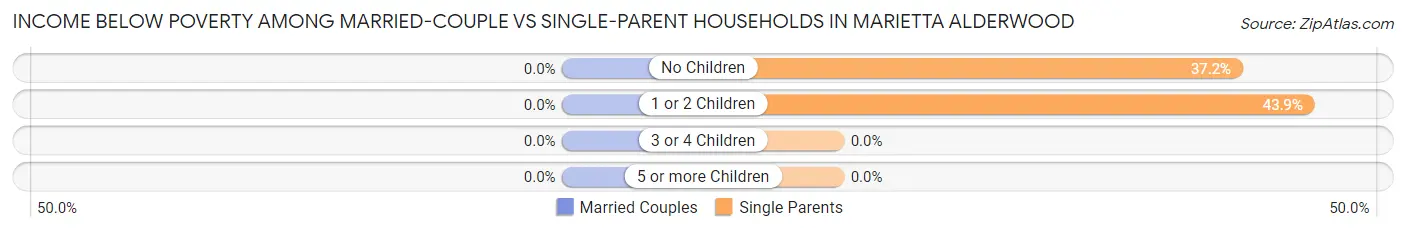
| Children | Married-Couple Families | Single-Parent Households |
| No Children | 0 (0.0%) | 29 (37.2%) |
| 1 or 2 Children | 0 (0.0%) | 61 (43.9%) |
| 3 or 4 Children | 0 (0.0%) | 0 (0.0%) |
| 5 or more Children | 0 (0.0%) | 0 (0.0%) |
| Total | 0 (0.0%) | 90 (41.5%) |
Race in Marietta Alderwood
The most populous races in Marietta Alderwood are White / Caucasian (2,518 | 76.2%), Hispanic or Latino (329 | 10.0%), and Some other Race (329 | 10.0%).
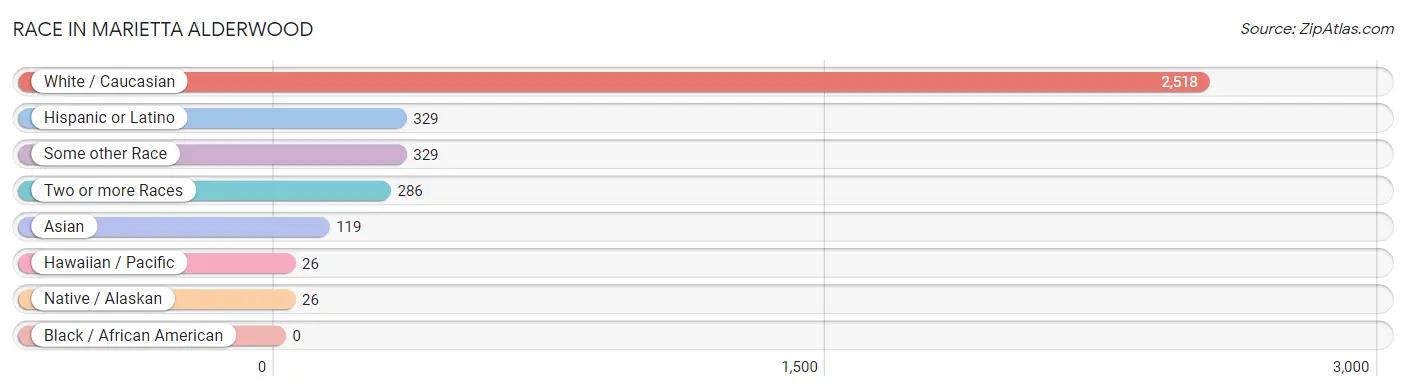
| Race | # Population | % Population |
| Asian | 119 | 3.6% |
| Black / African American | 0 | 0.0% |
| Hawaiian / Pacific | 26 | 0.8% |
| Hispanic or Latino | 329 | 10.0% |
| Native / Alaskan | 26 | 0.8% |
| White / Caucasian | 2,518 | 76.2% |
| Two or more Races | 286 | 8.7% |
| Some other Race | 329 | 10.0% |
| Total | 3,304 | 100.0% |
Ancestry in Marietta Alderwood
The most populous ancestries reported in Marietta Alderwood are Irish (627 | 19.0%), Norwegian (441 | 13.4%), German (408 | 12.3%), English (333 | 10.1%), and Mexican (329 | 10.0%), together accounting for 64.7% of all Marietta Alderwood residents.
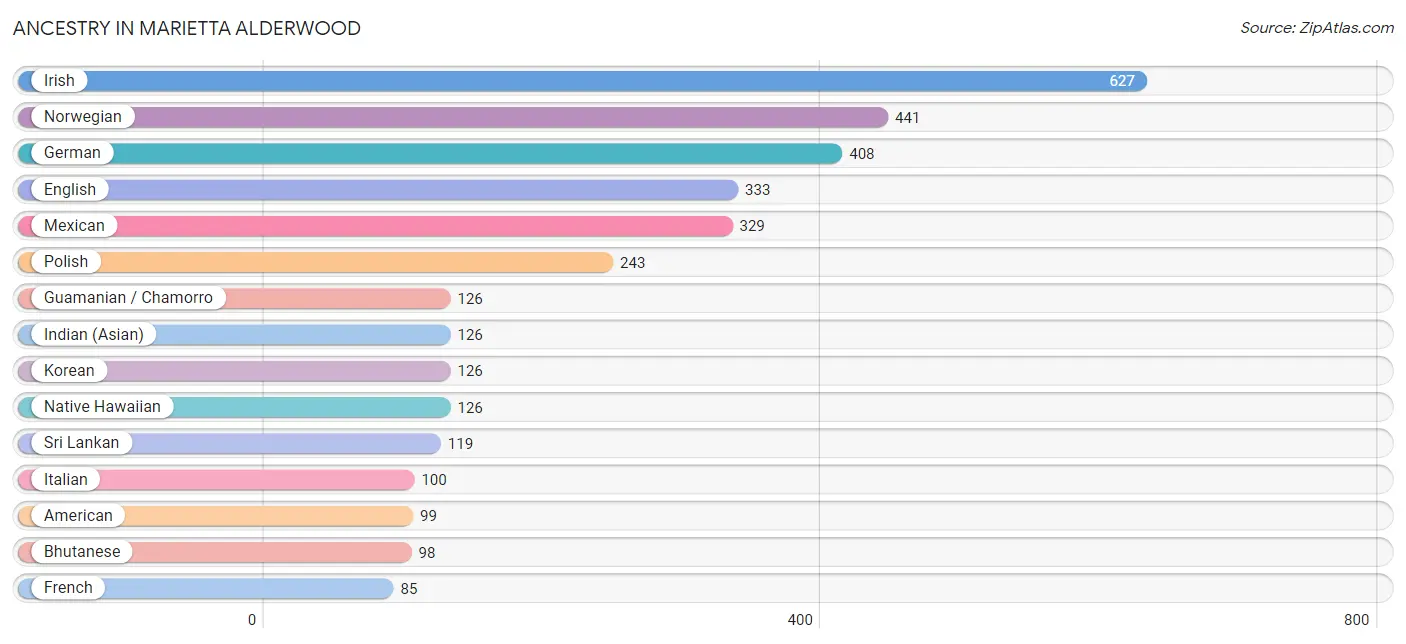
| Ancestry | # Population | % Population |
| Alaska Native | 46 | 1.4% |
| Alaskan Athabascan | 47 | 1.4% |
| American | 99 | 3.0% |
| Austrian | 20 | 0.6% |
| Bhutanese | 98 | 3.0% |
| British | 37 | 1.1% |
| Burmese | 25 | 0.8% |
| Canadian | 30 | 0.9% |
| Cherokee | 5 | 0.2% |
| Czech | 30 | 0.9% |
| Czechoslovakian | 13 | 0.4% |
| Danish | 26 | 0.8% |
| Dutch | 65 | 2.0% |
| English | 333 | 10.1% |
| European | 23 | 0.7% |
| French | 85 | 2.6% |
| French Canadian | 45 | 1.4% |
| German | 408 | 12.3% |
| Guamanian / Chamorro | 126 | 3.8% |
| Hungarian | 27 | 0.8% |
| Indian (Asian) | 126 | 3.8% |
| Irish | 627 | 19.0% |
| Italian | 100 | 3.0% |
| Korean | 126 | 3.8% |
| Lithuanian | 16 | 0.5% |
| Mexican | 329 | 10.0% |
| Native Hawaiian | 126 | 3.8% |
| Norwegian | 441 | 13.4% |
| Polish | 243 | 7.3% |
| Russian | 16 | 0.5% |
| Samoan | 26 | 0.8% |
| Scandinavian | 43 | 1.3% |
| Scottish | 44 | 1.3% |
| Sri Lankan | 119 | 3.6% |
| Swedish | 52 | 1.6% |
| Ukrainian | 17 | 0.5% |
| Welsh | 31 | 0.9% | View All 37 Rows |
Immigrants in Marietta Alderwood
The most numerous immigrant groups reported in Marietta Alderwood came from Central America (168 | 5.1%), Latin America (168 | 5.1%), Mexico (168 | 5.1%), Canada (57 | 1.7%), and Asia (50 | 1.5%), together accounting for 18.5% of all Marietta Alderwood residents.
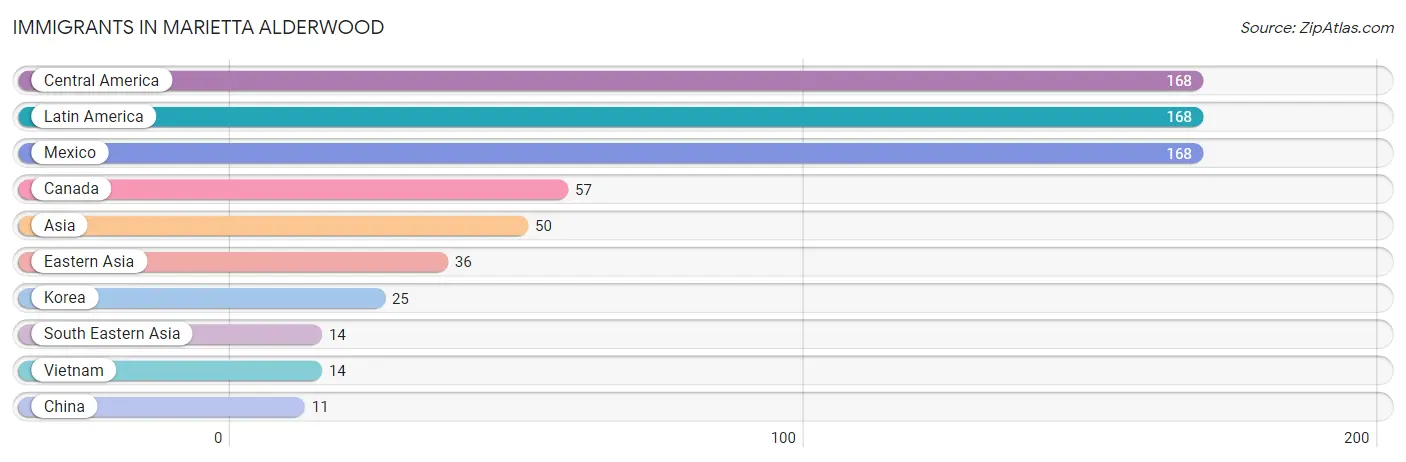
| Immigration Origin | # Population | % Population |
| Asia | 50 | 1.5% |
| Canada | 57 | 1.7% |
| Central America | 168 | 5.1% |
| China | 11 | 0.3% |
| Eastern Asia | 36 | 1.1% |
| Korea | 25 | 0.8% |
| Latin America | 168 | 5.1% |
| Mexico | 168 | 5.1% |
| South Eastern Asia | 14 | 0.4% |
| Vietnam | 14 | 0.4% | View All 10 Rows |
Sex and Age in Marietta Alderwood
Sex and Age in Marietta Alderwood
The most populous age groups in Marietta Alderwood are 40 to 44 Years (244 | 14.8%) for men and 20 to 24 Years (347 | 21.0%) for women.
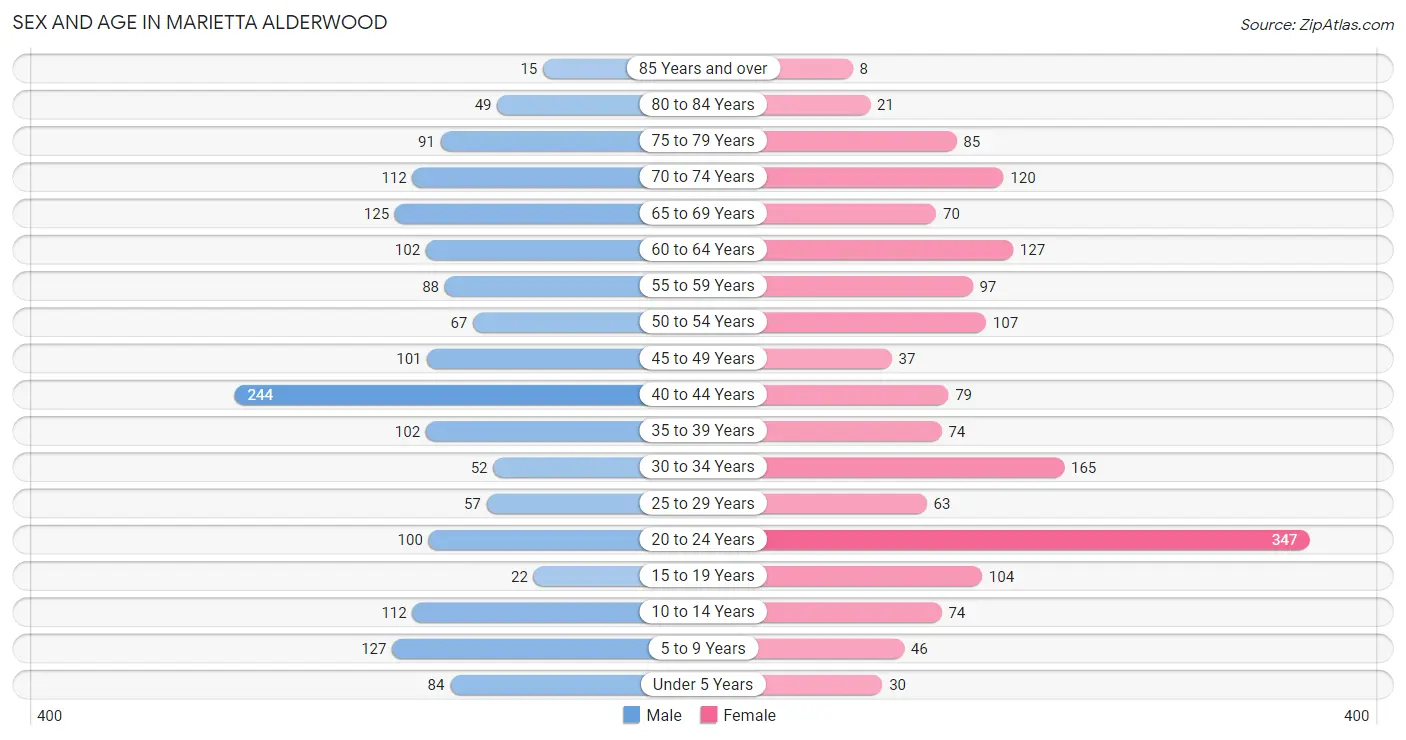
| Age Bracket | Male | Female |
| Under 5 Years | 84 (5.1%) | 30 (1.8%) |
| 5 to 9 Years | 127 (7.7%) | 46 (2.8%) |
| 10 to 14 Years | 112 (6.8%) | 74 (4.5%) |
| 15 to 19 Years | 22 (1.3%) | 104 (6.3%) |
| 20 to 24 Years | 100 (6.1%) | 347 (21.0%) |
| 25 to 29 Years | 57 (3.5%) | 63 (3.8%) |
| 30 to 34 Years | 52 (3.2%) | 165 (10.0%) |
| 35 to 39 Years | 102 (6.2%) | 74 (4.5%) |
| 40 to 44 Years | 244 (14.8%) | 79 (4.8%) |
| 45 to 49 Years | 101 (6.1%) | 37 (2.2%) |
| 50 to 54 Years | 67 (4.1%) | 107 (6.5%) |
| 55 to 59 Years | 88 (5.3%) | 97 (5.9%) |
| 60 to 64 Years | 102 (6.2%) | 127 (7.7%) |
| 65 to 69 Years | 125 (7.6%) | 70 (4.2%) |
| 70 to 74 Years | 112 (6.8%) | 120 (7.3%) |
| 75 to 79 Years | 91 (5.5%) | 85 (5.1%) |
| 80 to 84 Years | 49 (3.0%) | 21 (1.3%) |
| 85 Years and over | 15 (0.9%) | 8 (0.5%) |
| Total | 1,650 (100.0%) | 1,654 (100.0%) |
Families and Households in Marietta Alderwood
Median Family Size in Marietta Alderwood
The median family size in Marietta Alderwood is 2.62 persons per family, with married-couple families (618 | 74.0%) accounting for the largest median family size of 2.72 persons per family. On the other hand, single female/mother families (139 | 16.7%) represent the smallest median family size with 2.21 persons per family.
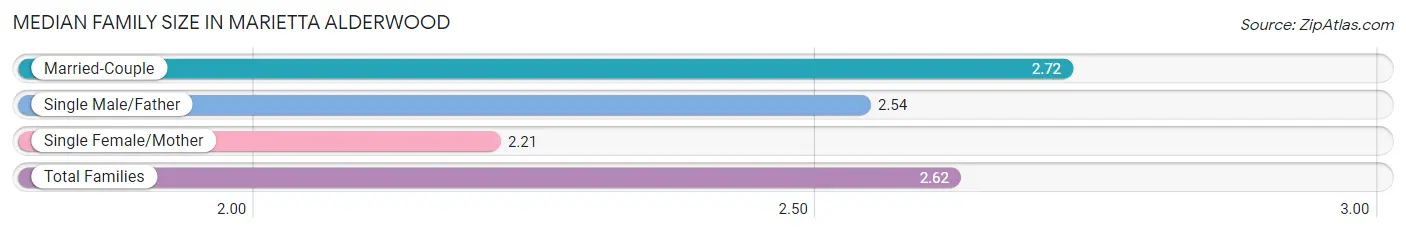
| Family Type | # Families | Family Size |
| Married-Couple | 618 (74.0%) | 2.72 |
| Single Male/Father | 78 (9.3%) | 2.54 |
| Single Female/Mother | 139 (16.7%) | 2.21 |
| Total Families | 835 (100.0%) | 2.62 |
Median Household Size in Marietta Alderwood
The median household size in Marietta Alderwood is 2.24 persons per household, with married-couple households (618 | 41.8%) accounting for the largest median household size of 2.76 persons per household. non-family households (642 | 43.5%) represent the smallest median household size with 1.66 persons per household.
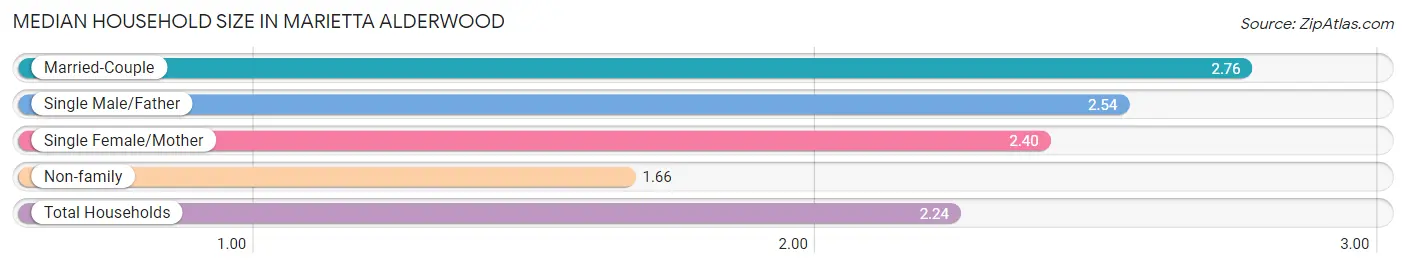
| Household Type | # Households | Household Size |
| Married-Couple | 618 (41.8%) | 2.76 |
| Single Male/Father | 78 (5.3%) | 2.54 |
| Single Female/Mother | 139 (9.4%) | 2.40 |
| Non-family | 642 (43.5%) | 1.66 |
| Total Households | 1,477 (100.0%) | 2.24 |
Household Size by Marriage Status in Marietta Alderwood
Out of a total of 1,477 households in Marietta Alderwood, 835 (56.5%) are family households, while 642 (43.5%) are nonfamily households. The most numerous type of family households are 2-person households, comprising 463, and the most common type of nonfamily households are 1-person households, comprising 359.
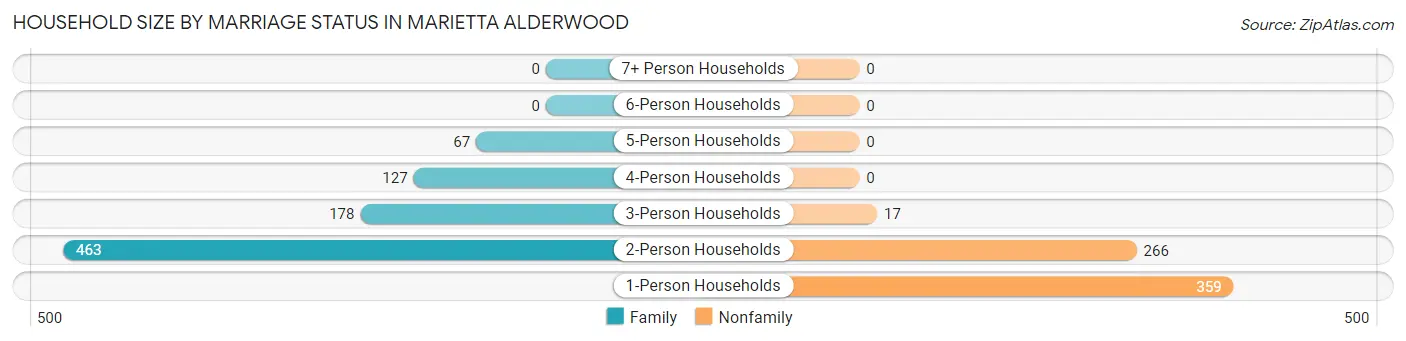
| Household Size | Family Households | Nonfamily Households |
| 1-Person Households | - | 359 (24.3%) |
| 2-Person Households | 463 (31.4%) | 266 (18.0%) |
| 3-Person Households | 178 (12.0%) | 17 (1.1%) |
| 4-Person Households | 127 (8.6%) | 0 (0.0%) |
| 5-Person Households | 67 (4.5%) | 0 (0.0%) |
| 6-Person Households | 0 (0.0%) | 0 (0.0%) |
| 7+ Person Households | 0 (0.0%) | 0 (0.0%) |
| Total | 835 (56.5%) | 642 (43.5%) |
Female Fertility in Marietta Alderwood
Fertility by Age in Marietta Alderwood
Average fertility rate in Marietta Alderwood is 55.0 births per 1,000 women. Women in the age bracket of 35 to 50 years have the highest fertility rate with 140.0 births per 1,000 women. Women in the age bracket of 35 to 50 years acount for 61.2% of all women with births.
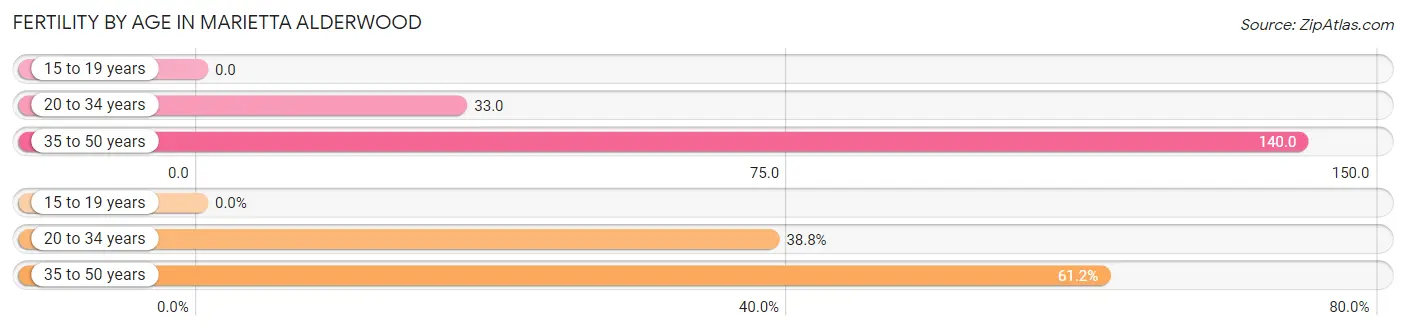
| Age Bracket | Women with Births | Births / 1,000 Women |
| 15 to 19 years | 0 (0.0%) | 0.0 |
| 20 to 34 years | 19 (38.8%) | 33.0 |
| 35 to 50 years | 30 (61.2%) | 140.0 |
| Total | 49 (100.0%) | 55.0 |
Fertility by Age by Marriage Status in Marietta Alderwood
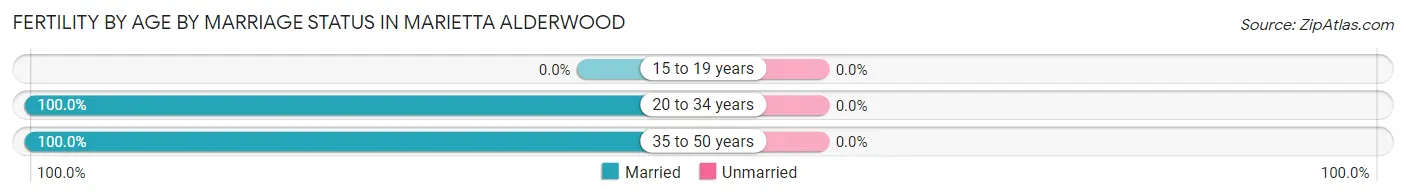
| Age Bracket | Married | Unmarried |
| 15 to 19 years | 0 (0.0%) | 0 (0.0%) |
| 20 to 34 years | 19 (100.0%) | 0 (0.0%) |
| 35 to 50 years | 30 (100.0%) | 0 (0.0%) |
| Total | 49 (100.0%) | 0 (0.0%) |
Fertility by Education in Marietta Alderwood
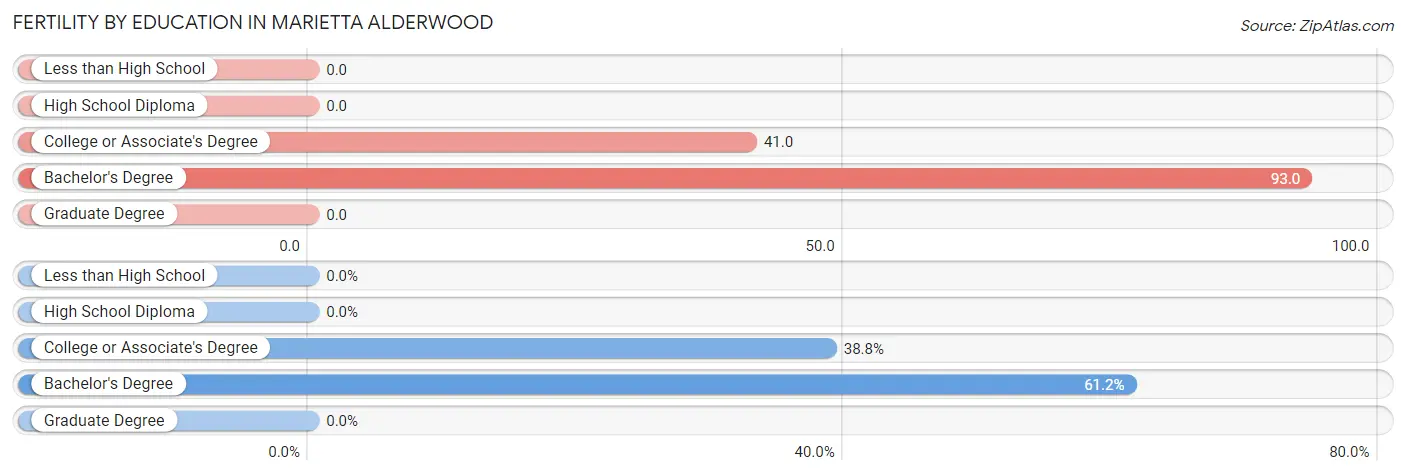
| Educational Attainment | Women with Births | Births / 1,000 Women |
| Less than High School | 0 (0.0%) | 0.0 |
| High School Diploma | 0 (0.0%) | 0.0 |
| College or Associate's Degree | 19 (38.8%) | 41.0 |
| Bachelor's Degree | 30 (61.2%) | 93.0 |
| Graduate Degree | 0 (0.0%) | 0.0 |
| Total | 49 (100.0%) | 55.0 |
Fertility by Education by Marriage Status in Marietta Alderwood
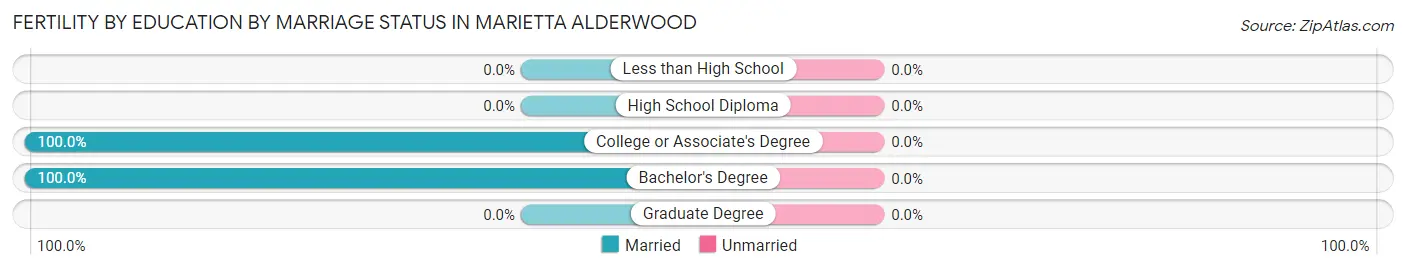
| Educational Attainment | Married | Unmarried |
| Less than High School | 0 (0.0%) | 0 (0.0%) |
| High School Diploma | 0 (0.0%) | 0 (0.0%) |
| College or Associate's Degree | 19 (100.0%) | 0 (0.0%) |
| Bachelor's Degree | 30 (100.0%) | 0 (0.0%) |
| Graduate Degree | 0 (0.0%) | 0 (0.0%) |
| Total | 49 (100.0%) | 0 (0.0%) |
Employment Characteristics in Marietta Alderwood
Employment by Class of Employer in Marietta Alderwood
Among the 1,706 employed individuals in Marietta Alderwood, private company employees (1,277 | 74.9%), local government employees (127 | 7.4%), and not-for-profit organizations (108 | 6.3%) make up the most common classes of employment.
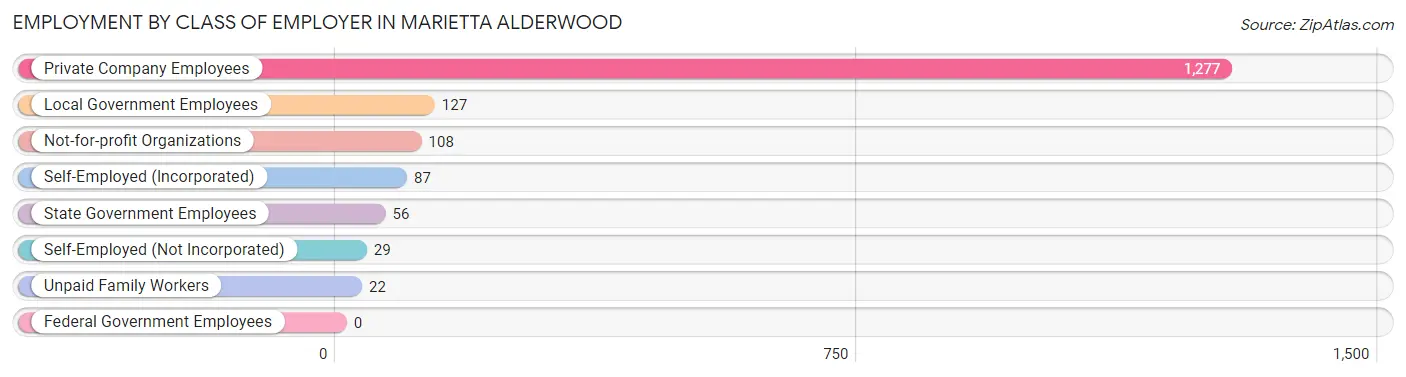
| Employer Class | # Employees | % Employees |
| Private Company Employees | 1,277 | 74.9% |
| Self-Employed (Incorporated) | 87 | 5.1% |
| Self-Employed (Not Incorporated) | 29 | 1.7% |
| Not-for-profit Organizations | 108 | 6.3% |
| Local Government Employees | 127 | 7.4% |
| State Government Employees | 56 | 3.3% |
| Federal Government Employees | 0 | 0.0% |
| Unpaid Family Workers | 22 | 1.3% |
| Total | 1,706 | 100.0% |
Employment Status by Age in Marietta Alderwood
According to the labor force statistics for Marietta Alderwood, out of the total population over 16 years of age (2,770), 65.2% or 1,806 individuals are in the labor force, with 4.3% or 78 of them unemployed. The age group with the highest labor force participation rate is 25 to 29 years, with 100.0% or 120 individuals in the labor force. Within the labor force, the 65 to 74 years age range has the highest percentage of unemployed individuals, with 34.7% or 33 of them being unemployed.
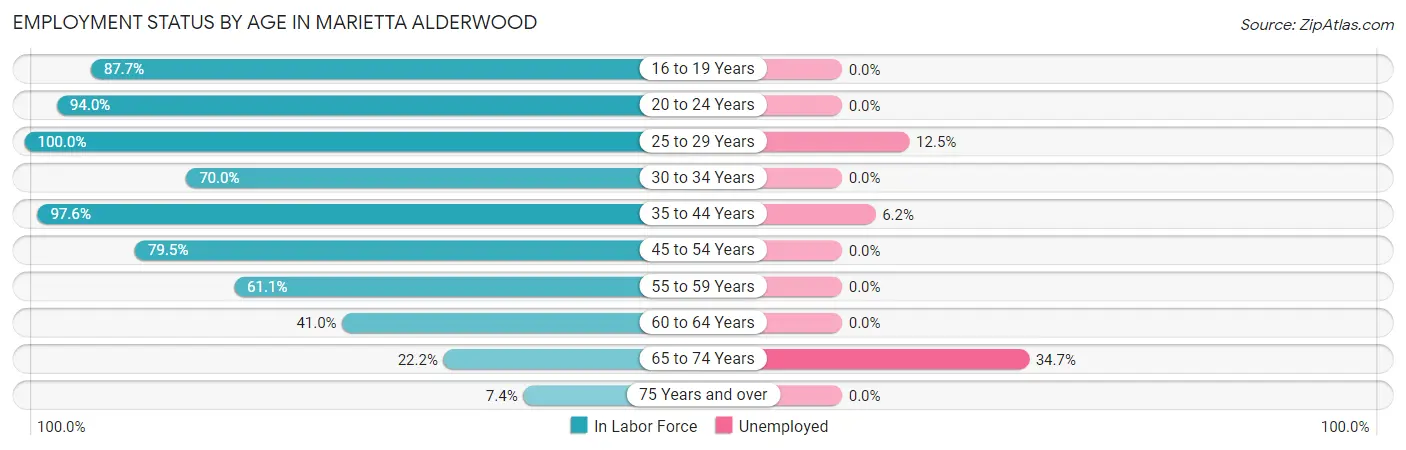
| Age Bracket | In Labor Force | Unemployed |
| 16 to 19 Years | 57 (87.7%) | 0 (0.0%) |
| 20 to 24 Years | 420 (94.0%) | 0 (0.0%) |
| 25 to 29 Years | 120 (100.0%) | 15 (12.5%) |
| 30 to 34 Years | 152 (70.0%) | 0 (0.0%) |
| 35 to 44 Years | 487 (97.6%) | 30 (6.2%) |
| 45 to 54 Years | 248 (79.5%) | 0 (0.0%) |
| 55 to 59 Years | 113 (61.1%) | 0 (0.0%) |
| 60 to 64 Years | 94 (41.0%) | 0 (0.0%) |
| 65 to 74 Years | 95 (22.2%) | 33 (34.7%) |
| 75 Years and over | 20 (7.4%) | 0 (0.0%) |
| Total | 1,806 (65.2%) | 78 (4.3%) |
Employment Status by Educational Attainment in Marietta Alderwood
According to labor force statistics for Marietta Alderwood, 77.7% of individuals (1,214) out of the total population between 25 and 64 years of age (1,562) are in the labor force, with 3.7% or 45 of them being unemployed. The group with the highest labor force participation rate are those with the educational attainment of bachelor's degree or higher, with 100.0% or 416 individuals in the labor force. Within the labor force, individuals with bachelor's degree or higher education have the highest percentage of unemployment, with 7.2% or 30 of them being unemployed.
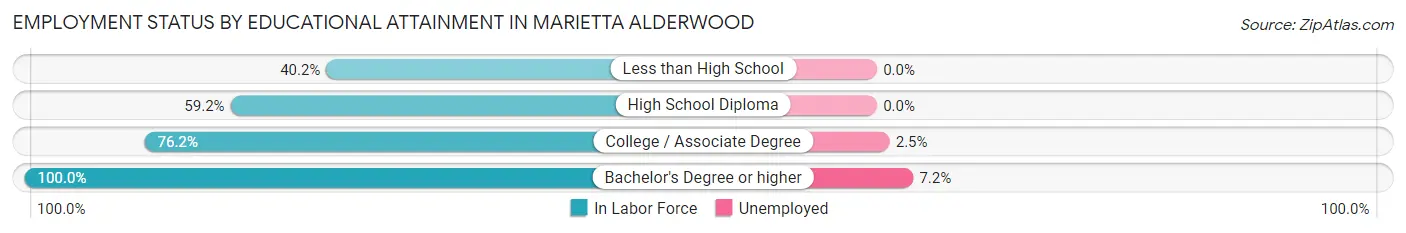
| Educational Attainment | In Labor Force | Unemployed |
| Less than High School | 33 (40.2%) | 0 (0.0%) |
| High School Diploma | 158 (59.2%) | 0 (0.0%) |
| College / Associate Degree | 607 (76.2%) | 20 (2.5%) |
| Bachelor's Degree or higher | 416 (100.0%) | 30 (7.2%) |
| Total | 1,214 (77.7%) | 58 (3.7%) |
Employment Occupations by Sex in Marietta Alderwood
Management, Business, Science and Arts Occupations
The most common Management, Business, Science and Arts occupations in Marietta Alderwood are Computers, Engineering & Science (427 | 24.7%), Architecture & Engineering (345 | 20.0%), Management (282 | 16.3%), Community & Social Service (98 | 5.7%), and Computers & Mathematics (82 | 4.8%).
Management, Business, Science and Arts Occupations by Sex
Within the Management, Business, Science and Arts occupations in Marietta Alderwood, the most male-oriented occupations are Legal Services & Support (100.0%), Computers & Mathematics (82.9%), and Management (67.4%), while the most female-oriented occupations are Education, Arts & Media (100.0%), Education Instruction & Library (100.0%), and Health Diagnosing & Treating (100.0%).
| Occupation | Male | Female |
| Management | 190 (67.4%) | 92 (32.6%) |
| Business & Financial | 22 (64.7%) | 12 (35.3%) |
| Computers, Engineering & Science | 175 (41.0%) | 252 (59.0%) |
| Computers & Mathematics | 68 (82.9%) | 14 (17.1%) |
| Architecture & Engineering | 107 (31.0%) | 238 (69.0%) |
| Life, Physical & Social Science | 0 (0.0%) | 0 (0.0%) |
| Community & Social Service | 34 (34.7%) | 64 (65.3%) |
| Education, Arts & Media | 0 (0.0%) | 19 (100.0%) |
| Legal Services & Support | 34 (100.0%) | 0 (0.0%) |
| Education Instruction & Library | 0 (0.0%) | 45 (100.0%) |
| Arts, Media & Entertainment | 0 (0.0%) | 0 (0.0%) |
| Health Diagnosing & Treating | 0 (0.0%) | 26 (100.0%) |
| Health Technologists | 0 (0.0%) | 26 (100.0%) |
| Total (Category) | 421 (48.6%) | 446 (51.4%) |
| Total (Overall) | 861 (49.8%) | 867 (50.2%) |
Services Occupations
The most common Services occupations in Marietta Alderwood are Healthcare Support (131 | 7.6%), Security & Protection (89 | 5.1%), Cleaning & Maintenance (89 | 5.1%), Food Preparation & Serving (71 | 4.1%), and Firefighting & Prevention (55 | 3.2%).
Services Occupations by Sex
Within the Services occupations in Marietta Alderwood, the most male-oriented occupations are Security & Protection (100.0%), Firefighting & Prevention (100.0%), and Law Enforcement (100.0%), while the most female-oriented occupations are Healthcare Support (85.5%), and Cleaning & Maintenance (80.9%).
| Occupation | Male | Female |
| Healthcare Support | 19 (14.5%) | 112 (85.5%) |
| Security & Protection | 89 (100.0%) | 0 (0.0%) |
| Firefighting & Prevention | 55 (100.0%) | 0 (0.0%) |
| Law Enforcement | 34 (100.0%) | 0 (0.0%) |
| Food Preparation & Serving | 71 (100.0%) | 0 (0.0%) |
| Cleaning & Maintenance | 17 (19.1%) | 72 (80.9%) |
| Personal Care & Service | 0 (0.0%) | 0 (0.0%) |
| Total (Category) | 196 (51.6%) | 184 (48.4%) |
| Total (Overall) | 861 (49.8%) | 867 (50.2%) |
Sales and Office Occupations
The most common Sales and Office occupations in Marietta Alderwood are Sales & Related (151 | 8.7%), and Office & Administration (32 | 1.8%).
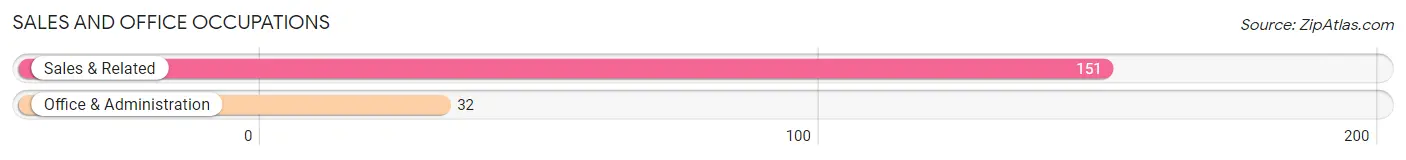
Sales and Office Occupations by Sex
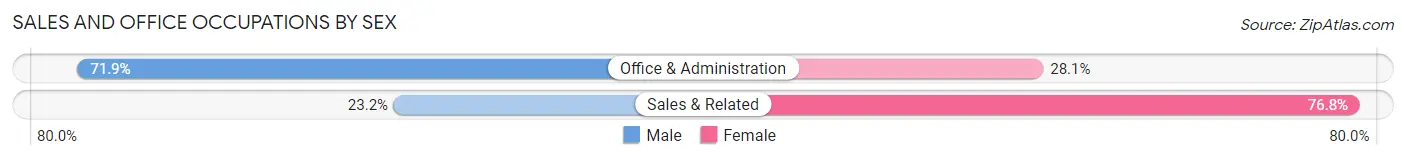
| Occupation | Male | Female |
| Sales & Related | 35 (23.2%) | 116 (76.8%) |
| Office & Administration | 23 (71.9%) | 9 (28.1%) |
| Total (Category) | 58 (31.7%) | 125 (68.3%) |
| Total (Overall) | 861 (49.8%) | 867 (50.2%) |
Natural Resources, Construction and Maintenance Occupations
The most common Natural Resources, Construction and Maintenance occupations in Marietta Alderwood are Installation, Maintenance & Repair (68 | 3.9%), and Construction & Extraction (42 | 2.4%).
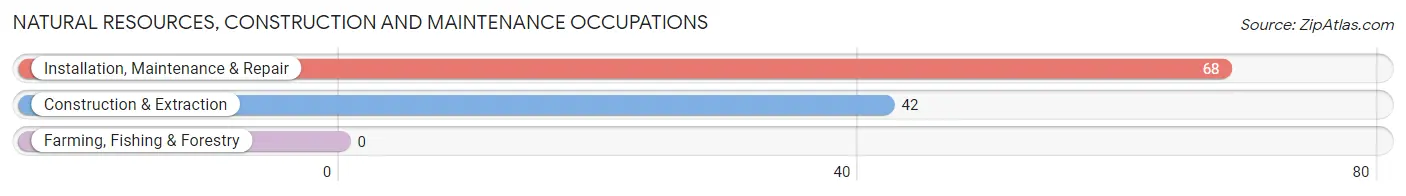
Natural Resources, Construction and Maintenance Occupations by Sex
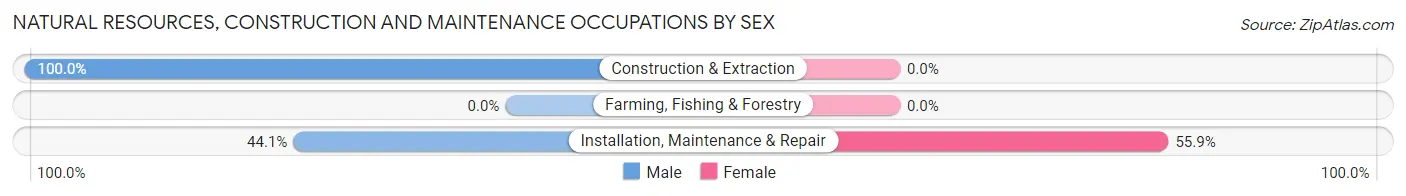
| Occupation | Male | Female |
| Farming, Fishing & Forestry | 0 (0.0%) | 0 (0.0%) |
| Construction & Extraction | 42 (100.0%) | 0 (0.0%) |
| Installation, Maintenance & Repair | 30 (44.1%) | 38 (55.9%) |
| Total (Category) | 72 (65.4%) | 38 (34.5%) |
| Total (Overall) | 861 (49.8%) | 867 (50.2%) |
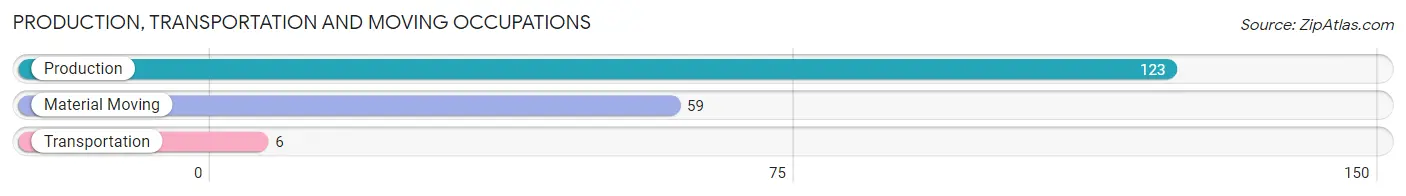
Production, Transportation and Moving Occupations
The most common Production, Transportation and Moving occupations in Marietta Alderwood are Production (123 | 7.1%), Material Moving (59 | 3.4%), and Transportation (6 | 0.4%).
Production, Transportation and Moving Occupations by Sex
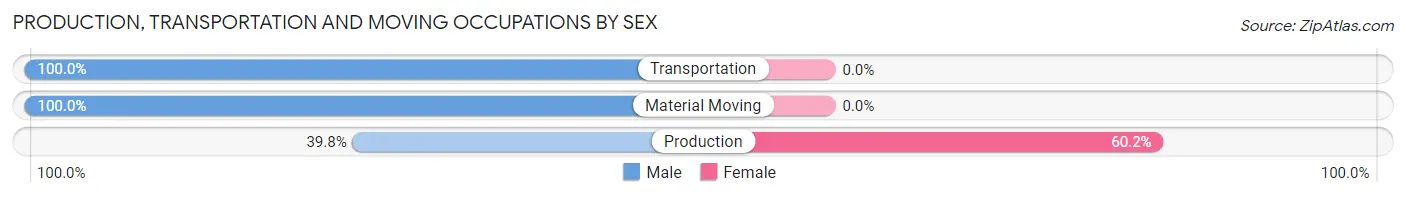
| Occupation | Male | Female |
| Production | 49 (39.8%) | 74 (60.2%) |
| Transportation | 6 (100.0%) | 0 (0.0%) |
| Material Moving | 59 (100.0%) | 0 (0.0%) |
| Total (Category) | 114 (60.6%) | 74 (39.4%) |
| Total (Overall) | 861 (49.8%) | 867 (50.2%) |
Employment Industries by Sex in Marietta Alderwood
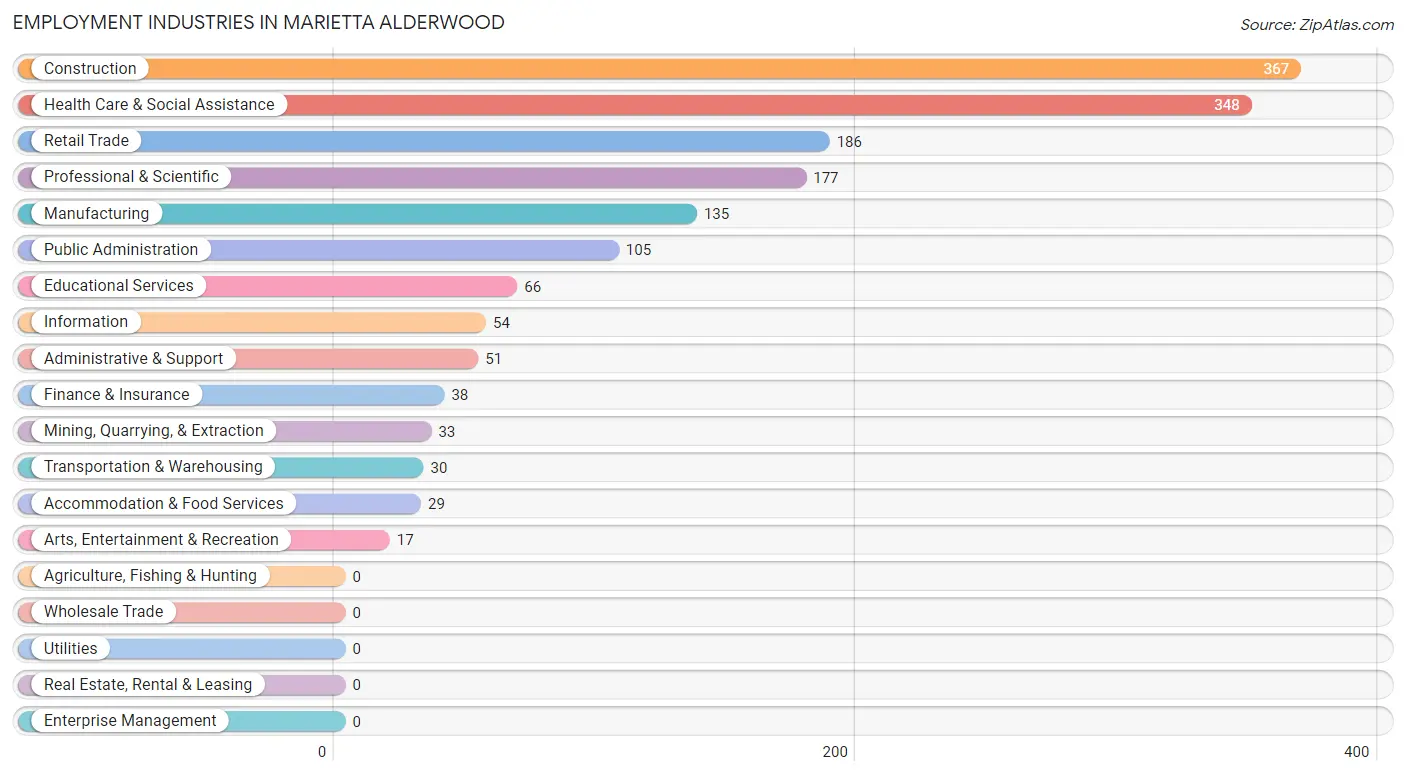
Employment Industries in Marietta Alderwood
The major employment industries in Marietta Alderwood include Construction (367 | 21.2%), Health Care & Social Assistance (348 | 20.1%), Retail Trade (186 | 10.8%), Professional & Scientific (177 | 10.2%), and Manufacturing (135 | 7.8%).
Employment Industries by Sex in Marietta Alderwood
The Marietta Alderwood industries that see more men than women are Mining, Quarrying, & Extraction (100.0%), Transportation & Warehousing (100.0%), and Arts, Entertainment & Recreation (100.0%), whereas the industries that tend to have a higher number of women are Health Care & Social Assistance (73.0%), Finance & Insurance (68.4%), and Information (64.8%).
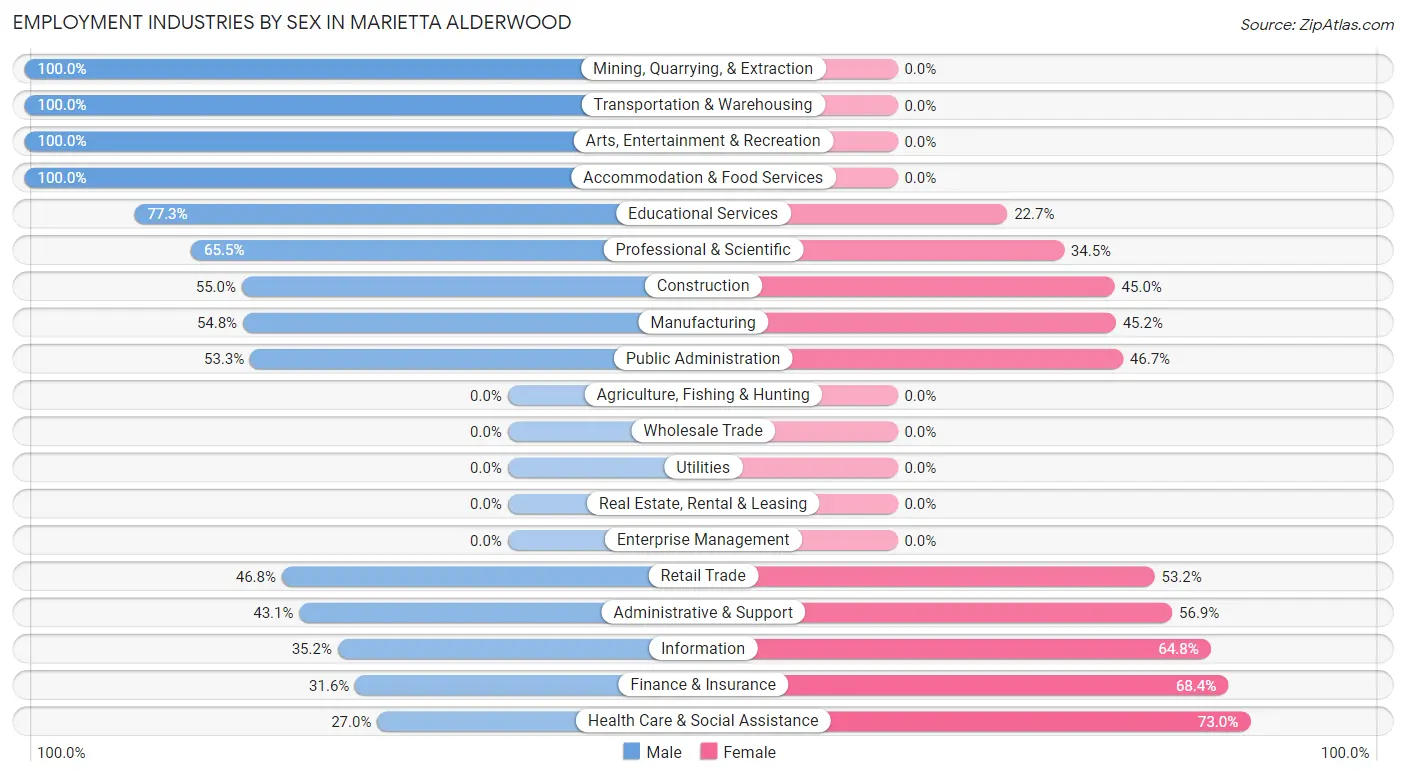
| Industry | Male | Female |
| Agriculture, Fishing & Hunting | 0 (0.0%) | 0 (0.0%) |
| Mining, Quarrying, & Extraction | 33 (100.0%) | 0 (0.0%) |
| Construction | 202 (55.0%) | 165 (45.0%) |
| Manufacturing | 74 (54.8%) | 61 (45.2%) |
| Wholesale Trade | 0 (0.0%) | 0 (0.0%) |
| Retail Trade | 87 (46.8%) | 99 (53.2%) |
| Transportation & Warehousing | 30 (100.0%) | 0 (0.0%) |
| Utilities | 0 (0.0%) | 0 (0.0%) |
| Information | 19 (35.2%) | 35 (64.8%) |
| Finance & Insurance | 12 (31.6%) | 26 (68.4%) |
| Real Estate, Rental & Leasing | 0 (0.0%) | 0 (0.0%) |
| Professional & Scientific | 116 (65.5%) | 61 (34.5%) |
| Enterprise Management | 0 (0.0%) | 0 (0.0%) |
| Administrative & Support | 22 (43.1%) | 29 (56.9%) |
| Educational Services | 51 (77.3%) | 15 (22.7%) |
| Health Care & Social Assistance | 94 (27.0%) | 254 (73.0%) |
| Arts, Entertainment & Recreation | 17 (100.0%) | 0 (0.0%) |
| Accommodation & Food Services | 29 (100.0%) | 0 (0.0%) |
| Public Administration | 56 (53.3%) | 49 (46.7%) |
| Total | 861 (49.8%) | 867 (50.2%) |
Education in Marietta Alderwood
School Enrollment in Marietta Alderwood
The most common levels of schooling among the 545 students in Marietta Alderwood are college / undergraduate (187 | 34.3%), middle school (119 | 21.8%), and graduate / professional (91 | 16.7%).
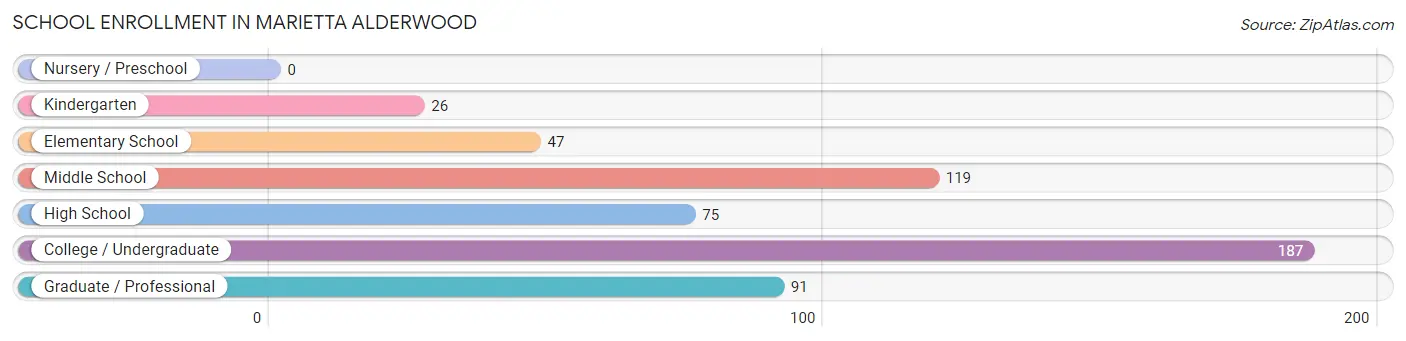
| School Level | # Students | % Students |
| Nursery / Preschool | 0 | 0.0% |
| Kindergarten | 26 | 4.8% |
| Elementary School | 47 | 8.6% |
| Middle School | 119 | 21.8% |
| High School | 75 | 13.8% |
| College / Undergraduate | 187 | 34.3% |
| Graduate / Professional | 91 | 16.7% |
| Total | 545 | 100.0% |
School Enrollment by Age by Funding Source in Marietta Alderwood
Out of a total of 545 students who are enrolled in schools in Marietta Alderwood, 71 (13.0%) attend a private institution, while the remaining 474 (87.0%) are enrolled in public schools. The age group of 5 to 9 year old has the highest likelihood of being enrolled in private schools, with 36 (49.3% in the age bracket) enrolled. Conversely, the age group of 15 to 17 year olds has the lowest likelihood of being enrolled in a private school, with 8 (100.0% in the age bracket) attending a public institution.
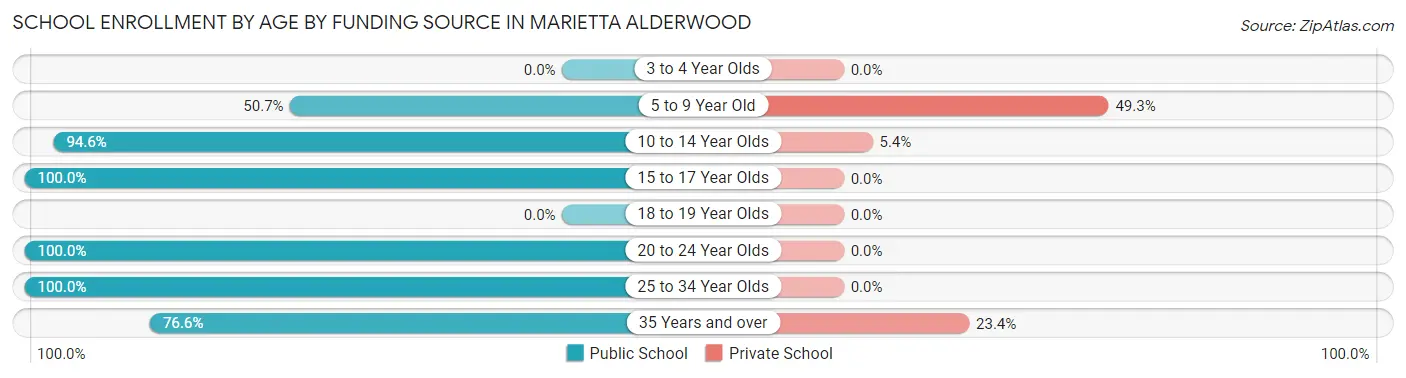
| Age Bracket | Public School | Private School |
| 3 to 4 Year Olds | 0 (0.0%) | 0 (0.0%) |
| 5 to 9 Year Old | 37 (50.7%) | 36 (49.3%) |
| 10 to 14 Year Olds | 176 (94.6%) | 10 (5.4%) |
| 15 to 17 Year Olds | 8 (100.0%) | 0 (0.0%) |
| 18 to 19 Year Olds | 0 (0.0%) | 0 (0.0%) |
| 20 to 24 Year Olds | 113 (100.0%) | 0 (0.0%) |
| 25 to 34 Year Olds | 58 (100.0%) | 0 (0.0%) |
| 35 Years and over | 82 (76.6%) | 25 (23.4%) |
| Total | 474 (87.0%) | 71 (13.0%) |
Educational Attainment by Field of Study in Marietta Alderwood
Bio, nature & agricultural (103 | 15.3%), social sciences (96 | 14.3%), physical & health sciences (93 | 13.8%), business (83 | 12.3%), and education (59 | 8.8%) are the most common fields of study among 672 individuals in Marietta Alderwood who have obtained a bachelor's degree or higher.
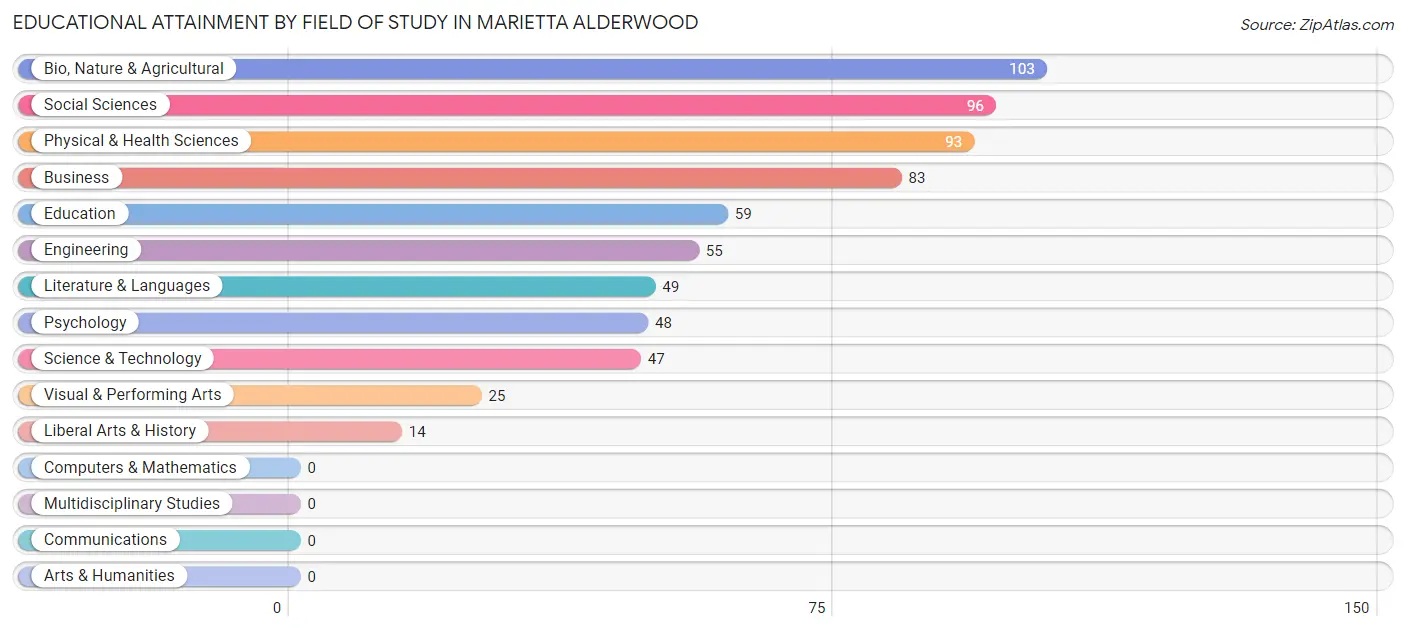
| Field of Study | # Graduates | % Graduates |
| Computers & Mathematics | 0 | 0.0% |
| Bio, Nature & Agricultural | 103 | 15.3% |
| Physical & Health Sciences | 93 | 13.8% |
| Psychology | 48 | 7.1% |
| Social Sciences | 96 | 14.3% |
| Engineering | 55 | 8.2% |
| Multidisciplinary Studies | 0 | 0.0% |
| Science & Technology | 47 | 7.0% |
| Business | 83 | 12.3% |
| Education | 59 | 8.8% |
| Literature & Languages | 49 | 7.3% |
| Liberal Arts & History | 14 | 2.1% |
| Visual & Performing Arts | 25 | 3.7% |
| Communications | 0 | 0.0% |
| Arts & Humanities | 0 | 0.0% |
| Total | 672 | 100.0% |
Transportation & Commute in Marietta Alderwood
Vehicle Availability by Sex in Marietta Alderwood
The most prevalent vehicle ownership categories in Marietta Alderwood are males with 2 vehicles (427, accounting for 50.1%) and females with 2 vehicles (684, making up 50.0%).
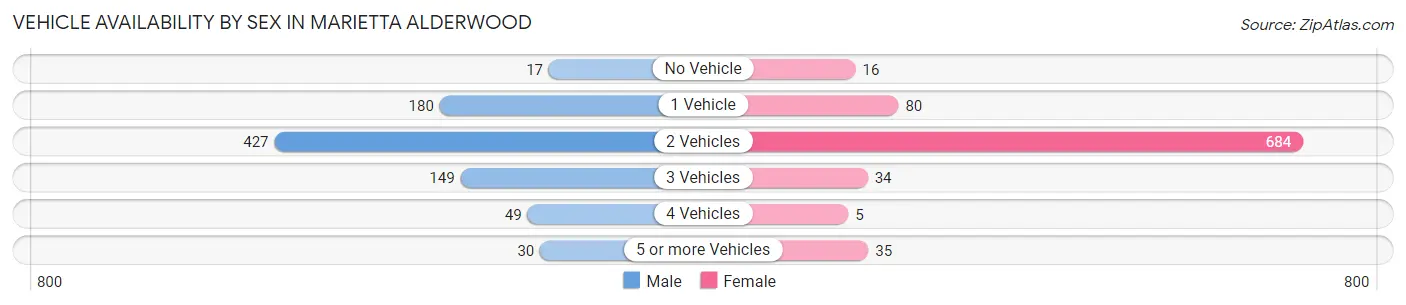
| Vehicles Available | Male | Female |
| No Vehicle | 17 (2.0%) | 16 (1.9%) |
| 1 Vehicle | 180 (21.1%) | 80 (9.4%) |
| 2 Vehicles | 427 (50.1%) | 684 (80.1%) |
| 3 Vehicles | 149 (17.5%) | 34 (4.0%) |
| 4 Vehicles | 49 (5.8%) | 5 (0.6%) |
| 5 or more Vehicles | 30 (3.5%) | 35 (4.1%) |
| Total | 852 (100.0%) | 854 (100.0%) |
Commute Time in Marietta Alderwood
The most frequently occuring commute durations in Marietta Alderwood are 10 to 14 minutes (420 commuters, 25.9%), 5 to 9 minutes (256 commuters, 15.8%), and 15 to 19 minutes (245 commuters, 15.1%).
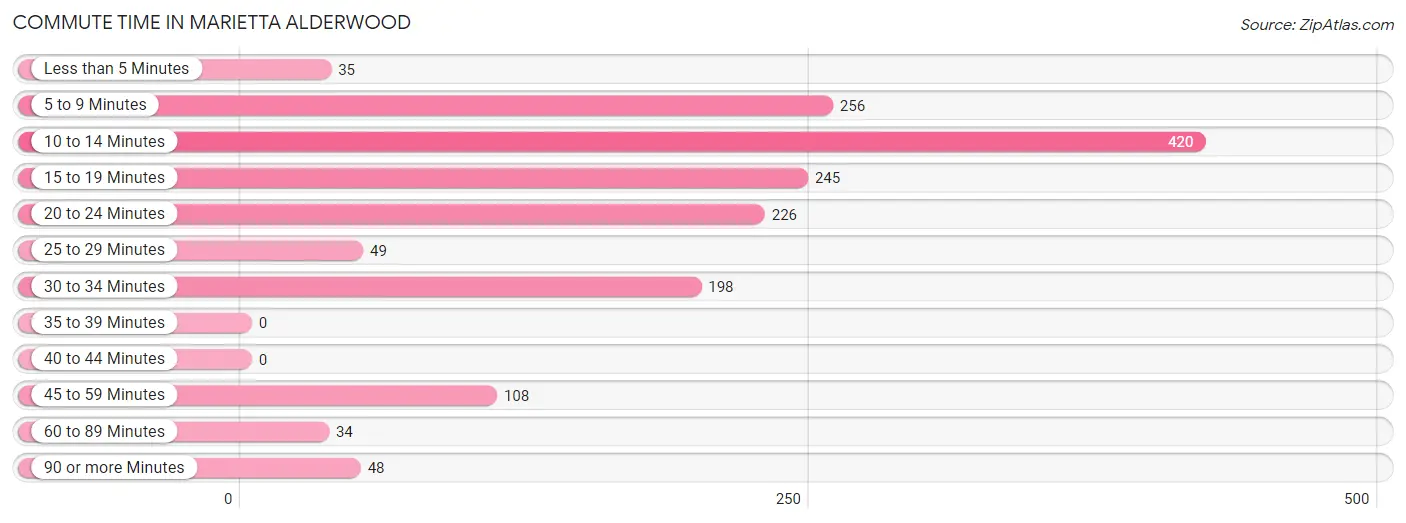
| Commute Time | # Commuters | % Commuters |
| Less than 5 Minutes | 35 | 2.2% |
| 5 to 9 Minutes | 256 | 15.8% |
| 10 to 14 Minutes | 420 | 25.9% |
| 15 to 19 Minutes | 245 | 15.1% |
| 20 to 24 Minutes | 226 | 14.0% |
| 25 to 29 Minutes | 49 | 3.0% |
| 30 to 34 Minutes | 198 | 12.2% |
| 35 to 39 Minutes | 0 | 0.0% |
| 40 to 44 Minutes | 0 | 0.0% |
| 45 to 59 Minutes | 108 | 6.7% |
| 60 to 89 Minutes | 34 | 2.1% |
| 90 or more Minutes | 48 | 3.0% |
Commute Time by Sex in Marietta Alderwood
The most common commute times in Marietta Alderwood are 10 to 14 minutes (286 commuters, 35.1%) for males and 5 to 9 minutes (227 commuters, 28.2%) for females.
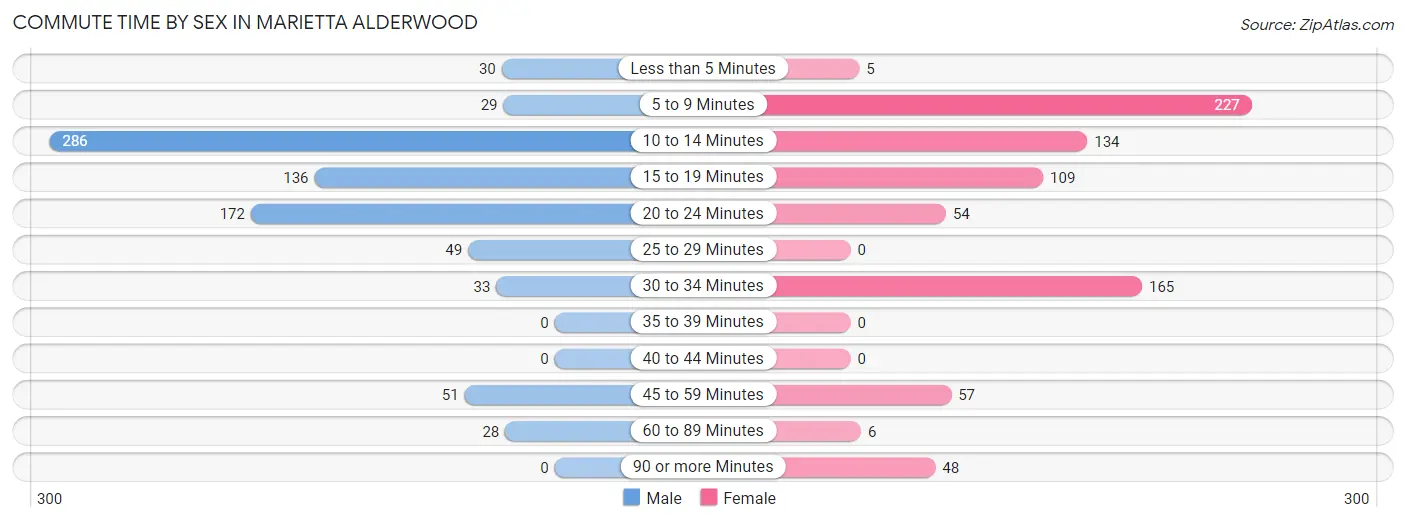
| Commute Time | Male | Female |
| Less than 5 Minutes | 30 (3.7%) | 5 (0.6%) |
| 5 to 9 Minutes | 29 (3.6%) | 227 (28.2%) |
| 10 to 14 Minutes | 286 (35.1%) | 134 (16.7%) |
| 15 to 19 Minutes | 136 (16.7%) | 109 (13.5%) |
| 20 to 24 Minutes | 172 (21.1%) | 54 (6.7%) |
| 25 to 29 Minutes | 49 (6.0%) | 0 (0.0%) |
| 30 to 34 Minutes | 33 (4.1%) | 165 (20.5%) |
| 35 to 39 Minutes | 0 (0.0%) | 0 (0.0%) |
| 40 to 44 Minutes | 0 (0.0%) | 0 (0.0%) |
| 45 to 59 Minutes | 51 (6.3%) | 57 (7.1%) |
| 60 to 89 Minutes | 28 (3.4%) | 6 (0.7%) |
| 90 or more Minutes | 0 (0.0%) | 48 (6.0%) |
Time of Departure to Work by Sex in Marietta Alderwood
The most frequent times of departure to work in Marietta Alderwood are 7:30 AM to 7:59 AM (244, 30.0%) for males and 6:30 AM to 6:59 AM (270, 33.5%) for females.
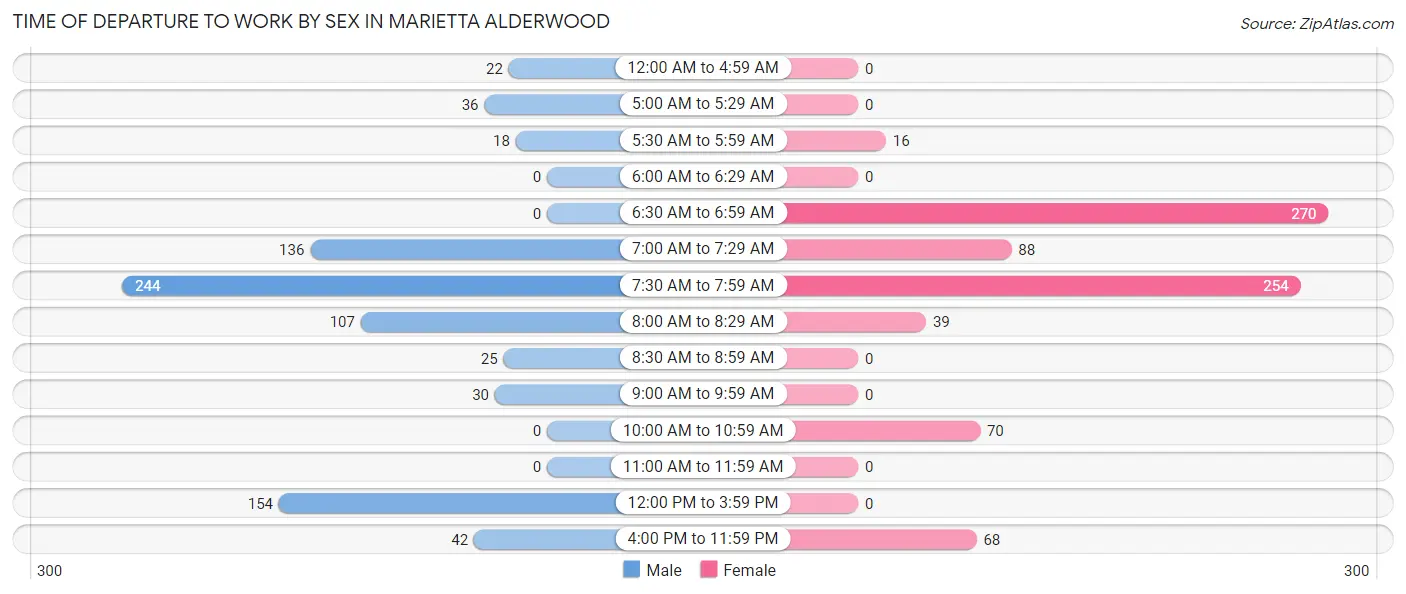
| Time of Departure | Male | Female |
| 12:00 AM to 4:59 AM | 22 (2.7%) | 0 (0.0%) |
| 5:00 AM to 5:29 AM | 36 (4.4%) | 0 (0.0%) |
| 5:30 AM to 5:59 AM | 18 (2.2%) | 16 (2.0%) |
| 6:00 AM to 6:29 AM | 0 (0.0%) | 0 (0.0%) |
| 6:30 AM to 6:59 AM | 0 (0.0%) | 270 (33.5%) |
| 7:00 AM to 7:29 AM | 136 (16.7%) | 88 (10.9%) |
| 7:30 AM to 7:59 AM | 244 (30.0%) | 254 (31.6%) |
| 8:00 AM to 8:29 AM | 107 (13.1%) | 39 (4.8%) |
| 8:30 AM to 8:59 AM | 25 (3.1%) | 0 (0.0%) |
| 9:00 AM to 9:59 AM | 30 (3.7%) | 0 (0.0%) |
| 10:00 AM to 10:59 AM | 0 (0.0%) | 70 (8.7%) |
| 11:00 AM to 11:59 AM | 0 (0.0%) | 0 (0.0%) |
| 12:00 PM to 3:59 PM | 154 (18.9%) | 0 (0.0%) |
| 4:00 PM to 11:59 PM | 42 (5.2%) | 68 (8.5%) |
| Total | 814 (100.0%) | 805 (100.0%) |
Housing Occupancy in Marietta Alderwood
Occupancy by Ownership in Marietta Alderwood
Of the total 1,477 dwellings in Marietta Alderwood, owner-occupied units account for 814 (55.1%), while renter-occupied units make up 663 (44.9%).
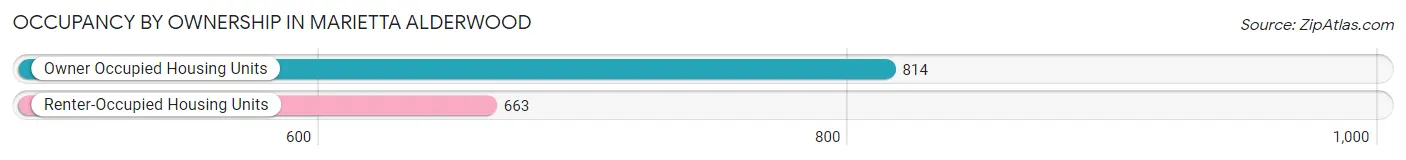
| Occupancy | # Housing Units | % Housing Units |
| Owner Occupied Housing Units | 814 | 55.1% |
| Renter-Occupied Housing Units | 663 | 44.9% |
| Total Occupied Housing Units | 1,477 | 100.0% |
Occupancy by Household Size in Marietta Alderwood
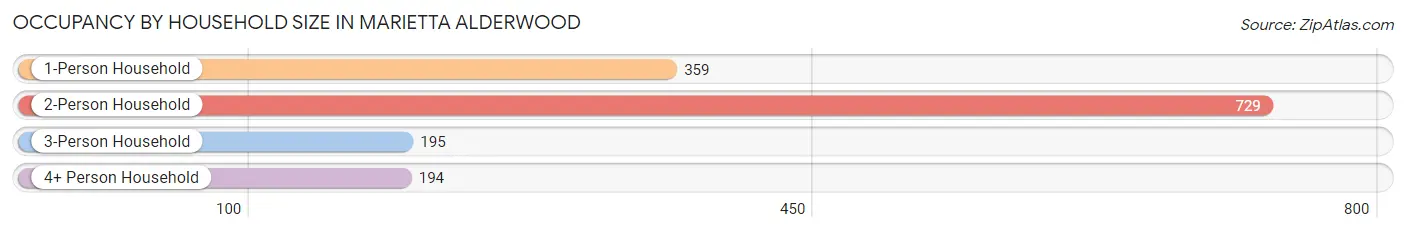
| Household Size | # Housing Units | % Housing Units |
| 1-Person Household | 359 | 24.3% |
| 2-Person Household | 729 | 49.4% |
| 3-Person Household | 195 | 13.2% |
| 4+ Person Household | 194 | 13.1% |
| Total Housing Units | 1,477 | 100.0% |
Occupancy by Ownership by Household Size in Marietta Alderwood
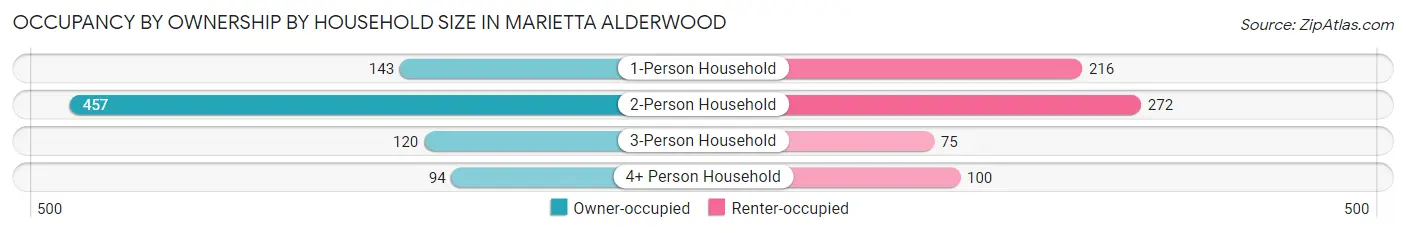
| Household Size | Owner-occupied | Renter-occupied |
| 1-Person Household | 143 (39.8%) | 216 (60.2%) |
| 2-Person Household | 457 (62.7%) | 272 (37.3%) |
| 3-Person Household | 120 (61.5%) | 75 (38.5%) |
| 4+ Person Household | 94 (48.4%) | 100 (51.5%) |
| Total Housing Units | 814 (55.1%) | 663 (44.9%) |
Occupancy by Educational Attainment in Marietta Alderwood
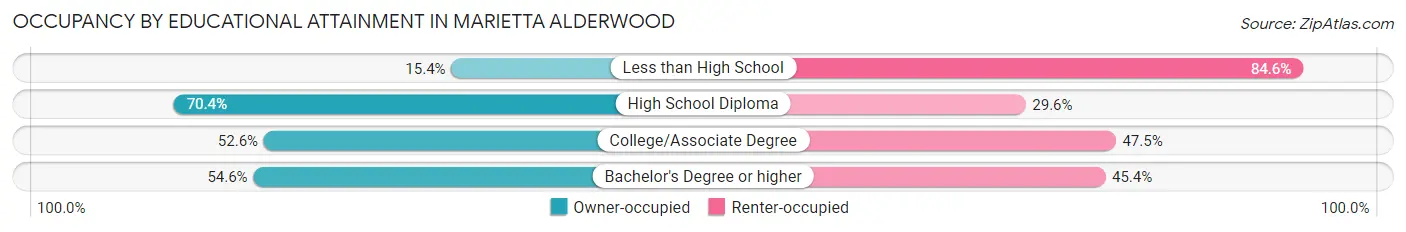
| Household Size | Owner-occupied | Renter-occupied |
| Less than High School | 6 (15.4%) | 33 (84.6%) |
| High School Diploma | 169 (70.4%) | 71 (29.6%) |
| College/Associate Degree | 391 (52.5%) | 353 (47.4%) |
| Bachelor's Degree or higher | 248 (54.6%) | 206 (45.4%) |
Occupancy by Age of Householder in Marietta Alderwood
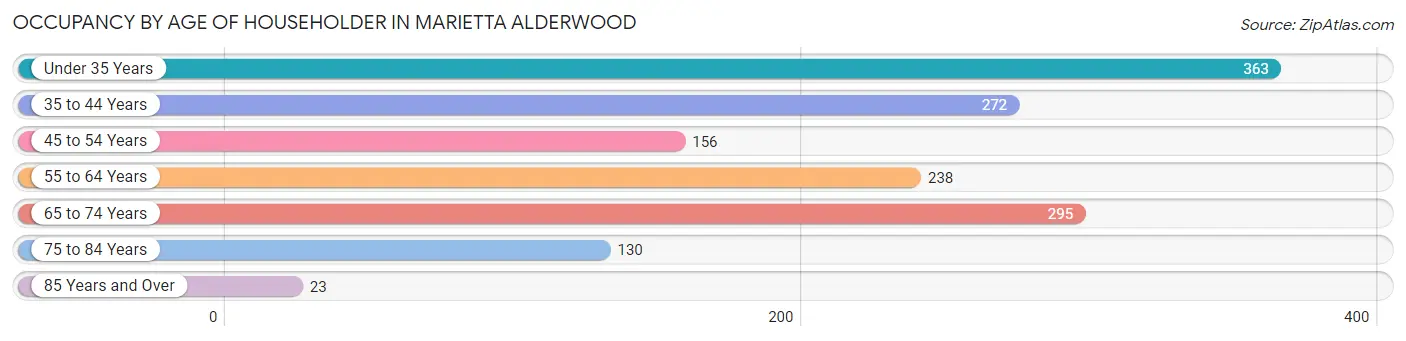
| Age Bracket | # Households | % Households |
| Under 35 Years | 363 | 24.6% |
| 35 to 44 Years | 272 | 18.4% |
| 45 to 54 Years | 156 | 10.6% |
| 55 to 64 Years | 238 | 16.1% |
| 65 to 74 Years | 295 | 20.0% |
| 75 to 84 Years | 130 | 8.8% |
| 85 Years and Over | 23 | 1.6% |
| Total | 1,477 | 100.0% |
Housing Finances in Marietta Alderwood
Median Income by Occupancy in Marietta Alderwood
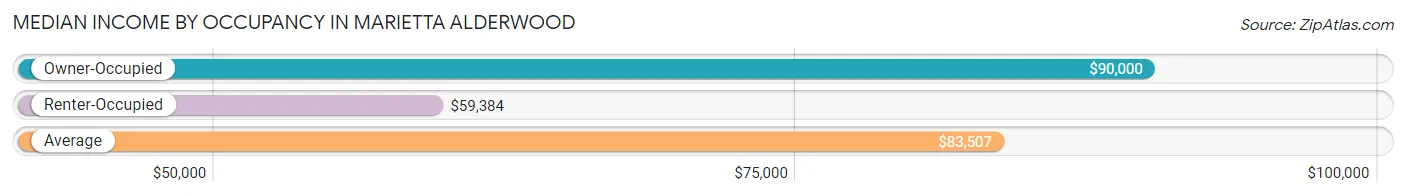
| Occupancy Type | # Households | Median Income |
| Owner-Occupied | 814 (55.1%) | $90,000 |
| Renter-Occupied | 663 (44.9%) | $59,384 |
| Average | 1,477 (100.0%) | $83,507 |
Occupancy by Householder Income Bracket in Marietta Alderwood
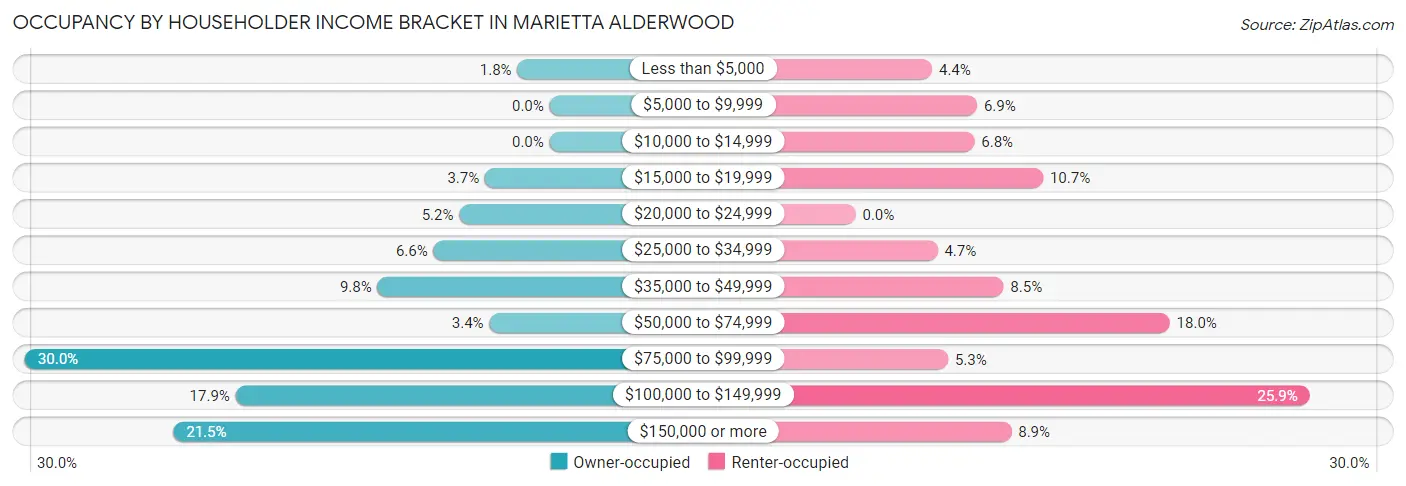
| Income Bracket | Owner-occupied | Renter-occupied |
| Less than $5,000 | 15 (1.8%) | 29 (4.4%) |
| $5,000 to $9,999 | 0 (0.0%) | 46 (6.9%) |
| $10,000 to $14,999 | 0 (0.0%) | 45 (6.8%) |
| $15,000 to $19,999 | 30 (3.7%) | 71 (10.7%) |
| $20,000 to $24,999 | 42 (5.2%) | 0 (0.0%) |
| $25,000 to $34,999 | 54 (6.6%) | 31 (4.7%) |
| $35,000 to $49,999 | 80 (9.8%) | 56 (8.5%) |
| $50,000 to $74,999 | 28 (3.4%) | 119 (17.9%) |
| $75,000 to $99,999 | 244 (30.0%) | 35 (5.3%) |
| $100,000 to $149,999 | 146 (17.9%) | 172 (25.9%) |
| $150,000 or more | 175 (21.5%) | 59 (8.9%) |
| Total | 814 (100.0%) | 663 (100.0%) |
Monthly Housing Cost Tiers in Marietta Alderwood
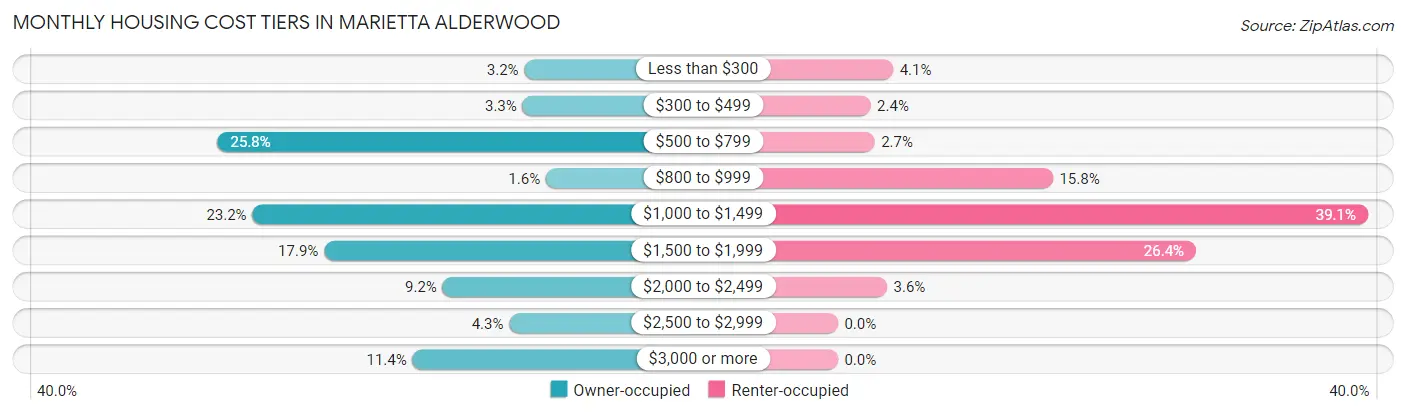
| Monthly Cost | Owner-occupied | Renter-occupied |
| Less than $300 | 26 (3.2%) | 27 (4.1%) |
| $300 to $499 | 27 (3.3%) | 16 (2.4%) |
| $500 to $799 | 210 (25.8%) | 18 (2.7%) |
| $800 to $999 | 13 (1.6%) | 105 (15.8%) |
| $1,000 to $1,499 | 189 (23.2%) | 259 (39.1%) |
| $1,500 to $1,999 | 146 (17.9%) | 175 (26.4%) |
| $2,000 to $2,499 | 75 (9.2%) | 24 (3.6%) |
| $2,500 to $2,999 | 35 (4.3%) | 0 (0.0%) |
| $3,000 or more | 93 (11.4%) | 0 (0.0%) |
| Total | 814 (100.0%) | 663 (100.0%) |
Physical Housing Characteristics in Marietta Alderwood
Housing Structures in Marietta Alderwood
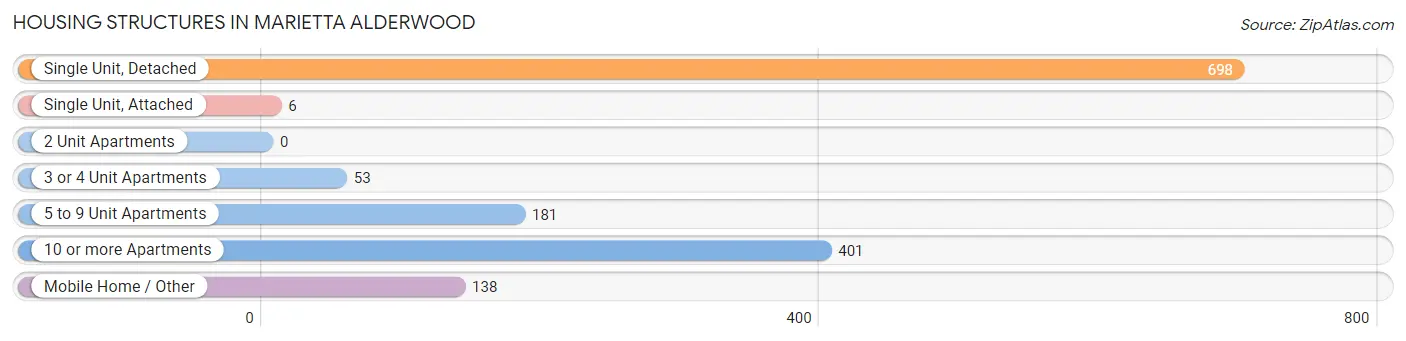
| Structure Type | # Housing Units | % Housing Units |
| Single Unit, Detached | 698 | 47.3% |
| Single Unit, Attached | 6 | 0.4% |
| 2 Unit Apartments | 0 | 0.0% |
| 3 or 4 Unit Apartments | 53 | 3.6% |
| 5 to 9 Unit Apartments | 181 | 12.2% |
| 10 or more Apartments | 401 | 27.2% |
| Mobile Home / Other | 138 | 9.3% |
| Total | 1,477 | 100.0% |
Housing Structures by Occupancy in Marietta Alderwood
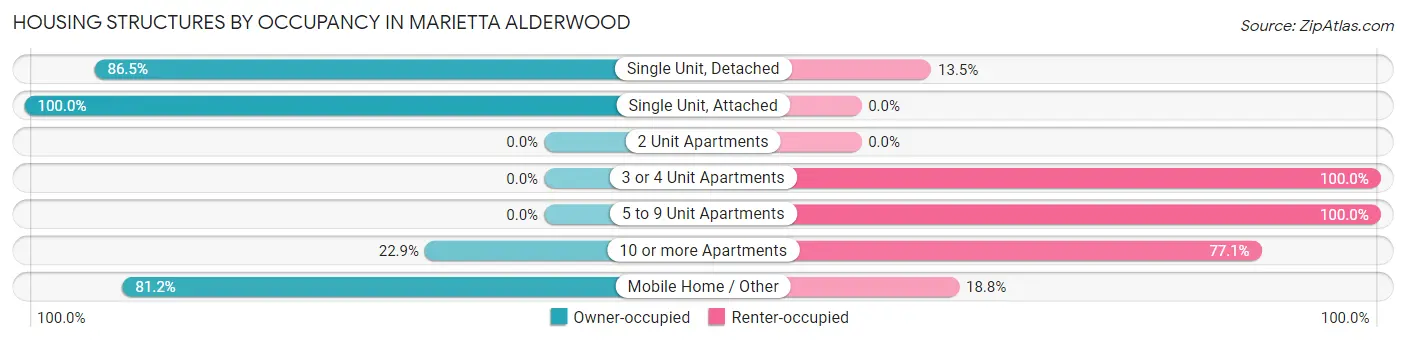
| Structure Type | Owner-occupied | Renter-occupied |
| Single Unit, Detached | 604 (86.5%) | 94 (13.5%) |
| Single Unit, Attached | 6 (100.0%) | 0 (0.0%) |
| 2 Unit Apartments | 0 (0.0%) | 0 (0.0%) |
| 3 or 4 Unit Apartments | 0 (0.0%) | 53 (100.0%) |
| 5 to 9 Unit Apartments | 0 (0.0%) | 181 (100.0%) |
| 10 or more Apartments | 92 (22.9%) | 309 (77.1%) |
| Mobile Home / Other | 112 (81.2%) | 26 (18.8%) |
| Total | 814 (55.1%) | 663 (44.9%) |
Housing Structures by Number of Rooms in Marietta Alderwood
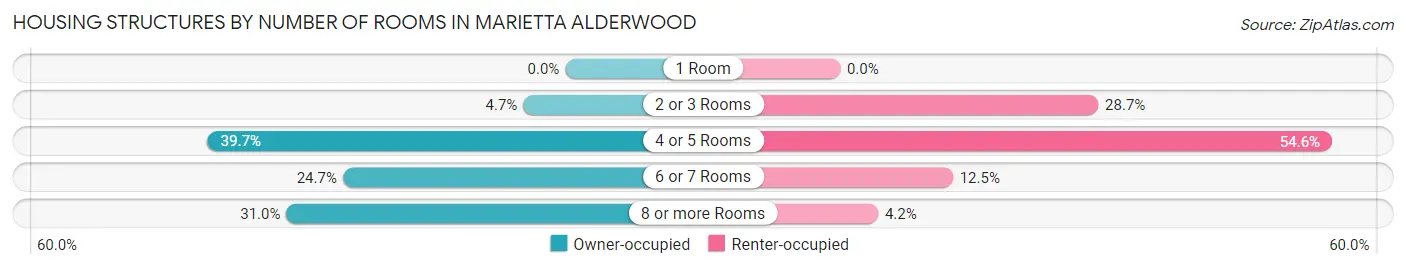
| Number of Rooms | Owner-occupied | Renter-occupied |
| 1 Room | 0 (0.0%) | 0 (0.0%) |
| 2 or 3 Rooms | 38 (4.7%) | 190 (28.7%) |
| 4 or 5 Rooms | 323 (39.7%) | 362 (54.6%) |
| 6 or 7 Rooms | 201 (24.7%) | 83 (12.5%) |
| 8 or more Rooms | 252 (31.0%) | 28 (4.2%) |
| Total | 814 (100.0%) | 663 (100.0%) |
Housing Structure by Heating Type in Marietta Alderwood
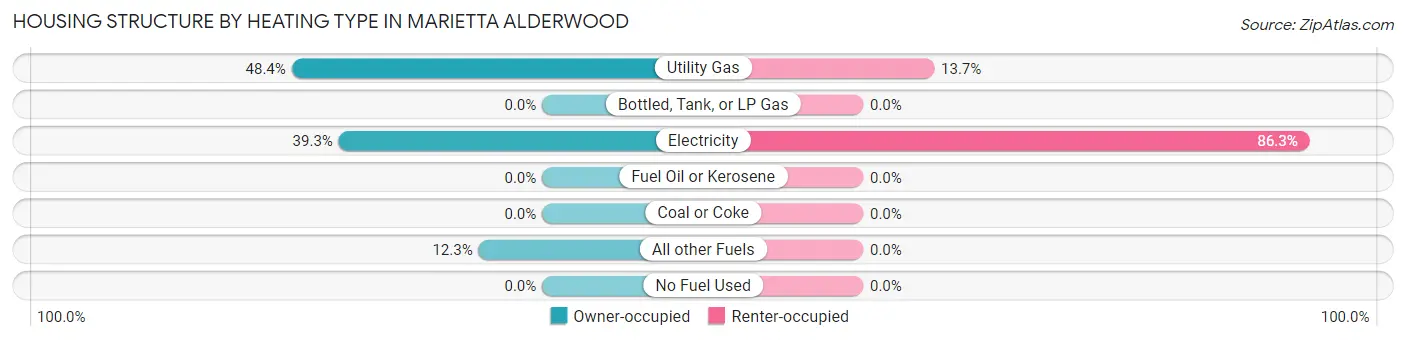
| Heating Type | Owner-occupied | Renter-occupied |
| Utility Gas | 394 (48.4%) | 91 (13.7%) |
| Bottled, Tank, or LP Gas | 0 (0.0%) | 0 (0.0%) |
| Electricity | 320 (39.3%) | 572 (86.3%) |
| Fuel Oil or Kerosene | 0 (0.0%) | 0 (0.0%) |
| Coal or Coke | 0 (0.0%) | 0 (0.0%) |
| All other Fuels | 100 (12.3%) | 0 (0.0%) |
| No Fuel Used | 0 (0.0%) | 0 (0.0%) |
| Total | 814 (100.0%) | 663 (100.0%) |
Household Vehicle Usage in Marietta Alderwood
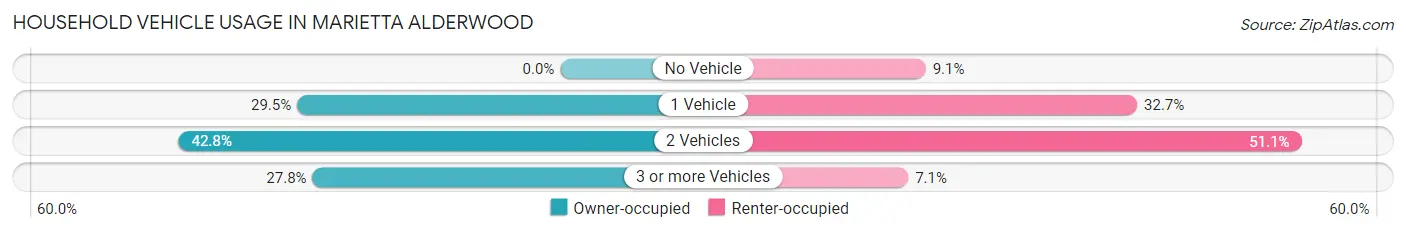
| Vehicles per Household | Owner-occupied | Renter-occupied |
| No Vehicle | 0 (0.0%) | 60 (9.0%) |
| 1 Vehicle | 240 (29.5%) | 217 (32.7%) |
| 2 Vehicles | 348 (42.7%) | 339 (51.1%) |
| 3 or more Vehicles | 226 (27.8%) | 47 (7.1%) |
| Total | 814 (100.0%) | 663 (100.0%) |
Real Estate & Mortgages in Marietta Alderwood
Real Estate and Mortgage Overview in Marietta Alderwood
| Characteristic | Without Mortgage | With Mortgage |
| Housing Units | 326 | 488 |
| Median Property Value | $467,400 | $362,200 |
| Median Household Income | $97,917 | $76 |
| Monthly Housing Costs | $703 | $93 |
| Real Estate Taxes | $4,283 | $0 |
Property Value by Mortgage Status in Marietta Alderwood
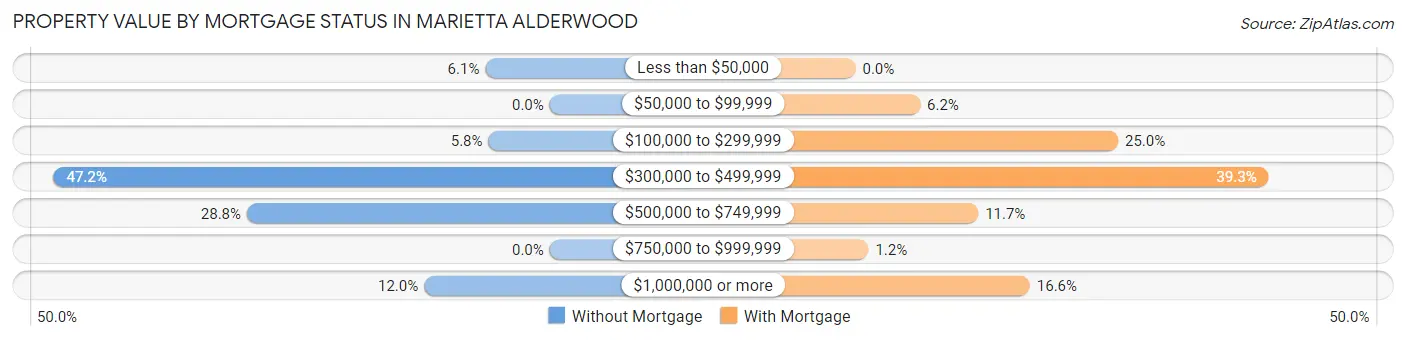
| Property Value | Without Mortgage | With Mortgage |
| Less than $50,000 | 20 (6.1%) | 0 (0.0%) |
| $50,000 to $99,999 | 0 (0.0%) | 30 (6.1%) |
| $100,000 to $299,999 | 19 (5.8%) | 122 (25.0%) |
| $300,000 to $499,999 | 154 (47.2%) | 192 (39.3%) |
| $500,000 to $749,999 | 94 (28.8%) | 57 (11.7%) |
| $750,000 to $999,999 | 0 (0.0%) | 6 (1.2%) |
| $1,000,000 or more | 39 (12.0%) | 81 (16.6%) |
| Total | 326 (100.0%) | 488 (100.0%) |
Household Income by Mortgage Status in Marietta Alderwood
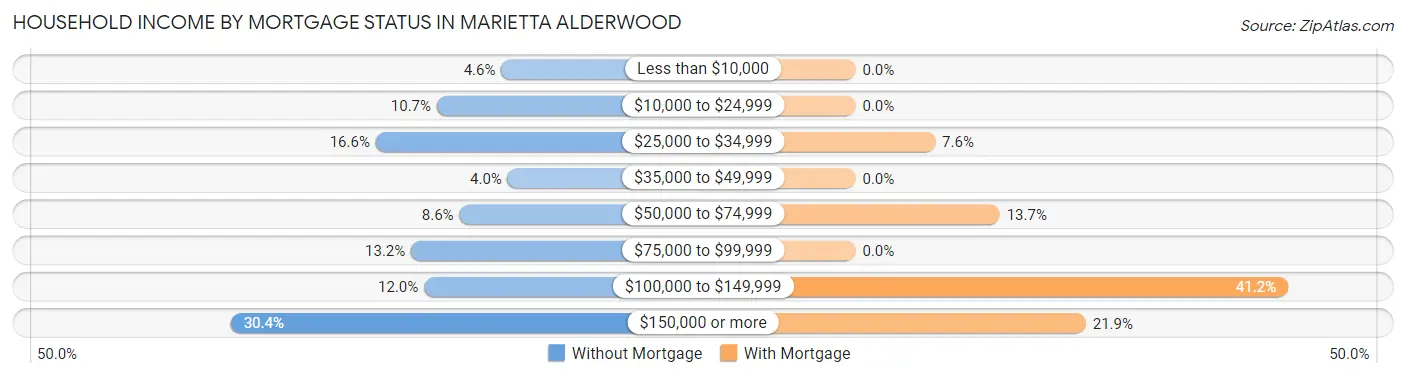
| Household Income | Without Mortgage | With Mortgage |
| Less than $10,000 | 15 (4.6%) | 0 (0.0%) |
| $10,000 to $24,999 | 35 (10.7%) | 0 (0.0%) |
| $25,000 to $34,999 | 54 (16.6%) | 37 (7.6%) |
| $35,000 to $49,999 | 13 (4.0%) | 0 (0.0%) |
| $50,000 to $74,999 | 28 (8.6%) | 67 (13.7%) |
| $75,000 to $99,999 | 43 (13.2%) | 0 (0.0%) |
| $100,000 to $149,999 | 39 (12.0%) | 201 (41.2%) |
| $150,000 or more | 99 (30.4%) | 107 (21.9%) |
| Total | 326 (100.0%) | 488 (100.0%) |
Property Value to Household Income Ratio in Marietta Alderwood
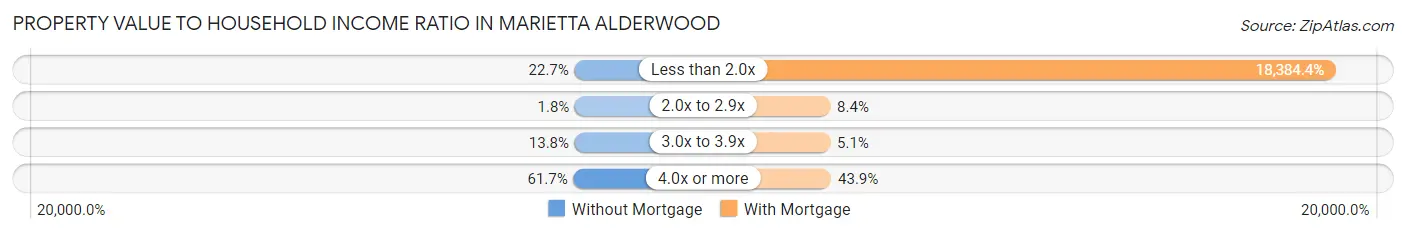
| Value-to-Income Ratio | Without Mortgage | With Mortgage |
| Less than 2.0x | 74 (22.7%) | 89,716 (18,384.4%) |
| 2.0x to 2.9x | 6 (1.8%) | 41 (8.4%) |
| 3.0x to 3.9x | 45 (13.8%) | 25 (5.1%) |
| 4.0x or more | 201 (61.7%) | 214 (43.9%) |
| Total | 326 (100.0%) | 488 (100.0%) |
Real Estate Taxes by Mortgage Status in Marietta Alderwood
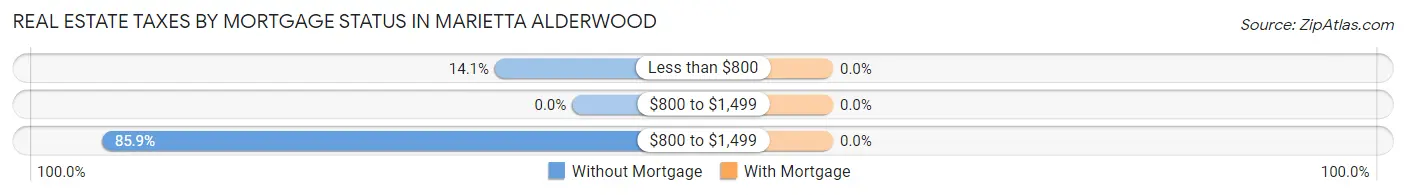
| Property Taxes | Without Mortgage | With Mortgage |
| Less than $800 | 46 (14.1%) | 0 (0.0%) |
| $800 to $1,499 | 0 (0.0%) | 0 (0.0%) |
| $800 to $1,499 | 280 (85.9%) | 0 (0.0%) |
| Total | 326 (100.0%) | 488 (100.0%) |
Health & Disability in Marietta Alderwood
Health Insurance Coverage by Age in Marietta Alderwood
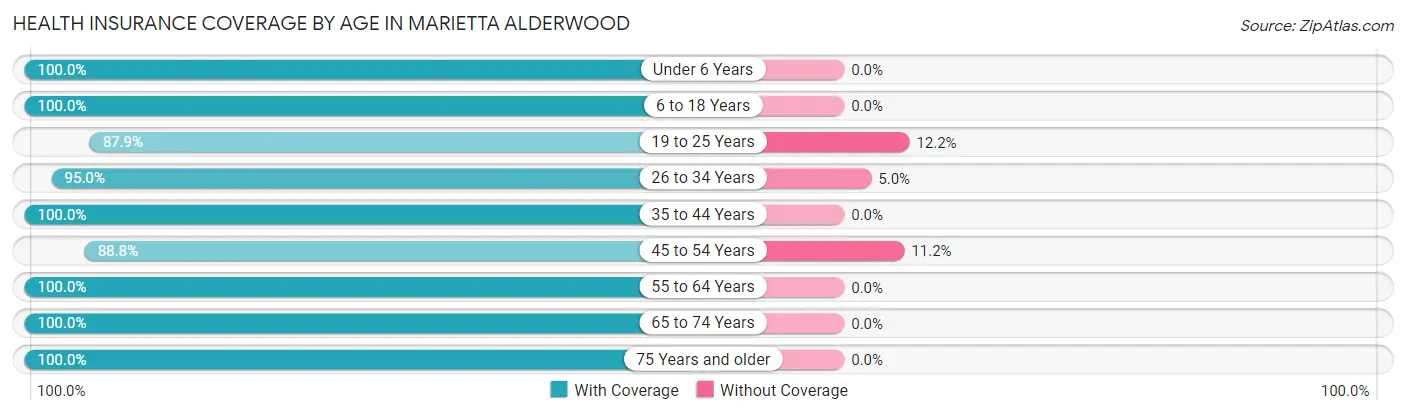
| Age Bracket | With Coverage | Without Coverage |
| Under 6 Years | 147 (100.0%) | 0 (0.0%) |
| 6 to 18 Years | 430 (100.0%) | 0 (0.0%) |
| 19 to 25 Years | 412 (87.8%) | 57 (12.1%) |
| 26 to 34 Years | 320 (95.0%) | 17 (5.0%) |
| 35 to 44 Years | 499 (100.0%) | 0 (0.0%) |
| 45 to 54 Years | 277 (88.8%) | 35 (11.2%) |
| 55 to 64 Years | 414 (100.0%) | 0 (0.0%) |
| 65 to 74 Years | 427 (100.0%) | 0 (0.0%) |
| 75 Years and older | 269 (100.0%) | 0 (0.0%) |
| Total | 3,195 (96.7%) | 109 (3.3%) |
Health Insurance Coverage by Citizenship Status in Marietta Alderwood
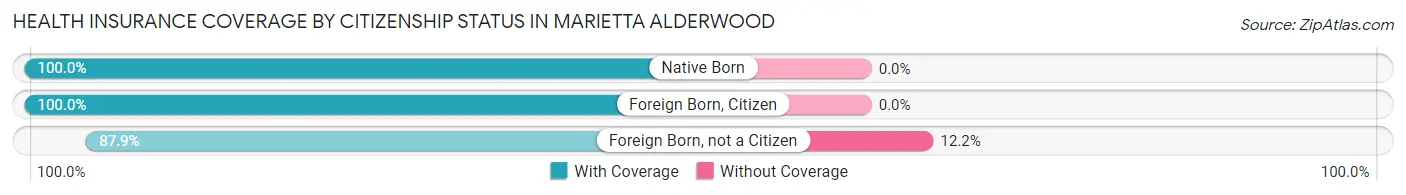
| Citizenship Status | With Coverage | Without Coverage |
| Native Born | 147 (100.0%) | 0 (0.0%) |
| Foreign Born, Citizen | 430 (100.0%) | 0 (0.0%) |
| Foreign Born, not a Citizen | 412 (87.8%) | 57 (12.1%) |
Health Insurance Coverage by Household Income in Marietta Alderwood
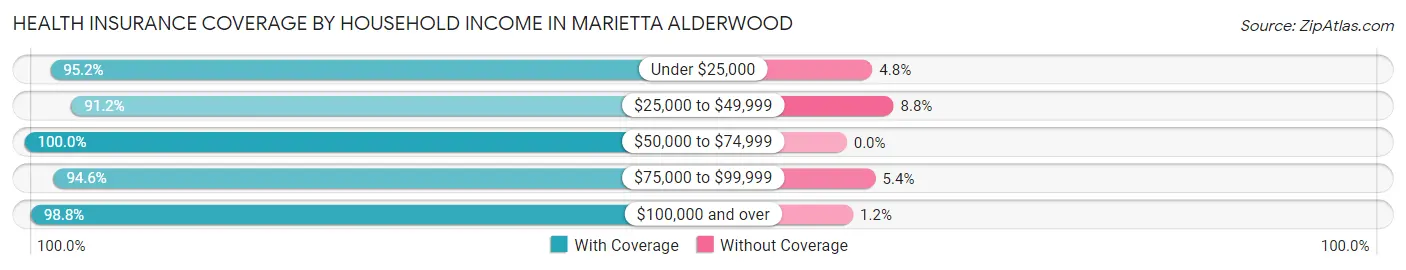
| Household Income | With Coverage | Without Coverage |
| Under $25,000 | 436 (95.2%) | 22 (4.8%) |
| $25,000 to $49,999 | 364 (91.2%) | 35 (8.8%) |
| $50,000 to $74,999 | 374 (100.0%) | 0 (0.0%) |
| $75,000 to $99,999 | 612 (94.6%) | 35 (5.4%) |
| $100,000 and over | 1,409 (98.8%) | 17 (1.2%) |
Public vs Private Health Insurance Coverage by Age in Marietta Alderwood
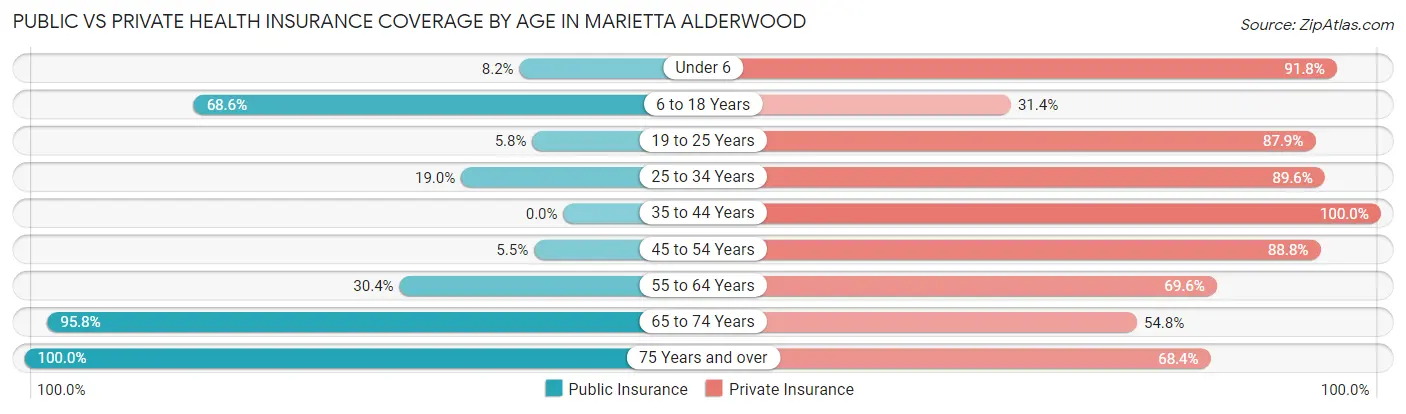
| Age Bracket | Public Insurance | Private Insurance |
| Under 6 | 12 (8.2%) | 135 (91.8%) |
| 6 to 18 Years | 295 (68.6%) | 135 (31.4%) |
| 19 to 25 Years | 27 (5.8%) | 412 (87.8%) |
| 25 to 34 Years | 64 (19.0%) | 302 (89.6%) |
| 35 to 44 Years | 0 (0.0%) | 499 (100.0%) |
| 45 to 54 Years | 17 (5.4%) | 277 (88.8%) |
| 55 to 64 Years | 126 (30.4%) | 288 (69.6%) |
| 65 to 74 Years | 409 (95.8%) | 234 (54.8%) |
| 75 Years and over | 269 (100.0%) | 184 (68.4%) |
| Total | 1,219 (36.9%) | 2,466 (74.6%) |
Disability Status by Sex by Age in Marietta Alderwood
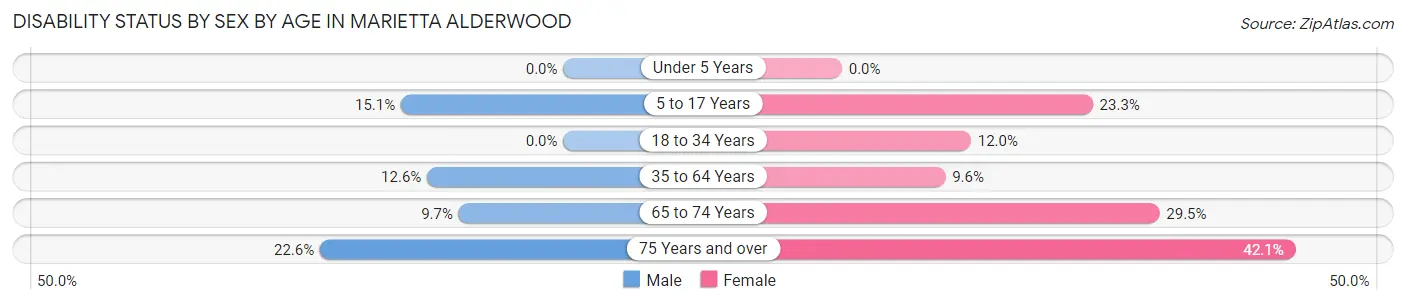
| Age Bracket | Male | Female |
| Under 5 Years | 0 (0.0%) | 0 (0.0%) |
| 5 to 17 Years | 36 (15.1%) | 44 (23.3%) |
| 18 to 34 Years | 0 (0.0%) | 73 (12.0%) |
| 35 to 64 Years | 89 (12.6%) | 50 (9.6%) |
| 65 to 74 Years | 23 (9.7%) | 56 (29.5%) |
| 75 Years and over | 35 (22.6%) | 48 (42.1%) |
Disability Class by Sex by Age in Marietta Alderwood
Disability Class: Hearing Difficulty
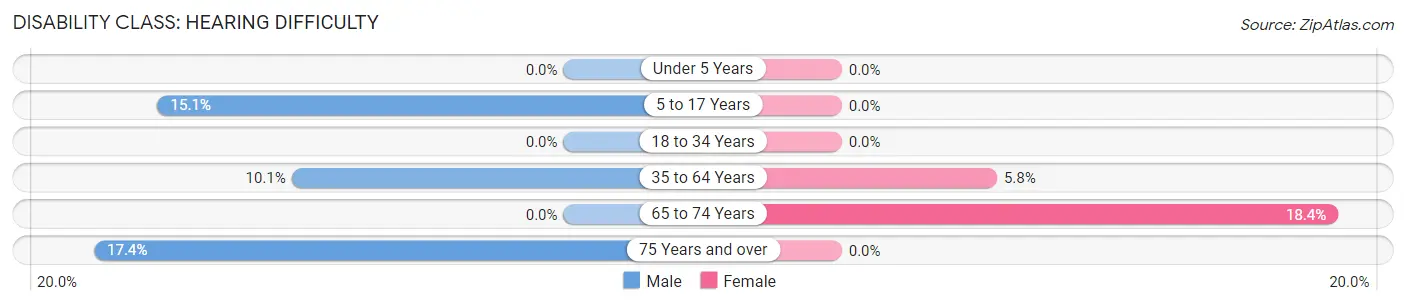
| Age Bracket | Male | Female |
| Under 5 Years | 0 (0.0%) | 0 (0.0%) |
| 5 to 17 Years | 36 (15.1%) | 0 (0.0%) |
| 18 to 34 Years | 0 (0.0%) | 0 (0.0%) |
| 35 to 64 Years | 71 (10.1%) | 30 (5.8%) |
| 65 to 74 Years | 0 (0.0%) | 35 (18.4%) |
| 75 Years and over | 27 (17.4%) | 0 (0.0%) |
Disability Class: Vision Difficulty
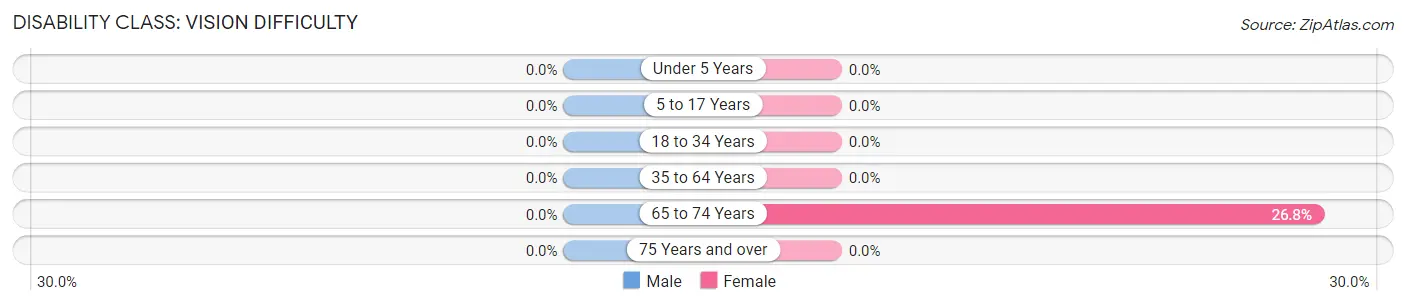
| Age Bracket | Male | Female |
| Under 5 Years | 0 (0.0%) | 0 (0.0%) |
| 5 to 17 Years | 0 (0.0%) | 0 (0.0%) |
| 18 to 34 Years | 0 (0.0%) | 0 (0.0%) |
| 35 to 64 Years | 0 (0.0%) | 0 (0.0%) |
| 65 to 74 Years | 0 (0.0%) | 51 (26.8%) |
| 75 Years and over | 0 (0.0%) | 0 (0.0%) |
Disability Class: Cognitive Difficulty
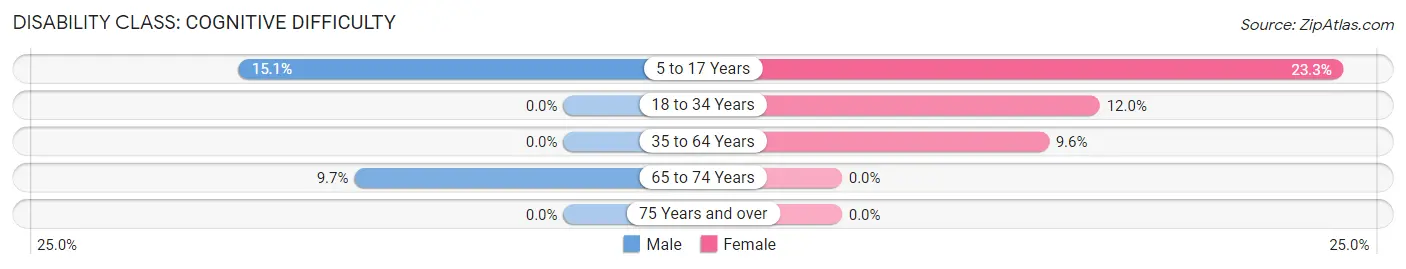
| Age Bracket | Male | Female |
| 5 to 17 Years | 36 (15.1%) | 44 (23.3%) |
| 18 to 34 Years | 0 (0.0%) | 73 (12.0%) |
| 35 to 64 Years | 0 (0.0%) | 50 (9.6%) |
| 65 to 74 Years | 23 (9.7%) | 0 (0.0%) |
| 75 Years and over | 0 (0.0%) | 0 (0.0%) |
Disability Class: Ambulatory Difficulty
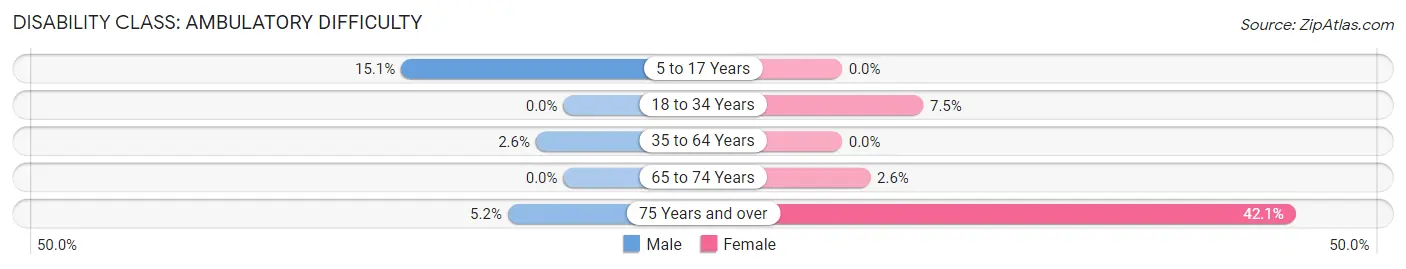
| Age Bracket | Male | Female |
| 5 to 17 Years | 36 (15.1%) | 0 (0.0%) |
| 18 to 34 Years | 0 (0.0%) | 46 (7.5%) |
| 35 to 64 Years | 18 (2.6%) | 0 (0.0%) |
| 65 to 74 Years | 0 (0.0%) | 5 (2.6%) |
| 75 Years and over | 8 (5.2%) | 48 (42.1%) |
Disability Class: Self-Care Difficulty
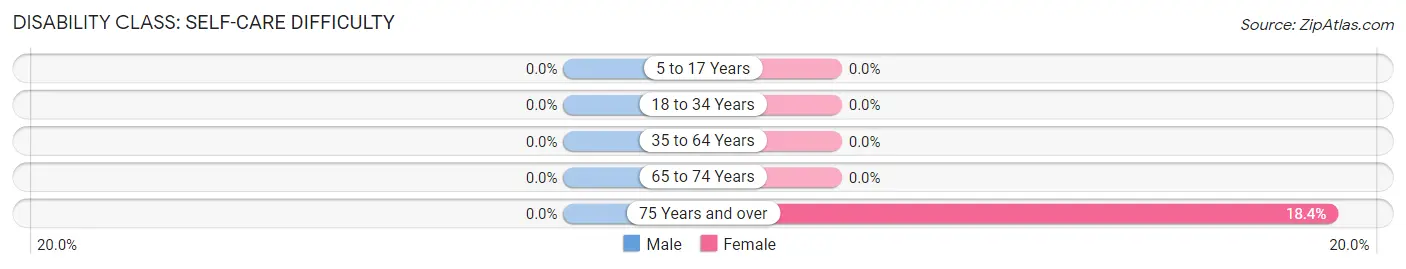
| Age Bracket | Male | Female |
| 5 to 17 Years | 0 (0.0%) | 0 (0.0%) |
| 18 to 34 Years | 0 (0.0%) | 0 (0.0%) |
| 35 to 64 Years | 0 (0.0%) | 0 (0.0%) |
| 65 to 74 Years | 0 (0.0%) | 0 (0.0%) |
| 75 Years and over | 0 (0.0%) | 21 (18.4%) |
Technology Access in Marietta Alderwood
Computing Device Access in Marietta Alderwood
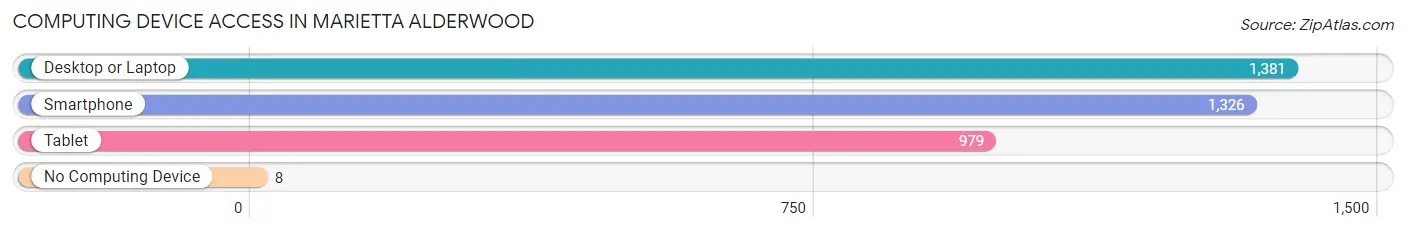
| Device Type | # Households | % Households |
| Desktop or Laptop | 1,381 | 93.5% |
| Smartphone | 1,326 | 89.8% |
| Tablet | 979 | 66.3% |
| No Computing Device | 8 | 0.5% |
| Total | 1,477 | 100.0% |
Internet Access in Marietta Alderwood
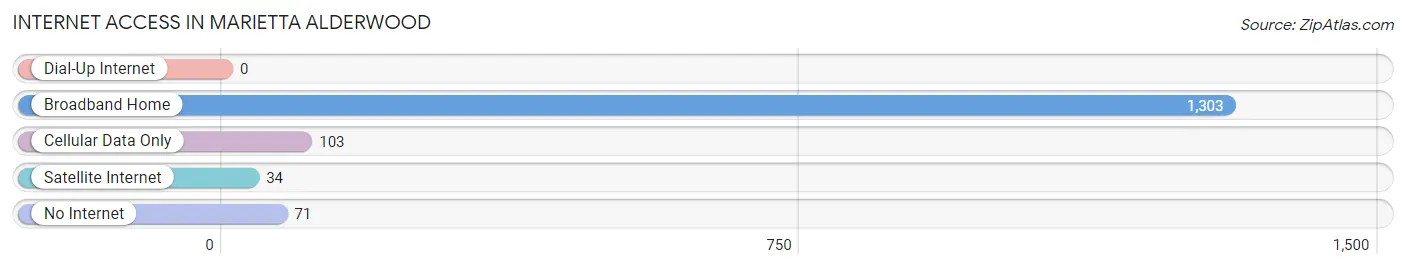
| Internet Type | # Households | % Households |
| Dial-Up Internet | 0 | 0.0% |
| Broadband Home | 1,303 | 88.2% |
| Cellular Data Only | 103 | 7.0% |
| Satellite Internet | 34 | 2.3% |
| No Internet | 71 | 4.8% |
| Total | 1,477 | 100.0% |
Marietta Alderwood Summary
Marietta Alderwood is a small unincorporated community located in Snohomish County, Washington. It is situated in the foothills of the Cascade Mountains, approximately 25 miles northeast of Seattle. The community is home to a population of approximately 1,000 people, and is known for its rural charm and close-knit community.
History
Marietta Alderwood was first settled in the late 1800s by a group of homesteaders who were drawn to the area by its abundant natural resources. The community was named after the daughter of one of the original settlers, Marietta Alderwood. The area was primarily used for logging and farming, and the first post office was established in 1891.
In the early 1900s, the area began to experience a population boom as more people moved to the area to take advantage of the abundant natural resources. The community was incorporated in 1909, and the first school was built in 1910.
Geography
Marietta Alderwood is located in the foothills of the Cascade Mountains, approximately 25 miles northeast of Seattle. The community is situated in a valley surrounded by mountains, and is home to a variety of wildlife, including deer, elk, and black bears. The area is known for its lush forests and abundant natural resources, including timber, fish, and game.
Economy
Marietta Alderwood is primarily a rural community, and the economy is largely based on agriculture and forestry. The area is home to several small farms, and the local timber industry provides employment for many of the residents. The community is also home to a variety of small businesses, including restaurants, shops, and services.
Demographics
As of the 2010 census, Marietta Alderwood had a population of 1,000 people. The population is primarily white (90%), with a small percentage of African American (3%), Asian (2%), and Hispanic (2%) residents. The median household income is $50,000, and the median age is 40.
Marietta Alderwood is a small, rural community with a close-knit population. The area is known for its natural beauty and abundance of natural resources, and is a popular destination for outdoor enthusiasts. The community is home to a variety of small businesses, and the local economy is largely based on agriculture and forestry.
Common Questions
What is Per Capita Income in Marietta Alderwood?
Per Capita income in Marietta Alderwood is $49,467.
What is the Median Family Income in Marietta Alderwood?
Median Family Income in Marietta Alderwood is $89,042.
What is the Median Household income in Marietta Alderwood?
Median Household Income in Marietta Alderwood is $83,507.
What is Income or Wage Gap in Marietta Alderwood?
Income or Wage Gap in Marietta Alderwood is 18.9%.
Women in Marietta Alderwood earn 81.1 cents for every dollar earned by a man.
What is Family Income Deficit in Marietta Alderwood?
Family Income Deficit in Marietta Alderwood is $14,164.
Families that are below poverty line in Marietta Alderwood earn $14,164 less on average than the poverty threshold level.
What is Inequality or Gini Index in Marietta Alderwood?
Inequality or Gini Index in Marietta Alderwood is 0.47.
What is the Total Population of Marietta Alderwood?
Total Population of Marietta Alderwood is 3,304.
What is the Total Male Population of Marietta Alderwood?
Total Male Population of Marietta Alderwood is 1,650.
What is the Total Female Population of Marietta Alderwood?
Total Female Population of Marietta Alderwood is 1,654.
What is the Ratio of Males per 100 Females in Marietta Alderwood?
There are 99.76 Males per 100 Females in Marietta Alderwood.
What is the Ratio of Females per 100 Males in Marietta Alderwood?
There are 100.24 Females per 100 Males in Marietta Alderwood.
What is the Median Population Age in Marietta Alderwood?
Median Population Age in Marietta Alderwood is 41.1 Years.
What is the Average Family Size in Marietta Alderwood
Average Family Size in Marietta Alderwood is 2.6 People.
What is the Average Household Size in Marietta Alderwood
Average Household Size in Marietta Alderwood is 2.2 People.
How Large is the Labor Force in Marietta Alderwood?
There are 1,806 People in the Labor Forcein in Marietta Alderwood.
What is the Percentage of People in the Labor Force in Marietta Alderwood?
65.2% of People are in the Labor Force in Marietta Alderwood.
What is the Unemployment Rate in Marietta Alderwood?
Unemployment Rate in Marietta Alderwood is 4.3%.