Southworth, WA Map & Demographics
Southworth Map
Southworth Overview
$56,428
PER CAPITA INCOME
$126,209
AVG FAMILY INCOME
$125,446
AVG HOUSEHOLD INCOME
41.6%
WAGE / INCOME GAP [ % ]
58.4¢/ $1
WAGE / INCOME GAP [ $ ]
0.28
INEQUALITY / GINI INDEX
1,953
TOTAL POPULATION
979
MALE POPULATION
974
FEMALE POPULATION
100.51
MALES / 100 FEMALES
99.49
FEMALES / 100 MALES
50.6
MEDIAN AGE
2.4
AVG FAMILY SIZE
2.2
AVG HOUSEHOLD SIZE
1,055
LABOR FORCE [ PEOPLE ]
61.6%
PERCENT IN LABOR FORCE
5.6%
UNEMPLOYMENT RATE
Income in Southworth
Income Overview in Southworth
Per Capita Income in Southworth is $56,428, while median incomes of families and households are $126,209 and $125,446 respectively.
| Characteristic | Number | Measure |
| Per Capita Income | 1,953 | $56,428 |
| Median Family Income | 683 | $126,209 |
| Mean Family Income | 683 | $129,689 |
| Median Household Income | 877 | $125,446 |
| Mean Household Income | 877 | $123,949 |
| Income Deficit | 683 | $0 |
| Wage / Income Gap (%) | 1,953 | 41.62% |
| Wage / Income Gap ($) | 1,953 | 58.38¢ per $1 |
| Gini / Inequality Index | 1,953 | 0.28 |
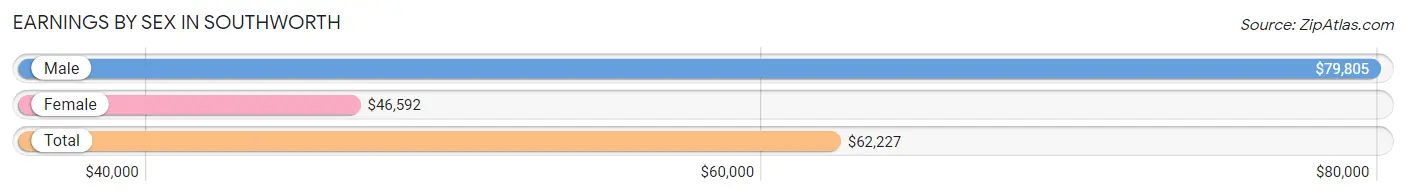
Earnings by Sex in Southworth
Average Earnings in Southworth are $62,227, $79,805 for men and $46,592 for women, a difference of 41.6%.
| Sex | Number | Average Earnings |
| Male | 689 (63.2%) | $79,805 |
| Female | 401 (36.8%) | $46,592 |
| Total | 1,090 (100.0%) | $62,227 |
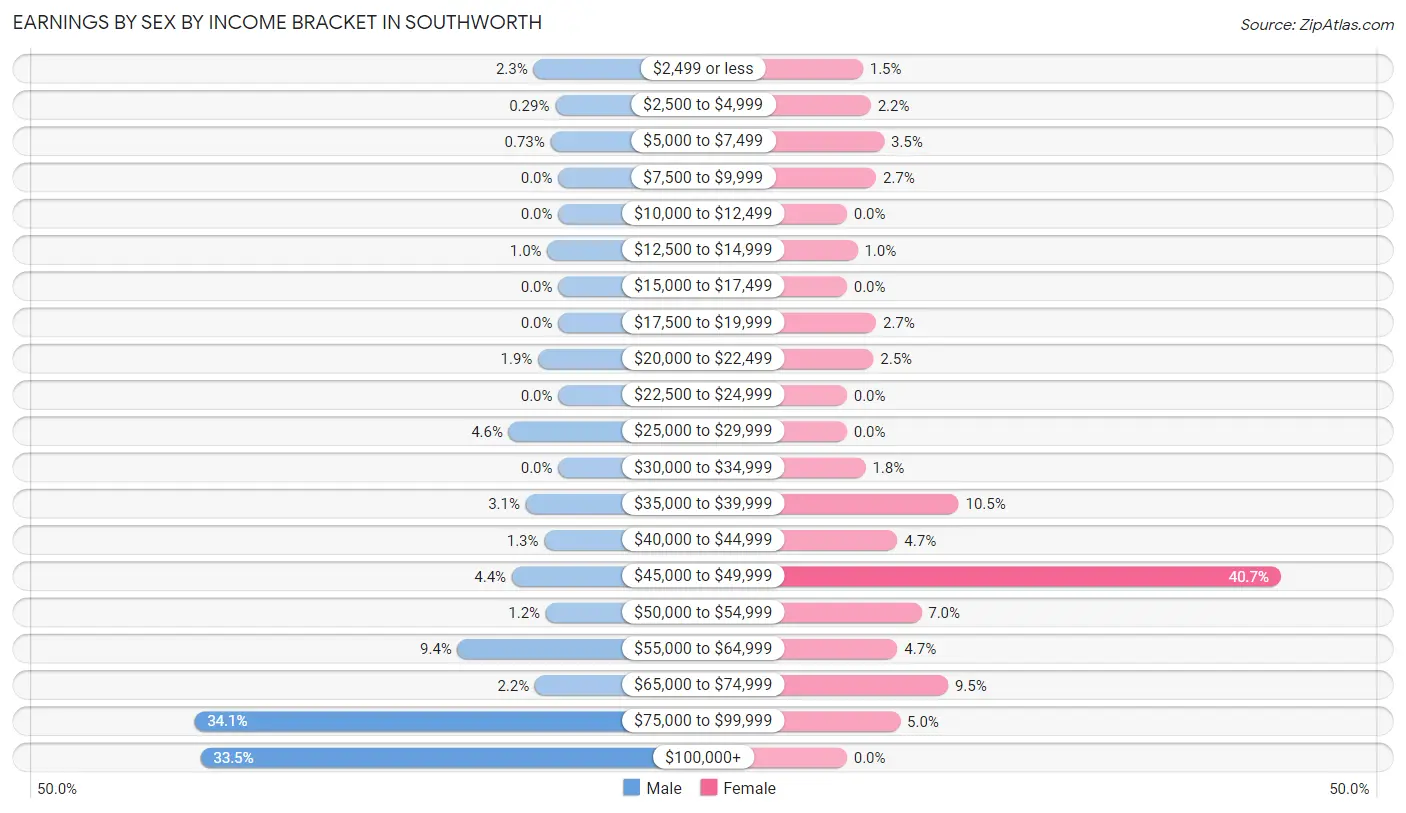
Earnings by Sex by Income Bracket in Southworth
The most common earnings brackets in Southworth are $75,000 to $99,999 for men (235 | 34.1%) and $45,000 to $49,999 for women (163 | 40.6%).
| Income | Male | Female |
| $2,499 or less | 16 (2.3%) | 6 (1.5%) |
| $2,500 to $4,999 | 2 (0.3%) | 9 (2.2%) |
| $5,000 to $7,499 | 5 (0.7%) | 14 (3.5%) |
| $7,500 to $9,999 | 0 (0.0%) | 11 (2.7%) |
| $10,000 to $12,499 | 0 (0.0%) | 0 (0.0%) |
| $12,500 to $14,999 | 7 (1.0%) | 4 (1.0%) |
| $15,000 to $17,499 | 0 (0.0%) | 0 (0.0%) |
| $17,500 to $19,999 | 0 (0.0%) | 11 (2.7%) |
| $20,000 to $22,499 | 13 (1.9%) | 10 (2.5%) |
| $22,500 to $24,999 | 0 (0.0%) | 0 (0.0%) |
| $25,000 to $29,999 | 32 (4.6%) | 0 (0.0%) |
| $30,000 to $34,999 | 0 (0.0%) | 7 (1.8%) |
| $35,000 to $39,999 | 21 (3.0%) | 42 (10.5%) |
| $40,000 to $44,999 | 9 (1.3%) | 19 (4.7%) |
| $45,000 to $49,999 | 30 (4.3%) | 163 (40.6%) |
| $50,000 to $54,999 | 8 (1.2%) | 28 (7.0%) |
| $55,000 to $64,999 | 65 (9.4%) | 19 (4.7%) |
| $65,000 to $74,999 | 15 (2.2%) | 38 (9.5%) |
| $75,000 to $99,999 | 235 (34.1%) | 20 (5.0%) |
| $100,000+ | 231 (33.5%) | 0 (0.0%) |
| Total | 689 (100.0%) | 401 (100.0%) |
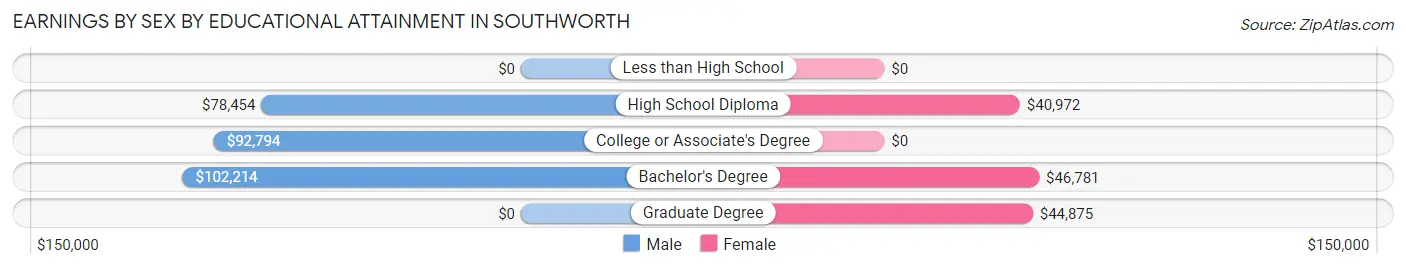
Earnings by Sex by Educational Attainment in Southworth
Average earnings in Southworth are $79,744 for men and $46,745 for women, a difference of 41.4%. Men with an educational attainment of bachelor's degree enjoy the highest average annual earnings of $102,214, while those with high school diploma education earn the least with $78,454. Women with an educational attainment of bachelor's degree earn the most with the average annual earnings of $46,781, while those with high school diploma education have the smallest earnings of $40,972.
| Educational Attainment | Male Income | Female Income |
| Less than High School | - | - |
| High School Diploma | $78,454 | $40,972 |
| College or Associate's Degree | $92,794 | $0 |
| Bachelor's Degree | $102,214 | $46,781 |
| Graduate Degree | - | - |
| Total | $79,744 | $46,745 |
Family Income in Southworth
Family Income Brackets in Southworth
According to the Southworth family income data, there are 258 families falling into the $100,000 to $149,999 income range, which is the most common income bracket and makes up 37.8% of all families.
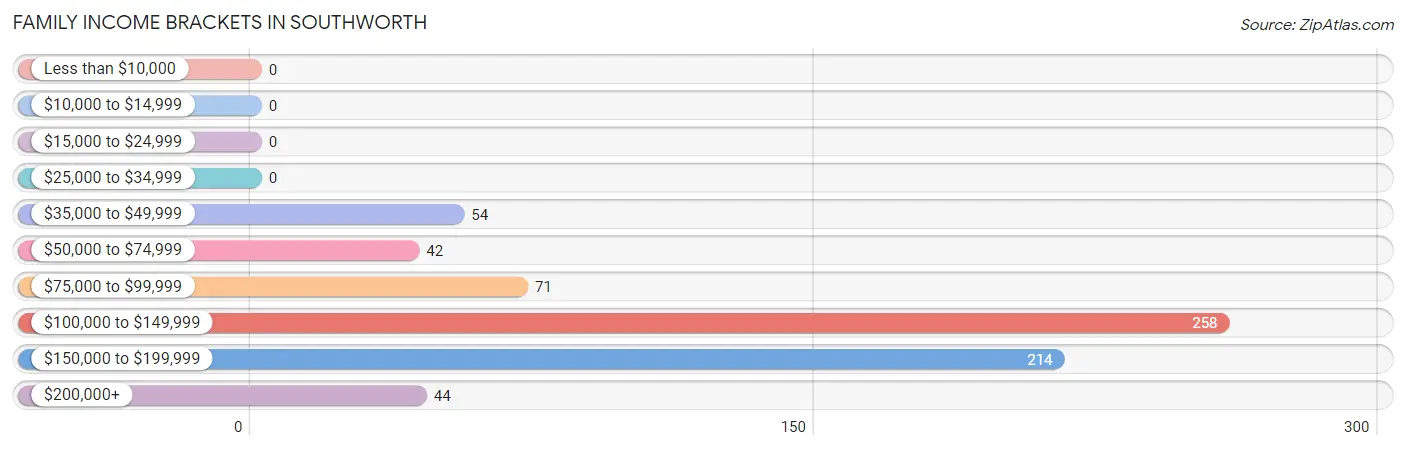
| Income Bracket | # Families | % Families |
| Less than $10,000 | 0 | 0.0% |
| $10,000 to $14,999 | 0 | 0.0% |
| $15,000 to $24,999 | 0 | 0.0% |
| $25,000 to $34,999 | 0 | 0.0% |
| $35,000 to $49,999 | 54 | 7.9% |
| $50,000 to $74,999 | 42 | 6.1% |
| $75,000 to $99,999 | 71 | 10.4% |
| $100,000 to $149,999 | 258 | 37.8% |
| $150,000 to $199,999 | 214 | 31.3% |
| $200,000+ | 44 | 6.4% |
Family Income by Famaliy Size in Southworth
2-person families (486 | 71.2%) account for the highest median family income in Southworth with $126,118 per family, while 2-person families (486 | 71.2%) have the highest median income of $63,059 per family member.
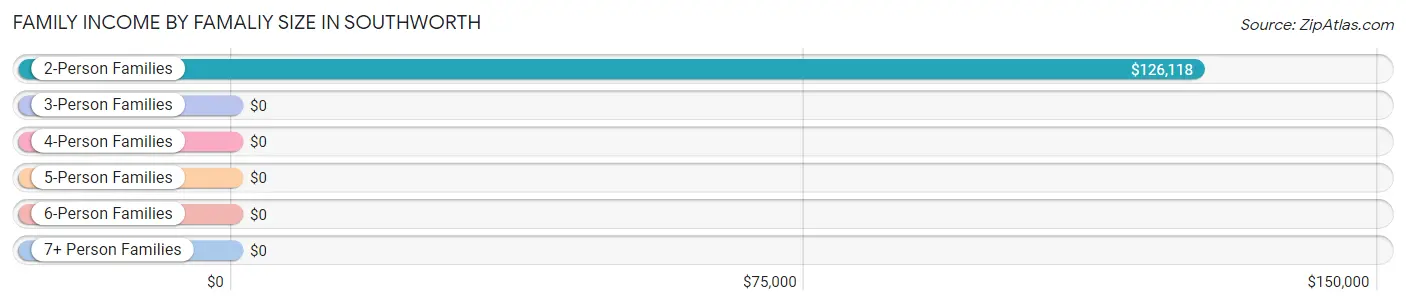
| Income Bracket | # Families | Median Income |
| 2-Person Families | 486 (71.2%) | $126,118 |
| 3-Person Families | 138 (20.2%) | $0 |
| 4-Person Families | 33 (4.8%) | $0 |
| 5-Person Families | 18 (2.6%) | $0 |
| 6-Person Families | 8 (1.2%) | $0 |
| 7+ Person Families | 0 (0.0%) | $0 |
| Total | 683 (100.0%) | $126,209 |
Family Income by Number of Earners in Southworth
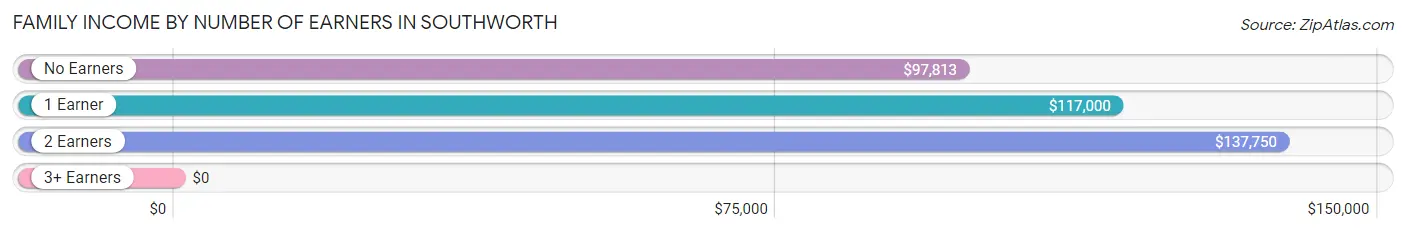
| Number of Earners | # Families | Median Income |
| No Earners | 122 (17.9%) | $97,813 |
| 1 Earner | 236 (34.5%) | $117,000 |
| 2 Earners | 312 (45.7%) | $137,750 |
| 3+ Earners | 13 (1.9%) | $0 |
| Total | 683 (100.0%) | $126,209 |
Household Income in Southworth
Household Income Brackets in Southworth
With 281 households falling in the category, the $100,000 to $149,999 income range is the most frequent in Southworth, accounting for 32.0% of all households.
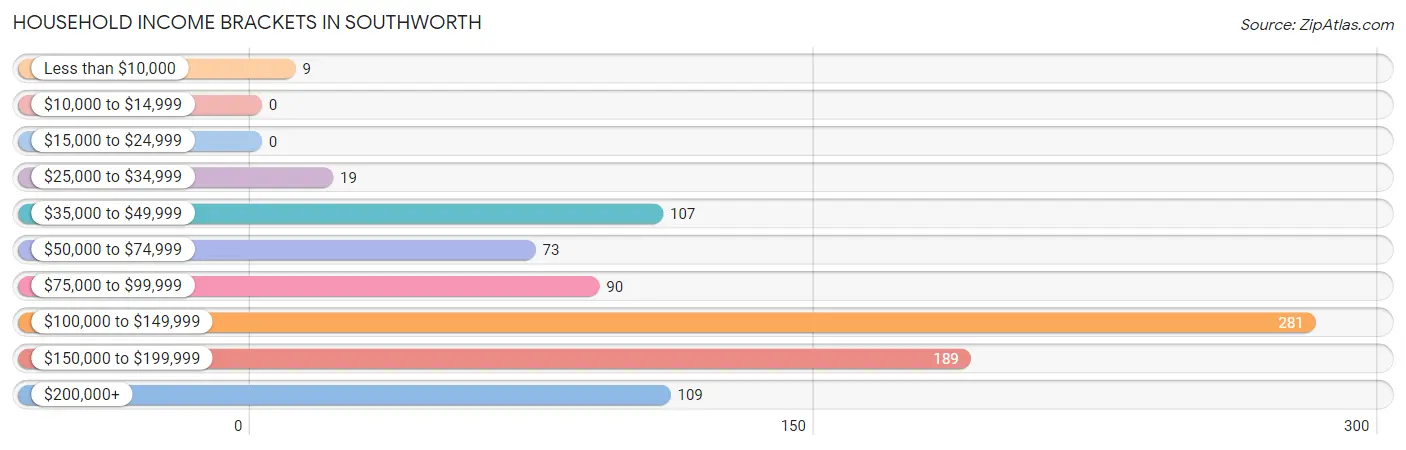
| Income Bracket | # Households | % Households |
| Less than $10,000 | 9 | 1.0% |
| $10,000 to $14,999 | 0 | 0.0% |
| $15,000 to $24,999 | 0 | 0.0% |
| $25,000 to $34,999 | 19 | 2.2% |
| $35,000 to $49,999 | 107 | 12.2% |
| $50,000 to $74,999 | 73 | 8.3% |
| $75,000 to $99,999 | 90 | 10.3% |
| $100,000 to $149,999 | 281 | 32.0% |
| $150,000 to $199,999 | 189 | 21.6% |
| $200,000+ | 109 | 12.4% |
Household Income by Householder Age in Southworth
The median household income in Southworth is $125,446, with the highest median household income of $127,378 found in the 45 to 64 years age bracket for the primary householder. A total of 438 households (49.9%) fall into this category. Meanwhile, the 15 to 24 years age bracket for the primary householder has the lowest median household income of $0, with 33 households (3.8%) in this group.
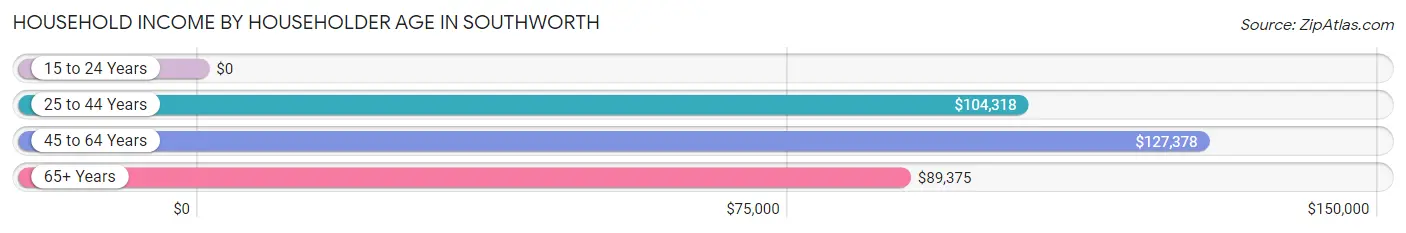
| Income Bracket | # Households | Median Income |
| 15 to 24 Years | 33 (3.8%) | $0 |
| 25 to 44 Years | 140 (16.0%) | $104,318 |
| 45 to 64 Years | 438 (49.9%) | $127,378 |
| 65+ Years | 266 (30.3%) | $89,375 |
| Total | 877 (100.0%) | $125,446 |
Poverty in Southworth
Income Below Poverty by Sex and Age in Southworth
With 1.2% poverty level for males and 1.1% for females among the residents of Southworth, 25 to 34 year old males and 75 year old and over females are the most vulnerable to poverty, with 5 males (13.9%) and 9 females (9.9%) in their respective age groups living below the poverty level.
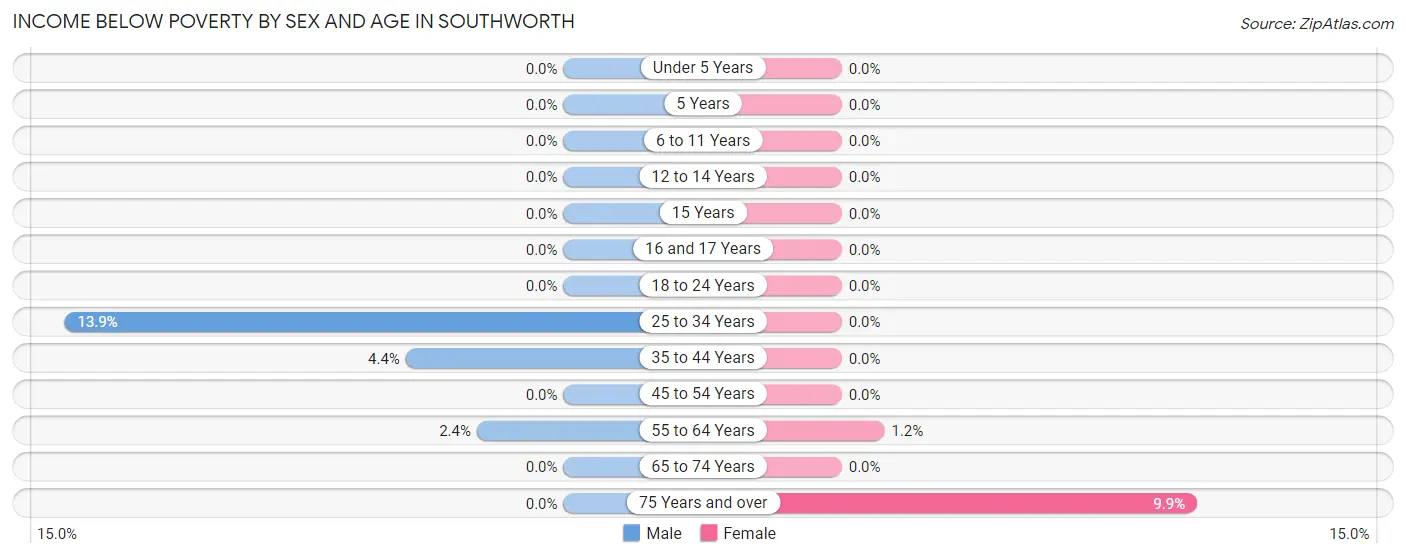
| Age Bracket | Male | Female |
| Under 5 Years | 0 (0.0%) | 0 (0.0%) |
| 5 Years | 0 (0.0%) | 0 (0.0%) |
| 6 to 11 Years | 0 (0.0%) | 0 (0.0%) |
| 12 to 14 Years | 0 (0.0%) | 0 (0.0%) |
| 15 Years | 0 (0.0%) | 0 (0.0%) |
| 16 and 17 Years | 0 (0.0%) | 0 (0.0%) |
| 18 to 24 Years | 0 (0.0%) | 0 (0.0%) |
| 25 to 34 Years | 5 (13.9%) | 0 (0.0%) |
| 35 to 44 Years | 5 (4.4%) | 0 (0.0%) |
| 45 to 54 Years | 0 (0.0%) | 0 (0.0%) |
| 55 to 64 Years | 2 (2.4%) | 2 (1.2%) |
| 65 to 74 Years | 0 (0.0%) | 0 (0.0%) |
| 75 Years and over | 0 (0.0%) | 9 (9.9%) |
| Total | 12 (1.2%) | 11 (1.1%) |
Income Above Poverty by Sex and Age in Southworth
According to the poverty statistics in Southworth, males aged 5 years and females aged under 5 years are the age groups that are most secure financially, with 100.0% of males and 100.0% of females in these age groups living above the poverty line.
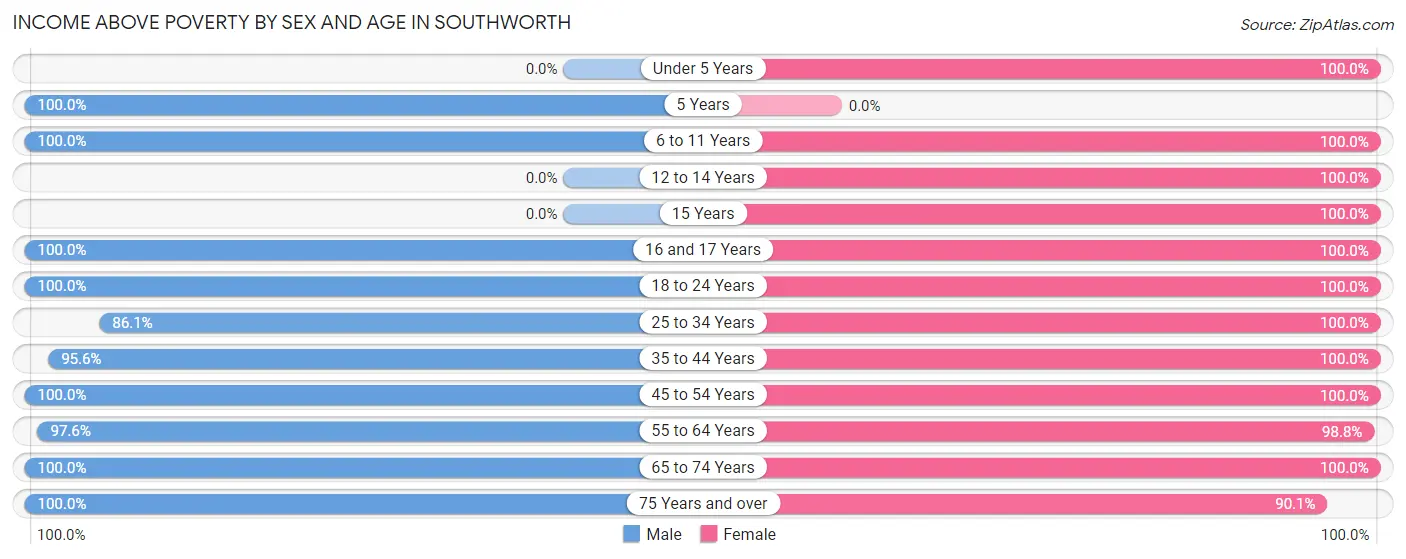
| Age Bracket | Male | Female |
| Under 5 Years | 0 (0.0%) | 97 (100.0%) |
| 5 Years | 16 (100.0%) | 0 (0.0%) |
| 6 to 11 Years | 6 (100.0%) | 37 (100.0%) |
| 12 to 14 Years | 0 (0.0%) | 32 (100.0%) |
| 15 Years | 0 (0.0%) | 53 (100.0%) |
| 16 and 17 Years | 8 (100.0%) | 13 (100.0%) |
| 18 to 24 Years | 124 (100.0%) | 46 (100.0%) |
| 25 to 34 Years | 31 (86.1%) | 66 (100.0%) |
| 35 to 44 Years | 109 (95.6%) | 83 (100.0%) |
| 45 to 54 Years | 375 (100.0%) | 182 (100.0%) |
| 55 to 64 Years | 81 (97.6%) | 166 (98.8%) |
| 65 to 74 Years | 144 (100.0%) | 106 (100.0%) |
| 75 Years and over | 73 (100.0%) | 82 (90.1%) |
| Total | 967 (98.8%) | 963 (98.9%) |
Income Below Poverty Among Married-Couple Families in Southworth
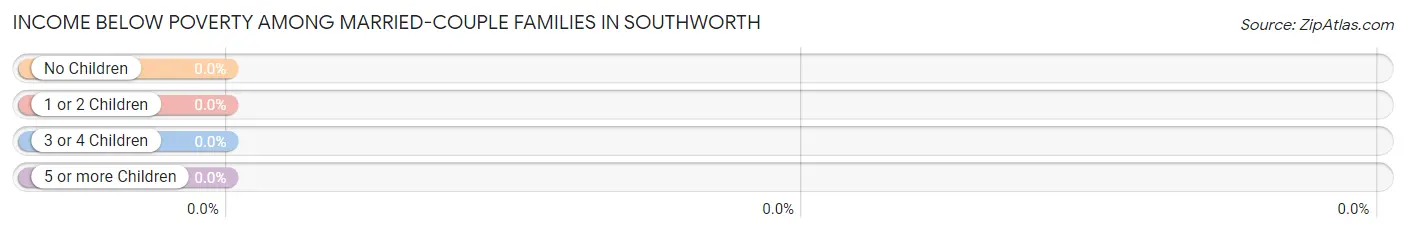
| Children | Above Poverty | Below Poverty |
| No Children | 377 (100.0%) | 0 (0.0%) |
| 1 or 2 Children | 154 (100.0%) | 0 (0.0%) |
| 3 or 4 Children | 11 (100.0%) | 0 (0.0%) |
| 5 or more Children | 0 (0.0%) | 0 (0.0%) |
| Total | 542 (100.0%) | 0 (0.0%) |
Income Below Poverty Among Single-Parent Households in Southworth
| Children | Single Father | Single Mother |
| No Children | 0 (0.0%) | 0 (0.0%) |
| 1 or 2 Children | 0 (0.0%) | 0 (0.0%) |
| 3 or 4 Children | 0 (0.0%) | 0 (0.0%) |
| 5 or more Children | 0 (0.0%) | 0 (0.0%) |
| Total | 0 (0.0%) | 0 (0.0%) |
Income Below Poverty Among Married-Couple vs Single-Parent Households in Southworth
| Children | Married-Couple Families | Single-Parent Households |
| No Children | 0 (0.0%) | 0 (0.0%) |
| 1 or 2 Children | 0 (0.0%) | 0 (0.0%) |
| 3 or 4 Children | 0 (0.0%) | 0 (0.0%) |
| 5 or more Children | 0 (0.0%) | 0 (0.0%) |
| Total | 0 (0.0%) | 0 (0.0%) |
Race in Southworth
The most populous races in Southworth are White / Caucasian (1,792 | 91.8%), Two or more Races (107 | 5.5%), and Hispanic or Latino (79 | 4.1%).
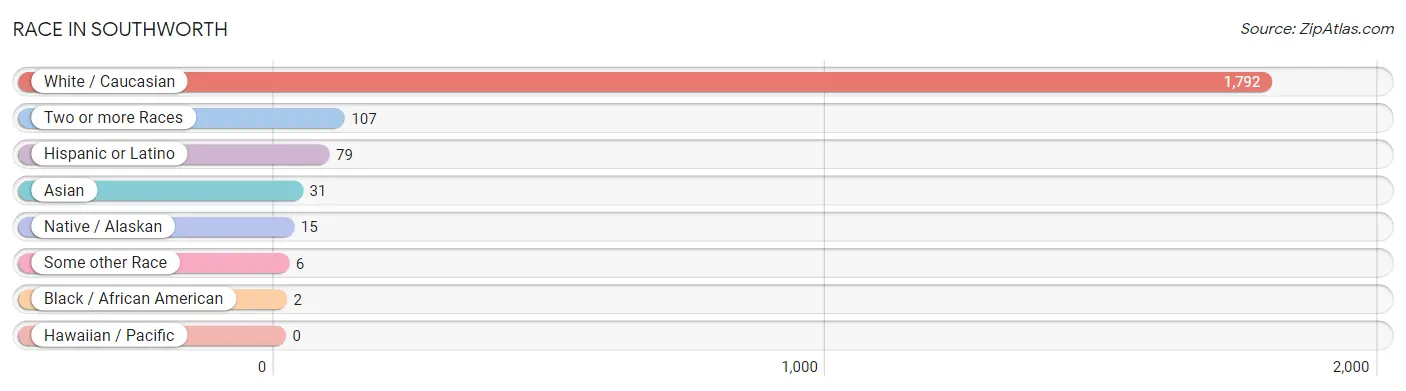
| Race | # Population | % Population |
| Asian | 31 | 1.6% |
| Black / African American | 2 | 0.1% |
| Hawaiian / Pacific | 0 | 0.0% |
| Hispanic or Latino | 79 | 4.1% |
| Native / Alaskan | 15 | 0.8% |
| White / Caucasian | 1,792 | 91.8% |
| Two or more Races | 107 | 5.5% |
| Some other Race | 6 | 0.3% |
| Total | 1,953 | 100.0% |
Ancestry in Southworth
The most populous ancestries reported in Southworth are Irish (436 | 22.3%), German (316 | 16.2%), English (307 | 15.7%), Norwegian (152 | 7.8%), and European (70 | 3.6%), together accounting for 65.6% of all Southworth residents.
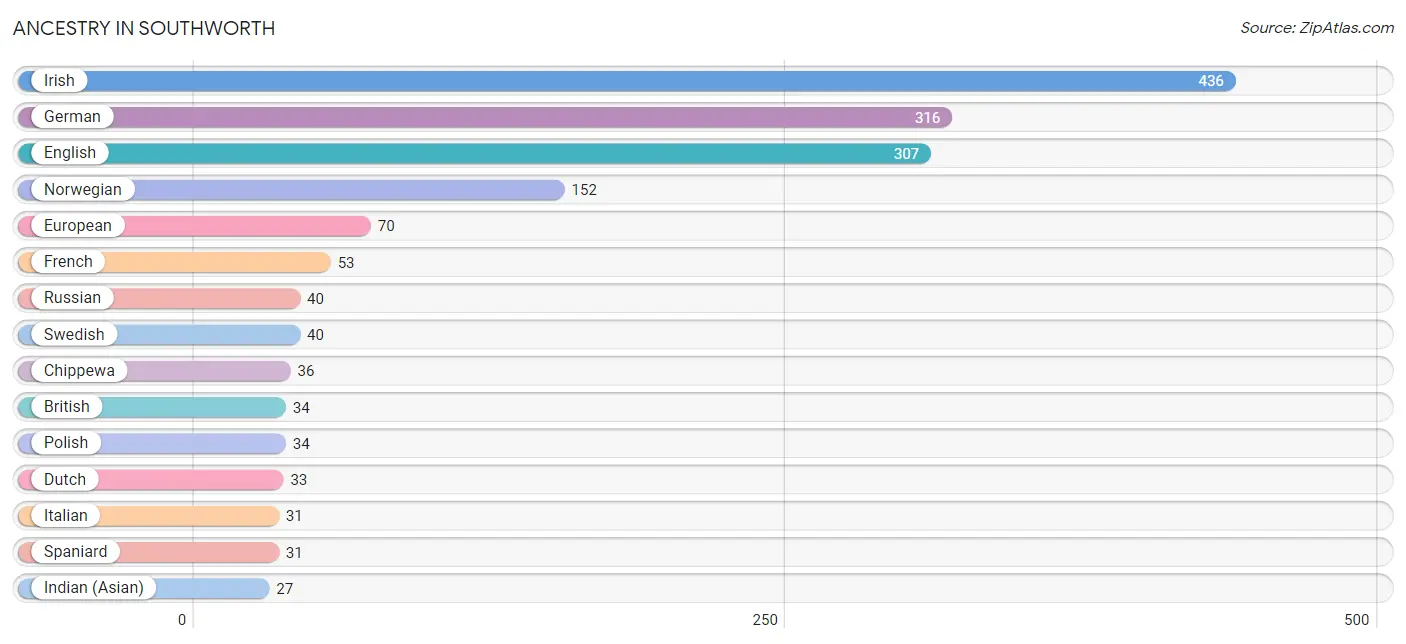
| Ancestry | # Population | % Population |
| Austrian | 4 | 0.2% |
| Bhutanese | 21 | 1.1% |
| British | 34 | 1.7% |
| Canadian | 2 | 0.1% |
| Chippewa | 36 | 1.8% |
| Cuban | 18 | 0.9% |
| Danish | 24 | 1.2% |
| Dutch | 33 | 1.7% |
| English | 307 | 15.7% |
| European | 70 | 3.6% |
| Finnish | 8 | 0.4% |
| French | 53 | 2.7% |
| German | 316 | 16.2% |
| Indian (Asian) | 27 | 1.4% |
| Irish | 436 | 22.3% |
| Italian | 31 | 1.6% |
| Latvian | 9 | 0.5% |
| Mexican | 24 | 1.2% |
| Mexican American Indian | 10 | 0.5% |
| Northern European | 13 | 0.7% |
| Norwegian | 152 | 7.8% |
| Polish | 34 | 1.7% |
| Russian | 40 | 2.1% |
| Scandinavian | 12 | 0.6% |
| Scottish | 18 | 0.9% |
| Spaniard | 31 | 1.6% |
| Spanish | 6 | 0.3% |
| Swedish | 40 | 2.1% |
| Swiss | 9 | 0.5% |
| Thai | 14 | 0.7% |
| Ukrainian | 15 | 0.8% | View All 31 Rows |
Immigrants in Southworth
The most numerous immigrant groups reported in Southworth came from Latin America (14 | 0.7%), England (9 | 0.5%), Europe (9 | 0.5%), Northern Europe (9 | 0.5%), and Caribbean (8 | 0.4%), together accounting for 2.5% of all Southworth residents.
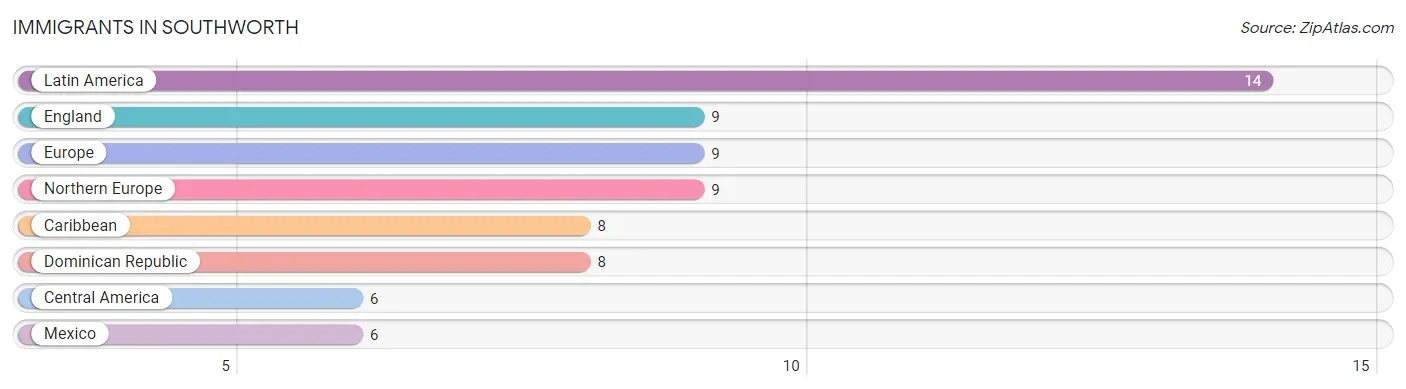
| Immigration Origin | # Population | % Population |
| Caribbean | 8 | 0.4% |
| Central America | 6 | 0.3% |
| Dominican Republic | 8 | 0.4% |
| England | 9 | 0.5% |
| Europe | 9 | 0.5% |
| Latin America | 14 | 0.7% |
| Mexico | 6 | 0.3% |
| Northern Europe | 9 | 0.5% | View All 8 Rows |
Sex and Age in Southworth
Sex and Age in Southworth
The most populous age groups in Southworth are 50 to 54 Years (236 | 24.1%) for men and 60 to 64 Years (122 | 12.5%) for women.
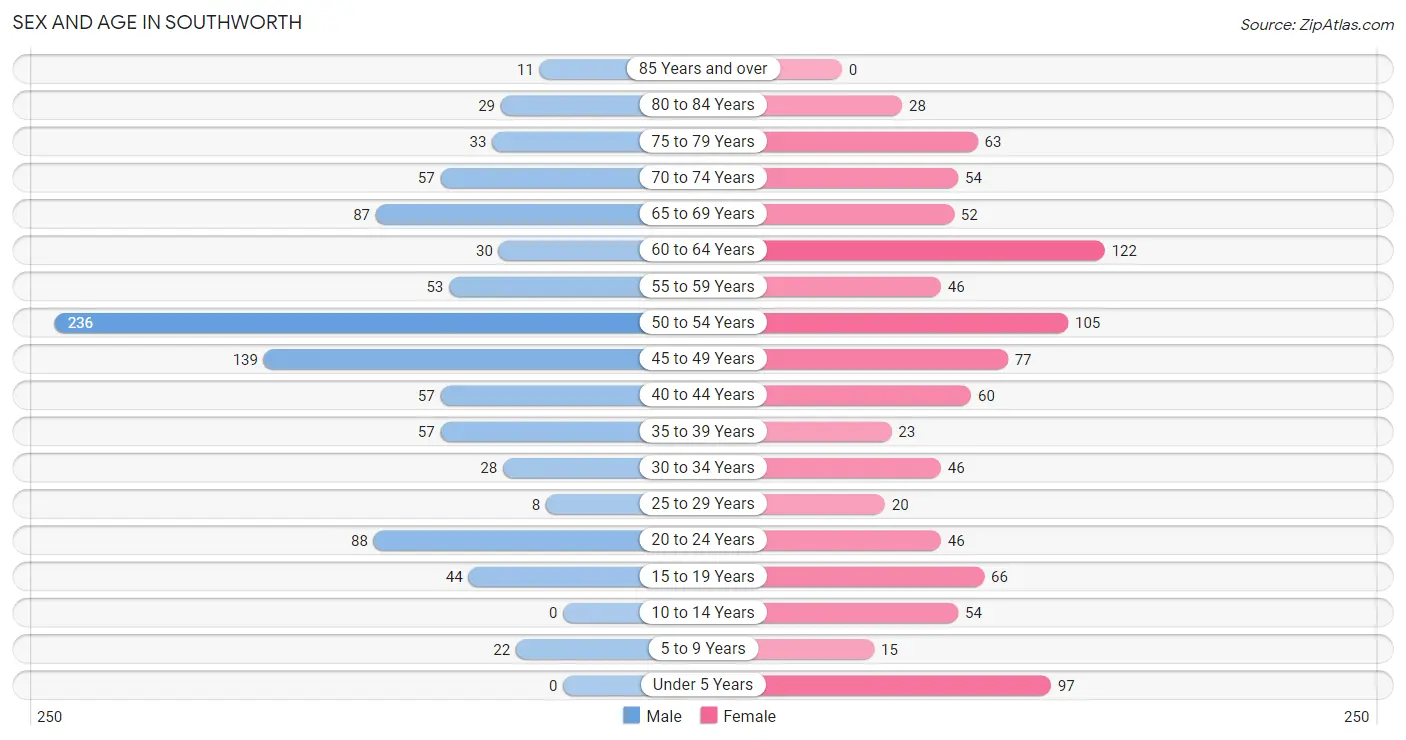
| Age Bracket | Male | Female |
| Under 5 Years | 0 (0.0%) | 97 (10.0%) |
| 5 to 9 Years | 22 (2.2%) | 15 (1.5%) |
| 10 to 14 Years | 0 (0.0%) | 54 (5.5%) |
| 15 to 19 Years | 44 (4.5%) | 66 (6.8%) |
| 20 to 24 Years | 88 (9.0%) | 46 (4.7%) |
| 25 to 29 Years | 8 (0.8%) | 20 (2.1%) |
| 30 to 34 Years | 28 (2.9%) | 46 (4.7%) |
| 35 to 39 Years | 57 (5.8%) | 23 (2.4%) |
| 40 to 44 Years | 57 (5.8%) | 60 (6.2%) |
| 45 to 49 Years | 139 (14.2%) | 77 (7.9%) |
| 50 to 54 Years | 236 (24.1%) | 105 (10.8%) |
| 55 to 59 Years | 53 (5.4%) | 46 (4.7%) |
| 60 to 64 Years | 30 (3.1%) | 122 (12.5%) |
| 65 to 69 Years | 87 (8.9%) | 52 (5.3%) |
| 70 to 74 Years | 57 (5.8%) | 54 (5.5%) |
| 75 to 79 Years | 33 (3.4%) | 63 (6.5%) |
| 80 to 84 Years | 29 (3.0%) | 28 (2.9%) |
| 85 Years and over | 11 (1.1%) | 0 (0.0%) |
| Total | 979 (100.0%) | 974 (100.0%) |
Families and Households in Southworth
Median Family Size in Southworth
The median family size in Southworth is 2.40 persons per family, with married-couple families (542 | 79.4%) accounting for the largest median family size of 2.44 persons per family. On the other hand, single female/mother families (42 | 6.1%) represent the smallest median family size with 2.21 persons per family.
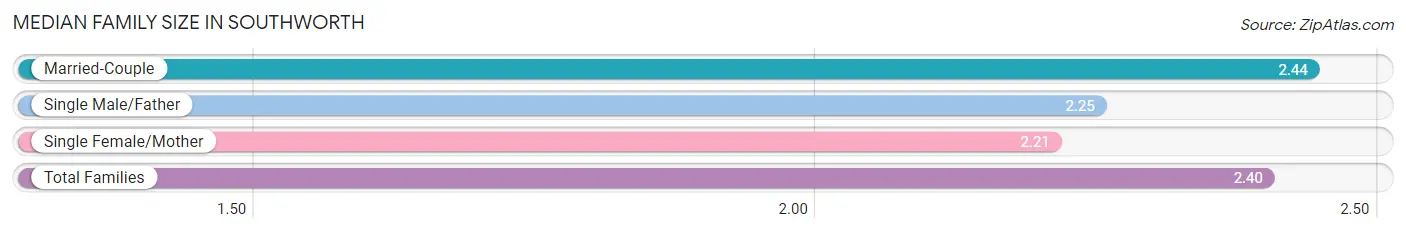
| Family Type | # Families | Family Size |
| Married-Couple | 542 (79.4%) | 2.44 |
| Single Male/Father | 99 (14.5%) | 2.25 |
| Single Female/Mother | 42 (6.1%) | 2.21 |
| Total Families | 683 (100.0%) | 2.40 |
Median Household Size in Southworth
The median household size in Southworth is 2.20 persons per household, with single male/father households (99 | 11.3%) accounting for the largest median household size of 2.81 persons per household. non-family households (194 | 22.1%) represent the smallest median household size with 1.18 persons per household.
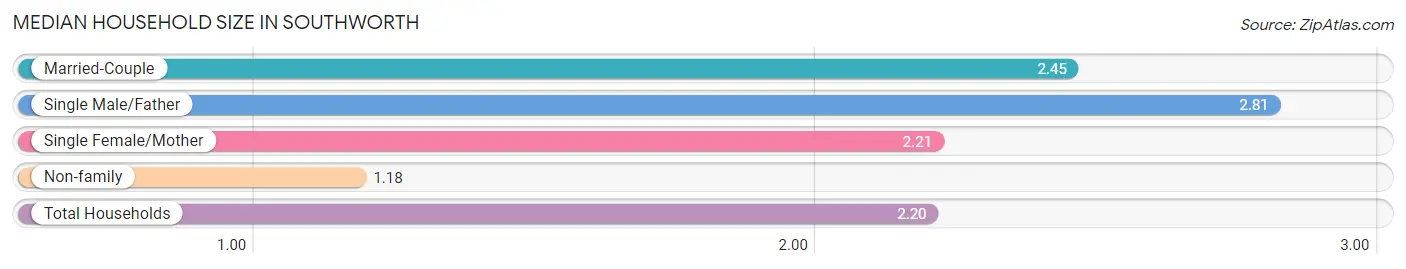
| Household Type | # Households | Household Size |
| Married-Couple | 542 (61.8%) | 2.45 |
| Single Male/Father | 99 (11.3%) | 2.81 |
| Single Female/Mother | 42 (4.8%) | 2.21 |
| Non-family | 194 (22.1%) | 1.18 |
| Total Households | 877 (100.0%) | 2.20 |
Household Size by Marriage Status in Southworth
Out of a total of 877 households in Southworth, 683 (77.9%) are family households, while 194 (22.1%) are nonfamily households. The most numerous type of family households are 2-person households, comprising 438, and the most common type of nonfamily households are 1-person households, comprising 159.
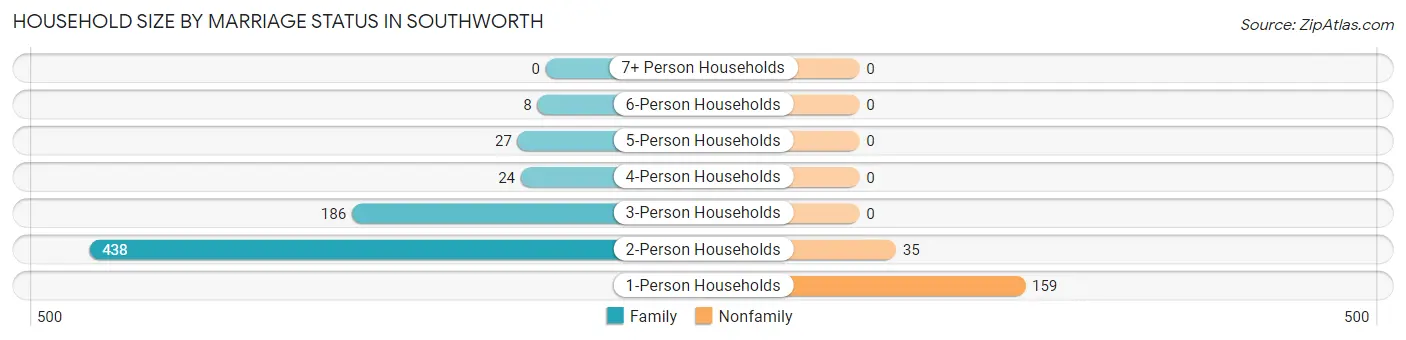
| Household Size | Family Households | Nonfamily Households |
| 1-Person Households | - | 159 (18.1%) |
| 2-Person Households | 438 (49.9%) | 35 (4.0%) |
| 3-Person Households | 186 (21.2%) | 0 (0.0%) |
| 4-Person Households | 24 (2.7%) | 0 (0.0%) |
| 5-Person Households | 27 (3.1%) | 0 (0.0%) |
| 6-Person Households | 8 (0.9%) | 0 (0.0%) |
| 7+ Person Households | 0 (0.0%) | 0 (0.0%) |
| Total | 683 (77.9%) | 194 (22.1%) |
Female Fertility in Southworth
Fertility by Age in Southworth
| Age Bracket | Women with Births | Births / 1,000 Women |
| 15 to 19 years | 0 (0.0%) | 0.0 |
| 20 to 34 years | 0 (0.0%) | 0.0 |
| 35 to 50 years | 0 (0.0%) | 0.0 |
| Total | 0 (0.0%) | 0.0 |
Fertility by Age by Marriage Status in Southworth
| Age Bracket | Married | Unmarried |
| 15 to 19 years | 0 (0.0%) | 0 (0.0%) |
| 20 to 34 years | 0 (0.0%) | 0 (0.0%) |
| 35 to 50 years | 0 (0.0%) | 0 (0.0%) |
| Total | 0 (0.0%) | 0 (0.0%) |
Fertility by Education in Southworth
| Educational Attainment | Women with Births | Births / 1,000 Women |
| Less than High School | 0 (0.0%) | 0.0 |
| High School Diploma | 0 (0.0%) | 0.0 |
| College or Associate's Degree | 0 (0.0%) | 0.0 |
| Bachelor's Degree | 0 (0.0%) | 0.0 |
| Graduate Degree | 0 (0.0%) | 0.0 |
| Total | 0 (0.0%) | 0.0 |
Fertility by Education by Marriage Status in Southworth
| Educational Attainment | Married | Unmarried |
| Less than High School | 0 (0.0%) | 0 (0.0%) |
| High School Diploma | 0 (0.0%) | 0 (0.0%) |
| College or Associate's Degree | 0 (0.0%) | 0 (0.0%) |
| Bachelor's Degree | 0 (0.0%) | 0 (0.0%) |
| Graduate Degree | 0 (0.0%) | 0 (0.0%) |
| Total | 0 (0.0%) | 0 (0.0%) |
Employment Characteristics in Southworth
Employment by Class of Employer in Southworth
Among the 974 employed individuals in Southworth, private company employees (672 | 69.0%), local government employees (95 | 9.8%), and federal government employees (53 | 5.4%) make up the most common classes of employment.
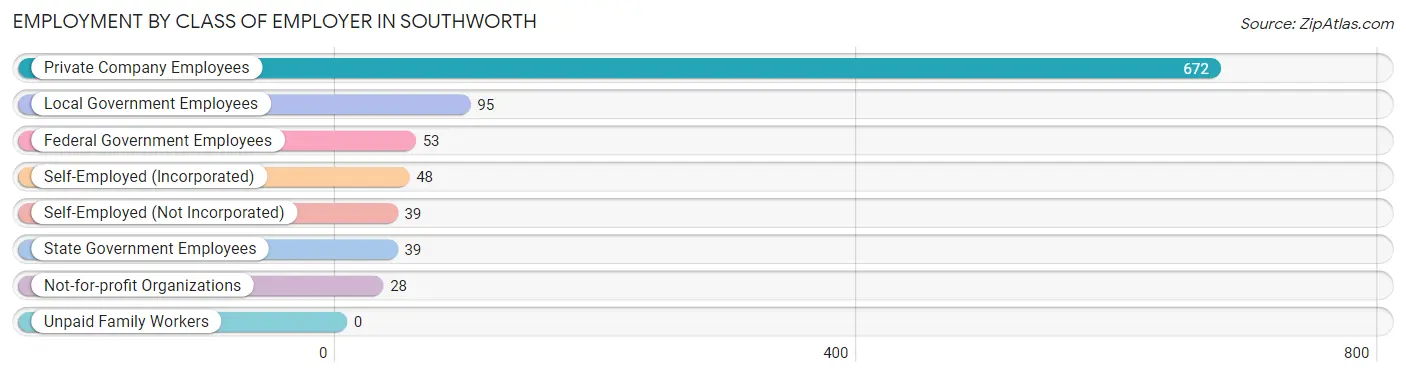
| Employer Class | # Employees | % Employees |
| Private Company Employees | 672 | 69.0% |
| Self-Employed (Incorporated) | 48 | 4.9% |
| Self-Employed (Not Incorporated) | 39 | 4.0% |
| Not-for-profit Organizations | 28 | 2.9% |
| Local Government Employees | 95 | 9.8% |
| State Government Employees | 39 | 4.0% |
| Federal Government Employees | 53 | 5.4% |
| Unpaid Family Workers | 0 | 0.0% |
| Total | 974 | 100.0% |
Employment Status by Age in Southworth
According to the labor force statistics for Southworth, out of the total population over 16 years of age (1,712), 61.6% or 1,055 individuals are in the labor force, with 5.6% or 59 of them unemployed. The age group with the highest labor force participation rate is 25 to 29 years, with 100.0% or 28 individuals in the labor force. Within the labor force, the 25 to 29 years age range has the highest percentage of unemployed individuals, with 43.5% or 12 of them being unemployed.
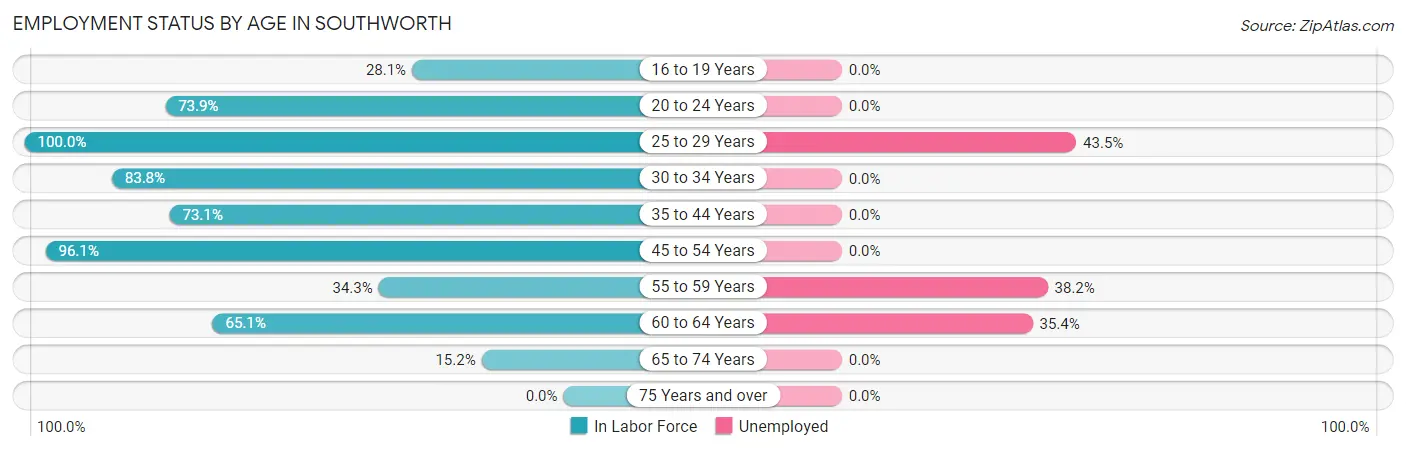
| Age Bracket | In Labor Force | Unemployed |
| 16 to 19 Years | 16 (28.1%) | 0 (0.0%) |
| 20 to 24 Years | 99 (73.9%) | 0 (0.0%) |
| 25 to 29 Years | 28 (100.0%) | 12 (43.5%) |
| 30 to 34 Years | 62 (83.8%) | 0 (0.0%) |
| 35 to 44 Years | 144 (73.1%) | 0 (0.0%) |
| 45 to 54 Years | 535 (96.1%) | 0 (0.0%) |
| 55 to 59 Years | 34 (34.3%) | 13 (38.2%) |
| 60 to 64 Years | 99 (65.1%) | 35 (35.4%) |
| 65 to 74 Years | 38 (15.2%) | 0 (0.0%) |
| 75 Years and over | 0 (0.0%) | 0 (0.0%) |
| Total | 1,055 (61.6%) | 59 (5.6%) |
Employment Status by Educational Attainment in Southworth
According to labor force statistics for Southworth, 81.5% of individuals (902) out of the total population between 25 and 64 years of age (1,107) are in the labor force, with 6.5% or 59 of them being unemployed. The group with the highest labor force participation rate are those with the educational attainment of high school diploma, with 93.1% or 271 individuals in the labor force. Within the labor force, individuals with college / associate degree education have the highest percentage of unemployment, with 9.4% or 14 of them being unemployed.
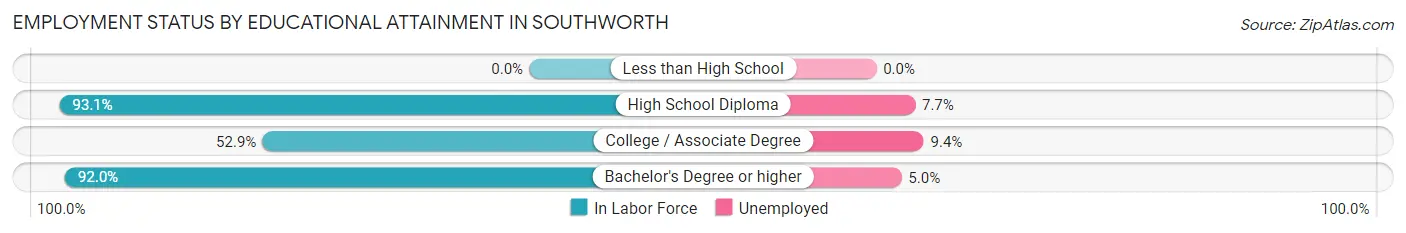
| Educational Attainment | In Labor Force | Unemployed |
| Less than High School | 0 (0.0%) | 0 (0.0%) |
| High School Diploma | 271 (93.1%) | 22 (7.7%) |
| College / Associate Degree | 147 (52.9%) | 26 (9.4%) |
| Bachelor's Degree or higher | 484 (92.0%) | 26 (5.0%) |
| Total | 902 (81.5%) | 72 (6.5%) |
Employment Occupations by Sex in Southworth
Management, Business, Science and Arts Occupations
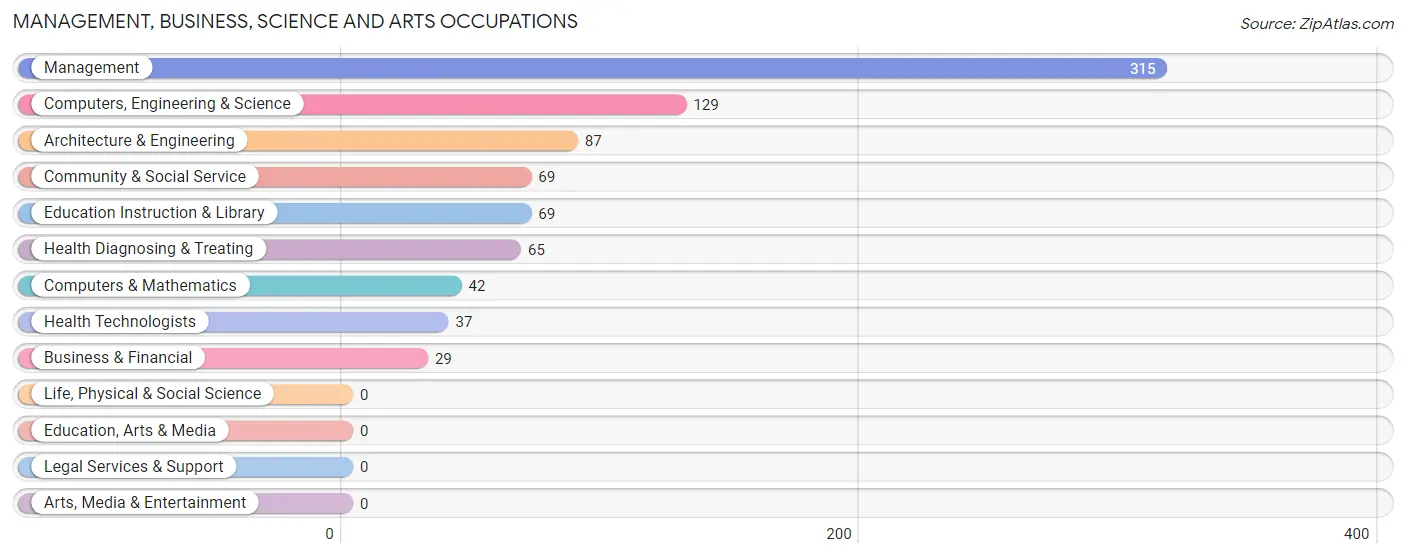
The most common Management, Business, Science and Arts occupations in Southworth are Management (315 | 32.0%), Computers, Engineering & Science (129 | 13.1%), Architecture & Engineering (87 | 8.8%), Community & Social Service (69 | 7.0%), and Education Instruction & Library (69 | 7.0%).
Management, Business, Science and Arts Occupations by Sex
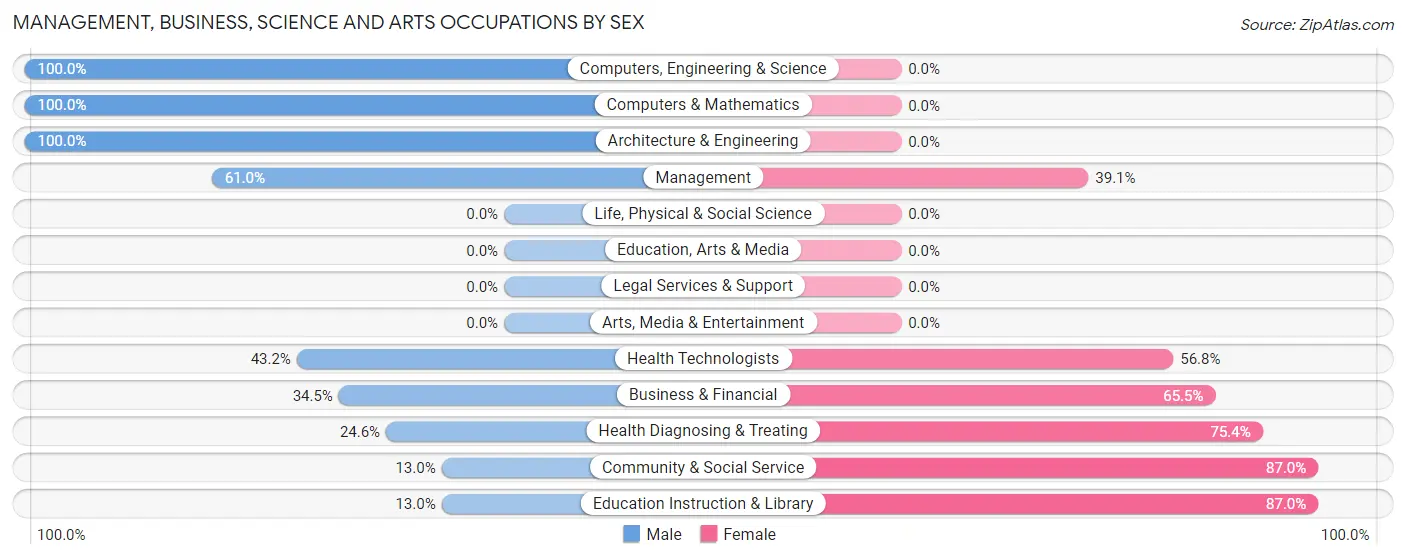
Within the Management, Business, Science and Arts occupations in Southworth, the most male-oriented occupations are Computers, Engineering & Science (100.0%), Computers & Mathematics (100.0%), and Architecture & Engineering (100.0%), while the most female-oriented occupations are Community & Social Service (87.0%), Education Instruction & Library (87.0%), and Health Diagnosing & Treating (75.4%).
| Occupation | Male | Female |
| Management | 192 (61.0%) | 123 (39.1%) |
| Business & Financial | 10 (34.5%) | 19 (65.5%) |
| Computers, Engineering & Science | 129 (100.0%) | 0 (0.0%) |
| Computers & Mathematics | 42 (100.0%) | 0 (0.0%) |
| Architecture & Engineering | 87 (100.0%) | 0 (0.0%) |
| Life, Physical & Social Science | 0 (0.0%) | 0 (0.0%) |
| Community & Social Service | 9 (13.0%) | 60 (87.0%) |
| Education, Arts & Media | 0 (0.0%) | 0 (0.0%) |
| Legal Services & Support | 0 (0.0%) | 0 (0.0%) |
| Education Instruction & Library | 9 (13.0%) | 60 (87.0%) |
| Arts, Media & Entertainment | 0 (0.0%) | 0 (0.0%) |
| Health Diagnosing & Treating | 16 (24.6%) | 49 (75.4%) |
| Health Technologists | 16 (43.2%) | 21 (56.8%) |
| Total (Category) | 356 (58.7%) | 251 (41.3%) |
| Total (Overall) | 647 (65.7%) | 337 (34.3%) |
Services Occupations
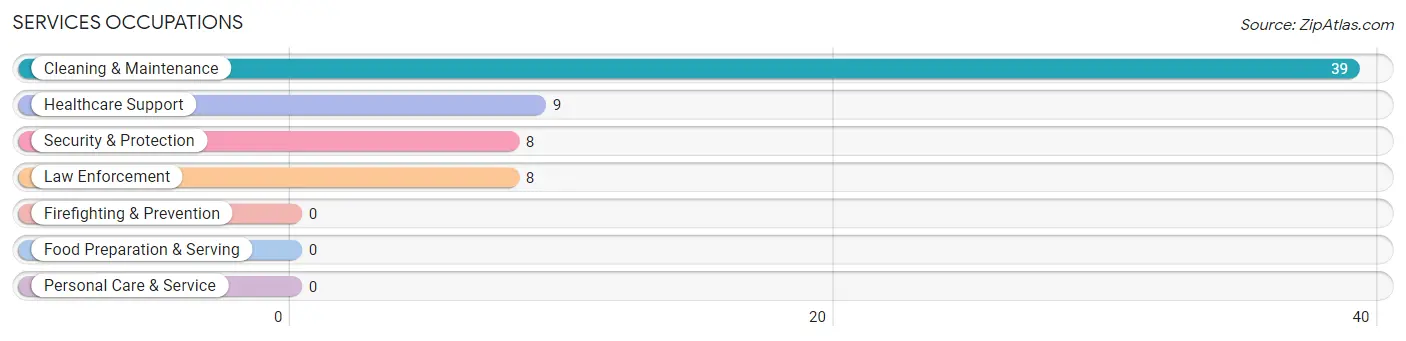
The most common Services occupations in Southworth are Cleaning & Maintenance (39 | 4.0%), Healthcare Support (9 | 0.9%), Security & Protection (8 | 0.8%), and Law Enforcement (8 | 0.8%).
Services Occupations by Sex
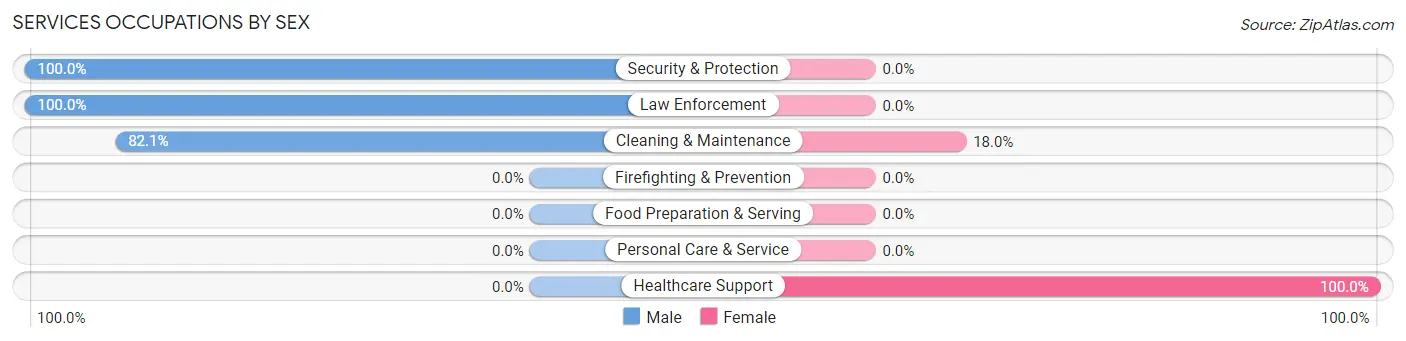
Within the Services occupations in Southworth, the most male-oriented occupations are Security & Protection (100.0%), Law Enforcement (100.0%), and Cleaning & Maintenance (82.1%), while the most female-oriented occupations are Healthcare Support (100.0%), and Cleaning & Maintenance (17.9%).
| Occupation | Male | Female |
| Healthcare Support | 0 (0.0%) | 9 (100.0%) |
| Security & Protection | 8 (100.0%) | 0 (0.0%) |
| Firefighting & Prevention | 0 (0.0%) | 0 (0.0%) |
| Law Enforcement | 8 (100.0%) | 0 (0.0%) |
| Food Preparation & Serving | 0 (0.0%) | 0 (0.0%) |
| Cleaning & Maintenance | 32 (82.1%) | 7 (17.9%) |
| Personal Care & Service | 0 (0.0%) | 0 (0.0%) |
| Total (Category) | 40 (71.4%) | 16 (28.6%) |
| Total (Overall) | 647 (65.7%) | 337 (34.3%) |
Sales and Office Occupations
The most common Sales and Office occupations in Southworth are Office & Administration (49 | 5.0%), and Sales & Related (20 | 2.0%).
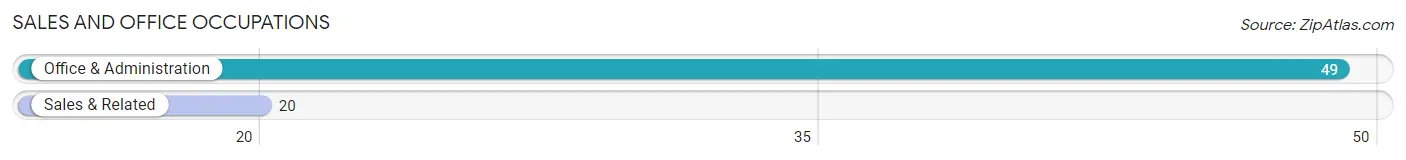
Sales and Office Occupations by Sex
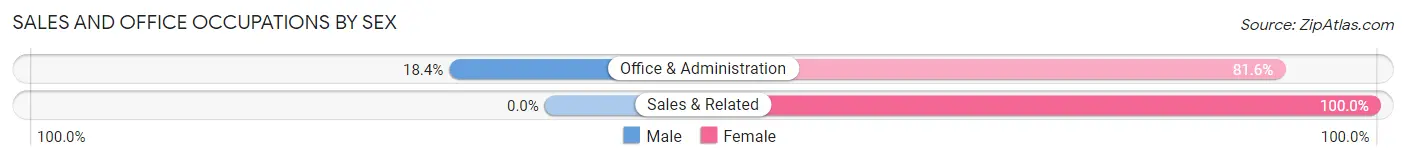
| Occupation | Male | Female |
| Sales & Related | 0 (0.0%) | 20 (100.0%) |
| Office & Administration | 9 (18.4%) | 40 (81.6%) |
| Total (Category) | 9 (13.0%) | 60 (87.0%) |
| Total (Overall) | 647 (65.7%) | 337 (34.3%) |
Natural Resources, Construction and Maintenance Occupations
The most common Natural Resources, Construction and Maintenance occupations in Southworth are Construction & Extraction (174 | 17.7%), Installation, Maintenance & Repair (24 | 2.4%), and Farming, Fishing & Forestry (6 | 0.6%).
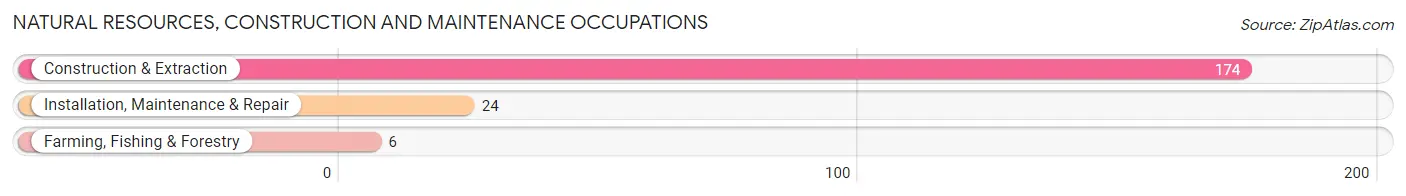
Natural Resources, Construction and Maintenance Occupations by Sex
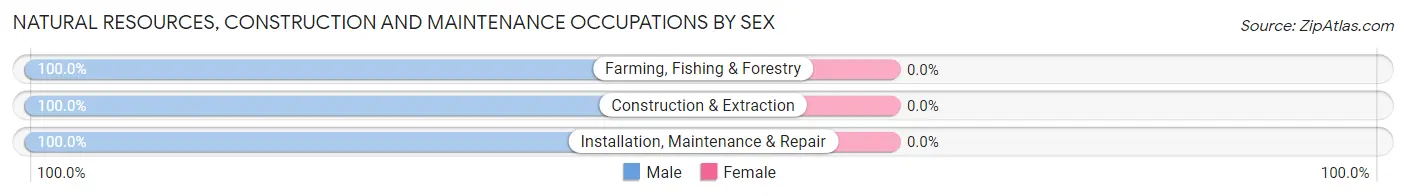
| Occupation | Male | Female |
| Farming, Fishing & Forestry | 6 (100.0%) | 0 (0.0%) |
| Construction & Extraction | 174 (100.0%) | 0 (0.0%) |
| Installation, Maintenance & Repair | 24 (100.0%) | 0 (0.0%) |
| Total (Category) | 204 (100.0%) | 0 (0.0%) |
| Total (Overall) | 647 (65.7%) | 337 (34.3%) |
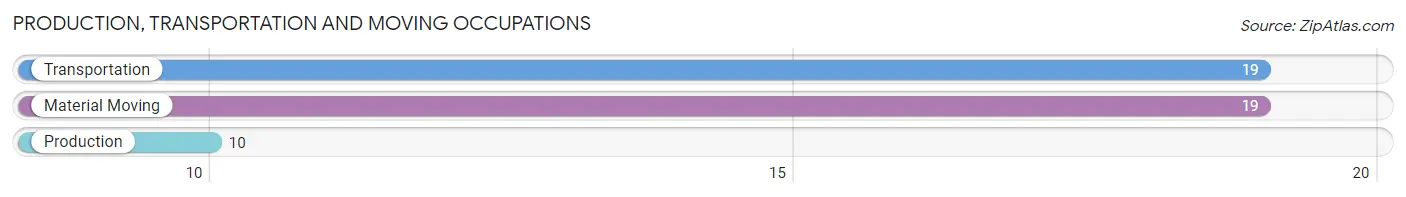
Production, Transportation and Moving Occupations
The most common Production, Transportation and Moving occupations in Southworth are Transportation (19 | 1.9%), Material Moving (19 | 1.9%), and Production (10 | 1.0%).
Production, Transportation and Moving Occupations by Sex
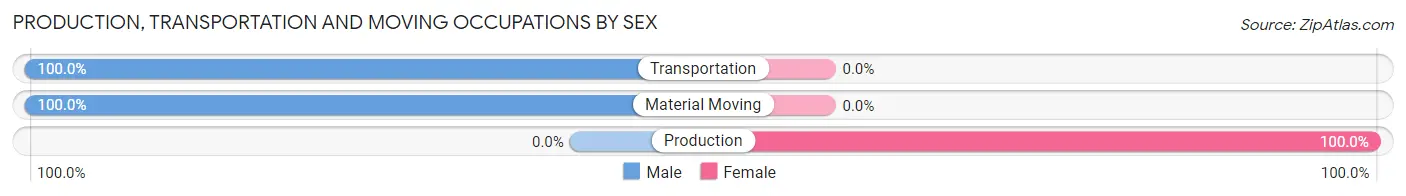
| Occupation | Male | Female |
| Production | 0 (0.0%) | 10 (100.0%) |
| Transportation | 19 (100.0%) | 0 (0.0%) |
| Material Moving | 19 (100.0%) | 0 (0.0%) |
| Total (Category) | 38 (79.2%) | 10 (20.8%) |
| Total (Overall) | 647 (65.7%) | 337 (34.3%) |
Employment Industries by Sex in Southworth
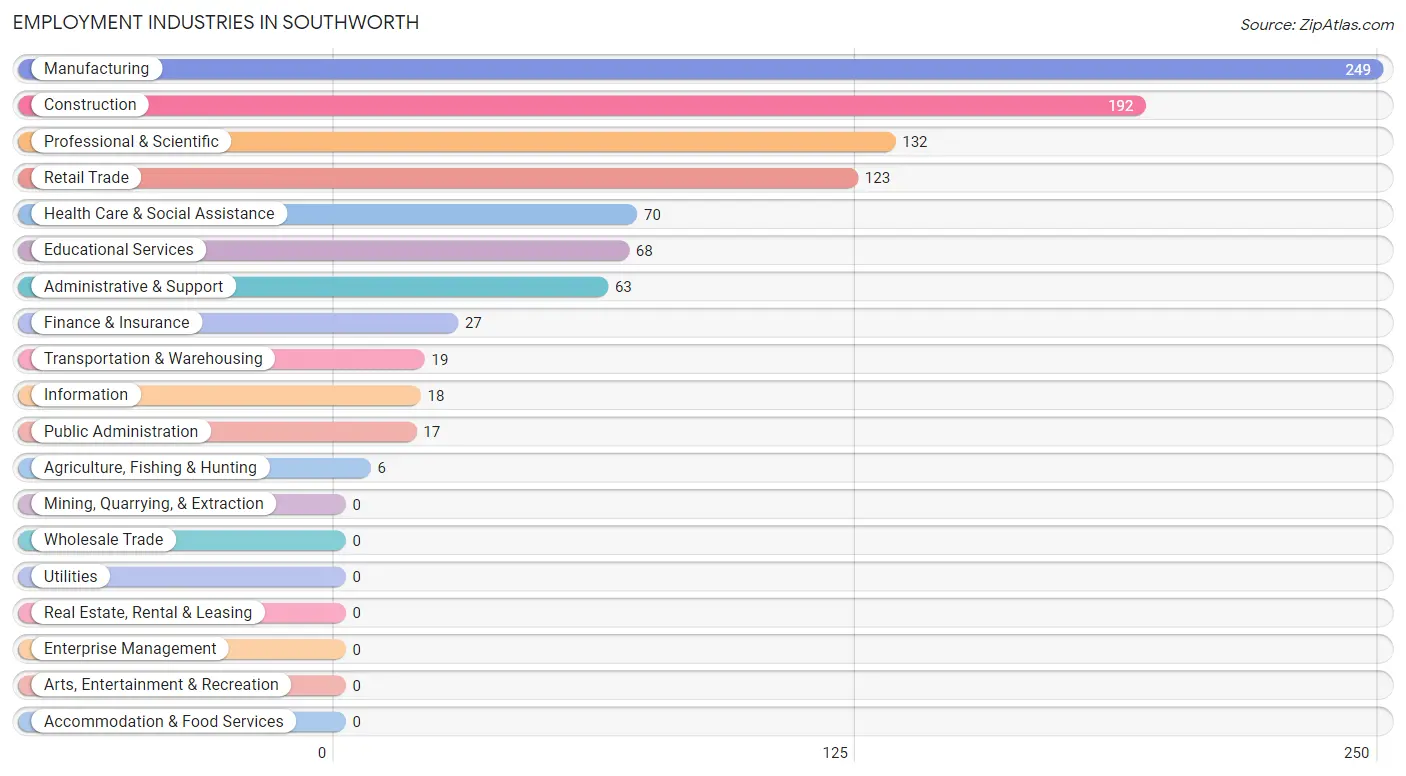
Employment Industries in Southworth
The major employment industries in Southworth include Manufacturing (249 | 25.3%), Construction (192 | 19.5%), Professional & Scientific (132 | 13.4%), Retail Trade (123 | 12.5%), and Health Care & Social Assistance (70 | 7.1%).
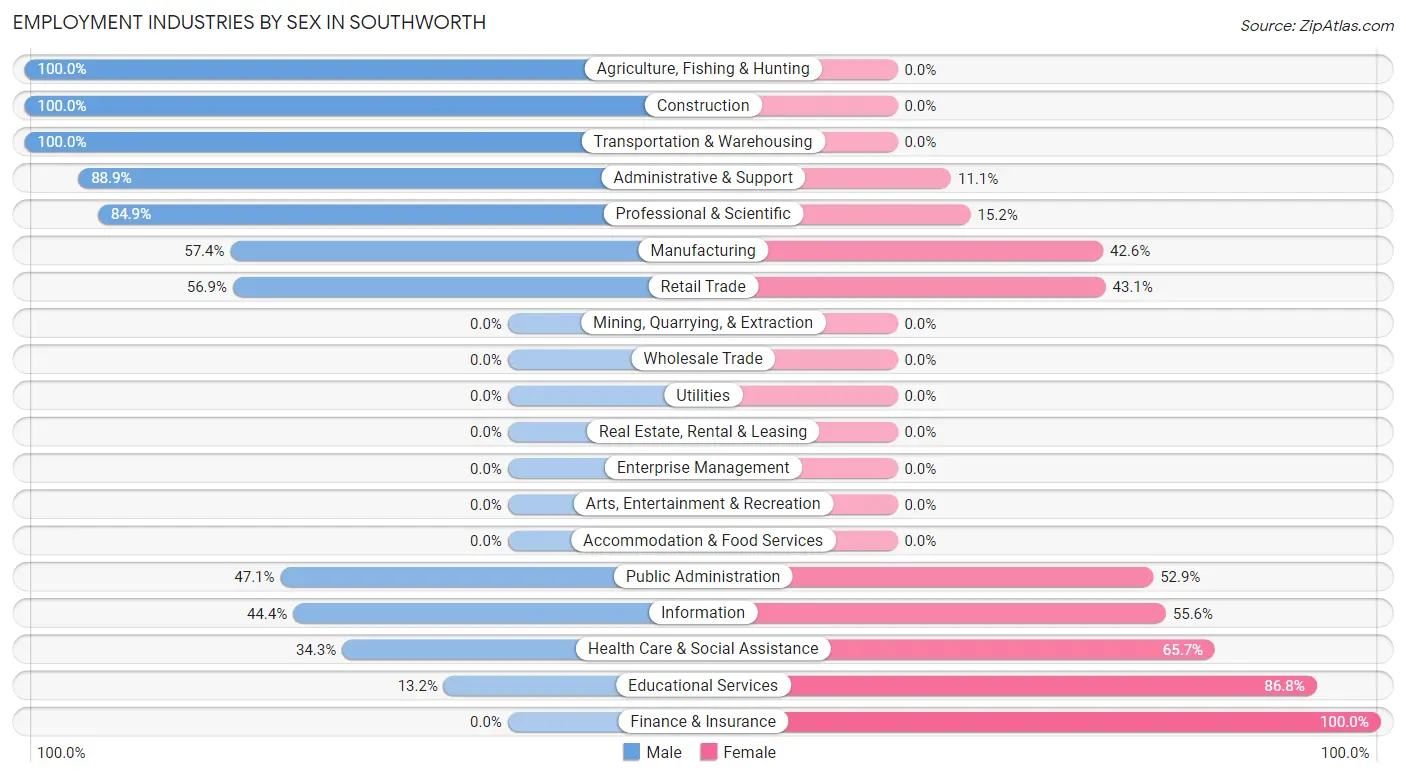
Employment Industries by Sex in Southworth
The Southworth industries that see more men than women are Agriculture, Fishing & Hunting (100.0%), Construction (100.0%), and Transportation & Warehousing (100.0%), whereas the industries that tend to have a higher number of women are Finance & Insurance (100.0%), Educational Services (86.8%), and Health Care & Social Assistance (65.7%).
| Industry | Male | Female |
| Agriculture, Fishing & Hunting | 6 (100.0%) | 0 (0.0%) |
| Mining, Quarrying, & Extraction | 0 (0.0%) | 0 (0.0%) |
| Construction | 192 (100.0%) | 0 (0.0%) |
| Manufacturing | 143 (57.4%) | 106 (42.6%) |
| Wholesale Trade | 0 (0.0%) | 0 (0.0%) |
| Retail Trade | 70 (56.9%) | 53 (43.1%) |
| Transportation & Warehousing | 19 (100.0%) | 0 (0.0%) |
| Utilities | 0 (0.0%) | 0 (0.0%) |
| Information | 8 (44.4%) | 10 (55.6%) |
| Finance & Insurance | 0 (0.0%) | 27 (100.0%) |
| Real Estate, Rental & Leasing | 0 (0.0%) | 0 (0.0%) |
| Professional & Scientific | 112 (84.9%) | 20 (15.1%) |
| Enterprise Management | 0 (0.0%) | 0 (0.0%) |
| Administrative & Support | 56 (88.9%) | 7 (11.1%) |
| Educational Services | 9 (13.2%) | 59 (86.8%) |
| Health Care & Social Assistance | 24 (34.3%) | 46 (65.7%) |
| Arts, Entertainment & Recreation | 0 (0.0%) | 0 (0.0%) |
| Accommodation & Food Services | 0 (0.0%) | 0 (0.0%) |
| Public Administration | 8 (47.1%) | 9 (52.9%) |
| Total | 647 (65.7%) | 337 (34.3%) |
Education in Southworth
School Enrollment in Southworth
The most common levels of schooling among the 218 students in Southworth are high school (99 | 45.4%), middle school (46 | 21.1%), and college / undergraduate (30 | 13.8%).
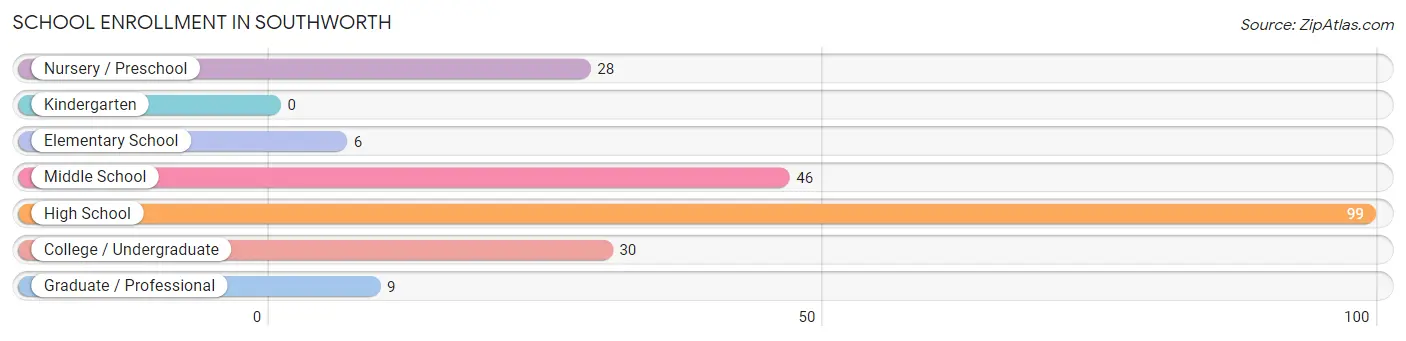
| School Level | # Students | % Students |
| Nursery / Preschool | 28 | 12.8% |
| Kindergarten | 0 | 0.0% |
| Elementary School | 6 | 2.8% |
| Middle School | 46 | 21.1% |
| High School | 99 | 45.4% |
| College / Undergraduate | 30 | 13.8% |
| Graduate / Professional | 9 | 4.1% |
| Total | 218 | 100.0% |
School Enrollment by Age by Funding Source in Southworth
Out of a total of 218 students who are enrolled in schools in Southworth, 35 (16.1%) attend a private institution, while the remaining 183 (83.9%) are enrolled in public schools. The age group of 5 to 9 year old has the highest likelihood of being enrolled in private schools, with 10 (45.5% in the age bracket) enrolled. Conversely, the age group of 3 to 4 year olds has the lowest likelihood of being enrolled in a private school, with 12 (100.0% in the age bracket) attending a public institution.
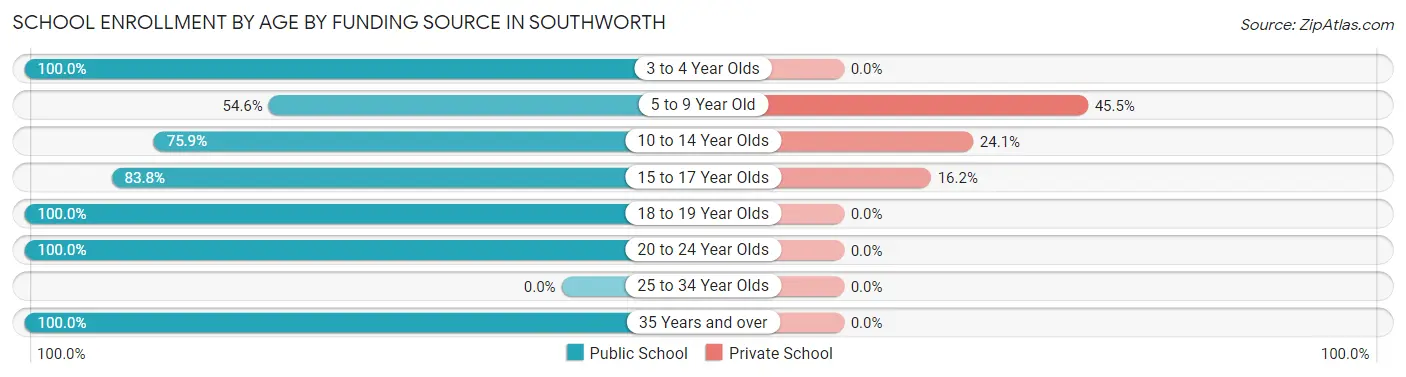
| Age Bracket | Public School | Private School |
| 3 to 4 Year Olds | 12 (100.0%) | 0 (0.0%) |
| 5 to 9 Year Old | 12 (54.5%) | 10 (45.5%) |
| 10 to 14 Year Olds | 41 (75.9%) | 13 (24.1%) |
| 15 to 17 Year Olds | 62 (83.8%) | 12 (16.2%) |
| 18 to 19 Year Olds | 17 (100.0%) | 0 (0.0%) |
| 20 to 24 Year Olds | 30 (100.0%) | 0 (0.0%) |
| 25 to 34 Year Olds | 0 (0.0%) | 0 (0.0%) |
| 35 Years and over | 9 (100.0%) | 0 (0.0%) |
| Total | 183 (83.9%) | 35 (16.1%) |
Educational Attainment by Field of Study in Southworth
Business (159 | 17.0%), bio, nature & agricultural (112 | 11.9%), engineering (112 | 11.9%), arts & humanities (109 | 11.6%), and social sciences (79 | 8.4%) are the most common fields of study among 938 individuals in Southworth who have obtained a bachelor's degree or higher.
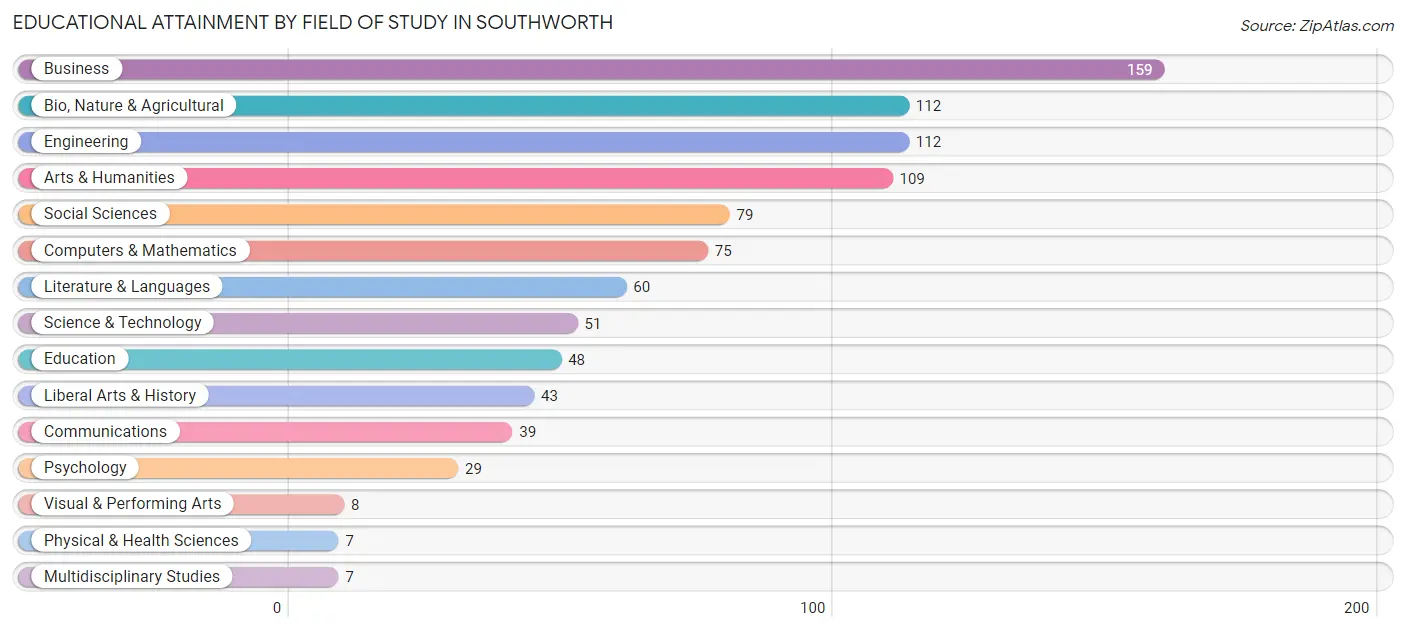
| Field of Study | # Graduates | % Graduates |
| Computers & Mathematics | 75 | 8.0% |
| Bio, Nature & Agricultural | 112 | 11.9% |
| Physical & Health Sciences | 7 | 0.7% |
| Psychology | 29 | 3.1% |
| Social Sciences | 79 | 8.4% |
| Engineering | 112 | 11.9% |
| Multidisciplinary Studies | 7 | 0.7% |
| Science & Technology | 51 | 5.4% |
| Business | 159 | 17.0% |
| Education | 48 | 5.1% |
| Literature & Languages | 60 | 6.4% |
| Liberal Arts & History | 43 | 4.6% |
| Visual & Performing Arts | 8 | 0.9% |
| Communications | 39 | 4.2% |
| Arts & Humanities | 109 | 11.6% |
| Total | 938 | 100.0% |
Transportation & Commute in Southworth
Vehicle Availability by Sex in Southworth
The most prevalent vehicle ownership categories in Southworth are males with 2 vehicles (218, accounting for 34.1%) and females with 2 vehicles (185, making up 67.1%).
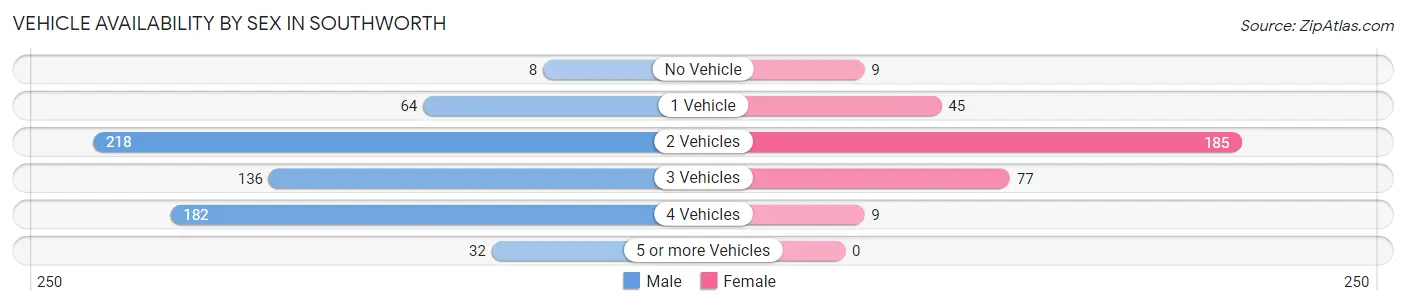
| Vehicles Available | Male | Female |
| No Vehicle | 8 (1.3%) | 9 (2.8%) |
| 1 Vehicle | 64 (10.0%) | 45 (13.9%) |
| 2 Vehicles | 218 (34.1%) | 185 (56.9%) |
| 3 Vehicles | 136 (21.2%) | 77 (23.7%) |
| 4 Vehicles | 182 (28.4%) | 9 (2.8%) |
| 5 or more Vehicles | 32 (5.0%) | 0 (0.0%) |
| Total | 640 (100.0%) | 325 (100.0%) |
Commute Time in Southworth
The most frequently occuring commute durations in Southworth are 60 to 89 minutes (209 commuters, 24.9%), 30 to 34 minutes (177 commuters, 21.1%), and 40 to 44 minutes (114 commuters, 13.6%).
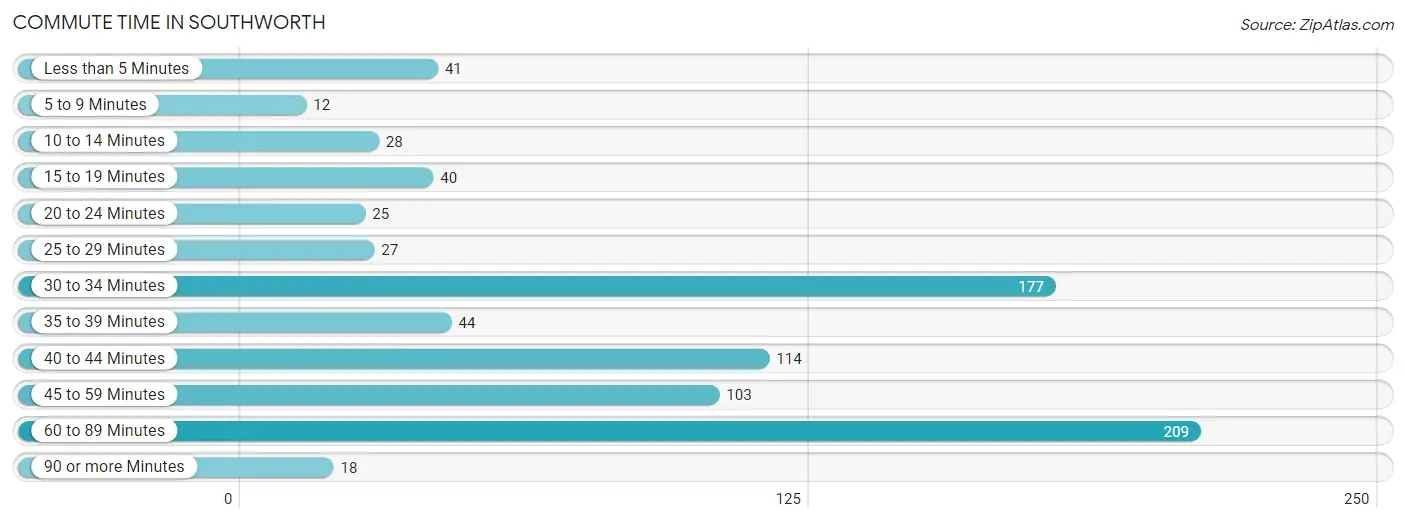
| Commute Time | # Commuters | % Commuters |
| Less than 5 Minutes | 41 | 4.9% |
| 5 to 9 Minutes | 12 | 1.4% |
| 10 to 14 Minutes | 28 | 3.3% |
| 15 to 19 Minutes | 40 | 4.8% |
| 20 to 24 Minutes | 25 | 3.0% |
| 25 to 29 Minutes | 27 | 3.2% |
| 30 to 34 Minutes | 177 | 21.1% |
| 35 to 39 Minutes | 44 | 5.2% |
| 40 to 44 Minutes | 114 | 13.6% |
| 45 to 59 Minutes | 103 | 12.3% |
| 60 to 89 Minutes | 209 | 24.9% |
| 90 or more Minutes | 18 | 2.1% |
Commute Time by Sex in Southworth
The most common commute times in Southworth are 60 to 89 minutes (200 commuters, 38.0%) for males and 30 to 34 minutes (135 commuters, 43.3%) for females.
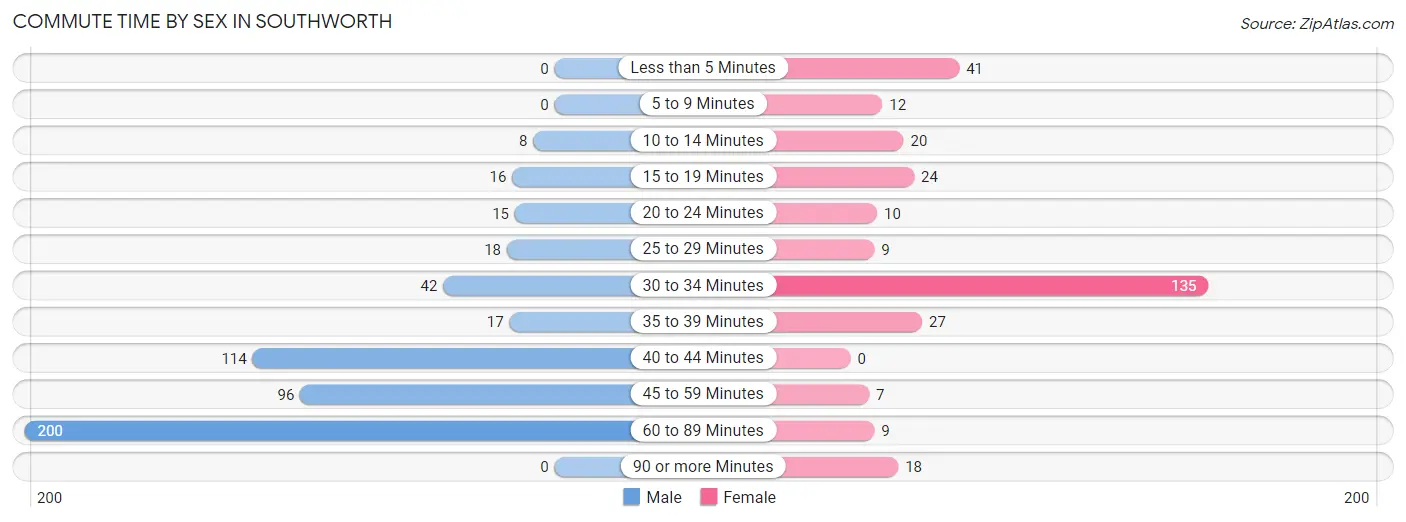
| Commute Time | Male | Female |
| Less than 5 Minutes | 0 (0.0%) | 41 (13.1%) |
| 5 to 9 Minutes | 0 (0.0%) | 12 (3.8%) |
| 10 to 14 Minutes | 8 (1.5%) | 20 (6.4%) |
| 15 to 19 Minutes | 16 (3.0%) | 24 (7.7%) |
| 20 to 24 Minutes | 15 (2.9%) | 10 (3.2%) |
| 25 to 29 Minutes | 18 (3.4%) | 9 (2.9%) |
| 30 to 34 Minutes | 42 (8.0%) | 135 (43.3%) |
| 35 to 39 Minutes | 17 (3.2%) | 27 (8.6%) |
| 40 to 44 Minutes | 114 (21.7%) | 0 (0.0%) |
| 45 to 59 Minutes | 96 (18.2%) | 7 (2.2%) |
| 60 to 89 Minutes | 200 (38.0%) | 9 (2.9%) |
| 90 or more Minutes | 0 (0.0%) | 18 (5.8%) |
Time of Departure to Work by Sex in Southworth
The most frequent times of departure to work in Southworth are 12:00 AM to 4:59 AM (138, 26.2%) for males and 6:30 AM to 6:59 AM (115, 36.9%) for females.
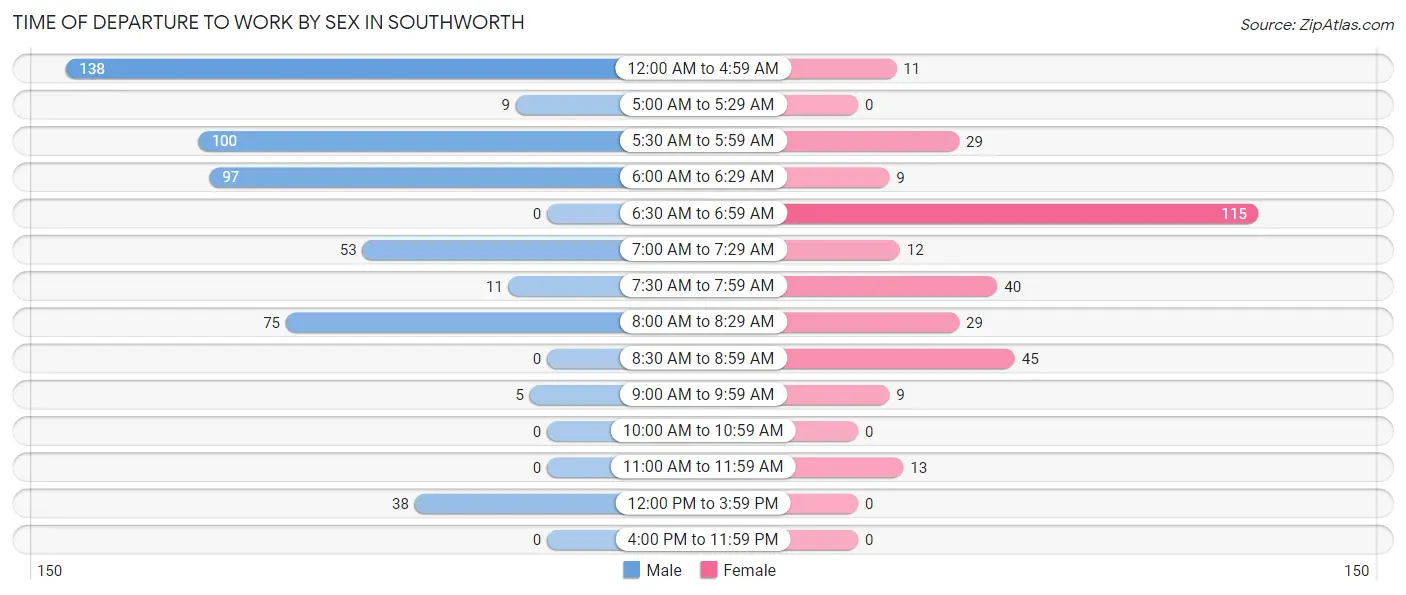
| Time of Departure | Male | Female |
| 12:00 AM to 4:59 AM | 138 (26.2%) | 11 (3.5%) |
| 5:00 AM to 5:29 AM | 9 (1.7%) | 0 (0.0%) |
| 5:30 AM to 5:59 AM | 100 (19.0%) | 29 (9.3%) |
| 6:00 AM to 6:29 AM | 97 (18.4%) | 9 (2.9%) |
| 6:30 AM to 6:59 AM | 0 (0.0%) | 115 (36.9%) |
| 7:00 AM to 7:29 AM | 53 (10.1%) | 12 (3.8%) |
| 7:30 AM to 7:59 AM | 11 (2.1%) | 40 (12.8%) |
| 8:00 AM to 8:29 AM | 75 (14.3%) | 29 (9.3%) |
| 8:30 AM to 8:59 AM | 0 (0.0%) | 45 (14.4%) |
| 9:00 AM to 9:59 AM | 5 (0.9%) | 9 (2.9%) |
| 10:00 AM to 10:59 AM | 0 (0.0%) | 0 (0.0%) |
| 11:00 AM to 11:59 AM | 0 (0.0%) | 13 (4.2%) |
| 12:00 PM to 3:59 PM | 38 (7.2%) | 0 (0.0%) |
| 4:00 PM to 11:59 PM | 0 (0.0%) | 0 (0.0%) |
| Total | 526 (100.0%) | 312 (100.0%) |
Housing Occupancy in Southworth
Occupancy by Ownership in Southworth
Of the total 877 dwellings in Southworth, owner-occupied units account for 738 (84.2%), while renter-occupied units make up 139 (15.9%).
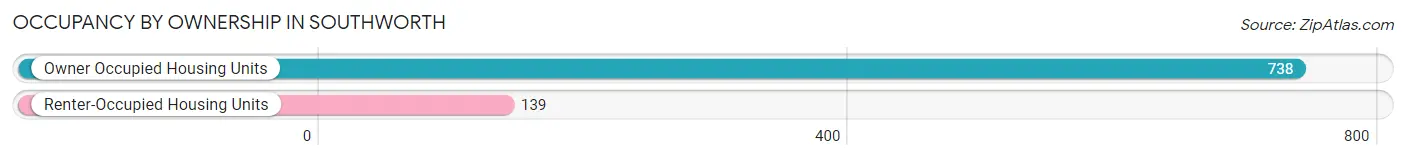
| Occupancy | # Housing Units | % Housing Units |
| Owner Occupied Housing Units | 738 | 84.2% |
| Renter-Occupied Housing Units | 139 | 15.9% |
| Total Occupied Housing Units | 877 | 100.0% |
Occupancy by Household Size in Southworth
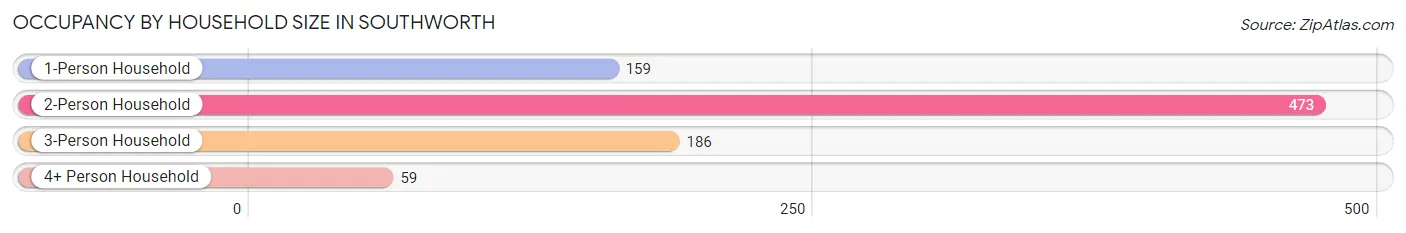
| Household Size | # Housing Units | % Housing Units |
| 1-Person Household | 159 | 18.1% |
| 2-Person Household | 473 | 53.9% |
| 3-Person Household | 186 | 21.2% |
| 4+ Person Household | 59 | 6.7% |
| Total Housing Units | 877 | 100.0% |
Occupancy by Ownership by Household Size in Southworth
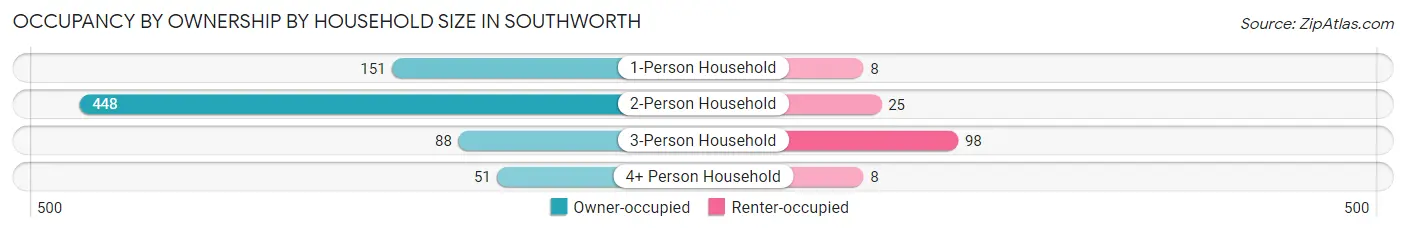
| Household Size | Owner-occupied | Renter-occupied |
| 1-Person Household | 151 (95.0%) | 8 (5.0%) |
| 2-Person Household | 448 (94.7%) | 25 (5.3%) |
| 3-Person Household | 88 (47.3%) | 98 (52.7%) |
| 4+ Person Household | 51 (86.4%) | 8 (13.6%) |
| Total Housing Units | 738 (84.2%) | 139 (15.9%) |
Occupancy by Educational Attainment in Southworth
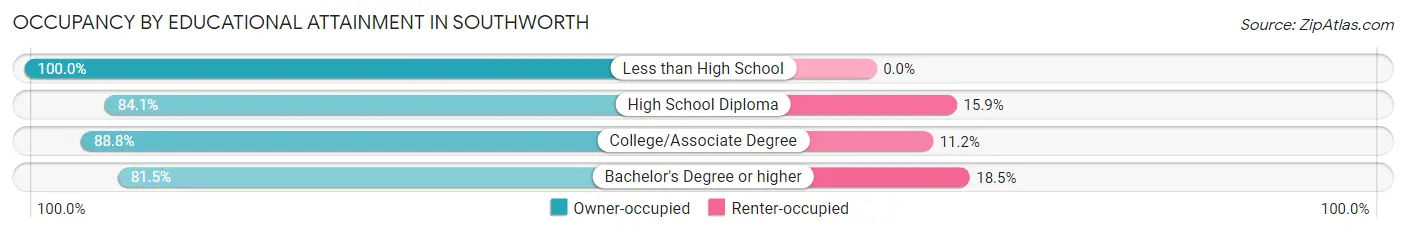
| Household Size | Owner-occupied | Renter-occupied |
| Less than High School | 3 (100.0%) | 0 (0.0%) |
| High School Diploma | 227 (84.1%) | 43 (15.9%) |
| College/Associate Degree | 190 (88.8%) | 24 (11.2%) |
| Bachelor's Degree or higher | 318 (81.5%) | 72 (18.5%) |
Occupancy by Age of Householder in Southworth
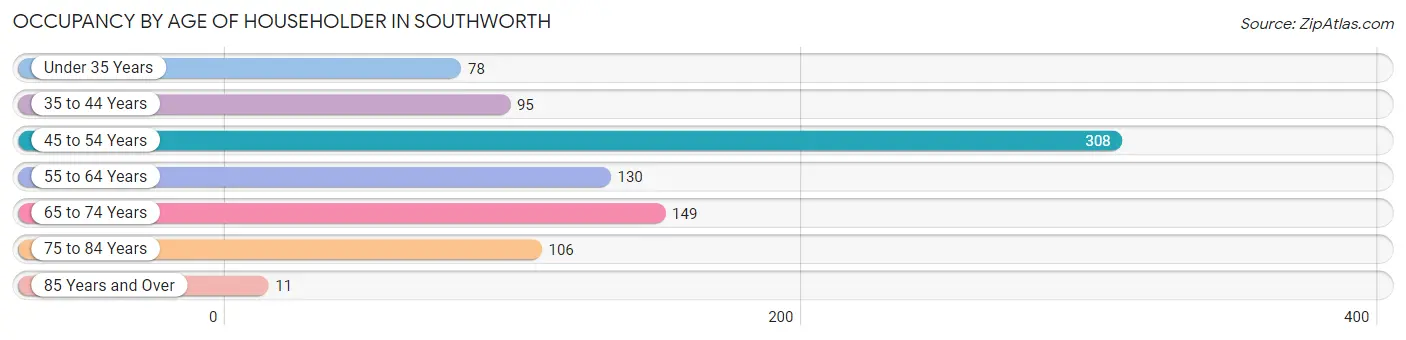
| Age Bracket | # Households | % Households |
| Under 35 Years | 78 | 8.9% |
| 35 to 44 Years | 95 | 10.8% |
| 45 to 54 Years | 308 | 35.1% |
| 55 to 64 Years | 130 | 14.8% |
| 65 to 74 Years | 149 | 17.0% |
| 75 to 84 Years | 106 | 12.1% |
| 85 Years and Over | 11 | 1.3% |
| Total | 877 | 100.0% |
Housing Finances in Southworth
Median Income by Occupancy in Southworth
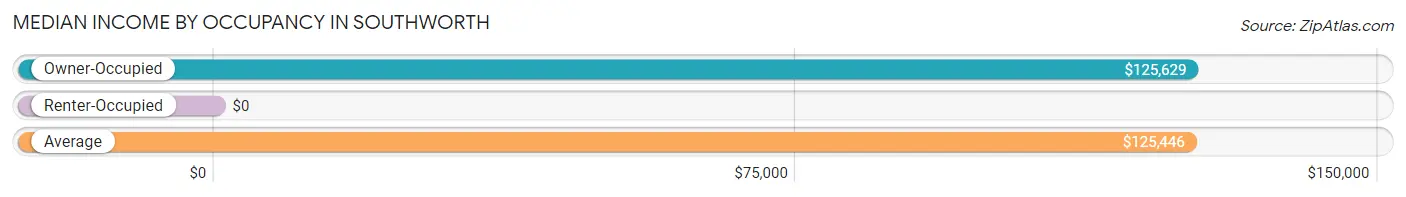
| Occupancy Type | # Households | Median Income |
| Owner-Occupied | 738 (84.2%) | $125,629 |
| Renter-Occupied | 139 (15.9%) | $0 |
| Average | 877 (100.0%) | $125,446 |
Occupancy by Householder Income Bracket in Southworth
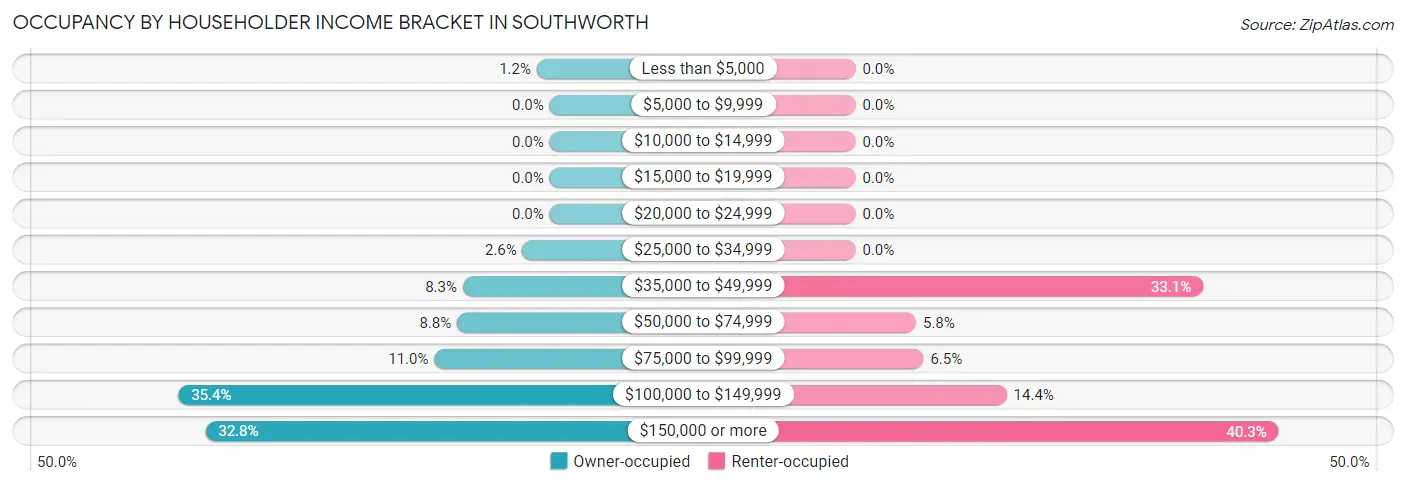
| Income Bracket | Owner-occupied | Renter-occupied |
| Less than $5,000 | 9 (1.2%) | 0 (0.0%) |
| $5,000 to $9,999 | 0 (0.0%) | 0 (0.0%) |
| $10,000 to $14,999 | 0 (0.0%) | 0 (0.0%) |
| $15,000 to $19,999 | 0 (0.0%) | 0 (0.0%) |
| $20,000 to $24,999 | 0 (0.0%) | 0 (0.0%) |
| $25,000 to $34,999 | 19 (2.6%) | 0 (0.0%) |
| $35,000 to $49,999 | 61 (8.3%) | 46 (33.1%) |
| $50,000 to $74,999 | 65 (8.8%) | 8 (5.8%) |
| $75,000 to $99,999 | 81 (11.0%) | 9 (6.5%) |
| $100,000 to $149,999 | 261 (35.4%) | 20 (14.4%) |
| $150,000 or more | 242 (32.8%) | 56 (40.3%) |
| Total | 738 (100.0%) | 139 (100.0%) |
Monthly Housing Cost Tiers in Southworth
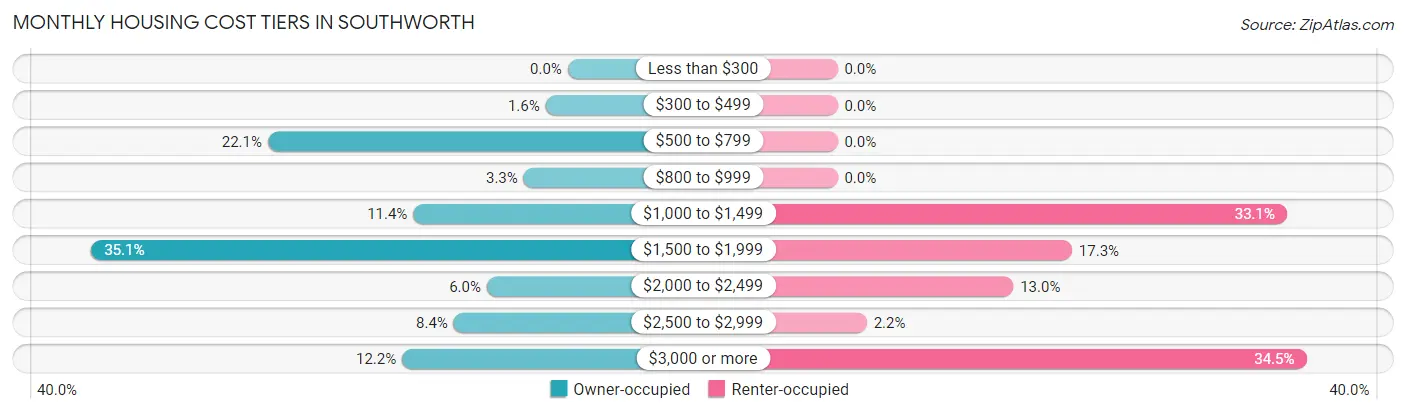
| Monthly Cost | Owner-occupied | Renter-occupied |
| Less than $300 | 0 (0.0%) | 0 (0.0%) |
| $300 to $499 | 12 (1.6%) | 0 (0.0%) |
| $500 to $799 | 163 (22.1%) | 0 (0.0%) |
| $800 to $999 | 24 (3.3%) | 0 (0.0%) |
| $1,000 to $1,499 | 84 (11.4%) | 46 (33.1%) |
| $1,500 to $1,999 | 259 (35.1%) | 24 (17.3%) |
| $2,000 to $2,499 | 44 (6.0%) | 18 (13.0%) |
| $2,500 to $2,999 | 62 (8.4%) | 3 (2.2%) |
| $3,000 or more | 90 (12.2%) | 48 (34.5%) |
| Total | 738 (100.0%) | 139 (100.0%) |
Physical Housing Characteristics in Southworth
Housing Structures in Southworth
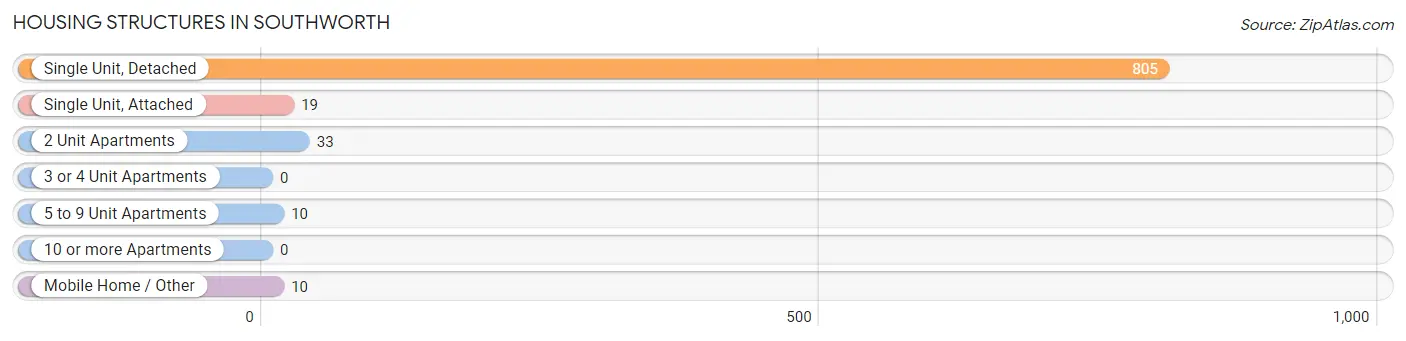
| Structure Type | # Housing Units | % Housing Units |
| Single Unit, Detached | 805 | 91.8% |
| Single Unit, Attached | 19 | 2.2% |
| 2 Unit Apartments | 33 | 3.8% |
| 3 or 4 Unit Apartments | 0 | 0.0% |
| 5 to 9 Unit Apartments | 10 | 1.1% |
| 10 or more Apartments | 0 | 0.0% |
| Mobile Home / Other | 10 | 1.1% |
| Total | 877 | 100.0% |
Housing Structures by Occupancy in Southworth
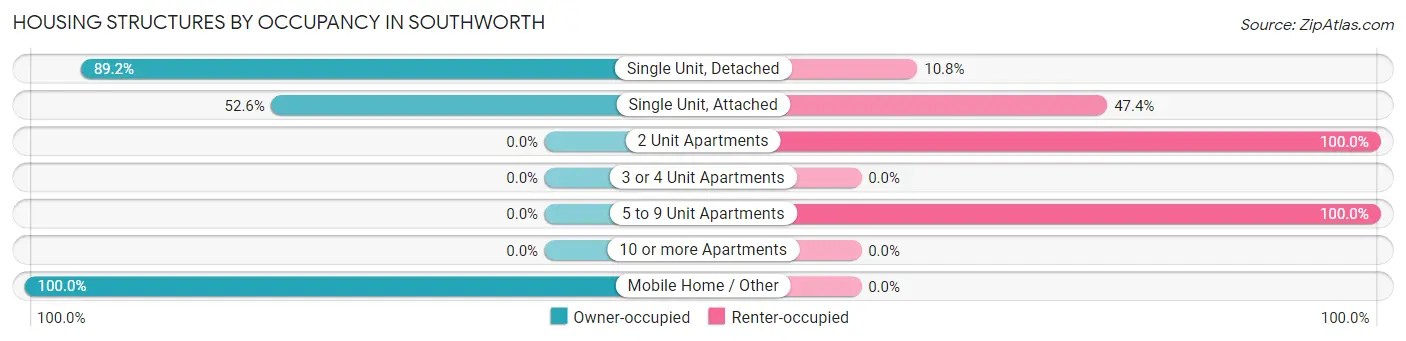
| Structure Type | Owner-occupied | Renter-occupied |
| Single Unit, Detached | 718 (89.2%) | 87 (10.8%) |
| Single Unit, Attached | 10 (52.6%) | 9 (47.4%) |
| 2 Unit Apartments | 0 (0.0%) | 33 (100.0%) |
| 3 or 4 Unit Apartments | 0 (0.0%) | 0 (0.0%) |
| 5 to 9 Unit Apartments | 0 (0.0%) | 10 (100.0%) |
| 10 or more Apartments | 0 (0.0%) | 0 (0.0%) |
| Mobile Home / Other | 10 (100.0%) | 0 (0.0%) |
| Total | 738 (84.2%) | 139 (15.9%) |
Housing Structures by Number of Rooms in Southworth
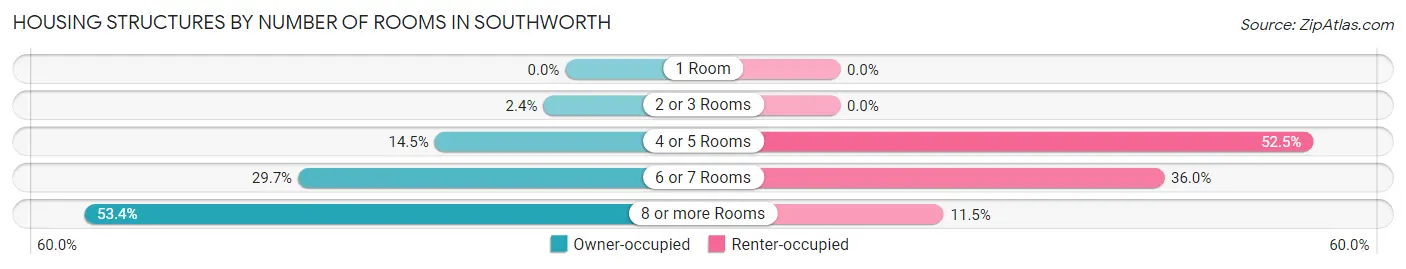
| Number of Rooms | Owner-occupied | Renter-occupied |
| 1 Room | 0 (0.0%) | 0 (0.0%) |
| 2 or 3 Rooms | 18 (2.4%) | 0 (0.0%) |
| 4 or 5 Rooms | 107 (14.5%) | 73 (52.5%) |
| 6 or 7 Rooms | 219 (29.7%) | 50 (36.0%) |
| 8 or more Rooms | 394 (53.4%) | 16 (11.5%) |
| Total | 738 (100.0%) | 139 (100.0%) |
Housing Structure by Heating Type in Southworth
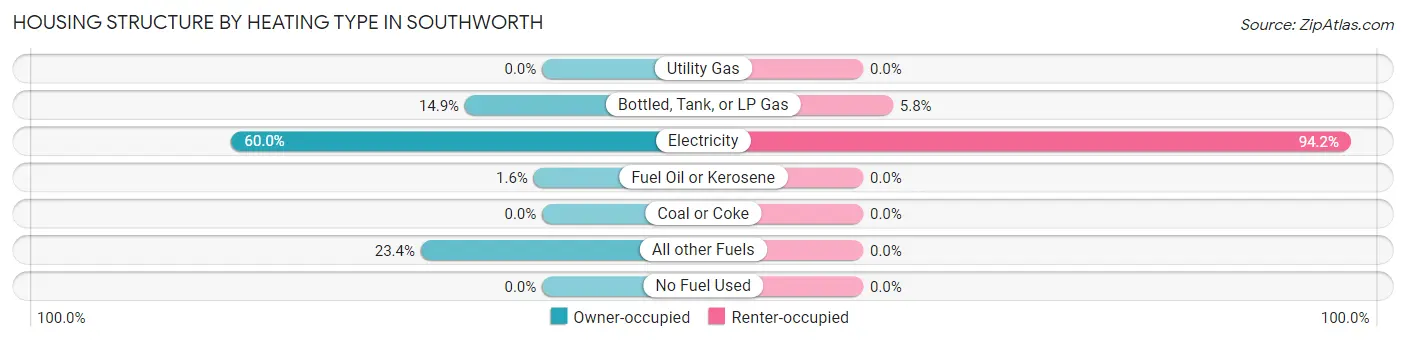
| Heating Type | Owner-occupied | Renter-occupied |
| Utility Gas | 0 (0.0%) | 0 (0.0%) |
| Bottled, Tank, or LP Gas | 110 (14.9%) | 8 (5.8%) |
| Electricity | 443 (60.0%) | 131 (94.2%) |
| Fuel Oil or Kerosene | 12 (1.6%) | 0 (0.0%) |
| Coal or Coke | 0 (0.0%) | 0 (0.0%) |
| All other Fuels | 173 (23.4%) | 0 (0.0%) |
| No Fuel Used | 0 (0.0%) | 0 (0.0%) |
| Total | 738 (100.0%) | 139 (100.0%) |
Household Vehicle Usage in Southworth
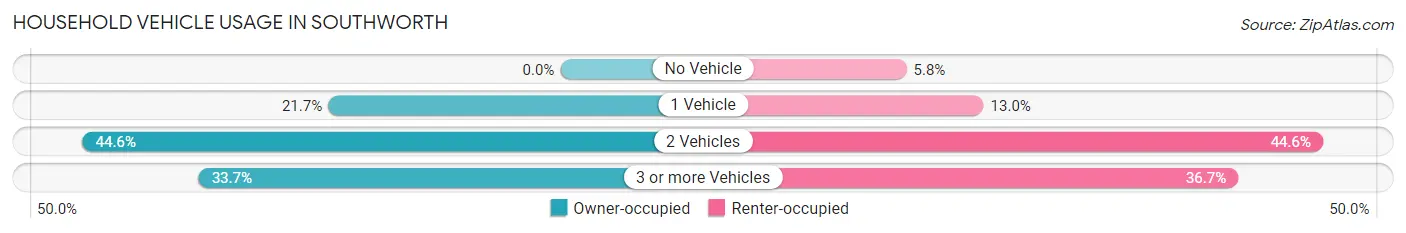
| Vehicles per Household | Owner-occupied | Renter-occupied |
| No Vehicle | 0 (0.0%) | 8 (5.8%) |
| 1 Vehicle | 160 (21.7%) | 18 (13.0%) |
| 2 Vehicles | 329 (44.6%) | 62 (44.6%) |
| 3 or more Vehicles | 249 (33.7%) | 51 (36.7%) |
| Total | 738 (100.0%) | 139 (100.0%) |
Real Estate & Mortgages in Southworth
Real Estate and Mortgage Overview in Southworth
| Characteristic | Without Mortgage | With Mortgage |
| Housing Units | 241 | 497 |
| Median Property Value | $607,800 | $574,000 |
| Median Household Income | $112,629 | $201 |
| Monthly Housing Costs | $678 | $90 |
| Real Estate Taxes | $4,743 | $0 |
Property Value by Mortgage Status in Southworth
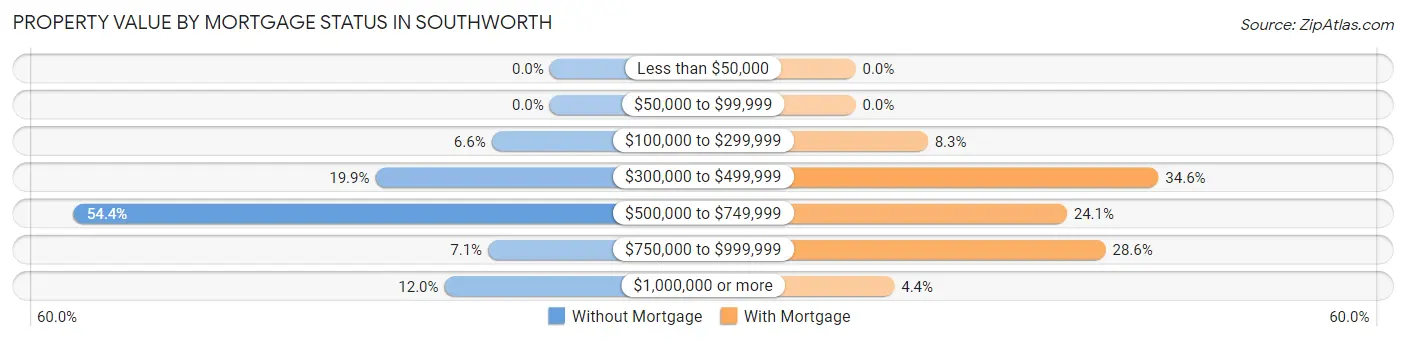
| Property Value | Without Mortgage | With Mortgage |
| Less than $50,000 | 0 (0.0%) | 0 (0.0%) |
| $50,000 to $99,999 | 0 (0.0%) | 0 (0.0%) |
| $100,000 to $299,999 | 16 (6.6%) | 41 (8.3%) |
| $300,000 to $499,999 | 48 (19.9%) | 172 (34.6%) |
| $500,000 to $749,999 | 131 (54.4%) | 120 (24.1%) |
| $750,000 to $999,999 | 17 (7.0%) | 142 (28.6%) |
| $1,000,000 or more | 29 (12.0%) | 22 (4.4%) |
| Total | 241 (100.0%) | 497 (100.0%) |
Household Income by Mortgage Status in Southworth
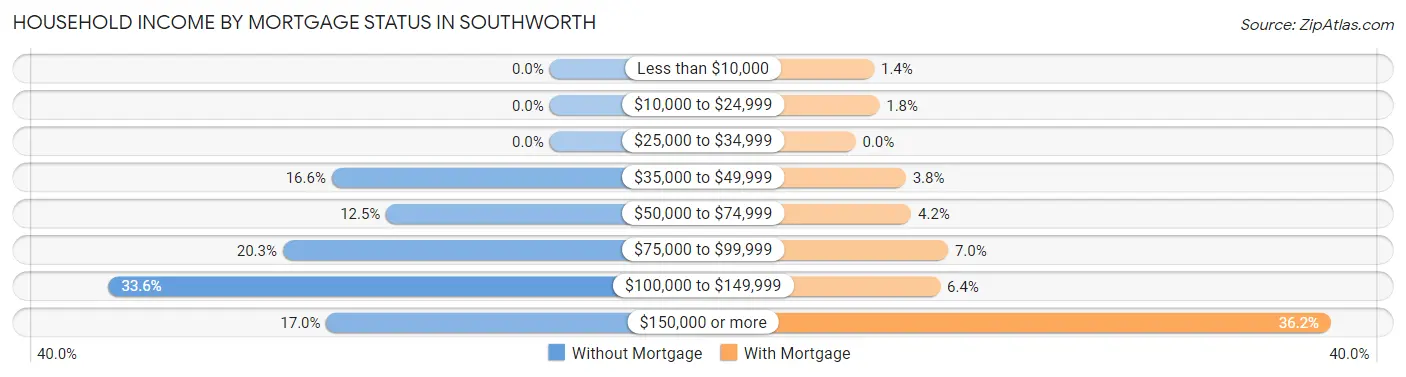
| Household Income | Without Mortgage | With Mortgage |
| Less than $10,000 | 0 (0.0%) | 7 (1.4%) |
| $10,000 to $24,999 | 0 (0.0%) | 9 (1.8%) |
| $25,000 to $34,999 | 0 (0.0%) | 0 (0.0%) |
| $35,000 to $49,999 | 40 (16.6%) | 19 (3.8%) |
| $50,000 to $74,999 | 30 (12.4%) | 21 (4.2%) |
| $75,000 to $99,999 | 49 (20.3%) | 35 (7.0%) |
| $100,000 to $149,999 | 81 (33.6%) | 32 (6.4%) |
| $150,000 or more | 41 (17.0%) | 180 (36.2%) |
| Total | 241 (100.0%) | 497 (100.0%) |
Property Value to Household Income Ratio in Southworth
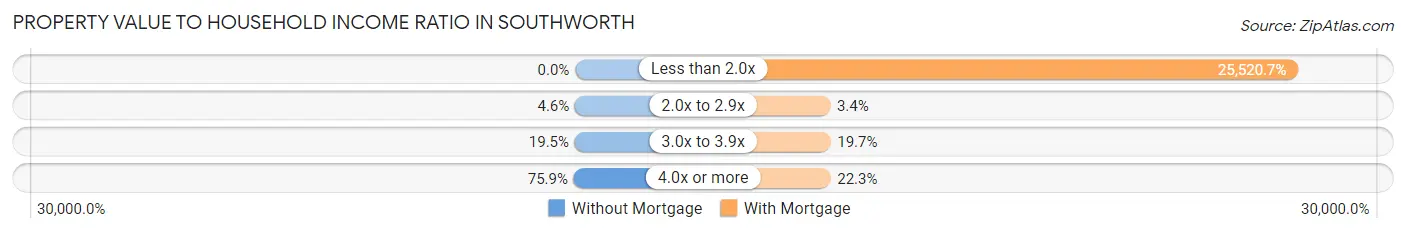
| Value-to-Income Ratio | Without Mortgage | With Mortgage |
| Less than 2.0x | 0 (0.0%) | 126,838 (25,520.7%) |
| 2.0x to 2.9x | 11 (4.6%) | 17 (3.4%) |
| 3.0x to 3.9x | 47 (19.5%) | 98 (19.7%) |
| 4.0x or more | 183 (75.9%) | 111 (22.3%) |
| Total | 241 (100.0%) | 497 (100.0%) |
Real Estate Taxes by Mortgage Status in Southworth
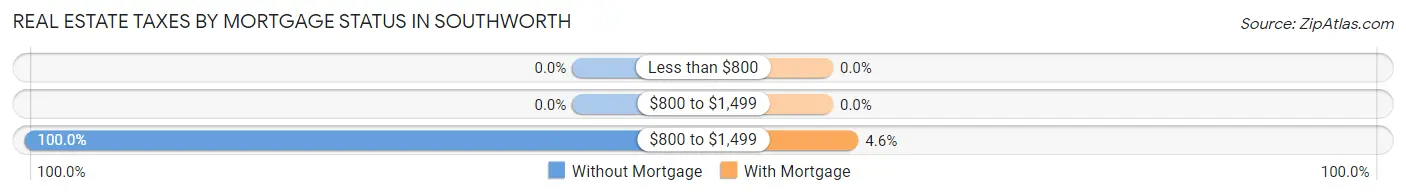
| Property Taxes | Without Mortgage | With Mortgage |
| Less than $800 | 0 (0.0%) | 0 (0.0%) |
| $800 to $1,499 | 0 (0.0%) | 0 (0.0%) |
| $800 to $1,499 | 241 (100.0%) | 23 (4.6%) |
| Total | 241 (100.0%) | 497 (100.0%) |
Health & Disability in Southworth
Health Insurance Coverage by Age in Southworth
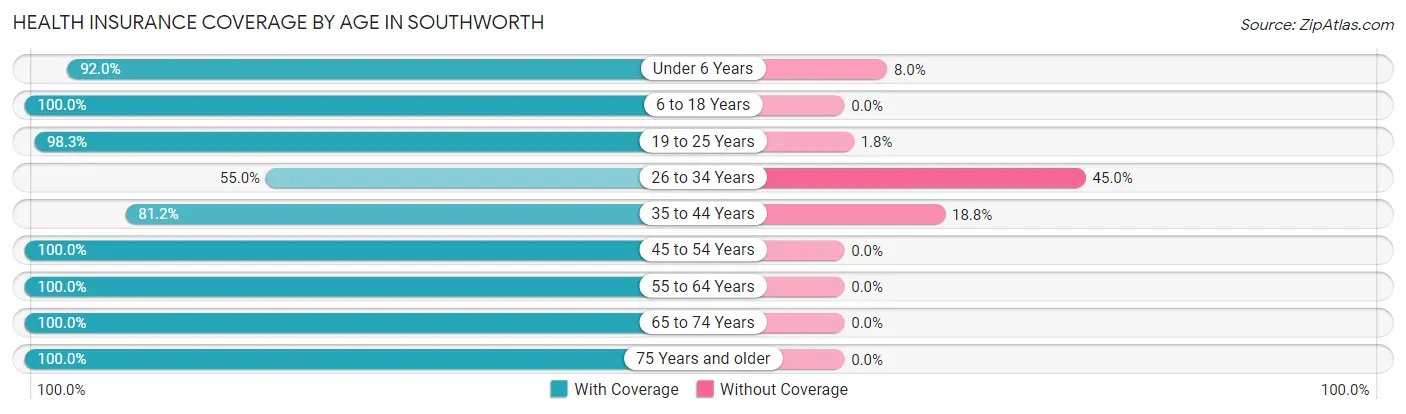
| Age Bracket | With Coverage | Without Coverage |
| Under 6 Years | 104 (92.0%) | 9 (8.0%) |
| 6 to 18 Years | 157 (100.0%) | 0 (0.0%) |
| 19 to 25 Years | 168 (98.3%) | 3 (1.8%) |
| 26 to 34 Years | 44 (55.0%) | 36 (45.0%) |
| 35 to 44 Years | 160 (81.2%) | 37 (18.8%) |
| 45 to 54 Years | 557 (100.0%) | 0 (0.0%) |
| 55 to 64 Years | 251 (100.0%) | 0 (0.0%) |
| 65 to 74 Years | 250 (100.0%) | 0 (0.0%) |
| 75 Years and older | 164 (100.0%) | 0 (0.0%) |
| Total | 1,855 (95.6%) | 85 (4.4%) |
Health Insurance Coverage by Citizenship Status in Southworth
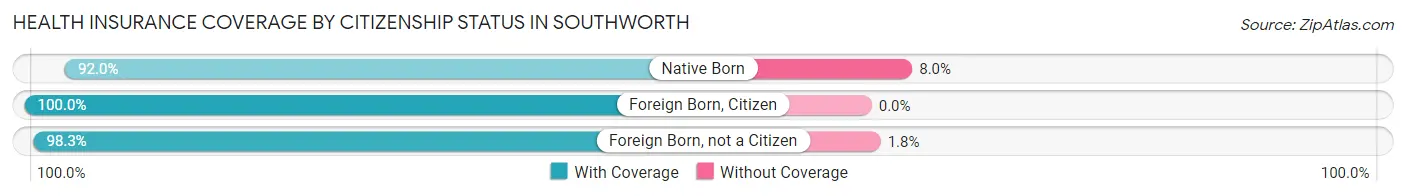
| Citizenship Status | With Coverage | Without Coverage |
| Native Born | 104 (92.0%) | 9 (8.0%) |
| Foreign Born, Citizen | 157 (100.0%) | 0 (0.0%) |
| Foreign Born, not a Citizen | 168 (98.3%) | 3 (1.8%) |
Health Insurance Coverage by Household Income in Southworth
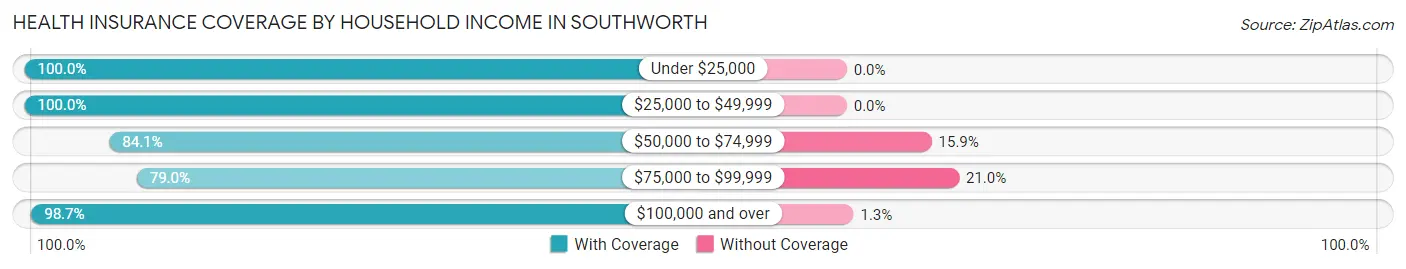
| Household Income | With Coverage | Without Coverage |
| Under $25,000 | 9 (100.0%) | 0 (0.0%) |
| $25,000 to $49,999 | 211 (100.0%) | 0 (0.0%) |
| $50,000 to $74,999 | 127 (84.1%) | 24 (15.9%) |
| $75,000 to $99,999 | 154 (79.0%) | 41 (21.0%) |
| $100,000 and over | 1,332 (98.7%) | 17 (1.3%) |
Public vs Private Health Insurance Coverage by Age in Southworth
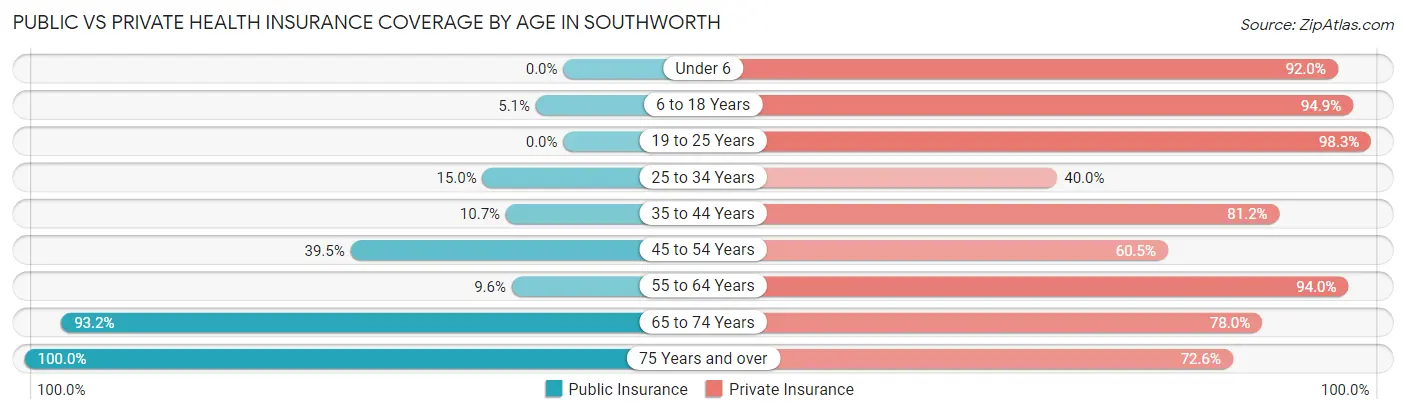
| Age Bracket | Public Insurance | Private Insurance |
| Under 6 | 0 (0.0%) | 104 (92.0%) |
| 6 to 18 Years | 8 (5.1%) | 149 (94.9%) |
| 19 to 25 Years | 0 (0.0%) | 168 (98.3%) |
| 25 to 34 Years | 12 (15.0%) | 32 (40.0%) |
| 35 to 44 Years | 21 (10.7%) | 160 (81.2%) |
| 45 to 54 Years | 220 (39.5%) | 337 (60.5%) |
| 55 to 64 Years | 24 (9.6%) | 236 (94.0%) |
| 65 to 74 Years | 233 (93.2%) | 195 (78.0%) |
| 75 Years and over | 164 (100.0%) | 119 (72.6%) |
| Total | 682 (35.1%) | 1,500 (77.3%) |
Disability Status by Sex by Age in Southworth
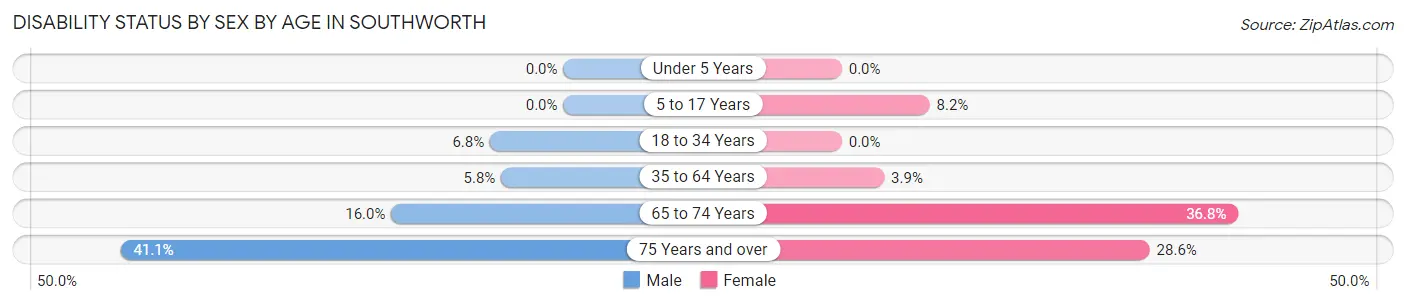
| Age Bracket | Male | Female |
| Under 5 Years | 0 (0.0%) | 0 (0.0%) |
| 5 to 17 Years | 0 (0.0%) | 11 (8.2%) |
| 18 to 34 Years | 10 (6.8%) | 0 (0.0%) |
| 35 to 64 Years | 33 (5.8%) | 17 (3.9%) |
| 65 to 74 Years | 23 (16.0%) | 39 (36.8%) |
| 75 Years and over | 30 (41.1%) | 26 (28.6%) |
Disability Class by Sex by Age in Southworth
Disability Class: Hearing Difficulty
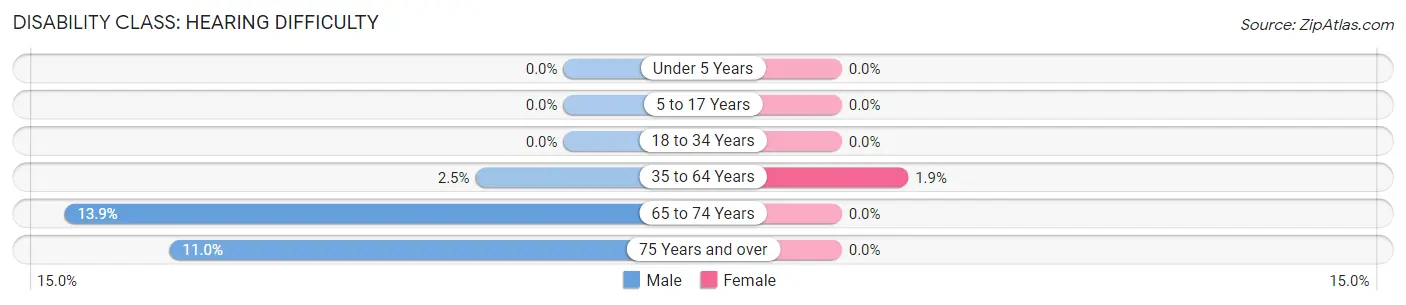
| Age Bracket | Male | Female |
| Under 5 Years | 0 (0.0%) | 0 (0.0%) |
| 5 to 17 Years | 0 (0.0%) | 0 (0.0%) |
| 18 to 34 Years | 0 (0.0%) | 0 (0.0%) |
| 35 to 64 Years | 14 (2.5%) | 8 (1.8%) |
| 65 to 74 Years | 20 (13.9%) | 0 (0.0%) |
| 75 Years and over | 8 (11.0%) | 0 (0.0%) |
Disability Class: Vision Difficulty
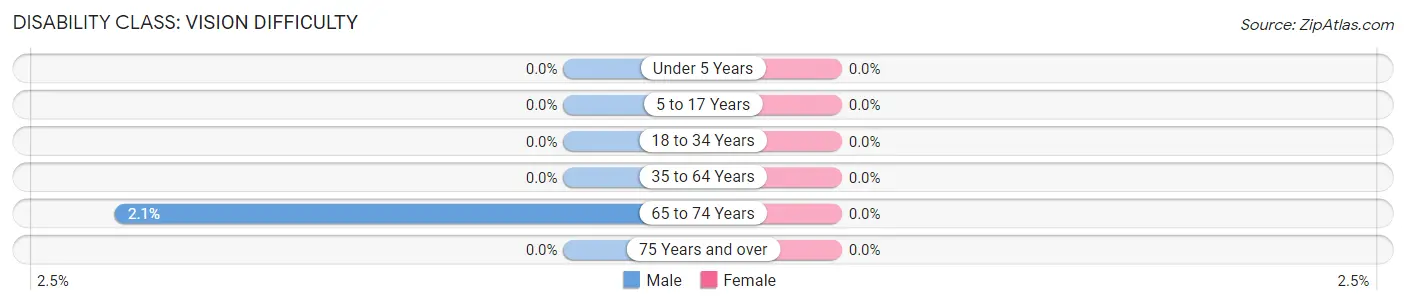
| Age Bracket | Male | Female |
| Under 5 Years | 0 (0.0%) | 0 (0.0%) |
| 5 to 17 Years | 0 (0.0%) | 0 (0.0%) |
| 18 to 34 Years | 0 (0.0%) | 0 (0.0%) |
| 35 to 64 Years | 0 (0.0%) | 0 (0.0%) |
| 65 to 74 Years | 3 (2.1%) | 0 (0.0%) |
| 75 Years and over | 0 (0.0%) | 0 (0.0%) |
Disability Class: Cognitive Difficulty
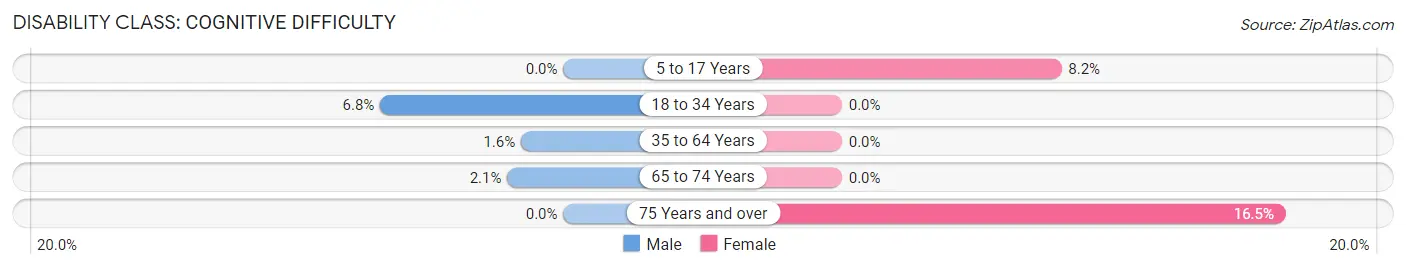
| Age Bracket | Male | Female |
| 5 to 17 Years | 0 (0.0%) | 11 (8.2%) |
| 18 to 34 Years | 10 (6.8%) | 0 (0.0%) |
| 35 to 64 Years | 9 (1.6%) | 0 (0.0%) |
| 65 to 74 Years | 3 (2.1%) | 0 (0.0%) |
| 75 Years and over | 0 (0.0%) | 15 (16.5%) |
Disability Class: Ambulatory Difficulty
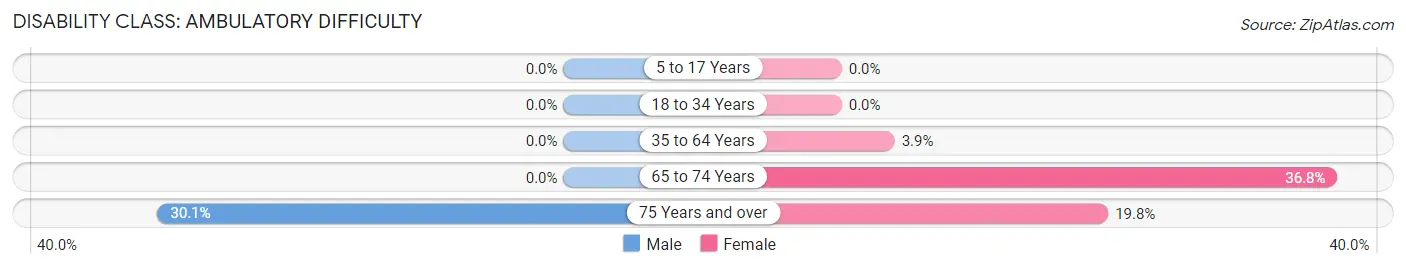
| Age Bracket | Male | Female |
| 5 to 17 Years | 0 (0.0%) | 0 (0.0%) |
| 18 to 34 Years | 0 (0.0%) | 0 (0.0%) |
| 35 to 64 Years | 0 (0.0%) | 17 (3.9%) |
| 65 to 74 Years | 0 (0.0%) | 39 (36.8%) |
| 75 Years and over | 22 (30.1%) | 18 (19.8%) |
Disability Class: Self-Care Difficulty
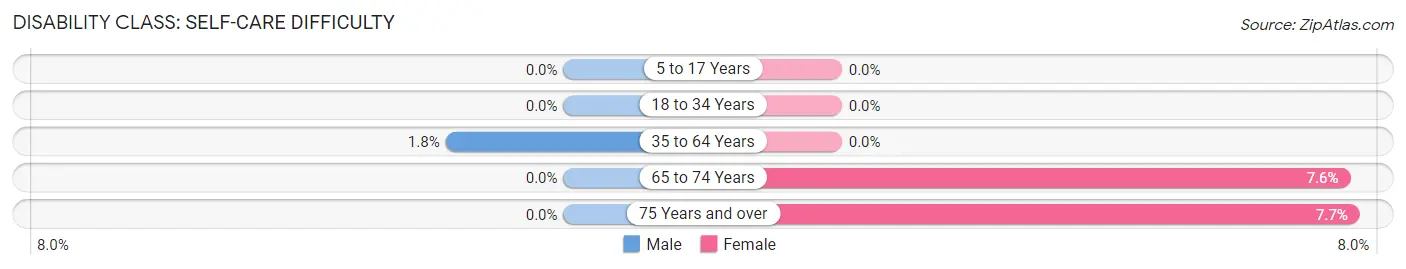
| Age Bracket | Male | Female |
| 5 to 17 Years | 0 (0.0%) | 0 (0.0%) |
| 18 to 34 Years | 0 (0.0%) | 0 (0.0%) |
| 35 to 64 Years | 10 (1.8%) | 0 (0.0%) |
| 65 to 74 Years | 0 (0.0%) | 8 (7.5%) |
| 75 Years and over | 0 (0.0%) | 7 (7.7%) |
Technology Access in Southworth
Computing Device Access in Southworth
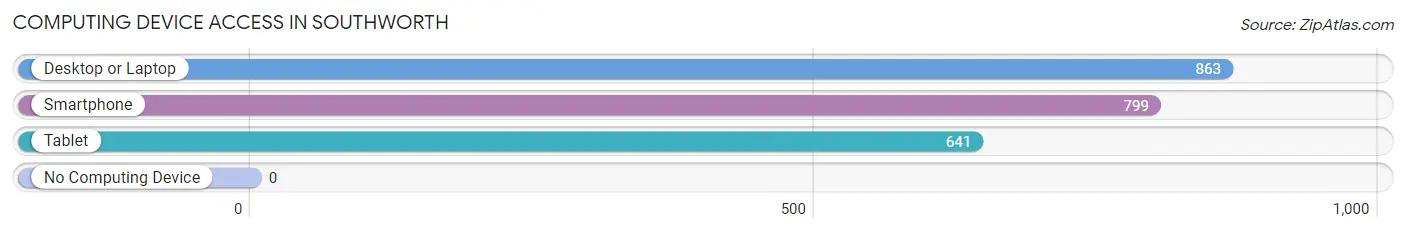
| Device Type | # Households | % Households |
| Desktop or Laptop | 863 | 98.4% |
| Smartphone | 799 | 91.1% |
| Tablet | 641 | 73.1% |
| No Computing Device | 0 | 0.0% |
| Total | 877 | 100.0% |
Internet Access in Southworth
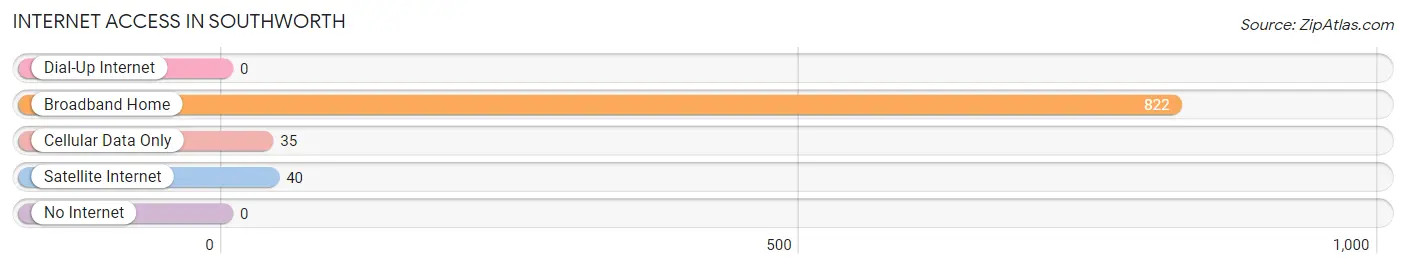
| Internet Type | # Households | % Households |
| Dial-Up Internet | 0 | 0.0% |
| Broadband Home | 822 | 93.7% |
| Cellular Data Only | 35 | 4.0% |
| Satellite Internet | 40 | 4.6% |
| No Internet | 0 | 0.0% |
| Total | 877 | 100.0% |
Southworth Summary
Southworth is a small unincorporated community located in Kitsap County, Washington, United States. It is situated on the south side of the Puget Sound, just south of the city of Seattle. The population of Southworth was estimated to be 1,845 in 2019.
History
Southworth was first settled in the late 1800s by a group of homesteaders who were drawn to the area by its natural beauty and abundant resources. The first settlers were mostly farmers and fishermen, and the area quickly became known for its abundance of salmon, oysters, and other seafood. The area was also known for its logging industry, which provided timber for the growing city of Seattle.
In the early 1900s, the area was developed as a resort community, with several hotels and resorts being built along the waterfront. The area was also home to a number of summer camps, which attracted visitors from all over the country.
In the 1950s, the area began to experience a population boom as people moved to the area to take advantage of the booming economy in Seattle. The population of Southworth grew rapidly, and by the 1970s, the area had become a popular destination for commuters who worked in Seattle but wanted to live in a more rural setting.
Geography
Southworth is located on the south side of the Puget Sound, just south of the city of Seattle. The area is bordered by the Kitsap Peninsula to the west, the Olympic Mountains to the east, and the Hood Canal to the south. The area is mostly rural, with a few small towns and villages scattered throughout.
The climate in Southworth is mild and temperate, with warm summers and cool winters. The average annual temperature is around 50 degrees Fahrenheit, and the average annual precipitation is around 40 inches.
Economy
The economy of Southworth is largely based on tourism and the service industry. The area is home to several resorts and hotels, as well as a number of restaurants and other businesses that cater to tourists. The area is also home to a number of small businesses, including a few wineries and craft breweries.
The area is also home to a number of small farms, which produce a variety of fruits and vegetables. The area is also known for its oyster farming, which is a major industry in the area.
Demographics
The population of Southworth is estimated to be 1,845 in 2019. The population is mostly white, with a small percentage of African Americans, Asians, and other ethnicities. The median age of the population is 44, and the median household income is $68,000.
The majority of the population is employed in the service industry, with a small percentage employed in the tourism industry. The area is also home to a number of small businesses, including a few wineries and craft breweries.
Conclusion
Southworth is a small unincorporated community located in Kitsap County, Washington, United States. It is situated on the south side of the Puget Sound, just south of the city of Seattle. The population of Southworth was estimated to be 1,845 in 2019. The area is mostly rural, with a few small towns and villages scattered throughout. The economy of Southworth is largely based on tourism and the service industry, and the population is mostly white, with a small percentage of African Americans, Asians, and other ethnicities. The median age of the population is 44, and the median household income is $68,000.
Common Questions
What is Per Capita Income in Southworth?
Per Capita income in Southworth is $56,428.
What is the Median Family Income in Southworth?
Median Family Income in Southworth is $126,209.
What is the Median Household income in Southworth?
Median Household Income in Southworth is $125,446.
What is Income or Wage Gap in Southworth?
Income or Wage Gap in Southworth is 41.6%.
Women in Southworth earn 58.4 cents for every dollar earned by a man.
What is Inequality or Gini Index in Southworth?
Inequality or Gini Index in Southworth is 0.28.
What is the Total Population of Southworth?
Total Population of Southworth is 1,953.
What is the Total Male Population of Southworth?
Total Male Population of Southworth is 979.
What is the Total Female Population of Southworth?
Total Female Population of Southworth is 974.
What is the Ratio of Males per 100 Females in Southworth?
There are 100.51 Males per 100 Females in Southworth.
What is the Ratio of Females per 100 Males in Southworth?
There are 99.49 Females per 100 Males in Southworth.
What is the Median Population Age in Southworth?
Median Population Age in Southworth is 50.6 Years.
What is the Average Family Size in Southworth
Average Family Size in Southworth is 2.4 People.
What is the Average Household Size in Southworth
Average Household Size in Southworth is 2.2 People.
How Large is the Labor Force in Southworth?
There are 1,055 People in the Labor Forcein in Southworth.
What is the Percentage of People in the Labor Force in Southworth?
61.6% of People are in the Labor Force in Southworth.
What is the Unemployment Rate in Southworth?
Unemployment Rate in Southworth is 5.6%.