Clearview, WA Map & Demographics
Clearview Map
Clearview Overview
$61,198
PER CAPITA INCOME
$197,308
AVG FAMILY INCOME
$174,051
AVG HOUSEHOLD INCOME
22.1%
WAGE / INCOME GAP [ % ]
77.9¢/ $1
WAGE / INCOME GAP [ $ ]
0.34
INEQUALITY / GINI INDEX
3,763
TOTAL POPULATION
2,110
MALE POPULATION
1,653
FEMALE POPULATION
127.65
MALES / 100 FEMALES
78.34
FEMALES / 100 MALES
41.3
MEDIAN AGE
3.1
AVG FAMILY SIZE
2.7
AVG HOUSEHOLD SIZE
2,025
LABOR FORCE [ PEOPLE ]
66.3%
PERCENT IN LABOR FORCE
2.1%
UNEMPLOYMENT RATE
Income in Clearview
Income Overview in Clearview
Per Capita Income in Clearview is $61,198, while median incomes of families and households are $197,308 and $174,051 respectively.
| Characteristic | Number | Measure |
| Per Capita Income | 3,763 | $61,198 |
| Median Family Income | 1,022 | $197,308 |
| Mean Family Income | 1,022 | $183,937 |
| Median Household Income | 1,385 | $174,051 |
| Mean Household Income | 1,385 | $160,383 |
| Income Deficit | 1,022 | $0 |
| Wage / Income Gap (%) | 3,763 | 22.08% |
| Wage / Income Gap ($) | 3,763 | 77.92¢ per $1 |
| Gini / Inequality Index | 3,763 | 0.34 |
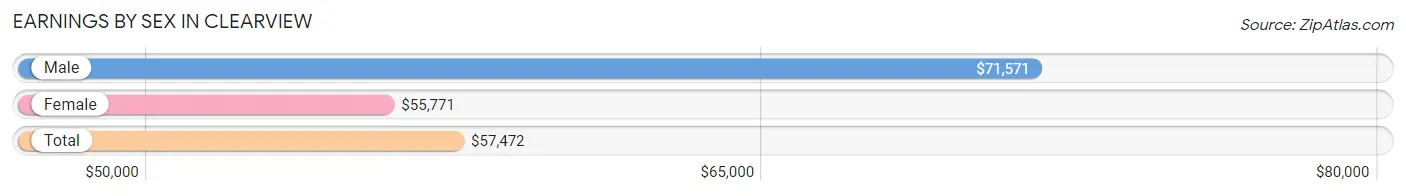
Earnings by Sex in Clearview
Average Earnings in Clearview are $57,472, $71,571 for men and $55,771 for women, a difference of 22.1%.
| Sex | Number | Average Earnings |
| Male | 1,332 (61.9%) | $71,571 |
| Female | 821 (38.1%) | $55,771 |
| Total | 2,153 (100.0%) | $57,472 |
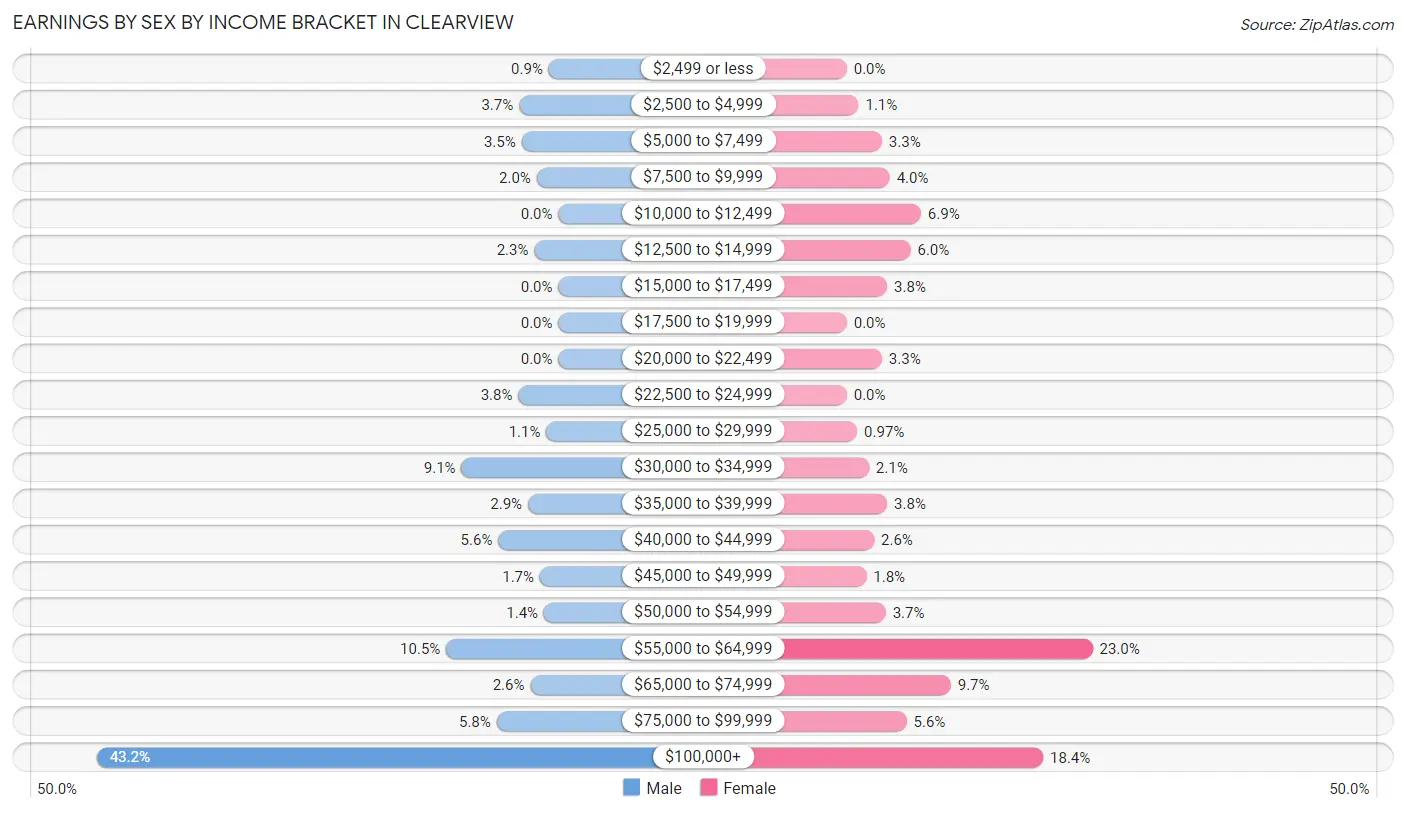
Earnings by Sex by Income Bracket in Clearview
The most common earnings brackets in Clearview are $100,000+ for men (576 | 43.2%) and $55,000 to $64,999 for women (189 | 23.0%).
| Income | Male | Female |
| $2,499 or less | 12 (0.9%) | 0 (0.0%) |
| $2,500 to $4,999 | 49 (3.7%) | 9 (1.1%) |
| $5,000 to $7,499 | 46 (3.5%) | 27 (3.3%) |
| $7,500 to $9,999 | 27 (2.0%) | 33 (4.0%) |
| $10,000 to $12,499 | 0 (0.0%) | 57 (6.9%) |
| $12,500 to $14,999 | 30 (2.2%) | 49 (6.0%) |
| $15,000 to $17,499 | 0 (0.0%) | 31 (3.8%) |
| $17,500 to $19,999 | 0 (0.0%) | 0 (0.0%) |
| $20,000 to $22,499 | 0 (0.0%) | 27 (3.3%) |
| $22,500 to $24,999 | 50 (3.7%) | 0 (0.0%) |
| $25,000 to $29,999 | 15 (1.1%) | 8 (1.0%) |
| $30,000 to $34,999 | 121 (9.1%) | 17 (2.1%) |
| $35,000 to $39,999 | 38 (2.9%) | 31 (3.8%) |
| $40,000 to $44,999 | 75 (5.6%) | 21 (2.6%) |
| $45,000 to $49,999 | 23 (1.7%) | 15 (1.8%) |
| $50,000 to $54,999 | 18 (1.3%) | 30 (3.6%) |
| $55,000 to $64,999 | 140 (10.5%) | 189 (23.0%) |
| $65,000 to $74,999 | 35 (2.6%) | 80 (9.7%) |
| $75,000 to $99,999 | 77 (5.8%) | 46 (5.6%) |
| $100,000+ | 576 (43.2%) | 151 (18.4%) |
| Total | 1,332 (100.0%) | 821 (100.0%) |
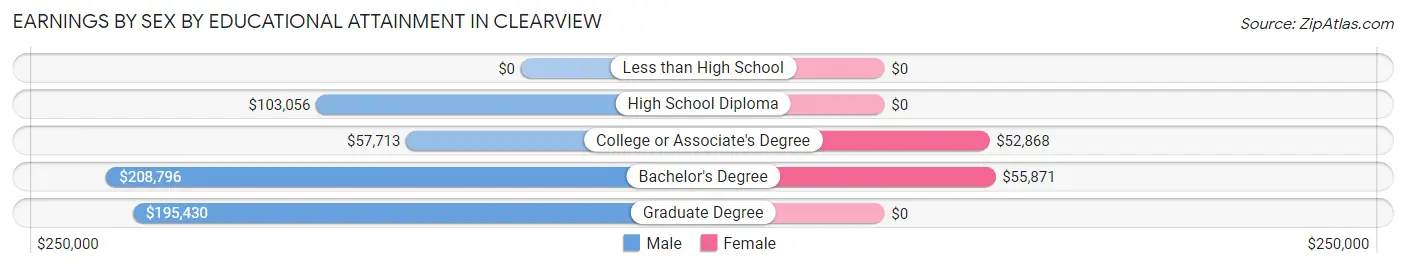
Earnings by Sex by Educational Attainment in Clearview
Average earnings in Clearview are $103,050 for men and $55,424 for women, a difference of 46.2%. Men with an educational attainment of bachelor's degree enjoy the highest average annual earnings of $208,796, while those with college or associate's degree education earn the least with $57,713. Women with an educational attainment of bachelor's degree earn the most with the average annual earnings of $55,871, while those with college or associate's degree education have the smallest earnings of $52,868.
| Educational Attainment | Male Income | Female Income |
| Less than High School | - | - |
| High School Diploma | $103,056 | $0 |
| College or Associate's Degree | $57,713 | $52,868 |
| Bachelor's Degree | $208,796 | $55,871 |
| Graduate Degree | $195,430 | $0 |
| Total | $103,050 | $55,424 |
Family Income in Clearview
Family Income Brackets in Clearview
According to the Clearview family income data, there are 510 families falling into the $200,000+ income range, which is the most common income bracket and makes up 49.9% of all families.
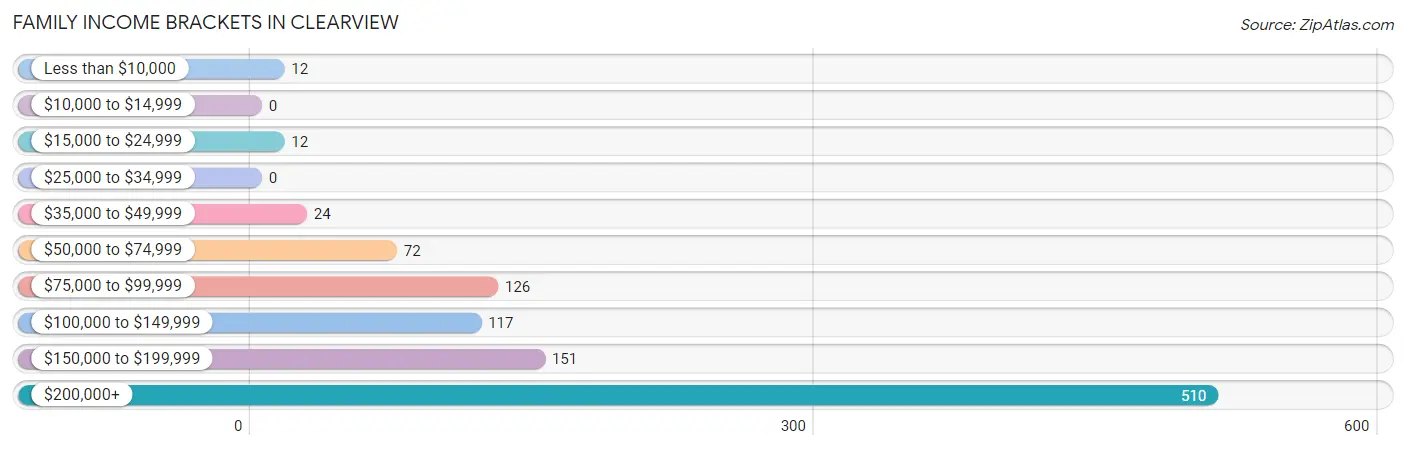
| Income Bracket | # Families | % Families |
| Less than $10,000 | 12 | 1.2% |
| $10,000 to $14,999 | 0 | 0.0% |
| $15,000 to $24,999 | 12 | 1.2% |
| $25,000 to $34,999 | 0 | 0.0% |
| $35,000 to $49,999 | 24 | 2.3% |
| $50,000 to $74,999 | 72 | 7.0% |
| $75,000 to $99,999 | 126 | 12.3% |
| $100,000 to $149,999 | 117 | 11.4% |
| $150,000 to $199,999 | 151 | 14.8% |
| $200,000+ | 510 | 49.9% |
Family Income by Famaliy Size in Clearview
5-person families (81 | 7.9%) account for the highest median family income in Clearview with $225,938 per family, while 2-person families (488 | 47.7%) have the highest median income of $98,366 per family member.
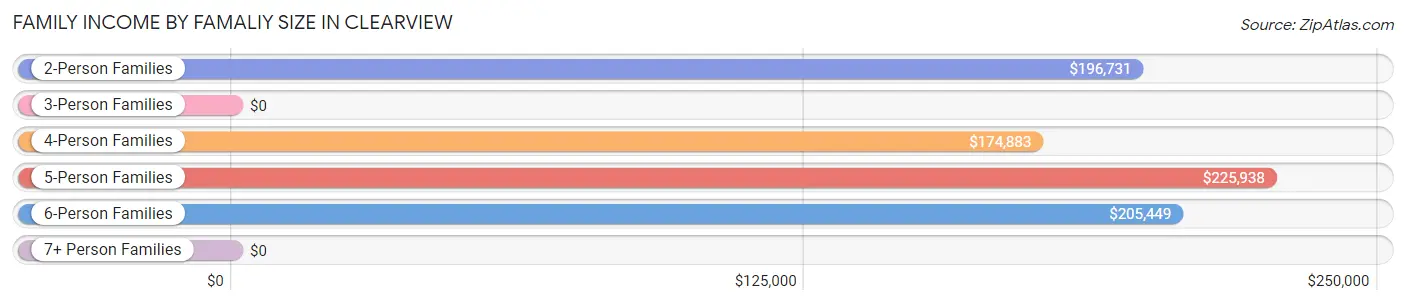
| Income Bracket | # Families | Median Income |
| 2-Person Families | 488 (47.7%) | $196,731 |
| 3-Person Families | 172 (16.8%) | $0 |
| 4-Person Families | 217 (21.2%) | $174,883 |
| 5-Person Families | 81 (7.9%) | $225,938 |
| 6-Person Families | 64 (6.3%) | $205,449 |
| 7+ Person Families | 0 (0.0%) | $0 |
| Total | 1,022 (100.0%) | $197,308 |
Family Income by Number of Earners in Clearview
The median family income in Clearview is $197,308, with families comprising 2 earners (383) having the highest median family income of $233,750, while families with no earners (126) have the lowest median family income of $85,625, accounting for 37.5% and 12.3% of families, respectively.
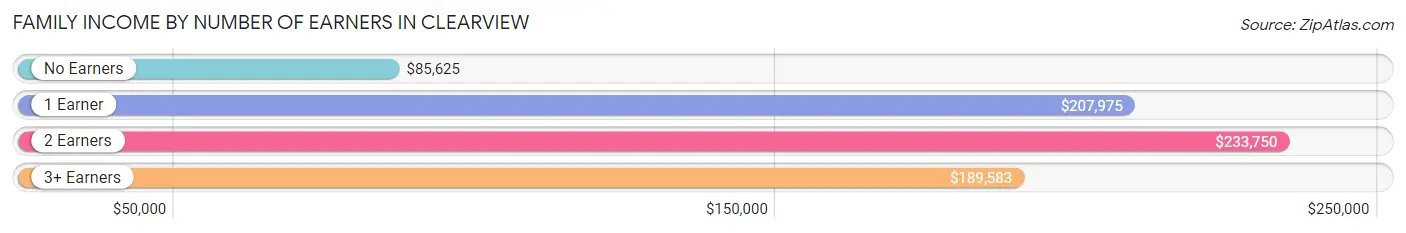
| Number of Earners | # Families | Median Income |
| No Earners | 126 (12.3%) | $85,625 |
| 1 Earner | 362 (35.4%) | $207,975 |
| 2 Earners | 383 (37.5%) | $233,750 |
| 3+ Earners | 151 (14.8%) | $189,583 |
| Total | 1,022 (100.0%) | $197,308 |
Household Income in Clearview
Household Income Brackets in Clearview
With 537 households falling in the category, the $200,000+ income range is the most frequent in Clearview, accounting for 38.8% of all households.
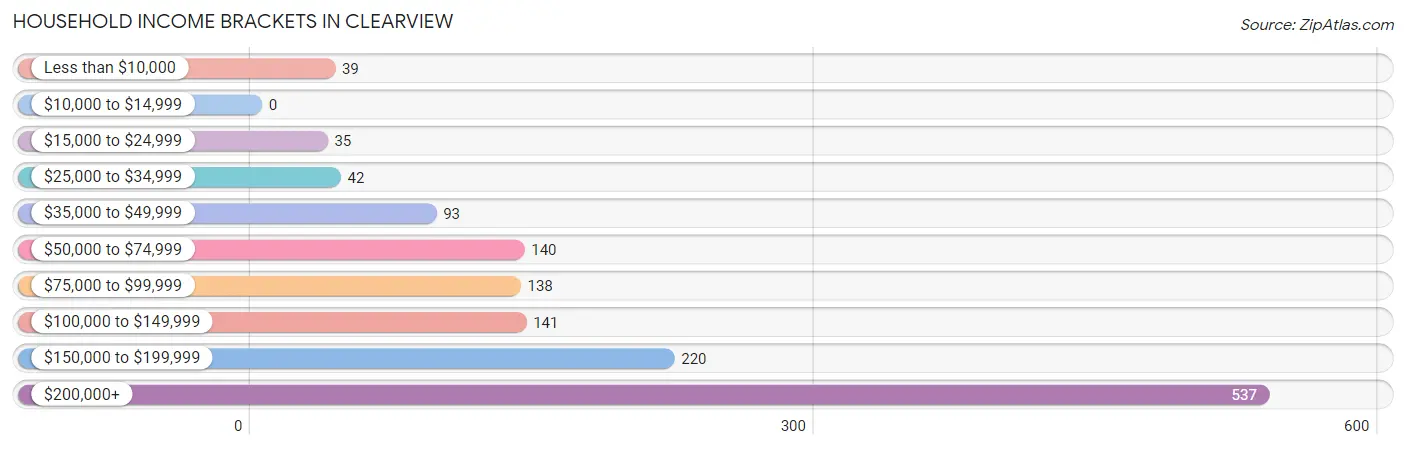
| Income Bracket | # Households | % Households |
| Less than $10,000 | 39 | 2.8% |
| $10,000 to $14,999 | 0 | 0.0% |
| $15,000 to $24,999 | 35 | 2.5% |
| $25,000 to $34,999 | 42 | 3.0% |
| $35,000 to $49,999 | 93 | 6.7% |
| $50,000 to $74,999 | 140 | 10.1% |
| $75,000 to $99,999 | 138 | 10.0% |
| $100,000 to $149,999 | 141 | 10.2% |
| $150,000 to $199,999 | 220 | 15.9% |
| $200,000+ | 537 | 38.8% |
Household Income by Householder Age in Clearview
The median household income in Clearview is $174,051, with the highest median household income of $207,901 found in the 25 to 44 years age bracket for the primary householder. A total of 414 households (29.9%) fall into this category. Meanwhile, the 15 to 24 years age bracket for the primary householder has the lowest median household income of $0, with 69 households (5.0%) in this group.
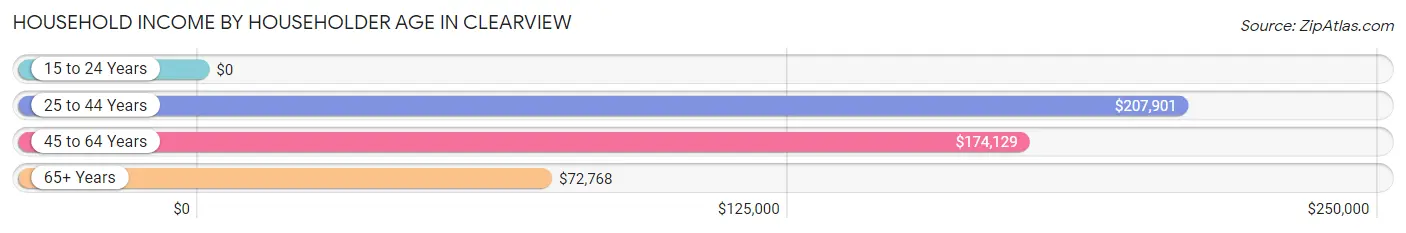
| Income Bracket | # Households | Median Income |
| 15 to 24 Years | 69 (5.0%) | $0 |
| 25 to 44 Years | 414 (29.9%) | $207,901 |
| 45 to 64 Years | 637 (46.0%) | $174,129 |
| 65+ Years | 265 (19.1%) | $72,768 |
| Total | 1,385 (100.0%) | $174,051 |
Poverty in Clearview
Income Below Poverty by Sex and Age in Clearview
With 3.0% poverty level for males and 1.9% for females among the residents of Clearview, 15 year old males and under 5 year old females are the most vulnerable to poverty, with 7 males (100.0%) and 13 females (39.4%) in their respective age groups living below the poverty level.
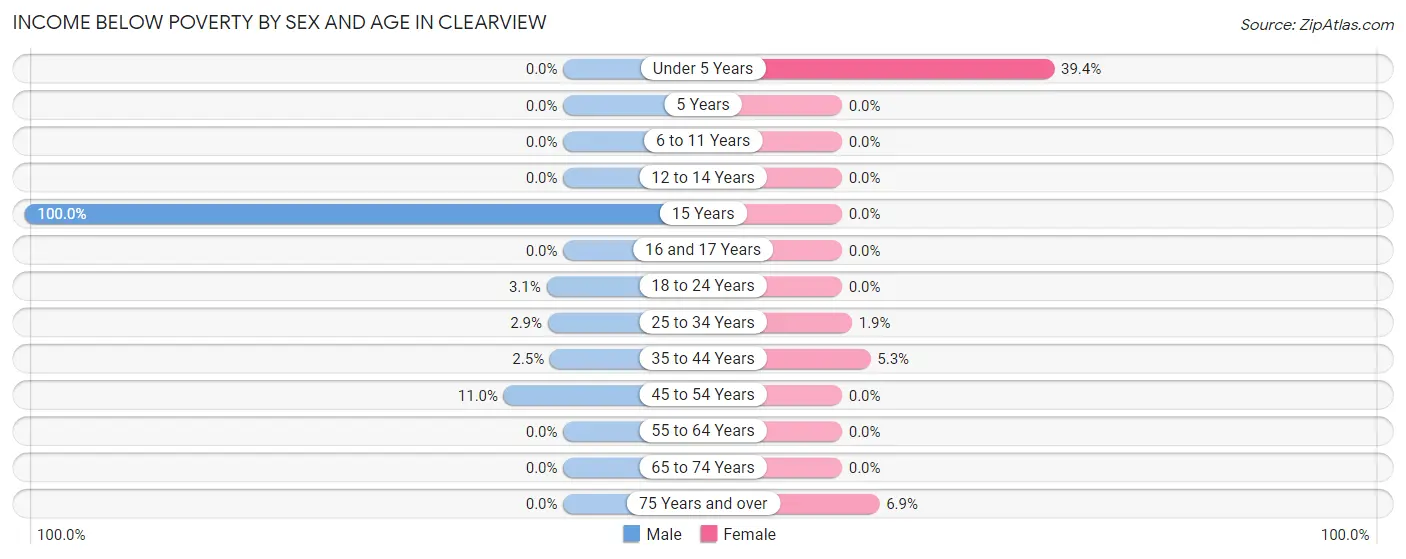
| Age Bracket | Male | Female |
| Under 5 Years | 0 (0.0%) | 13 (39.4%) |
| 5 Years | 0 (0.0%) | 0 (0.0%) |
| 6 to 11 Years | 0 (0.0%) | 0 (0.0%) |
| 12 to 14 Years | 0 (0.0%) | 0 (0.0%) |
| 15 Years | 7 (100.0%) | 0 (0.0%) |
| 16 and 17 Years | 0 (0.0%) | 0 (0.0%) |
| 18 to 24 Years | 7 (3.1%) | 0 (0.0%) |
| 25 to 34 Years | 6 (2.9%) | 6 (1.8%) |
| 35 to 44 Years | 8 (2.5%) | 8 (5.3%) |
| 45 to 54 Years | 36 (11.0%) | 0 (0.0%) |
| 55 to 64 Years | 0 (0.0%) | 0 (0.0%) |
| 65 to 74 Years | 0 (0.0%) | 0 (0.0%) |
| 75 Years and over | 0 (0.0%) | 5 (6.9%) |
| Total | 64 (3.0%) | 32 (1.9%) |
Income Above Poverty by Sex and Age in Clearview
According to the poverty statistics in Clearview, males aged under 5 years and females aged 5 years are the age groups that are most secure financially, with 100.0% of males and 100.0% of females in these age groups living above the poverty line.
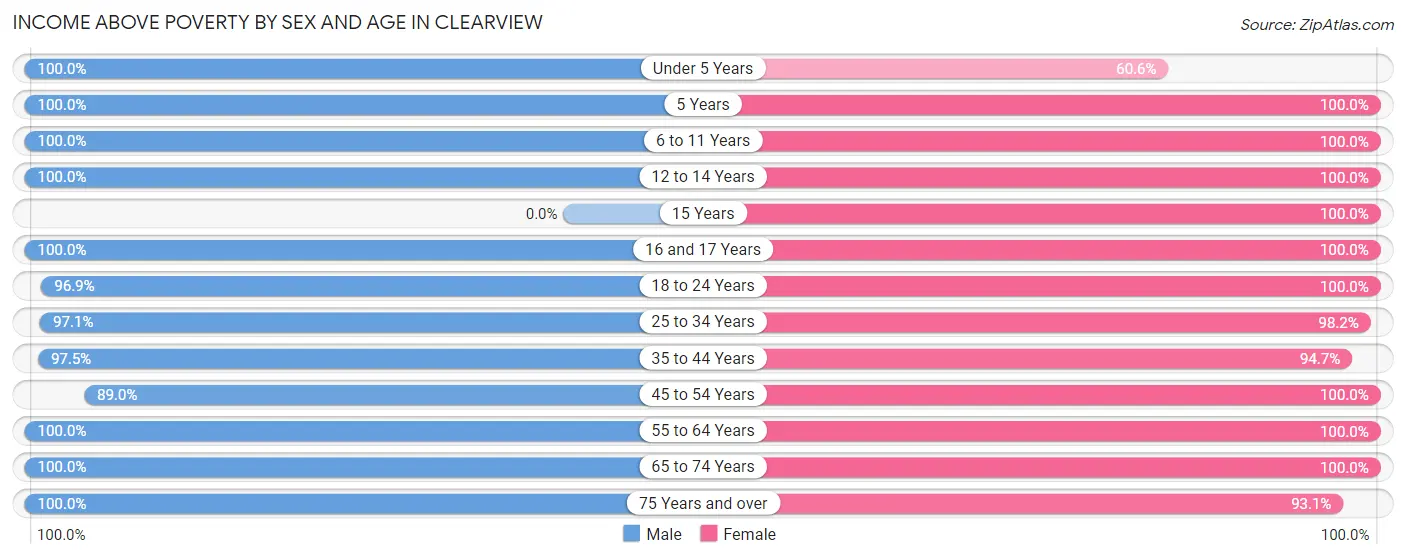
| Age Bracket | Male | Female |
| Under 5 Years | 81 (100.0%) | 20 (60.6%) |
| 5 Years | 55 (100.0%) | 11 (100.0%) |
| 6 to 11 Years | 178 (100.0%) | 86 (100.0%) |
| 12 to 14 Years | 54 (100.0%) | 143 (100.0%) |
| 15 Years | 0 (0.0%) | 61 (100.0%) |
| 16 and 17 Years | 179 (100.0%) | 9 (100.0%) |
| 18 to 24 Years | 217 (96.9%) | 96 (100.0%) |
| 25 to 34 Years | 203 (97.1%) | 318 (98.2%) |
| 35 to 44 Years | 315 (97.5%) | 143 (94.7%) |
| 45 to 54 Years | 290 (89.0%) | 274 (100.0%) |
| 55 to 64 Years | 252 (100.0%) | 225 (100.0%) |
| 65 to 74 Years | 111 (100.0%) | 168 (100.0%) |
| 75 Years and over | 110 (100.0%) | 67 (93.1%) |
| Total | 2,045 (97.0%) | 1,621 (98.1%) |
Income Below Poverty Among Married-Couple Families in Clearview
The poverty statistics for married-couple families in Clearview show that 0.8% or 6 of the total 741 families live below the poverty line. Families with 1 or 2 children have the highest poverty rate of 2.4%, comprising of 6 families. On the other hand, families with no children have the lowest poverty rate of 0.0%, which includes 0 families.
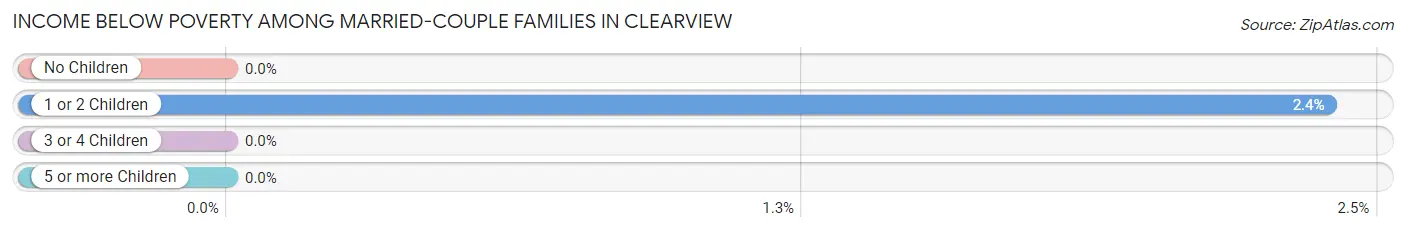
| Children | Above Poverty | Below Poverty |
| No Children | 421 (100.0%) | 0 (0.0%) |
| 1 or 2 Children | 245 (97.6%) | 6 (2.4%) |
| 3 or 4 Children | 69 (100.0%) | 0 (0.0%) |
| 5 or more Children | 0 (0.0%) | 0 (0.0%) |
| Total | 735 (99.2%) | 6 (0.8%) |
Income Below Poverty Among Single-Parent Households in Clearview
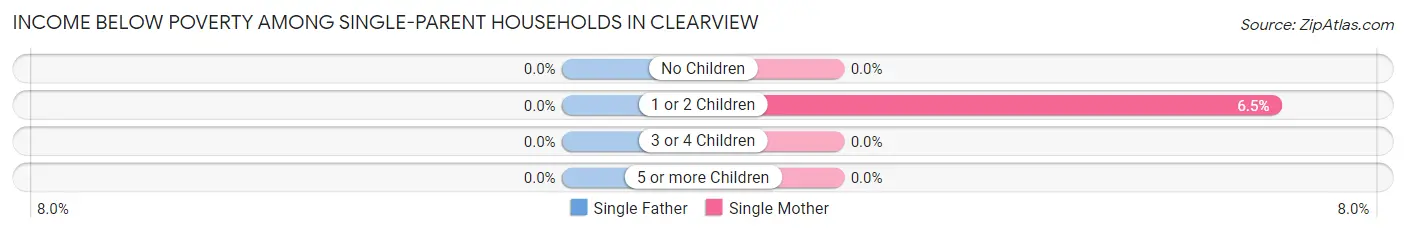
| Children | Single Father | Single Mother |
| No Children | 0 (0.0%) | 0 (0.0%) |
| 1 or 2 Children | 0 (0.0%) | 6 (6.5%) |
| 3 or 4 Children | 0 (0.0%) | 0 (0.0%) |
| 5 or more Children | 0 (0.0%) | 0 (0.0%) |
| Total | 0 (0.0%) | 6 (5.5%) |
Income Below Poverty Among Married-Couple vs Single-Parent Households in Clearview
The poverty data for Clearview shows that 6 of the married-couple family households (0.8%) and 6 of the single-parent households (2.1%) are living below the poverty level. Within the married-couple family households, those with 1 or 2 children have the highest poverty rate, with 6 households (2.4%) falling below the poverty line. Among the single-parent households, those with 1 or 2 children have the highest poverty rate, with 6 household (2.4%) living below poverty.
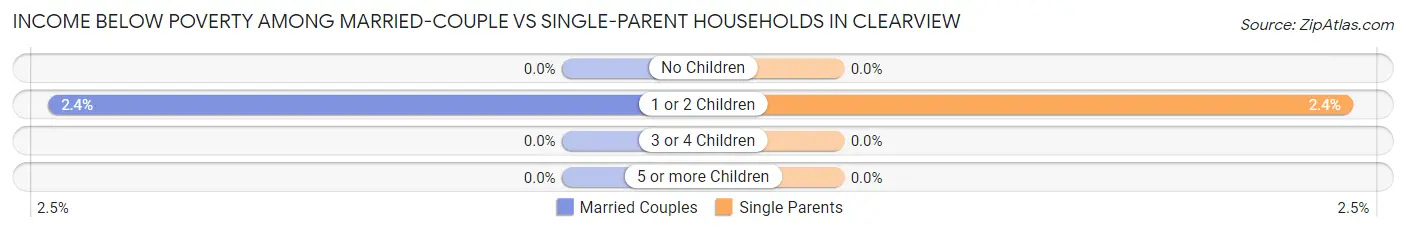
| Children | Married-Couple Families | Single-Parent Households |
| No Children | 0 (0.0%) | 0 (0.0%) |
| 1 or 2 Children | 6 (2.4%) | 6 (2.4%) |
| 3 or 4 Children | 0 (0.0%) | 0 (0.0%) |
| 5 or more Children | 0 (0.0%) | 0 (0.0%) |
| Total | 6 (0.8%) | 6 (2.1%) |
Race in Clearview
The most populous races in Clearview are White / Caucasian (3,343 | 88.8%), Asian (223 | 5.9%), and Two or more Races (183 | 4.9%).
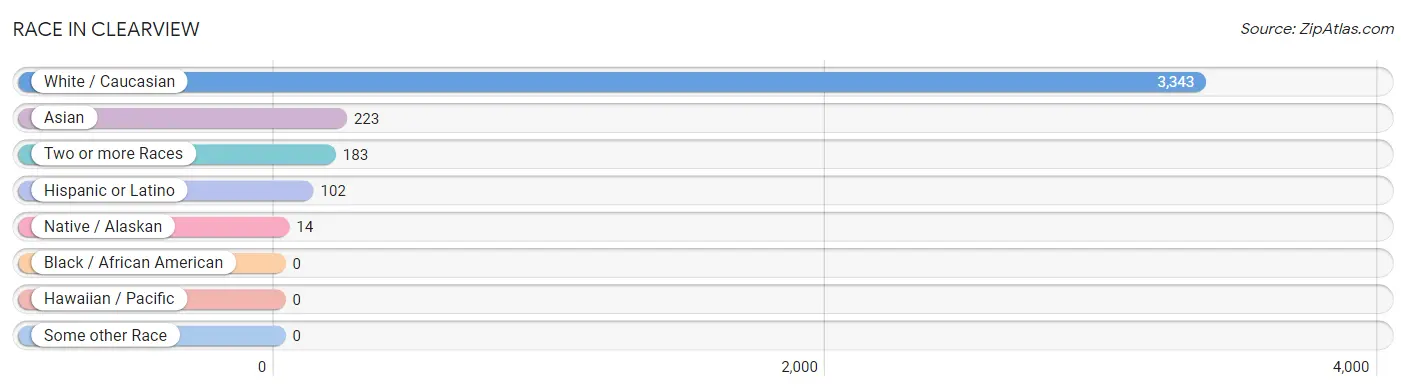
| Race | # Population | % Population |
| Asian | 223 | 5.9% |
| Black / African American | 0 | 0.0% |
| Hawaiian / Pacific | 0 | 0.0% |
| Hispanic or Latino | 102 | 2.7% |
| Native / Alaskan | 14 | 0.4% |
| White / Caucasian | 3,343 | 88.8% |
| Two or more Races | 183 | 4.9% |
| Some other Race | 0 | 0.0% |
| Total | 3,763 | 100.0% |
Ancestry in Clearview
The most populous ancestries reported in Clearview are German (458 | 12.2%), Polish (350 | 9.3%), English (302 | 8.0%), Irish (257 | 6.8%), and Norwegian (168 | 4.5%), together accounting for 40.8% of all Clearview residents.
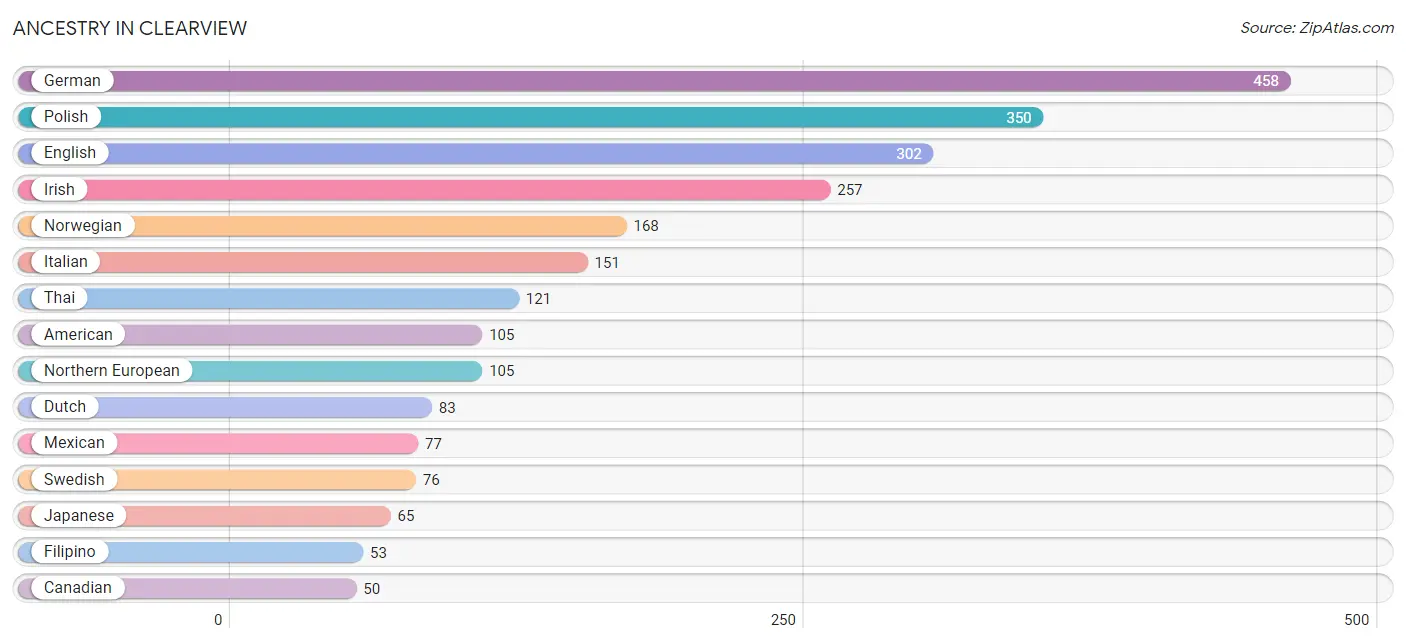
| Ancestry | # Population | % Population |
| American | 105 | 2.8% |
| Bhutanese | 23 | 0.6% |
| Burmese | 15 | 0.4% |
| Canadian | 50 | 1.3% |
| Cherokee | 12 | 0.3% |
| Cuban | 25 | 0.7% |
| Danish | 45 | 1.2% |
| Dutch | 83 | 2.2% |
| Eastern European | 10 | 0.3% |
| English | 302 | 8.0% |
| European | 19 | 0.5% |
| Filipino | 53 | 1.4% |
| French | 49 | 1.3% |
| German | 458 | 12.2% |
| Greek | 16 | 0.4% |
| Indian (Asian) | 19 | 0.5% |
| Inupiat | 14 | 0.4% |
| Iranian | 12 | 0.3% |
| Irish | 257 | 6.8% |
| Italian | 151 | 4.0% |
| Japanese | 65 | 1.7% |
| Mexican | 77 | 2.1% |
| Northern European | 105 | 2.8% |
| Norwegian | 168 | 4.5% |
| Polish | 350 | 9.3% |
| Russian | 3 | 0.1% |
| Scandinavian | 20 | 0.5% |
| Scotch-Irish | 36 | 1.0% |
| Scottish | 6 | 0.2% |
| Slavic | 11 | 0.3% |
| Swedish | 76 | 2.0% |
| Thai | 121 | 3.2% |
| Welsh | 11 | 0.3% | View All 33 Rows |
Immigrants in Clearview
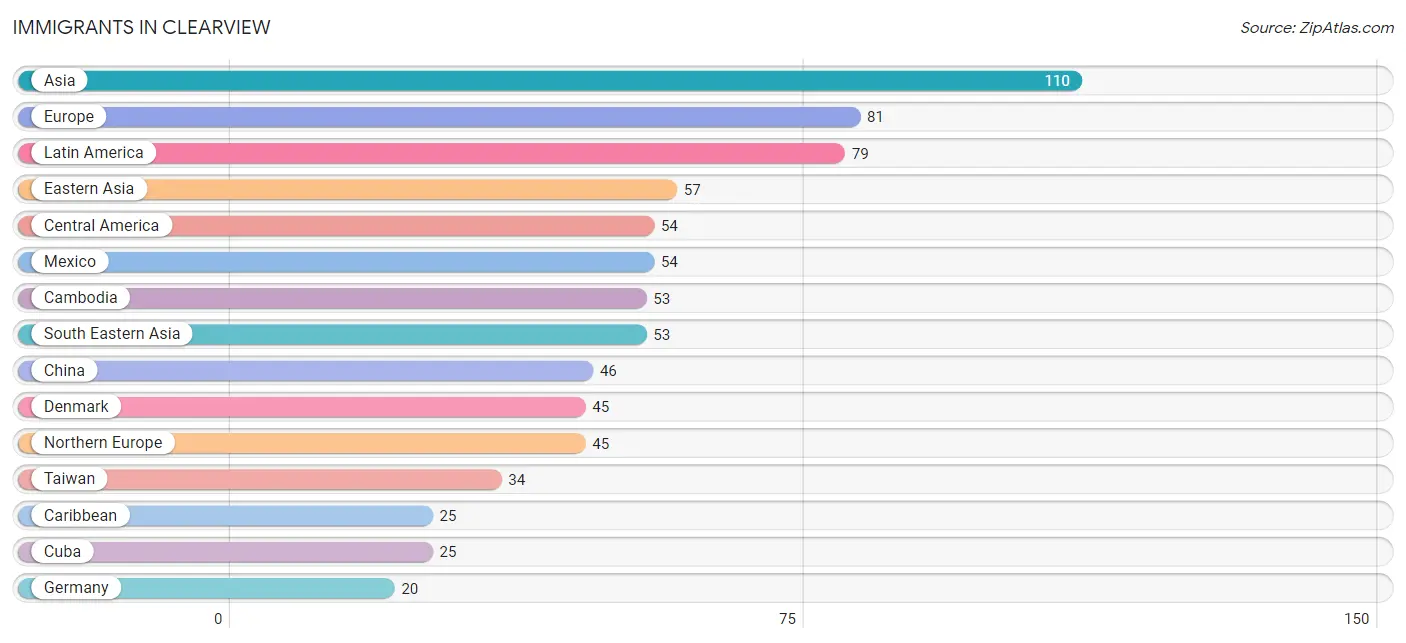
The most numerous immigrant groups reported in Clearview came from Asia (110 | 2.9%), Europe (81 | 2.1%), Latin America (79 | 2.1%), Eastern Asia (57 | 1.5%), and Central America (54 | 1.4%), together accounting for 10.1% of all Clearview residents.
| Immigration Origin | # Population | % Population |
| Asia | 110 | 2.9% |
| Cambodia | 53 | 1.4% |
| Canada | 14 | 0.4% |
| Caribbean | 25 | 0.7% |
| Central America | 54 | 1.4% |
| China | 46 | 1.2% |
| Cuba | 25 | 0.7% |
| Denmark | 45 | 1.2% |
| Eastern Asia | 57 | 1.5% |
| Europe | 81 | 2.1% |
| Germany | 20 | 0.5% |
| Greece | 16 | 0.4% |
| Korea | 11 | 0.3% |
| Latin America | 79 | 2.1% |
| Mexico | 54 | 1.4% |
| Northern Europe | 45 | 1.2% |
| South Eastern Asia | 53 | 1.4% |
| Southern Europe | 16 | 0.4% |
| Taiwan | 34 | 0.9% |
| Western Europe | 20 | 0.5% | View All 20 Rows |
Sex and Age in Clearview
Sex and Age in Clearview
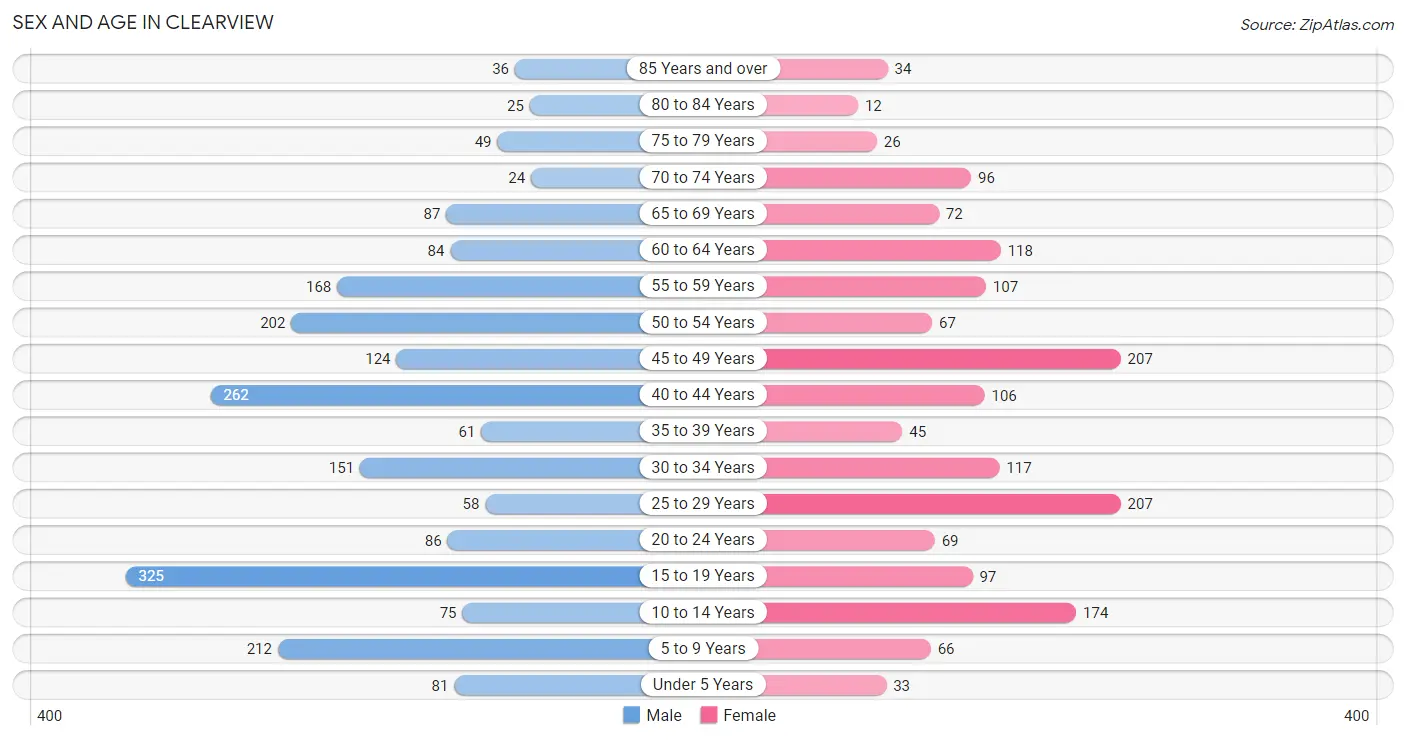
The most populous age groups in Clearview are 15 to 19 Years (325 | 15.4%) for men and 25 to 29 Years (207 | 12.5%) for women.
| Age Bracket | Male | Female |
| Under 5 Years | 81 (3.8%) | 33 (2.0%) |
| 5 to 9 Years | 212 (10.1%) | 66 (4.0%) |
| 10 to 14 Years | 75 (3.5%) | 174 (10.5%) |
| 15 to 19 Years | 325 (15.4%) | 97 (5.9%) |
| 20 to 24 Years | 86 (4.1%) | 69 (4.2%) |
| 25 to 29 Years | 58 (2.8%) | 207 (12.5%) |
| 30 to 34 Years | 151 (7.2%) | 117 (7.1%) |
| 35 to 39 Years | 61 (2.9%) | 45 (2.7%) |
| 40 to 44 Years | 262 (12.4%) | 106 (6.4%) |
| 45 to 49 Years | 124 (5.9%) | 207 (12.5%) |
| 50 to 54 Years | 202 (9.6%) | 67 (4.1%) |
| 55 to 59 Years | 168 (8.0%) | 107 (6.5%) |
| 60 to 64 Years | 84 (4.0%) | 118 (7.1%) |
| 65 to 69 Years | 87 (4.1%) | 72 (4.4%) |
| 70 to 74 Years | 24 (1.1%) | 96 (5.8%) |
| 75 to 79 Years | 49 (2.3%) | 26 (1.6%) |
| 80 to 84 Years | 25 (1.2%) | 12 (0.7%) |
| 85 Years and over | 36 (1.7%) | 34 (2.1%) |
| Total | 2,110 (100.0%) | 1,653 (100.0%) |
Families and Households in Clearview
Median Family Size in Clearview
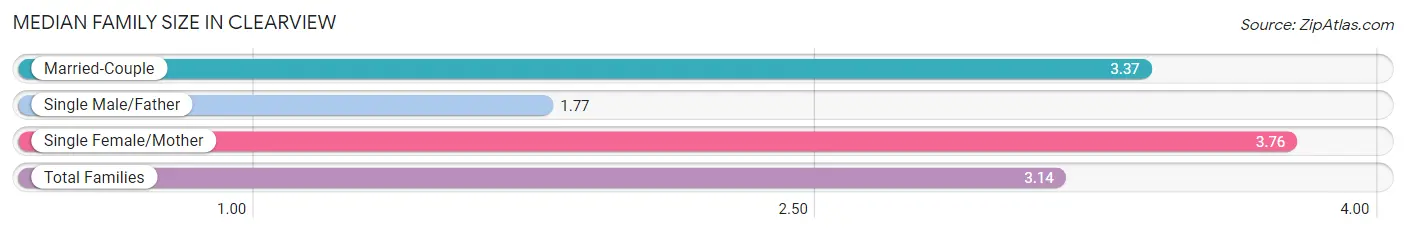
The median family size in Clearview is 3.14 persons per family, with single female/mother families (109 | 10.7%) accounting for the largest median family size of 3.76 persons per family. On the other hand, single male/father families (172 | 16.8%) represent the smallest median family size with 1.77 persons per family.
| Family Type | # Families | Family Size |
| Married-Couple | 741 (72.5%) | 3.37 |
| Single Male/Father | 172 (16.8%) | 1.77 |
| Single Female/Mother | 109 (10.7%) | 3.76 |
| Total Families | 1,022 (100.0%) | 3.14 |
Median Household Size in Clearview
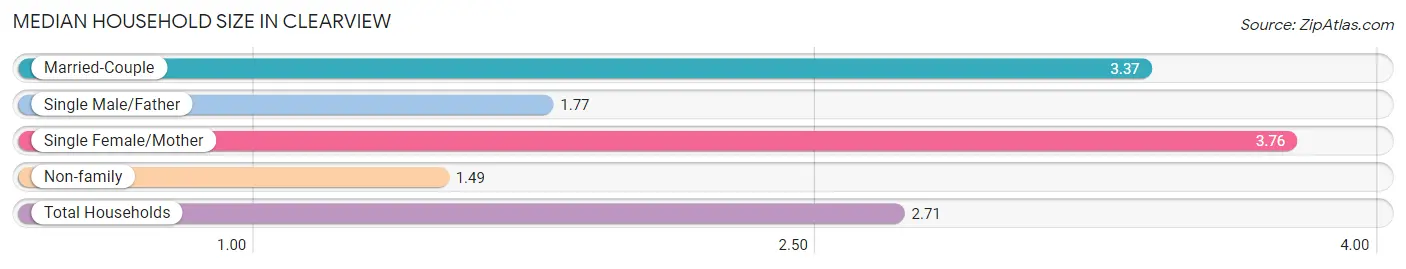
The median household size in Clearview is 2.71 persons per household, with single female/mother households (109 | 7.9%) accounting for the largest median household size of 3.76 persons per household. non-family households (363 | 26.2%) represent the smallest median household size with 1.49 persons per household.
| Household Type | # Households | Household Size |
| Married-Couple | 741 (53.5%) | 3.37 |
| Single Male/Father | 172 (12.4%) | 1.77 |
| Single Female/Mother | 109 (7.9%) | 3.76 |
| Non-family | 363 (26.2%) | 1.49 |
| Total Households | 1,385 (100.0%) | 2.71 |
Household Size by Marriage Status in Clearview
Out of a total of 1,385 households in Clearview, 1,022 (73.8%) are family households, while 363 (26.2%) are nonfamily households. The most numerous type of family households are 2-person households, comprising 488, and the most common type of nonfamily households are 1-person households, comprising 287.
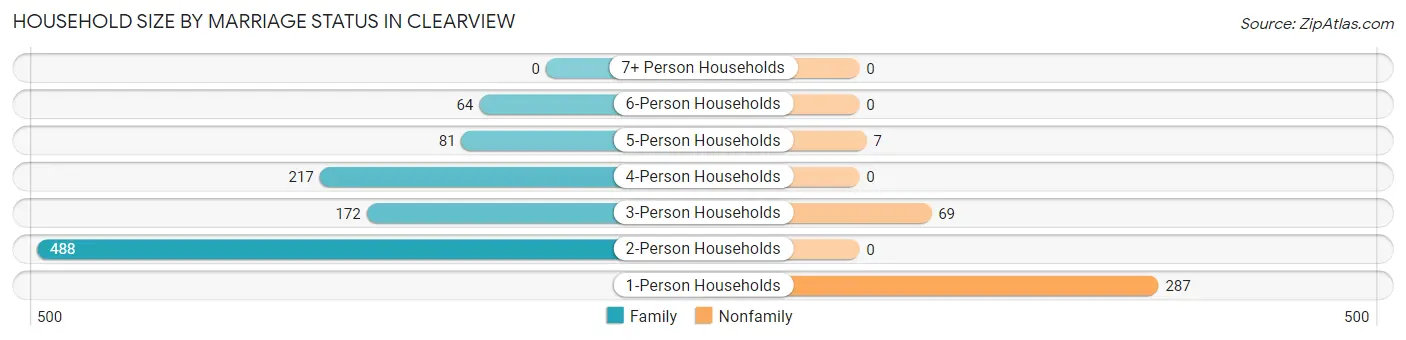
| Household Size | Family Households | Nonfamily Households |
| 1-Person Households | - | 287 (20.7%) |
| 2-Person Households | 488 (35.2%) | 0 (0.0%) |
| 3-Person Households | 172 (12.4%) | 69 (5.0%) |
| 4-Person Households | 217 (15.7%) | 0 (0.0%) |
| 5-Person Households | 81 (5.9%) | 7 (0.5%) |
| 6-Person Households | 64 (4.6%) | 0 (0.0%) |
| 7+ Person Households | 0 (0.0%) | 0 (0.0%) |
| Total | 1,022 (73.8%) | 363 (26.2%) |
Female Fertility in Clearview
Fertility by Age in Clearview
Average fertility rate in Clearview is 44.0 births per 1,000 women. Women in the age bracket of 20 to 34 years have the highest fertility rate with 94.0 births per 1,000 women. Women in the age bracket of 20 to 34 years acount for 100.0% of all women with births.
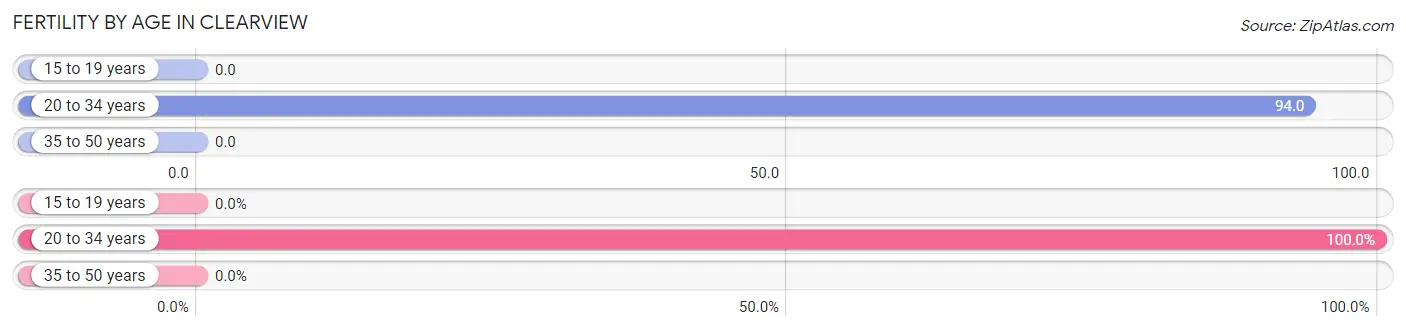
| Age Bracket | Women with Births | Births / 1,000 Women |
| 15 to 19 years | 0 (0.0%) | 0.0 |
| 20 to 34 years | 37 (100.0%) | 94.0 |
| 35 to 50 years | 0 (0.0%) | 0.0 |
| Total | 37 (100.0%) | 44.0 |
Fertility by Age by Marriage Status in Clearview
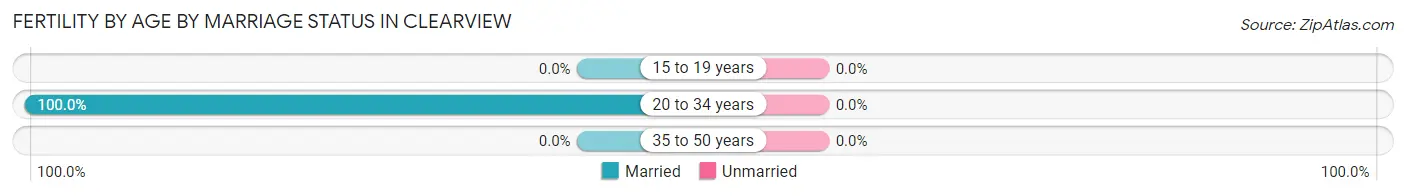
| Age Bracket | Married | Unmarried |
| 15 to 19 years | 0 (0.0%) | 0 (0.0%) |
| 20 to 34 years | 37 (100.0%) | 0 (0.0%) |
| 35 to 50 years | 0 (0.0%) | 0 (0.0%) |
| Total | 37 (100.0%) | 0 (0.0%) |
Fertility by Education in Clearview
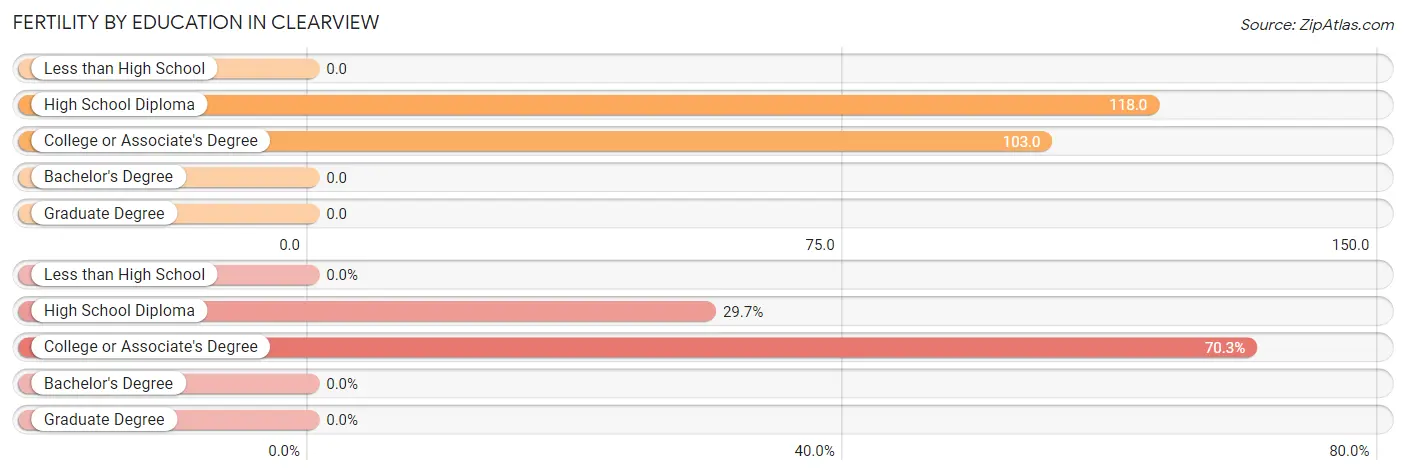
| Educational Attainment | Women with Births | Births / 1,000 Women |
| Less than High School | 0 (0.0%) | 0.0 |
| High School Diploma | 11 (29.7%) | 118.0 |
| College or Associate's Degree | 26 (70.3%) | 103.0 |
| Bachelor's Degree | 0 (0.0%) | 0.0 |
| Graduate Degree | 0 (0.0%) | 0.0 |
| Total | 37 (100.0%) | 44.0 |
Fertility by Education by Marriage Status in Clearview
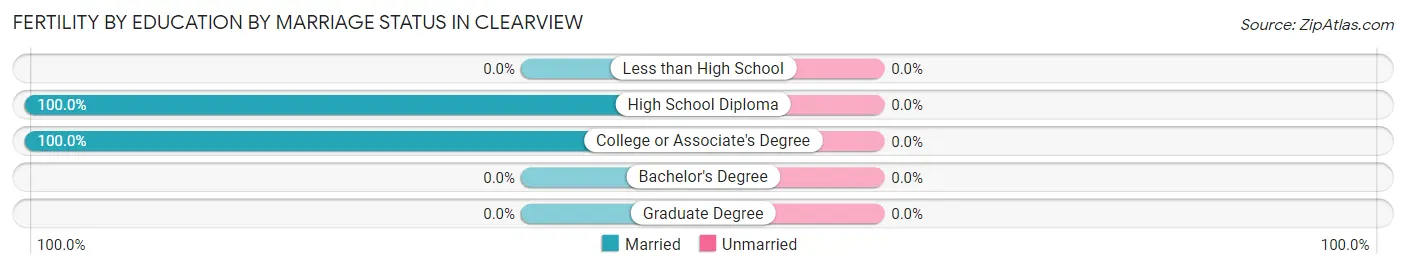
| Educational Attainment | Married | Unmarried |
| Less than High School | 0 (0.0%) | 0 (0.0%) |
| High School Diploma | 11 (100.0%) | 0 (0.0%) |
| College or Associate's Degree | 26 (100.0%) | 0 (0.0%) |
| Bachelor's Degree | 0 (0.0%) | 0 (0.0%) |
| Graduate Degree | 0 (0.0%) | 0 (0.0%) |
| Total | 37 (100.0%) | 0 (0.0%) |
Employment Characteristics in Clearview
Employment by Class of Employer in Clearview
Among the 1,982 employed individuals in Clearview, private company employees (1,584 | 79.9%), self-employed (incorporated) (176 | 8.9%), and self-employed (not incorporated) (91 | 4.6%) make up the most common classes of employment.
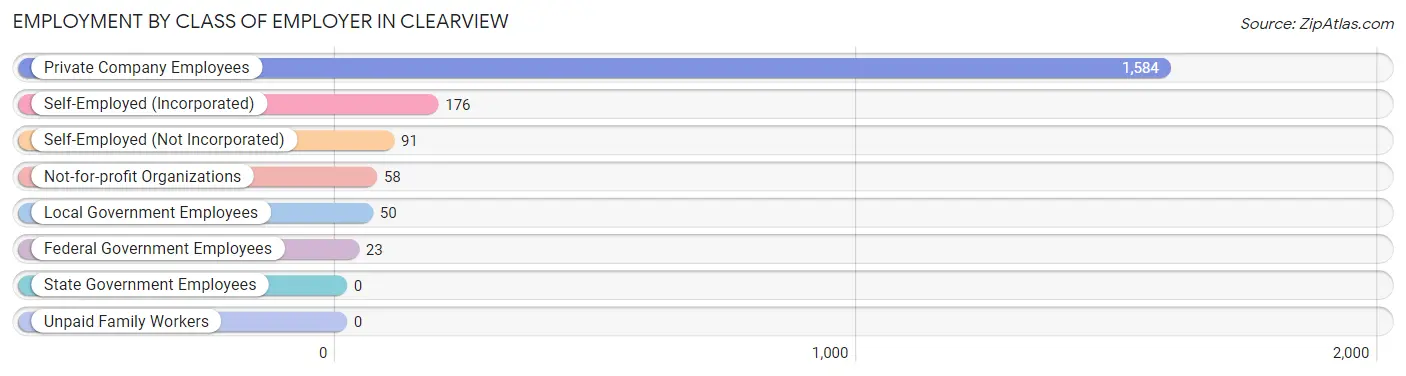
| Employer Class | # Employees | % Employees |
| Private Company Employees | 1,584 | 79.9% |
| Self-Employed (Incorporated) | 176 | 8.9% |
| Self-Employed (Not Incorporated) | 91 | 4.6% |
| Not-for-profit Organizations | 58 | 2.9% |
| Local Government Employees | 50 | 2.5% |
| State Government Employees | 0 | 0.0% |
| Federal Government Employees | 23 | 1.2% |
| Unpaid Family Workers | 0 | 0.0% |
| Total | 1,982 | 100.0% |
Employment Status by Age in Clearview
According to the labor force statistics for Clearview, out of the total population over 16 years of age (3,054), 66.3% or 2,025 individuals are in the labor force, with 2.1% or 43 of them unemployed. The age group with the highest labor force participation rate is 35 to 44 years, with 88.8% or 421 individuals in the labor force. Within the labor force, the 20 to 24 years age range has the highest percentage of unemployed individuals, with 30.8% or 37 of them being unemployed.
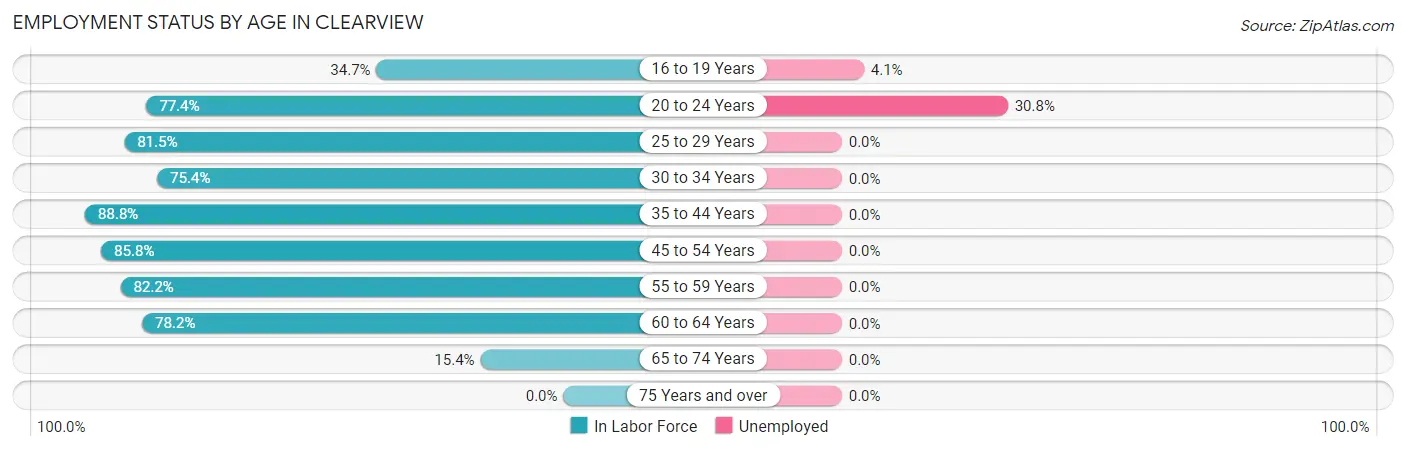
| Age Bracket | In Labor Force | Unemployed |
| 16 to 19 Years | 123 (34.7%) | 5 (4.1%) |
| 20 to 24 Years | 120 (77.4%) | 37 (30.8%) |
| 25 to 29 Years | 216 (81.5%) | 0 (0.0%) |
| 30 to 34 Years | 202 (75.4%) | 0 (0.0%) |
| 35 to 44 Years | 421 (88.8%) | 0 (0.0%) |
| 45 to 54 Years | 515 (85.8%) | 0 (0.0%) |
| 55 to 59 Years | 226 (82.2%) | 0 (0.0%) |
| 60 to 64 Years | 158 (78.2%) | 0 (0.0%) |
| 65 to 74 Years | 43 (15.4%) | 0 (0.0%) |
| 75 Years and over | 0 (0.0%) | 0 (0.0%) |
| Total | 2,025 (66.3%) | 43 (2.1%) |
Employment Status by Educational Attainment in Clearview
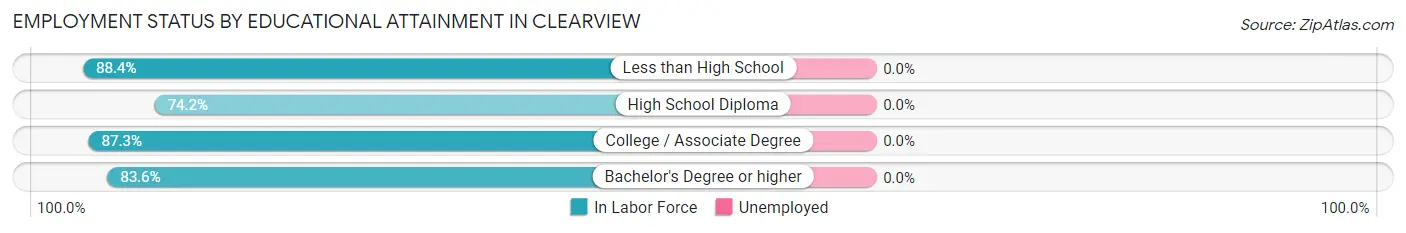
| Educational Attainment | In Labor Force | Unemployed |
| Less than High School | 61 (88.4%) | 0 (0.0%) |
| High School Diploma | 285 (74.2%) | 0 (0.0%) |
| College / Associate Degree | 666 (87.3%) | 0 (0.0%) |
| Bachelor's Degree or higher | 726 (83.6%) | 0 (0.0%) |
| Total | 1,738 (83.4%) | 0 (0.0%) |
Employment Occupations by Sex in Clearview
Management, Business, Science and Arts Occupations
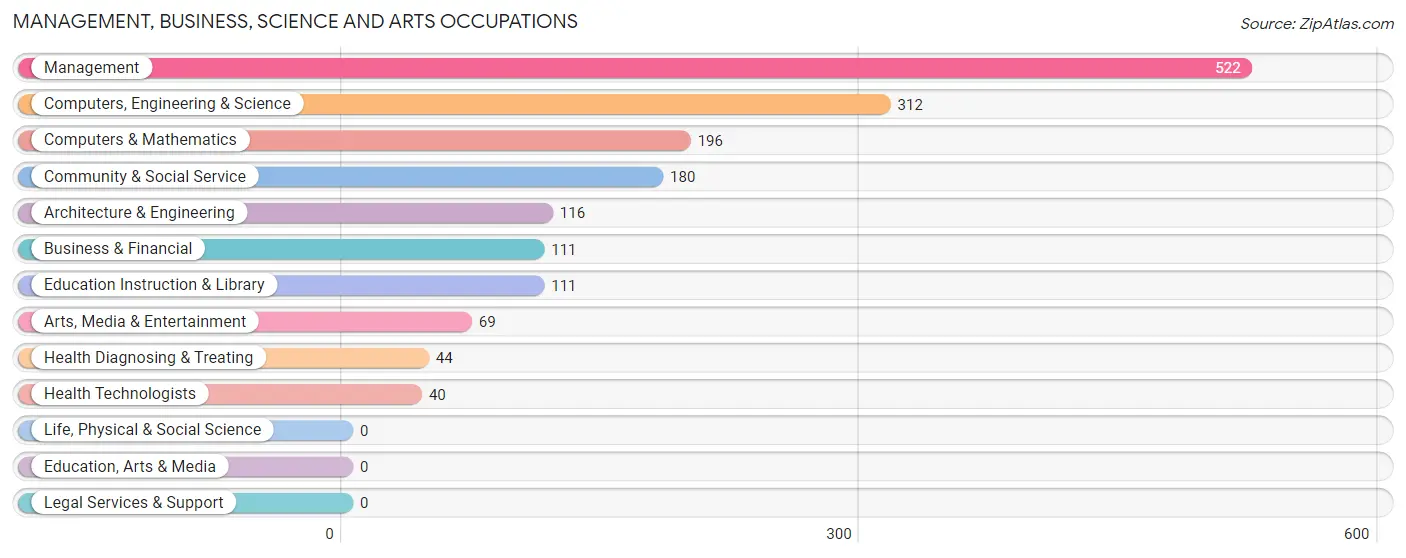
The most common Management, Business, Science and Arts occupations in Clearview are Management (522 | 26.3%), Computers, Engineering & Science (312 | 15.7%), Computers & Mathematics (196 | 9.9%), Community & Social Service (180 | 9.1%), and Architecture & Engineering (116 | 5.9%).
Management, Business, Science and Arts Occupations by Sex
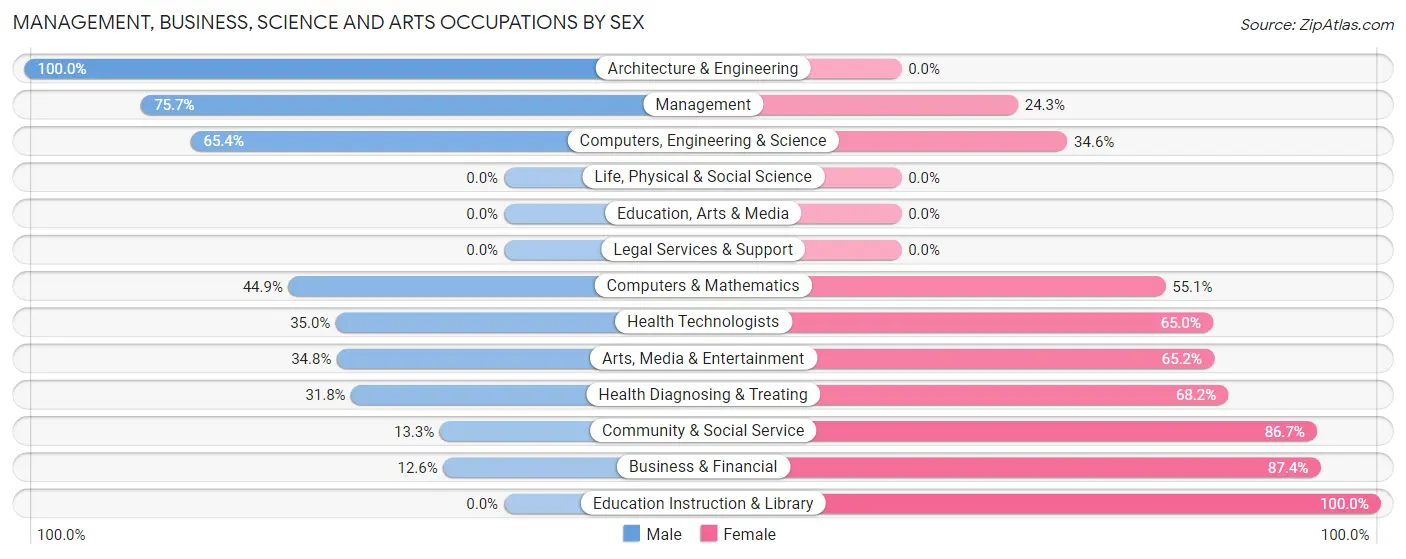
Within the Management, Business, Science and Arts occupations in Clearview, the most male-oriented occupations are Architecture & Engineering (100.0%), Management (75.7%), and Computers, Engineering & Science (65.4%), while the most female-oriented occupations are Education Instruction & Library (100.0%), Business & Financial (87.4%), and Community & Social Service (86.7%).
| Occupation | Male | Female |
| Management | 395 (75.7%) | 127 (24.3%) |
| Business & Financial | 14 (12.6%) | 97 (87.4%) |
| Computers, Engineering & Science | 204 (65.4%) | 108 (34.6%) |
| Computers & Mathematics | 88 (44.9%) | 108 (55.1%) |
| Architecture & Engineering | 116 (100.0%) | 0 (0.0%) |
| Life, Physical & Social Science | 0 (0.0%) | 0 (0.0%) |
| Community & Social Service | 24 (13.3%) | 156 (86.7%) |
| Education, Arts & Media | 0 (0.0%) | 0 (0.0%) |
| Legal Services & Support | 0 (0.0%) | 0 (0.0%) |
| Education Instruction & Library | 0 (0.0%) | 111 (100.0%) |
| Arts, Media & Entertainment | 24 (34.8%) | 45 (65.2%) |
| Health Diagnosing & Treating | 14 (31.8%) | 30 (68.2%) |
| Health Technologists | 14 (35.0%) | 26 (65.0%) |
| Total (Category) | 651 (55.7%) | 518 (44.3%) |
| Total (Overall) | 1,222 (61.7%) | 760 (38.4%) |
Services Occupations
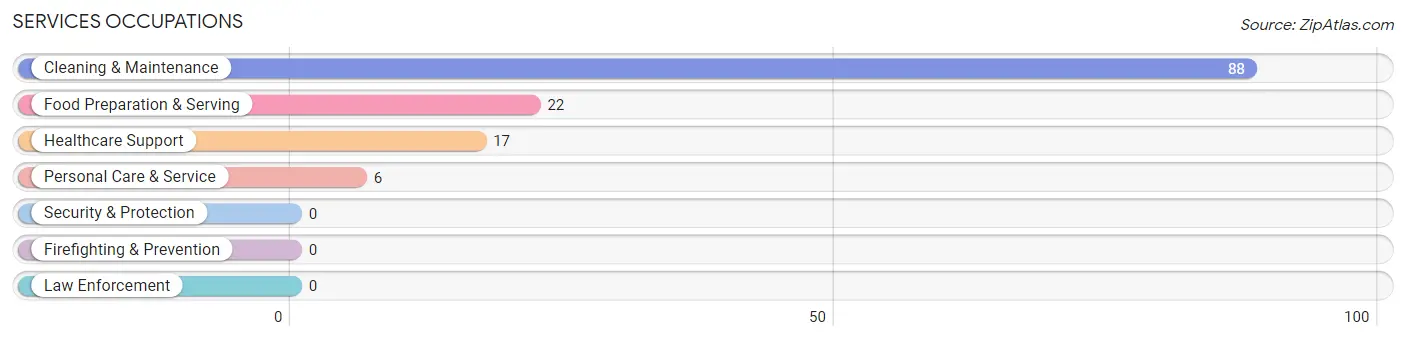
The most common Services occupations in Clearview are Cleaning & Maintenance (88 | 4.4%), Food Preparation & Serving (22 | 1.1%), Healthcare Support (17 | 0.9%), and Personal Care & Service (6 | 0.3%).
Services Occupations by Sex
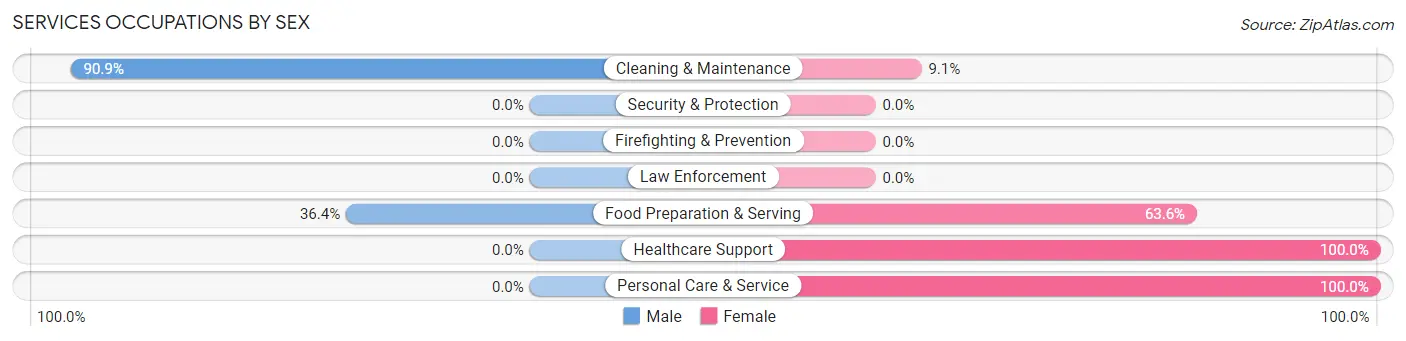
Within the Services occupations in Clearview, the most male-oriented occupations are Cleaning & Maintenance (90.9%), and Food Preparation & Serving (36.4%), while the most female-oriented occupations are Healthcare Support (100.0%), Personal Care & Service (100.0%), and Food Preparation & Serving (63.6%).
| Occupation | Male | Female |
| Healthcare Support | 0 (0.0%) | 17 (100.0%) |
| Security & Protection | 0 (0.0%) | 0 (0.0%) |
| Firefighting & Prevention | 0 (0.0%) | 0 (0.0%) |
| Law Enforcement | 0 (0.0%) | 0 (0.0%) |
| Food Preparation & Serving | 8 (36.4%) | 14 (63.6%) |
| Cleaning & Maintenance | 80 (90.9%) | 8 (9.1%) |
| Personal Care & Service | 0 (0.0%) | 6 (100.0%) |
| Total (Category) | 88 (66.2%) | 45 (33.8%) |
| Total (Overall) | 1,222 (61.7%) | 760 (38.4%) |
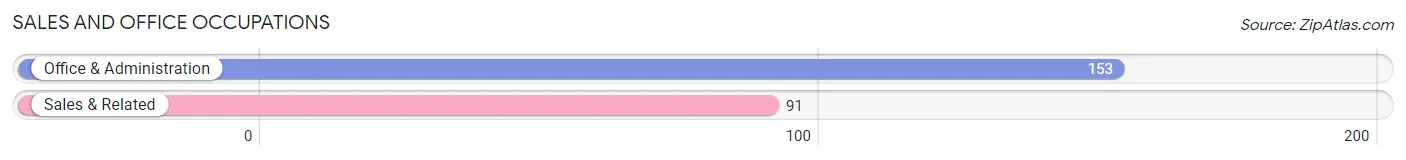
Sales and Office Occupations
The most common Sales and Office occupations in Clearview are Office & Administration (153 | 7.7%), and Sales & Related (91 | 4.6%).
Sales and Office Occupations by Sex
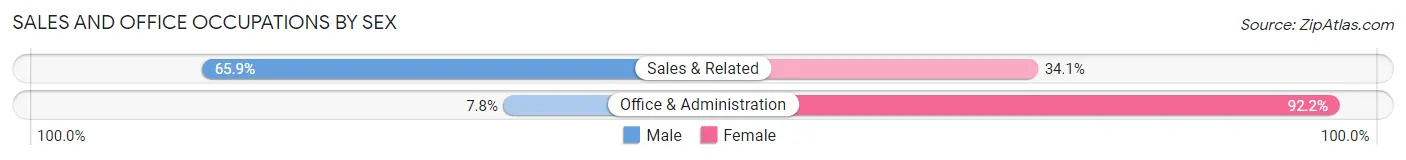
| Occupation | Male | Female |
| Sales & Related | 60 (65.9%) | 31 (34.1%) |
| Office & Administration | 12 (7.8%) | 141 (92.2%) |
| Total (Category) | 72 (29.5%) | 172 (70.5%) |
| Total (Overall) | 1,222 (61.7%) | 760 (38.4%) |
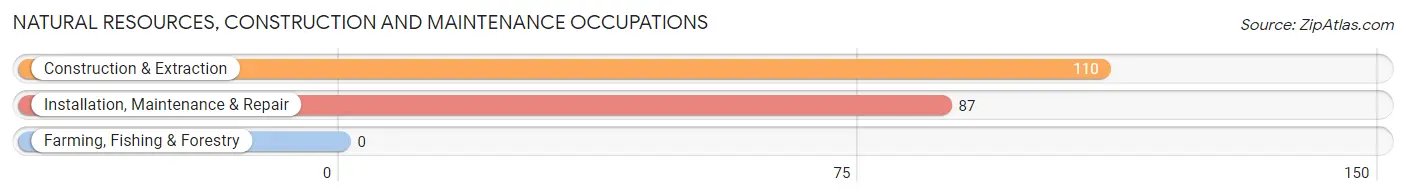
Natural Resources, Construction and Maintenance Occupations
The most common Natural Resources, Construction and Maintenance occupations in Clearview are Construction & Extraction (110 | 5.6%), and Installation, Maintenance & Repair (87 | 4.4%).
Natural Resources, Construction and Maintenance Occupations by Sex
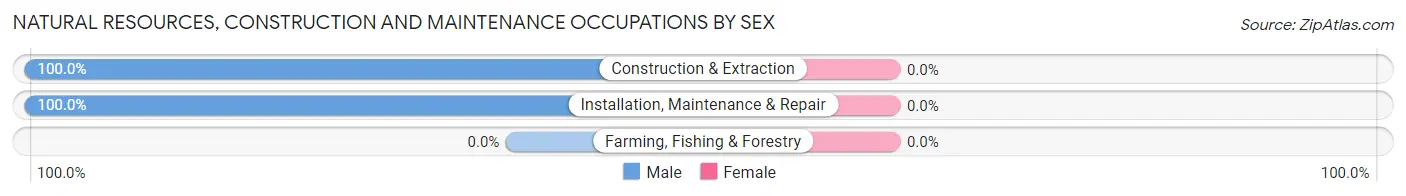
| Occupation | Male | Female |
| Farming, Fishing & Forestry | 0 (0.0%) | 0 (0.0%) |
| Construction & Extraction | 110 (100.0%) | 0 (0.0%) |
| Installation, Maintenance & Repair | 87 (100.0%) | 0 (0.0%) |
| Total (Category) | 197 (100.0%) | 0 (0.0%) |
| Total (Overall) | 1,222 (61.7%) | 760 (38.4%) |
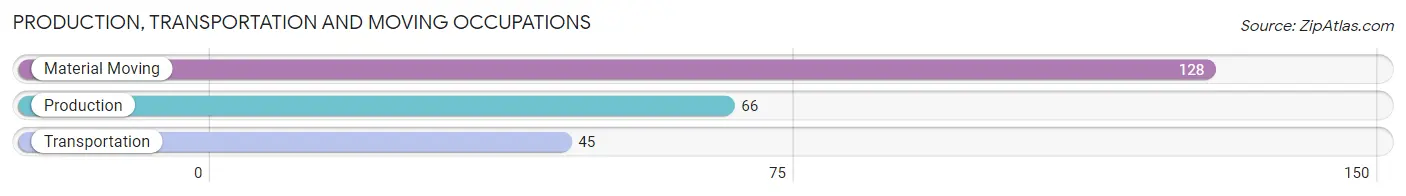
Production, Transportation and Moving Occupations
The most common Production, Transportation and Moving occupations in Clearview are Material Moving (128 | 6.5%), Production (66 | 3.3%), and Transportation (45 | 2.3%).
Production, Transportation and Moving Occupations by Sex
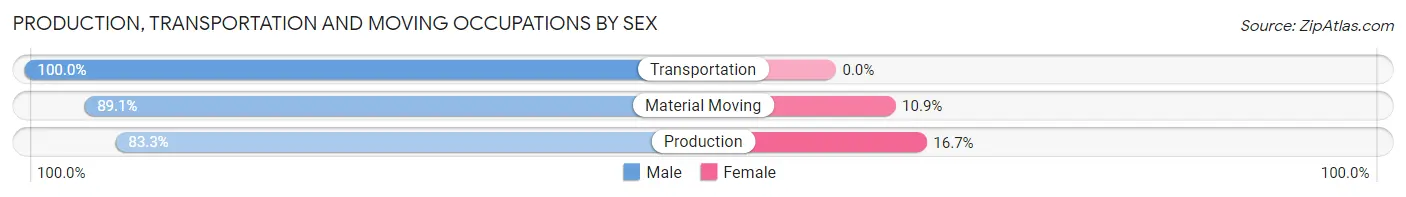
| Occupation | Male | Female |
| Production | 55 (83.3%) | 11 (16.7%) |
| Transportation | 45 (100.0%) | 0 (0.0%) |
| Material Moving | 114 (89.1%) | 14 (10.9%) |
| Total (Category) | 214 (89.5%) | 25 (10.5%) |
| Total (Overall) | 1,222 (61.7%) | 760 (38.4%) |
Employment Industries by Sex in Clearview
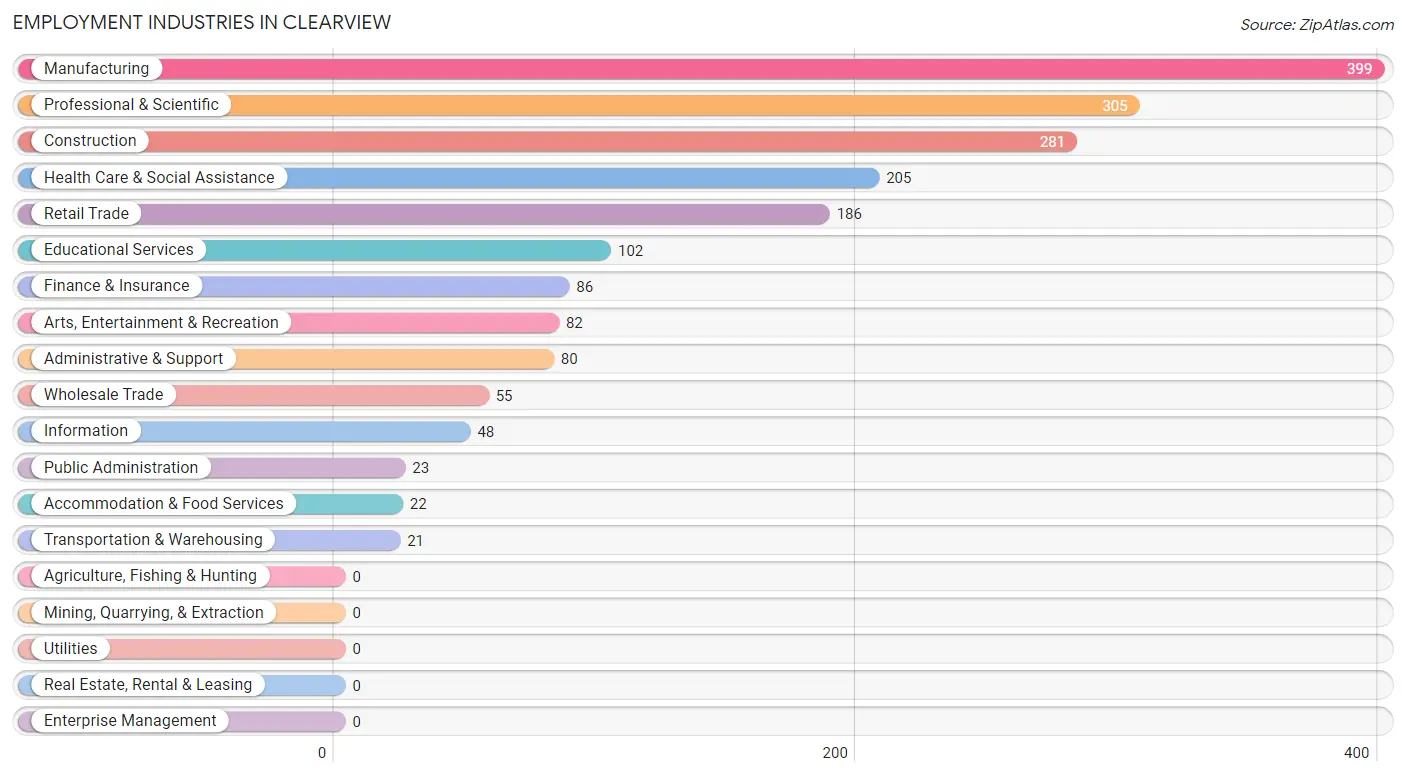
Employment Industries in Clearview
The major employment industries in Clearview include Manufacturing (399 | 20.1%), Professional & Scientific (305 | 15.4%), Construction (281 | 14.2%), Health Care & Social Assistance (205 | 10.3%), and Retail Trade (186 | 9.4%).
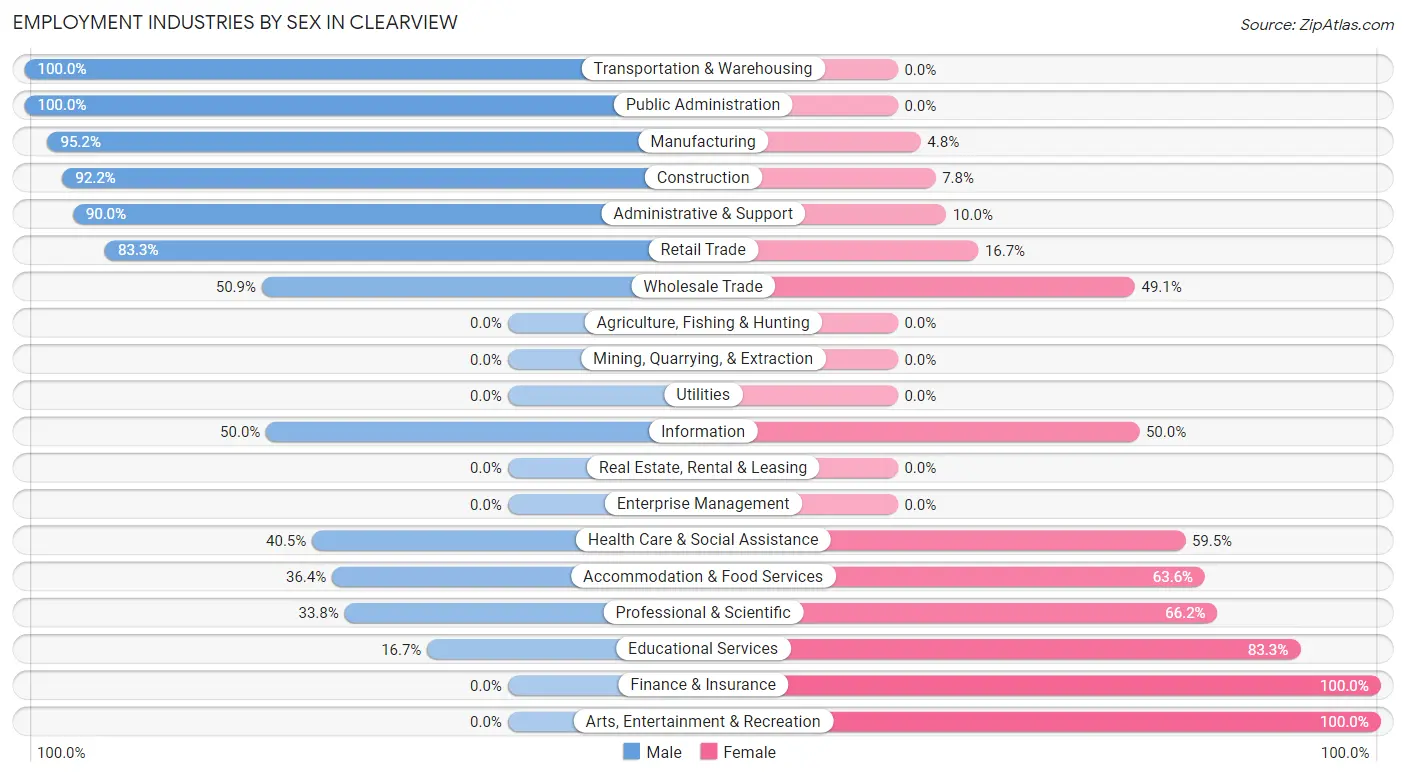
Employment Industries by Sex in Clearview
The Clearview industries that see more men than women are Transportation & Warehousing (100.0%), Public Administration (100.0%), and Manufacturing (95.2%), whereas the industries that tend to have a higher number of women are Finance & Insurance (100.0%), Arts, Entertainment & Recreation (100.0%), and Educational Services (83.3%).
| Industry | Male | Female |
| Agriculture, Fishing & Hunting | 0 (0.0%) | 0 (0.0%) |
| Mining, Quarrying, & Extraction | 0 (0.0%) | 0 (0.0%) |
| Construction | 259 (92.2%) | 22 (7.8%) |
| Manufacturing | 380 (95.2%) | 19 (4.8%) |
| Wholesale Trade | 28 (50.9%) | 27 (49.1%) |
| Retail Trade | 155 (83.3%) | 31 (16.7%) |
| Transportation & Warehousing | 21 (100.0%) | 0 (0.0%) |
| Utilities | 0 (0.0%) | 0 (0.0%) |
| Information | 24 (50.0%) | 24 (50.0%) |
| Finance & Insurance | 0 (0.0%) | 86 (100.0%) |
| Real Estate, Rental & Leasing | 0 (0.0%) | 0 (0.0%) |
| Professional & Scientific | 103 (33.8%) | 202 (66.2%) |
| Enterprise Management | 0 (0.0%) | 0 (0.0%) |
| Administrative & Support | 72 (90.0%) | 8 (10.0%) |
| Educational Services | 17 (16.7%) | 85 (83.3%) |
| Health Care & Social Assistance | 83 (40.5%) | 122 (59.5%) |
| Arts, Entertainment & Recreation | 0 (0.0%) | 82 (100.0%) |
| Accommodation & Food Services | 8 (36.4%) | 14 (63.6%) |
| Public Administration | 23 (100.0%) | 0 (0.0%) |
| Total | 1,222 (61.7%) | 760 (38.4%) |
Education in Clearview
School Enrollment in Clearview
The most common levels of schooling among the 901 students in Clearview are high school (312 | 34.6%), middle school (217 | 24.1%), and elementary school (186 | 20.6%).
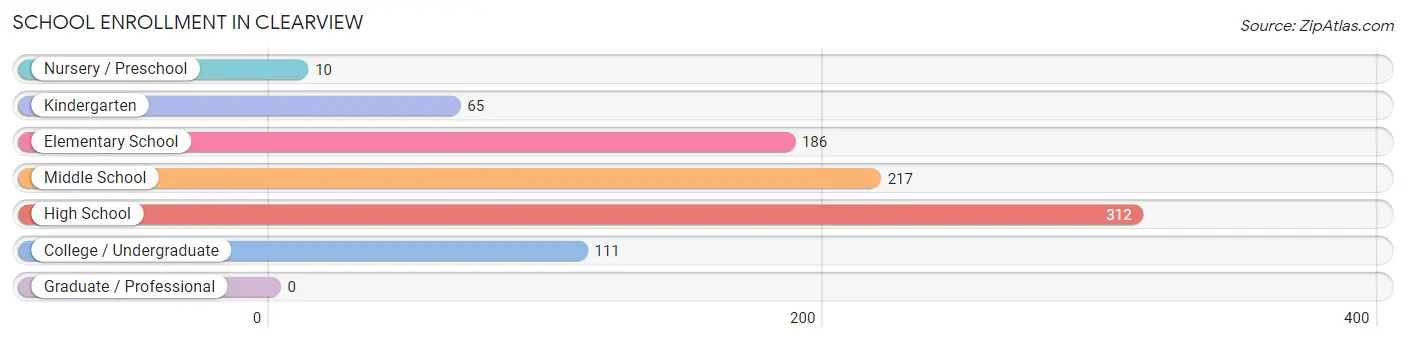
| School Level | # Students | % Students |
| Nursery / Preschool | 10 | 1.1% |
| Kindergarten | 65 | 7.2% |
| Elementary School | 186 | 20.6% |
| Middle School | 217 | 24.1% |
| High School | 312 | 34.6% |
| College / Undergraduate | 111 | 12.3% |
| Graduate / Professional | 0 | 0.0% |
| Total | 901 | 100.0% |
School Enrollment by Age by Funding Source in Clearview
Out of a total of 901 students who are enrolled in schools in Clearview, 177 (19.6%) attend a private institution, while the remaining 724 (80.4%) are enrolled in public schools. The age group of 3 to 4 year olds has the highest likelihood of being enrolled in private schools, with 10 (100.0% in the age bracket) enrolled. Conversely, the age group of 18 to 19 year olds has the lowest likelihood of being enrolled in a private school, with 49 (100.0% in the age bracket) attending a public institution.
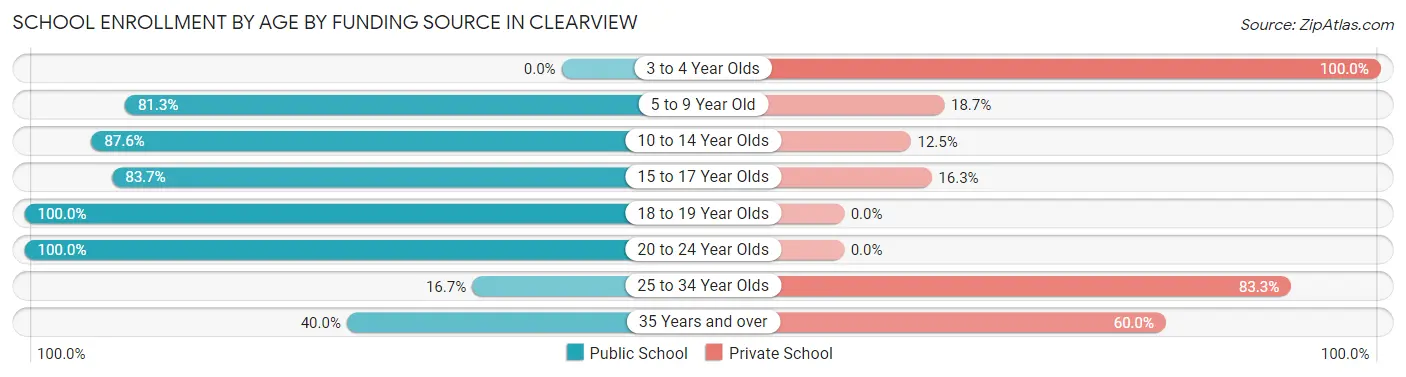
| Age Bracket | Public School | Private School |
| 3 to 4 Year Olds | 0 (0.0%) | 10 (100.0%) |
| 5 to 9 Year Old | 187 (81.3%) | 43 (18.7%) |
| 10 to 14 Year Olds | 218 (87.5%) | 31 (12.4%) |
| 15 to 17 Year Olds | 215 (83.7%) | 42 (16.3%) |
| 18 to 19 Year Olds | 49 (100.0%) | 0 (0.0%) |
| 20 to 24 Year Olds | 35 (100.0%) | 0 (0.0%) |
| 25 to 34 Year Olds | 6 (16.7%) | 30 (83.3%) |
| 35 Years and over | 14 (40.0%) | 21 (60.0%) |
| Total | 724 (80.4%) | 177 (19.6%) |
Educational Attainment by Field of Study in Clearview
Communications (227 | 21.9%), engineering (172 | 16.6%), business (153 | 14.7%), social sciences (143 | 13.8%), and bio, nature & agricultural (112 | 10.8%) are the most common fields of study among 1,037 individuals in Clearview who have obtained a bachelor's degree or higher.
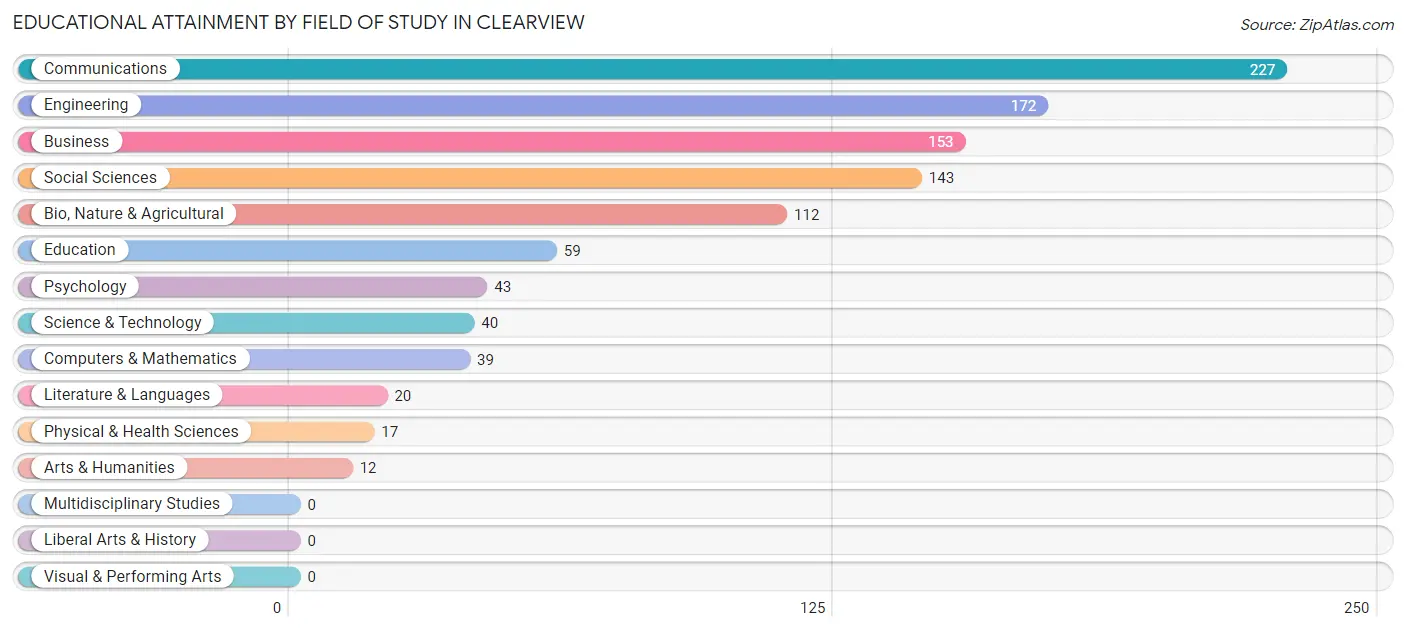
| Field of Study | # Graduates | % Graduates |
| Computers & Mathematics | 39 | 3.8% |
| Bio, Nature & Agricultural | 112 | 10.8% |
| Physical & Health Sciences | 17 | 1.6% |
| Psychology | 43 | 4.2% |
| Social Sciences | 143 | 13.8% |
| Engineering | 172 | 16.6% |
| Multidisciplinary Studies | 0 | 0.0% |
| Science & Technology | 40 | 3.9% |
| Business | 153 | 14.7% |
| Education | 59 | 5.7% |
| Literature & Languages | 20 | 1.9% |
| Liberal Arts & History | 0 | 0.0% |
| Visual & Performing Arts | 0 | 0.0% |
| Communications | 227 | 21.9% |
| Arts & Humanities | 12 | 1.2% |
| Total | 1,037 | 100.0% |
Transportation & Commute in Clearview
Vehicle Availability by Sex in Clearview
The most prevalent vehicle ownership categories in Clearview are males with 3 vehicles (431, accounting for 35.3%) and females with 3 vehicles (418, making up 56.7%).
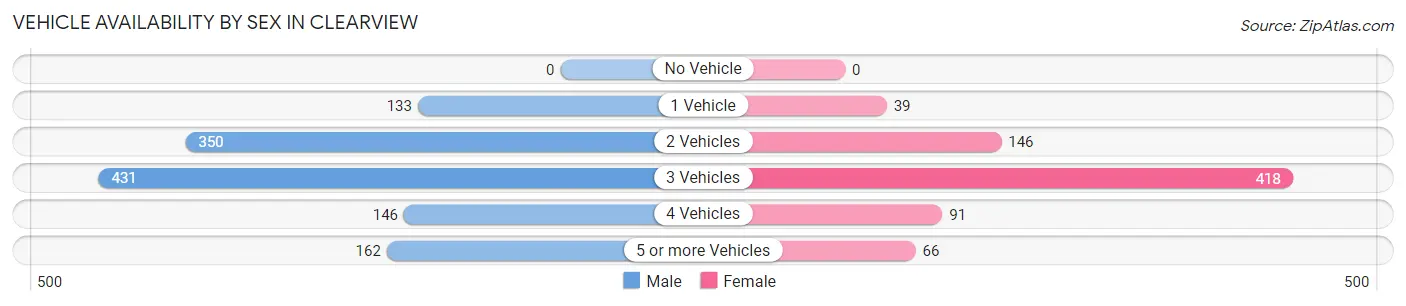
| Vehicles Available | Male | Female |
| No Vehicle | 0 (0.0%) | 0 (0.0%) |
| 1 Vehicle | 133 (10.9%) | 39 (5.1%) |
| 2 Vehicles | 350 (28.6%) | 146 (19.2%) |
| 3 Vehicles | 431 (35.3%) | 418 (55.0%) |
| 4 Vehicles | 146 (11.9%) | 91 (12.0%) |
| 5 or more Vehicles | 162 (13.3%) | 66 (8.7%) |
| Total | 1,222 (100.0%) | 760 (100.0%) |
Commute Time in Clearview
The most frequently occuring commute durations in Clearview are 30 to 34 minutes (477 commuters, 28.1%), 25 to 29 minutes (295 commuters, 17.4%), and 15 to 19 minutes (224 commuters, 13.2%).
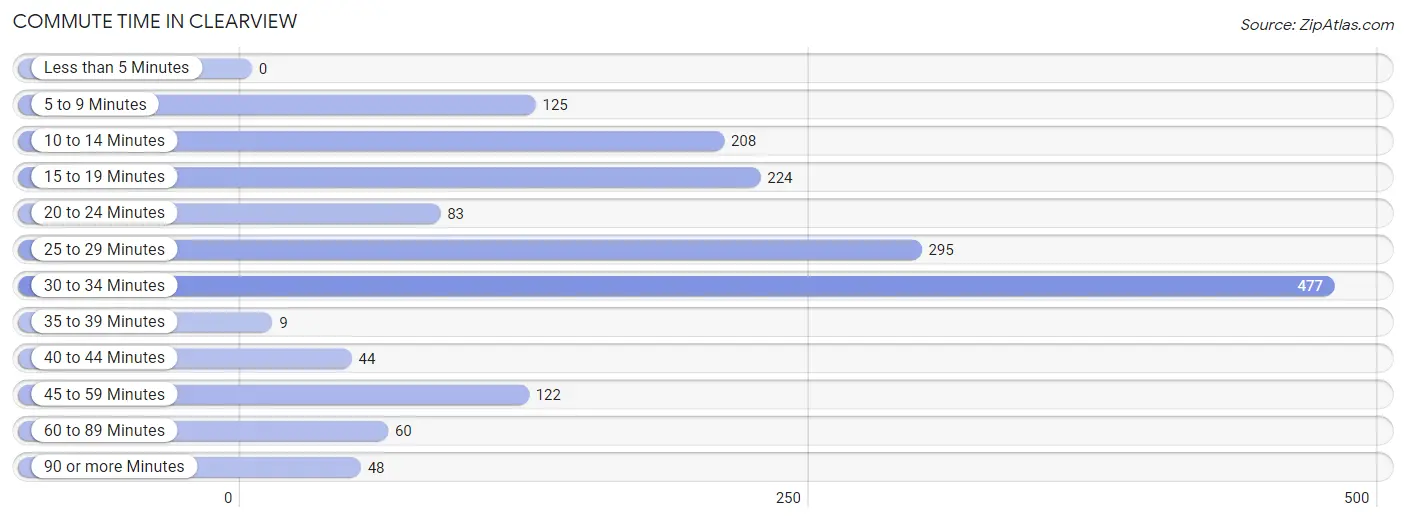
| Commute Time | # Commuters | % Commuters |
| Less than 5 Minutes | 0 | 0.0% |
| 5 to 9 Minutes | 125 | 7.4% |
| 10 to 14 Minutes | 208 | 12.3% |
| 15 to 19 Minutes | 224 | 13.2% |
| 20 to 24 Minutes | 83 | 4.9% |
| 25 to 29 Minutes | 295 | 17.4% |
| 30 to 34 Minutes | 477 | 28.1% |
| 35 to 39 Minutes | 9 | 0.5% |
| 40 to 44 Minutes | 44 | 2.6% |
| 45 to 59 Minutes | 122 | 7.2% |
| 60 to 89 Minutes | 60 | 3.5% |
| 90 or more Minutes | 48 | 2.8% |
Commute Time by Sex in Clearview
The most common commute times in Clearview are 30 to 34 minutes (427 commuters, 38.9%) for males and 25 to 29 minutes (176 commuters, 29.4%) for females.
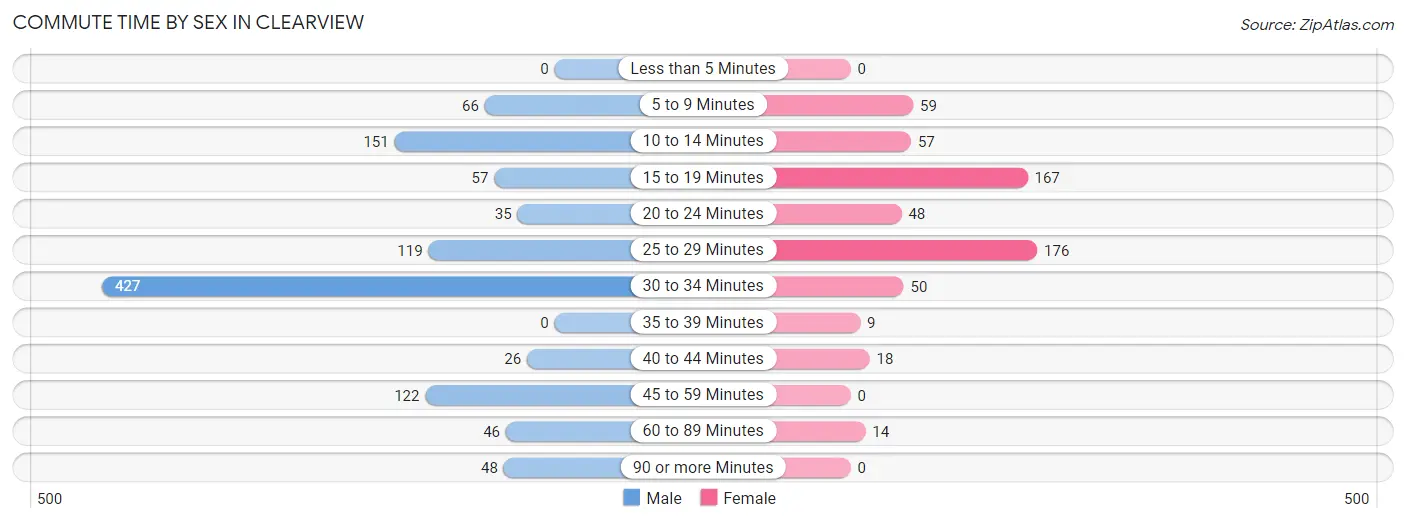
| Commute Time | Male | Female |
| Less than 5 Minutes | 0 (0.0%) | 0 (0.0%) |
| 5 to 9 Minutes | 66 (6.0%) | 59 (9.9%) |
| 10 to 14 Minutes | 151 (13.8%) | 57 (9.5%) |
| 15 to 19 Minutes | 57 (5.2%) | 167 (27.9%) |
| 20 to 24 Minutes | 35 (3.2%) | 48 (8.0%) |
| 25 to 29 Minutes | 119 (10.8%) | 176 (29.4%) |
| 30 to 34 Minutes | 427 (38.9%) | 50 (8.4%) |
| 35 to 39 Minutes | 0 (0.0%) | 9 (1.5%) |
| 40 to 44 Minutes | 26 (2.4%) | 18 (3.0%) |
| 45 to 59 Minutes | 122 (11.1%) | 0 (0.0%) |
| 60 to 89 Minutes | 46 (4.2%) | 14 (2.3%) |
| 90 or more Minutes | 48 (4.4%) | 0 (0.0%) |
Time of Departure to Work by Sex in Clearview
The most frequent times of departure to work in Clearview are 7:00 AM to 7:29 AM (281, 25.6%) for males and 6:30 AM to 6:59 AM (242, 40.5%) for females.
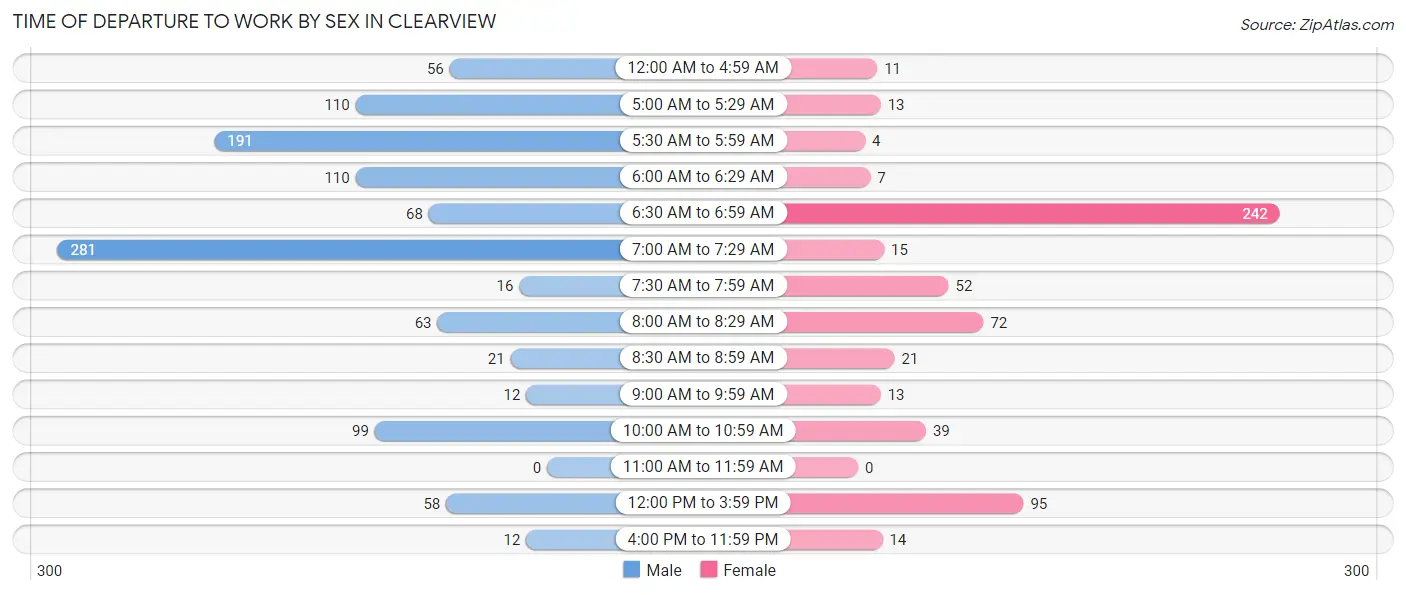
| Time of Departure | Male | Female |
| 12:00 AM to 4:59 AM | 56 (5.1%) | 11 (1.8%) |
| 5:00 AM to 5:29 AM | 110 (10.0%) | 13 (2.2%) |
| 5:30 AM to 5:59 AM | 191 (17.4%) | 4 (0.7%) |
| 6:00 AM to 6:29 AM | 110 (10.0%) | 7 (1.2%) |
| 6:30 AM to 6:59 AM | 68 (6.2%) | 242 (40.5%) |
| 7:00 AM to 7:29 AM | 281 (25.6%) | 15 (2.5%) |
| 7:30 AM to 7:59 AM | 16 (1.5%) | 52 (8.7%) |
| 8:00 AM to 8:29 AM | 63 (5.7%) | 72 (12.0%) |
| 8:30 AM to 8:59 AM | 21 (1.9%) | 21 (3.5%) |
| 9:00 AM to 9:59 AM | 12 (1.1%) | 13 (2.2%) |
| 10:00 AM to 10:59 AM | 99 (9.0%) | 39 (6.5%) |
| 11:00 AM to 11:59 AM | 0 (0.0%) | 0 (0.0%) |
| 12:00 PM to 3:59 PM | 58 (5.3%) | 95 (15.9%) |
| 4:00 PM to 11:59 PM | 12 (1.1%) | 14 (2.3%) |
| Total | 1,097 (100.0%) | 598 (100.0%) |
Housing Occupancy in Clearview
Occupancy by Ownership in Clearview
Of the total 1,385 dwellings in Clearview, owner-occupied units account for 1,137 (82.1%), while renter-occupied units make up 248 (17.9%).
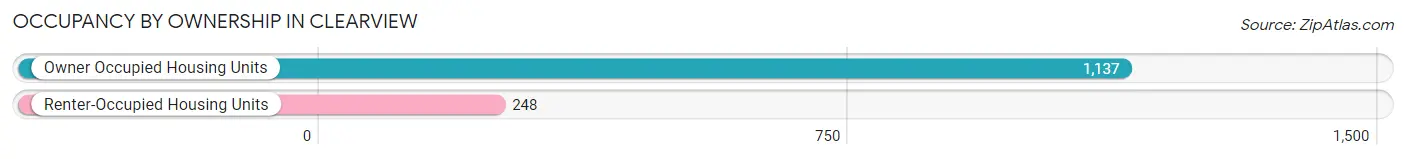
| Occupancy | # Housing Units | % Housing Units |
| Owner Occupied Housing Units | 1,137 | 82.1% |
| Renter-Occupied Housing Units | 248 | 17.9% |
| Total Occupied Housing Units | 1,385 | 100.0% |
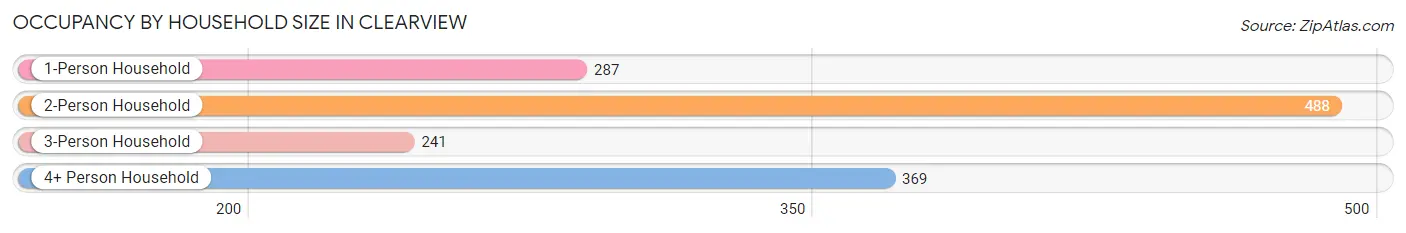
Occupancy by Household Size in Clearview
| Household Size | # Housing Units | % Housing Units |
| 1-Person Household | 287 | 20.7% |
| 2-Person Household | 488 | 35.2% |
| 3-Person Household | 241 | 17.4% |
| 4+ Person Household | 369 | 26.6% |
| Total Housing Units | 1,385 | 100.0% |
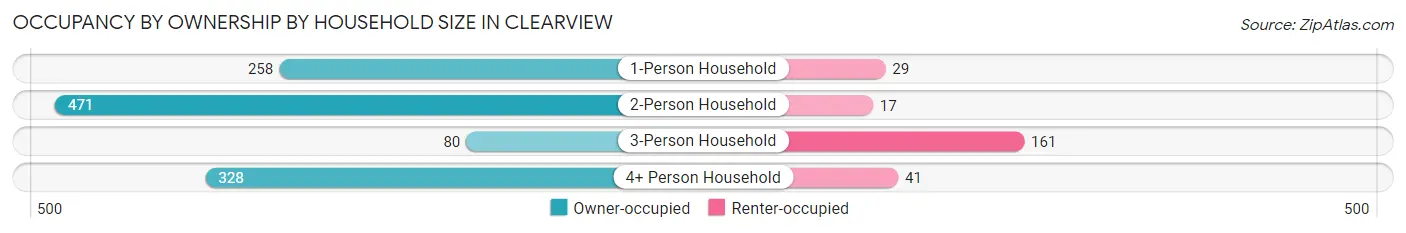
Occupancy by Ownership by Household Size in Clearview
| Household Size | Owner-occupied | Renter-occupied |
| 1-Person Household | 258 (89.9%) | 29 (10.1%) |
| 2-Person Household | 471 (96.5%) | 17 (3.5%) |
| 3-Person Household | 80 (33.2%) | 161 (66.8%) |
| 4+ Person Household | 328 (88.9%) | 41 (11.1%) |
| Total Housing Units | 1,137 (82.1%) | 248 (17.9%) |
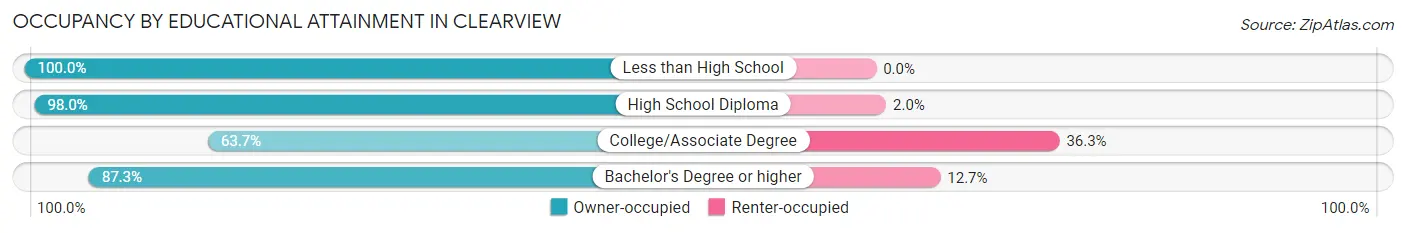
Occupancy by Educational Attainment in Clearview
| Household Size | Owner-occupied | Renter-occupied |
| Less than High School | 61 (100.0%) | 0 (0.0%) |
| High School Diploma | 300 (98.0%) | 6 (2.0%) |
| College/Associate Degree | 303 (63.7%) | 173 (36.3%) |
| Bachelor's Degree or higher | 473 (87.3%) | 69 (12.7%) |
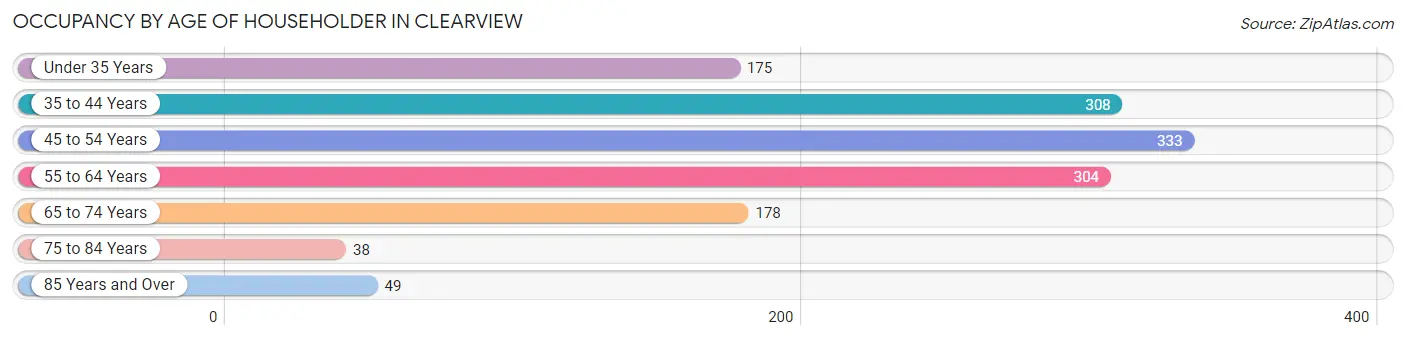
Occupancy by Age of Householder in Clearview
| Age Bracket | # Households | % Households |
| Under 35 Years | 175 | 12.6% |
| 35 to 44 Years | 308 | 22.2% |
| 45 to 54 Years | 333 | 24.0% |
| 55 to 64 Years | 304 | 22.0% |
| 65 to 74 Years | 178 | 12.9% |
| 75 to 84 Years | 38 | 2.7% |
| 85 Years and Over | 49 | 3.5% |
| Total | 1,385 | 100.0% |
Housing Finances in Clearview
Median Income by Occupancy in Clearview
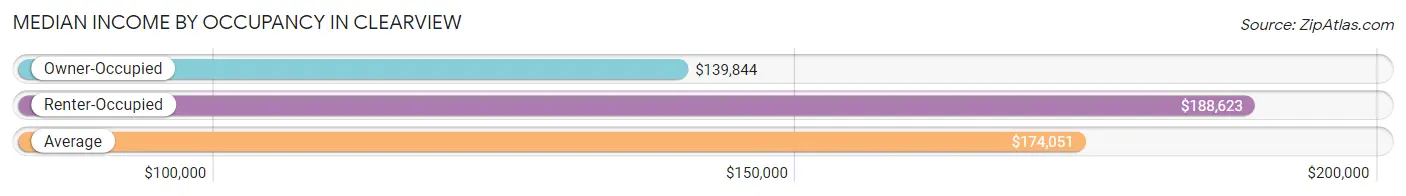
| Occupancy Type | # Households | Median Income |
| Owner-Occupied | 1,137 (82.1%) | $139,844 |
| Renter-Occupied | 248 (17.9%) | $188,623 |
| Average | 1,385 (100.0%) | $174,051 |
Occupancy by Householder Income Bracket in Clearview
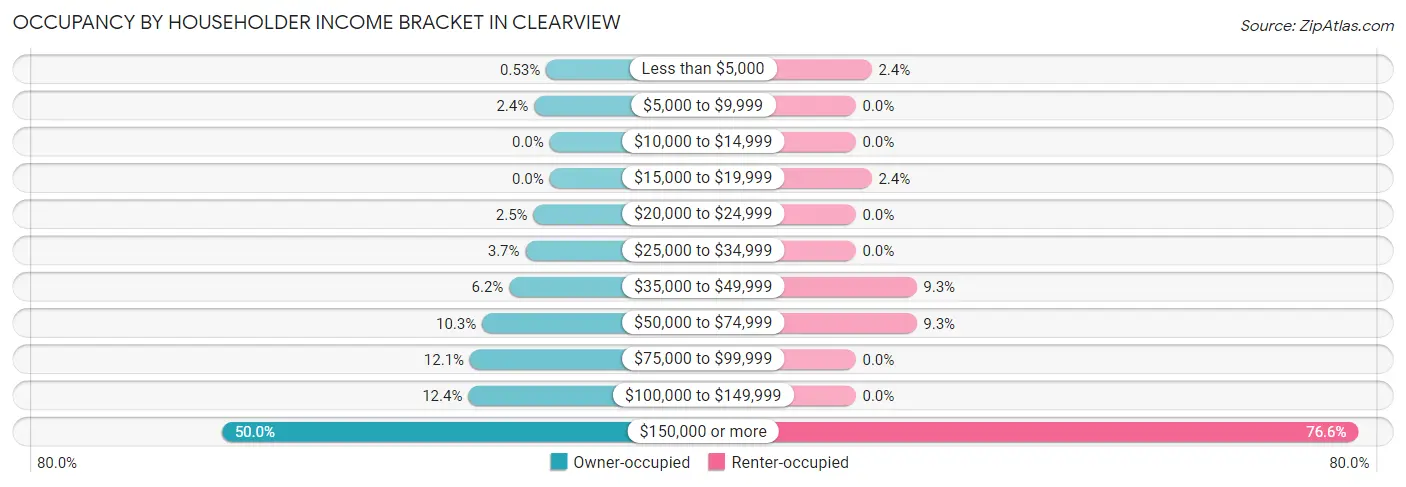
| Income Bracket | Owner-occupied | Renter-occupied |
| Less than $5,000 | 6 (0.5%) | 6 (2.4%) |
| $5,000 to $9,999 | 27 (2.4%) | 0 (0.0%) |
| $10,000 to $14,999 | 0 (0.0%) | 0 (0.0%) |
| $15,000 to $19,999 | 0 (0.0%) | 6 (2.4%) |
| $20,000 to $24,999 | 28 (2.5%) | 0 (0.0%) |
| $25,000 to $34,999 | 42 (3.7%) | 0 (0.0%) |
| $35,000 to $49,999 | 70 (6.2%) | 23 (9.3%) |
| $50,000 to $74,999 | 117 (10.3%) | 23 (9.3%) |
| $75,000 to $99,999 | 138 (12.1%) | 0 (0.0%) |
| $100,000 to $149,999 | 141 (12.4%) | 0 (0.0%) |
| $150,000 or more | 568 (50.0%) | 190 (76.6%) |
| Total | 1,137 (100.0%) | 248 (100.0%) |
Monthly Housing Cost Tiers in Clearview
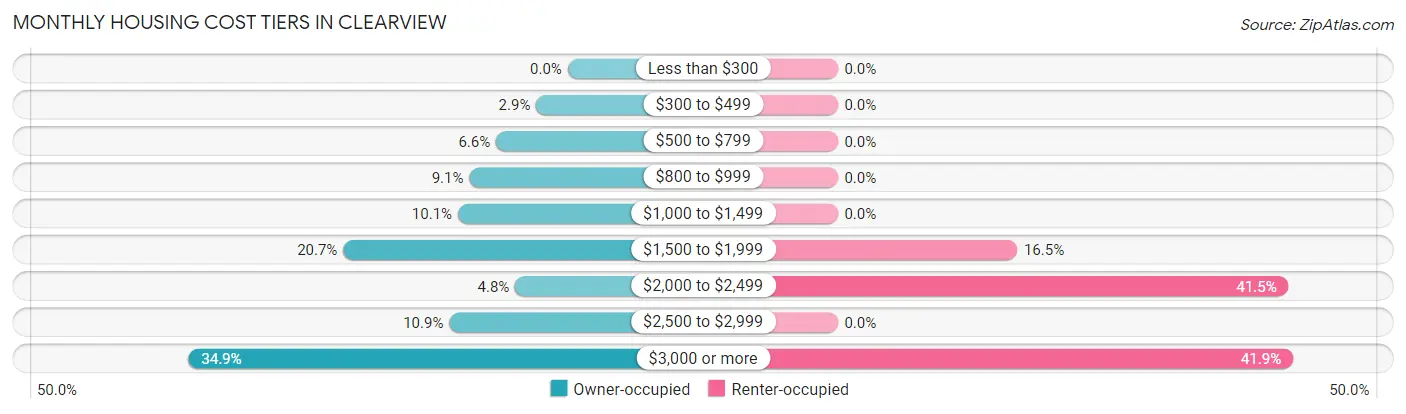
| Monthly Cost | Owner-occupied | Renter-occupied |
| Less than $300 | 0 (0.0%) | 0 (0.0%) |
| $300 to $499 | 33 (2.9%) | 0 (0.0%) |
| $500 to $799 | 75 (6.6%) | 0 (0.0%) |
| $800 to $999 | 103 (9.1%) | 0 (0.0%) |
| $1,000 to $1,499 | 115 (10.1%) | 0 (0.0%) |
| $1,500 to $1,999 | 235 (20.7%) | 41 (16.5%) |
| $2,000 to $2,499 | 55 (4.8%) | 103 (41.5%) |
| $2,500 to $2,999 | 124 (10.9%) | 0 (0.0%) |
| $3,000 or more | 397 (34.9%) | 104 (41.9%) |
| Total | 1,137 (100.0%) | 248 (100.0%) |
Physical Housing Characteristics in Clearview
Housing Structures in Clearview
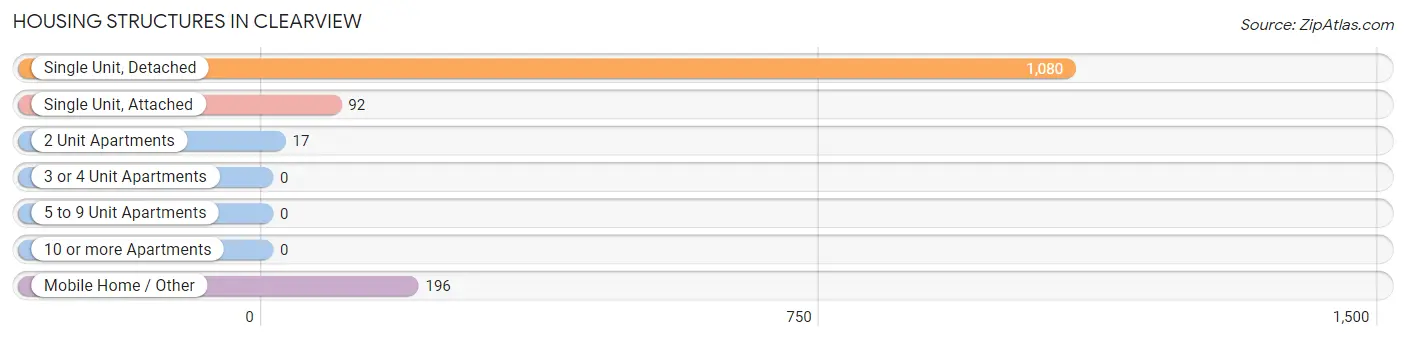
| Structure Type | # Housing Units | % Housing Units |
| Single Unit, Detached | 1,080 | 78.0% |
| Single Unit, Attached | 92 | 6.6% |
| 2 Unit Apartments | 17 | 1.2% |
| 3 or 4 Unit Apartments | 0 | 0.0% |
| 5 to 9 Unit Apartments | 0 | 0.0% |
| 10 or more Apartments | 0 | 0.0% |
| Mobile Home / Other | 196 | 14.1% |
| Total | 1,385 | 100.0% |
Housing Structures by Occupancy in Clearview
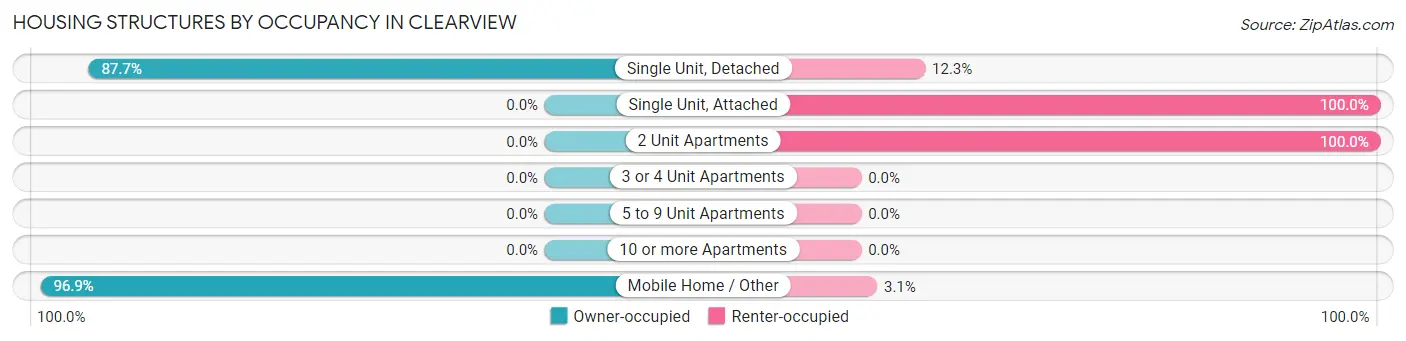
| Structure Type | Owner-occupied | Renter-occupied |
| Single Unit, Detached | 947 (87.7%) | 133 (12.3%) |
| Single Unit, Attached | 0 (0.0%) | 92 (100.0%) |
| 2 Unit Apartments | 0 (0.0%) | 17 (100.0%) |
| 3 or 4 Unit Apartments | 0 (0.0%) | 0 (0.0%) |
| 5 to 9 Unit Apartments | 0 (0.0%) | 0 (0.0%) |
| 10 or more Apartments | 0 (0.0%) | 0 (0.0%) |
| Mobile Home / Other | 190 (96.9%) | 6 (3.1%) |
| Total | 1,137 (82.1%) | 248 (17.9%) |
Housing Structures by Number of Rooms in Clearview
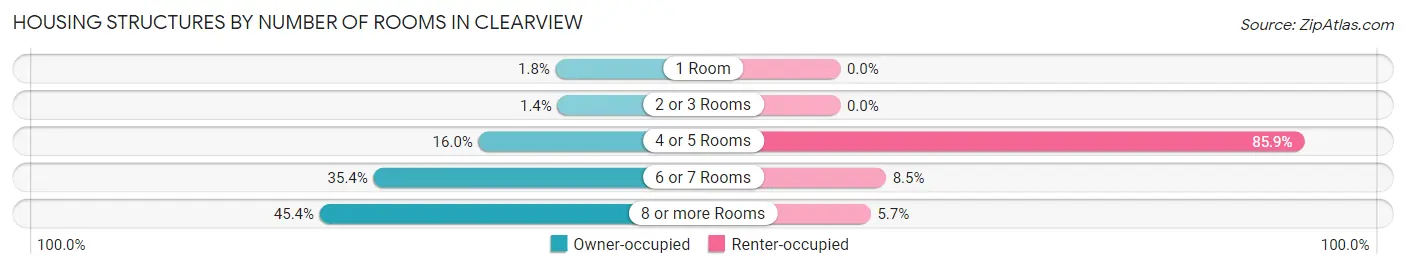
| Number of Rooms | Owner-occupied | Renter-occupied |
| 1 Room | 20 (1.8%) | 0 (0.0%) |
| 2 or 3 Rooms | 16 (1.4%) | 0 (0.0%) |
| 4 or 5 Rooms | 182 (16.0%) | 213 (85.9%) |
| 6 or 7 Rooms | 403 (35.4%) | 21 (8.5%) |
| 8 or more Rooms | 516 (45.4%) | 14 (5.7%) |
| Total | 1,137 (100.0%) | 248 (100.0%) |
Housing Structure by Heating Type in Clearview
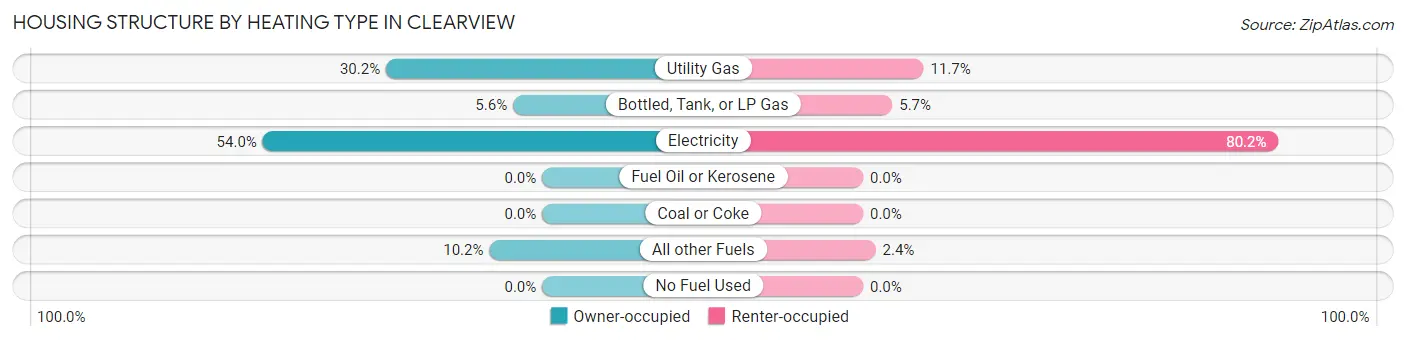
| Heating Type | Owner-occupied | Renter-occupied |
| Utility Gas | 343 (30.2%) | 29 (11.7%) |
| Bottled, Tank, or LP Gas | 64 (5.6%) | 14 (5.7%) |
| Electricity | 614 (54.0%) | 199 (80.2%) |
| Fuel Oil or Kerosene | 0 (0.0%) | 0 (0.0%) |
| Coal or Coke | 0 (0.0%) | 0 (0.0%) |
| All other Fuels | 116 (10.2%) | 6 (2.4%) |
| No Fuel Used | 0 (0.0%) | 0 (0.0%) |
| Total | 1,137 (100.0%) | 248 (100.0%) |
Household Vehicle Usage in Clearview
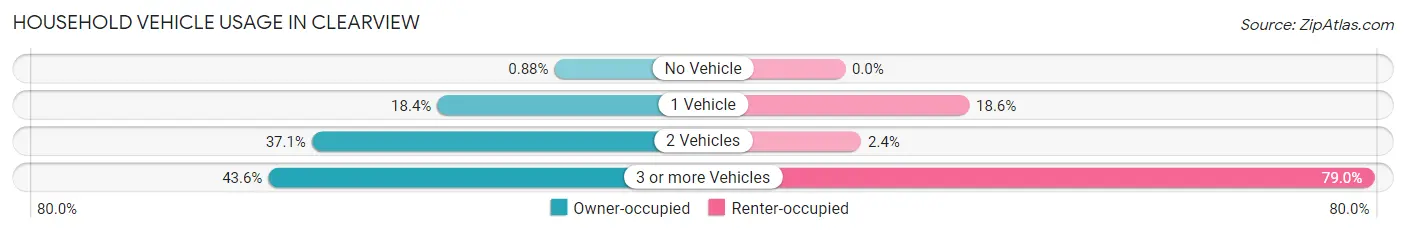
| Vehicles per Household | Owner-occupied | Renter-occupied |
| No Vehicle | 10 (0.9%) | 0 (0.0%) |
| 1 Vehicle | 209 (18.4%) | 46 (18.5%) |
| 2 Vehicles | 422 (37.1%) | 6 (2.4%) |
| 3 or more Vehicles | 496 (43.6%) | 196 (79.0%) |
| Total | 1,137 (100.0%) | 248 (100.0%) |
Real Estate & Mortgages in Clearview
Real Estate and Mortgage Overview in Clearview
| Characteristic | Without Mortgage | With Mortgage |
| Housing Units | 414 | 723 |
| Median Property Value | $672,400 | $846,100 |
| Median Household Income | - | - |
| Monthly Housing Costs | $1,106 | $397 |
| Real Estate Taxes | - | - |
Property Value by Mortgage Status in Clearview
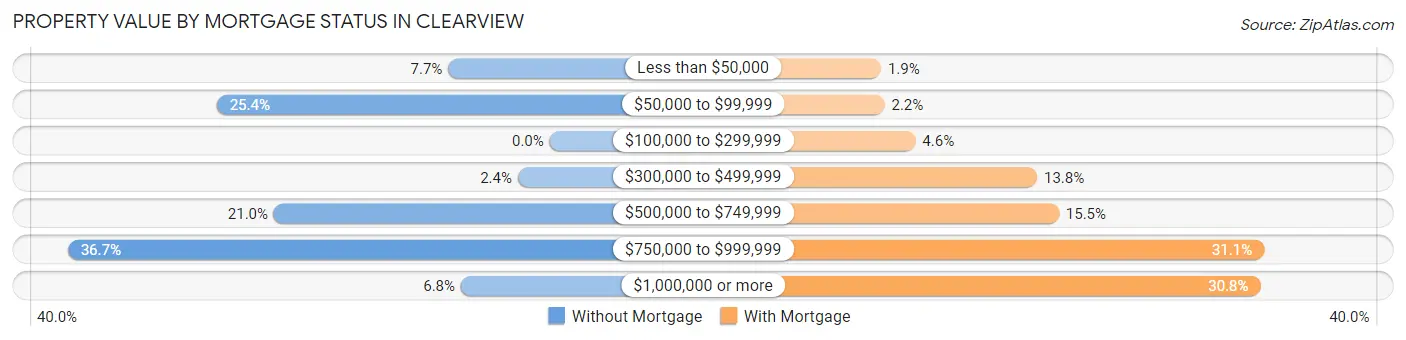
| Property Value | Without Mortgage | With Mortgage |
| Less than $50,000 | 32 (7.7%) | 14 (1.9%) |
| $50,000 to $99,999 | 105 (25.4%) | 16 (2.2%) |
| $100,000 to $299,999 | 0 (0.0%) | 33 (4.6%) |
| $300,000 to $499,999 | 10 (2.4%) | 100 (13.8%) |
| $500,000 to $749,999 | 87 (21.0%) | 112 (15.5%) |
| $750,000 to $999,999 | 152 (36.7%) | 225 (31.1%) |
| $1,000,000 or more | 28 (6.8%) | 223 (30.8%) |
| Total | 414 (100.0%) | 723 (100.0%) |
Household Income by Mortgage Status in Clearview
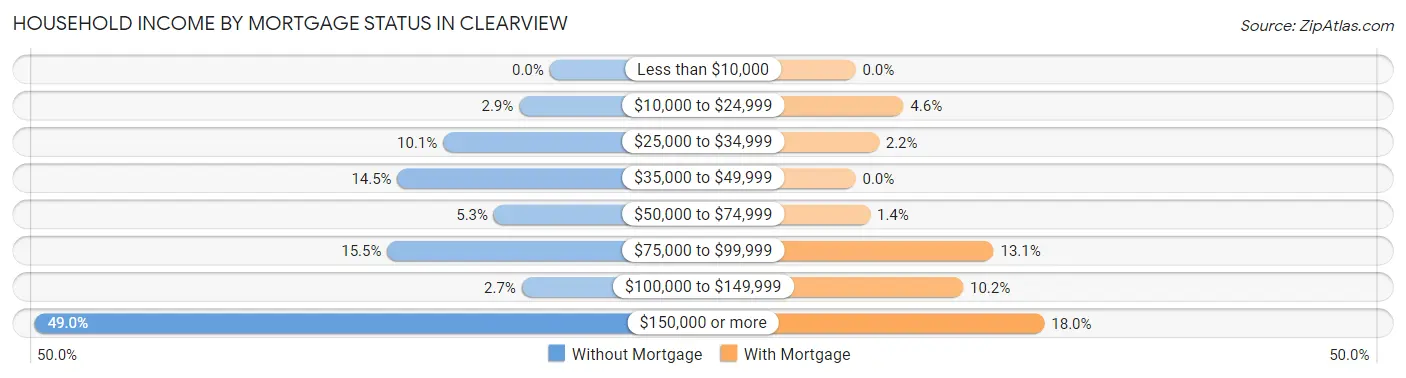
| Household Income | Without Mortgage | With Mortgage |
| Less than $10,000 | 0 (0.0%) | 0 (0.0%) |
| $10,000 to $24,999 | 12 (2.9%) | 33 (4.6%) |
| $25,000 to $34,999 | 42 (10.1%) | 16 (2.2%) |
| $35,000 to $49,999 | 60 (14.5%) | 0 (0.0%) |
| $50,000 to $74,999 | 22 (5.3%) | 10 (1.4%) |
| $75,000 to $99,999 | 64 (15.5%) | 95 (13.1%) |
| $100,000 to $149,999 | 11 (2.7%) | 74 (10.2%) |
| $150,000 or more | 203 (49.0%) | 130 (18.0%) |
| Total | 414 (100.0%) | 723 (100.0%) |
Property Value to Household Income Ratio in Clearview
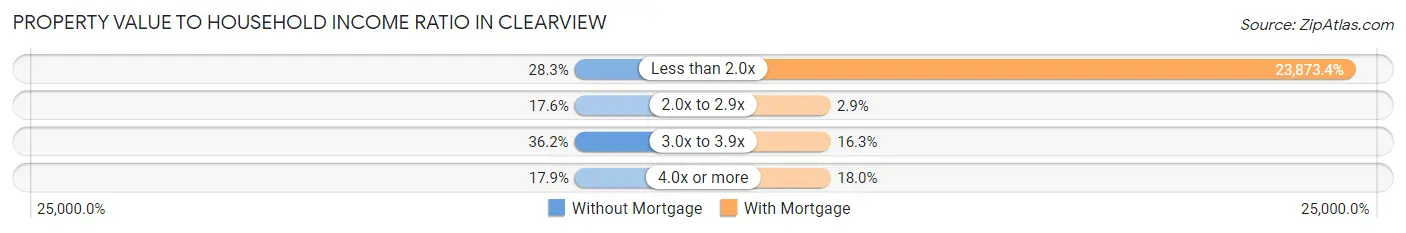
| Value-to-Income Ratio | Without Mortgage | With Mortgage |
| Less than 2.0x | 117 (28.3%) | 172,605 (23,873.4%) |
| 2.0x to 2.9x | 73 (17.6%) | 21 (2.9%) |
| 3.0x to 3.9x | 150 (36.2%) | 118 (16.3%) |
| 4.0x or more | 74 (17.9%) | 130 (18.0%) |
| Total | 414 (100.0%) | 723 (100.0%) |
Real Estate Taxes by Mortgage Status in Clearview
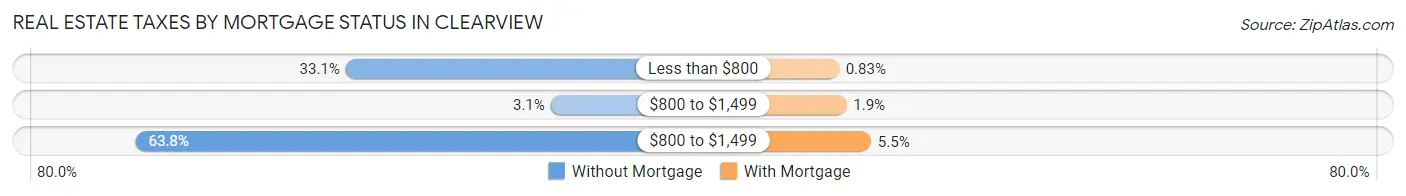
| Property Taxes | Without Mortgage | With Mortgage |
| Less than $800 | 137 (33.1%) | 6 (0.8%) |
| $800 to $1,499 | 13 (3.1%) | 14 (1.9%) |
| $800 to $1,499 | 264 (63.8%) | 40 (5.5%) |
| Total | 414 (100.0%) | 723 (100.0%) |
Health & Disability in Clearview
Health Insurance Coverage by Age in Clearview
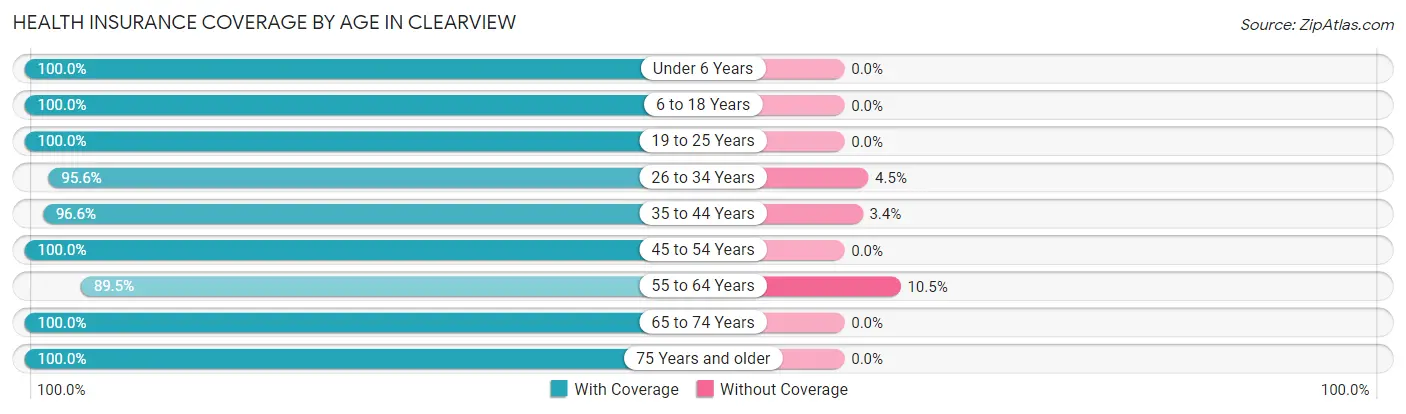
| Age Bracket | With Coverage | Without Coverage |
| Under 6 Years | 180 (100.0%) | 0 (0.0%) |
| 6 to 18 Years | 749 (100.0%) | 0 (0.0%) |
| 19 to 25 Years | 394 (100.0%) | 0 (0.0%) |
| 26 to 34 Years | 408 (95.6%) | 19 (4.4%) |
| 35 to 44 Years | 458 (96.6%) | 16 (3.4%) |
| 45 to 54 Years | 600 (100.0%) | 0 (0.0%) |
| 55 to 64 Years | 427 (89.5%) | 50 (10.5%) |
| 65 to 74 Years | 279 (100.0%) | 0 (0.0%) |
| 75 Years and older | 182 (100.0%) | 0 (0.0%) |
| Total | 3,677 (97.7%) | 85 (2.3%) |
Health Insurance Coverage by Citizenship Status in Clearview
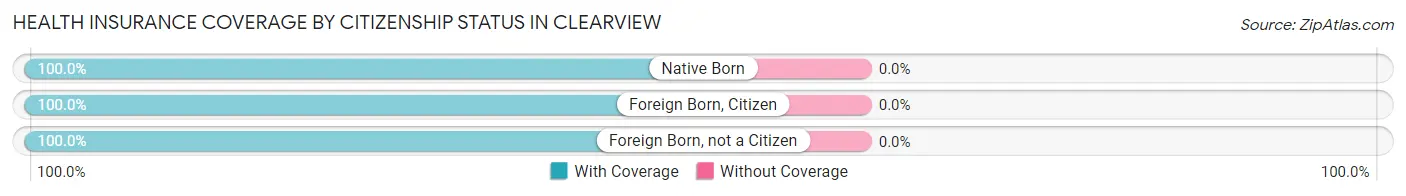
| Citizenship Status | With Coverage | Without Coverage |
| Native Born | 180 (100.0%) | 0 (0.0%) |
| Foreign Born, Citizen | 749 (100.0%) | 0 (0.0%) |
| Foreign Born, not a Citizen | 394 (100.0%) | 0 (0.0%) |
Health Insurance Coverage by Household Income in Clearview
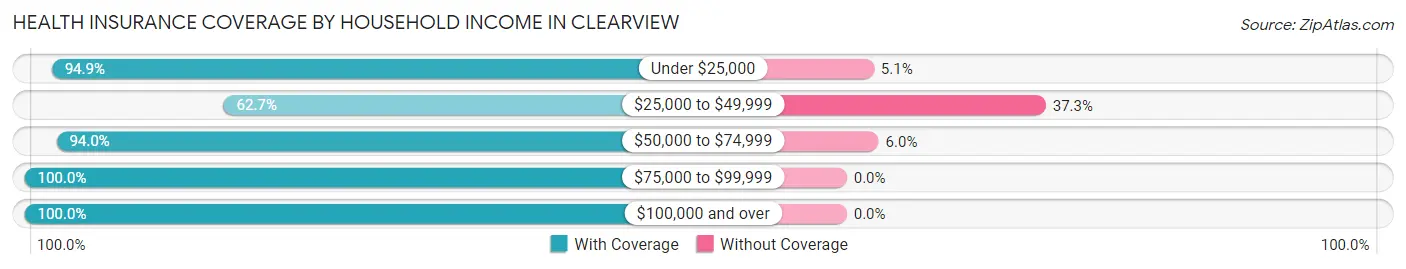
| Household Income | With Coverage | Without Coverage |
| Under $25,000 | 112 (94.9%) | 6 (5.1%) |
| $25,000 to $49,999 | 106 (62.7%) | 63 (37.3%) |
| $50,000 to $74,999 | 252 (94.0%) | 16 (6.0%) |
| $75,000 to $99,999 | 345 (100.0%) | 0 (0.0%) |
| $100,000 and over | 2,852 (100.0%) | 0 (0.0%) |
Public vs Private Health Insurance Coverage by Age in Clearview
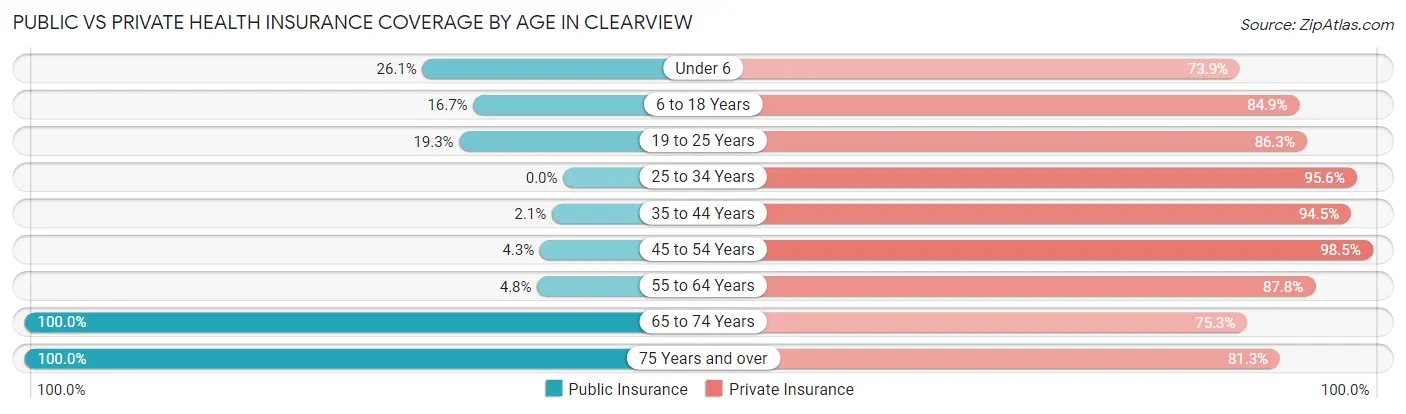
| Age Bracket | Public Insurance | Private Insurance |
| Under 6 | 47 (26.1%) | 133 (73.9%) |
| 6 to 18 Years | 125 (16.7%) | 636 (84.9%) |
| 19 to 25 Years | 76 (19.3%) | 340 (86.3%) |
| 25 to 34 Years | 0 (0.0%) | 408 (95.6%) |
| 35 to 44 Years | 10 (2.1%) | 448 (94.5%) |
| 45 to 54 Years | 26 (4.3%) | 591 (98.5%) |
| 55 to 64 Years | 23 (4.8%) | 419 (87.8%) |
| 65 to 74 Years | 279 (100.0%) | 210 (75.3%) |
| 75 Years and over | 182 (100.0%) | 148 (81.3%) |
| Total | 768 (20.4%) | 3,333 (88.6%) |
Disability Status by Sex by Age in Clearview
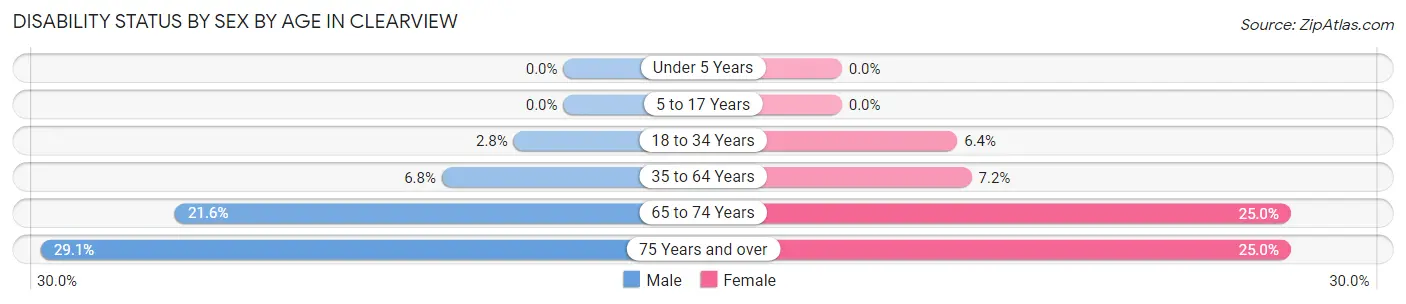
| Age Bracket | Male | Female |
| Under 5 Years | 0 (0.0%) | 0 (0.0%) |
| 5 to 17 Years | 0 (0.0%) | 0 (0.0%) |
| 18 to 34 Years | 12 (2.8%) | 27 (6.4%) |
| 35 to 64 Years | 61 (6.8%) | 47 (7.2%) |
| 65 to 74 Years | 24 (21.6%) | 42 (25.0%) |
| 75 Years and over | 32 (29.1%) | 18 (25.0%) |
Disability Class by Sex by Age in Clearview
Disability Class: Hearing Difficulty
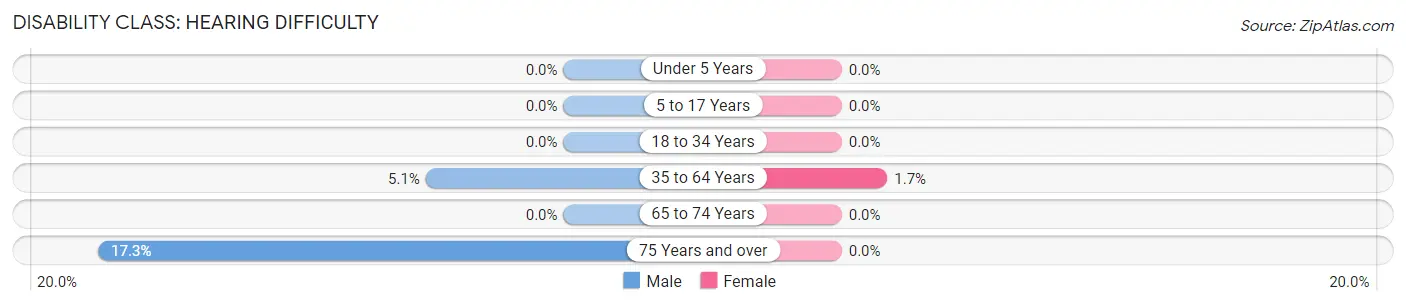
| Age Bracket | Male | Female |
| Under 5 Years | 0 (0.0%) | 0 (0.0%) |
| 5 to 17 Years | 0 (0.0%) | 0 (0.0%) |
| 18 to 34 Years | 0 (0.0%) | 0 (0.0%) |
| 35 to 64 Years | 46 (5.1%) | 11 (1.7%) |
| 65 to 74 Years | 0 (0.0%) | 0 (0.0%) |
| 75 Years and over | 19 (17.3%) | 0 (0.0%) |
Disability Class: Vision Difficulty
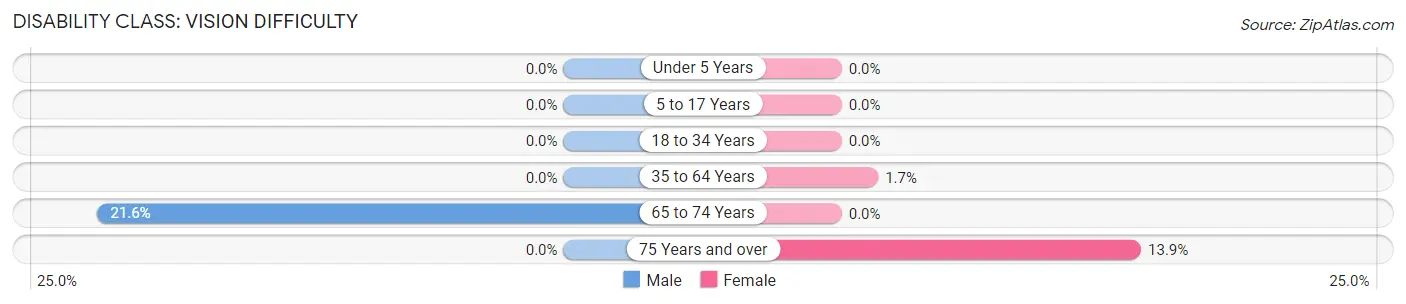
| Age Bracket | Male | Female |
| Under 5 Years | 0 (0.0%) | 0 (0.0%) |
| 5 to 17 Years | 0 (0.0%) | 0 (0.0%) |
| 18 to 34 Years | 0 (0.0%) | 0 (0.0%) |
| 35 to 64 Years | 0 (0.0%) | 11 (1.7%) |
| 65 to 74 Years | 24 (21.6%) | 0 (0.0%) |
| 75 Years and over | 0 (0.0%) | 10 (13.9%) |
Disability Class: Cognitive Difficulty
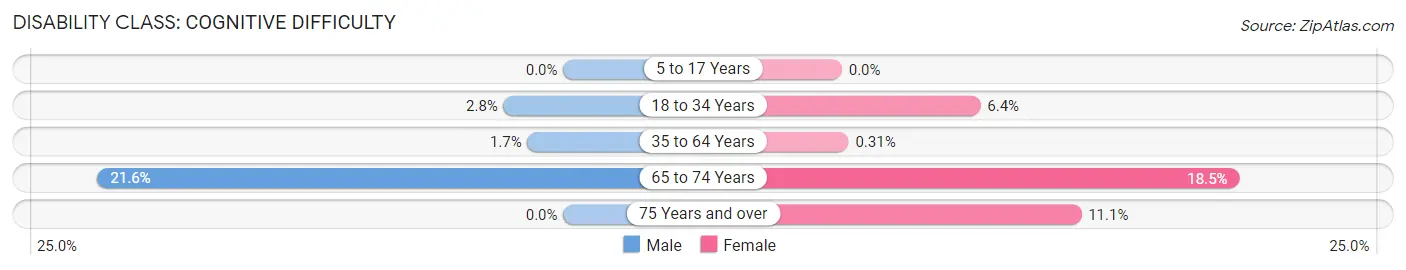
| Age Bracket | Male | Female |
| 5 to 17 Years | 0 (0.0%) | 0 (0.0%) |
| 18 to 34 Years | 12 (2.8%) | 27 (6.4%) |
| 35 to 64 Years | 15 (1.7%) | 2 (0.3%) |
| 65 to 74 Years | 24 (21.6%) | 31 (18.4%) |
| 75 Years and over | 0 (0.0%) | 8 (11.1%) |
Disability Class: Ambulatory Difficulty
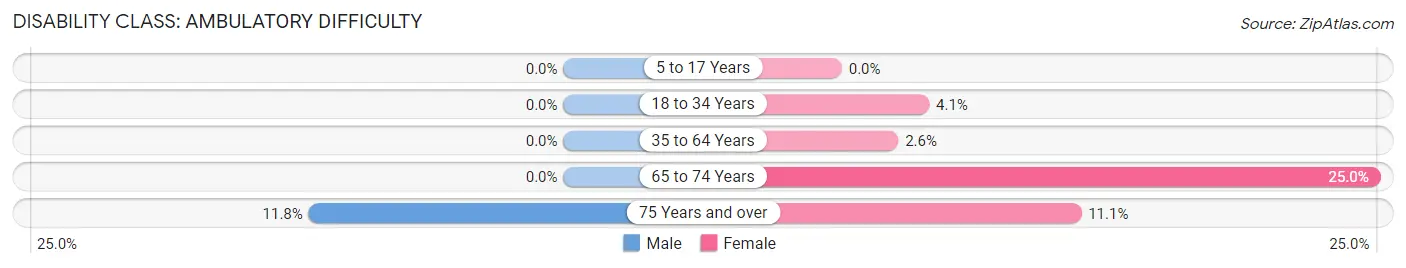
| Age Bracket | Male | Female |
| 5 to 17 Years | 0 (0.0%) | 0 (0.0%) |
| 18 to 34 Years | 0 (0.0%) | 17 (4.1%) |
| 35 to 64 Years | 0 (0.0%) | 17 (2.6%) |
| 65 to 74 Years | 0 (0.0%) | 42 (25.0%) |
| 75 Years and over | 13 (11.8%) | 8 (11.1%) |
Disability Class: Self-Care Difficulty
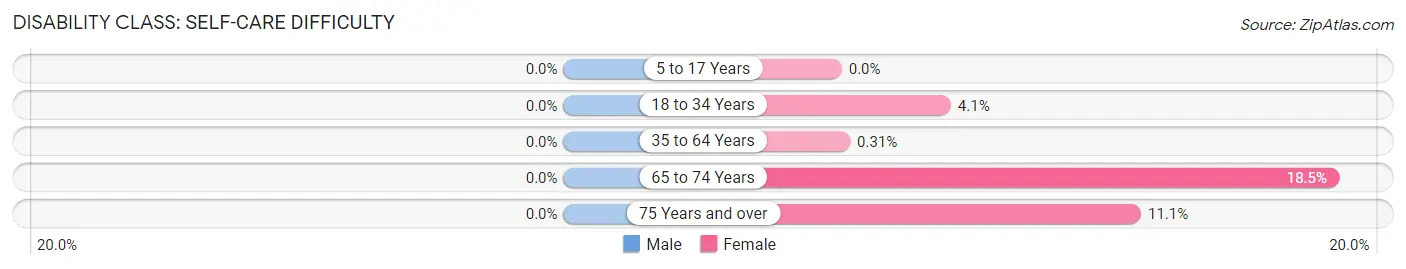
| Age Bracket | Male | Female |
| 5 to 17 Years | 0 (0.0%) | 0 (0.0%) |
| 18 to 34 Years | 0 (0.0%) | 17 (4.1%) |
| 35 to 64 Years | 0 (0.0%) | 2 (0.3%) |
| 65 to 74 Years | 0 (0.0%) | 31 (18.4%) |
| 75 Years and over | 0 (0.0%) | 8 (11.1%) |
Technology Access in Clearview
Computing Device Access in Clearview
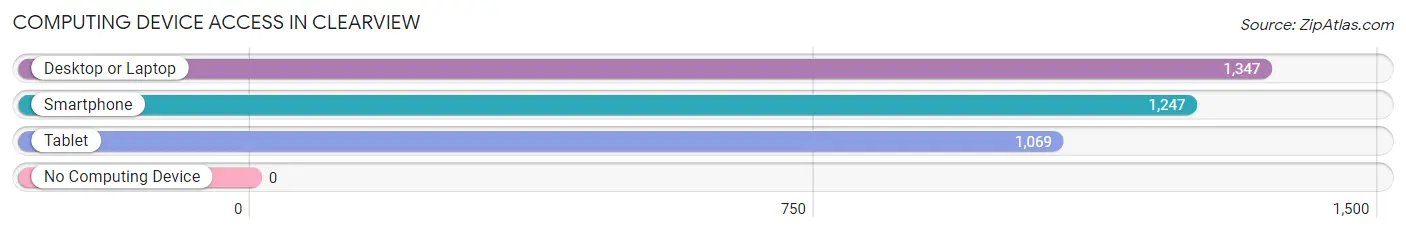
| Device Type | # Households | % Households |
| Desktop or Laptop | 1,347 | 97.3% |
| Smartphone | 1,247 | 90.0% |
| Tablet | 1,069 | 77.2% |
| No Computing Device | 0 | 0.0% |
| Total | 1,385 | 100.0% |
Internet Access in Clearview
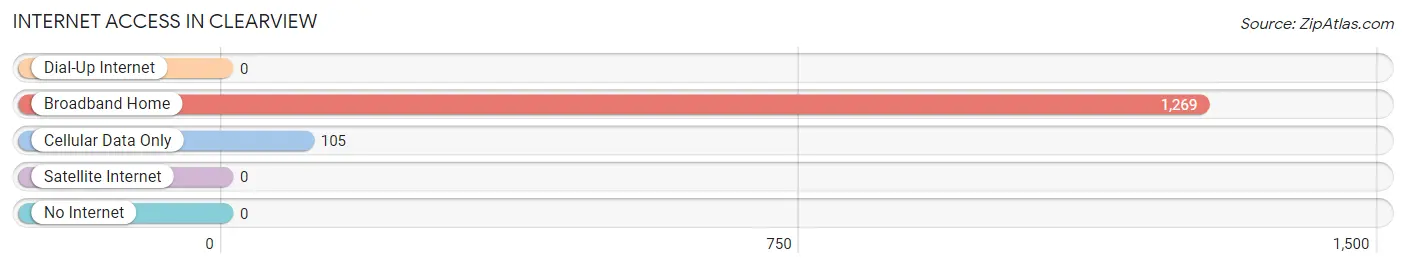
| Internet Type | # Households | % Households |
| Dial-Up Internet | 0 | 0.0% |
| Broadband Home | 1,269 | 91.6% |
| Cellular Data Only | 105 | 7.6% |
| Satellite Internet | 0 | 0.0% |
| No Internet | 0 | 0.0% |
| Total | 1,385 | 100.0% |
Clearview Summary
History
Clearview, Washington is a small town located in Snohomish County, Washington. It is situated in the foothills of the Cascade Mountains, about 25 miles northeast of Seattle. The town was founded in 1891 by a group of settlers who were looking for a place to settle and start a new life. The town was originally called Clearview because of the clear view of the mountains from the area.
The first settlers in Clearview were mostly farmers and loggers. They cleared the land and built homes and businesses. The town grew slowly but steadily over the years, and by the early 1900s, it had become a thriving community.
In the 1920s, the town began to experience a period of growth and prosperity. The population increased, and new businesses opened up. The town also became a popular tourist destination, as people from all over the country came to visit the beautiful mountain scenery.
In the 1950s, Clearview began to experience a decline in population and businesses. This was due to the increasing popularity of nearby cities such as Everett and Seattle. However, the town was able to maintain its small-town charm and character.
In the late 1980s, Clearview began to experience a resurgence in population and businesses. This was due to the increasing popularity of the nearby cities of Everett and Seattle. The town also began to attract new businesses, such as restaurants, shops, and other services.
Geography
Clearview is located in Snohomish County, Washington. It is situated in the foothills of the Cascade Mountains, about 25 miles northeast of Seattle. The town is surrounded by lush forests and rolling hills. The nearby mountains provide a stunning backdrop for the town.
The climate in Clearview is mild and temperate. The summers are warm and sunny, while the winters are cold and wet. The average annual temperature is around 50 degrees Fahrenheit.
Economy
Clearview’s economy is largely based on tourism and retail. The town is a popular destination for tourists who come to enjoy the beautiful mountain scenery. There are several restaurants, shops, and other services in the town.
The town also has a thriving agricultural sector. The surrounding area is home to many farms and ranches, which produce a variety of crops and livestock.
Demographics
As of the 2010 census, the population of Clearview was 4,845. The population is mostly white (90.2%), with a small percentage of African Americans (2.2%), Asians (2.1%), and other races (5.5%). The median household income is $60,945, and the median age is 43.
Conclusion
Clearview, Washington is a small town located in Snohomish County, Washington. It is situated in the foothills of the Cascade Mountains, about 25 miles northeast of Seattle. The town was founded in 1891 by a group of settlers who were looking for a place to settle and start a new life. The town has experienced periods of growth and decline over the years, but it has managed to maintain its small-town charm and character. The economy of Clearview is largely based on tourism and retail, and the population is mostly white.
Common Questions
What is Per Capita Income in Clearview?
Per Capita income in Clearview is $61,198.
What is the Median Family Income in Clearview?
Median Family Income in Clearview is $197,308.
What is the Median Household income in Clearview?
Median Household Income in Clearview is $174,051.
What is Income or Wage Gap in Clearview?
Income or Wage Gap in Clearview is 22.1%.
Women in Clearview earn 77.9 cents for every dollar earned by a man.
What is Inequality or Gini Index in Clearview?
Inequality or Gini Index in Clearview is 0.34.
What is the Total Population of Clearview?
Total Population of Clearview is 3,763.
What is the Total Male Population of Clearview?
Total Male Population of Clearview is 2,110.
What is the Total Female Population of Clearview?
Total Female Population of Clearview is 1,653.
What is the Ratio of Males per 100 Females in Clearview?
There are 127.65 Males per 100 Females in Clearview.
What is the Ratio of Females per 100 Males in Clearview?
There are 78.34 Females per 100 Males in Clearview.
What is the Median Population Age in Clearview?
Median Population Age in Clearview is 41.3 Years.
What is the Average Family Size in Clearview
Average Family Size in Clearview is 3.1 People.
What is the Average Household Size in Clearview
Average Household Size in Clearview is 2.7 People.
How Large is the Labor Force in Clearview?
There are 2,025 People in the Labor Forcein in Clearview.
What is the Percentage of People in the Labor Force in Clearview?
66.3% of People are in the Labor Force in Clearview.
What is the Unemployment Rate in Clearview?
Unemployment Rate in Clearview is 2.1%.