Zip Codes with the Highest Percentage of Population Employed in Architecture & Engineering in Marysville, WA
RELATED REPORTS & OPTIONS
Architecture & Engineering
Marysville
Compare Zip Codes
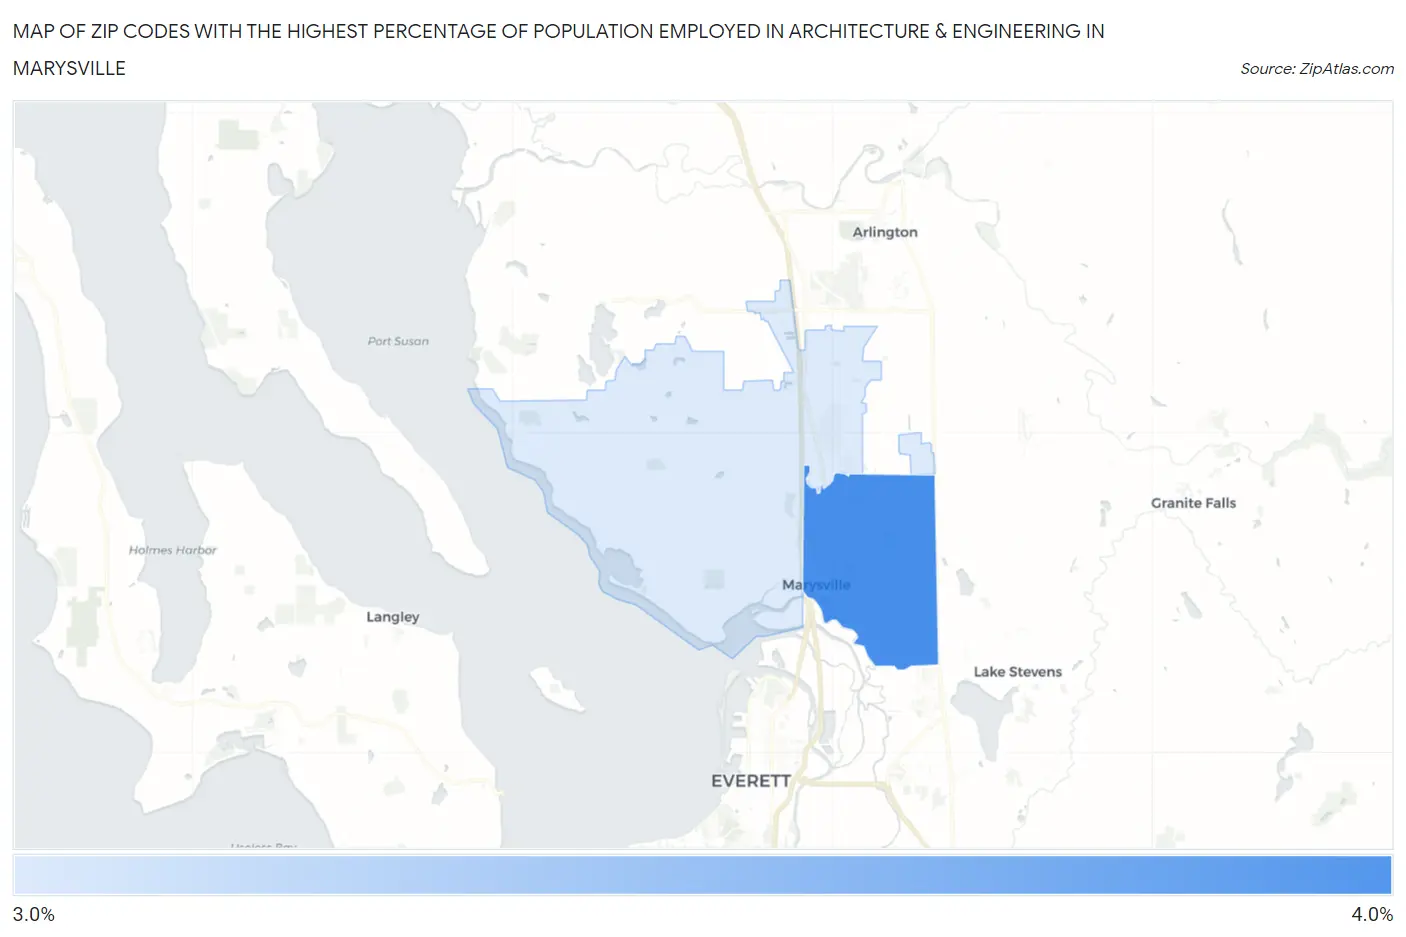
Map of Zip Codes with the Highest Percentage of Population Employed in Architecture & Engineering in Marysville
3.2%
3.3%
Zip Codes with the Highest Percentage of Population Employed in Architecture & Engineering in Marysville, WA
| Zip Code | % Employed | vs State | vs National | |
| 1. | 98270 | 3.3% | 2.8%(+0.521)#120 | 2.1%(+1.16)#4,174 |
| 2. | 98271 | 3.2% | 2.8%(+0.399)#128 | 2.1%(+1.04)#4,487 |
1
Common Questions
What are the Top Zip Codes with the Highest Percentage of Population Employed in Architecture & Engineering in Marysville, WA?
Top Zip Codes with the Highest Percentage of Population Employed in Architecture & Engineering in Marysville, WA are:
What zip code has the Highest Percentage of Population Employed in Architecture & Engineering in Marysville, WA?
98270 has the Highest Percentage of Population Employed in Architecture & Engineering in Marysville, WA with 3.3%.
What is the Percentage of Population Employed in Architecture & Engineering in Marysville, WA?
Percentage of Population Employed in Architecture & Engineering in Marysville is 3.4%.
What is the Percentage of Population Employed in Architecture & Engineering in Washington?
Percentage of Population Employed in Architecture & Engineering in Washington is 2.8%.
What is the Percentage of Population Employed in Architecture & Engineering in the United States?
Percentage of Population Employed in Architecture & Engineering in the United States is 2.1%.