Custer, WA Map & Demographics
Custer Map
Custer Overview
$40,404
PER CAPITA INCOME
$130,192
AVG FAMILY INCOME
$92,768
AVG HOUSEHOLD INCOME
54.4%
WAGE / INCOME GAP [ % ]
45.6¢/ $1
WAGE / INCOME GAP [ $ ]
0.26
INEQUALITY / GINI INDEX
301
TOTAL POPULATION
140
MALE POPULATION
161
FEMALE POPULATION
86.96
MALES / 100 FEMALES
115.00
FEMALES / 100 MALES
34.5
MEDIAN AGE
2.6
AVG FAMILY SIZE
2.3
AVG HOUSEHOLD SIZE
218
LABOR FORCE [ PEOPLE ]
89.7%
PERCENT IN LABOR FORCE
16.1%
UNEMPLOYMENT RATE
Custer Zip Codes
Custer Area Codes
Income in Custer
Income Overview in Custer
Per Capita Income in Custer is $40,404, while median incomes of families and households are $130,192 and $92,768 respectively.
| Characteristic | Number | Measure |
| Per Capita Income | 301 | $40,404 |
| Median Family Income | 90 | $130,192 |
| Mean Family Income | 90 | $105,383 |
| Median Household Income | 131 | $92,768 |
| Mean Household Income | 131 | $92,366 |
| Income Deficit | 90 | $0 |
| Wage / Income Gap (%) | 301 | 54.45% |
| Wage / Income Gap ($) | 301 | 45.55¢ per $1 |
| Gini / Inequality Index | 301 | 0.26 |
Earnings by Sex in Custer
Average Earnings in Custer are $49,470, $75,833 for men and $34,545 for women, a difference of 54.4%.
| Sex | Number | Average Earnings |
| Male | 82 (41.8%) | $75,833 |
| Female | 114 (58.2%) | $34,545 |
| Total | 196 (100.0%) | $49,470 |
Earnings by Sex by Income Bracket in Custer
The most common earnings brackets in Custer are $75,000 to $99,999 for men (45 | 54.9%) and $45,000 to $49,999 for women (33 | 28.9%).
| Income | Male | Female |
| $2,499 or less | 13 (15.9%) | 0 (0.0%) |
| $2,500 to $4,999 | 0 (0.0%) | 0 (0.0%) |
| $5,000 to $7,499 | 0 (0.0%) | 0 (0.0%) |
| $7,500 to $9,999 | 0 (0.0%) | 0 (0.0%) |
| $10,000 to $12,499 | 0 (0.0%) | 0 (0.0%) |
| $12,500 to $14,999 | 0 (0.0%) | 0 (0.0%) |
| $15,000 to $17,499 | 0 (0.0%) | 0 (0.0%) |
| $17,500 to $19,999 | 0 (0.0%) | 0 (0.0%) |
| $20,000 to $22,499 | 0 (0.0%) | 32 (28.1%) |
| $22,500 to $24,999 | 0 (0.0%) | 0 (0.0%) |
| $25,000 to $29,999 | 0 (0.0%) | 16 (14.0%) |
| $30,000 to $34,999 | 0 (0.0%) | 11 (9.7%) |
| $35,000 to $39,999 | 0 (0.0%) | 0 (0.0%) |
| $40,000 to $44,999 | 0 (0.0%) | 0 (0.0%) |
| $45,000 to $49,999 | 0 (0.0%) | 33 (28.9%) |
| $50,000 to $54,999 | 4 (4.9%) | 8 (7.0%) |
| $55,000 to $64,999 | 0 (0.0%) | 0 (0.0%) |
| $65,000 to $74,999 | 20 (24.4%) | 0 (0.0%) |
| $75,000 to $99,999 | 45 (54.9%) | 14 (12.3%) |
| $100,000+ | 0 (0.0%) | 0 (0.0%) |
| Total | 82 (100.0%) | 114 (100.0%) |
Earnings by Sex by Educational Attainment in Custer
Average earnings in Custer are $75,833 for men and $34,545 for women, a difference of 54.4%. Men with an educational attainment of college or associate's degree enjoy the highest average annual earnings of $2,499, while those with college or associate's degree education earn the least with $2,499. Women with an educational attainment of high school diploma earn the most with the average annual earnings of $27,891, while those with high school diploma education have the smallest earnings of $27,891.
| Educational Attainment | Male Income | Female Income |
| Less than High School | - | - |
| High School Diploma | - | - |
| College or Associate's Degree | $2,499 | $0 |
| Bachelor's Degree | - | - |
| Graduate Degree | - | - |
| Total | $75,833 | $34,545 |
Family Income in Custer
Family Income Brackets in Custer
According to the Custer family income data, there are 46 families falling into the $100,000 to $149,999 income range, which is the most common income bracket and makes up 51.1% of all families.
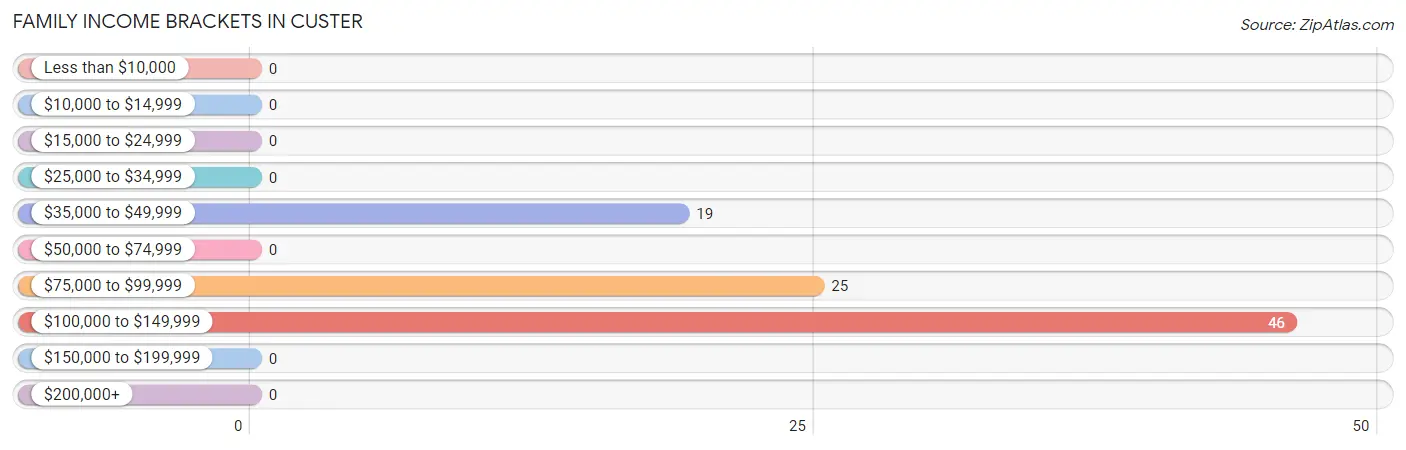
| Income Bracket | # Families | % Families |
| Less than $10,000 | 0 | 0.0% |
| $10,000 to $14,999 | 0 | 0.0% |
| $15,000 to $24,999 | 0 | 0.0% |
| $25,000 to $34,999 | 0 | 0.0% |
| $35,000 to $49,999 | 19 | 21.1% |
| $50,000 to $74,999 | 0 | 0.0% |
| $75,000 to $99,999 | 25 | 27.8% |
| $100,000 to $149,999 | 46 | 51.1% |
| $150,000 to $199,999 | 0 | 0.0% |
| $200,000+ | 0 | 0.0% |
Family Income by Famaliy Size in Custer
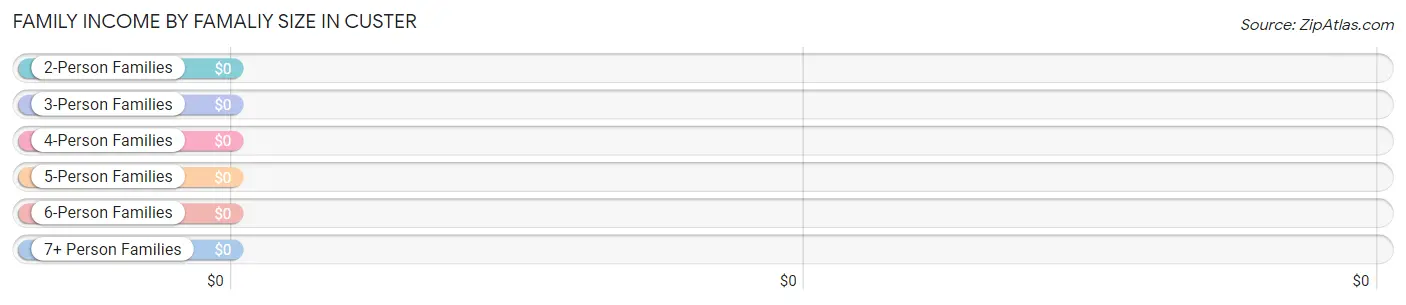
| Income Bracket | # Families | Median Income |
| 2-Person Families | 52 (57.8%) | $0 |
| 3-Person Families | 27 (30.0%) | $0 |
| 4-Person Families | 0 (0.0%) | $0 |
| 5-Person Families | 11 (12.2%) | $0 |
| 6-Person Families | 0 (0.0%) | $0 |
| 7+ Person Families | 0 (0.0%) | $0 |
| Total | 90 (100.0%) | $130,192 |
Family Income by Number of Earners in Custer
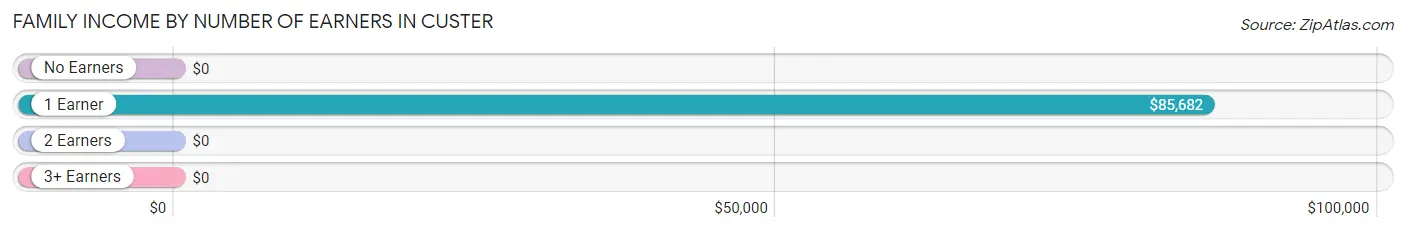
| Number of Earners | # Families | Median Income |
| No Earners | 0 (0.0%) | $0 |
| 1 Earner | 44 (48.9%) | $85,682 |
| 2 Earners | 33 (36.7%) | $0 |
| 3+ Earners | 13 (14.4%) | $0 |
| Total | 90 (100.0%) | $130,192 |
Household Income in Custer
Household Income Brackets in Custer
With 53 households falling in the category, the $100,000 to $149,999 income range is the most frequent in Custer, accounting for 40.5% of all households.
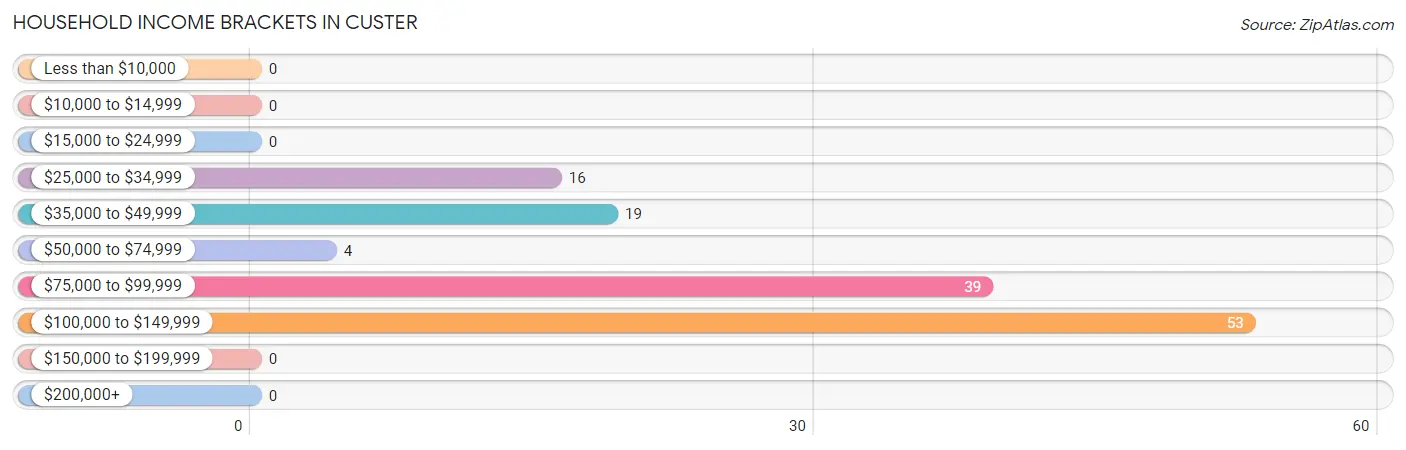
| Income Bracket | # Households | % Households |
| Less than $10,000 | 0 | 0.0% |
| $10,000 to $14,999 | 0 | 0.0% |
| $15,000 to $24,999 | 0 | 0.0% |
| $25,000 to $34,999 | 16 | 12.2% |
| $35,000 to $49,999 | 19 | 14.5% |
| $50,000 to $74,999 | 4 | 3.1% |
| $75,000 to $99,999 | 39 | 29.8% |
| $100,000 to $149,999 | 53 | 40.5% |
| $150,000 to $199,999 | 0 | 0.0% |
| $200,000+ | 0 | 0.0% |
Household Income by Householder Age in Custer
The median household income in Custer is $92,768, with the highest median household income of $94,911 found in the 25 to 44 years age bracket for the primary householder. A total of 81 households (61.8%) fall into this category.
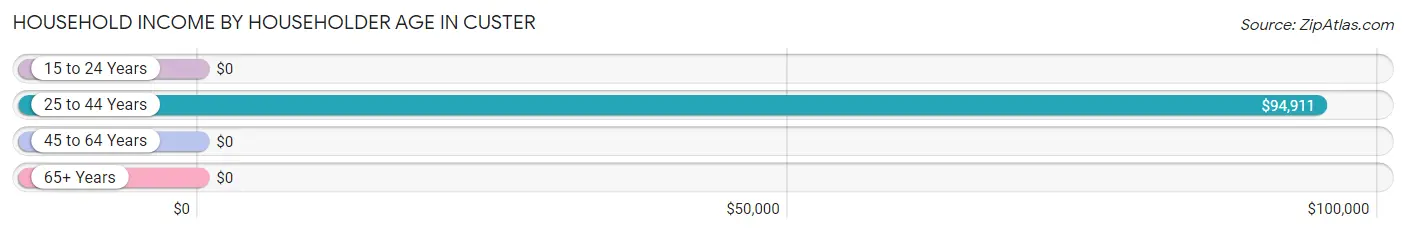
| Income Bracket | # Households | Median Income |
| 15 to 24 Years | 0 (0.0%) | $0 |
| 25 to 44 Years | 81 (61.8%) | $94,911 |
| 45 to 64 Years | 50 (38.2%) | $0 |
| 65+ Years | 0 (0.0%) | $0 |
| Total | 131 (100.0%) | $92,768 |
Poverty in Custer
Income Below Poverty by Sex and Age in Custer
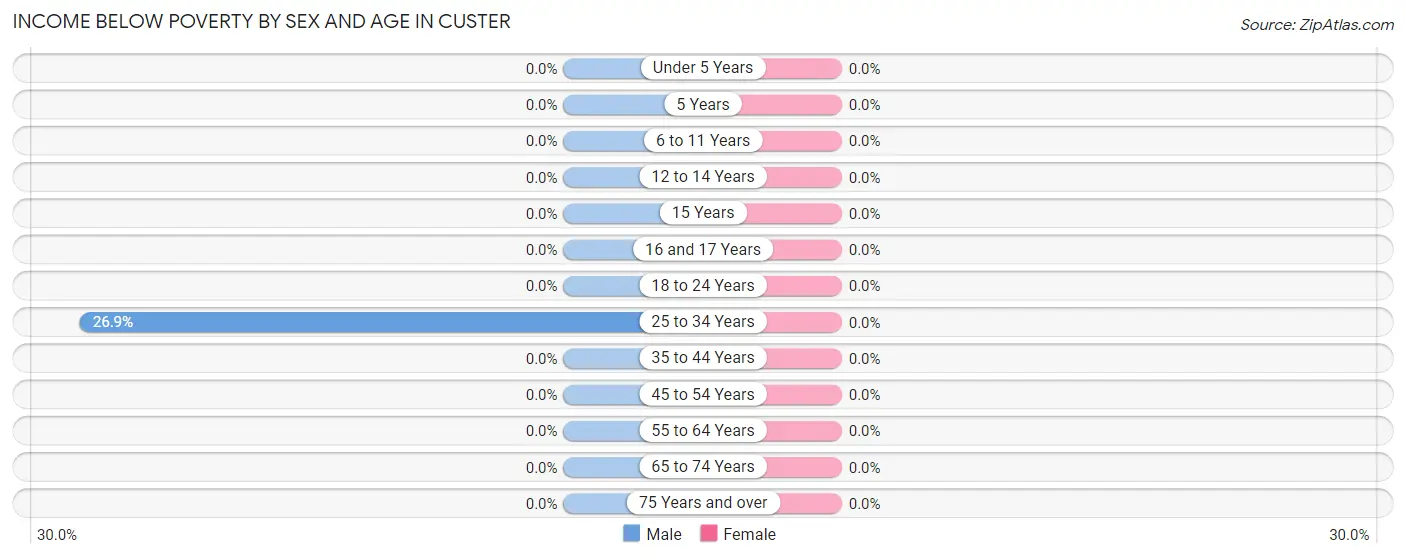
| Age Bracket | Male | Female |
| Under 5 Years | 0 (0.0%) | 0 (0.0%) |
| 5 Years | 0 (0.0%) | 0 (0.0%) |
| 6 to 11 Years | 0 (0.0%) | 0 (0.0%) |
| 12 to 14 Years | 0 (0.0%) | 0 (0.0%) |
| 15 Years | 0 (0.0%) | 0 (0.0%) |
| 16 and 17 Years | 0 (0.0%) | 0 (0.0%) |
| 18 to 24 Years | 0 (0.0%) | 0 (0.0%) |
| 25 to 34 Years | 14 (26.9%) | 0 (0.0%) |
| 35 to 44 Years | 0 (0.0%) | 0 (0.0%) |
| 45 to 54 Years | 0 (0.0%) | 0 (0.0%) |
| 55 to 64 Years | 0 (0.0%) | 0 (0.0%) |
| 65 to 74 Years | 0 (0.0%) | 0 (0.0%) |
| 75 Years and over | 0 (0.0%) | 0 (0.0%) |
| Total | 14 (10.0%) | 0 (0.0%) |
Income Above Poverty by Sex and Age in Custer
According to the poverty statistics in Custer, males aged under 5 years and females aged under 5 years are the age groups that are most secure financially, with 100.0% of males and 100.0% of females in these age groups living above the poverty line.
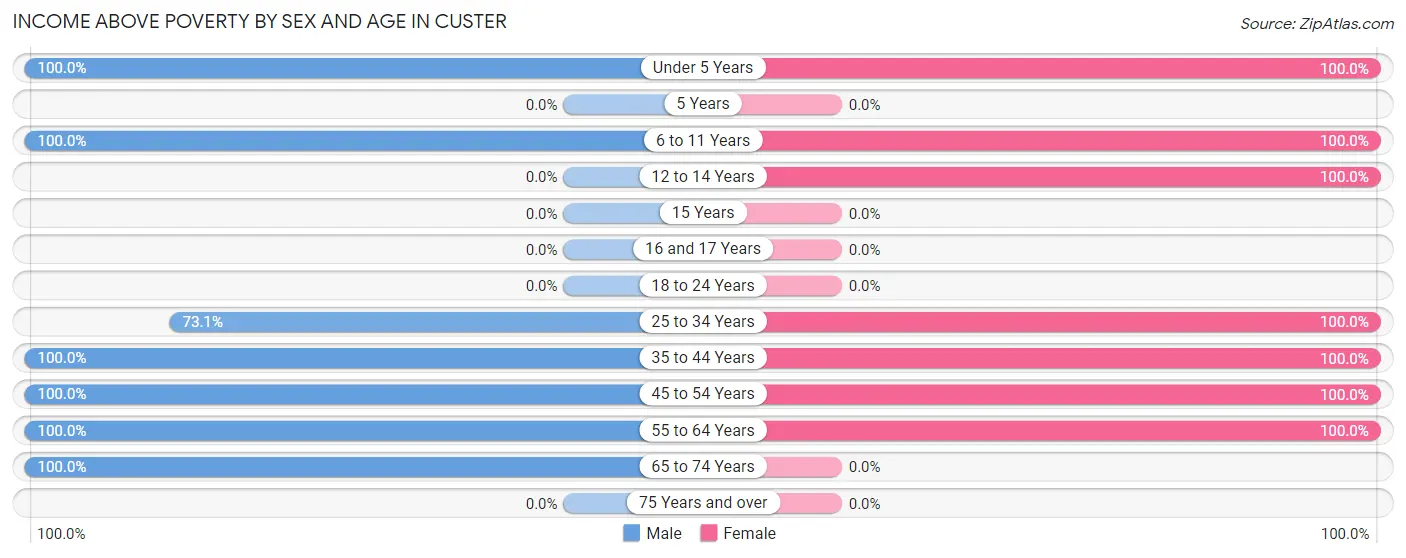
| Age Bracket | Male | Female |
| Under 5 Years | 9 (100.0%) | 11 (100.0%) |
| 5 Years | 0 (0.0%) | 0 (0.0%) |
| 6 to 11 Years | 13 (100.0%) | 13 (100.0%) |
| 12 to 14 Years | 0 (0.0%) | 12 (100.0%) |
| 15 Years | 0 (0.0%) | 0 (0.0%) |
| 16 and 17 Years | 0 (0.0%) | 0 (0.0%) |
| 18 to 24 Years | 0 (0.0%) | 0 (0.0%) |
| 25 to 34 Years | 38 (73.1%) | 55 (100.0%) |
| 35 to 44 Years | 29 (100.0%) | 24 (100.0%) |
| 45 to 54 Years | 2 (100.0%) | 16 (100.0%) |
| 55 to 64 Years | 13 (100.0%) | 30 (100.0%) |
| 65 to 74 Years | 22 (100.0%) | 0 (0.0%) |
| 75 Years and over | 0 (0.0%) | 0 (0.0%) |
| Total | 126 (90.0%) | 161 (100.0%) |
Income Below Poverty Among Married-Couple Families in Custer
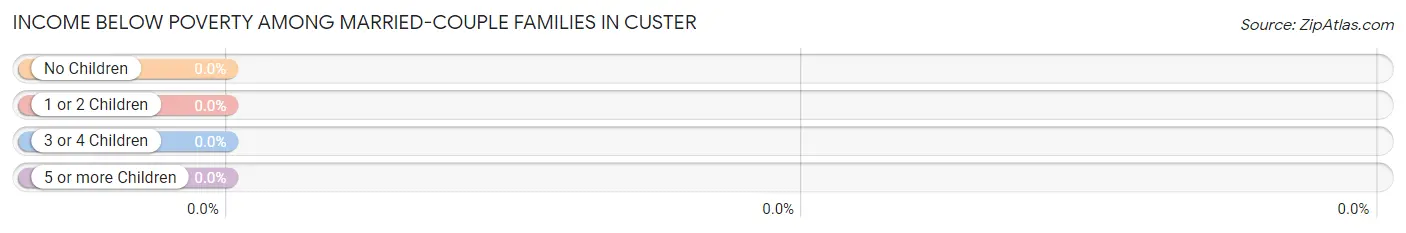
| Children | Above Poverty | Below Poverty |
| No Children | 65 (100.0%) | 0 (0.0%) |
| 1 or 2 Children | 0 (0.0%) | 0 (0.0%) |
| 3 or 4 Children | 11 (100.0%) | 0 (0.0%) |
| 5 or more Children | 0 (0.0%) | 0 (0.0%) |
| Total | 76 (100.0%) | 0 (0.0%) |
Income Below Poverty Among Single-Parent Households in Custer
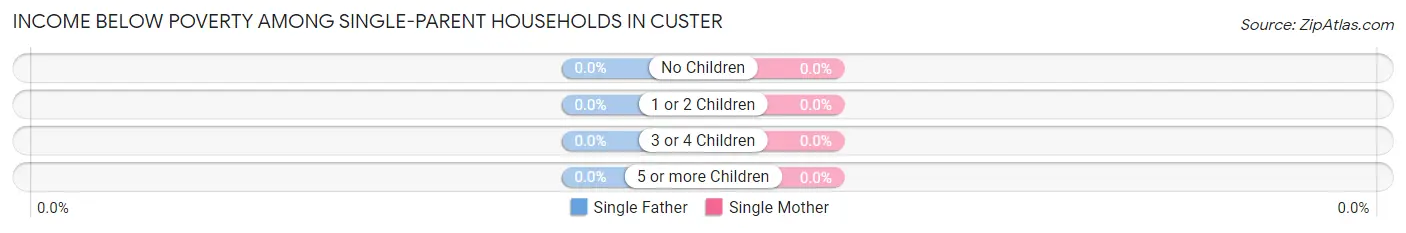
| Children | Single Father | Single Mother |
| No Children | 0 (0.0%) | 0 (0.0%) |
| 1 or 2 Children | 0 (0.0%) | 0 (0.0%) |
| 3 or 4 Children | 0 (0.0%) | 0 (0.0%) |
| 5 or more Children | 0 (0.0%) | 0 (0.0%) |
| Total | 0 (0.0%) | 0 (0.0%) |
Income Below Poverty Among Married-Couple vs Single-Parent Households in Custer
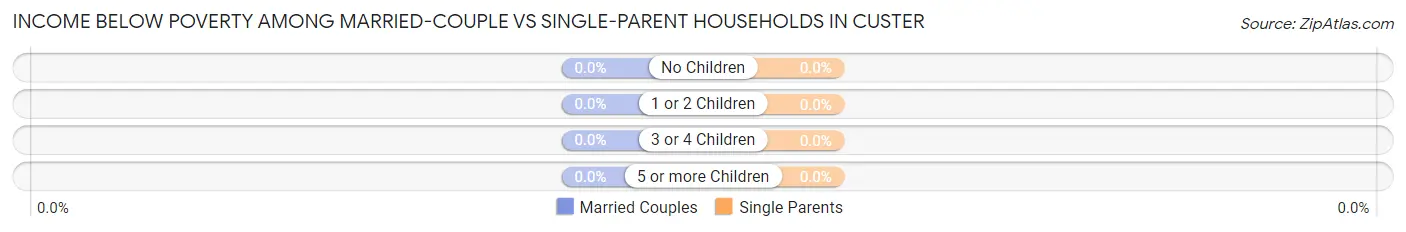
| Children | Married-Couple Families | Single-Parent Households |
| No Children | 0 (0.0%) | 0 (0.0%) |
| 1 or 2 Children | 0 (0.0%) | 0 (0.0%) |
| 3 or 4 Children | 0 (0.0%) | 0 (0.0%) |
| 5 or more Children | 0 (0.0%) | 0 (0.0%) |
| Total | 0 (0.0%) | 0 (0.0%) |
Race in Custer
The most populous races in Custer are White / Caucasian (301 | 100.0%), and Hispanic or Latino (4 | 1.3%).
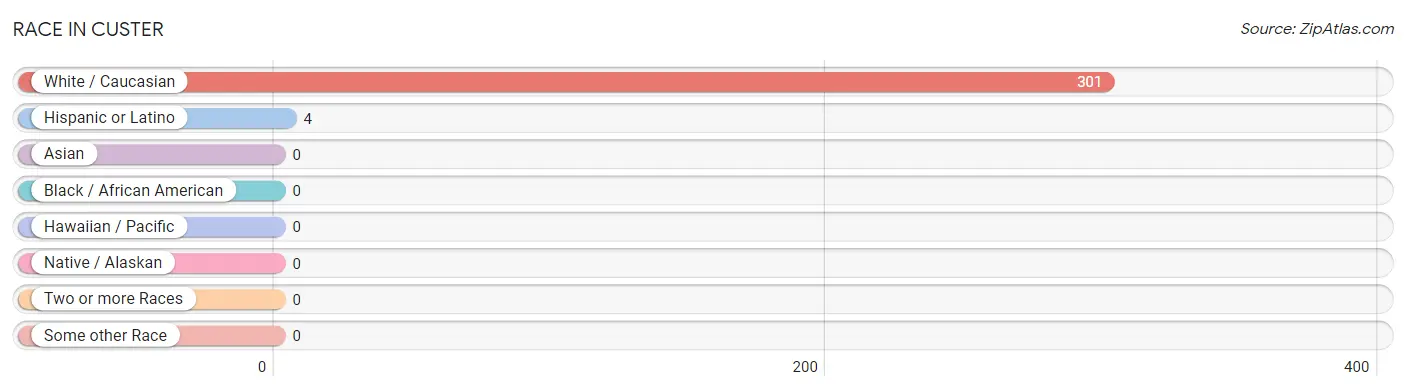
| Race | # Population | % Population |
| Asian | 0 | 0.0% |
| Black / African American | 0 | 0.0% |
| Hawaiian / Pacific | 0 | 0.0% |
| Hispanic or Latino | 4 | 1.3% |
| Native / Alaskan | 0 | 0.0% |
| White / Caucasian | 301 | 100.0% |
| Two or more Races | 0 | 0.0% |
| Some other Race | 0 | 0.0% |
| Total | 301 | 100.0% |
Ancestry in Custer
The most populous ancestries reported in Custer are German (59 | 19.6%), Dutch (53 | 17.6%), Scottish (39 | 13.0%), Australian (38 | 12.6%), and Irish (29 | 9.6%), together accounting for 72.4% of all Custer residents.
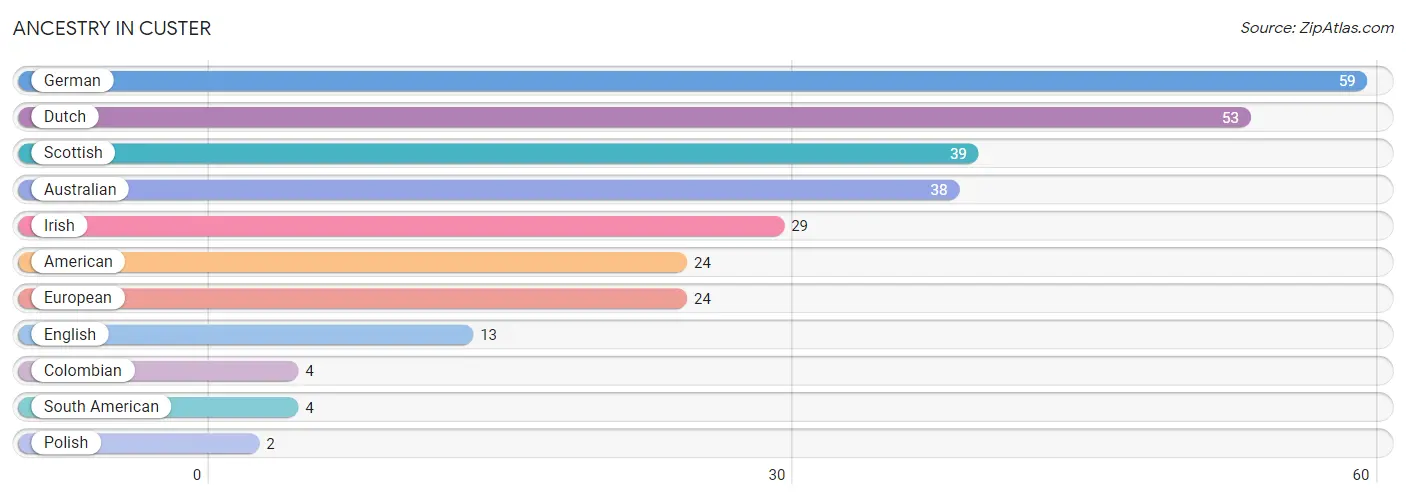
| Ancestry | # Population | % Population |
| American | 24 | 8.0% |
| Australian | 38 | 12.6% |
| Colombian | 4 | 1.3% |
| Dutch | 53 | 17.6% |
| English | 13 | 4.3% |
| European | 24 | 8.0% |
| German | 59 | 19.6% |
| Irish | 29 | 9.6% |
| Polish | 2 | 0.7% |
| Scottish | 39 | 13.0% |
| South American | 4 | 1.3% | View All 11 Rows |
Immigrants in Custer
The most numerous immigrant groups reported in Custer came from Australia (13 | 4.3%), Oceania (13 | 4.3%), Central America (4 | 1.3%), Latin America (4 | 1.3%), and Mexico (4 | 1.3%), together accounting for 12.6% of all Custer residents.
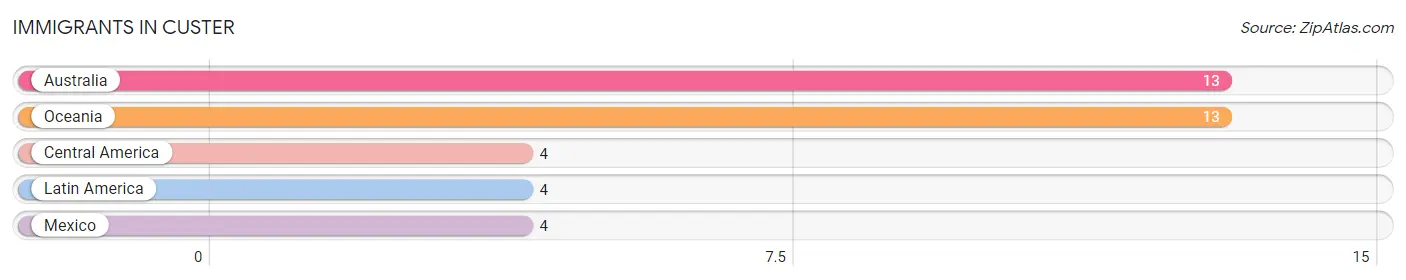
| Immigration Origin | # Population | % Population |
| Australia | 13 | 4.3% |
| Central America | 4 | 1.3% |
| Latin America | 4 | 1.3% |
| Mexico | 4 | 1.3% |
| Oceania | 13 | 4.3% | View All 5 Rows |
Sex and Age in Custer
Sex and Age in Custer
The most populous age groups in Custer are 30 to 34 Years (31 | 22.1%) for men and 30 to 34 Years (33 | 20.5%) for women.
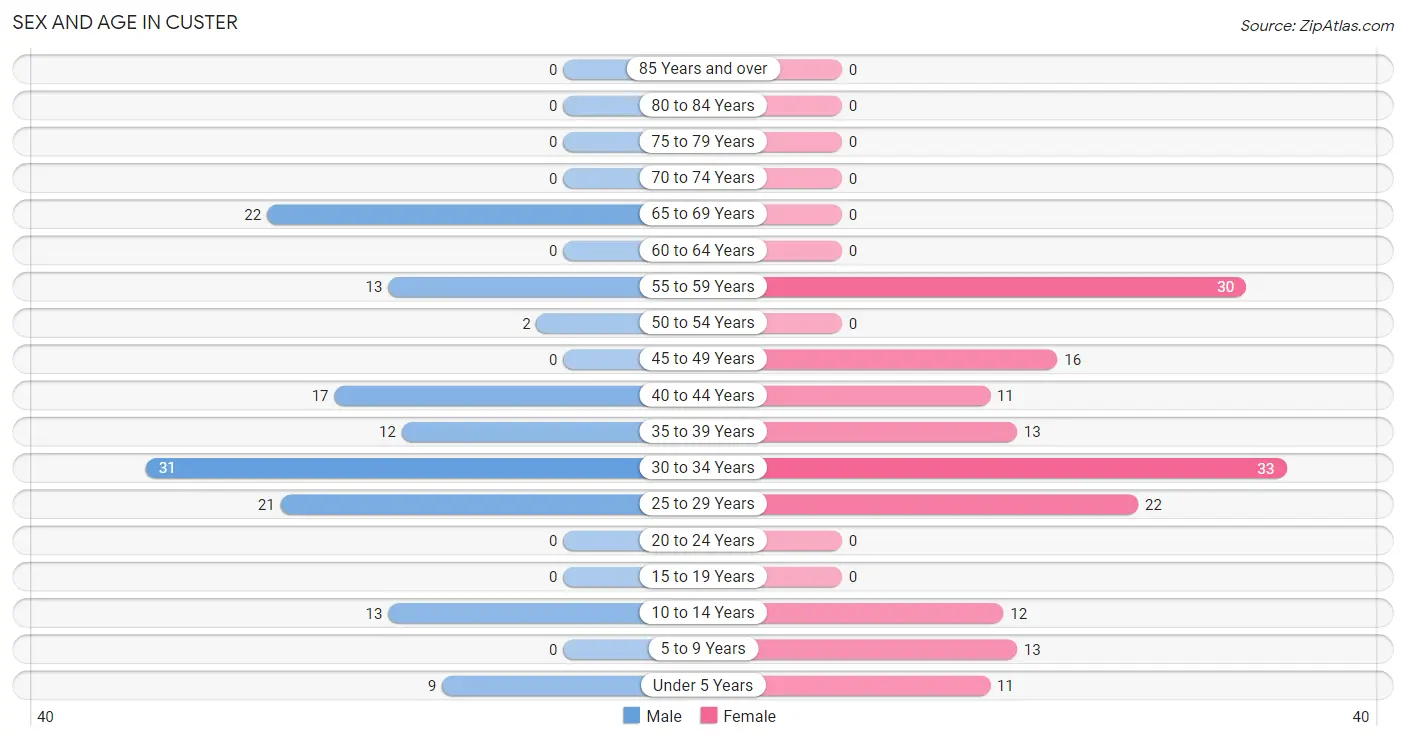
| Age Bracket | Male | Female |
| Under 5 Years | 9 (6.4%) | 11 (6.8%) |
| 5 to 9 Years | 0 (0.0%) | 13 (8.1%) |
| 10 to 14 Years | 13 (9.3%) | 12 (7.4%) |
| 15 to 19 Years | 0 (0.0%) | 0 (0.0%) |
| 20 to 24 Years | 0 (0.0%) | 0 (0.0%) |
| 25 to 29 Years | 21 (15.0%) | 22 (13.7%) |
| 30 to 34 Years | 31 (22.1%) | 33 (20.5%) |
| 35 to 39 Years | 12 (8.6%) | 13 (8.1%) |
| 40 to 44 Years | 17 (12.1%) | 11 (6.8%) |
| 45 to 49 Years | 0 (0.0%) | 16 (9.9%) |
| 50 to 54 Years | 2 (1.4%) | 0 (0.0%) |
| 55 to 59 Years | 13 (9.3%) | 30 (18.6%) |
| 60 to 64 Years | 0 (0.0%) | 0 (0.0%) |
| 65 to 69 Years | 22 (15.7%) | 0 (0.0%) |
| 70 to 74 Years | 0 (0.0%) | 0 (0.0%) |
| 75 to 79 Years | 0 (0.0%) | 0 (0.0%) |
| 80 to 84 Years | 0 (0.0%) | 0 (0.0%) |
| 85 Years and over | 0 (0.0%) | 0 (0.0%) |
| Total | 140 (100.0%) | 161 (100.0%) |
Families and Households in Custer
Median Family Size in Custer
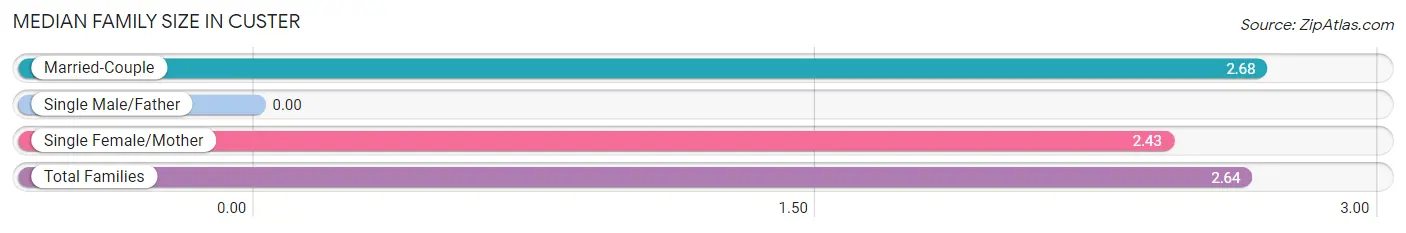
| Family Type | # Families | Family Size |
| Married-Couple | 76 (84.4%) | 2.68 |
| Single Male/Father | 0 (0.0%) | - |
| Single Female/Mother | 14 (15.6%) | 2.43 |
| Total Families | 90 (100.0%) | 2.64 |
Median Household Size in Custer
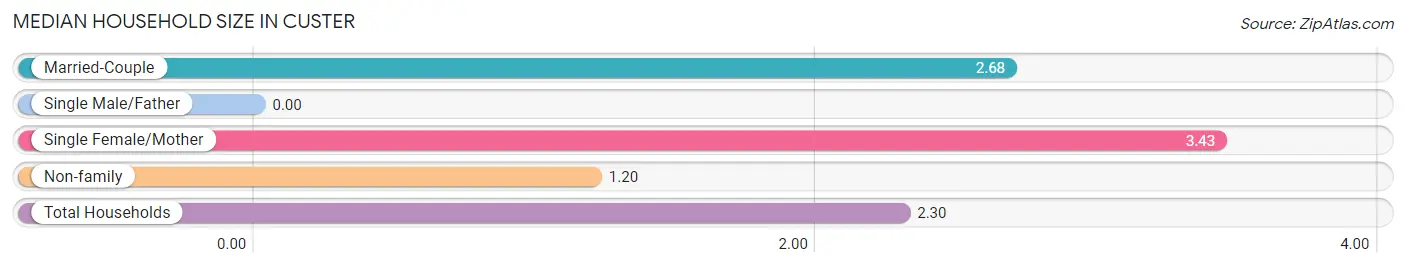
| Household Type | # Households | Household Size |
| Married-Couple | 76 (58.0%) | 2.68 |
| Single Male/Father | 0 (0.0%) | - |
| Single Female/Mother | 14 (10.7%) | 3.43 |
| Non-family | 41 (31.3%) | 1.20 |
| Total Households | 131 (100.0%) | 2.30 |
Household Size by Marriage Status in Custer
Out of a total of 131 households in Custer, 90 (68.7%) are family households, while 41 (31.3%) are nonfamily households. The most numerous type of family households are 2-person households, comprising 52, and the most common type of nonfamily households are 1-person households, comprising 34.
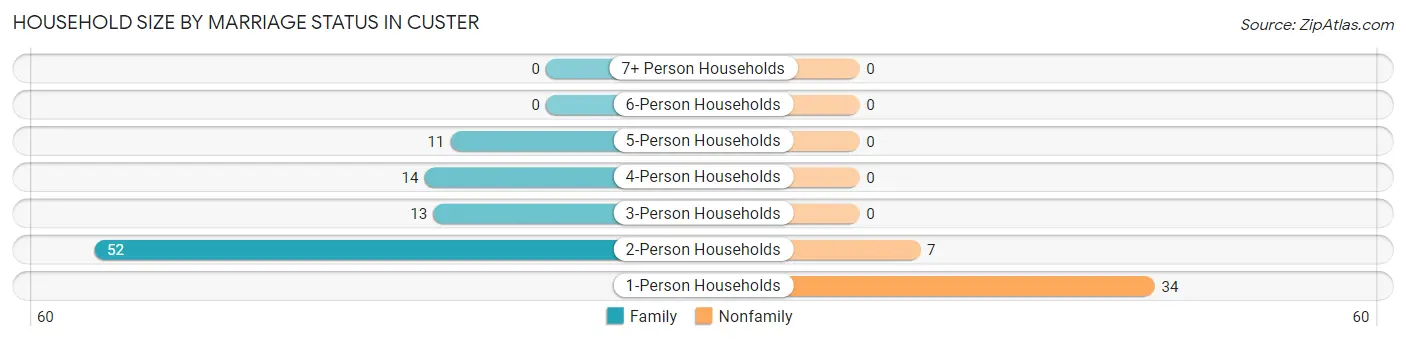
| Household Size | Family Households | Nonfamily Households |
| 1-Person Households | - | 34 (26.0%) |
| 2-Person Households | 52 (39.7%) | 7 (5.3%) |
| 3-Person Households | 13 (9.9%) | 0 (0.0%) |
| 4-Person Households | 14 (10.7%) | 0 (0.0%) |
| 5-Person Households | 11 (8.4%) | 0 (0.0%) |
| 6-Person Households | 0 (0.0%) | 0 (0.0%) |
| 7+ Person Households | 0 (0.0%) | 0 (0.0%) |
| Total | 90 (68.7%) | 41 (31.3%) |
Female Fertility in Custer
Fertility by Age in Custer
| Age Bracket | Women with Births | Births / 1,000 Women |
| 15 to 19 years | 0 (0.0%) | 0.0 |
| 20 to 34 years | 0 (0.0%) | 0.0 |
| 35 to 50 years | 0 (0.0%) | 0.0 |
| Total | 0 (0.0%) | 0.0 |
Fertility by Age by Marriage Status in Custer
| Age Bracket | Married | Unmarried |
| 15 to 19 years | 0 (0.0%) | 0 (0.0%) |
| 20 to 34 years | 0 (0.0%) | 0 (0.0%) |
| 35 to 50 years | 0 (0.0%) | 0 (0.0%) |
| Total | 0 (0.0%) | 0 (0.0%) |
Fertility by Education in Custer
| Educational Attainment | Women with Births | Births / 1,000 Women |
| Less than High School | 0 (0.0%) | 0.0 |
| High School Diploma | 0 (0.0%) | 0.0 |
| College or Associate's Degree | 0 (0.0%) | 0.0 |
| Bachelor's Degree | 0 (0.0%) | 0.0 |
| Graduate Degree | 0 (0.0%) | 0.0 |
| Total | 0 (0.0%) | 0.0 |
Fertility by Education by Marriage Status in Custer
| Educational Attainment | Married | Unmarried |
| Less than High School | 0 (0.0%) | 0 (0.0%) |
| High School Diploma | 0 (0.0%) | 0 (0.0%) |
| College or Associate's Degree | 0 (0.0%) | 0 (0.0%) |
| Bachelor's Degree | 0 (0.0%) | 0 (0.0%) |
| Graduate Degree | 0 (0.0%) | 0 (0.0%) |
| Total | 0 (0.0%) | 0 (0.0%) |
Employment Characteristics in Custer
Employment by Class of Employer in Custer
Among the 183 employed individuals in Custer, private company employees (89 | 48.6%), local government employees (33 | 18.0%), and not-for-profit organizations (32 | 17.5%) make up the most common classes of employment.
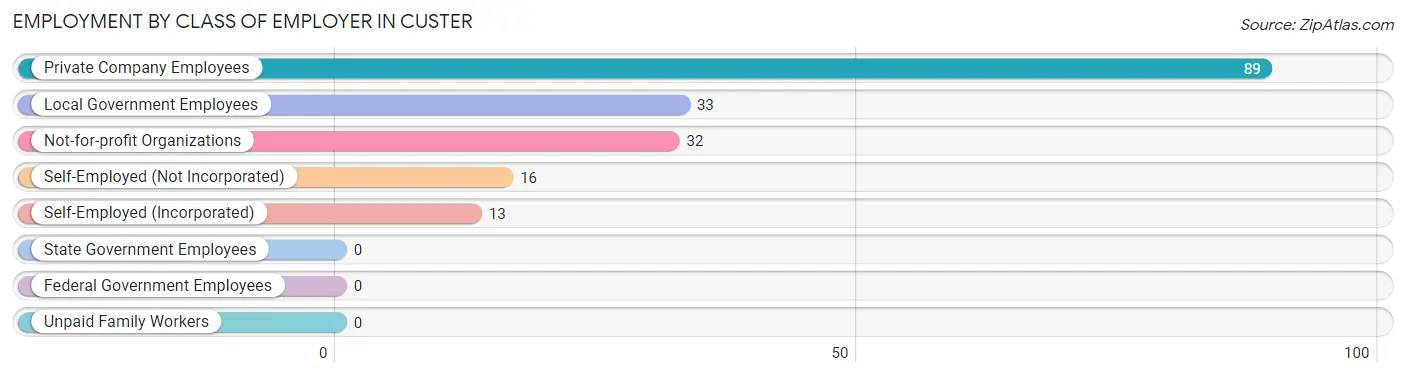
| Employer Class | # Employees | % Employees |
| Private Company Employees | 89 | 48.6% |
| Self-Employed (Incorporated) | 13 | 7.1% |
| Self-Employed (Not Incorporated) | 16 | 8.7% |
| Not-for-profit Organizations | 32 | 17.5% |
| Local Government Employees | 33 | 18.0% |
| State Government Employees | 0 | 0.0% |
| Federal Government Employees | 0 | 0.0% |
| Unpaid Family Workers | 0 | 0.0% |
| Total | 183 | 100.0% |
Employment Status by Age in Custer
According to the labor force statistics for Custer, out of the total population over 16 years of age (243), 89.7% or 218 individuals are in the labor force, with 16.1% or 35 of them unemployed. The age group with the highest labor force participation rate is 30 to 34 years, with 100.0% or 64 individuals in the labor force. Within the labor force, the 65 to 74 years age range has the highest percentage of unemployed individuals, with 100.0% or 22 of them being unemployed.
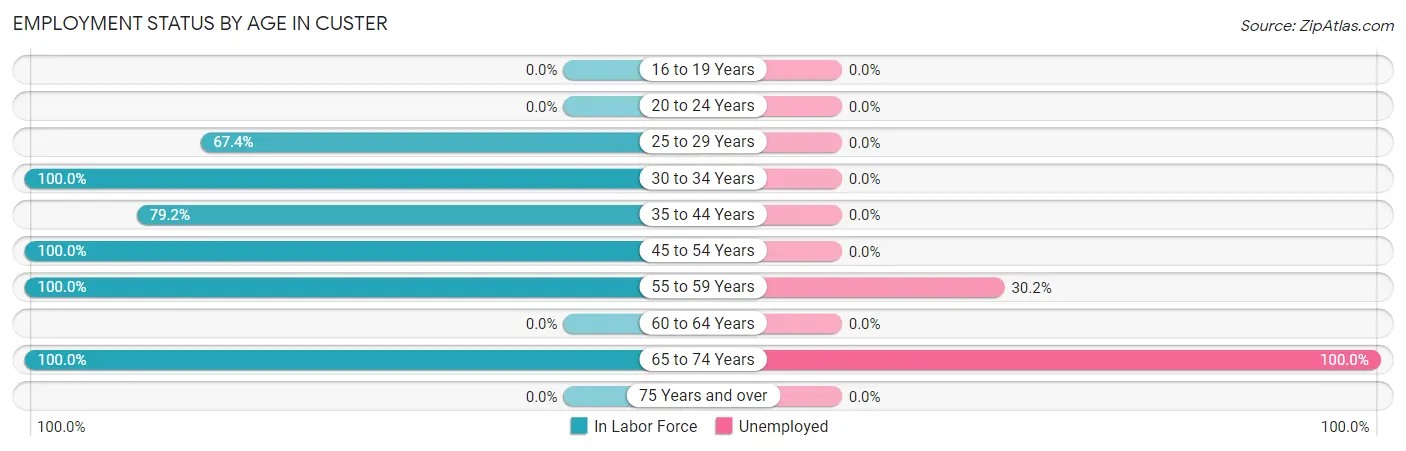
| Age Bracket | In Labor Force | Unemployed |
| 16 to 19 Years | 0 (0.0%) | 0 (0.0%) |
| 20 to 24 Years | 0 (0.0%) | 0 (0.0%) |
| 25 to 29 Years | 29 (67.4%) | 0 (0.0%) |
| 30 to 34 Years | 64 (100.0%) | 0 (0.0%) |
| 35 to 44 Years | 42 (79.2%) | 0 (0.0%) |
| 45 to 54 Years | 18 (100.0%) | 0 (0.0%) |
| 55 to 59 Years | 43 (100.0%) | 13 (30.2%) |
| 60 to 64 Years | 0 (0.0%) | 0 (0.0%) |
| 65 to 74 Years | 22 (100.0%) | 22 (100.0%) |
| 75 Years and over | 0 (0.0%) | 0 (0.0%) |
| Total | 218 (89.7%) | 35 (16.1%) |
Employment Status by Educational Attainment in Custer
According to labor force statistics for Custer, 88.7% of individuals (196) out of the total population between 25 and 64 years of age (221) are in the labor force, with 6.6% or 13 of them being unemployed. The group with the highest labor force participation rate are those with the educational attainment of less than high school, with 100.0% or 14 individuals in the labor force. Within the labor force, individuals with college / associate degree education have the highest percentage of unemployment, with 68.4% or 13 of them being unemployed.
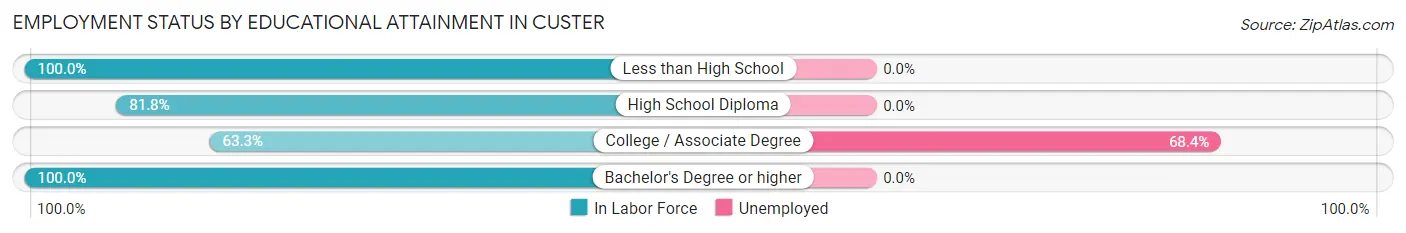
| Educational Attainment | In Labor Force | Unemployed |
| Less than High School | 14 (100.0%) | 0 (0.0%) |
| High School Diploma | 63 (81.8%) | 0 (0.0%) |
| College / Associate Degree | 19 (63.3%) | 21 (68.4%) |
| Bachelor's Degree or higher | 100 (100.0%) | 0 (0.0%) |
| Total | 196 (88.7%) | 15 (6.6%) |
Employment Occupations by Sex in Custer
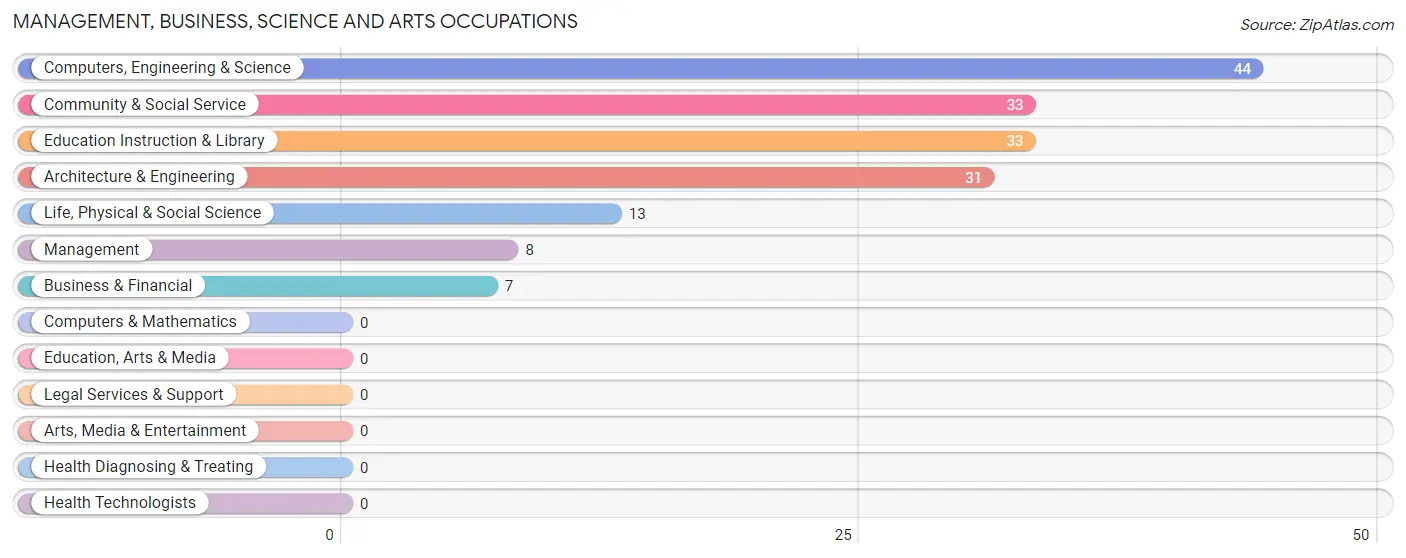
Management, Business, Science and Arts Occupations
The most common Management, Business, Science and Arts occupations in Custer are Computers, Engineering & Science (44 | 24.0%), Community & Social Service (33 | 18.0%), Education Instruction & Library (33 | 18.0%), Architecture & Engineering (31 | 16.9%), and Life, Physical & Social Science (13 | 7.1%).
Management, Business, Science and Arts Occupations by Sex
Within the Management, Business, Science and Arts occupations in Custer, the most male-oriented occupations are Business & Financial (100.0%), Architecture & Engineering (100.0%), and Computers, Engineering & Science (70.5%), while the most female-oriented occupations are Management (100.0%), Life, Physical & Social Science (100.0%), and Community & Social Service (100.0%).
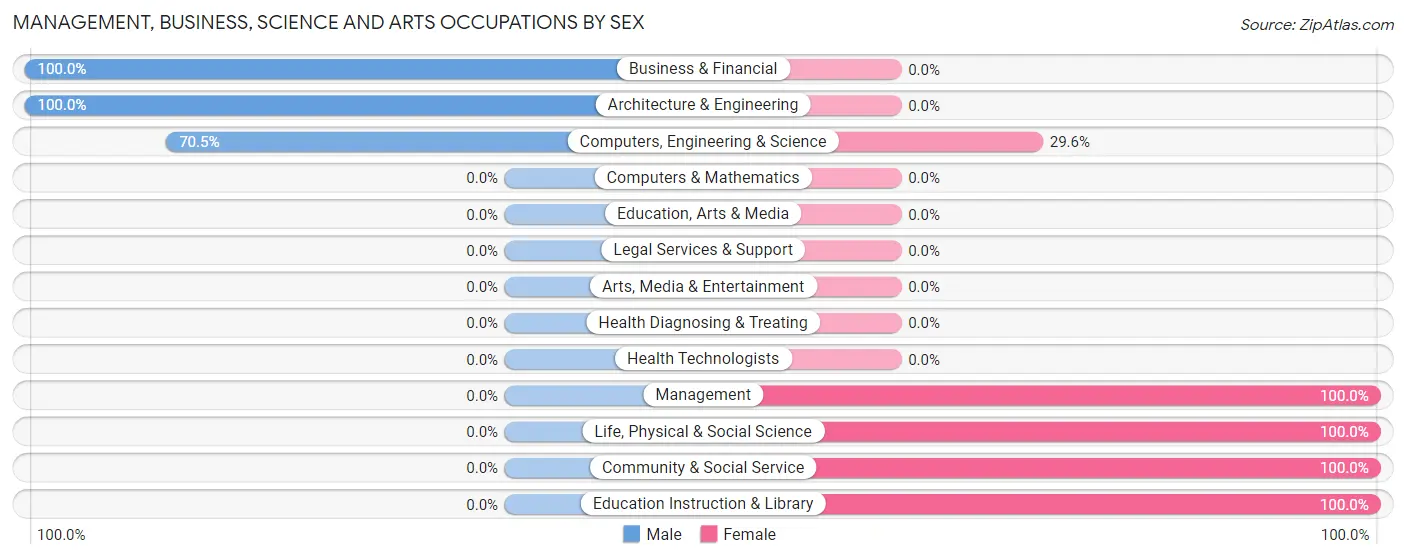
| Occupation | Male | Female |
| Management | 0 (0.0%) | 8 (100.0%) |
| Business & Financial | 7 (100.0%) | 0 (0.0%) |
| Computers, Engineering & Science | 31 (70.5%) | 13 (29.5%) |
| Computers & Mathematics | 0 (0.0%) | 0 (0.0%) |
| Architecture & Engineering | 31 (100.0%) | 0 (0.0%) |
| Life, Physical & Social Science | 0 (0.0%) | 13 (100.0%) |
| Community & Social Service | 0 (0.0%) | 33 (100.0%) |
| Education, Arts & Media | 0 (0.0%) | 0 (0.0%) |
| Legal Services & Support | 0 (0.0%) | 0 (0.0%) |
| Education Instruction & Library | 0 (0.0%) | 33 (100.0%) |
| Arts, Media & Entertainment | 0 (0.0%) | 0 (0.0%) |
| Health Diagnosing & Treating | 0 (0.0%) | 0 (0.0%) |
| Health Technologists | 0 (0.0%) | 0 (0.0%) |
| Total (Category) | 38 (41.3%) | 54 (58.7%) |
| Total (Overall) | 69 (37.7%) | 114 (62.3%) |
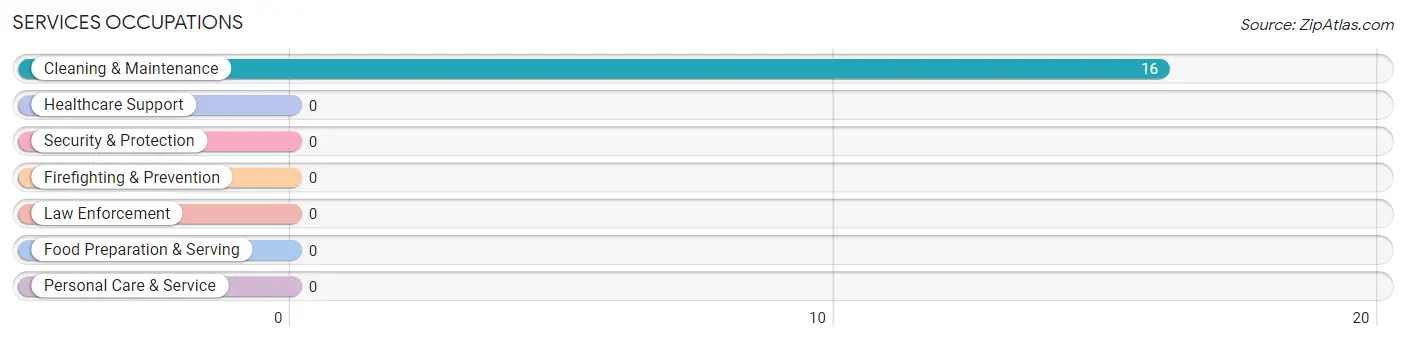
Services Occupations
The most common Services occupations in Custer are , and Cleaning & Maintenance (16 | 8.7%).
Services Occupations by Sex
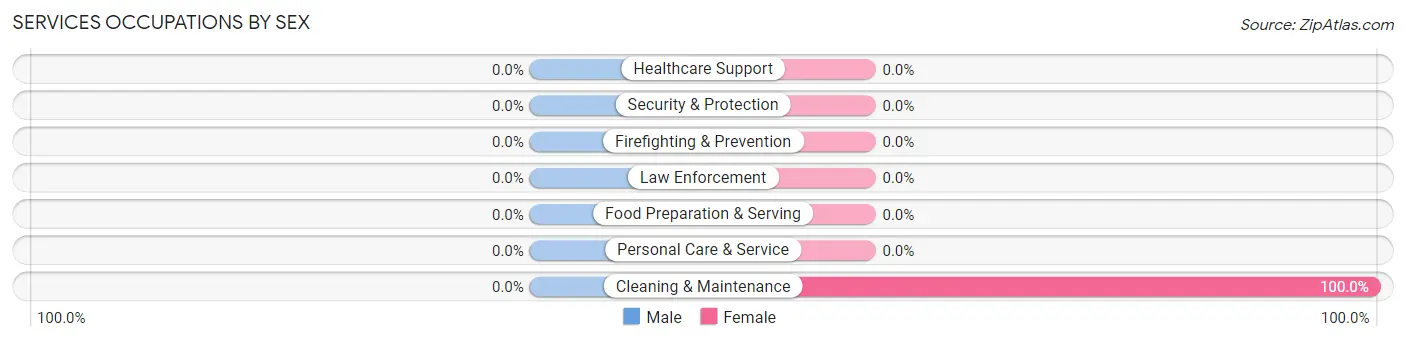
| Occupation | Male | Female |
| Healthcare Support | 0 (0.0%) | 0 (0.0%) |
| Security & Protection | 0 (0.0%) | 0 (0.0%) |
| Firefighting & Prevention | 0 (0.0%) | 0 (0.0%) |
| Law Enforcement | 0 (0.0%) | 0 (0.0%) |
| Food Preparation & Serving | 0 (0.0%) | 0 (0.0%) |
| Cleaning & Maintenance | 0 (0.0%) | 16 (100.0%) |
| Personal Care & Service | 0 (0.0%) | 0 (0.0%) |
| Total (Category) | 0 (0.0%) | 16 (100.0%) |
| Total (Overall) | 69 (37.7%) | 114 (62.3%) |
Sales and Office Occupations

Sales and Office Occupations by Sex

| Occupation | Male | Female |
| Sales & Related | 0 (0.0%) | 0 (0.0%) |
| Office & Administration | 0 (0.0%) | 0 (0.0%) |
| Total (Category) | 0 (0.0%) | 0 (0.0%) |
| Total (Overall) | 69 (37.7%) | 114 (62.3%) |
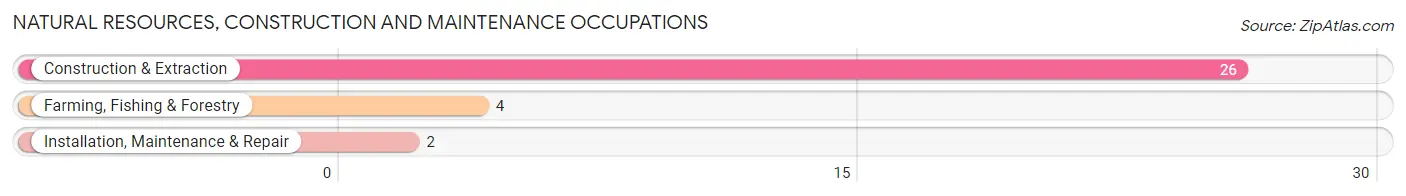
Natural Resources, Construction and Maintenance Occupations
The most common Natural Resources, Construction and Maintenance occupations in Custer are Construction & Extraction (26 | 14.2%), Farming, Fishing & Forestry (4 | 2.2%), and Installation, Maintenance & Repair (2 | 1.1%).
Natural Resources, Construction and Maintenance Occupations by Sex
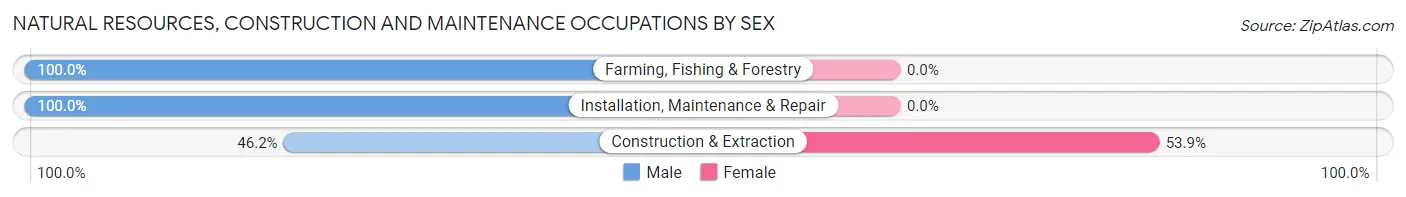
| Occupation | Male | Female |
| Farming, Fishing & Forestry | 4 (100.0%) | 0 (0.0%) |
| Construction & Extraction | 12 (46.2%) | 14 (53.8%) |
| Installation, Maintenance & Repair | 2 (100.0%) | 0 (0.0%) |
| Total (Category) | 18 (56.2%) | 14 (43.8%) |
| Total (Overall) | 69 (37.7%) | 114 (62.3%) |
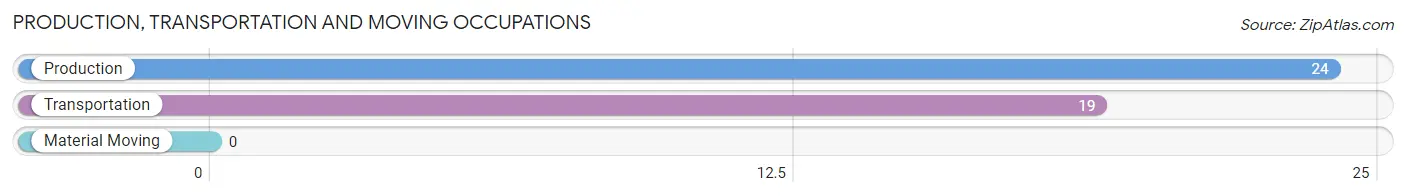
Production, Transportation and Moving Occupations
The most common Production, Transportation and Moving occupations in Custer are Production (24 | 13.1%), and Transportation (19 | 10.4%).
Production, Transportation and Moving Occupations by Sex
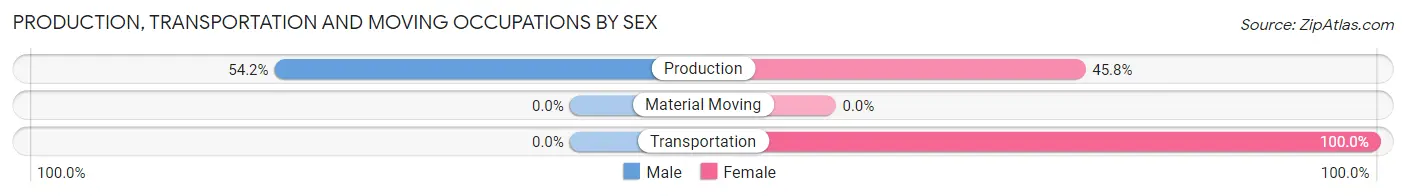
| Occupation | Male | Female |
| Production | 13 (54.2%) | 11 (45.8%) |
| Transportation | 0 (0.0%) | 19 (100.0%) |
| Material Moving | 0 (0.0%) | 0 (0.0%) |
| Total (Category) | 13 (30.2%) | 30 (69.8%) |
| Total (Overall) | 69 (37.7%) | 114 (62.3%) |
Employment Industries by Sex in Custer
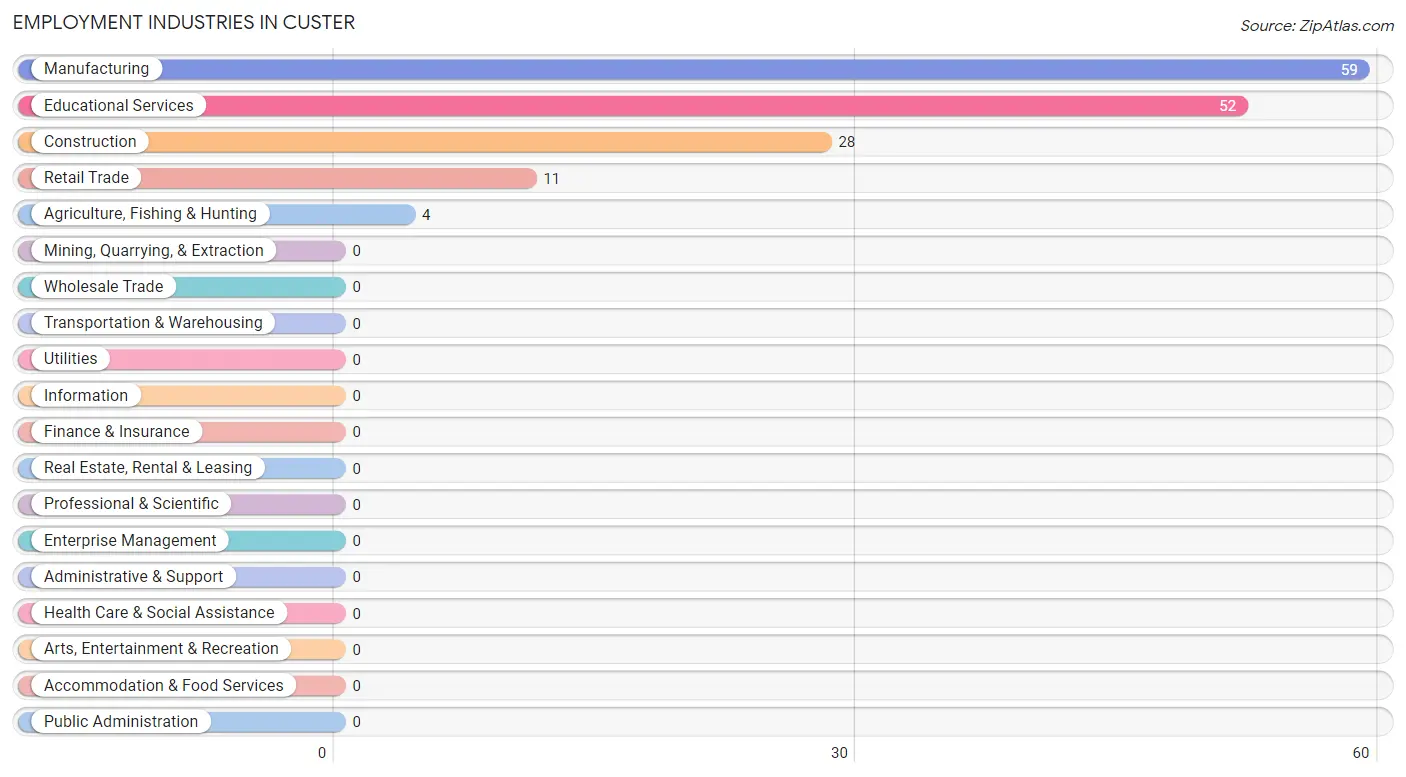
Employment Industries in Custer
The major employment industries in Custer include Manufacturing (59 | 32.2%), Educational Services (52 | 28.4%), Construction (28 | 15.3%), Retail Trade (11 | 6.0%), and Agriculture, Fishing & Hunting (4 | 2.2%).
Employment Industries by Sex in Custer
The Custer industries that see more men than women are Agriculture, Fishing & Hunting (100.0%), Manufacturing (86.4%), and Construction (50.0%), whereas the industries that tend to have a higher number of women are Retail Trade (100.0%), Educational Services (100.0%), and Construction (50.0%).
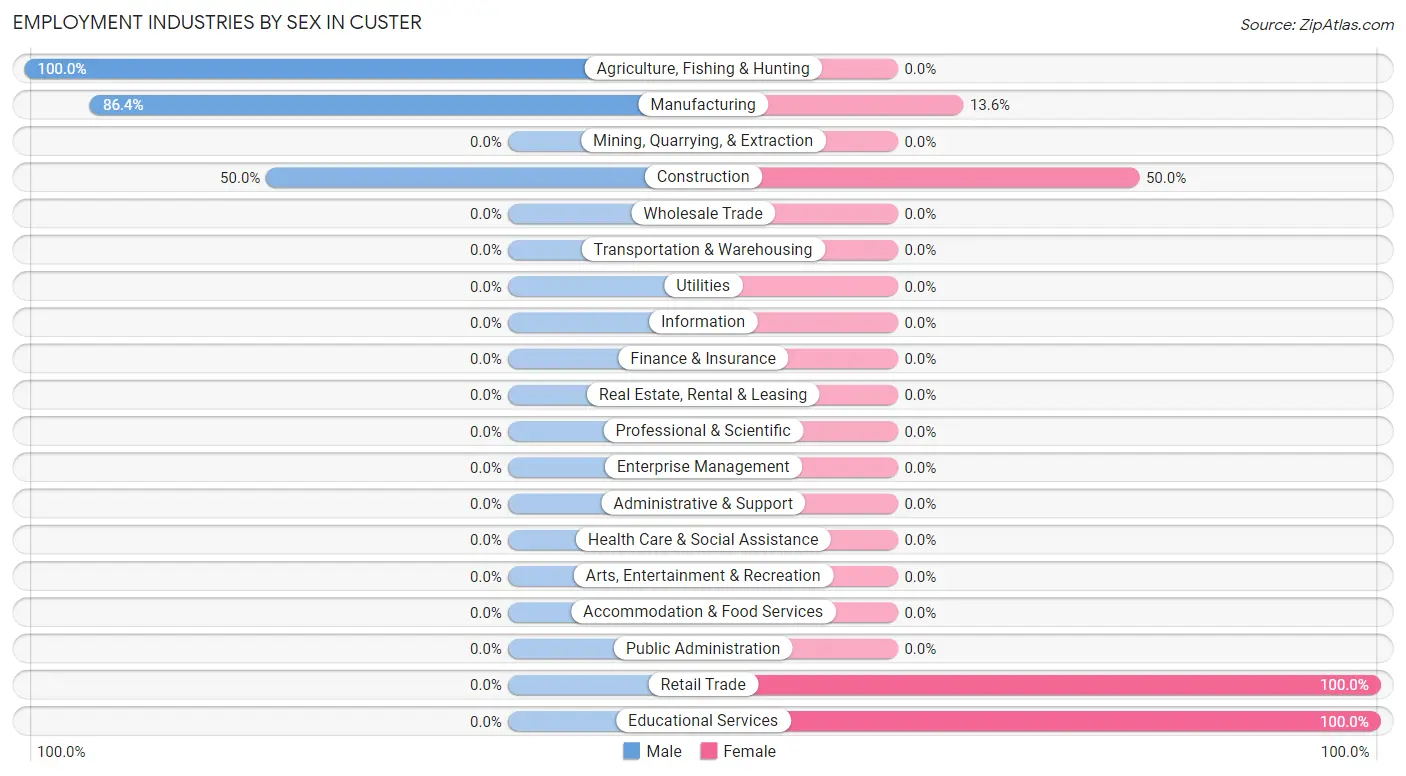
| Industry | Male | Female |
| Agriculture, Fishing & Hunting | 4 (100.0%) | 0 (0.0%) |
| Mining, Quarrying, & Extraction | 0 (0.0%) | 0 (0.0%) |
| Construction | 14 (50.0%) | 14 (50.0%) |
| Manufacturing | 51 (86.4%) | 8 (13.6%) |
| Wholesale Trade | 0 (0.0%) | 0 (0.0%) |
| Retail Trade | 0 (0.0%) | 11 (100.0%) |
| Transportation & Warehousing | 0 (0.0%) | 0 (0.0%) |
| Utilities | 0 (0.0%) | 0 (0.0%) |
| Information | 0 (0.0%) | 0 (0.0%) |
| Finance & Insurance | 0 (0.0%) | 0 (0.0%) |
| Real Estate, Rental & Leasing | 0 (0.0%) | 0 (0.0%) |
| Professional & Scientific | 0 (0.0%) | 0 (0.0%) |
| Enterprise Management | 0 (0.0%) | 0 (0.0%) |
| Administrative & Support | 0 (0.0%) | 0 (0.0%) |
| Educational Services | 0 (0.0%) | 52 (100.0%) |
| Health Care & Social Assistance | 0 (0.0%) | 0 (0.0%) |
| Arts, Entertainment & Recreation | 0 (0.0%) | 0 (0.0%) |
| Accommodation & Food Services | 0 (0.0%) | 0 (0.0%) |
| Public Administration | 0 (0.0%) | 0 (0.0%) |
| Total | 69 (37.7%) | 114 (62.3%) |
Education in Custer
School Enrollment in Custer
The most common levels of schooling among the 38 students in Custer are middle school (25 | 65.8%), and elementary school (13 | 34.2%).
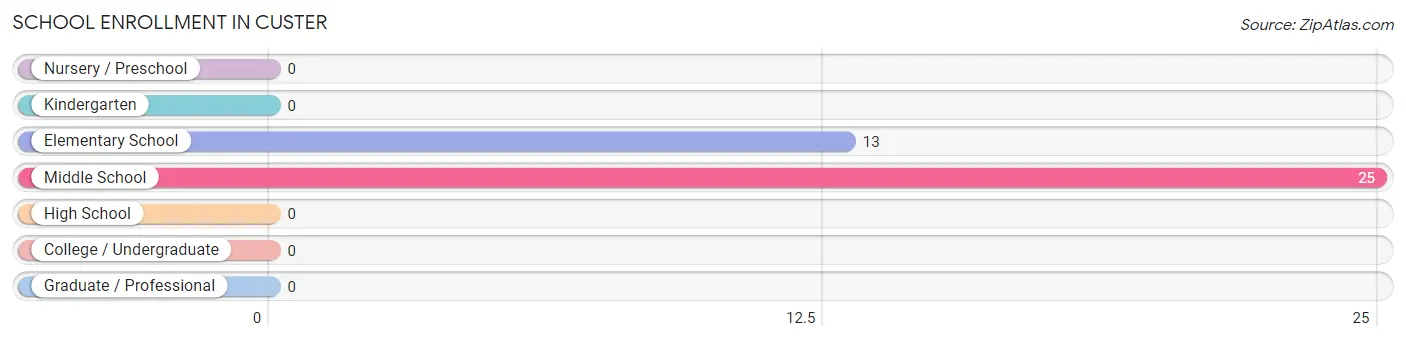
| School Level | # Students | % Students |
| Nursery / Preschool | 0 | 0.0% |
| Kindergarten | 0 | 0.0% |
| Elementary School | 13 | 34.2% |
| Middle School | 25 | 65.8% |
| High School | 0 | 0.0% |
| College / Undergraduate | 0 | 0.0% |
| Graduate / Professional | 0 | 0.0% |
| Total | 38 | 100.0% |
School Enrollment by Age by Funding Source in Custer
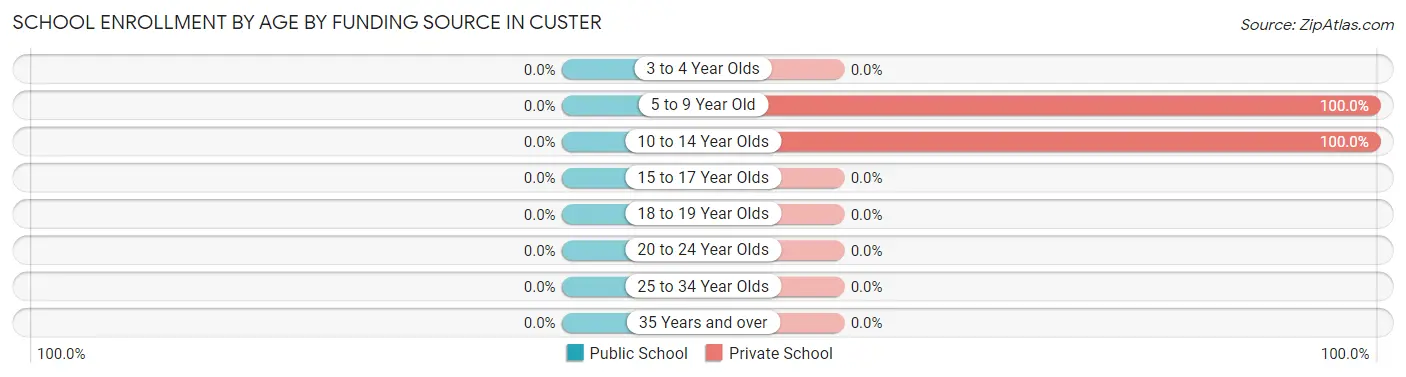
| Age Bracket | Public School | Private School |
| 3 to 4 Year Olds | 0 (0.0%) | 0 (0.0%) |
| 5 to 9 Year Old | 0 (0.0%) | 13 (100.0%) |
| 10 to 14 Year Olds | 0 (0.0%) | 25 (100.0%) |
| 15 to 17 Year Olds | 0 (0.0%) | 0 (0.0%) |
| 18 to 19 Year Olds | 0 (0.0%) | 0 (0.0%) |
| 20 to 24 Year Olds | 0 (0.0%) | 0 (0.0%) |
| 25 to 34 Year Olds | 0 (0.0%) | 0 (0.0%) |
| 35 Years and over | 0 (0.0%) | 0 (0.0%) |
| Total | 0 (0.0%) | 38 (100.0%) |
Educational Attainment by Field of Study in Custer
Visual & performing arts (33 | 33.0%), engineering (31 | 31.0%), liberal arts & history (24 | 24.0%), and business (12 | 12.0%) are the most common fields of study among 100 individuals in Custer who have obtained a bachelor's degree or higher.
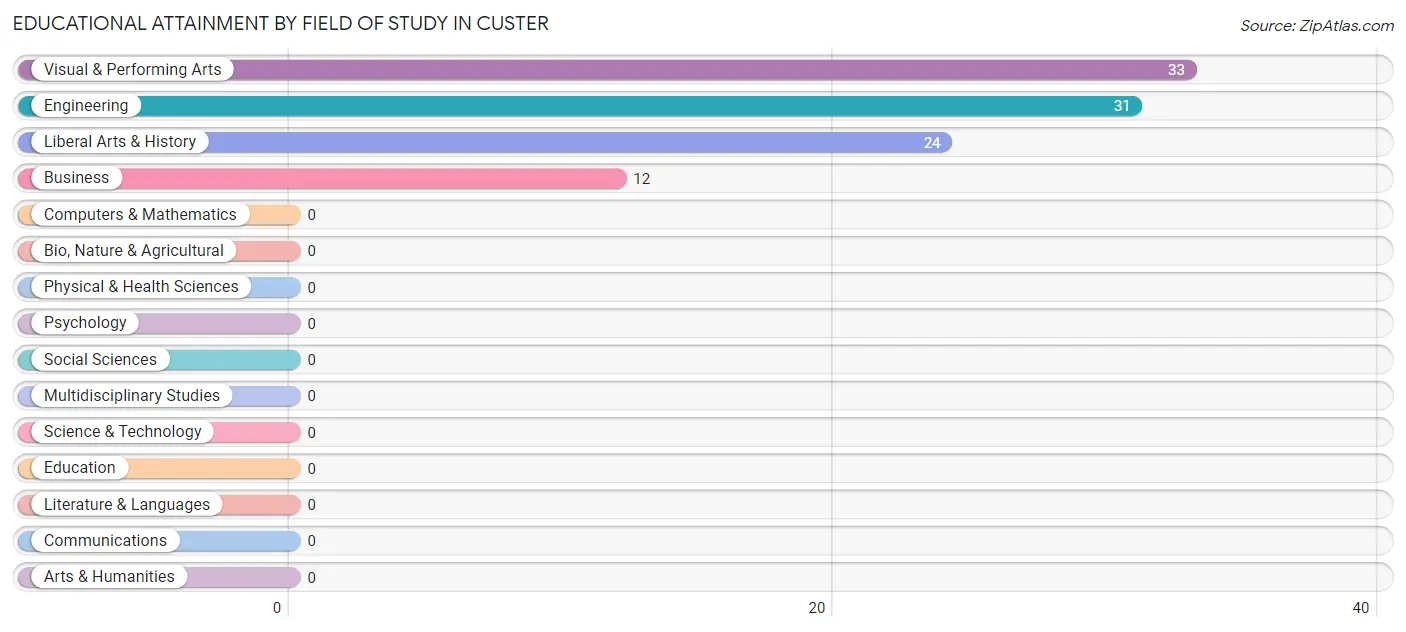
| Field of Study | # Graduates | % Graduates |
| Computers & Mathematics | 0 | 0.0% |
| Bio, Nature & Agricultural | 0 | 0.0% |
| Physical & Health Sciences | 0 | 0.0% |
| Psychology | 0 | 0.0% |
| Social Sciences | 0 | 0.0% |
| Engineering | 31 | 31.0% |
| Multidisciplinary Studies | 0 | 0.0% |
| Science & Technology | 0 | 0.0% |
| Business | 12 | 12.0% |
| Education | 0 | 0.0% |
| Literature & Languages | 0 | 0.0% |
| Liberal Arts & History | 24 | 24.0% |
| Visual & Performing Arts | 33 | 33.0% |
| Communications | 0 | 0.0% |
| Arts & Humanities | 0 | 0.0% |
| Total | 100 | 100.0% |
Transportation & Commute in Custer
Vehicle Availability by Sex in Custer
The most prevalent vehicle ownership categories in Custer are males with 4 vehicles (31, accounting for 44.9%) and females with 4 vehicles (33, making up 27.2%).
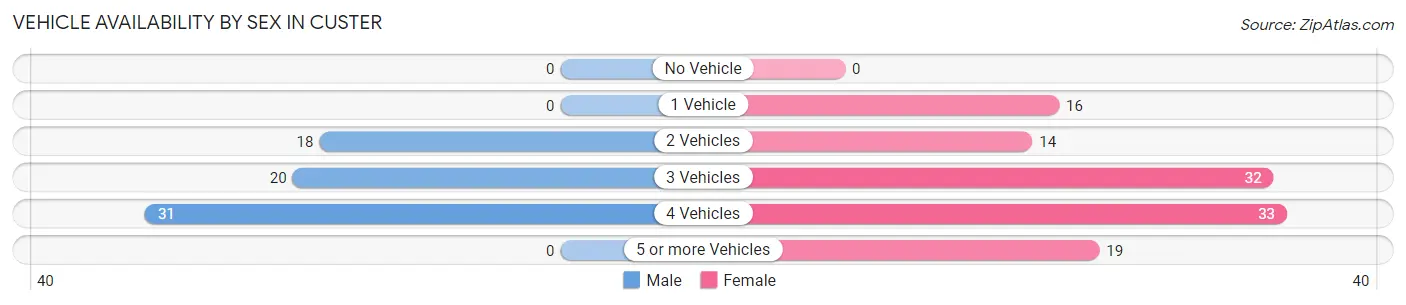
| Vehicles Available | Male | Female |
| No Vehicle | 0 (0.0%) | 0 (0.0%) |
| 1 Vehicle | 0 (0.0%) | 16 (14.0%) |
| 2 Vehicles | 18 (26.1%) | 14 (12.3%) |
| 3 Vehicles | 20 (29.0%) | 32 (28.1%) |
| 4 Vehicles | 31 (44.9%) | 33 (28.9%) |
| 5 or more Vehicles | 0 (0.0%) | 19 (16.7%) |
| Total | 69 (100.0%) | 114 (100.0%) |
Commute Time in Custer
The most frequently occuring commute durations in Custer are 15 to 19 minutes (87 commuters, 51.2%), 30 to 34 minutes (31 commuters, 18.2%), and 45 to 59 minutes (31 commuters, 18.2%).
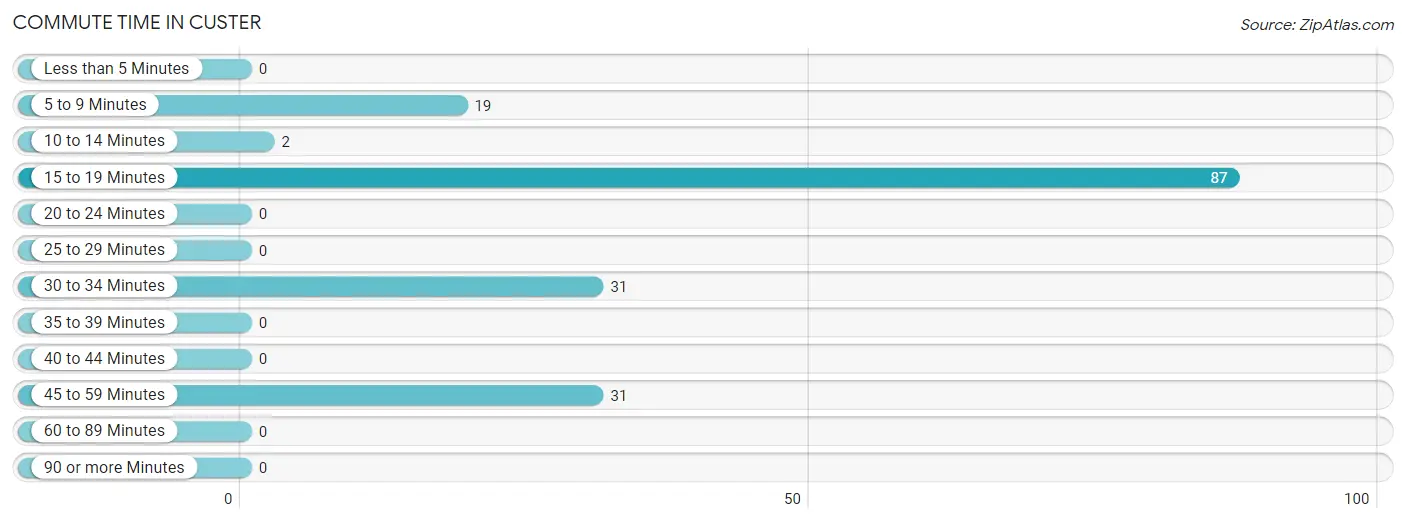
| Commute Time | # Commuters | % Commuters |
| Less than 5 Minutes | 0 | 0.0% |
| 5 to 9 Minutes | 19 | 11.2% |
| 10 to 14 Minutes | 2 | 1.2% |
| 15 to 19 Minutes | 87 | 51.2% |
| 20 to 24 Minutes | 0 | 0.0% |
| 25 to 29 Minutes | 0 | 0.0% |
| 30 to 34 Minutes | 31 | 18.2% |
| 35 to 39 Minutes | 0 | 0.0% |
| 40 to 44 Minutes | 0 | 0.0% |
| 45 to 59 Minutes | 31 | 18.2% |
| 60 to 89 Minutes | 0 | 0.0% |
| 90 or more Minutes | 0 | 0.0% |
Commute Time by Sex in Custer
The most common commute times in Custer are 45 to 59 minutes (31 commuters, 44.9%) for males and 15 to 19 minutes (68 commuters, 67.3%) for females.
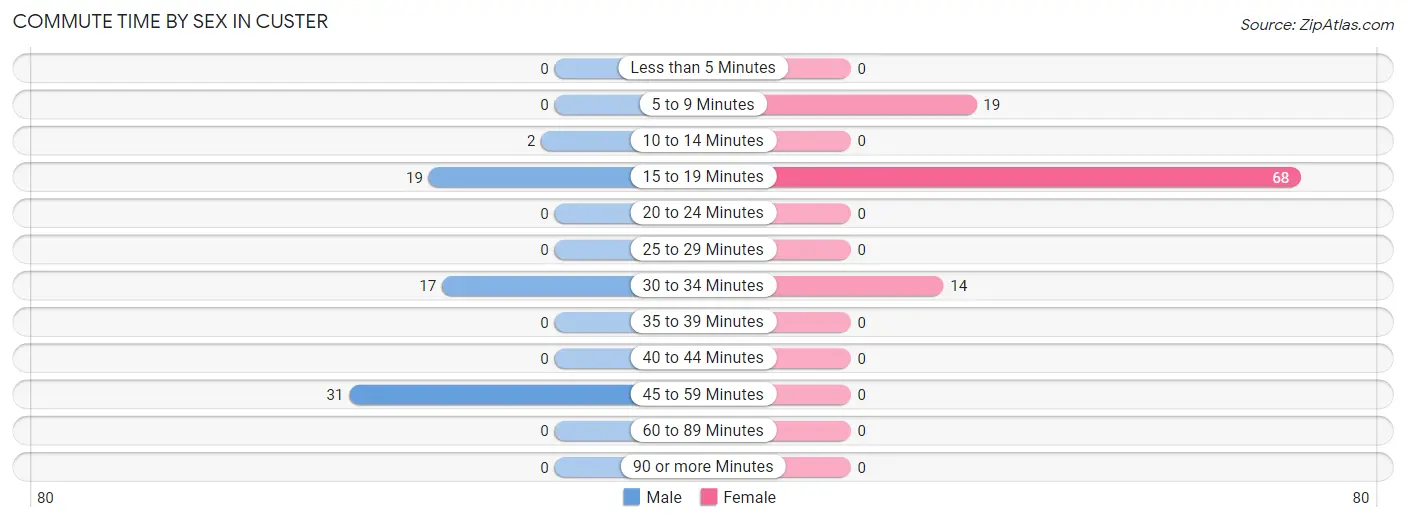
| Commute Time | Male | Female |
| Less than 5 Minutes | 0 (0.0%) | 0 (0.0%) |
| 5 to 9 Minutes | 0 (0.0%) | 19 (18.8%) |
| 10 to 14 Minutes | 2 (2.9%) | 0 (0.0%) |
| 15 to 19 Minutes | 19 (27.5%) | 68 (67.3%) |
| 20 to 24 Minutes | 0 (0.0%) | 0 (0.0%) |
| 25 to 29 Minutes | 0 (0.0%) | 0 (0.0%) |
| 30 to 34 Minutes | 17 (24.6%) | 14 (13.9%) |
| 35 to 39 Minutes | 0 (0.0%) | 0 (0.0%) |
| 40 to 44 Minutes | 0 (0.0%) | 0 (0.0%) |
| 45 to 59 Minutes | 31 (44.9%) | 0 (0.0%) |
| 60 to 89 Minutes | 0 (0.0%) | 0 (0.0%) |
| 90 or more Minutes | 0 (0.0%) | 0 (0.0%) |
Time of Departure to Work by Sex in Custer
The most frequent times of departure to work in Custer are 6:00 AM to 6:29 AM (33, 47.8%) for males and 6:30 AM to 6:59 AM (44, 43.6%) for females.
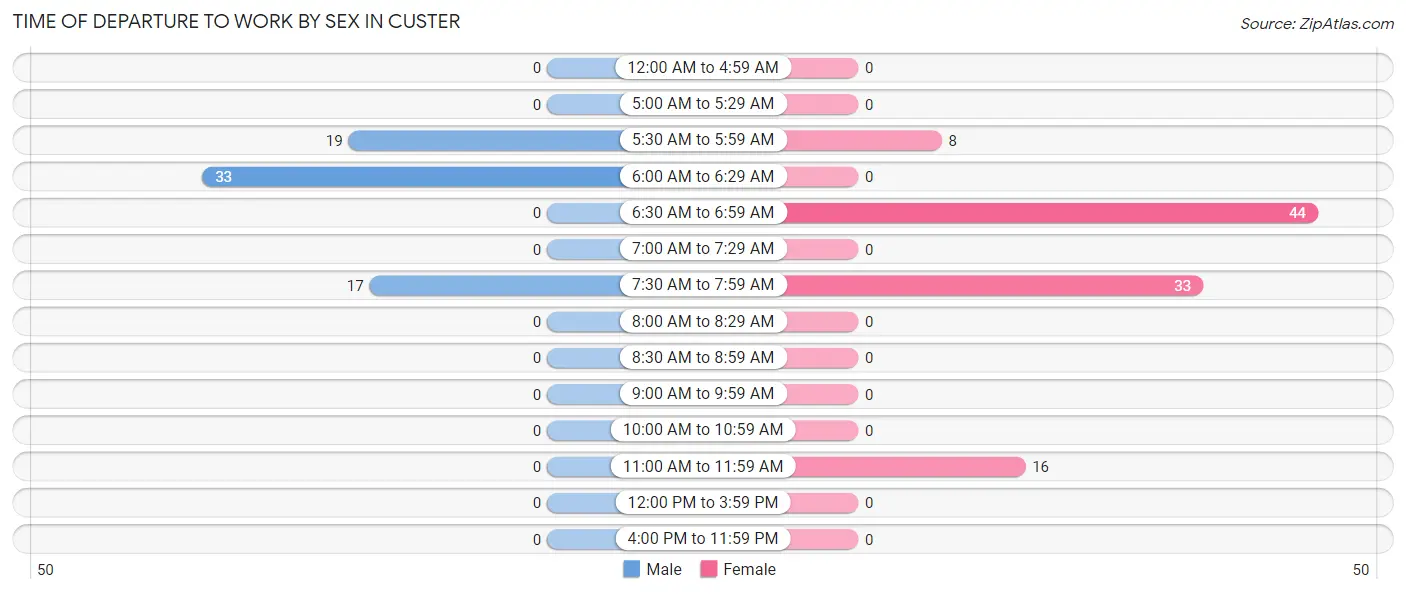
| Time of Departure | Male | Female |
| 12:00 AM to 4:59 AM | 0 (0.0%) | 0 (0.0%) |
| 5:00 AM to 5:29 AM | 0 (0.0%) | 0 (0.0%) |
| 5:30 AM to 5:59 AM | 19 (27.5%) | 8 (7.9%) |
| 6:00 AM to 6:29 AM | 33 (47.8%) | 0 (0.0%) |
| 6:30 AM to 6:59 AM | 0 (0.0%) | 44 (43.6%) |
| 7:00 AM to 7:29 AM | 0 (0.0%) | 0 (0.0%) |
| 7:30 AM to 7:59 AM | 17 (24.6%) | 33 (32.7%) |
| 8:00 AM to 8:29 AM | 0 (0.0%) | 0 (0.0%) |
| 8:30 AM to 8:59 AM | 0 (0.0%) | 0 (0.0%) |
| 9:00 AM to 9:59 AM | 0 (0.0%) | 0 (0.0%) |
| 10:00 AM to 10:59 AM | 0 (0.0%) | 0 (0.0%) |
| 11:00 AM to 11:59 AM | 0 (0.0%) | 16 (15.8%) |
| 12:00 PM to 3:59 PM | 0 (0.0%) | 0 (0.0%) |
| 4:00 PM to 11:59 PM | 0 (0.0%) | 0 (0.0%) |
| Total | 69 (100.0%) | 101 (100.0%) |
Housing Occupancy in Custer
Occupancy by Ownership in Custer
Of the total 131 dwellings in Custer, owner-occupied units account for 111 (84.7%), while renter-occupied units make up 20 (15.3%).
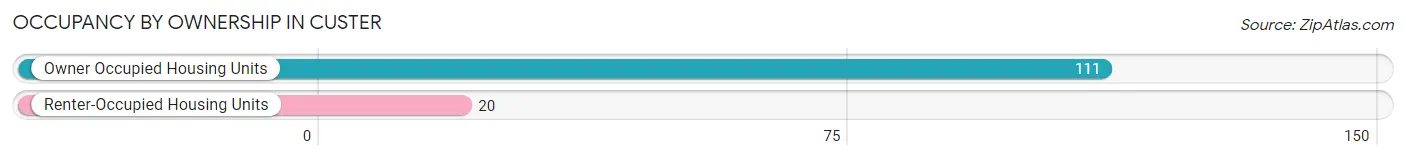
| Occupancy | # Housing Units | % Housing Units |
| Owner Occupied Housing Units | 111 | 84.7% |
| Renter-Occupied Housing Units | 20 | 15.3% |
| Total Occupied Housing Units | 131 | 100.0% |
Occupancy by Household Size in Custer
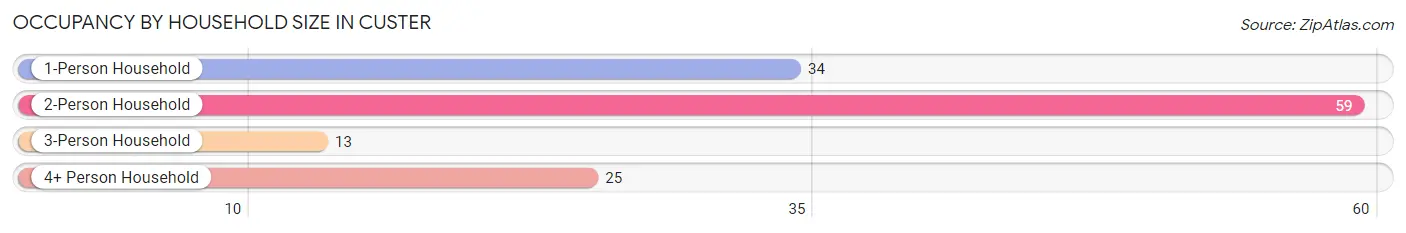
| Household Size | # Housing Units | % Housing Units |
| 1-Person Household | 34 | 26.0% |
| 2-Person Household | 59 | 45.0% |
| 3-Person Household | 13 | 9.9% |
| 4+ Person Household | 25 | 19.1% |
| Total Housing Units | 131 | 100.0% |
Occupancy by Ownership by Household Size in Custer
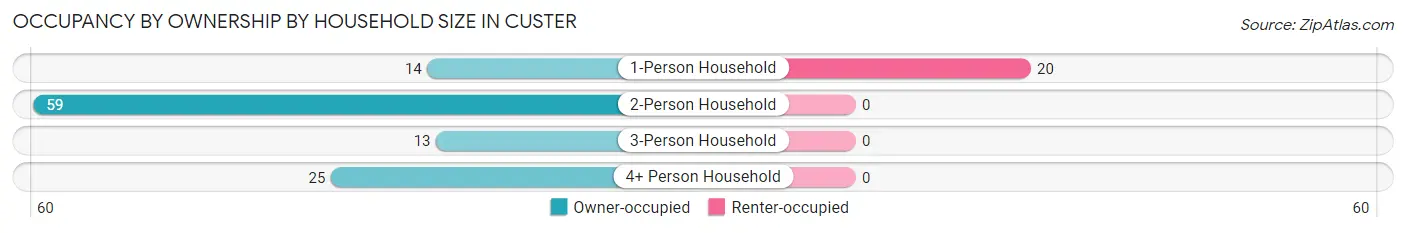
| Household Size | Owner-occupied | Renter-occupied |
| 1-Person Household | 14 (41.2%) | 20 (58.8%) |
| 2-Person Household | 59 (100.0%) | 0 (0.0%) |
| 3-Person Household | 13 (100.0%) | 0 (0.0%) |
| 4+ Person Household | 25 (100.0%) | 0 (0.0%) |
| Total Housing Units | 111 (84.7%) | 20 (15.3%) |
Occupancy by Educational Attainment in Custer
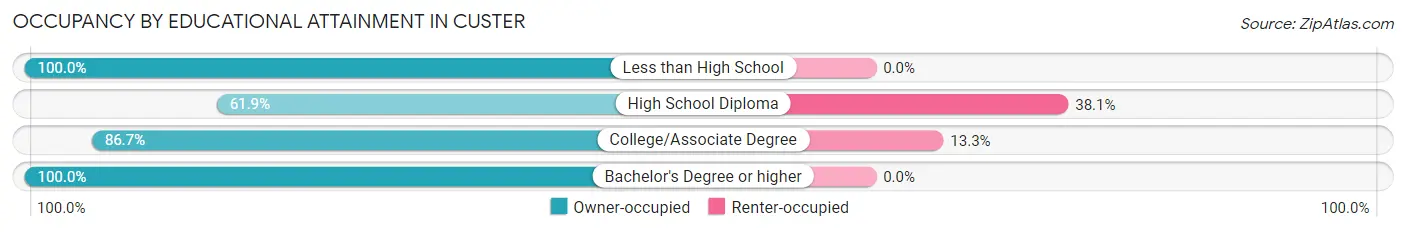
| Household Size | Owner-occupied | Renter-occupied |
| Less than High School | 14 (100.0%) | 0 (0.0%) |
| High School Diploma | 26 (61.9%) | 16 (38.1%) |
| College/Associate Degree | 26 (86.7%) | 4 (13.3%) |
| Bachelor's Degree or higher | 45 (100.0%) | 0 (0.0%) |
Occupancy by Age of Householder in Custer
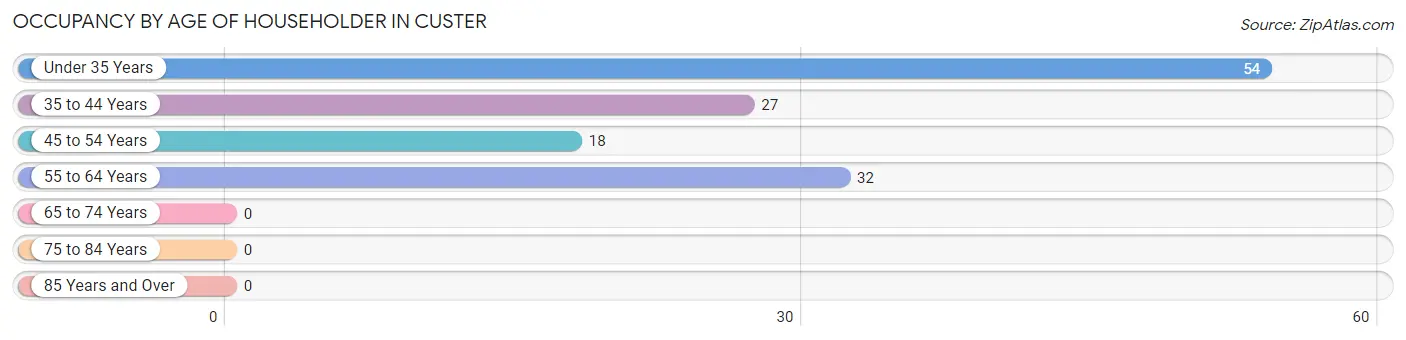
| Age Bracket | # Households | % Households |
| Under 35 Years | 54 | 41.2% |
| 35 to 44 Years | 27 | 20.6% |
| 45 to 54 Years | 18 | 13.7% |
| 55 to 64 Years | 32 | 24.4% |
| 65 to 74 Years | 0 | 0.0% |
| 75 to 84 Years | 0 | 0.0% |
| 85 Years and Over | 0 | 0.0% |
| Total | 131 | 100.0% |
Housing Finances in Custer
Median Income by Occupancy in Custer
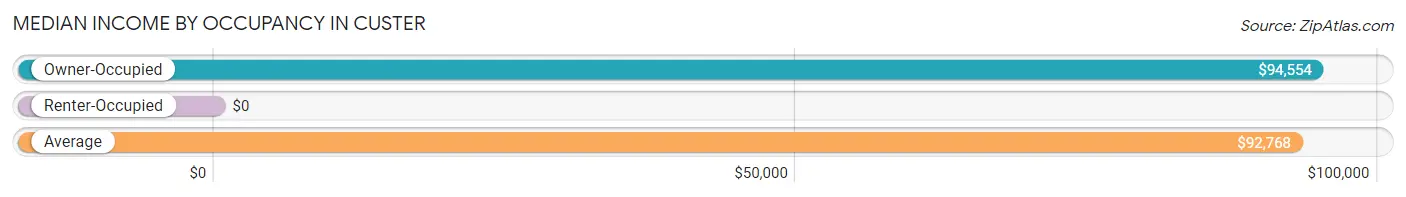
| Occupancy Type | # Households | Median Income |
| Owner-Occupied | 111 (84.7%) | $94,554 |
| Renter-Occupied | 20 (15.3%) | $0 |
| Average | 131 (100.0%) | $92,768 |
Occupancy by Householder Income Bracket in Custer
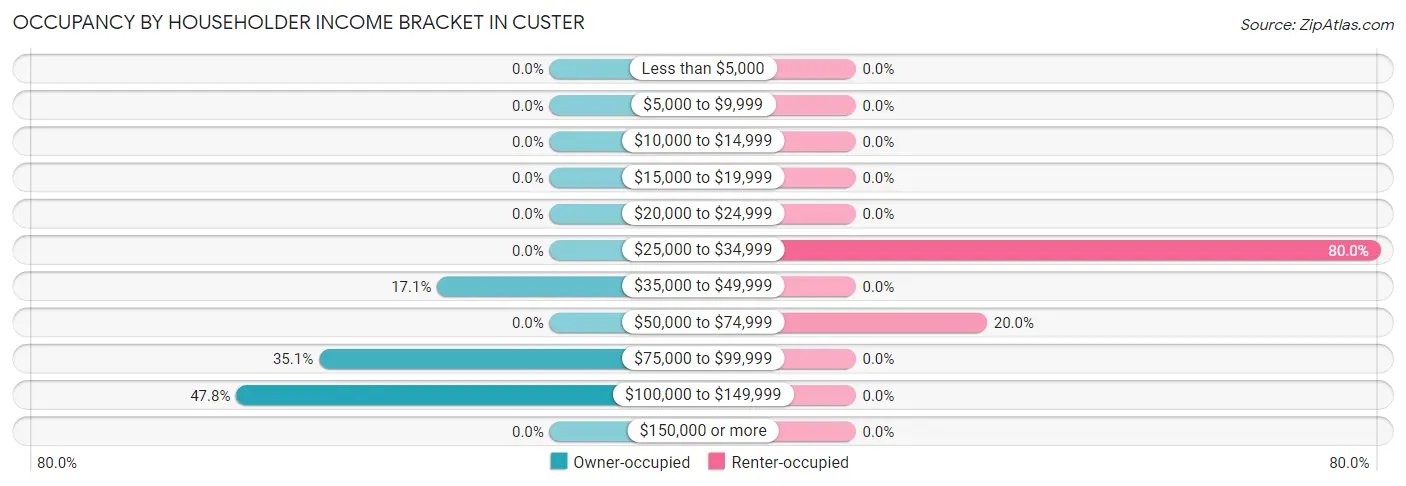
| Income Bracket | Owner-occupied | Renter-occupied |
| Less than $5,000 | 0 (0.0%) | 0 (0.0%) |
| $5,000 to $9,999 | 0 (0.0%) | 0 (0.0%) |
| $10,000 to $14,999 | 0 (0.0%) | 0 (0.0%) |
| $15,000 to $19,999 | 0 (0.0%) | 0 (0.0%) |
| $20,000 to $24,999 | 0 (0.0%) | 0 (0.0%) |
| $25,000 to $34,999 | 0 (0.0%) | 16 (80.0%) |
| $35,000 to $49,999 | 19 (17.1%) | 0 (0.0%) |
| $50,000 to $74,999 | 0 (0.0%) | 4 (20.0%) |
| $75,000 to $99,999 | 39 (35.1%) | 0 (0.0%) |
| $100,000 to $149,999 | 53 (47.7%) | 0 (0.0%) |
| $150,000 or more | 0 (0.0%) | 0 (0.0%) |
| Total | 111 (100.0%) | 20 (100.0%) |
Monthly Housing Cost Tiers in Custer
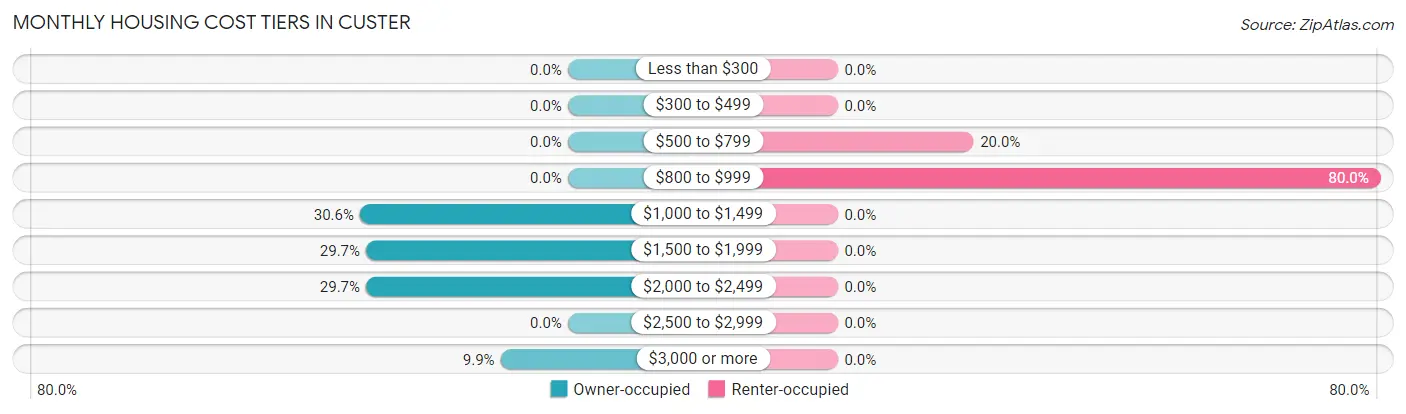
| Monthly Cost | Owner-occupied | Renter-occupied |
| Less than $300 | 0 (0.0%) | 0 (0.0%) |
| $300 to $499 | 0 (0.0%) | 0 (0.0%) |
| $500 to $799 | 0 (0.0%) | 4 (20.0%) |
| $800 to $999 | 0 (0.0%) | 16 (80.0%) |
| $1,000 to $1,499 | 34 (30.6%) | 0 (0.0%) |
| $1,500 to $1,999 | 33 (29.7%) | 0 (0.0%) |
| $2,000 to $2,499 | 33 (29.7%) | 0 (0.0%) |
| $2,500 to $2,999 | 0 (0.0%) | 0 (0.0%) |
| $3,000 or more | 11 (9.9%) | 0 (0.0%) |
| Total | 111 (100.0%) | 20 (100.0%) |
Physical Housing Characteristics in Custer
Housing Structures in Custer
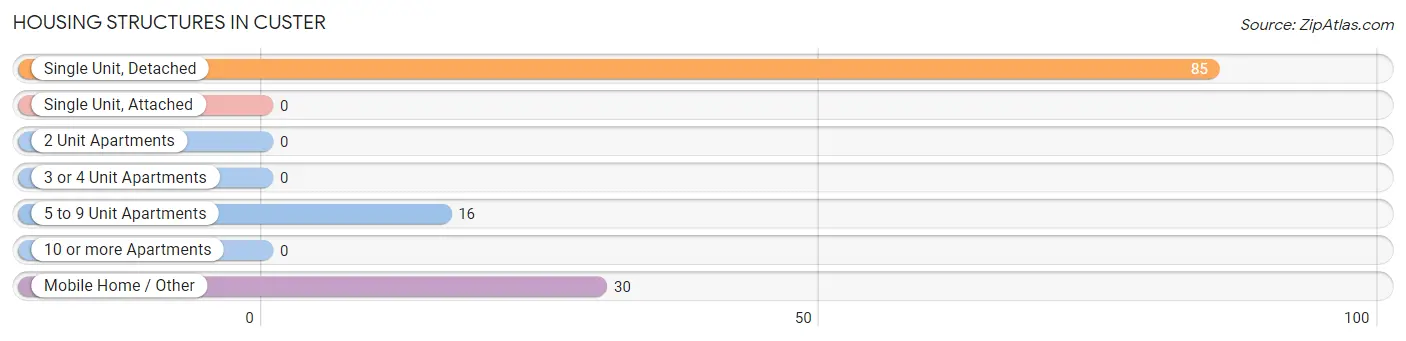
| Structure Type | # Housing Units | % Housing Units |
| Single Unit, Detached | 85 | 64.9% |
| Single Unit, Attached | 0 | 0.0% |
| 2 Unit Apartments | 0 | 0.0% |
| 3 or 4 Unit Apartments | 0 | 0.0% |
| 5 to 9 Unit Apartments | 16 | 12.2% |
| 10 or more Apartments | 0 | 0.0% |
| Mobile Home / Other | 30 | 22.9% |
| Total | 131 | 100.0% |
Housing Structures by Occupancy in Custer
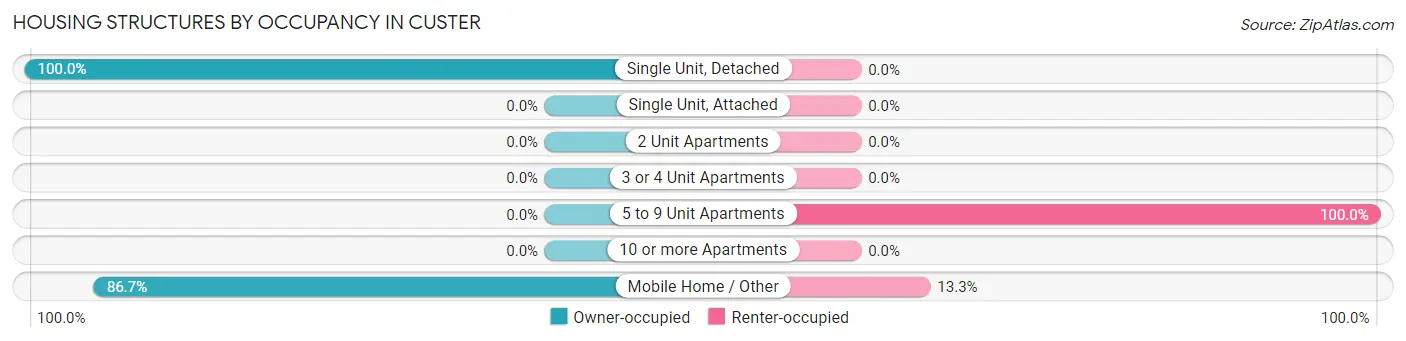
| Structure Type | Owner-occupied | Renter-occupied |
| Single Unit, Detached | 85 (100.0%) | 0 (0.0%) |
| Single Unit, Attached | 0 (0.0%) | 0 (0.0%) |
| 2 Unit Apartments | 0 (0.0%) | 0 (0.0%) |
| 3 or 4 Unit Apartments | 0 (0.0%) | 0 (0.0%) |
| 5 to 9 Unit Apartments | 0 (0.0%) | 16 (100.0%) |
| 10 or more Apartments | 0 (0.0%) | 0 (0.0%) |
| Mobile Home / Other | 26 (86.7%) | 4 (13.3%) |
| Total | 111 (84.7%) | 20 (15.3%) |
Housing Structures by Number of Rooms in Custer
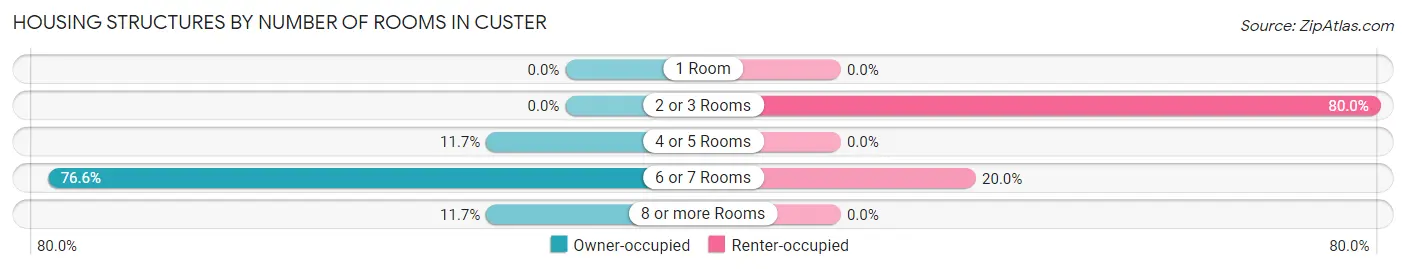
| Number of Rooms | Owner-occupied | Renter-occupied |
| 1 Room | 0 (0.0%) | 0 (0.0%) |
| 2 or 3 Rooms | 0 (0.0%) | 16 (80.0%) |
| 4 or 5 Rooms | 13 (11.7%) | 0 (0.0%) |
| 6 or 7 Rooms | 85 (76.6%) | 4 (20.0%) |
| 8 or more Rooms | 13 (11.7%) | 0 (0.0%) |
| Total | 111 (100.0%) | 20 (100.0%) |
Housing Structure by Heating Type in Custer
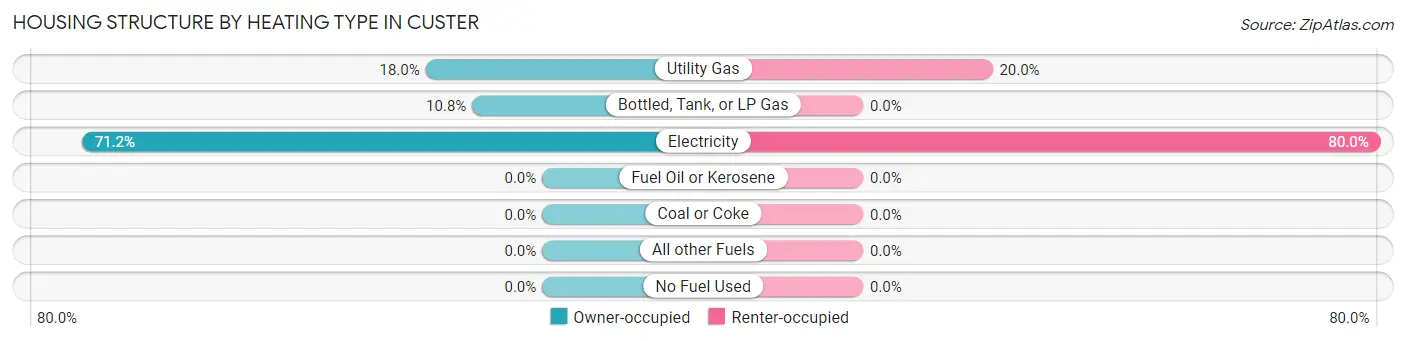
| Heating Type | Owner-occupied | Renter-occupied |
| Utility Gas | 20 (18.0%) | 4 (20.0%) |
| Bottled, Tank, or LP Gas | 12 (10.8%) | 0 (0.0%) |
| Electricity | 79 (71.2%) | 16 (80.0%) |
| Fuel Oil or Kerosene | 0 (0.0%) | 0 (0.0%) |
| Coal or Coke | 0 (0.0%) | 0 (0.0%) |
| All other Fuels | 0 (0.0%) | 0 (0.0%) |
| No Fuel Used | 0 (0.0%) | 0 (0.0%) |
| Total | 111 (100.0%) | 20 (100.0%) |
Household Vehicle Usage in Custer
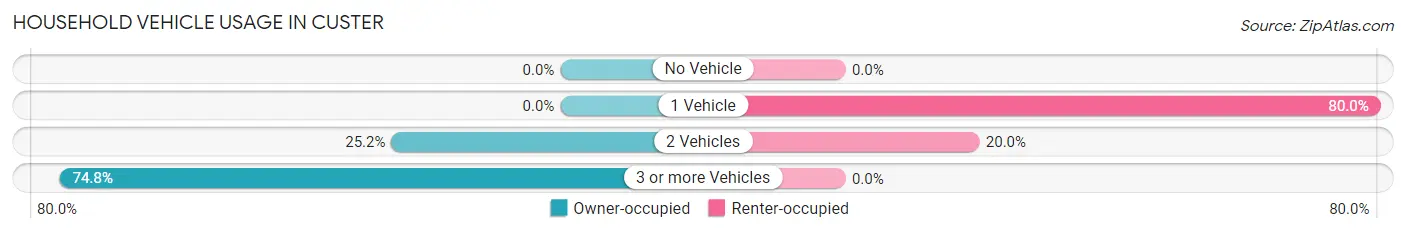
| Vehicles per Household | Owner-occupied | Renter-occupied |
| No Vehicle | 0 (0.0%) | 0 (0.0%) |
| 1 Vehicle | 0 (0.0%) | 16 (80.0%) |
| 2 Vehicles | 28 (25.2%) | 4 (20.0%) |
| 3 or more Vehicles | 83 (74.8%) | 0 (0.0%) |
| Total | 111 (100.0%) | 20 (100.0%) |
Real Estate & Mortgages in Custer
Real Estate and Mortgage Overview in Custer
| Characteristic | Without Mortgage | With Mortgage |
| Housing Units | 0 | 111 |
| Median Property Value | - | - |
| Median Household Income | - | - |
| Monthly Housing Costs | - | - |
| Real Estate Taxes | - | - |
Property Value by Mortgage Status in Custer
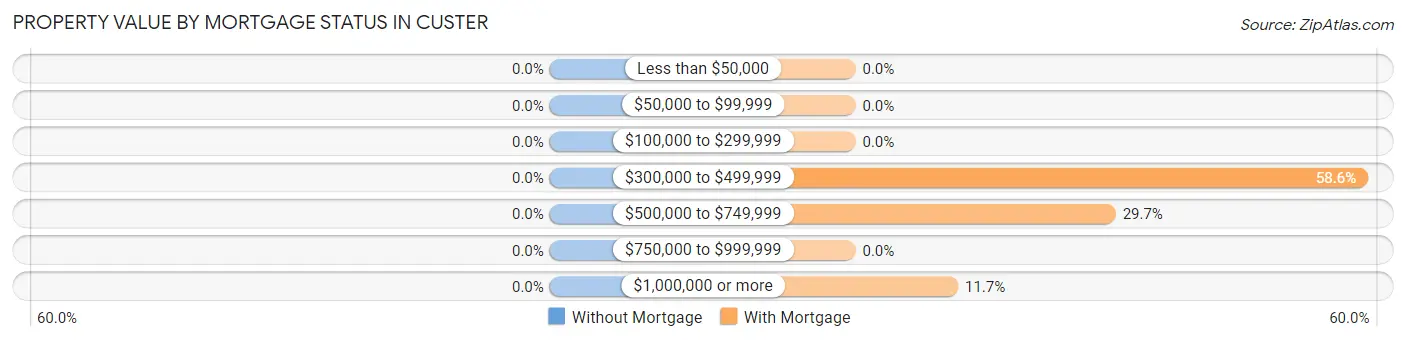
| Property Value | Without Mortgage | With Mortgage |
| Less than $50,000 | 0 (0.0%) | 0 (0.0%) |
| $50,000 to $99,999 | 0 (0.0%) | 0 (0.0%) |
| $100,000 to $299,999 | 0 (0.0%) | 0 (0.0%) |
| $300,000 to $499,999 | 0 (0.0%) | 65 (58.6%) |
| $500,000 to $749,999 | 0 (0.0%) | 33 (29.7%) |
| $750,000 to $999,999 | 0 (0.0%) | 0 (0.0%) |
| $1,000,000 or more | 0 (0.0%) | 13 (11.7%) |
| Total | 0 (0.0%) | 111 (100.0%) |
Household Income by Mortgage Status in Custer
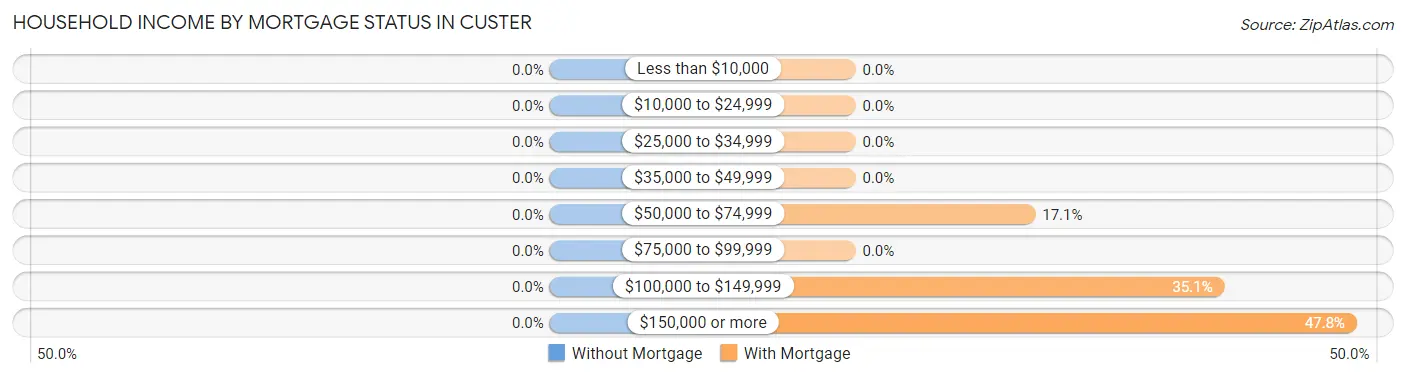
| Household Income | Without Mortgage | With Mortgage |
| Less than $10,000 | 0 (0.0%) | 0 (0.0%) |
| $10,000 to $24,999 | 0 (0.0%) | 0 (0.0%) |
| $25,000 to $34,999 | 0 (0.0%) | 0 (0.0%) |
| $35,000 to $49,999 | 0 (0.0%) | 0 (0.0%) |
| $50,000 to $74,999 | 0 (0.0%) | 19 (17.1%) |
| $75,000 to $99,999 | 0 (0.0%) | 0 (0.0%) |
| $100,000 to $149,999 | 0 (0.0%) | 39 (35.1%) |
| $150,000 or more | 0 (0.0%) | 53 (47.7%) |
| Total | 0 (0.0%) | 111 (100.0%) |
Property Value to Household Income Ratio in Custer
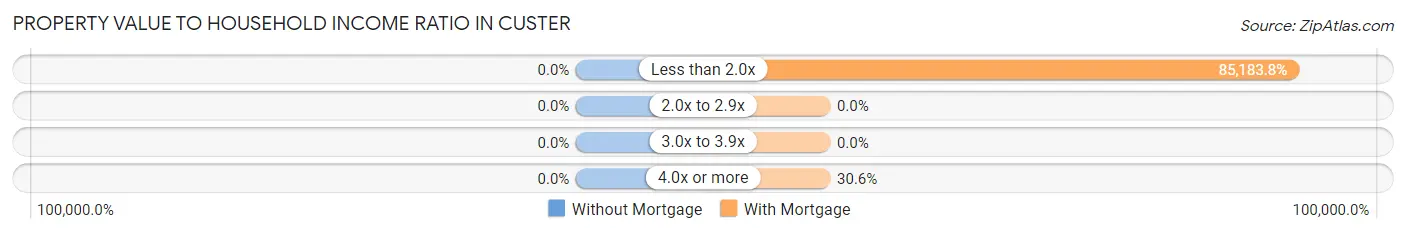
| Value-to-Income Ratio | Without Mortgage | With Mortgage |
| Less than 2.0x | 0 (0.0%) | 94,554 (85,183.8%) |
| 2.0x to 2.9x | 0 (0.0%) | 0 (0.0%) |
| 3.0x to 3.9x | 0 (0.0%) | 0 (0.0%) |
| 4.0x or more | 0 (0.0%) | 34 (30.6%) |
| Total | 0 (0.0%) | 111 (100.0%) |
Real Estate Taxes by Mortgage Status in Custer
| Property Taxes | Without Mortgage | With Mortgage |
| Less than $800 | 0 (0.0%) | 0 (0.0%) |
| $800 to $1,499 | 0 (0.0%) | 0 (0.0%) |
| $800 to $1,499 | 0 (0.0%) | 0 (0.0%) |
| Total | 0 (0.0%) | 111 (100.0%) |
Health & Disability in Custer
Health Insurance Coverage by Age in Custer
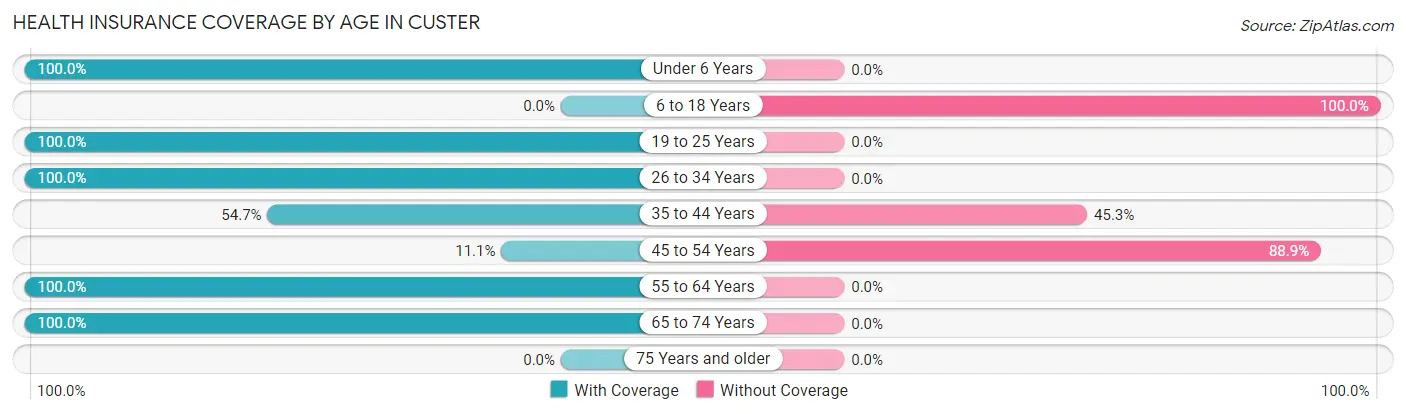
| Age Bracket | With Coverage | Without Coverage |
| Under 6 Years | 20 (100.0%) | 0 (0.0%) |
| 6 to 18 Years | 0 (0.0%) | 38 (100.0%) |
| 19 to 25 Years | 14 (100.0%) | 0 (0.0%) |
| 26 to 34 Years | 93 (100.0%) | 0 (0.0%) |
| 35 to 44 Years | 29 (54.7%) | 24 (45.3%) |
| 45 to 54 Years | 2 (11.1%) | 16 (88.9%) |
| 55 to 64 Years | 43 (100.0%) | 0 (0.0%) |
| 65 to 74 Years | 22 (100.0%) | 0 (0.0%) |
| 75 Years and older | 0 (0.0%) | 0 (0.0%) |
| Total | 223 (74.1%) | 78 (25.9%) |
Health Insurance Coverage by Citizenship Status in Custer
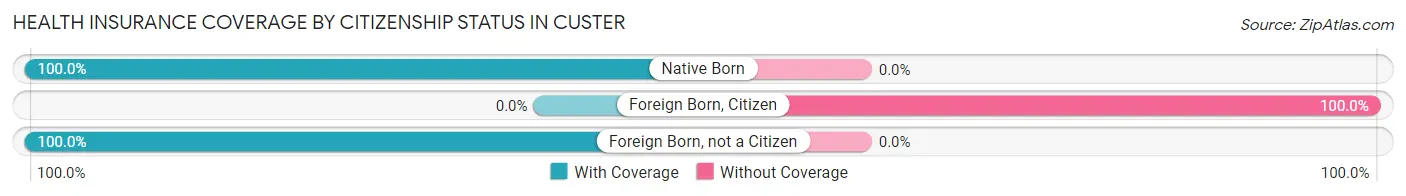
| Citizenship Status | With Coverage | Without Coverage |
| Native Born | 20 (100.0%) | 0 (0.0%) |
| Foreign Born, Citizen | 0 (0.0%) | 38 (100.0%) |
| Foreign Born, not a Citizen | 14 (100.0%) | 0 (0.0%) |
Health Insurance Coverage by Household Income in Custer
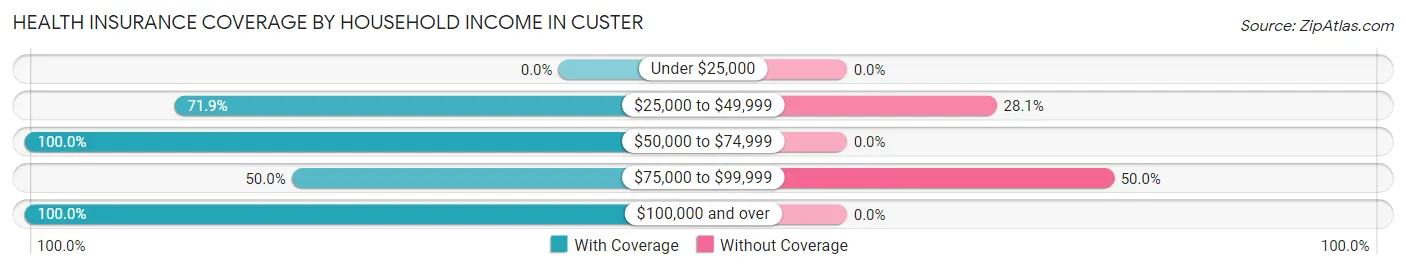
| Household Income | With Coverage | Without Coverage |
| Under $25,000 | 0 (0.0%) | 0 (0.0%) |
| $25,000 to $49,999 | 41 (71.9%) | 16 (28.1%) |
| $50,000 to $74,999 | 4 (100.0%) | 0 (0.0%) |
| $75,000 to $99,999 | 62 (50.0%) | 62 (50.0%) |
| $100,000 and over | 116 (100.0%) | 0 (0.0%) |
Public vs Private Health Insurance Coverage by Age in Custer
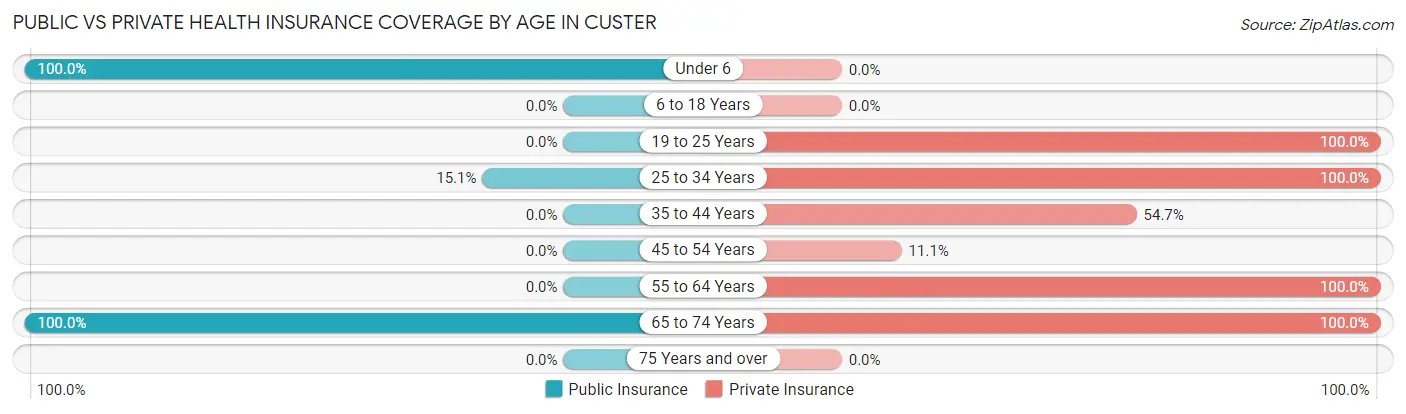
| Age Bracket | Public Insurance | Private Insurance |
| Under 6 | 20 (100.0%) | 0 (0.0%) |
| 6 to 18 Years | 0 (0.0%) | 0 (0.0%) |
| 19 to 25 Years | 0 (0.0%) | 14 (100.0%) |
| 25 to 34 Years | 14 (15.0%) | 93 (100.0%) |
| 35 to 44 Years | 0 (0.0%) | 29 (54.7%) |
| 45 to 54 Years | 0 (0.0%) | 2 (11.1%) |
| 55 to 64 Years | 0 (0.0%) | 43 (100.0%) |
| 65 to 74 Years | 22 (100.0%) | 22 (100.0%) |
| 75 Years and over | 0 (0.0%) | 0 (0.0%) |
| Total | 56 (18.6%) | 203 (67.4%) |
Disability Status by Sex by Age in Custer
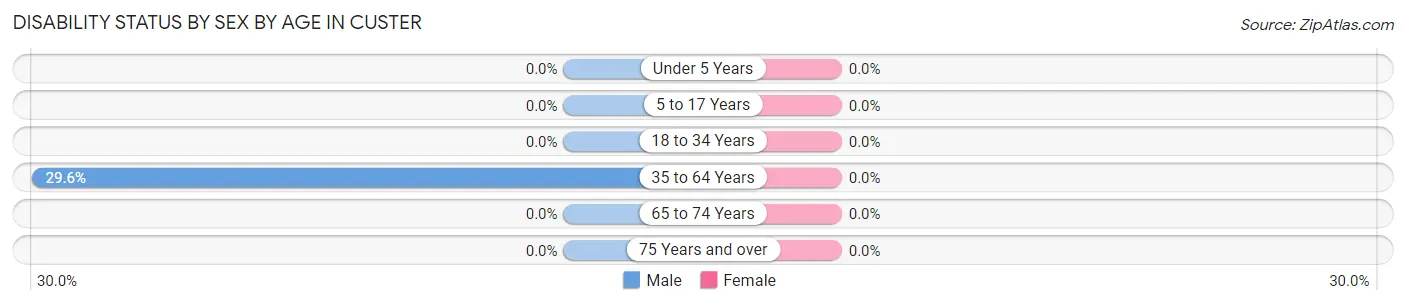
| Age Bracket | Male | Female |
| Under 5 Years | 0 (0.0%) | 0 (0.0%) |
| 5 to 17 Years | 0 (0.0%) | 0 (0.0%) |
| 18 to 34 Years | 0 (0.0%) | 0 (0.0%) |
| 35 to 64 Years | 13 (29.5%) | 0 (0.0%) |
| 65 to 74 Years | 0 (0.0%) | 0 (0.0%) |
| 75 Years and over | 0 (0.0%) | 0 (0.0%) |
Disability Class by Sex by Age in Custer
Disability Class: Hearing Difficulty

| Age Bracket | Male | Female |
| Under 5 Years | 0 (0.0%) | 0 (0.0%) |
| 5 to 17 Years | 0 (0.0%) | 0 (0.0%) |
| 18 to 34 Years | 0 (0.0%) | 0 (0.0%) |
| 35 to 64 Years | 13 (29.5%) | 0 (0.0%) |
| 65 to 74 Years | 0 (0.0%) | 0 (0.0%) |
| 75 Years and over | 0 (0.0%) | 0 (0.0%) |
Disability Class: Vision Difficulty
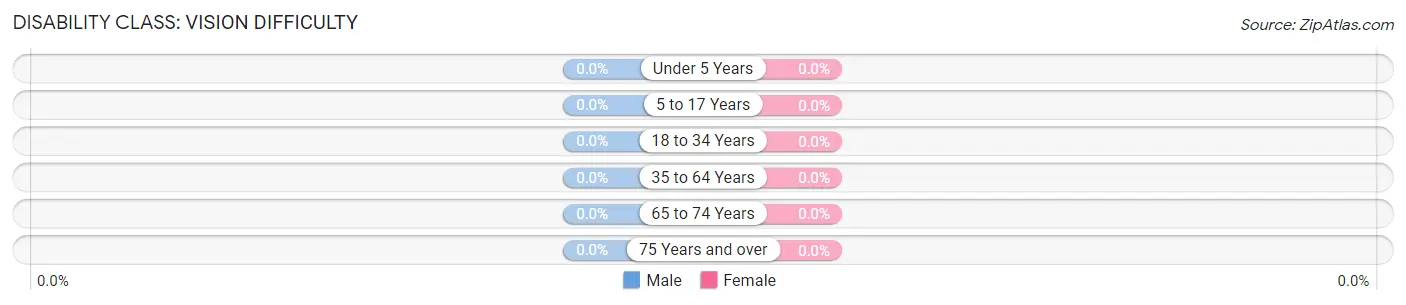
| Age Bracket | Male | Female |
| Under 5 Years | 0 (0.0%) | 0 (0.0%) |
| 5 to 17 Years | 0 (0.0%) | 0 (0.0%) |
| 18 to 34 Years | 0 (0.0%) | 0 (0.0%) |
| 35 to 64 Years | 0 (0.0%) | 0 (0.0%) |
| 65 to 74 Years | 0 (0.0%) | 0 (0.0%) |
| 75 Years and over | 0 (0.0%) | 0 (0.0%) |
Disability Class: Cognitive Difficulty
| Age Bracket | Male | Female |
| 5 to 17 Years | 0 (0.0%) | 0 (0.0%) |
| 18 to 34 Years | 0 (0.0%) | 0 (0.0%) |
| 35 to 64 Years | 0 (0.0%) | 0 (0.0%) |
| 65 to 74 Years | 0 (0.0%) | 0 (0.0%) |
| 75 Years and over | 0 (0.0%) | 0 (0.0%) |
Disability Class: Ambulatory Difficulty
| Age Bracket | Male | Female |
| 5 to 17 Years | 0 (0.0%) | 0 (0.0%) |
| 18 to 34 Years | 0 (0.0%) | 0 (0.0%) |
| 35 to 64 Years | 0 (0.0%) | 0 (0.0%) |
| 65 to 74 Years | 0 (0.0%) | 0 (0.0%) |
| 75 Years and over | 0 (0.0%) | 0 (0.0%) |
Disability Class: Self-Care Difficulty
| Age Bracket | Male | Female |
| 5 to 17 Years | 0 (0.0%) | 0 (0.0%) |
| 18 to 34 Years | 0 (0.0%) | 0 (0.0%) |
| 35 to 64 Years | 0 (0.0%) | 0 (0.0%) |
| 65 to 74 Years | 0 (0.0%) | 0 (0.0%) |
| 75 Years and over | 0 (0.0%) | 0 (0.0%) |
Technology Access in Custer
Computing Device Access in Custer
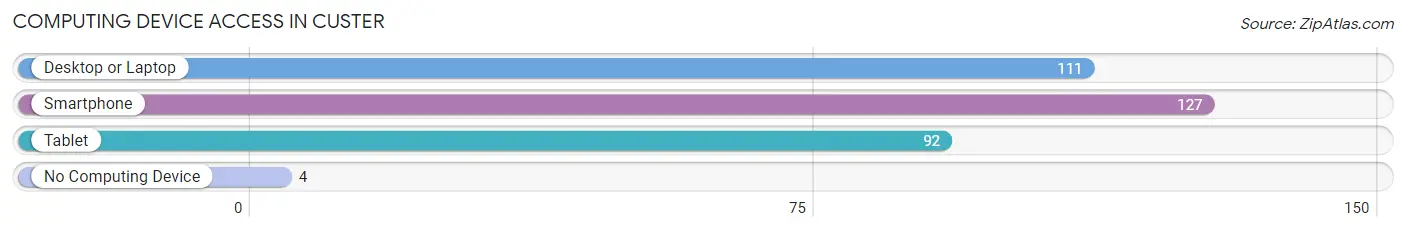
| Device Type | # Households | % Households |
| Desktop or Laptop | 111 | 84.7% |
| Smartphone | 127 | 97.0% |
| Tablet | 92 | 70.2% |
| No Computing Device | 4 | 3.0% |
| Total | 131 | 100.0% |
Internet Access in Custer
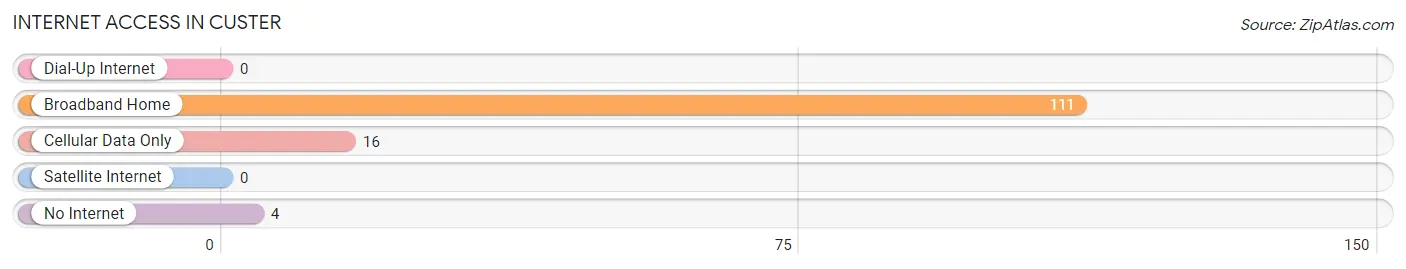
| Internet Type | # Households | % Households |
| Dial-Up Internet | 0 | 0.0% |
| Broadband Home | 111 | 84.7% |
| Cellular Data Only | 16 | 12.2% |
| Satellite Internet | 0 | 0.0% |
| No Internet | 4 | 3.0% |
| Total | 131 | 100.0% |
Custer Summary
Custer, Washington is a small unincorporated community located in Whatcom County, Washington. It is situated in the foothills of the Cascade Mountains, approximately 10 miles east of Bellingham. The population of Custer was estimated to be 1,845 in 2019.
History
Custer was first settled in the late 1800s by a group of homesteaders. The town was named after General George Armstrong Custer, who was a Civil War hero. The first post office was established in 1891.
In the early 1900s, Custer was a thriving logging and farming community. The town was home to several sawmills, a general store, a blacksmith shop, and a school. The logging industry was the main source of employment for the town’s residents.
In the 1950s, Custer began to experience a decline in population as the logging industry declined. The town’s population decreased from 1,500 in 1950 to just over 500 in 2000.
Geography
Custer is located in the foothills of the Cascade Mountains in Whatcom County, Washington. The town is situated at an elevation of 1,000 feet and is surrounded by forests and mountains. The nearby Mount Baker Ski Area is a popular destination for skiing and snowboarding.
The town is located approximately 10 miles east of Bellingham, Washington and is accessible via State Route 542. The nearest major airport is Seattle-Tacoma International Airport, which is located approximately 90 miles south of Custer.
Economy
The economy of Custer is largely based on tourism and the service industry. The town is home to several restaurants, bars, and shops. The nearby Mount Baker Ski Area is a popular destination for skiing and snowboarding.
The town is also home to several small businesses, including a lumber mill, a sawmill, and a general store. The lumber mill is the largest employer in the town.
Demographics
As of 2019, the population of Custer was estimated to be 1,845. The town has a median age of 44.7 years and a median household income of $50,000. The town is predominantly white (94.2%) and the majority of the population is of German (37.2%) and English (25.2%) descent.
The town has a low crime rate and a high rate of homeownership (77.2%). The town is served by the Custer School District, which includes one elementary school, one middle school, and one high school.
Conclusion
Custer, Washington is a small unincorporated community located in Whatcom County, Washington. It is situated in the foothills of the Cascade Mountains, approximately 10 miles east of Bellingham. The town has a population of 1,845 and is predominantly white. The economy of Custer is largely based on tourism and the service industry. The town is home to several restaurants, bars, and shops, as well as a lumber mill, a sawmill, and a general store. The town is served by the Custer School District, which includes one elementary school, one middle school, and one high school.
Common Questions
What is Per Capita Income in Custer?
Per Capita income in Custer is $40,404.
What is the Median Family Income in Custer?
Median Family Income in Custer is $130,192.
What is the Median Household income in Custer?
Median Household Income in Custer is $92,768.
What is Income or Wage Gap in Custer?
Income or Wage Gap in Custer is 54.4%.
Women in Custer earn 45.6 cents for every dollar earned by a man.
What is Inequality or Gini Index in Custer?
Inequality or Gini Index in Custer is 0.26.
What is the Total Population of Custer?
Total Population of Custer is 301.
What is the Total Male Population of Custer?
Total Male Population of Custer is 140.
What is the Total Female Population of Custer?
Total Female Population of Custer is 161.
What is the Ratio of Males per 100 Females in Custer?
There are 86.96 Males per 100 Females in Custer.
What is the Ratio of Females per 100 Males in Custer?
There are 115.00 Females per 100 Males in Custer.
What is the Median Population Age in Custer?
Median Population Age in Custer is 34.5 Years.
What is the Average Family Size in Custer
Average Family Size in Custer is 2.6 People.
What is the Average Household Size in Custer
Average Household Size in Custer is 2.3 People.
How Large is the Labor Force in Custer?
There are 218 People in the Labor Forcein in Custer.
What is the Percentage of People in the Labor Force in Custer?
89.7% of People are in the Labor Force in Custer.
What is the Unemployment Rate in Custer?
Unemployment Rate in Custer is 16.1%.