Snoqualmie, WA Map & Demographics
Snoqualmie Map
Snoqualmie Overview
$74,487
PER CAPITA INCOME
$211,250
AVG FAMILY INCOME
$186,353
AVG HOUSEHOLD INCOME
51.6%
WAGE / INCOME GAP [ % ]
48.4¢/ $1
WAGE / INCOME GAP [ $ ]
0.33
INEQUALITY / GINI INDEX
13,762
TOTAL POPULATION
6,775
MALE POPULATION
6,987
FEMALE POPULATION
96.97
MALES / 100 FEMALES
103.13
FEMALES / 100 MALES
38.6
MEDIAN AGE
3.2
AVG FAMILY SIZE
3.0
AVG HOUSEHOLD SIZE
8,066
LABOR FORCE [ PEOPLE ]
81.2%
PERCENT IN LABOR FORCE
2.7%
UNEMPLOYMENT RATE
Snoqualmie Zip Codes
Income in Snoqualmie
Income Overview in Snoqualmie
Per Capita Income in Snoqualmie is $74,487, while median incomes of families and households are $211,250 and $186,353 respectively.
| Characteristic | Number | Measure |
| Per Capita Income | 13,762 | $74,487 |
| Median Family Income | 3,971 | $211,250 |
| Mean Family Income | 3,971 | $231,991 |
| Median Household Income | 4,539 | $186,353 |
| Mean Household Income | 4,539 | $222,021 |
| Income Deficit | 3,971 | $0 |
| Wage / Income Gap (%) | 13,762 | 51.62% |
| Wage / Income Gap ($) | 13,762 | 48.38¢ per $1 |
| Gini / Inequality Index | 13,762 | 0.33 |
Earnings by Sex in Snoqualmie
Average Earnings in Snoqualmie are $94,132, $127,766 for men and $61,813 for women, a difference of 51.6%.
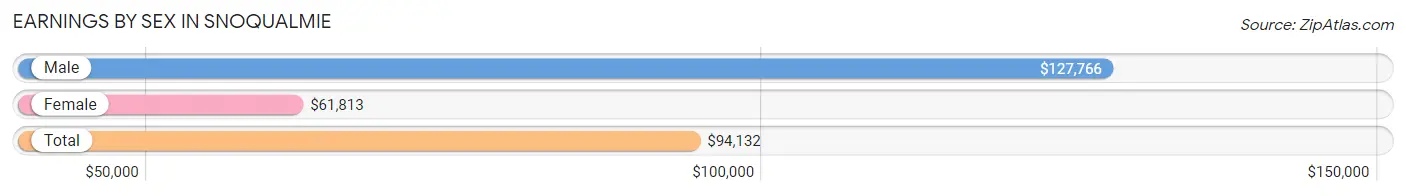
| Sex | Number | Average Earnings |
| Male | 4,450 (54.9%) | $127,766 |
| Female | 3,660 (45.1%) | $61,813 |
| Total | 8,110 (100.0%) | $94,132 |
Earnings by Sex by Income Bracket in Snoqualmie
The most common earnings brackets in Snoqualmie are $100,000+ for men (2,705 | 60.8%) and $100,000+ for women (1,128 | 30.8%).
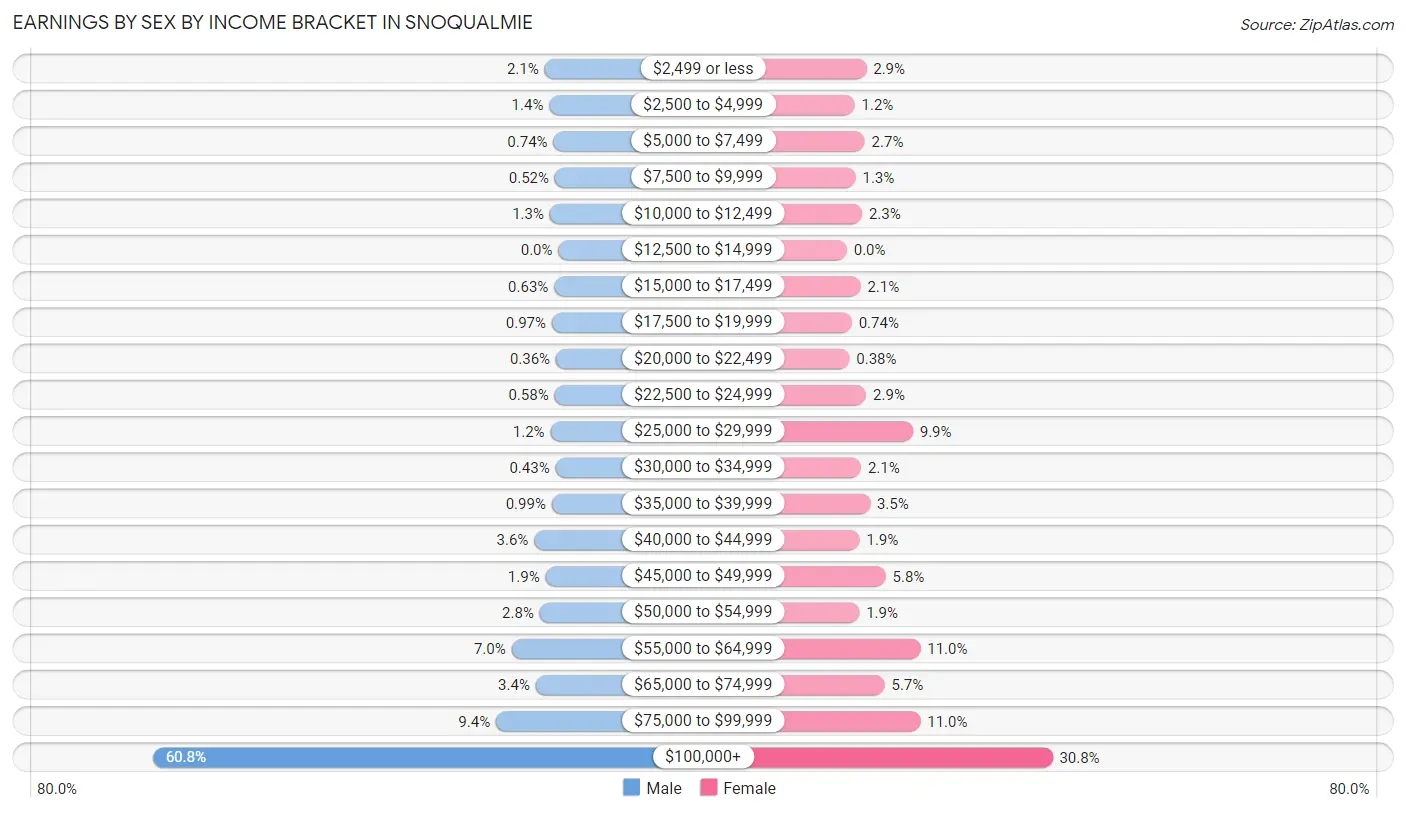
| Income | Male | Female |
| $2,499 or less | 92 (2.1%) | 107 (2.9%) |
| $2,500 to $4,999 | 61 (1.4%) | 43 (1.2%) |
| $5,000 to $7,499 | 33 (0.7%) | 98 (2.7%) |
| $7,500 to $9,999 | 23 (0.5%) | 48 (1.3%) |
| $10,000 to $12,499 | 57 (1.3%) | 83 (2.3%) |
| $12,500 to $14,999 | 0 (0.0%) | 0 (0.0%) |
| $15,000 to $17,499 | 28 (0.6%) | 75 (2.1%) |
| $17,500 to $19,999 | 43 (1.0%) | 27 (0.7%) |
| $20,000 to $22,499 | 16 (0.4%) | 14 (0.4%) |
| $22,500 to $24,999 | 26 (0.6%) | 106 (2.9%) |
| $25,000 to $29,999 | 53 (1.2%) | 362 (9.9%) |
| $30,000 to $34,999 | 19 (0.4%) | 78 (2.1%) |
| $35,000 to $39,999 | 44 (1.0%) | 127 (3.5%) |
| $40,000 to $44,999 | 161 (3.6%) | 70 (1.9%) |
| $45,000 to $49,999 | 86 (1.9%) | 213 (5.8%) |
| $50,000 to $54,999 | 124 (2.8%) | 68 (1.9%) |
| $55,000 to $64,999 | 312 (7.0%) | 403 (11.0%) |
| $65,000 to $74,999 | 151 (3.4%) | 207 (5.7%) |
| $75,000 to $99,999 | 416 (9.3%) | 403 (11.0%) |
| $100,000+ | 2,705 (60.8%) | 1,128 (30.8%) |
| Total | 4,450 (100.0%) | 3,660 (100.0%) |
Earnings by Sex by Educational Attainment in Snoqualmie
Average earnings in Snoqualmie are $130,316 for men and $64,896 for women, a difference of 50.2%. Men with an educational attainment of graduate degree enjoy the highest average annual earnings of $165,833, while those with high school diploma education earn the least with $57,218. Women with an educational attainment of graduate degree earn the most with the average annual earnings of $100,592, while those with high school diploma education have the smallest earnings of $36,034.
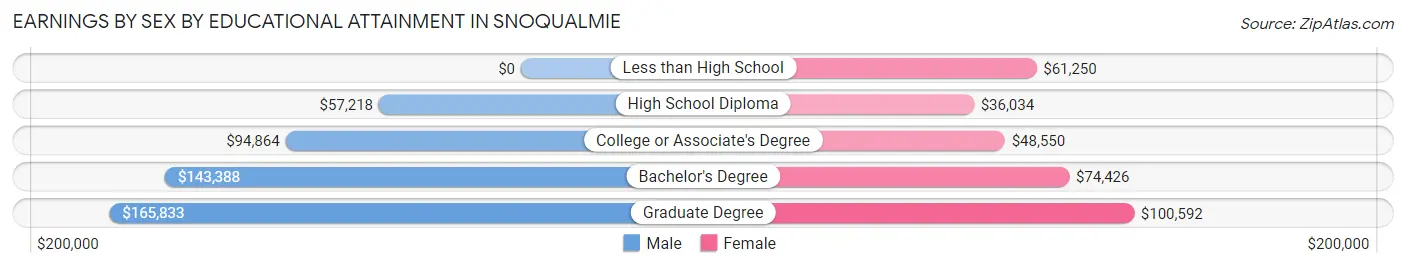
| Educational Attainment | Male Income | Female Income |
| Less than High School | - | - |
| High School Diploma | $57,218 | $36,034 |
| College or Associate's Degree | $94,864 | $48,550 |
| Bachelor's Degree | $143,388 | $74,426 |
| Graduate Degree | $165,833 | $100,592 |
| Total | $130,316 | $64,896 |
Family Income in Snoqualmie
Family Income Brackets in Snoqualmie
According to the Snoqualmie family income data, there are 2,061 families falling into the $200,000+ income range, which is the most common income bracket and makes up 51.9% of all families.
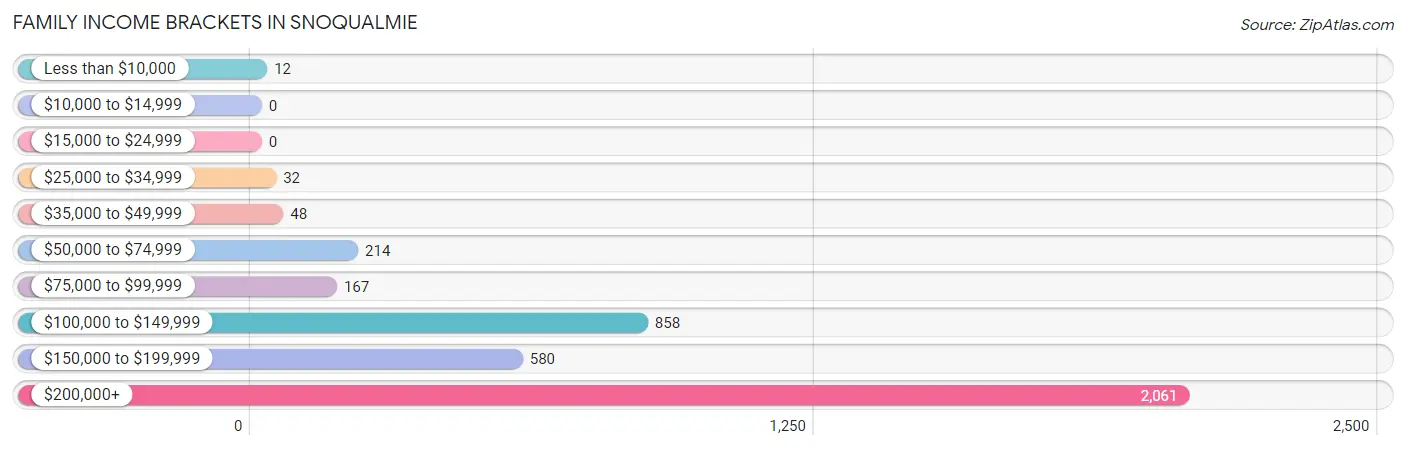
| Income Bracket | # Families | % Families |
| Less than $10,000 | 12 | 0.3% |
| $10,000 to $14,999 | 0 | 0.0% |
| $15,000 to $24,999 | 0 | 0.0% |
| $25,000 to $34,999 | 32 | 0.8% |
| $35,000 to $49,999 | 48 | 1.2% |
| $50,000 to $74,999 | 214 | 5.4% |
| $75,000 to $99,999 | 167 | 4.2% |
| $100,000 to $149,999 | 858 | 21.6% |
| $150,000 to $199,999 | 580 | 14.6% |
| $200,000+ | 2,061 | 51.9% |
Family Income by Famaliy Size in Snoqualmie
7+ person families (90 | 2.3%) account for the highest median family income in Snoqualmie with $250,001 per family, while 2-person families (1,530 | 38.5%) have the highest median income of $89,822 per family member.
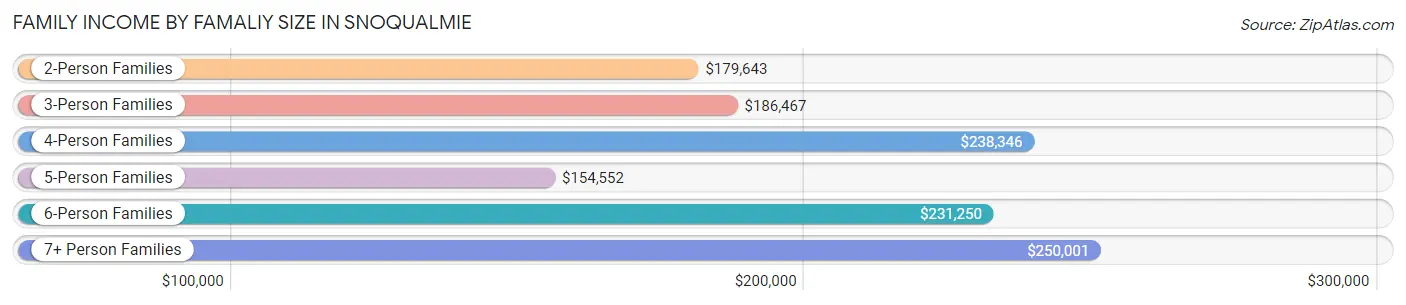
| Income Bracket | # Families | Median Income |
| 2-Person Families | 1,530 (38.5%) | $179,643 |
| 3-Person Families | 869 (21.9%) | $186,467 |
| 4-Person Families | 1,061 (26.7%) | $238,346 |
| 5-Person Families | 369 (9.3%) | $154,552 |
| 6-Person Families | 52 (1.3%) | $231,250 |
| 7+ Person Families | 90 (2.3%) | $250,001 |
| Total | 3,971 (100.0%) | $211,250 |
Family Income by Number of Earners in Snoqualmie
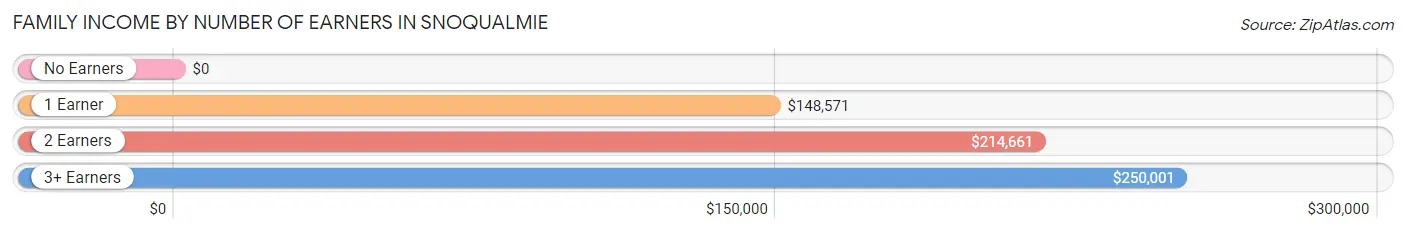
| Number of Earners | # Families | Median Income |
| No Earners | 61 (1.5%) | $0 |
| 1 Earner | 1,126 (28.4%) | $148,571 |
| 2 Earners | 2,423 (61.0%) | $214,661 |
| 3+ Earners | 361 (9.1%) | $250,001 |
| Total | 3,971 (100.0%) | $211,250 |
Household Income in Snoqualmie
Household Income Brackets in Snoqualmie
With 2,147 households falling in the category, the $200,000+ income range is the most frequent in Snoqualmie, accounting for 47.3% of all households.
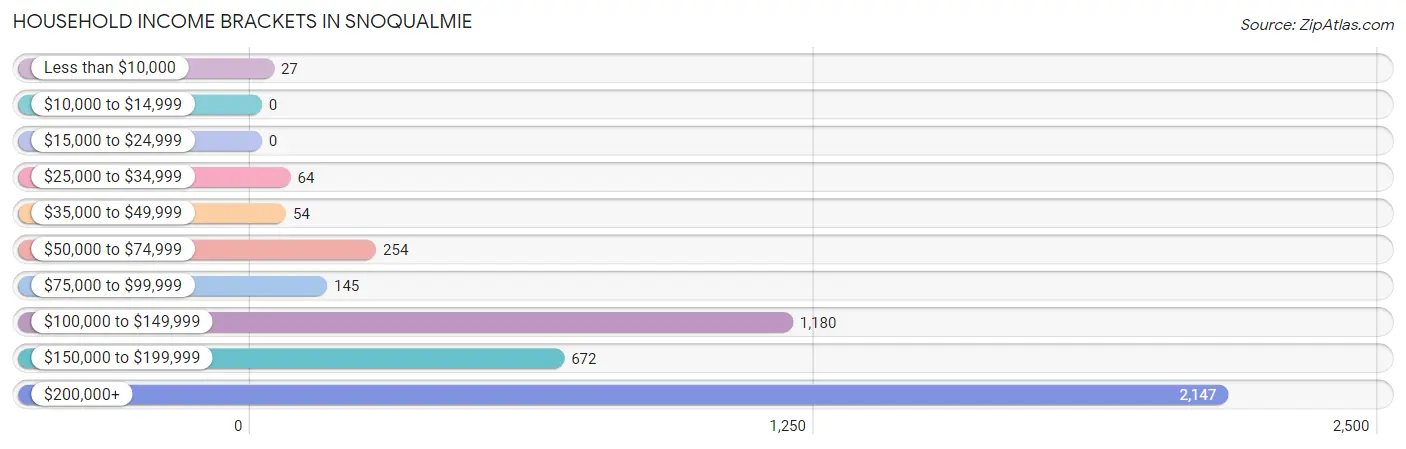
| Income Bracket | # Households | % Households |
| Less than $10,000 | 27 | 0.6% |
| $10,000 to $14,999 | 0 | 0.0% |
| $15,000 to $24,999 | 0 | 0.0% |
| $25,000 to $34,999 | 64 | 1.4% |
| $35,000 to $49,999 | 54 | 1.2% |
| $50,000 to $74,999 | 254 | 5.6% |
| $75,000 to $99,999 | 145 | 3.2% |
| $100,000 to $149,999 | 1,180 | 26.0% |
| $150,000 to $199,999 | 672 | 14.8% |
| $200,000+ | 2,147 | 47.3% |
Household Income by Householder Age in Snoqualmie
The median household income in Snoqualmie is $186,353, with the highest median household income of $195,329 found in the 45 to 64 years age bracket for the primary householder. A total of 2,071 households (45.6%) fall into this category. Meanwhile, the 15 to 24 years age bracket for the primary householder has the lowest median household income of $0, with 5 households (0.1%) in this group.
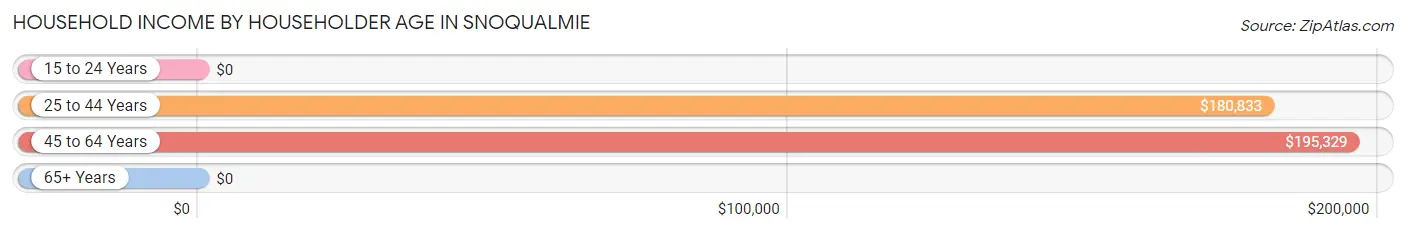
| Income Bracket | # Households | Median Income |
| 15 to 24 Years | 5 (0.1%) | $0 |
| 25 to 44 Years | 2,042 (45.0%) | $180,833 |
| 45 to 64 Years | 2,071 (45.6%) | $195,329 |
| 65+ Years | 421 (9.3%) | $0 |
| Total | 4,539 (100.0%) | $186,353 |
Poverty in Snoqualmie
Income Below Poverty by Sex and Age in Snoqualmie
With 0.1% poverty level for males and 0.5% for females among the residents of Snoqualmie, 25 to 34 year old males and 5 year old females are the most vulnerable to poverty, with 6 males (1.2%) and 6 females (4.7%) in their respective age groups living below the poverty level.
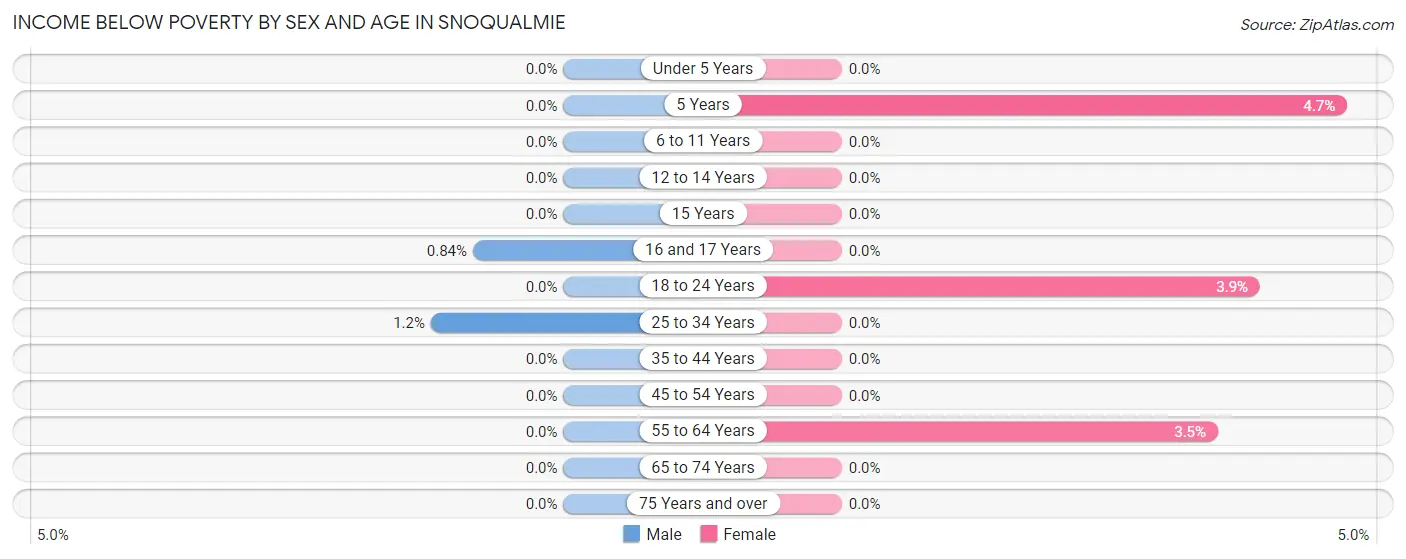
| Age Bracket | Male | Female |
| Under 5 Years | 0 (0.0%) | 0 (0.0%) |
| 5 Years | 0 (0.0%) | 6 (4.7%) |
| 6 to 11 Years | 0 (0.0%) | 0 (0.0%) |
| 12 to 14 Years | 0 (0.0%) | 0 (0.0%) |
| 15 Years | 0 (0.0%) | 0 (0.0%) |
| 16 and 17 Years | 3 (0.8%) | 0 (0.0%) |
| 18 to 24 Years | 0 (0.0%) | 9 (3.9%) |
| 25 to 34 Years | 6 (1.2%) | 0 (0.0%) |
| 35 to 44 Years | 0 (0.0%) | 0 (0.0%) |
| 45 to 54 Years | 0 (0.0%) | 0 (0.0%) |
| 55 to 64 Years | 0 (0.0%) | 19 (3.5%) |
| 65 to 74 Years | 0 (0.0%) | 0 (0.0%) |
| 75 Years and over | 0 (0.0%) | 0 (0.0%) |
| Total | 9 (0.1%) | 34 (0.5%) |
Income Above Poverty by Sex and Age in Snoqualmie
According to the poverty statistics in Snoqualmie, males aged under 5 years and females aged under 5 years are the age groups that are most secure financially, with 100.0% of males and 100.0% of females in these age groups living above the poverty line.
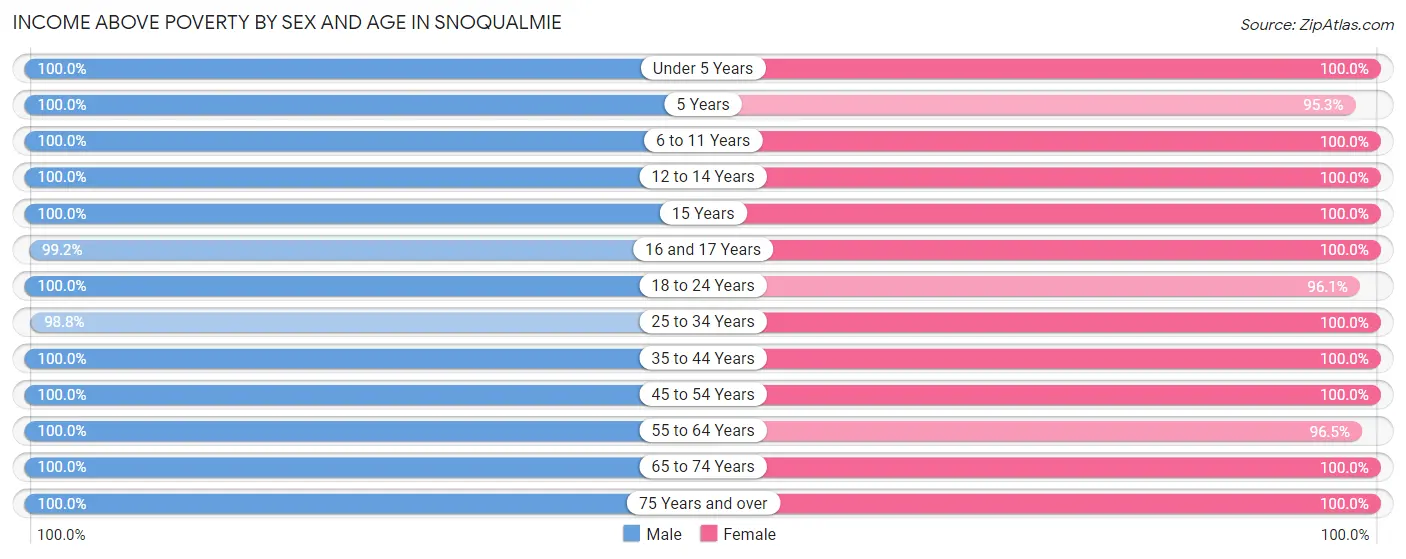
| Age Bracket | Male | Female |
| Under 5 Years | 353 (100.0%) | 424 (100.0%) |
| 5 Years | 86 (100.0%) | 122 (95.3%) |
| 6 to 11 Years | 618 (100.0%) | 1,017 (100.0%) |
| 12 to 14 Years | 460 (100.0%) | 434 (100.0%) |
| 15 Years | 241 (100.0%) | 48 (100.0%) |
| 16 and 17 Years | 353 (99.2%) | 105 (100.0%) |
| 18 to 24 Years | 165 (100.0%) | 223 (96.1%) |
| 25 to 34 Years | 480 (98.8%) | 740 (100.0%) |
| 35 to 44 Years | 1,539 (100.0%) | 1,618 (100.0%) |
| 45 to 54 Years | 1,397 (100.0%) | 1,166 (100.0%) |
| 55 to 64 Years | 685 (100.0%) | 525 (96.5%) |
| 65 to 74 Years | 312 (100.0%) | 410 (100.0%) |
| 75 Years and over | 77 (100.0%) | 102 (100.0%) |
| Total | 6,766 (99.9%) | 6,934 (99.5%) |
Income Below Poverty Among Married-Couple Families in Snoqualmie
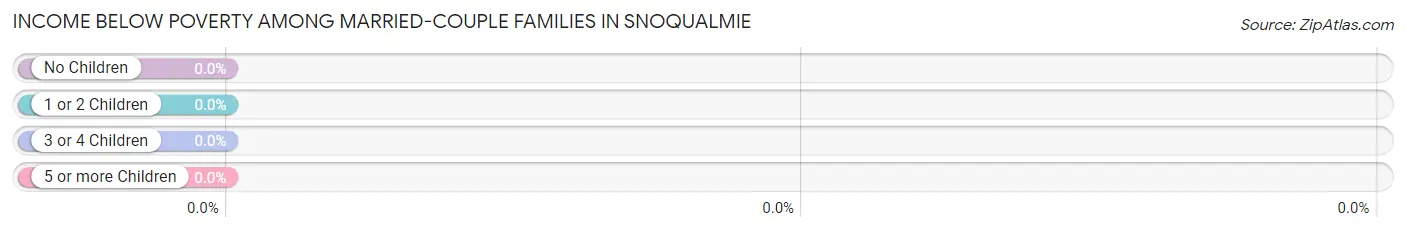
| Children | Above Poverty | Below Poverty |
| No Children | 1,473 (100.0%) | 0 (0.0%) |
| 1 or 2 Children | 1,631 (100.0%) | 0 (0.0%) |
| 3 or 4 Children | 348 (100.0%) | 0 (0.0%) |
| 5 or more Children | 39 (100.0%) | 0 (0.0%) |
| Total | 3,491 (100.0%) | 0 (0.0%) |
Income Below Poverty Among Single-Parent Households in Snoqualmie
According to the poverty data in Snoqualmie, 8.0% or 6 single-father households and 1.7% or 7 single-mother households are living below the poverty line. Among single-father households, those with 1 or 2 children have the highest poverty rate, with 6 households (20.0%) experiencing poverty. Likewise, among single-mother households, those with no children have the highest poverty rate, with 7 households (4.5%) falling below the poverty line.
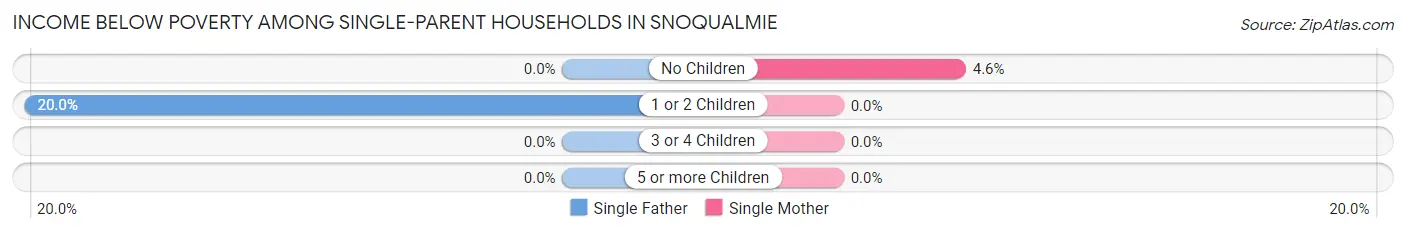
| Children | Single Father | Single Mother |
| No Children | 0 (0.0%) | 7 (4.5%) |
| 1 or 2 Children | 6 (20.0%) | 0 (0.0%) |
| 3 or 4 Children | 0 (0.0%) | 0 (0.0%) |
| 5 or more Children | 0 (0.0%) | 0 (0.0%) |
| Total | 6 (8.0%) | 7 (1.7%) |
Income Below Poverty Among Married-Couple vs Single-Parent Households in Snoqualmie
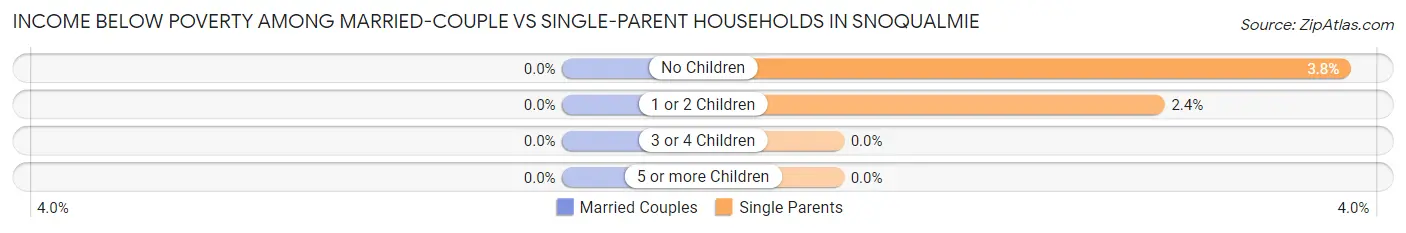
| Children | Married-Couple Families | Single-Parent Households |
| No Children | 0 (0.0%) | 7 (3.8%) |
| 1 or 2 Children | 0 (0.0%) | 6 (2.4%) |
| 3 or 4 Children | 0 (0.0%) | 0 (0.0%) |
| 5 or more Children | 0 (0.0%) | 0 (0.0%) |
| Total | 0 (0.0%) | 13 (2.7%) |
Race in Snoqualmie
The most populous races in Snoqualmie are White / Caucasian (11,216 | 81.5%), Asian (1,433 | 10.4%), and Two or more Races (913 | 6.6%).
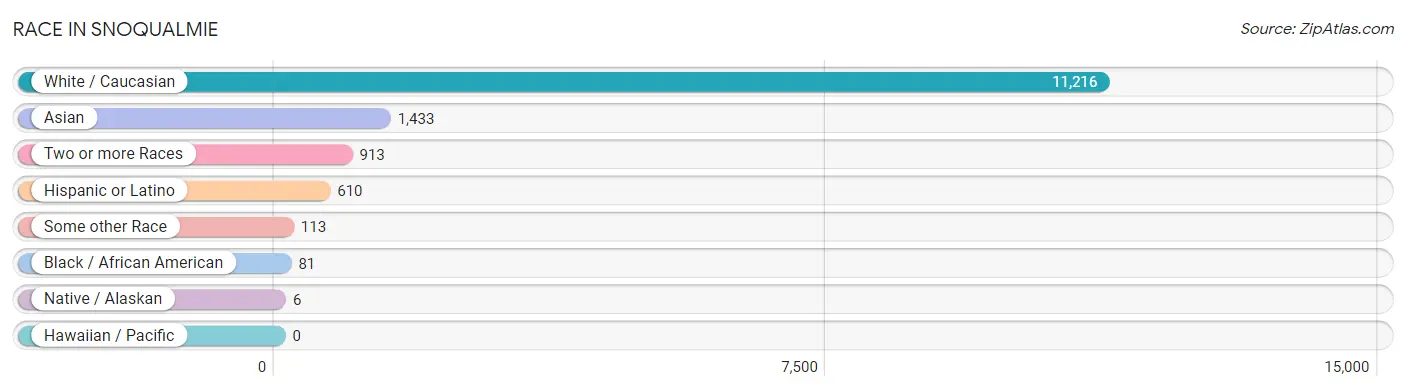
| Race | # Population | % Population |
| Asian | 1,433 | 10.4% |
| Black / African American | 81 | 0.6% |
| Hawaiian / Pacific | 0 | 0.0% |
| Hispanic or Latino | 610 | 4.4% |
| Native / Alaskan | 6 | 0.0% |
| White / Caucasian | 11,216 | 81.5% |
| Two or more Races | 913 | 6.6% |
| Some other Race | 113 | 0.8% |
| Total | 13,762 | 100.0% |
Ancestry in Snoqualmie
The most populous ancestries reported in Snoqualmie are German (2,414 | 17.5%), English (2,312 | 16.8%), Irish (1,831 | 13.3%), Thai (849 | 6.2%), and Norwegian (616 | 4.5%), together accounting for 58.3% of all Snoqualmie residents.
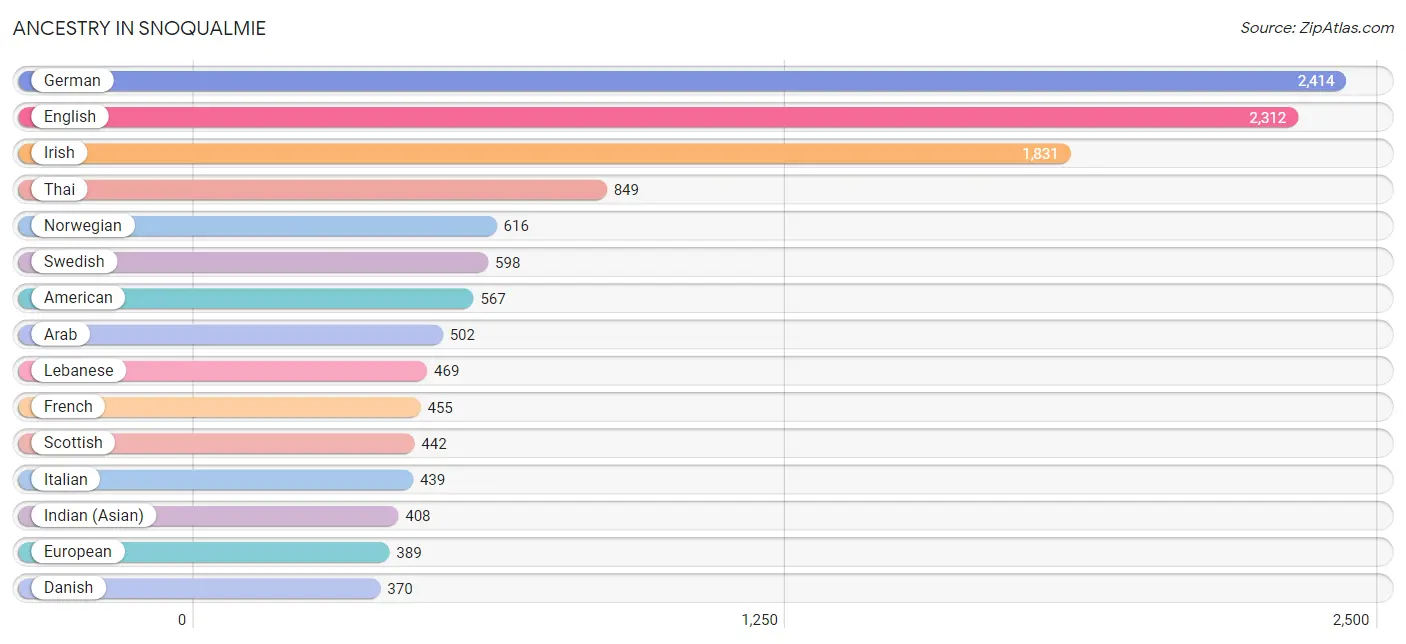
| Ancestry | # Population | % Population |
| American | 567 | 4.1% |
| Arab | 502 | 3.6% |
| Armenian | 25 | 0.2% |
| Austrian | 55 | 0.4% |
| Bangladeshi | 31 | 0.2% |
| Belgian | 3 | 0.0% |
| Bhutanese | 161 | 1.2% |
| British | 134 | 1.0% |
| Burmese | 81 | 0.6% |
| Canadian | 45 | 0.3% |
| Colombian | 11 | 0.1% |
| Croatian | 95 | 0.7% |
| Czech | 49 | 0.4% |
| Danish | 370 | 2.7% |
| Dutch | 272 | 2.0% |
| Eastern European | 32 | 0.2% |
| Ecuadorian | 22 | 0.2% |
| Egyptian | 31 | 0.2% |
| English | 2,312 | 16.8% |
| European | 389 | 2.8% |
| Filipino | 12 | 0.1% |
| Finnish | 183 | 1.3% |
| French | 455 | 3.3% |
| German | 2,414 | 17.5% |
| Greek | 59 | 0.4% |
| Indian (Asian) | 408 | 3.0% |
| Irish | 1,831 | 13.3% |
| Israeli | 34 | 0.3% |
| Italian | 439 | 3.2% |
| Jamaican | 33 | 0.2% |
| Korean | 195 | 1.4% |
| Laotian | 58 | 0.4% |
| Latvian | 16 | 0.1% |
| Lebanese | 469 | 3.4% |
| Lithuanian | 33 | 0.2% |
| Mexican | 292 | 2.1% |
| Native Hawaiian | 188 | 1.4% |
| Northern European | 77 | 0.6% |
| Norwegian | 616 | 4.5% |
| Pakistani | 105 | 0.8% |
| Palestinian | 2 | 0.0% |
| Peruvian | 208 | 1.5% |
| Polish | 68 | 0.5% |
| Portuguese | 37 | 0.3% |
| Puerto Rican | 33 | 0.2% |
| Romanian | 75 | 0.5% |
| Russian | 159 | 1.2% |
| Scandinavian | 287 | 2.1% |
| Scotch-Irish | 305 | 2.2% |
| Scottish | 442 | 3.2% |
| Slovak | 42 | 0.3% |
| Slovene | 5 | 0.0% |
| South American | 257 | 1.9% |
| South American Indian | 22 | 0.2% |
| Spaniard | 28 | 0.2% |
| Swedish | 598 | 4.3% |
| Swiss | 83 | 0.6% |
| Thai | 849 | 6.2% |
| Ukrainian | 28 | 0.2% |
| Venezuelan | 16 | 0.1% |
| Welsh | 82 | 0.6% | View All 61 Rows |
Immigrants in Snoqualmie
The most numerous immigrant groups reported in Snoqualmie came from Asia (1,112 | 8.1%), South Central Asia (617 | 4.5%), India (552 | 4.0%), Europe (545 | 4.0%), and Eastern Asia (225 | 1.6%), together accounting for 22.2% of all Snoqualmie residents.
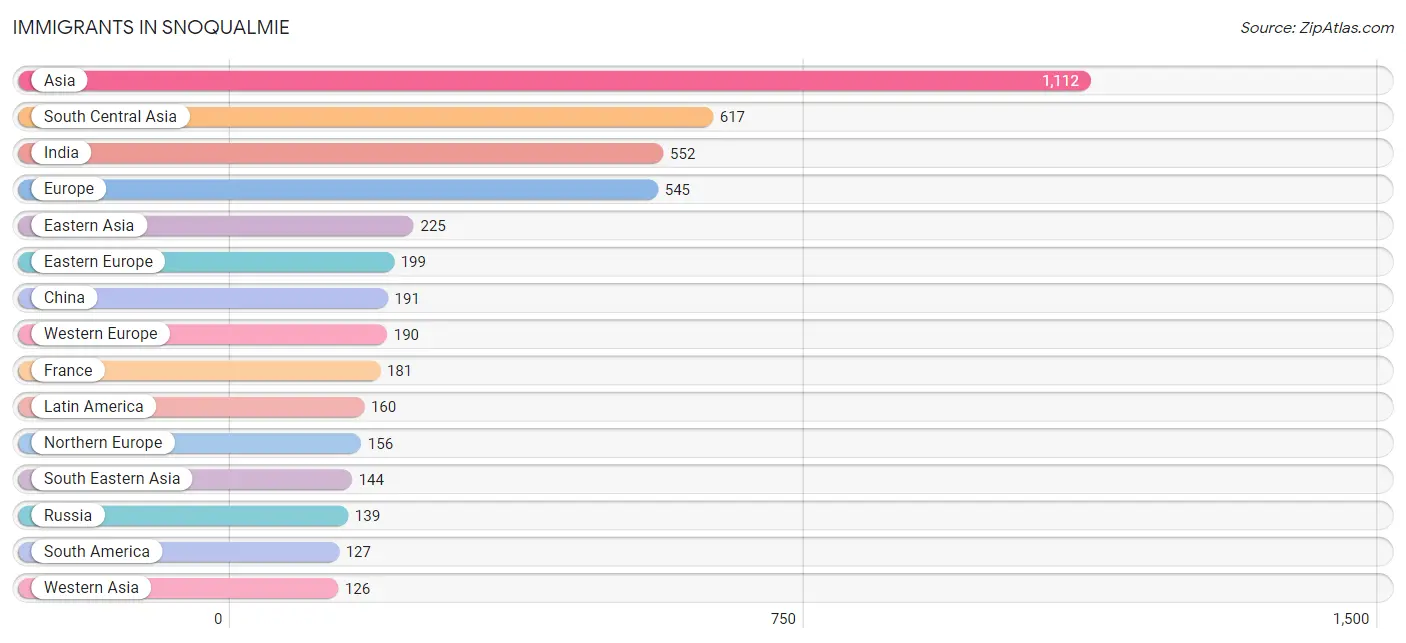
| Immigration Origin | # Population | % Population |
| Africa | 42 | 0.3% |
| Armenia | 23 | 0.2% |
| Asia | 1,112 | 8.1% |
| Belarus | 16 | 0.1% |
| Brazil | 78 | 0.6% |
| Canada | 17 | 0.1% |
| Caribbean | 33 | 0.2% |
| China | 191 | 1.4% |
| Colombia | 11 | 0.1% |
| Eastern Asia | 225 | 1.6% |
| Eastern Europe | 199 | 1.5% |
| Ecuador | 22 | 0.2% |
| Egypt | 31 | 0.2% |
| England | 18 | 0.1% |
| Europe | 545 | 4.0% |
| France | 181 | 1.3% |
| Germany | 9 | 0.1% |
| India | 552 | 4.0% |
| Israel | 36 | 0.3% |
| Jamaica | 33 | 0.2% |
| Japan | 20 | 0.2% |
| Korea | 14 | 0.1% |
| Laos | 7 | 0.1% |
| Latin America | 160 | 1.2% |
| Lebanon | 3 | 0.0% |
| Nigeria | 4 | 0.0% |
| Northern Africa | 31 | 0.2% |
| Northern Europe | 156 | 1.1% |
| Pakistan | 33 | 0.2% |
| Philippines | 75 | 0.5% |
| Romania | 38 | 0.3% |
| Russia | 139 | 1.0% |
| South Africa | 7 | 0.1% |
| South America | 127 | 0.9% |
| South Central Asia | 617 | 4.5% |
| South Eastern Asia | 144 | 1.1% |
| Sweden | 49 | 0.4% |
| Thailand | 62 | 0.4% |
| Venezuela | 16 | 0.1% |
| Western Africa | 4 | 0.0% |
| Western Asia | 126 | 0.9% |
| Western Europe | 190 | 1.4% | View All 42 Rows |
Sex and Age in Snoqualmie
Sex and Age in Snoqualmie
The most populous age groups in Snoqualmie are 45 to 49 Years (857 | 12.7%) for men and 40 to 44 Years (999 | 14.3%) for women.
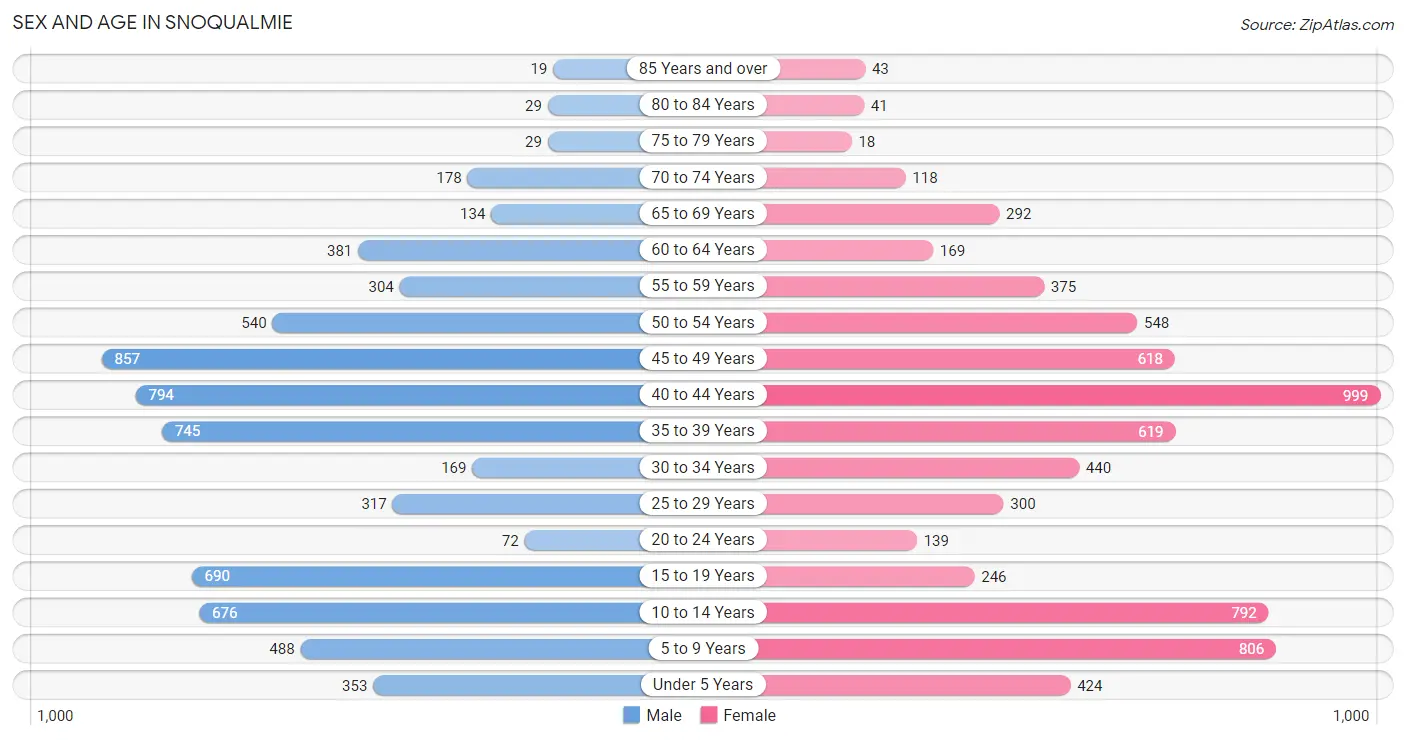
| Age Bracket | Male | Female |
| Under 5 Years | 353 (5.2%) | 424 (6.1%) |
| 5 to 9 Years | 488 (7.2%) | 806 (11.5%) |
| 10 to 14 Years | 676 (10.0%) | 792 (11.3%) |
| 15 to 19 Years | 690 (10.2%) | 246 (3.5%) |
| 20 to 24 Years | 72 (1.1%) | 139 (2.0%) |
| 25 to 29 Years | 317 (4.7%) | 300 (4.3%) |
| 30 to 34 Years | 169 (2.5%) | 440 (6.3%) |
| 35 to 39 Years | 745 (11.0%) | 619 (8.9%) |
| 40 to 44 Years | 794 (11.7%) | 999 (14.3%) |
| 45 to 49 Years | 857 (12.7%) | 618 (8.8%) |
| 50 to 54 Years | 540 (8.0%) | 548 (7.8%) |
| 55 to 59 Years | 304 (4.5%) | 375 (5.4%) |
| 60 to 64 Years | 381 (5.6%) | 169 (2.4%) |
| 65 to 69 Years | 134 (2.0%) | 292 (4.2%) |
| 70 to 74 Years | 178 (2.6%) | 118 (1.7%) |
| 75 to 79 Years | 29 (0.4%) | 18 (0.3%) |
| 80 to 84 Years | 29 (0.4%) | 41 (0.6%) |
| 85 Years and over | 19 (0.3%) | 43 (0.6%) |
| Total | 6,775 (100.0%) | 6,987 (100.0%) |
Families and Households in Snoqualmie
Median Family Size in Snoqualmie
The median family size in Snoqualmie is 3.22 persons per family, with married-couple families (3,491 | 87.9%) accounting for the largest median family size of 3.25 persons per family. On the other hand, single male/father families (75 | 1.9%) represent the smallest median family size with 2.73 persons per family.
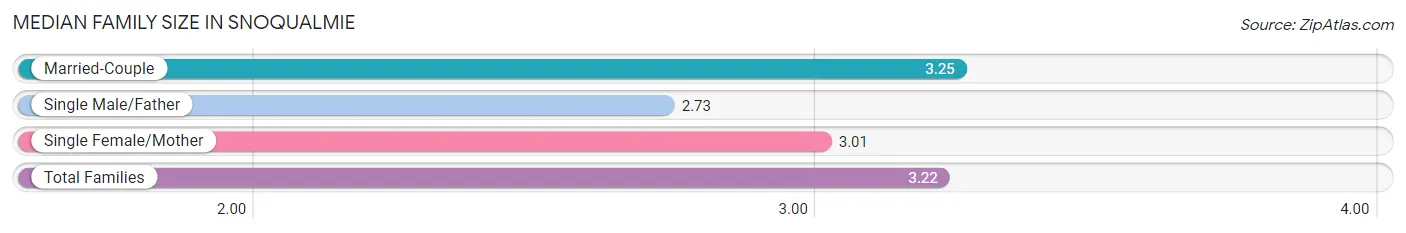
| Family Type | # Families | Family Size |
| Married-Couple | 3,491 (87.9%) | 3.25 |
| Single Male/Father | 75 (1.9%) | 2.73 |
| Single Female/Mother | 405 (10.2%) | 3.01 |
| Total Families | 3,971 (100.0%) | 3.22 |
Median Household Size in Snoqualmie
The median household size in Snoqualmie is 3.03 persons per household, with single female/mother households (405 | 8.9%) accounting for the largest median household size of 3.7 persons per household. non-family households (568 | 12.5%) represent the smallest median household size with 1.20 persons per household.
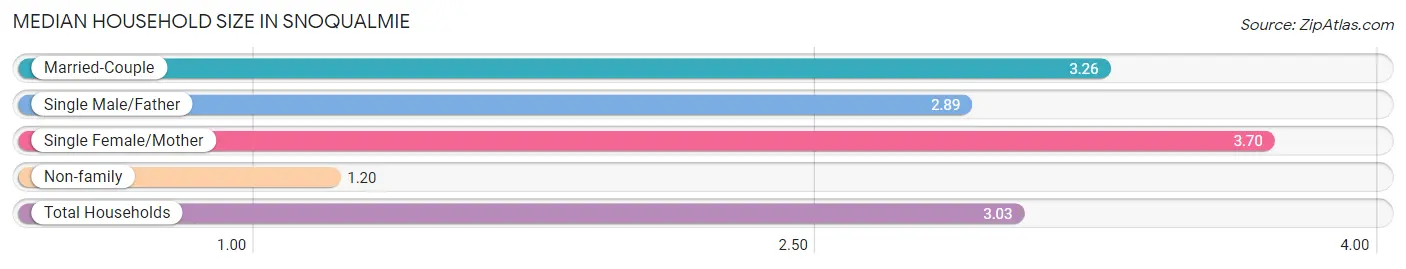
| Household Type | # Households | Household Size |
| Married-Couple | 3,491 (76.9%) | 3.26 |
| Single Male/Father | 75 (1.7%) | 2.89 |
| Single Female/Mother | 405 (8.9%) | 3.70 |
| Non-family | 568 (12.5%) | 1.20 |
| Total Households | 4,539 (100.0%) | 3.03 |
Household Size by Marriage Status in Snoqualmie
Out of a total of 4,539 households in Snoqualmie, 3,971 (87.5%) are family households, while 568 (12.5%) are nonfamily households. The most numerous type of family households are 2-person households, comprising 1,483, and the most common type of nonfamily households are 1-person households, comprising 482.
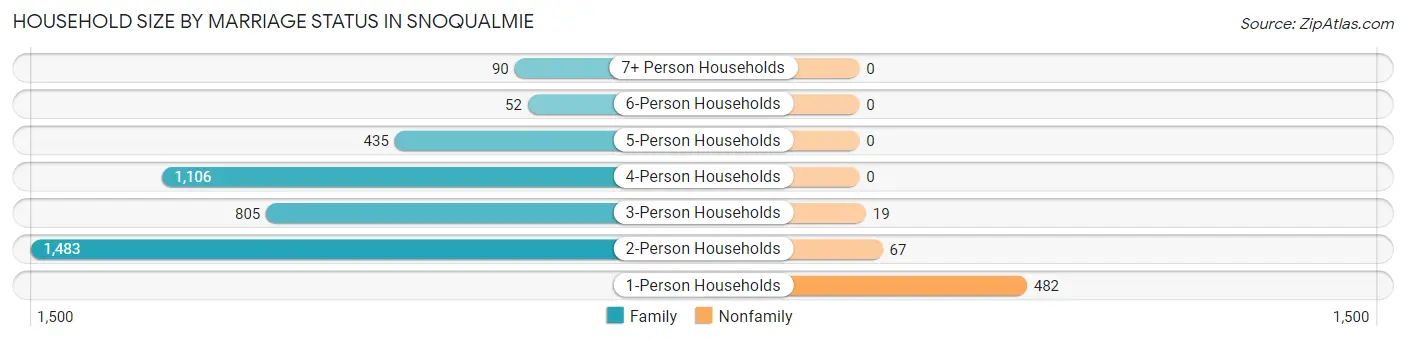
| Household Size | Family Households | Nonfamily Households |
| 1-Person Households | - | 482 (10.6%) |
| 2-Person Households | 1,483 (32.7%) | 67 (1.5%) |
| 3-Person Households | 805 (17.7%) | 19 (0.4%) |
| 4-Person Households | 1,106 (24.4%) | 0 (0.0%) |
| 5-Person Households | 435 (9.6%) | 0 (0.0%) |
| 6-Person Households | 52 (1.1%) | 0 (0.0%) |
| 7+ Person Households | 90 (2.0%) | 0 (0.0%) |
| Total | 3,971 (87.5%) | 568 (12.5%) |
Female Fertility in Snoqualmie
Fertility by Age in Snoqualmie
Average fertility rate in Snoqualmie is 13.0 births per 1,000 women. Women in the age bracket of 20 to 34 years have the highest fertility rate with 23.0 births per 1,000 women. Women in the age bracket of 35 to 50 years acount for 56.5% of all women with births.
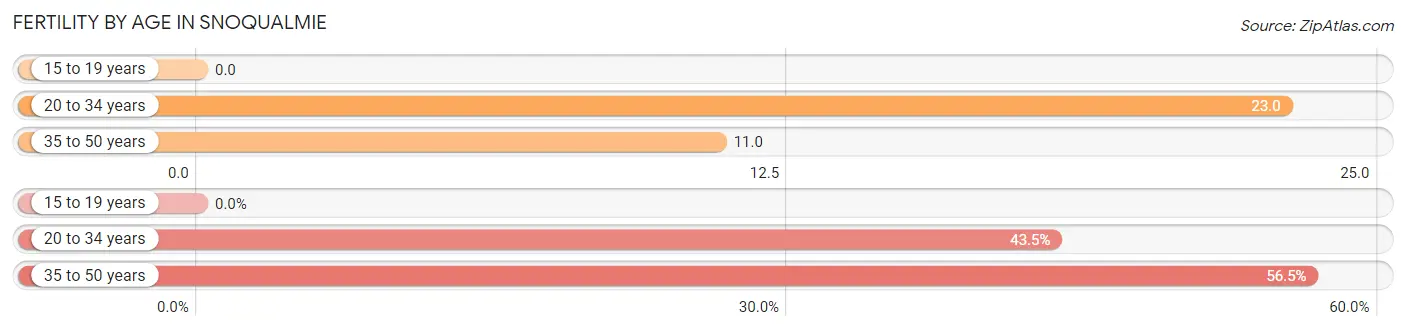
| Age Bracket | Women with Births | Births / 1,000 Women |
| 15 to 19 years | 0 (0.0%) | 0.0 |
| 20 to 34 years | 20 (43.5%) | 23.0 |
| 35 to 50 years | 26 (56.5%) | 11.0 |
| Total | 46 (100.0%) | 13.0 |
Fertility by Age by Marriage Status in Snoqualmie
63.0% of women with births (46) in Snoqualmie are married. The highest percentage of unmarried women with births falls into 20 to 34 years age bracket with 85.0% of them unmarried at the time of birth, while the lowest percentage of unmarried women with births belong to 35 to 50 years age bracket with 0.0% of them unmarried.
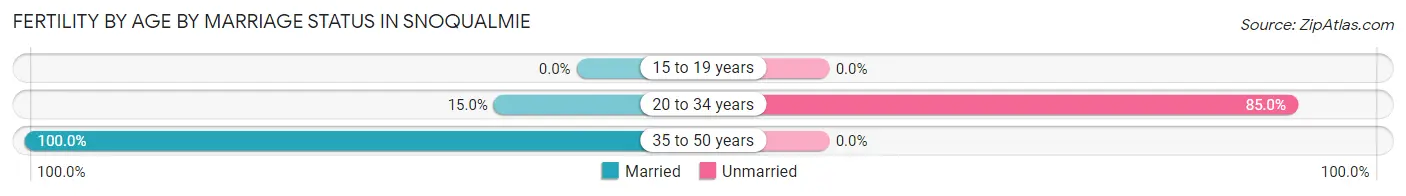
| Age Bracket | Married | Unmarried |
| 15 to 19 years | 0 (0.0%) | 0 (0.0%) |
| 20 to 34 years | 3 (15.0%) | 17 (85.0%) |
| 35 to 50 years | 26 (100.0%) | 0 (0.0%) |
| Total | 29 (63.0%) | 17 (37.0%) |
Fertility by Education in Snoqualmie
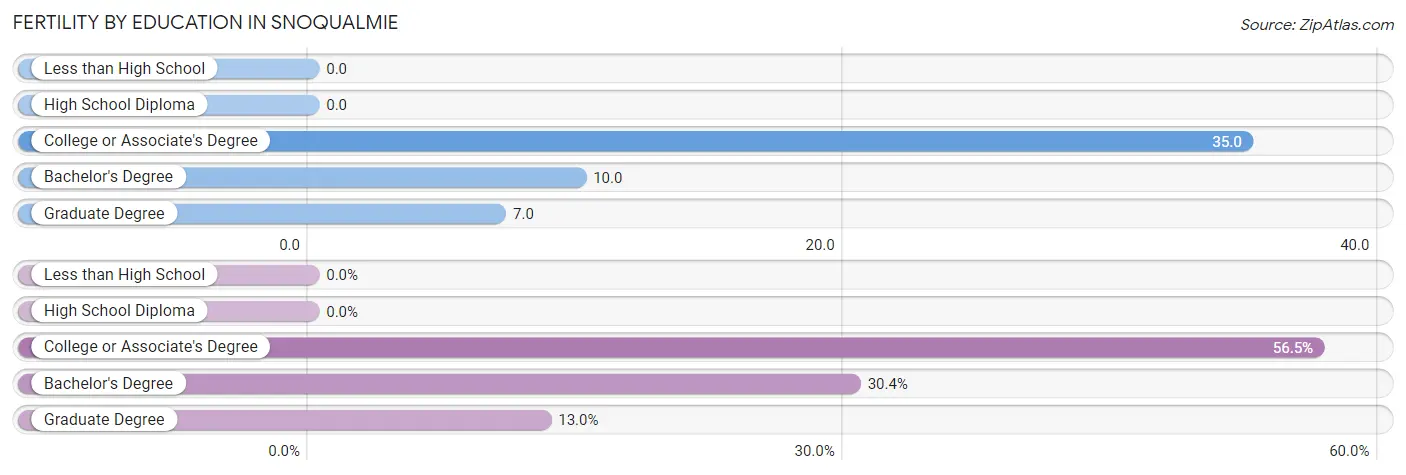
| Educational Attainment | Women with Births | Births / 1,000 Women |
| Less than High School | 0 (0.0%) | 0.0 |
| High School Diploma | 0 (0.0%) | 0.0 |
| College or Associate's Degree | 26 (56.5%) | 35.0 |
| Bachelor's Degree | 14 (30.4%) | 10.0 |
| Graduate Degree | 6 (13.0%) | 7.0 |
| Total | 46 (100.0%) | 13.0 |
Fertility by Education by Marriage Status in Snoqualmie
37.0% of women with births in Snoqualmie are unmarried. Women with the educational attainment of bachelor's degree are most likely to be married with 100.0% of them married at childbirth, while women with the educational attainment of college or associate's degree are least likely to be married with 65.4% of them unmarried at childbirth.
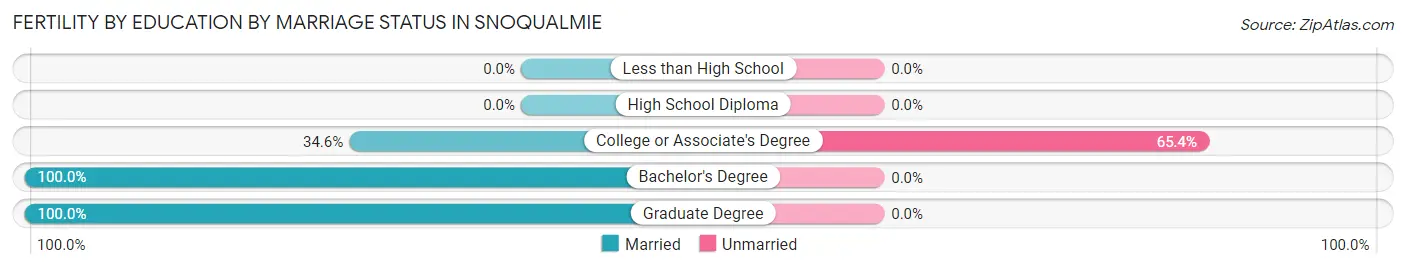
| Educational Attainment | Married | Unmarried |
| Less than High School | 0 (0.0%) | 0 (0.0%) |
| High School Diploma | 0 (0.0%) | 0 (0.0%) |
| College or Associate's Degree | 9 (34.6%) | 17 (65.4%) |
| Bachelor's Degree | 14 (100.0%) | 0 (0.0%) |
| Graduate Degree | 6 (100.0%) | 0 (0.0%) |
| Total | 29 (63.0%) | 17 (37.0%) |
Employment Characteristics in Snoqualmie
Employment by Class of Employer in Snoqualmie
Among the 7,723 employed individuals in Snoqualmie, private company employees (5,521 | 71.5%), local government employees (744 | 9.6%), and not-for-profit organizations (458 | 5.9%) make up the most common classes of employment.
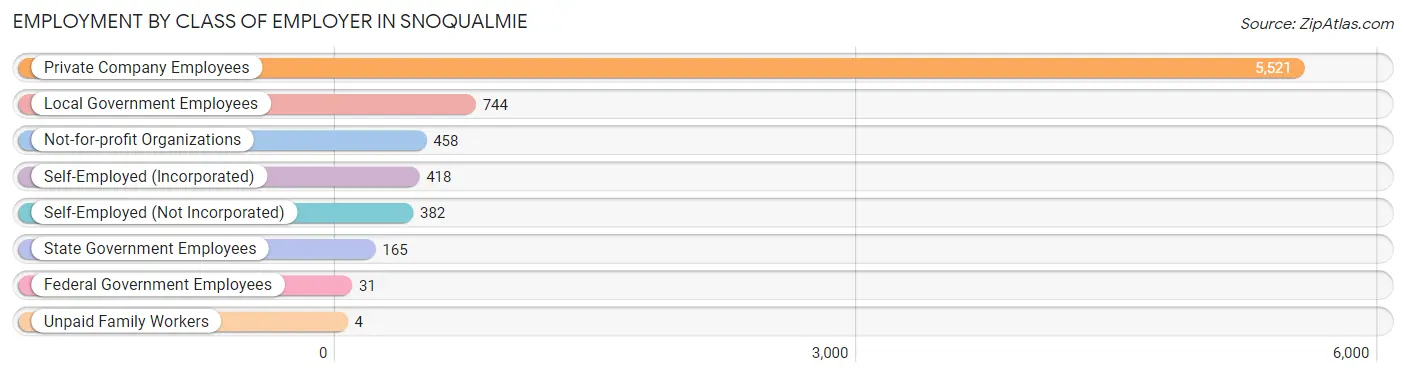
| Employer Class | # Employees | % Employees |
| Private Company Employees | 5,521 | 71.5% |
| Self-Employed (Incorporated) | 418 | 5.4% |
| Self-Employed (Not Incorporated) | 382 | 5.0% |
| Not-for-profit Organizations | 458 | 5.9% |
| Local Government Employees | 744 | 9.6% |
| State Government Employees | 165 | 2.1% |
| Federal Government Employees | 31 | 0.4% |
| Unpaid Family Workers | 4 | 0.1% |
| Total | 7,723 | 100.0% |
Employment Status by Age in Snoqualmie
According to the labor force statistics for Snoqualmie, out of the total population over 16 years of age (9,934), 81.2% or 8,066 individuals are in the labor force, with 2.7% or 218 of them unemployed. The age group with the highest labor force participation rate is 25 to 29 years, with 95.8% or 591 individuals in the labor force. Within the labor force, the 16 to 19 years age range has the highest percentage of unemployed individuals, with 18.3% or 50 of them being unemployed.
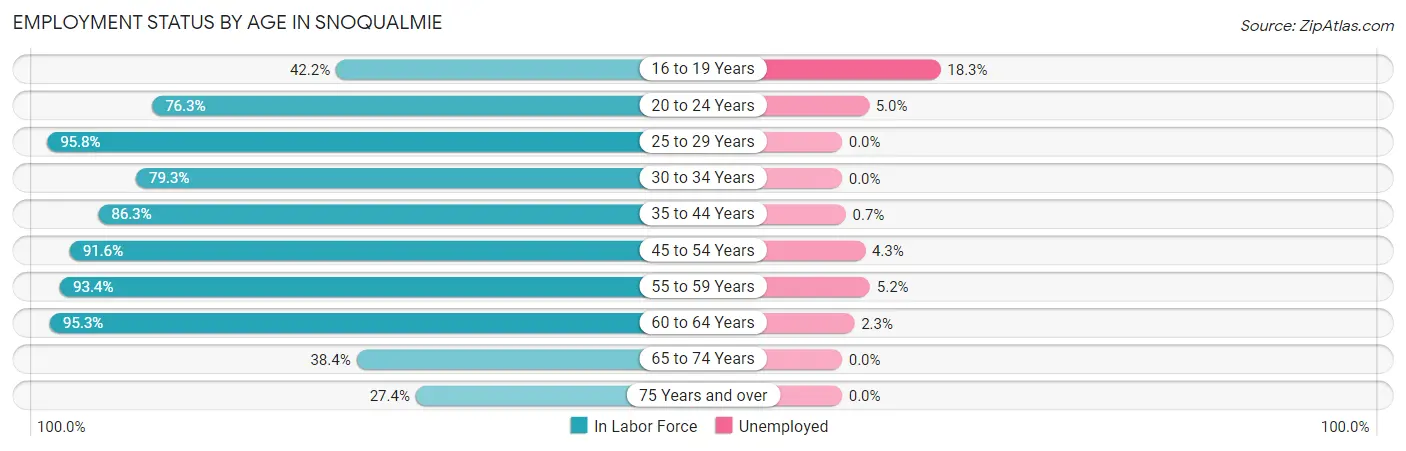
| Age Bracket | In Labor Force | Unemployed |
| 16 to 19 Years | 273 (42.2%) | 50 (18.3%) |
| 20 to 24 Years | 161 (76.3%) | 8 (5.0%) |
| 25 to 29 Years | 591 (95.8%) | 0 (0.0%) |
| 30 to 34 Years | 483 (79.3%) | 0 (0.0%) |
| 35 to 44 Years | 2,724 (86.3%) | 19 (0.7%) |
| 45 to 54 Years | 2,348 (91.6%) | 101 (4.3%) |
| 55 to 59 Years | 634 (93.4%) | 33 (5.2%) |
| 60 to 64 Years | 524 (95.3%) | 12 (2.3%) |
| 65 to 74 Years | 277 (38.4%) | 0 (0.0%) |
| 75 Years and over | 49 (27.4%) | 0 (0.0%) |
| Total | 8,066 (81.2%) | 218 (2.7%) |
Employment Status by Educational Attainment in Snoqualmie
According to labor force statistics for Snoqualmie, 89.3% of individuals (7,300) out of the total population between 25 and 64 years of age (8,175) are in the labor force, with 2.2% or 161 of them being unemployed. The group with the highest labor force participation rate are those with the educational attainment of bachelor's degree or higher, with 90.6% or 5,081 individuals in the labor force. Within the labor force, individuals with college / associate degree education have the highest percentage of unemployment, with 4.4% or 62 of them being unemployed.
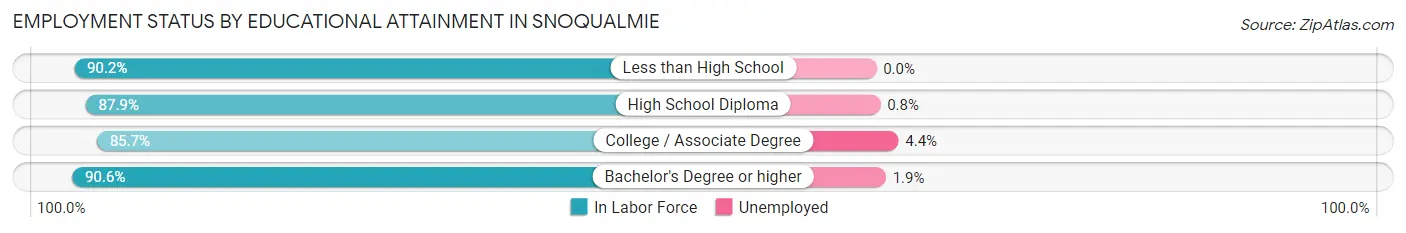
| Educational Attainment | In Labor Force | Unemployed |
| Less than High School | 92 (90.2%) | 0 (0.0%) |
| High School Diploma | 714 (87.9%) | 6 (0.8%) |
| College / Associate Degree | 1,417 (85.7%) | 73 (4.4%) |
| Bachelor's Degree or higher | 5,081 (90.6%) | 107 (1.9%) |
| Total | 7,300 (89.3%) | 180 (2.2%) |
Employment Occupations by Sex in Snoqualmie
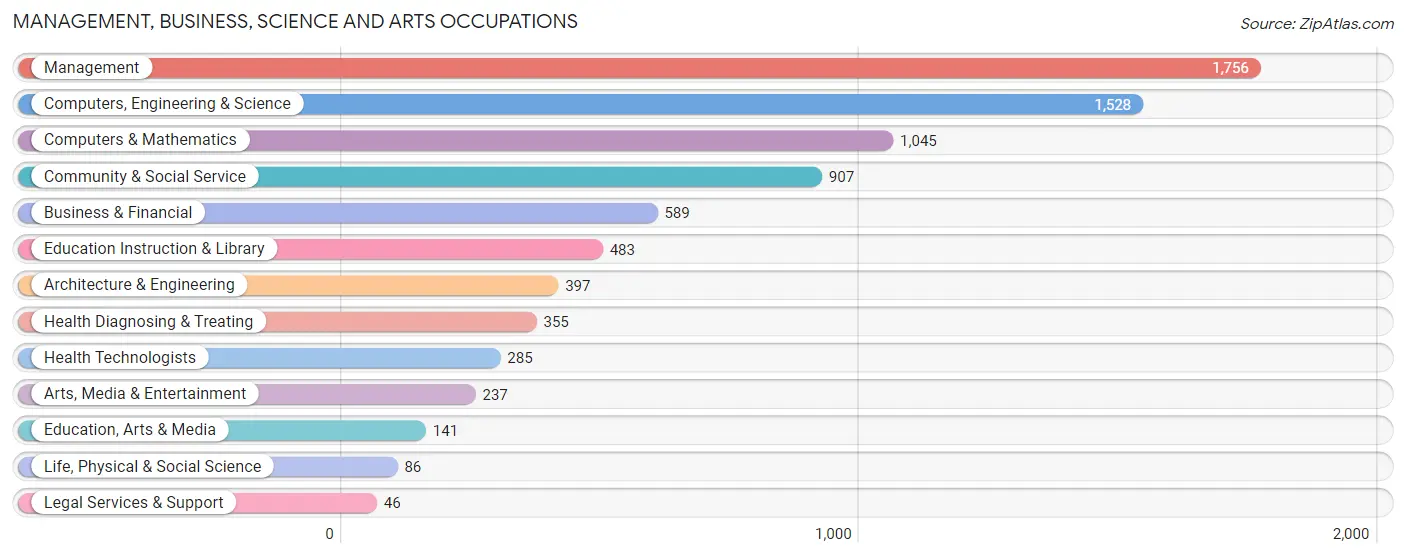
Management, Business, Science and Arts Occupations
The most common Management, Business, Science and Arts occupations in Snoqualmie are Management (1,756 | 22.4%), Computers, Engineering & Science (1,528 | 19.5%), Computers & Mathematics (1,045 | 13.3%), Community & Social Service (907 | 11.6%), and Business & Financial (589 | 7.5%).
Management, Business, Science and Arts Occupations by Sex
Within the Management, Business, Science and Arts occupations in Snoqualmie, the most male-oriented occupations are Computers & Mathematics (85.0%), Computers, Engineering & Science (81.7%), and Architecture & Engineering (81.6%), while the most female-oriented occupations are Education Instruction & Library (80.9%), Health Diagnosing & Treating (76.6%), and Education, Arts & Media (76.6%).
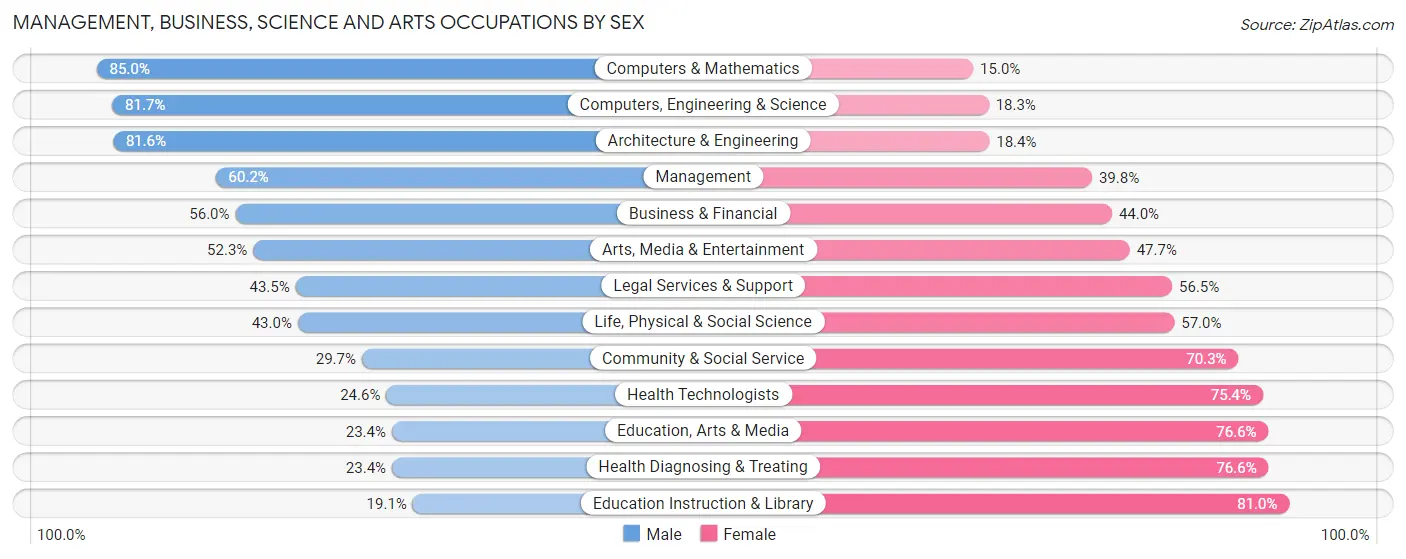
| Occupation | Male | Female |
| Management | 1,057 (60.2%) | 699 (39.8%) |
| Business & Financial | 330 (56.0%) | 259 (44.0%) |
| Computers, Engineering & Science | 1,249 (81.7%) | 279 (18.3%) |
| Computers & Mathematics | 888 (85.0%) | 157 (15.0%) |
| Architecture & Engineering | 324 (81.6%) | 73 (18.4%) |
| Life, Physical & Social Science | 37 (43.0%) | 49 (57.0%) |
| Community & Social Service | 269 (29.7%) | 638 (70.3%) |
| Education, Arts & Media | 33 (23.4%) | 108 (76.6%) |
| Legal Services & Support | 20 (43.5%) | 26 (56.5%) |
| Education Instruction & Library | 92 (19.1%) | 391 (80.9%) |
| Arts, Media & Entertainment | 124 (52.3%) | 113 (47.7%) |
| Health Diagnosing & Treating | 83 (23.4%) | 272 (76.6%) |
| Health Technologists | 70 (24.6%) | 215 (75.4%) |
| Total (Category) | 2,988 (58.2%) | 2,147 (41.8%) |
| Total (Overall) | 4,364 (55.6%) | 3,479 (44.4%) |
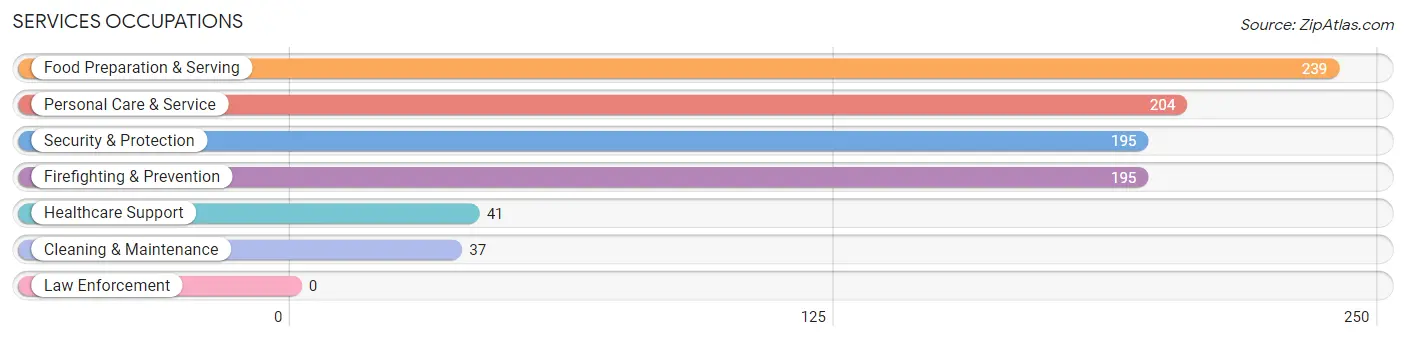
Services Occupations
The most common Services occupations in Snoqualmie are Food Preparation & Serving (239 | 3.0%), Personal Care & Service (204 | 2.6%), Security & Protection (195 | 2.5%), Firefighting & Prevention (195 | 2.5%), and Healthcare Support (41 | 0.5%).
Services Occupations by Sex
Within the Services occupations in Snoqualmie, the most male-oriented occupations are Cleaning & Maintenance (100.0%), Security & Protection (95.9%), and Firefighting & Prevention (95.9%), while the most female-oriented occupations are Healthcare Support (100.0%), Personal Care & Service (77.4%), and Food Preparation & Serving (60.7%).
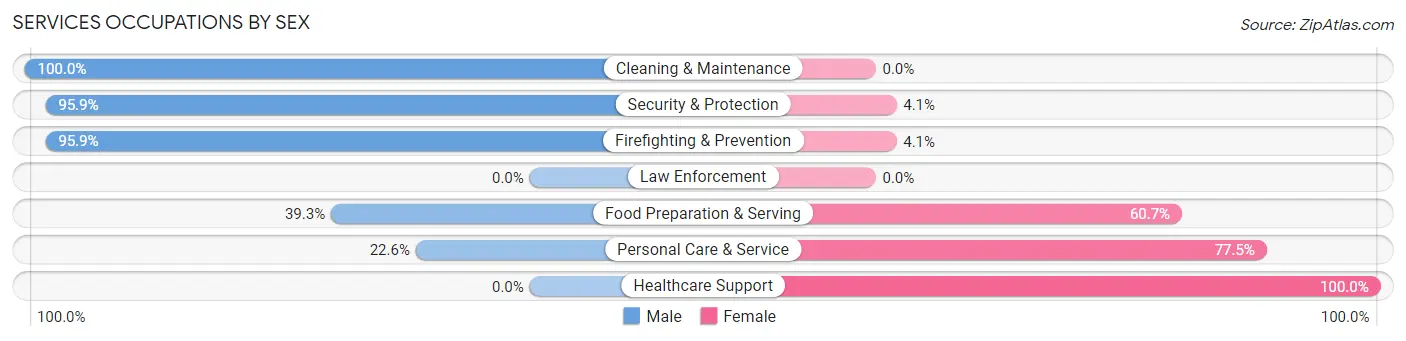
| Occupation | Male | Female |
| Healthcare Support | 0 (0.0%) | 41 (100.0%) |
| Security & Protection | 187 (95.9%) | 8 (4.1%) |
| Firefighting & Prevention | 187 (95.9%) | 8 (4.1%) |
| Law Enforcement | 0 (0.0%) | 0 (0.0%) |
| Food Preparation & Serving | 94 (39.3%) | 145 (60.7%) |
| Cleaning & Maintenance | 37 (100.0%) | 0 (0.0%) |
| Personal Care & Service | 46 (22.6%) | 158 (77.4%) |
| Total (Category) | 364 (50.8%) | 352 (49.2%) |
| Total (Overall) | 4,364 (55.6%) | 3,479 (44.4%) |
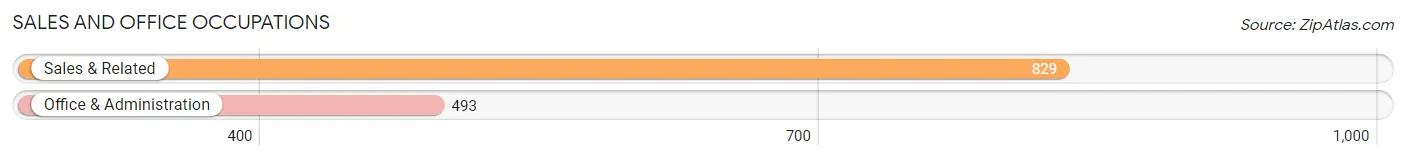
Sales and Office Occupations
The most common Sales and Office occupations in Snoqualmie are Sales & Related (829 | 10.6%), and Office & Administration (493 | 6.3%).
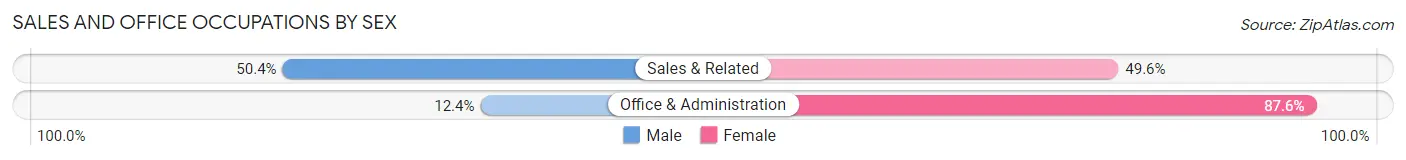
Sales and Office Occupations by Sex
| Occupation | Male | Female |
| Sales & Related | 418 (50.4%) | 411 (49.6%) |
| Office & Administration | 61 (12.4%) | 432 (87.6%) |
| Total (Category) | 479 (36.2%) | 843 (63.8%) |
| Total (Overall) | 4,364 (55.6%) | 3,479 (44.4%) |
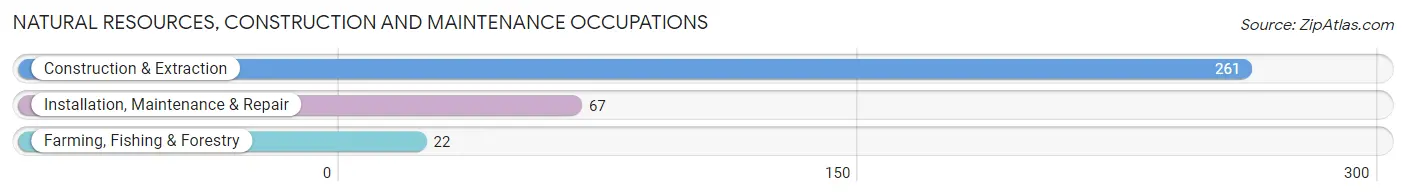
Natural Resources, Construction and Maintenance Occupations
The most common Natural Resources, Construction and Maintenance occupations in Snoqualmie are Construction & Extraction (261 | 3.3%), Installation, Maintenance & Repair (67 | 0.9%), and Farming, Fishing & Forestry (22 | 0.3%).
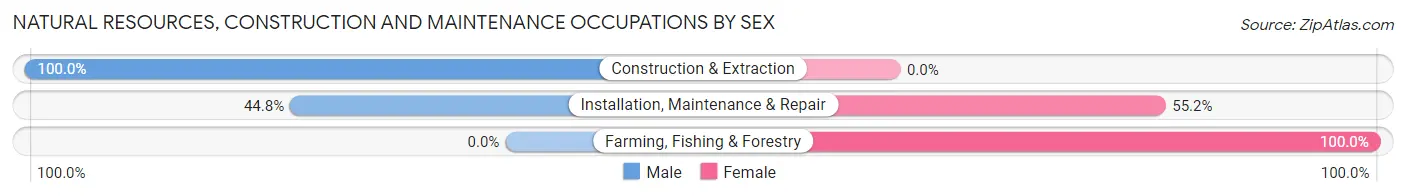
Natural Resources, Construction and Maintenance Occupations by Sex
| Occupation | Male | Female |
| Farming, Fishing & Forestry | 0 (0.0%) | 22 (100.0%) |
| Construction & Extraction | 261 (100.0%) | 0 (0.0%) |
| Installation, Maintenance & Repair | 30 (44.8%) | 37 (55.2%) |
| Total (Category) | 291 (83.1%) | 59 (16.9%) |
| Total (Overall) | 4,364 (55.6%) | 3,479 (44.4%) |
Production, Transportation and Moving Occupations
The most common Production, Transportation and Moving occupations in Snoqualmie are Material Moving (118 | 1.5%), Transportation (112 | 1.4%), and Production (90 | 1.1%).
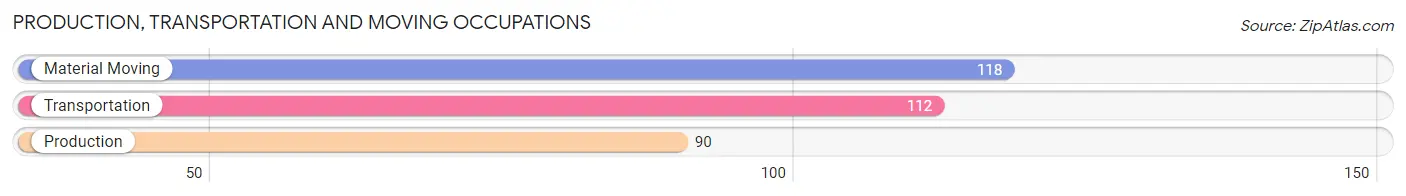
Production, Transportation and Moving Occupations by Sex
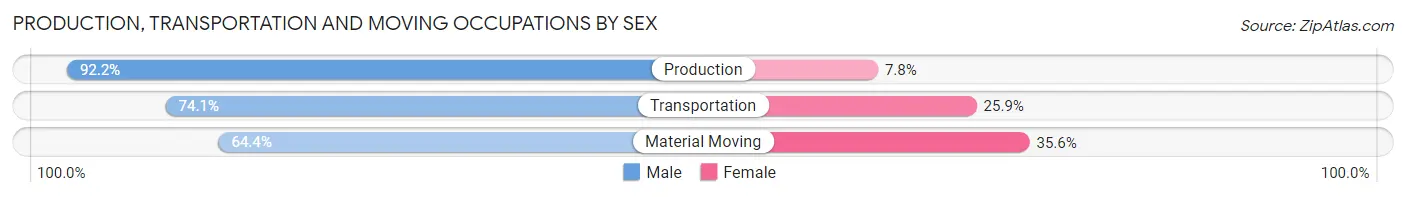
| Occupation | Male | Female |
| Production | 83 (92.2%) | 7 (7.8%) |
| Transportation | 83 (74.1%) | 29 (25.9%) |
| Material Moving | 76 (64.4%) | 42 (35.6%) |
| Total (Category) | 242 (75.6%) | 78 (24.4%) |
| Total (Overall) | 4,364 (55.6%) | 3,479 (44.4%) |
Employment Industries by Sex in Snoqualmie
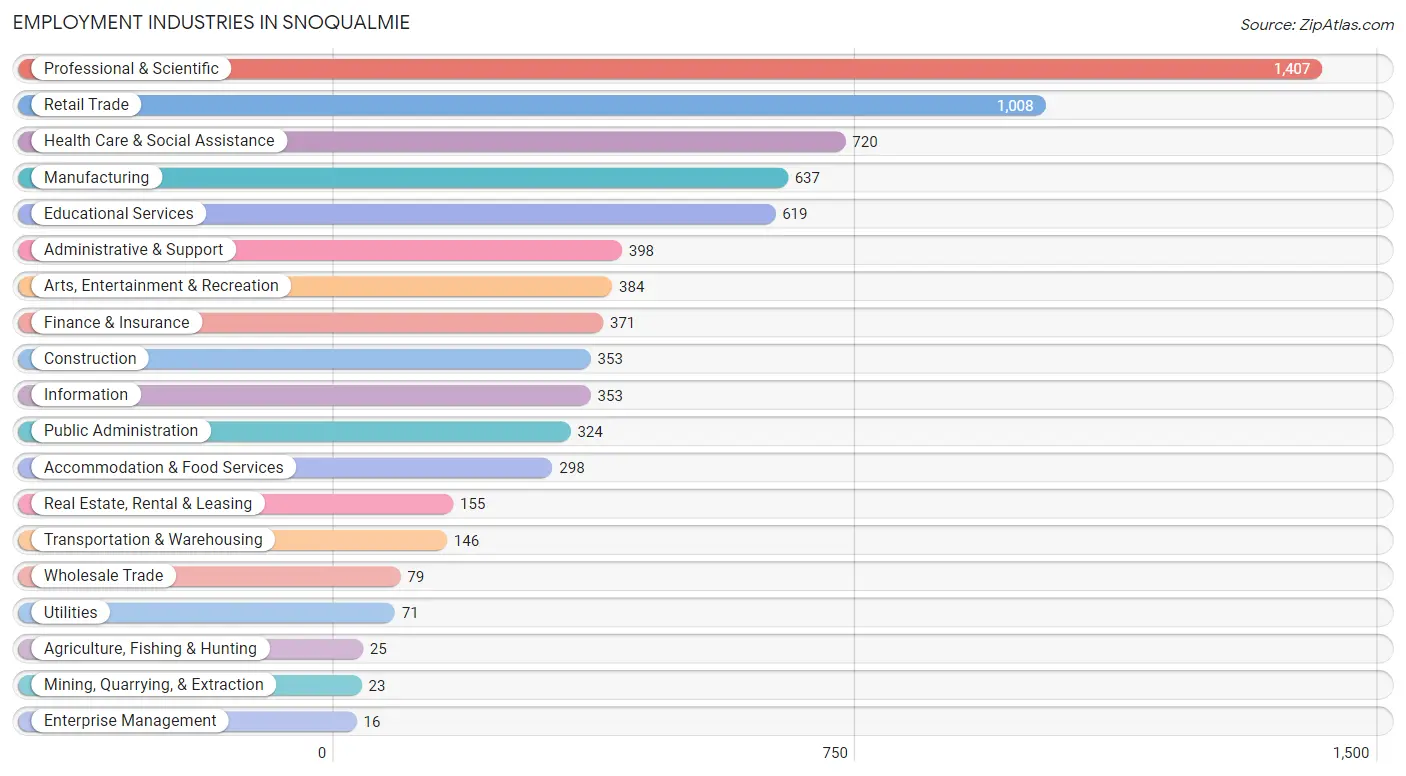
Employment Industries in Snoqualmie
The major employment industries in Snoqualmie include Professional & Scientific (1,407 | 17.9%), Retail Trade (1,008 | 12.9%), Health Care & Social Assistance (720 | 9.2%), Manufacturing (637 | 8.1%), and Educational Services (619 | 7.9%).
Employment Industries by Sex in Snoqualmie
The Snoqualmie industries that see more men than women are Mining, Quarrying, & Extraction (100.0%), Utilities (100.0%), and Construction (96.6%), whereas the industries that tend to have a higher number of women are Agriculture, Fishing & Hunting (100.0%), Enterprise Management (100.0%), and Health Care & Social Assistance (80.3%).
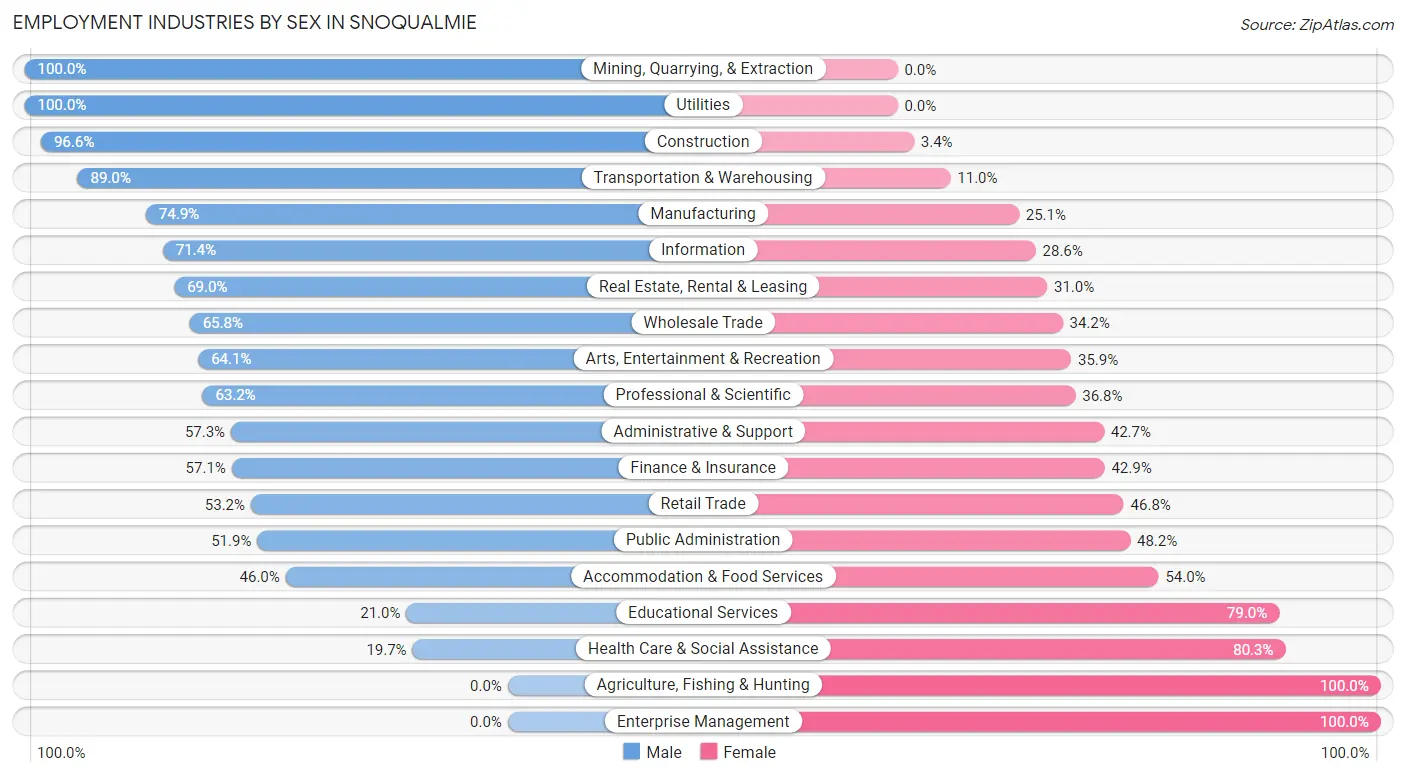
| Industry | Male | Female |
| Agriculture, Fishing & Hunting | 0 (0.0%) | 25 (100.0%) |
| Mining, Quarrying, & Extraction | 23 (100.0%) | 0 (0.0%) |
| Construction | 341 (96.6%) | 12 (3.4%) |
| Manufacturing | 477 (74.9%) | 160 (25.1%) |
| Wholesale Trade | 52 (65.8%) | 27 (34.2%) |
| Retail Trade | 536 (53.2%) | 472 (46.8%) |
| Transportation & Warehousing | 130 (89.0%) | 16 (11.0%) |
| Utilities | 71 (100.0%) | 0 (0.0%) |
| Information | 252 (71.4%) | 101 (28.6%) |
| Finance & Insurance | 212 (57.1%) | 159 (42.9%) |
| Real Estate, Rental & Leasing | 107 (69.0%) | 48 (31.0%) |
| Professional & Scientific | 889 (63.2%) | 518 (36.8%) |
| Enterprise Management | 0 (0.0%) | 16 (100.0%) |
| Administrative & Support | 228 (57.3%) | 170 (42.7%) |
| Educational Services | 130 (21.0%) | 489 (79.0%) |
| Health Care & Social Assistance | 142 (19.7%) | 578 (80.3%) |
| Arts, Entertainment & Recreation | 246 (64.1%) | 138 (35.9%) |
| Accommodation & Food Services | 137 (46.0%) | 161 (54.0%) |
| Public Administration | 168 (51.8%) | 156 (48.1%) |
| Total | 4,364 (55.6%) | 3,479 (44.4%) |
Education in Snoqualmie
School Enrollment in Snoqualmie
The most common levels of schooling among the 4,119 students in Snoqualmie are elementary school (1,138 | 27.6%), middle school (1,071 | 26.0%), and high school (978 | 23.7%).
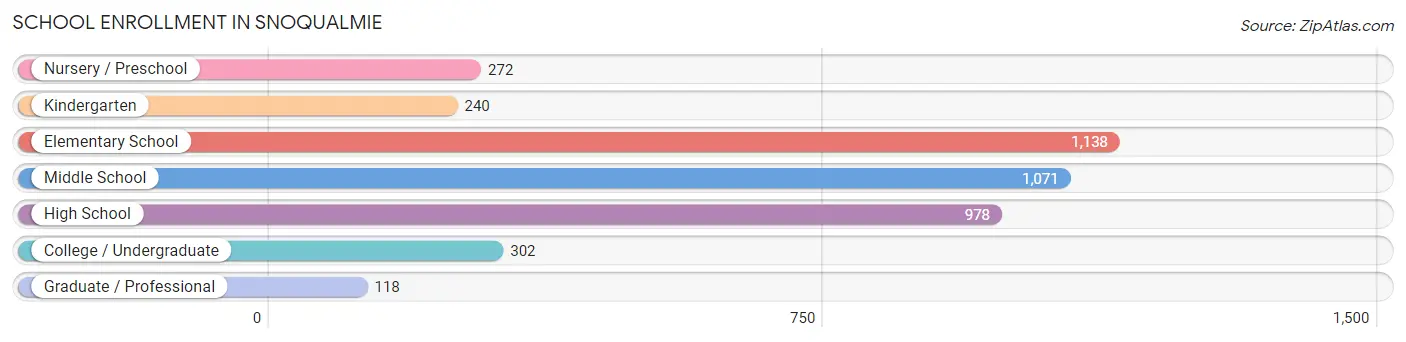
| School Level | # Students | % Students |
| Nursery / Preschool | 272 | 6.6% |
| Kindergarten | 240 | 5.8% |
| Elementary School | 1,138 | 27.6% |
| Middle School | 1,071 | 26.0% |
| High School | 978 | 23.7% |
| College / Undergraduate | 302 | 7.3% |
| Graduate / Professional | 118 | 2.9% |
| Total | 4,119 | 100.0% |
School Enrollment by Age by Funding Source in Snoqualmie
Out of a total of 4,119 students who are enrolled in schools in Snoqualmie, 919 (22.3%) attend a private institution, while the remaining 3,200 (77.7%) are enrolled in public schools. The age group of 3 to 4 year olds has the highest likelihood of being enrolled in private schools, with 169 (90.9% in the age bracket) enrolled. Conversely, the age group of 15 to 17 year olds has the lowest likelihood of being enrolled in a private school, with 620 (88.2% in the age bracket) attending a public institution.
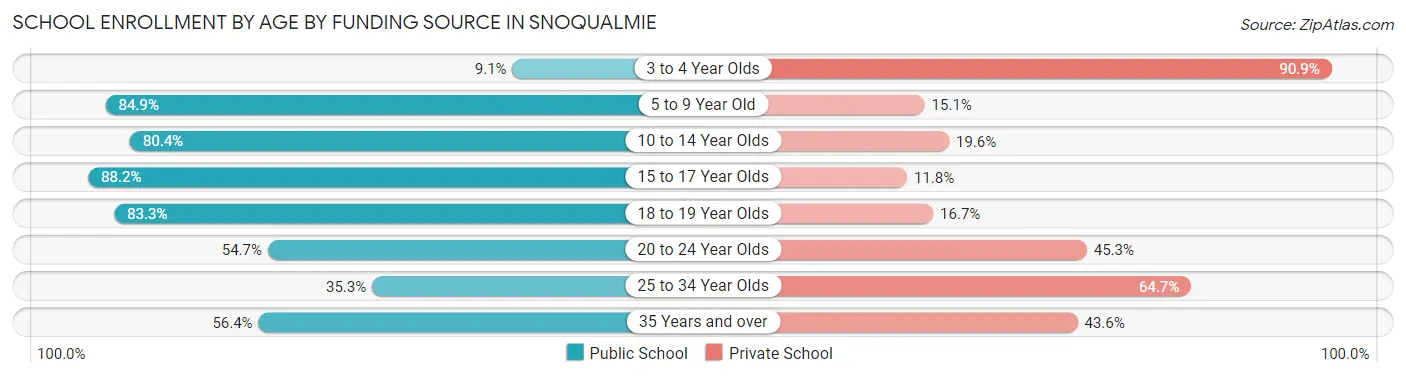
| Age Bracket | Public School | Private School |
| 3 to 4 Year Olds | 17 (9.1%) | 169 (90.9%) |
| 5 to 9 Year Old | 1,069 (84.9%) | 190 (15.1%) |
| 10 to 14 Year Olds | 1,180 (80.4%) | 288 (19.6%) |
| 15 to 17 Year Olds | 620 (88.2%) | 83 (11.8%) |
| 18 to 19 Year Olds | 125 (83.3%) | 25 (16.7%) |
| 20 to 24 Year Olds | 64 (54.7%) | 53 (45.3%) |
| 25 to 34 Year Olds | 12 (35.3%) | 22 (64.7%) |
| 35 Years and over | 114 (56.4%) | 88 (43.6%) |
| Total | 3,200 (77.7%) | 919 (22.3%) |
Educational Attainment by Field of Study in Snoqualmie
Business (1,153 | 17.4%), computers & mathematics (860 | 13.0%), social sciences (714 | 10.7%), engineering (673 | 10.1%), and liberal arts & history (607 | 9.1%) are the most common fields of study among 6,639 individuals in Snoqualmie who have obtained a bachelor's degree or higher.
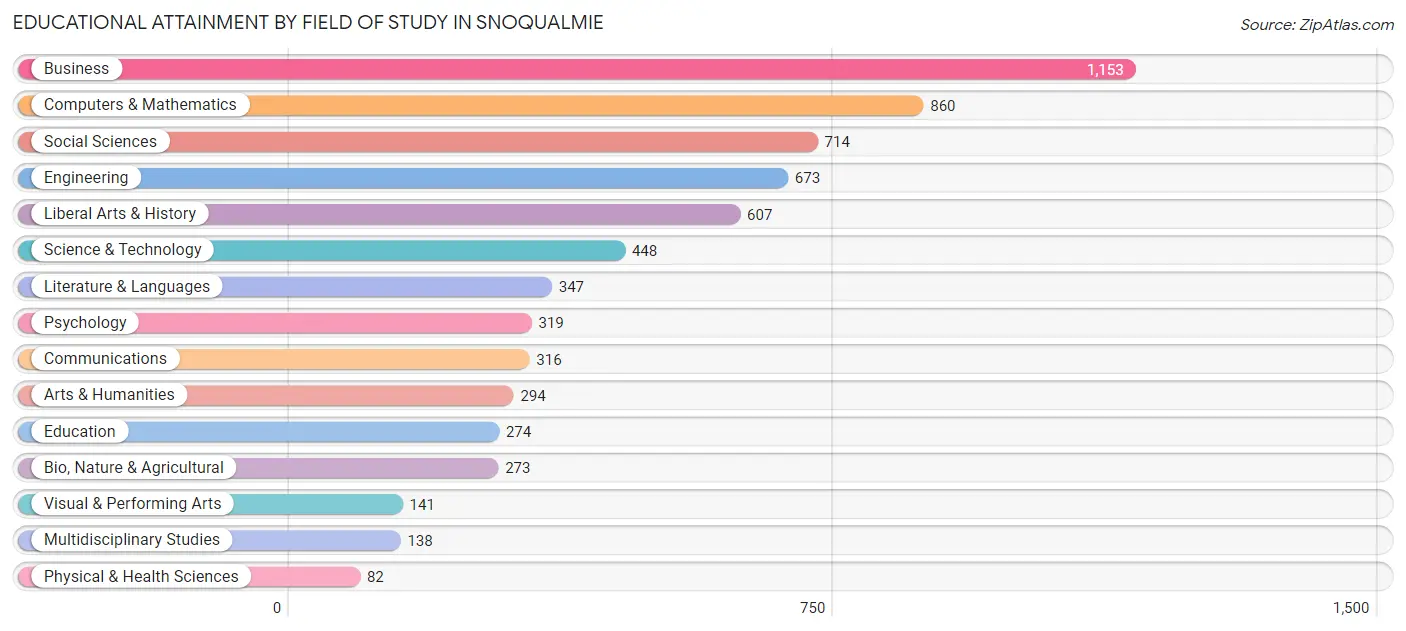
| Field of Study | # Graduates | % Graduates |
| Computers & Mathematics | 860 | 13.0% |
| Bio, Nature & Agricultural | 273 | 4.1% |
| Physical & Health Sciences | 82 | 1.2% |
| Psychology | 319 | 4.8% |
| Social Sciences | 714 | 10.7% |
| Engineering | 673 | 10.1% |
| Multidisciplinary Studies | 138 | 2.1% |
| Science & Technology | 448 | 6.8% |
| Business | 1,153 | 17.4% |
| Education | 274 | 4.1% |
| Literature & Languages | 347 | 5.2% |
| Liberal Arts & History | 607 | 9.1% |
| Visual & Performing Arts | 141 | 2.1% |
| Communications | 316 | 4.8% |
| Arts & Humanities | 294 | 4.4% |
| Total | 6,639 | 100.0% |
Transportation & Commute in Snoqualmie
Vehicle Availability by Sex in Snoqualmie
The most prevalent vehicle ownership categories in Snoqualmie are males with 2 vehicles (2,489, accounting for 57.8%) and females with 2 vehicles (2,204, making up 72.9%).
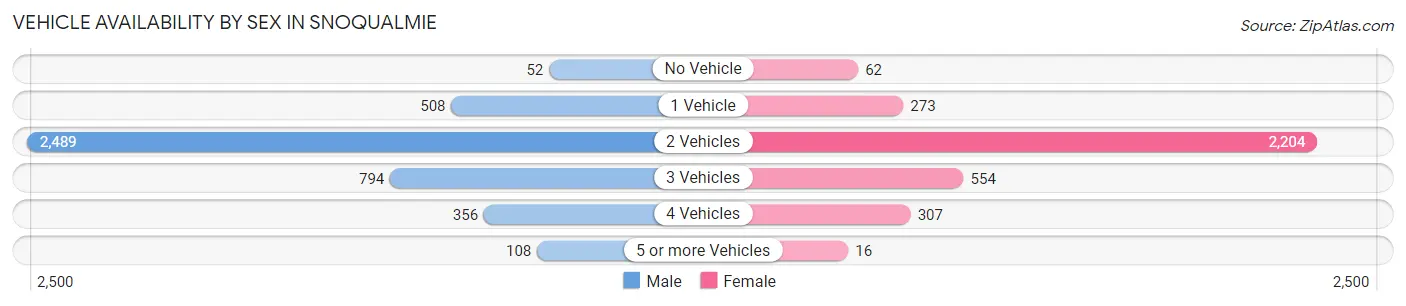
| Vehicles Available | Male | Female |
| No Vehicle | 52 (1.2%) | 62 (1.8%) |
| 1 Vehicle | 508 (11.8%) | 273 (8.0%) |
| 2 Vehicles | 2,489 (57.8%) | 2,204 (64.5%) |
| 3 Vehicles | 794 (18.4%) | 554 (16.2%) |
| 4 Vehicles | 356 (8.3%) | 307 (9.0%) |
| 5 or more Vehicles | 108 (2.5%) | 16 (0.5%) |
| Total | 4,307 (100.0%) | 3,416 (100.0%) |
Commute Time in Snoqualmie
The most frequently occuring commute durations in Snoqualmie are 45 to 59 minutes (848 commuters, 14.6%), 5 to 9 minutes (783 commuters, 13.5%), and 30 to 34 minutes (650 commuters, 11.2%).
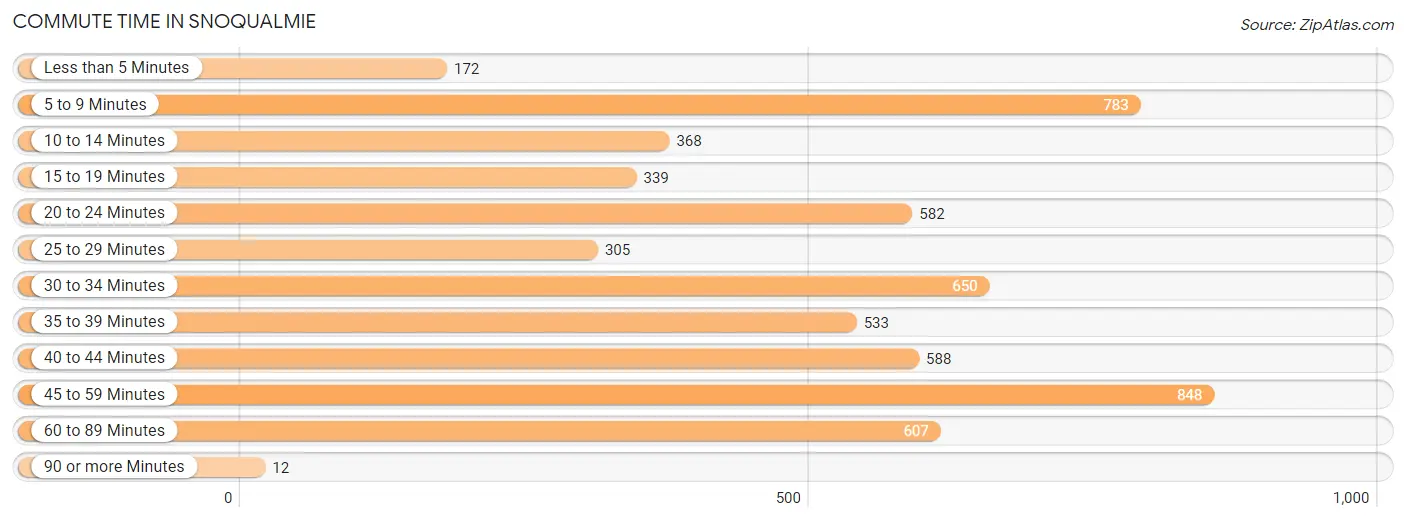
| Commute Time | # Commuters | % Commuters |
| Less than 5 Minutes | 172 | 3.0% |
| 5 to 9 Minutes | 783 | 13.5% |
| 10 to 14 Minutes | 368 | 6.4% |
| 15 to 19 Minutes | 339 | 5.9% |
| 20 to 24 Minutes | 582 | 10.1% |
| 25 to 29 Minutes | 305 | 5.3% |
| 30 to 34 Minutes | 650 | 11.2% |
| 35 to 39 Minutes | 533 | 9.2% |
| 40 to 44 Minutes | 588 | 10.2% |
| 45 to 59 Minutes | 848 | 14.6% |
| 60 to 89 Minutes | 607 | 10.5% |
| 90 or more Minutes | 12 | 0.2% |
Commute Time by Sex in Snoqualmie
The most common commute times in Snoqualmie are 60 to 89 minutes (527 commuters, 15.7%) for males and 45 to 59 minutes (409 commuters, 16.8%) for females.
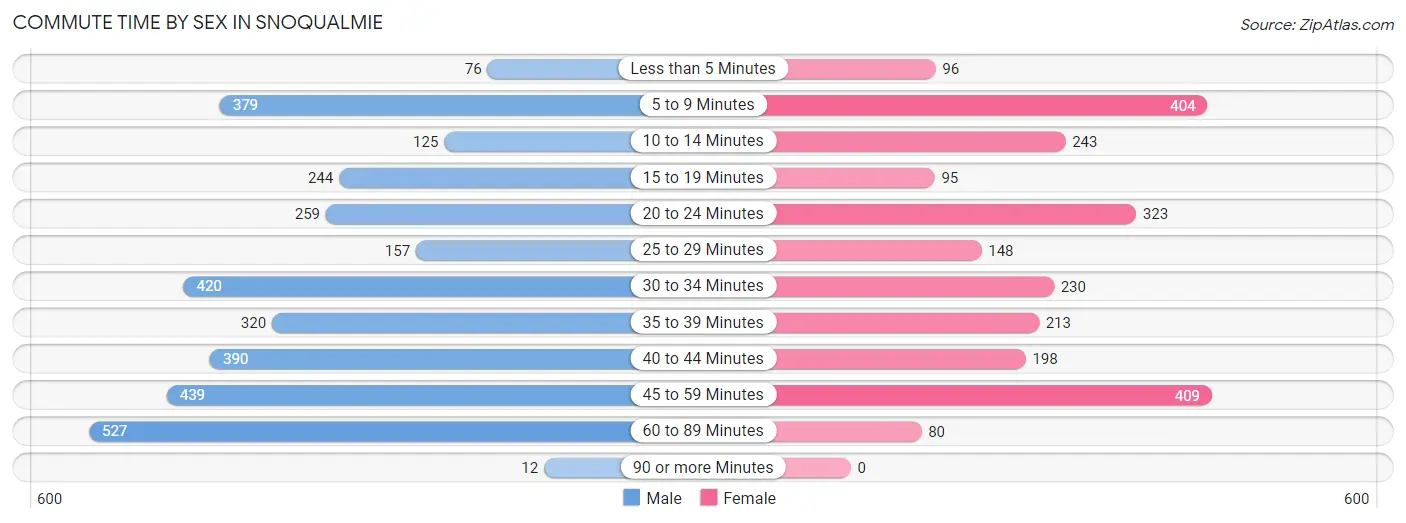
| Commute Time | Male | Female |
| Less than 5 Minutes | 76 (2.3%) | 96 (3.9%) |
| 5 to 9 Minutes | 379 (11.3%) | 404 (16.6%) |
| 10 to 14 Minutes | 125 (3.7%) | 243 (10.0%) |
| 15 to 19 Minutes | 244 (7.3%) | 95 (3.9%) |
| 20 to 24 Minutes | 259 (7.7%) | 323 (13.2%) |
| 25 to 29 Minutes | 157 (4.7%) | 148 (6.1%) |
| 30 to 34 Minutes | 420 (12.5%) | 230 (9.4%) |
| 35 to 39 Minutes | 320 (9.6%) | 213 (8.7%) |
| 40 to 44 Minutes | 390 (11.7%) | 198 (8.1%) |
| 45 to 59 Minutes | 439 (13.1%) | 409 (16.8%) |
| 60 to 89 Minutes | 527 (15.7%) | 80 (3.3%) |
| 90 or more Minutes | 12 (0.4%) | 0 (0.0%) |
Time of Departure to Work by Sex in Snoqualmie
The most frequent times of departure to work in Snoqualmie are 8:00 AM to 8:29 AM (512, 15.3%) for males and 8:00 AM to 8:29 AM (381, 15.6%) for females.
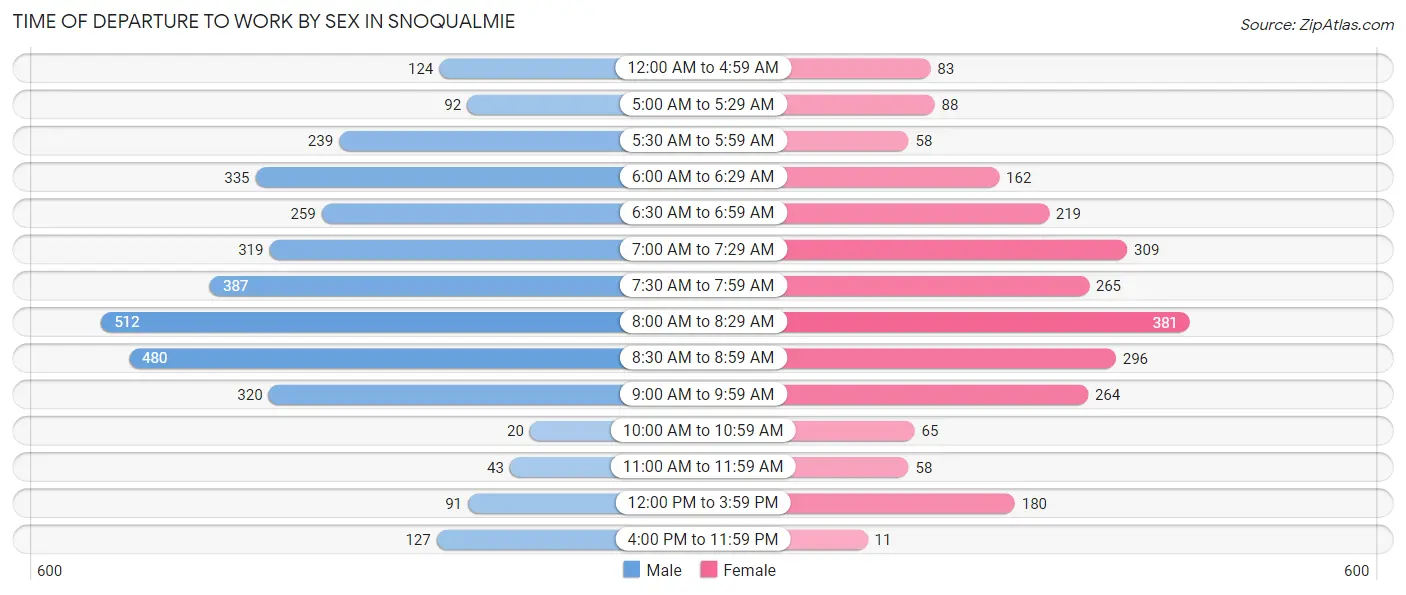
| Time of Departure | Male | Female |
| 12:00 AM to 4:59 AM | 124 (3.7%) | 83 (3.4%) |
| 5:00 AM to 5:29 AM | 92 (2.8%) | 88 (3.6%) |
| 5:30 AM to 5:59 AM | 239 (7.1%) | 58 (2.4%) |
| 6:00 AM to 6:29 AM | 335 (10.0%) | 162 (6.6%) |
| 6:30 AM to 6:59 AM | 259 (7.7%) | 219 (9.0%) |
| 7:00 AM to 7:29 AM | 319 (9.5%) | 309 (12.7%) |
| 7:30 AM to 7:59 AM | 387 (11.6%) | 265 (10.9%) |
| 8:00 AM to 8:29 AM | 512 (15.3%) | 381 (15.6%) |
| 8:30 AM to 8:59 AM | 480 (14.3%) | 296 (12.1%) |
| 9:00 AM to 9:59 AM | 320 (9.6%) | 264 (10.8%) |
| 10:00 AM to 10:59 AM | 20 (0.6%) | 65 (2.7%) |
| 11:00 AM to 11:59 AM | 43 (1.3%) | 58 (2.4%) |
| 12:00 PM to 3:59 PM | 91 (2.7%) | 180 (7.4%) |
| 4:00 PM to 11:59 PM | 127 (3.8%) | 11 (0.4%) |
| Total | 3,348 (100.0%) | 2,439 (100.0%) |
Housing Occupancy in Snoqualmie
Occupancy by Ownership in Snoqualmie
Of the total 4,539 dwellings in Snoqualmie, owner-occupied units account for 3,857 (85.0%), while renter-occupied units make up 682 (15.0%).
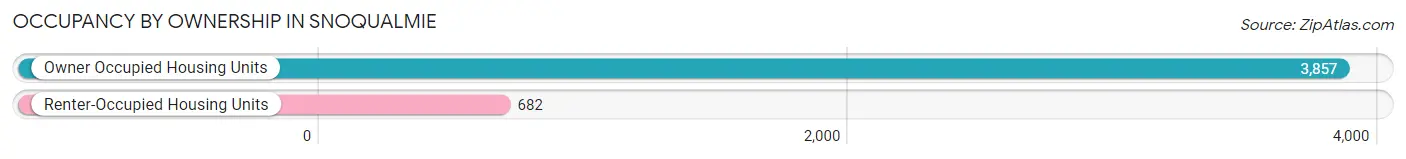
| Occupancy | # Housing Units | % Housing Units |
| Owner Occupied Housing Units | 3,857 | 85.0% |
| Renter-Occupied Housing Units | 682 | 15.0% |
| Total Occupied Housing Units | 4,539 | 100.0% |
Occupancy by Household Size in Snoqualmie
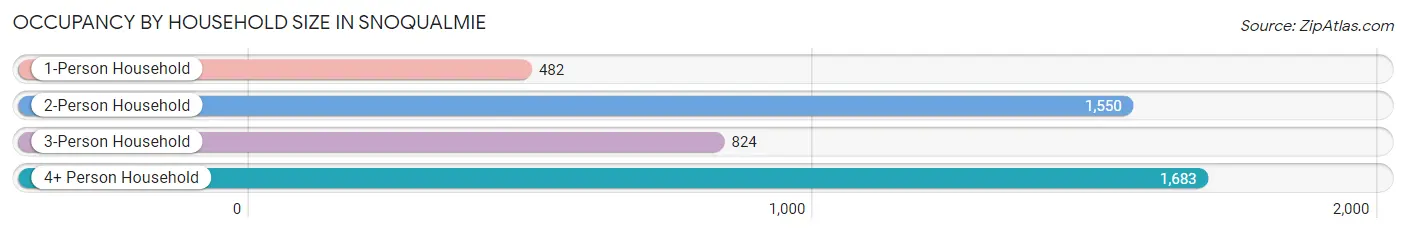
| Household Size | # Housing Units | % Housing Units |
| 1-Person Household | 482 | 10.6% |
| 2-Person Household | 1,550 | 34.2% |
| 3-Person Household | 824 | 18.1% |
| 4+ Person Household | 1,683 | 37.1% |
| Total Housing Units | 4,539 | 100.0% |
Occupancy by Ownership by Household Size in Snoqualmie
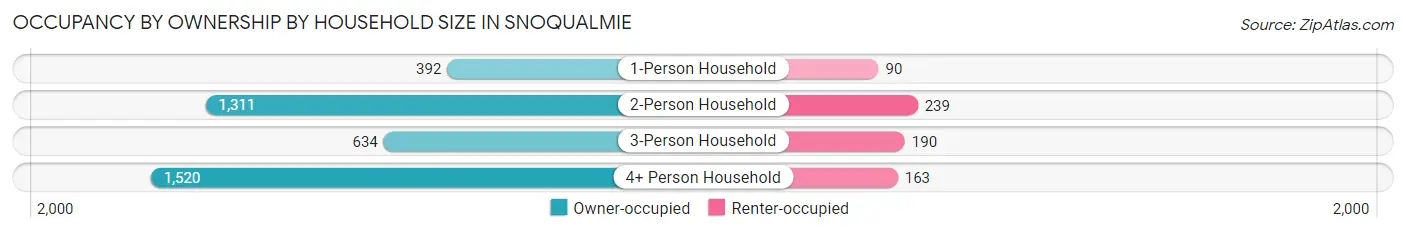
| Household Size | Owner-occupied | Renter-occupied |
| 1-Person Household | 392 (81.3%) | 90 (18.7%) |
| 2-Person Household | 1,311 (84.6%) | 239 (15.4%) |
| 3-Person Household | 634 (76.9%) | 190 (23.1%) |
| 4+ Person Household | 1,520 (90.3%) | 163 (9.7%) |
| Total Housing Units | 3,857 (85.0%) | 682 (15.0%) |
Occupancy by Educational Attainment in Snoqualmie
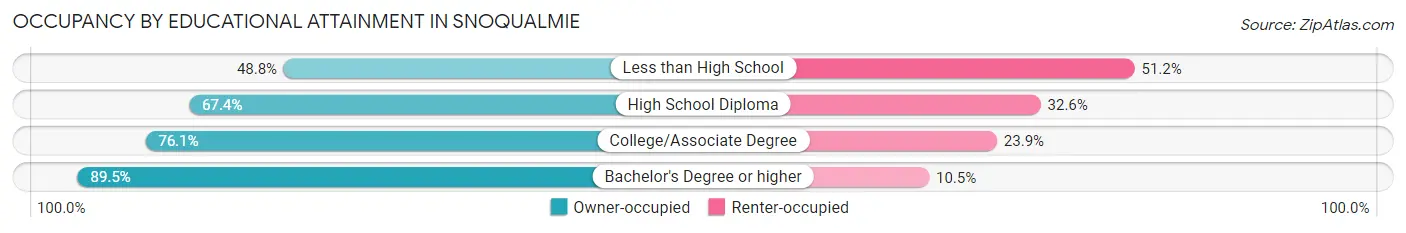
| Household Size | Owner-occupied | Renter-occupied |
| Less than High School | 20 (48.8%) | 21 (51.2%) |
| High School Diploma | 153 (67.4%) | 74 (32.6%) |
| College/Associate Degree | 788 (76.1%) | 248 (23.9%) |
| Bachelor's Degree or higher | 2,896 (89.5%) | 339 (10.5%) |
Occupancy by Age of Householder in Snoqualmie
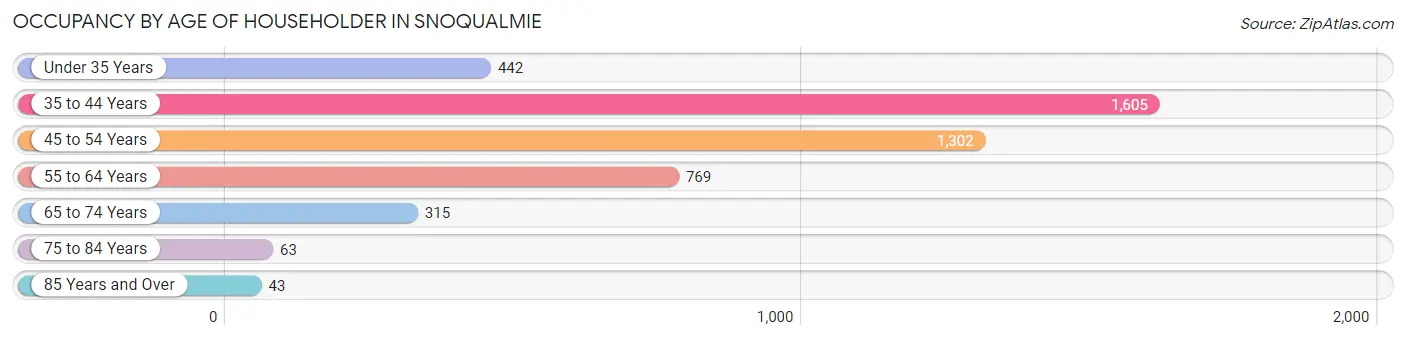
| Age Bracket | # Households | % Households |
| Under 35 Years | 442 | 9.7% |
| 35 to 44 Years | 1,605 | 35.4% |
| 45 to 54 Years | 1,302 | 28.7% |
| 55 to 64 Years | 769 | 16.9% |
| 65 to 74 Years | 315 | 6.9% |
| 75 to 84 Years | 63 | 1.4% |
| 85 Years and Over | 43 | 0.9% |
| Total | 4,539 | 100.0% |
Housing Finances in Snoqualmie
Median Income by Occupancy in Snoqualmie

| Occupancy Type | # Households | Median Income |
| Owner-Occupied | 3,857 (85.0%) | $206,058 |
| Renter-Occupied | 682 (15.0%) | $135,491 |
| Average | 4,539 (100.0%) | $186,353 |
Occupancy by Householder Income Bracket in Snoqualmie
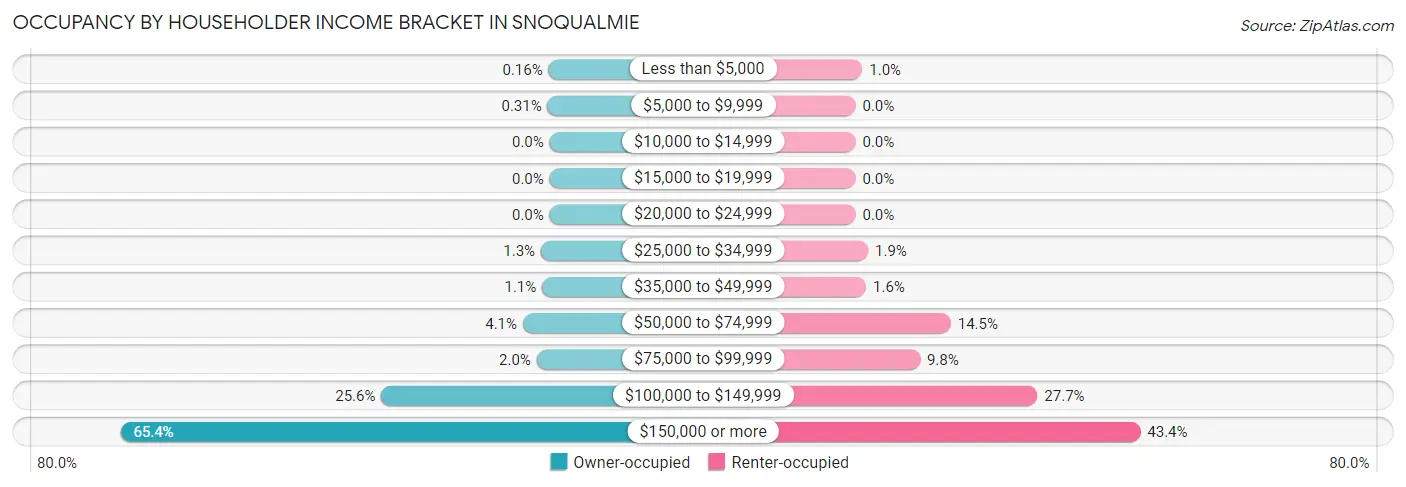
| Income Bracket | Owner-occupied | Renter-occupied |
| Less than $5,000 | 6 (0.2%) | 7 (1.0%) |
| $5,000 to $9,999 | 12 (0.3%) | 0 (0.0%) |
| $10,000 to $14,999 | 0 (0.0%) | 0 (0.0%) |
| $15,000 to $19,999 | 0 (0.0%) | 0 (0.0%) |
| $20,000 to $24,999 | 0 (0.0%) | 0 (0.0%) |
| $25,000 to $34,999 | 51 (1.3%) | 13 (1.9%) |
| $35,000 to $49,999 | 44 (1.1%) | 11 (1.6%) |
| $50,000 to $74,999 | 157 (4.1%) | 99 (14.5%) |
| $75,000 to $99,999 | 76 (2.0%) | 67 (9.8%) |
| $100,000 to $149,999 | 989 (25.6%) | 189 (27.7%) |
| $150,000 or more | 2,522 (65.4%) | 296 (43.4%) |
| Total | 3,857 (100.0%) | 682 (100.0%) |
Monthly Housing Cost Tiers in Snoqualmie
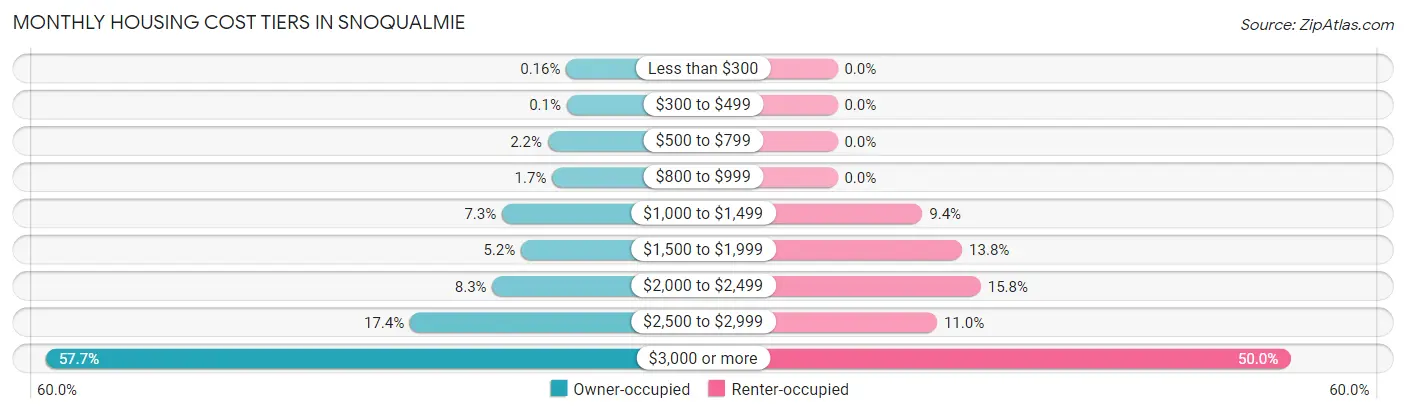
| Monthly Cost | Owner-occupied | Renter-occupied |
| Less than $300 | 6 (0.2%) | 0 (0.0%) |
| $300 to $499 | 4 (0.1%) | 0 (0.0%) |
| $500 to $799 | 85 (2.2%) | 0 (0.0%) |
| $800 to $999 | 66 (1.7%) | 0 (0.0%) |
| $1,000 to $1,499 | 280 (7.3%) | 64 (9.4%) |
| $1,500 to $1,999 | 199 (5.2%) | 94 (13.8%) |
| $2,000 to $2,499 | 321 (8.3%) | 108 (15.8%) |
| $2,500 to $2,999 | 672 (17.4%) | 75 (11.0%) |
| $3,000 or more | 2,224 (57.7%) | 341 (50.0%) |
| Total | 3,857 (100.0%) | 682 (100.0%) |
Physical Housing Characteristics in Snoqualmie
Housing Structures in Snoqualmie
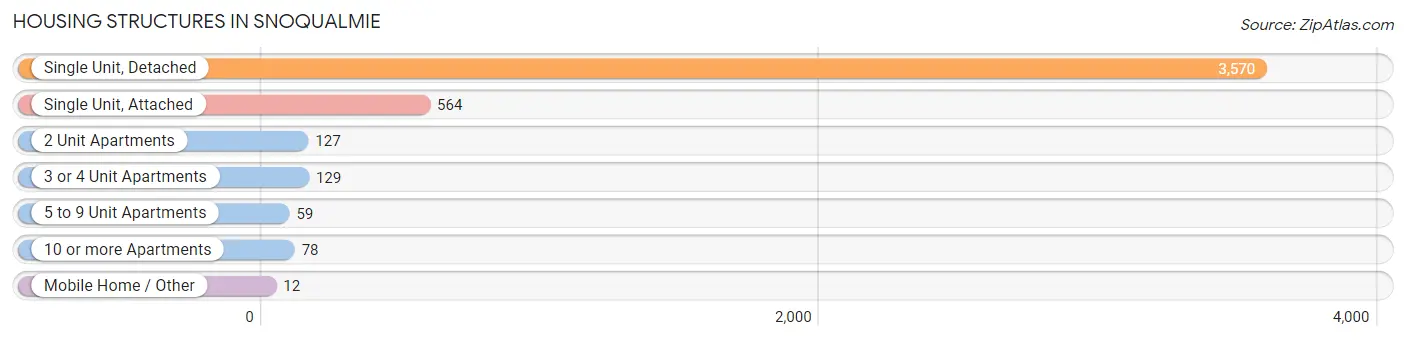
| Structure Type | # Housing Units | % Housing Units |
| Single Unit, Detached | 3,570 | 78.6% |
| Single Unit, Attached | 564 | 12.4% |
| 2 Unit Apartments | 127 | 2.8% |
| 3 or 4 Unit Apartments | 129 | 2.8% |
| 5 to 9 Unit Apartments | 59 | 1.3% |
| 10 or more Apartments | 78 | 1.7% |
| Mobile Home / Other | 12 | 0.3% |
| Total | 4,539 | 100.0% |
Housing Structures by Occupancy in Snoqualmie
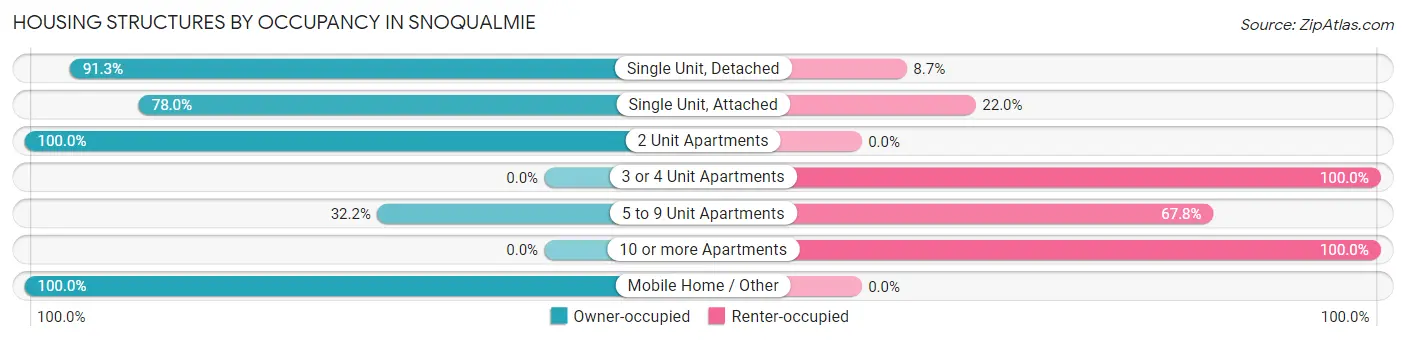
| Structure Type | Owner-occupied | Renter-occupied |
| Single Unit, Detached | 3,259 (91.3%) | 311 (8.7%) |
| Single Unit, Attached | 440 (78.0%) | 124 (22.0%) |
| 2 Unit Apartments | 127 (100.0%) | 0 (0.0%) |
| 3 or 4 Unit Apartments | 0 (0.0%) | 129 (100.0%) |
| 5 to 9 Unit Apartments | 19 (32.2%) | 40 (67.8%) |
| 10 or more Apartments | 0 (0.0%) | 78 (100.0%) |
| Mobile Home / Other | 12 (100.0%) | 0 (0.0%) |
| Total | 3,857 (85.0%) | 682 (15.0%) |
Housing Structures by Number of Rooms in Snoqualmie
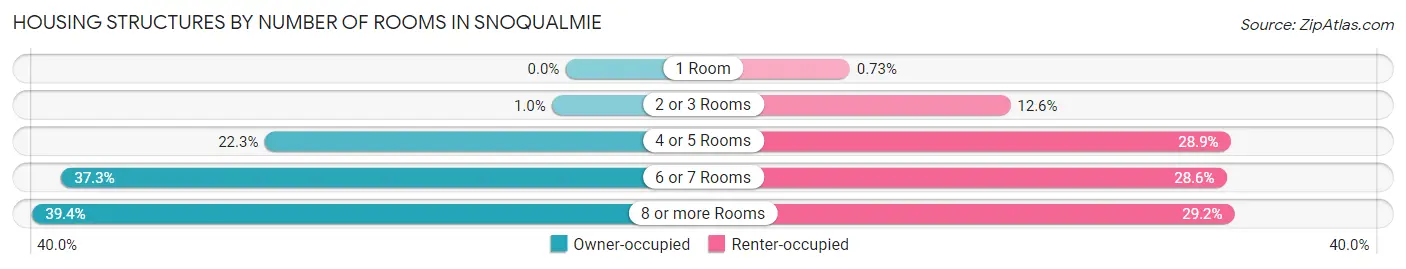
| Number of Rooms | Owner-occupied | Renter-occupied |
| 1 Room | 0 (0.0%) | 5 (0.7%) |
| 2 or 3 Rooms | 39 (1.0%) | 86 (12.6%) |
| 4 or 5 Rooms | 859 (22.3%) | 197 (28.9%) |
| 6 or 7 Rooms | 1,438 (37.3%) | 195 (28.6%) |
| 8 or more Rooms | 1,521 (39.4%) | 199 (29.2%) |
| Total | 3,857 (100.0%) | 682 (100.0%) |
Housing Structure by Heating Type in Snoqualmie
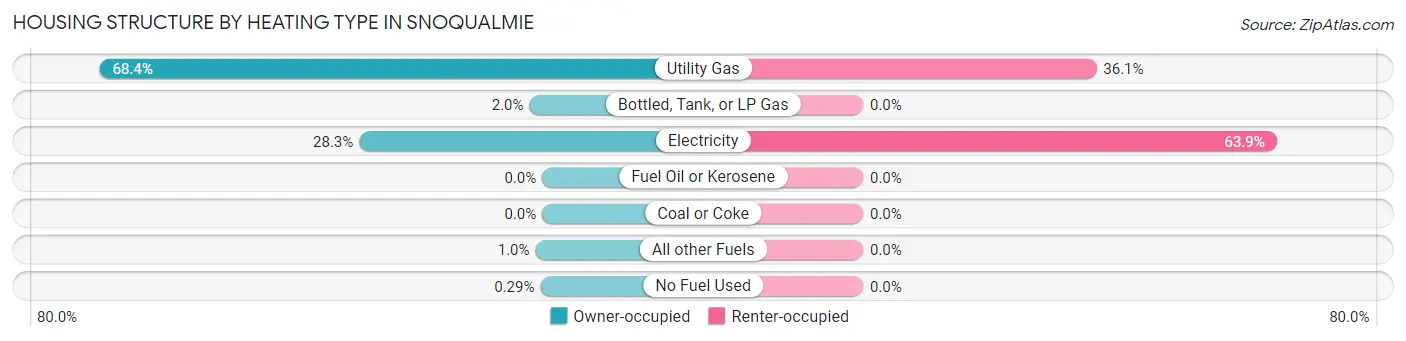
| Heating Type | Owner-occupied | Renter-occupied |
| Utility Gas | 2,639 (68.4%) | 246 (36.1%) |
| Bottled, Tank, or LP Gas | 76 (2.0%) | 0 (0.0%) |
| Electricity | 1,091 (28.3%) | 436 (63.9%) |
| Fuel Oil or Kerosene | 0 (0.0%) | 0 (0.0%) |
| Coal or Coke | 0 (0.0%) | 0 (0.0%) |
| All other Fuels | 40 (1.0%) | 0 (0.0%) |
| No Fuel Used | 11 (0.3%) | 0 (0.0%) |
| Total | 3,857 (100.0%) | 682 (100.0%) |
Household Vehicle Usage in Snoqualmie
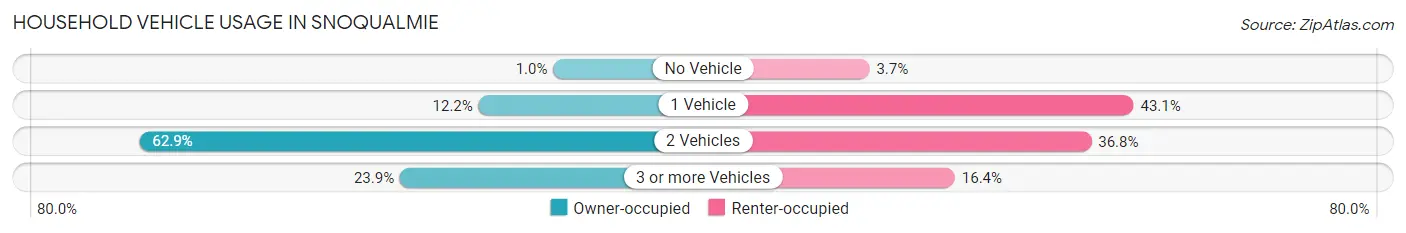
| Vehicles per Household | Owner-occupied | Renter-occupied |
| No Vehicle | 40 (1.0%) | 25 (3.7%) |
| 1 Vehicle | 470 (12.2%) | 294 (43.1%) |
| 2 Vehicles | 2,424 (62.8%) | 251 (36.8%) |
| 3 or more Vehicles | 923 (23.9%) | 112 (16.4%) |
| Total | 3,857 (100.0%) | 682 (100.0%) |
Real Estate & Mortgages in Snoqualmie
Real Estate and Mortgage Overview in Snoqualmie
| Characteristic | Without Mortgage | With Mortgage |
| Housing Units | 469 | 3,388 |
| Median Property Value | $740,500 | $858,500 |
| Median Household Income | $137,995 | $2,332 |
| Monthly Housing Costs | $1,206 | $2,224 |
| Real Estate Taxes | $7,673 | $15 |
Property Value by Mortgage Status in Snoqualmie
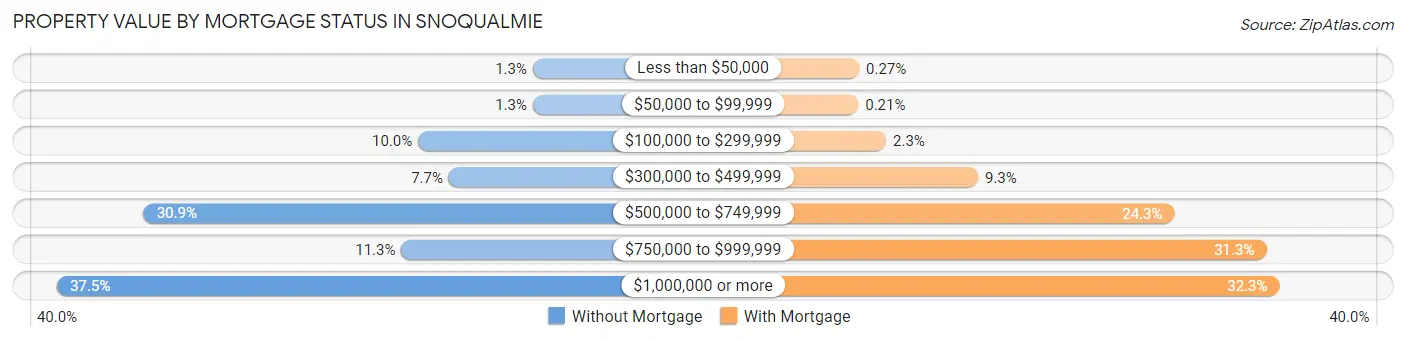
| Property Value | Without Mortgage | With Mortgage |
| Less than $50,000 | 6 (1.3%) | 9 (0.3%) |
| $50,000 to $99,999 | 6 (1.3%) | 7 (0.2%) |
| $100,000 to $299,999 | 47 (10.0%) | 79 (2.3%) |
| $300,000 to $499,999 | 36 (7.7%) | 316 (9.3%) |
| $500,000 to $749,999 | 145 (30.9%) | 823 (24.3%) |
| $750,000 to $999,999 | 53 (11.3%) | 1,060 (31.3%) |
| $1,000,000 or more | 176 (37.5%) | 1,094 (32.3%) |
| Total | 469 (100.0%) | 3,388 (100.0%) |
Household Income by Mortgage Status in Snoqualmie
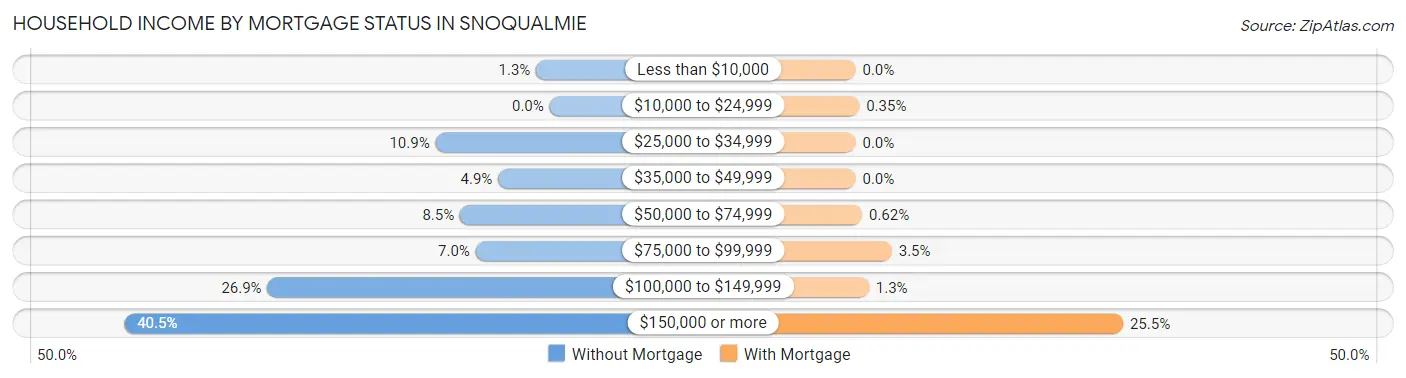
| Household Income | Without Mortgage | With Mortgage |
| Less than $10,000 | 6 (1.3%) | 0 (0.0%) |
| $10,000 to $24,999 | 0 (0.0%) | 12 (0.4%) |
| $25,000 to $34,999 | 51 (10.9%) | 0 (0.0%) |
| $35,000 to $49,999 | 23 (4.9%) | 0 (0.0%) |
| $50,000 to $74,999 | 40 (8.5%) | 21 (0.6%) |
| $75,000 to $99,999 | 33 (7.0%) | 117 (3.5%) |
| $100,000 to $149,999 | 126 (26.9%) | 43 (1.3%) |
| $150,000 or more | 190 (40.5%) | 863 (25.5%) |
| Total | 469 (100.0%) | 3,388 (100.0%) |
Property Value to Household Income Ratio in Snoqualmie
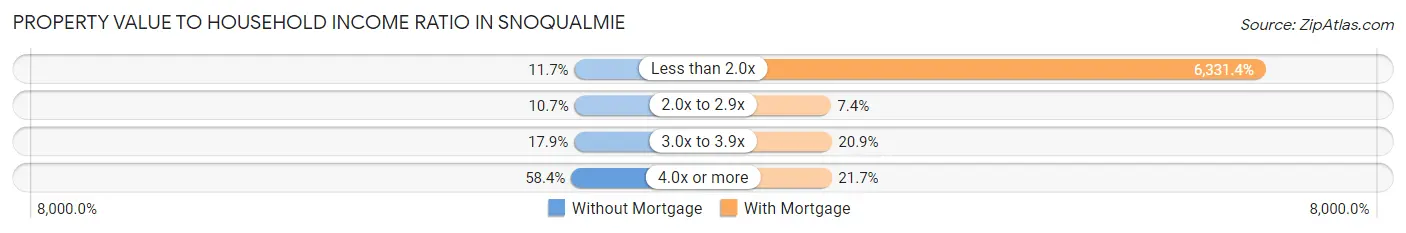
| Value-to-Income Ratio | Without Mortgage | With Mortgage |
| Less than 2.0x | 55 (11.7%) | 214,508 (6,331.4%) |
| 2.0x to 2.9x | 50 (10.7%) | 251 (7.4%) |
| 3.0x to 3.9x | 84 (17.9%) | 708 (20.9%) |
| 4.0x or more | 274 (58.4%) | 734 (21.7%) |
| Total | 469 (100.0%) | 3,388 (100.0%) |
Real Estate Taxes by Mortgage Status in Snoqualmie
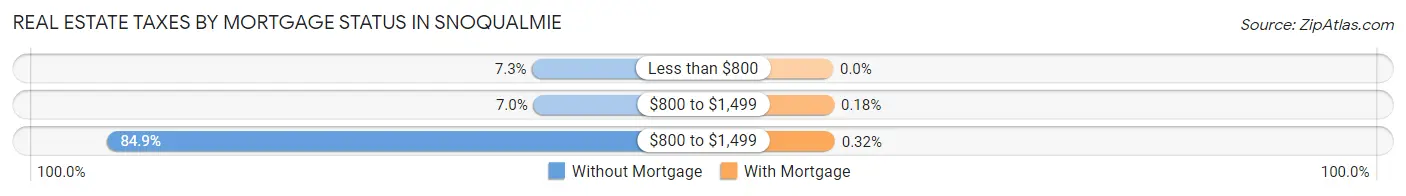
| Property Taxes | Without Mortgage | With Mortgage |
| Less than $800 | 34 (7.2%) | 0 (0.0%) |
| $800 to $1,499 | 33 (7.0%) | 6 (0.2%) |
| $800 to $1,499 | 398 (84.9%) | 11 (0.3%) |
| Total | 469 (100.0%) | 3,388 (100.0%) |
Health & Disability in Snoqualmie
Health Insurance Coverage by Age in Snoqualmie
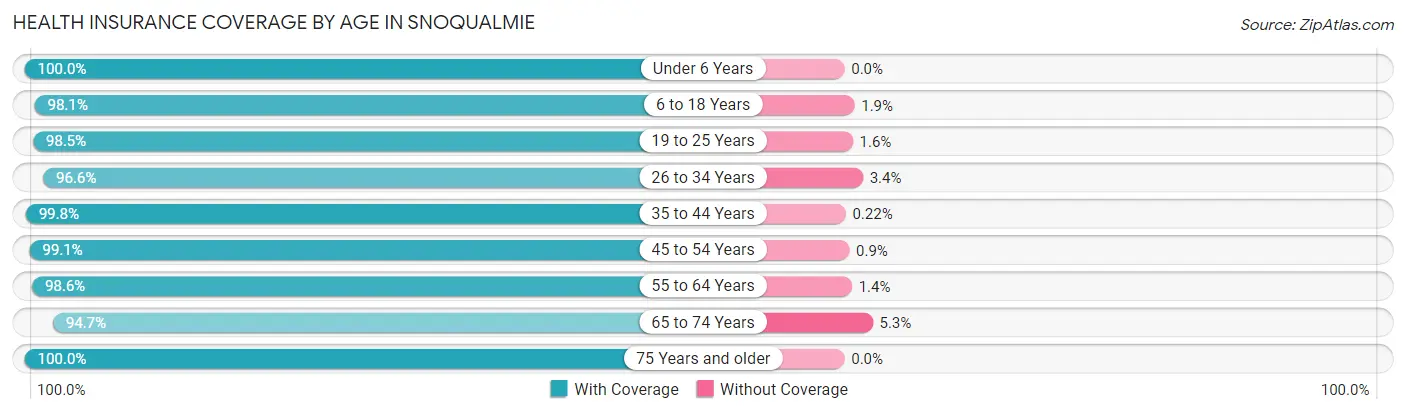
| Age Bracket | With Coverage | Without Coverage |
| Under 6 Years | 991 (100.0%) | 0 (0.0%) |
| 6 to 18 Years | 3,372 (98.1%) | 64 (1.9%) |
| 19 to 25 Years | 317 (98.5%) | 5 (1.5%) |
| 26 to 34 Years | 1,123 (96.6%) | 40 (3.4%) |
| 35 to 44 Years | 3,150 (99.8%) | 7 (0.2%) |
| 45 to 54 Years | 2,540 (99.1%) | 23 (0.9%) |
| 55 to 64 Years | 1,212 (98.6%) | 17 (1.4%) |
| 65 to 74 Years | 684 (94.7%) | 38 (5.3%) |
| 75 Years and older | 179 (100.0%) | 0 (0.0%) |
| Total | 13,568 (98.6%) | 194 (1.4%) |
Health Insurance Coverage by Citizenship Status in Snoqualmie
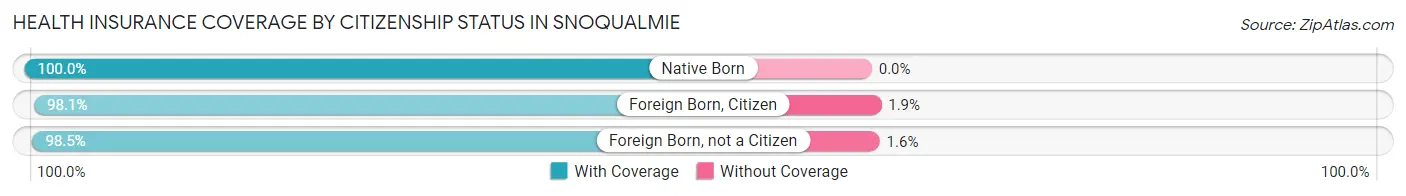
| Citizenship Status | With Coverage | Without Coverage |
| Native Born | 991 (100.0%) | 0 (0.0%) |
| Foreign Born, Citizen | 3,372 (98.1%) | 64 (1.9%) |
| Foreign Born, not a Citizen | 317 (98.5%) | 5 (1.5%) |
Health Insurance Coverage by Household Income in Snoqualmie
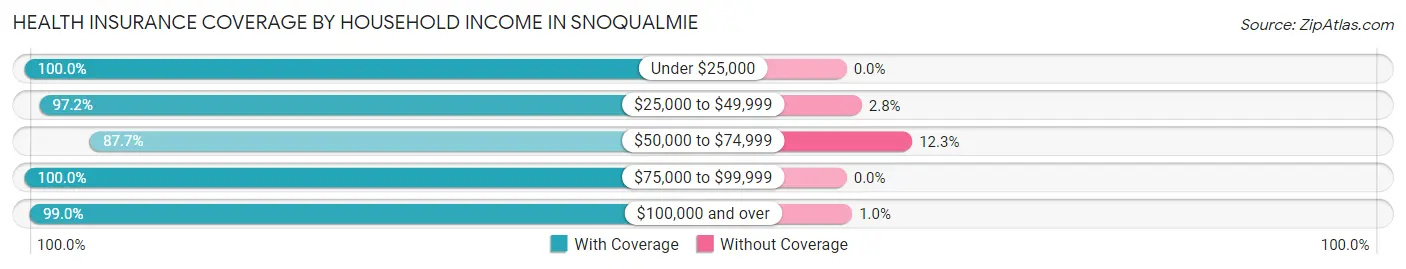
| Household Income | With Coverage | Without Coverage |
| Under $25,000 | 40 (100.0%) | 0 (0.0%) |
| $25,000 to $49,999 | 207 (97.2%) | 6 (2.8%) |
| $50,000 to $74,999 | 415 (87.7%) | 58 (12.3%) |
| $75,000 to $99,999 | 290 (100.0%) | 0 (0.0%) |
| $100,000 and over | 12,616 (99.0%) | 130 (1.0%) |
Public vs Private Health Insurance Coverage by Age in Snoqualmie
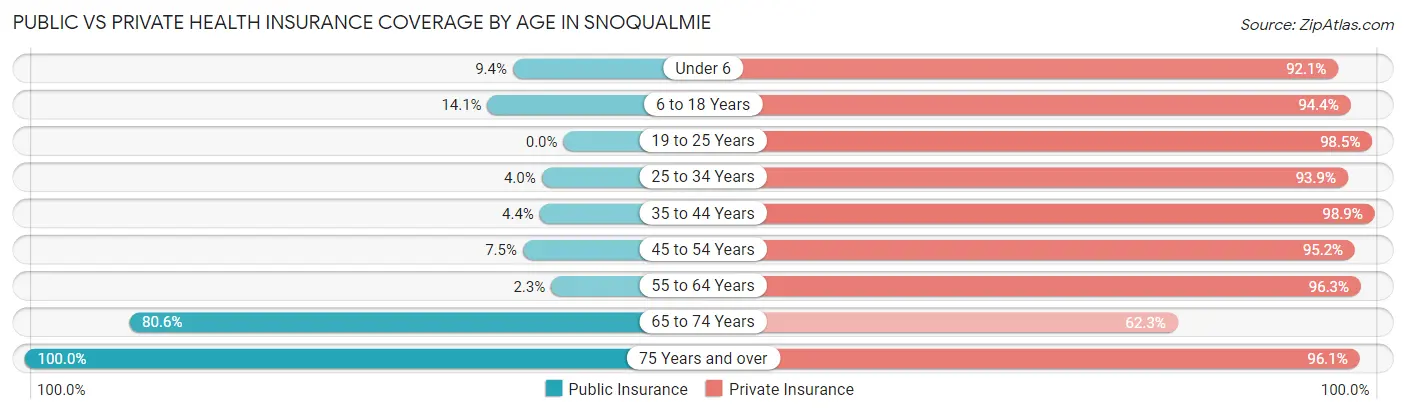
| Age Bracket | Public Insurance | Private Insurance |
| Under 6 | 93 (9.4%) | 913 (92.1%) |
| 6 to 18 Years | 484 (14.1%) | 3,244 (94.4%) |
| 19 to 25 Years | 0 (0.0%) | 317 (98.5%) |
| 25 to 34 Years | 47 (4.0%) | 1,092 (93.9%) |
| 35 to 44 Years | 139 (4.4%) | 3,122 (98.9%) |
| 45 to 54 Years | 193 (7.5%) | 2,441 (95.2%) |
| 55 to 64 Years | 28 (2.3%) | 1,184 (96.3%) |
| 65 to 74 Years | 582 (80.6%) | 450 (62.3%) |
| 75 Years and over | 179 (100.0%) | 172 (96.1%) |
| Total | 1,745 (12.7%) | 12,935 (94.0%) |
Disability Status by Sex by Age in Snoqualmie
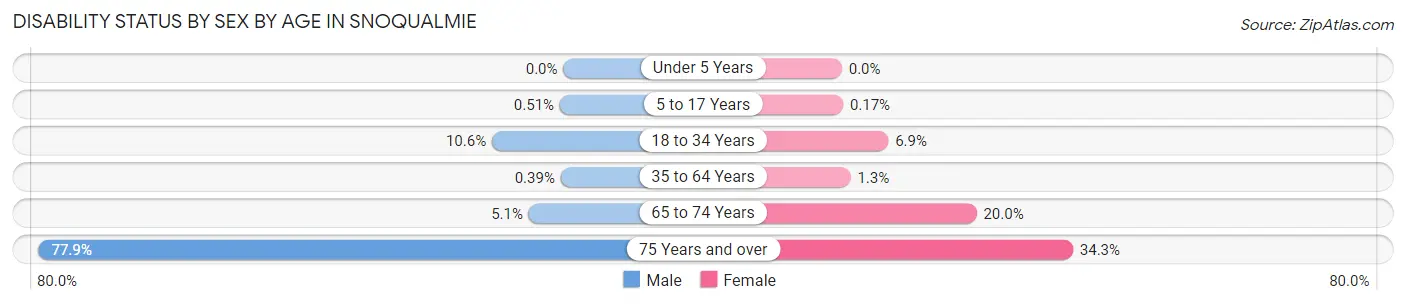
| Age Bracket | Male | Female |
| Under 5 Years | 0 (0.0%) | 0 (0.0%) |
| 5 to 17 Years | 9 (0.5%) | 3 (0.2%) |
| 18 to 34 Years | 69 (10.6%) | 67 (6.9%) |
| 35 to 64 Years | 14 (0.4%) | 43 (1.3%) |
| 65 to 74 Years | 16 (5.1%) | 82 (20.0%) |
| 75 Years and over | 60 (77.9%) | 35 (34.3%) |
Disability Class by Sex by Age in Snoqualmie
Disability Class: Hearing Difficulty
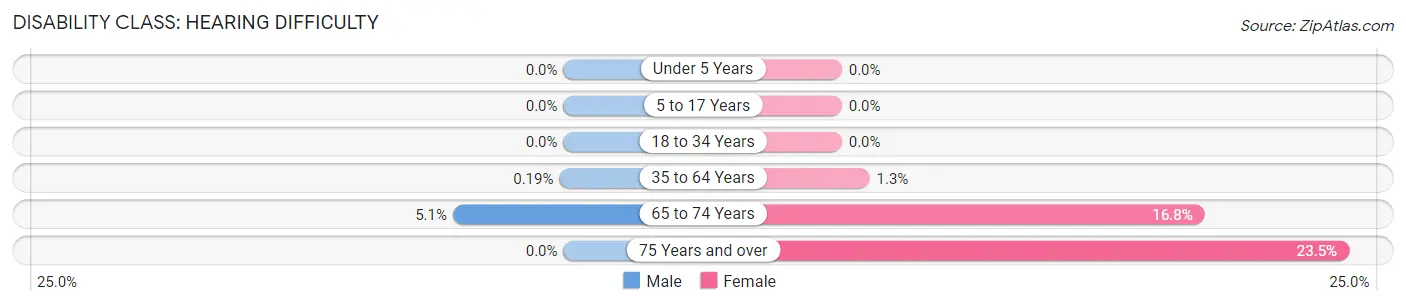
| Age Bracket | Male | Female |
| Under 5 Years | 0 (0.0%) | 0 (0.0%) |
| 5 to 17 Years | 0 (0.0%) | 0 (0.0%) |
| 18 to 34 Years | 0 (0.0%) | 0 (0.0%) |
| 35 to 64 Years | 7 (0.2%) | 43 (1.3%) |
| 65 to 74 Years | 16 (5.1%) | 69 (16.8%) |
| 75 Years and over | 0 (0.0%) | 24 (23.5%) |
Disability Class: Vision Difficulty
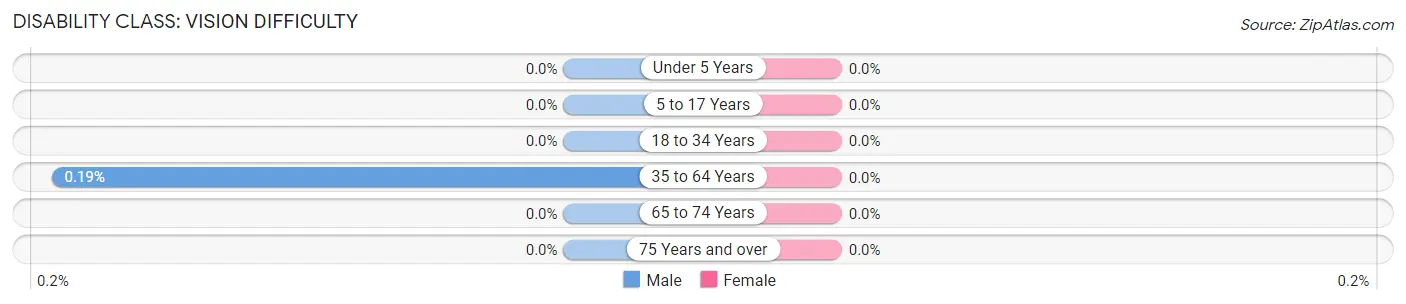
| Age Bracket | Male | Female |
| Under 5 Years | 0 (0.0%) | 0 (0.0%) |
| 5 to 17 Years | 0 (0.0%) | 0 (0.0%) |
| 18 to 34 Years | 0 (0.0%) | 0 (0.0%) |
| 35 to 64 Years | 7 (0.2%) | 0 (0.0%) |
| 65 to 74 Years | 0 (0.0%) | 0 (0.0%) |
| 75 Years and over | 0 (0.0%) | 0 (0.0%) |
Disability Class: Cognitive Difficulty
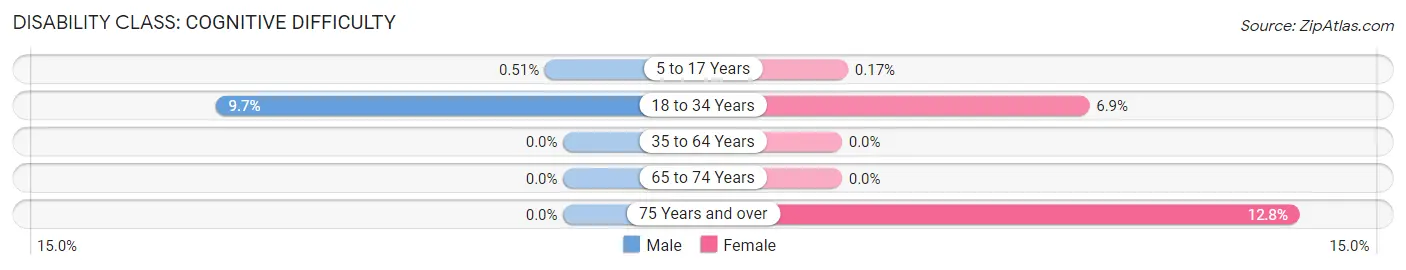
| Age Bracket | Male | Female |
| 5 to 17 Years | 9 (0.5%) | 3 (0.2%) |
| 18 to 34 Years | 63 (9.7%) | 67 (6.9%) |
| 35 to 64 Years | 0 (0.0%) | 0 (0.0%) |
| 65 to 74 Years | 0 (0.0%) | 0 (0.0%) |
| 75 Years and over | 0 (0.0%) | 13 (12.8%) |
Disability Class: Ambulatory Difficulty
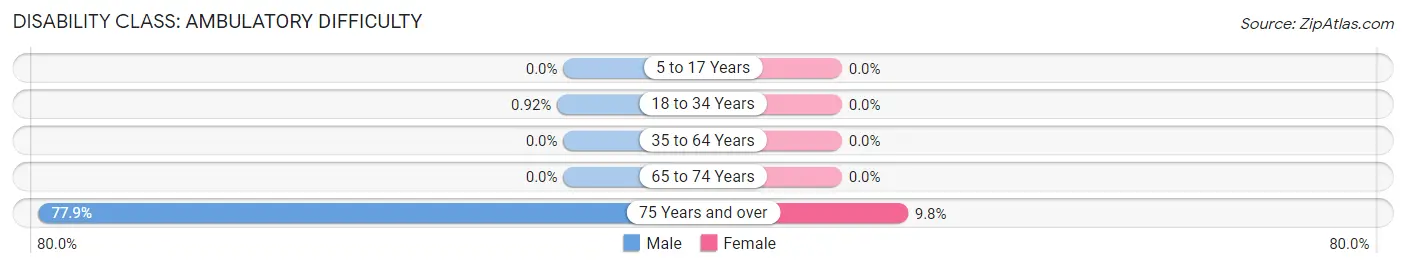
| Age Bracket | Male | Female |
| 5 to 17 Years | 0 (0.0%) | 0 (0.0%) |
| 18 to 34 Years | 6 (0.9%) | 0 (0.0%) |
| 35 to 64 Years | 0 (0.0%) | 0 (0.0%) |
| 65 to 74 Years | 0 (0.0%) | 0 (0.0%) |
| 75 Years and over | 60 (77.9%) | 10 (9.8%) |
Disability Class: Self-Care Difficulty
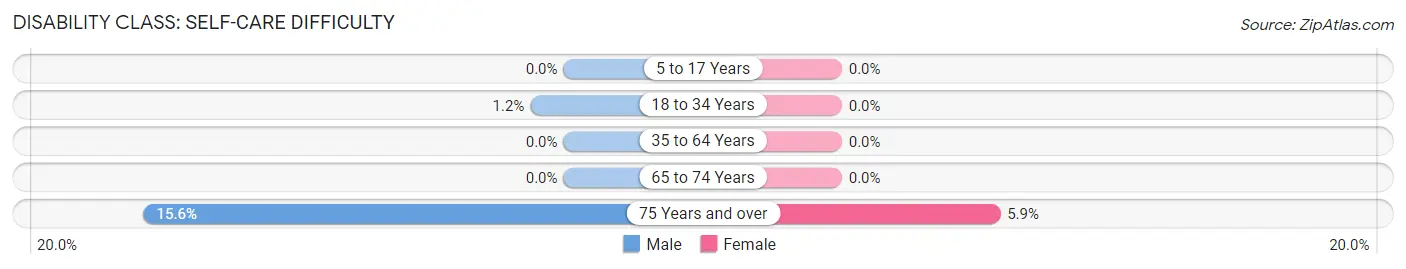
| Age Bracket | Male | Female |
| 5 to 17 Years | 0 (0.0%) | 0 (0.0%) |
| 18 to 34 Years | 8 (1.2%) | 0 (0.0%) |
| 35 to 64 Years | 0 (0.0%) | 0 (0.0%) |
| 65 to 74 Years | 0 (0.0%) | 0 (0.0%) |
| 75 Years and over | 12 (15.6%) | 6 (5.9%) |
Technology Access in Snoqualmie
Computing Device Access in Snoqualmie
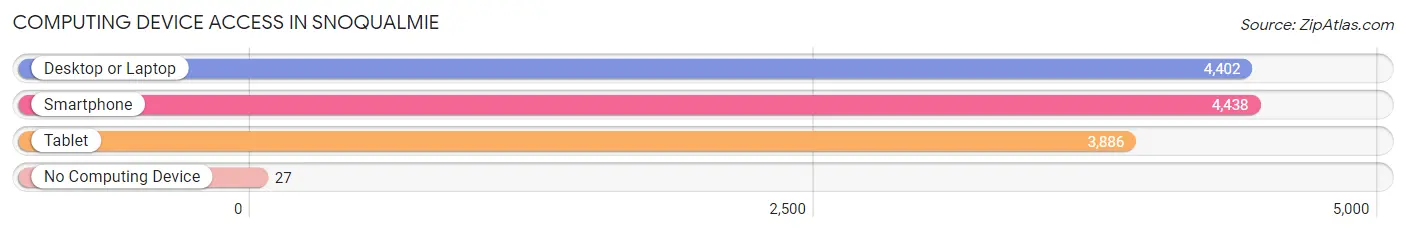
| Device Type | # Households | % Households |
| Desktop or Laptop | 4,402 | 97.0% |
| Smartphone | 4,438 | 97.8% |
| Tablet | 3,886 | 85.6% |
| No Computing Device | 27 | 0.6% |
| Total | 4,539 | 100.0% |
Internet Access in Snoqualmie
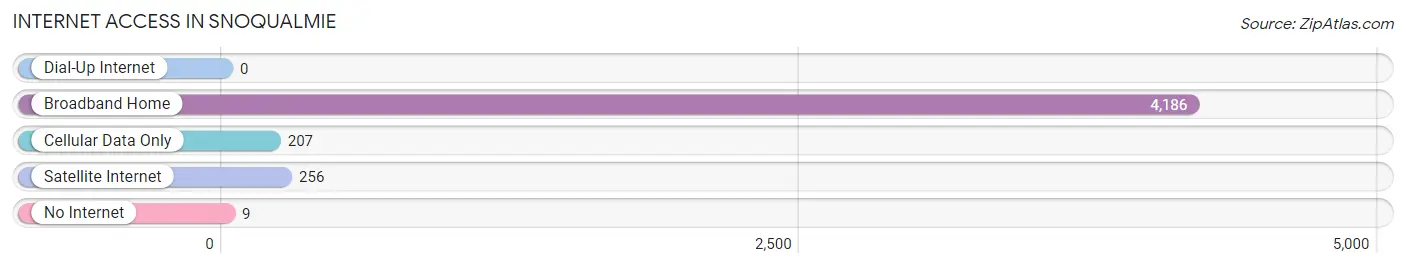
| Internet Type | # Households | % Households |
| Dial-Up Internet | 0 | 0.0% |
| Broadband Home | 4,186 | 92.2% |
| Cellular Data Only | 207 | 4.6% |
| Satellite Internet | 256 | 5.6% |
| No Internet | 9 | 0.2% |
| Total | 4,539 | 100.0% |
Snoqualmie Summary
Snoqualmie, Washington is a small city located in King County, Washington, United States. It is situated in the foothills of the Cascade Mountains, about 30 miles east of Seattle. The city is home to the Snoqualmie Falls, a popular tourist destination, and is the site of the Snoqualmie Casino, a gaming and entertainment complex. The population of Snoqualmie was 10,670 at the 2010 census.
Geography
Snoqualmie is located at 47°31′N 121°50′W (47.5179, -121.8333). According to the United States Census Bureau, the city has a total area of 4.7 square miles (12.2 km2), of which, 4.6 square miles (11.9 km2) is land and 0.1 square miles (0.3 km2) is water.
The city is situated in the foothills of the Cascade Mountains, about 30 miles east of Seattle. The Snoqualmie River flows through the city, and Snoqualmie Falls is located just outside the city limits. The city is surrounded by the Snoqualmie National Forest.
History
The Snoqualmie people have lived in the area for thousands of years. The Snoqualmie Falls were a sacred site for the Snoqualmie people, and the area was a major fishing and hunting ground.
The first non-native settlers arrived in the area in the late 1800s. The city was officially incorporated in 1899.
In the early 1900s, the city was a logging and mill town. The Snoqualmie Falls hydroelectric plant was built in 1898, and the city was home to several lumber mills.
The city experienced a population boom in the 1950s and 1960s, as people moved to the area from Seattle and other parts of the country.
Economy
The economy of Snoqualmie is largely based on tourism. The city is home to the Snoqualmie Falls, a popular tourist destination, and the Snoqualmie Casino, a gaming and entertainment complex.
The city is also home to several technology companies including Microsoft Amazon and T Mobile
Demographics
As of the 2010 census, there were 10,670 people, 4,072 households, and 2,845 families residing in the city. The population density was 2,310.2 people per square mile (894.2/km2). There were 4,323 housing units at an average density of 930.3 per square mile (359.3/km2). The racial makeup of the city was 79.2% White, 0.9% African American, 0.7% Native American, 8.2% Asian, 0.2% Pacific Islander, 6.7% from other races, and 4.1% from two or more races. Hispanic or Latino of any race were 13.2% of the population.
There were 4,072 households, out of which 37.2% had children under the age of 18 living with them, 54.2% were married couples living together, 10.2% had a female householder with no husband present, and 30.7% were non-families. 24.2% of all households were made up of individuals, and 6.3% had someone living alone who was 65 years of age or older. The average household size was 2.62 and the average family size was 3.14.
In the city, the population was spread out, with 27.2% under the age of 18, 7.2% from 18 to 24, 33.2% from 25 to 44, 22.7% from 45 to 64, and 9.7% who were 65 years of age or older. The median age was 36 years. For every 100 females, there were 97.2 males. For every 100 females age 18 and over, there were 94.3 males.
The median income for a household in the city was $68,945, and the median income for a family was $77,945. Males had a median income of $51,945 versus $41,945 for females. The per capita income for the city was $31,945. About 4.2% of families and 6.2% of the population were below the poverty line, including 8.2% of those under age 18 and 3.2% of those age 65 or over.
Common Questions
What is Per Capita Income in Snoqualmie?
Per Capita income in Snoqualmie is $74,487.
What is the Median Family Income in Snoqualmie?
Median Family Income in Snoqualmie is $211,250.
What is the Median Household income in Snoqualmie?
Median Household Income in Snoqualmie is $186,353.
What is Income or Wage Gap in Snoqualmie?
Income or Wage Gap in Snoqualmie is 51.6%.
Women in Snoqualmie earn 48.4 cents for every dollar earned by a man.
What is Inequality or Gini Index in Snoqualmie?
Inequality or Gini Index in Snoqualmie is 0.33.
What is the Total Population of Snoqualmie?
Total Population of Snoqualmie is 13,762.
What is the Total Male Population of Snoqualmie?
Total Male Population of Snoqualmie is 6,775.
What is the Total Female Population of Snoqualmie?
Total Female Population of Snoqualmie is 6,987.
What is the Ratio of Males per 100 Females in Snoqualmie?
There are 96.97 Males per 100 Females in Snoqualmie.
What is the Ratio of Females per 100 Males in Snoqualmie?
There are 103.13 Females per 100 Males in Snoqualmie.
What is the Median Population Age in Snoqualmie?
Median Population Age in Snoqualmie is 38.6 Years.
What is the Average Family Size in Snoqualmie
Average Family Size in Snoqualmie is 3.2 People.
What is the Average Household Size in Snoqualmie
Average Household Size in Snoqualmie is 3.0 People.
How Large is the Labor Force in Snoqualmie?
There are 8,066 People in the Labor Forcein in Snoqualmie.
What is the Percentage of People in the Labor Force in Snoqualmie?
81.2% of People are in the Labor Force in Snoqualmie.
What is the Unemployment Rate in Snoqualmie?
Unemployment Rate in Snoqualmie is 2.7%.