Alderwood Manor, WA Map & Demographics
Alderwood Manor Map
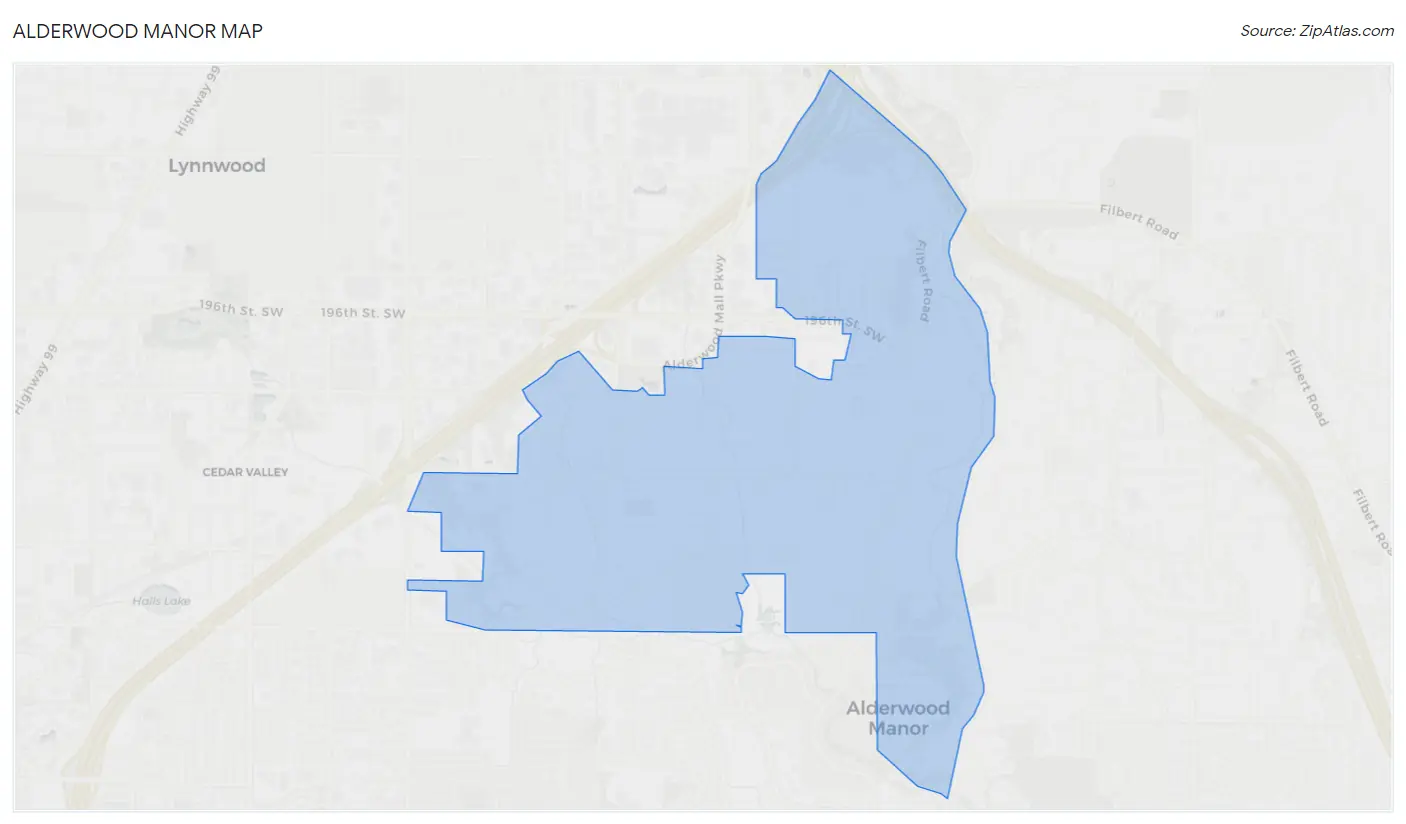
Alderwood Manor Overview
$47,801
PER CAPITA INCOME
$126,937
AVG FAMILY INCOME
$120,571
AVG HOUSEHOLD INCOME
23.7%
WAGE / INCOME GAP [ % ]
76.3¢/ $1
WAGE / INCOME GAP [ $ ]
0.36
INEQUALITY / GINI INDEX
10,525
TOTAL POPULATION
5,207
MALE POPULATION
5,318
FEMALE POPULATION
97.91
MALES / 100 FEMALES
102.13
FEMALES / 100 MALES
36.3
MEDIAN AGE
3.4
AVG FAMILY SIZE
3.0
AVG HOUSEHOLD SIZE
5,765
LABOR FORCE [ PEOPLE ]
67.0%
PERCENT IN LABOR FORCE
4.8%
UNEMPLOYMENT RATE
Income in Alderwood Manor
Income Overview in Alderwood Manor
Per Capita Income in Alderwood Manor is $47,801, while median incomes of families and households are $126,937 and $120,571 respectively.
| Characteristic | Number | Measure |
| Per Capita Income | 10,525 | $47,801 |
| Median Family Income | 2,576 | $126,937 |
| Mean Family Income | 2,576 | $151,712 |
| Median Household Income | 3,505 | $120,571 |
| Mean Household Income | 3,505 | $137,609 |
| Income Deficit | 2,576 | $0 |
| Wage / Income Gap (%) | 10,525 | 23.67% |
| Wage / Income Gap ($) | 10,525 | 76.33¢ per $1 |
| Gini / Inequality Index | 10,525 | 0.36 |
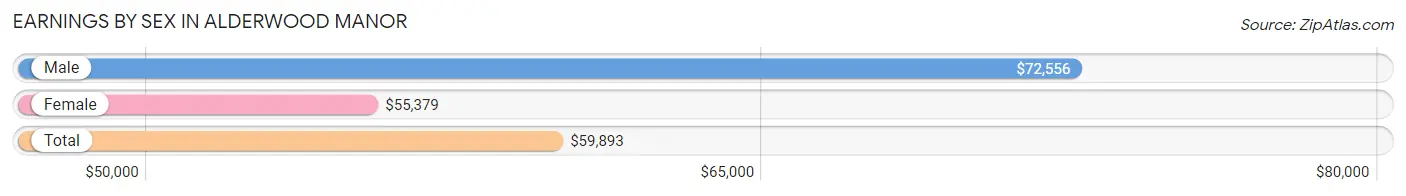
Earnings by Sex in Alderwood Manor
Average Earnings in Alderwood Manor are $59,893, $72,556 for men and $55,379 for women, a difference of 23.7%.
| Sex | Number | Average Earnings |
| Male | 3,084 (53.8%) | $72,556 |
| Female | 2,651 (46.2%) | $55,379 |
| Total | 5,735 (100.0%) | $59,893 |
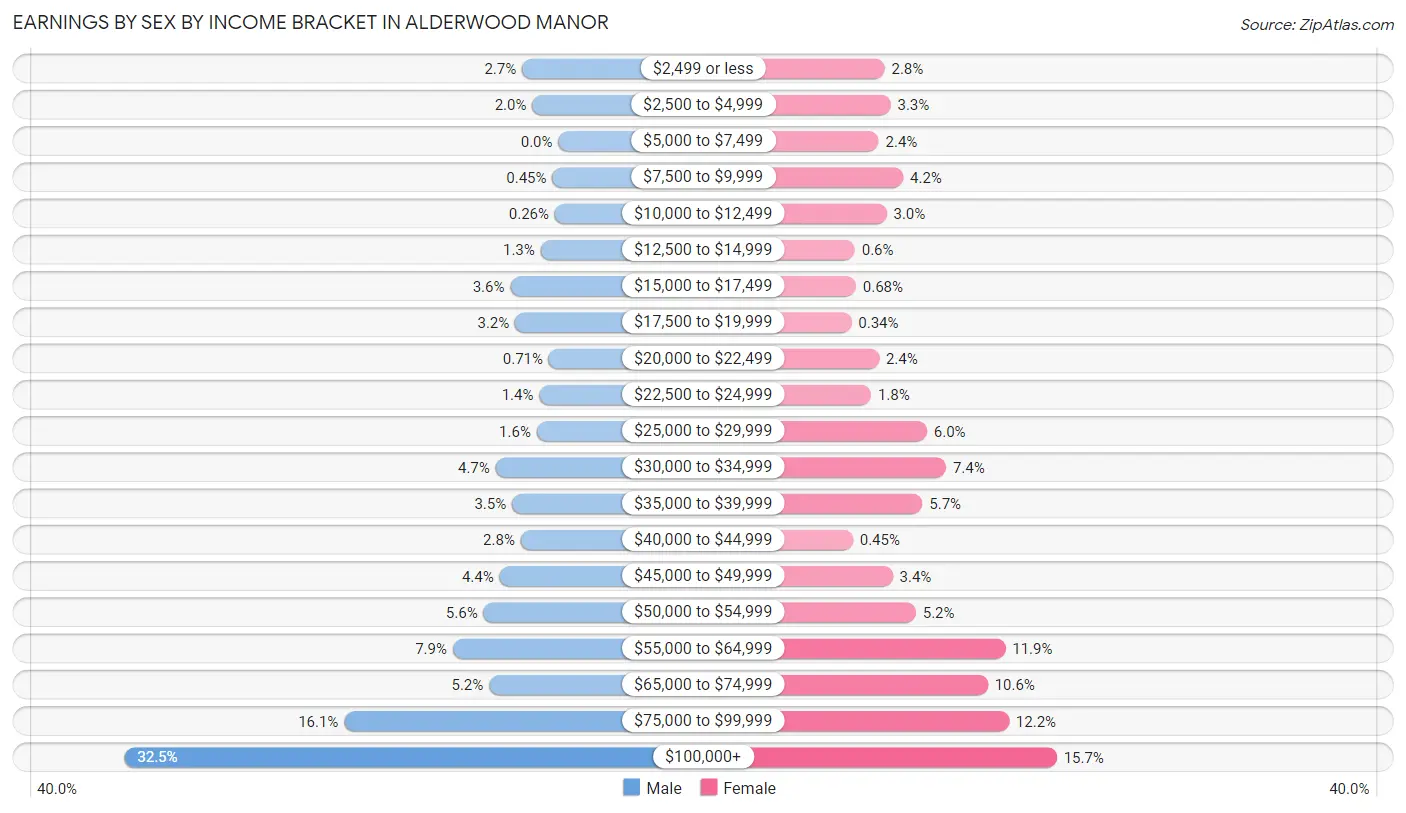
Earnings by Sex by Income Bracket in Alderwood Manor
The most common earnings brackets in Alderwood Manor are $100,000+ for men (1,003 | 32.5%) and $100,000+ for women (417 | 15.7%).
| Income | Male | Female |
| $2,499 or less | 84 (2.7%) | 75 (2.8%) |
| $2,500 to $4,999 | 60 (1.9%) | 87 (3.3%) |
| $5,000 to $7,499 | 0 (0.0%) | 63 (2.4%) |
| $7,500 to $9,999 | 14 (0.4%) | 112 (4.2%) |
| $10,000 to $12,499 | 8 (0.3%) | 79 (3.0%) |
| $12,500 to $14,999 | 41 (1.3%) | 16 (0.6%) |
| $15,000 to $17,499 | 111 (3.6%) | 18 (0.7%) |
| $17,500 to $19,999 | 100 (3.2%) | 9 (0.3%) |
| $20,000 to $22,499 | 22 (0.7%) | 64 (2.4%) |
| $22,500 to $24,999 | 44 (1.4%) | 48 (1.8%) |
| $25,000 to $29,999 | 50 (1.6%) | 159 (6.0%) |
| $30,000 to $34,999 | 145 (4.7%) | 197 (7.4%) |
| $35,000 to $39,999 | 107 (3.5%) | 150 (5.7%) |
| $40,000 to $44,999 | 87 (2.8%) | 12 (0.4%) |
| $45,000 to $49,999 | 136 (4.4%) | 91 (3.4%) |
| $50,000 to $54,999 | 173 (5.6%) | 137 (5.2%) |
| $55,000 to $64,999 | 244 (7.9%) | 315 (11.9%) |
| $65,000 to $74,999 | 160 (5.2%) | 280 (10.6%) |
| $75,000 to $99,999 | 495 (16.1%) | 322 (12.1%) |
| $100,000+ | 1,003 (32.5%) | 417 (15.7%) |
| Total | 3,084 (100.0%) | 2,651 (100.0%) |
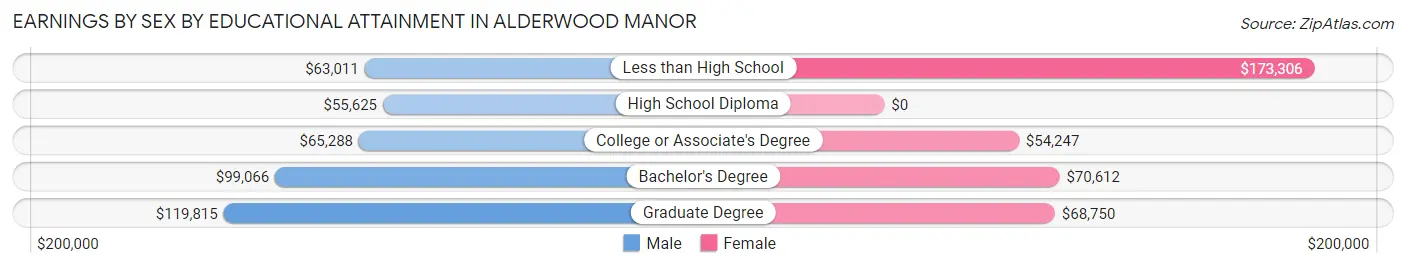
Earnings by Sex by Educational Attainment in Alderwood Manor
Average earnings in Alderwood Manor are $87,563 for men and $62,553 for women, a difference of 28.6%. Men with an educational attainment of graduate degree enjoy the highest average annual earnings of $119,815, while those with high school diploma education earn the least with $55,625. Women with an educational attainment of less than high school earn the most with the average annual earnings of $173,306, while those with college or associate's degree education have the smallest earnings of $54,247.
| Educational Attainment | Male Income | Female Income |
| Less than High School | $63,011 | $173,306 |
| High School Diploma | $55,625 | $0 |
| College or Associate's Degree | $65,288 | $54,247 |
| Bachelor's Degree | $99,066 | $70,612 |
| Graduate Degree | $119,815 | $68,750 |
| Total | $87,563 | $62,553 |
Family Income in Alderwood Manor
Family Income Brackets in Alderwood Manor
According to the Alderwood Manor family income data, there are 659 families falling into the $200,000+ income range, which is the most common income bracket and makes up 25.6% of all families.
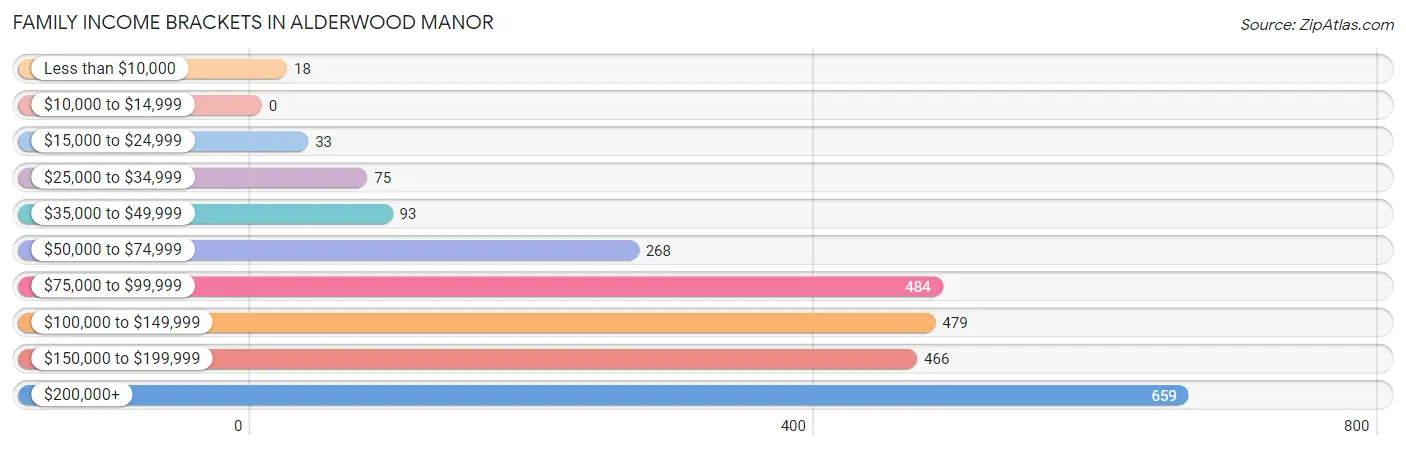
| Income Bracket | # Families | % Families |
| Less than $10,000 | 18 | 0.7% |
| $10,000 to $14,999 | 0 | 0.0% |
| $15,000 to $24,999 | 33 | 1.3% |
| $25,000 to $34,999 | 75 | 2.9% |
| $35,000 to $49,999 | 93 | 3.6% |
| $50,000 to $74,999 | 268 | 10.4% |
| $75,000 to $99,999 | 484 | 18.8% |
| $100,000 to $149,999 | 479 | 18.6% |
| $150,000 to $199,999 | 466 | 18.1% |
| $200,000+ | 659 | 25.6% |
Family Income by Famaliy Size in Alderwood Manor
4-person families (652 | 25.3%) account for the highest median family income in Alderwood Manor with $147,500 per family, while 2-person families (970 | 37.7%) have the highest median income of $58,203 per family member.
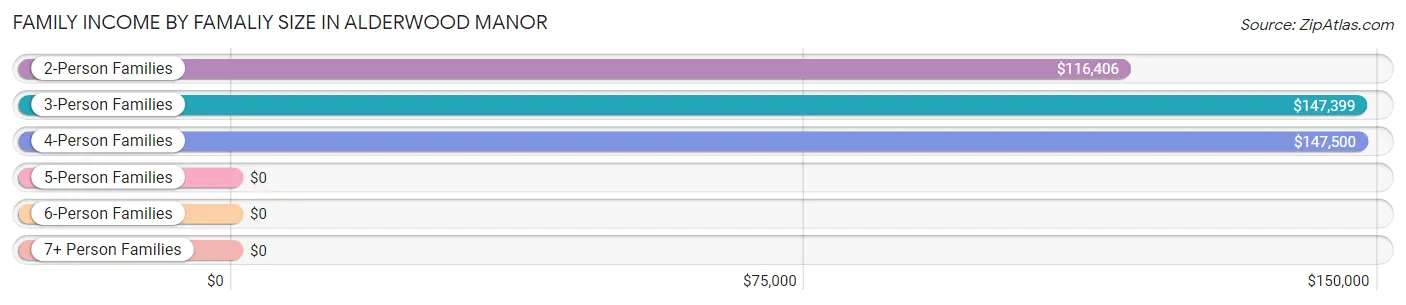
| Income Bracket | # Families | Median Income |
| 2-Person Families | 970 (37.7%) | $116,406 |
| 3-Person Families | 671 (26.1%) | $147,399 |
| 4-Person Families | 652 (25.3%) | $147,500 |
| 5-Person Families | 187 (7.3%) | $0 |
| 6-Person Families | 40 (1.5%) | $0 |
| 7+ Person Families | 56 (2.2%) | $0 |
| Total | 2,576 (100.0%) | $126,937 |
Family Income by Number of Earners in Alderwood Manor
The median family income in Alderwood Manor is $126,937, with families comprising 3+ earners (347) having the highest median family income of $190,428, while families with no earners (200) have the lowest median family income of $75,000, accounting for 13.5% and 7.8% of families, respectively.
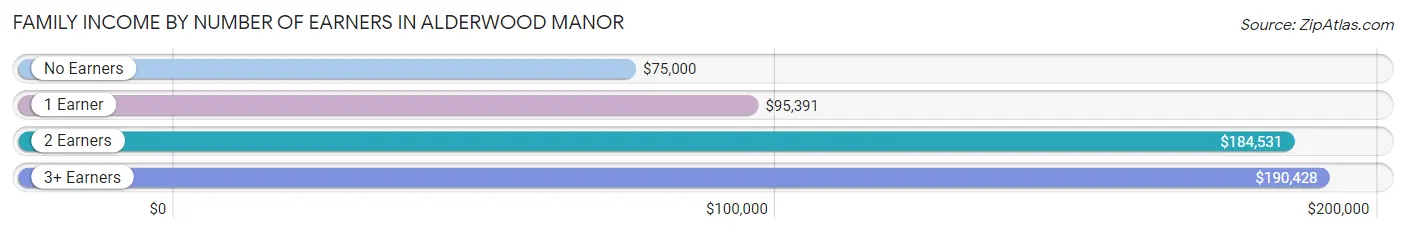
| Number of Earners | # Families | Median Income |
| No Earners | 200 (7.8%) | $75,000 |
| 1 Earner | 984 (38.2%) | $95,391 |
| 2 Earners | 1,045 (40.6%) | $184,531 |
| 3+ Earners | 347 (13.5%) | $190,428 |
| Total | 2,576 (100.0%) | $126,937 |
Household Income in Alderwood Manor
Household Income Brackets in Alderwood Manor
With 761 households falling in the category, the $200,000+ income range is the most frequent in Alderwood Manor, accounting for 21.7% of all households. In contrast, only 32 households (0.9%) fall into the $10,000 to $14,999 income bracket, making it the least populous group.
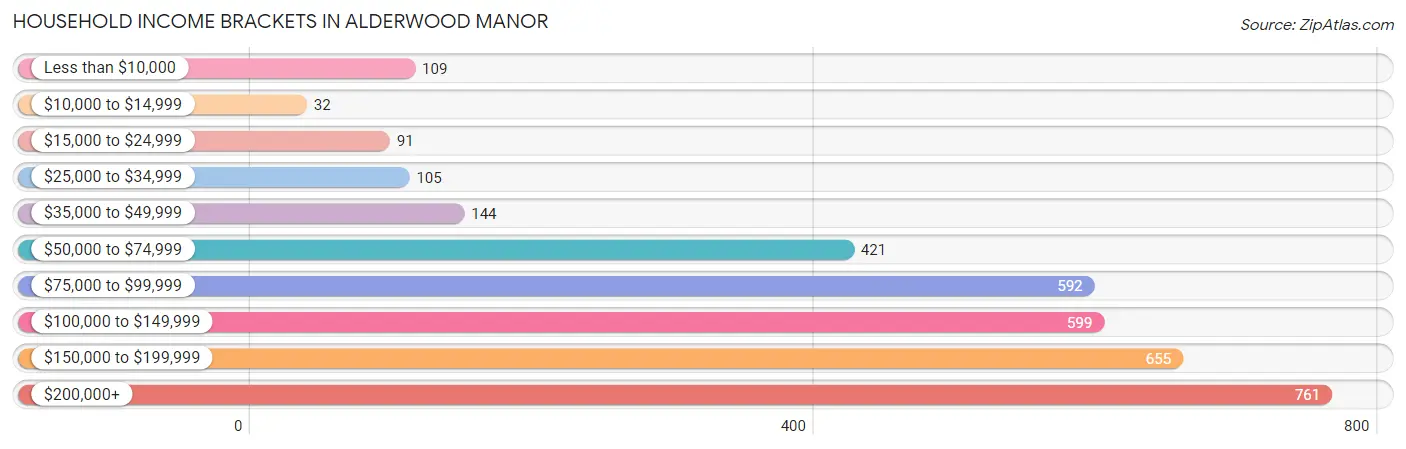
| Income Bracket | # Households | % Households |
| Less than $10,000 | 109 | 3.1% |
| $10,000 to $14,999 | 32 | 0.9% |
| $15,000 to $24,999 | 91 | 2.6% |
| $25,000 to $34,999 | 105 | 3.0% |
| $35,000 to $49,999 | 144 | 4.1% |
| $50,000 to $74,999 | 421 | 12.0% |
| $75,000 to $99,999 | 592 | 16.9% |
| $100,000 to $149,999 | 599 | 17.1% |
| $150,000 to $199,999 | 655 | 18.7% |
| $200,000+ | 761 | 21.7% |
Household Income by Householder Age in Alderwood Manor
The median household income in Alderwood Manor is $120,571, with the highest median household income of $145,169 found in the 45 to 64 years age bracket for the primary householder. A total of 1,351 households (38.5%) fall into this category. Meanwhile, the 15 to 24 years age bracket for the primary householder has the lowest median household income of $0, with 111 households (3.2%) in this group.
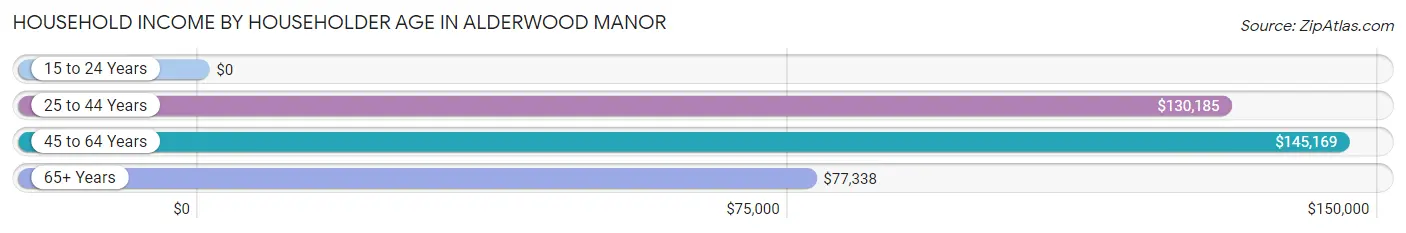
| Income Bracket | # Households | Median Income |
| 15 to 24 Years | 111 (3.2%) | $0 |
| 25 to 44 Years | 1,338 (38.2%) | $130,185 |
| 45 to 64 Years | 1,351 (38.5%) | $145,169 |
| 65+ Years | 705 (20.1%) | $77,338 |
| Total | 3,505 (100.0%) | $120,571 |
Poverty in Alderwood Manor
Income Below Poverty by Sex and Age in Alderwood Manor
With 3.5% poverty level for males and 5.3% for females among the residents of Alderwood Manor, 35 to 44 year old males and 45 to 54 year old females are the most vulnerable to poverty, with 83 males (9.9%) and 121 females (13.8%) in their respective age groups living below the poverty level.
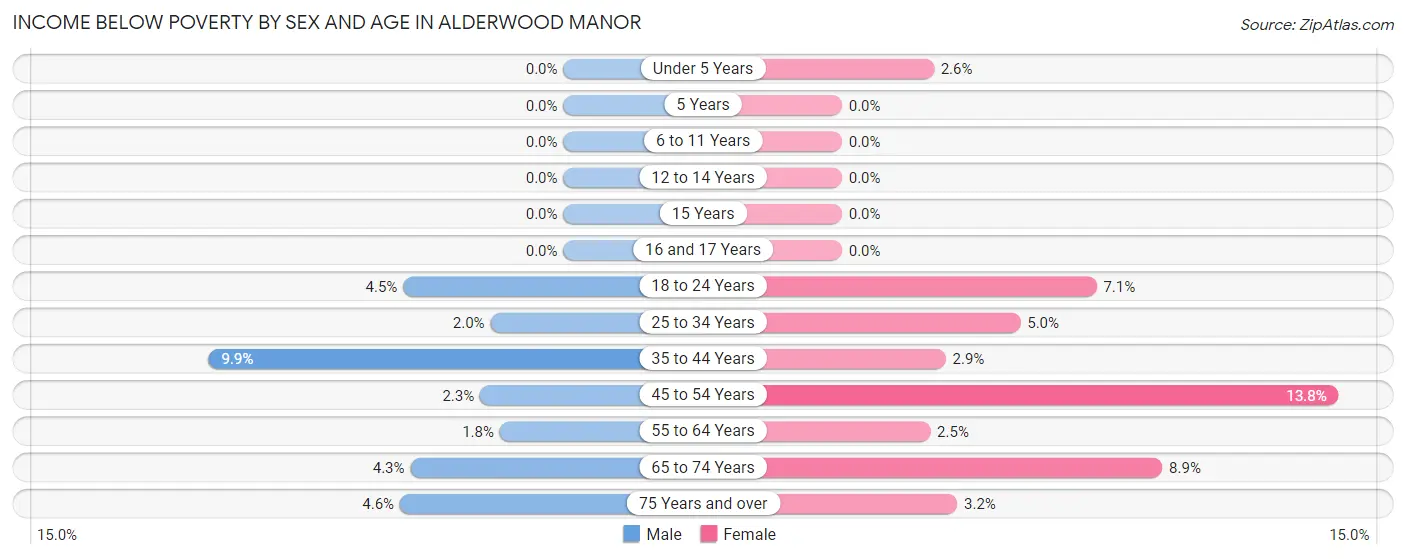
| Age Bracket | Male | Female |
| Under 5 Years | 0 (0.0%) | 15 (2.6%) |
| 5 Years | 0 (0.0%) | 0 (0.0%) |
| 6 to 11 Years | 0 (0.0%) | 0 (0.0%) |
| 12 to 14 Years | 0 (0.0%) | 0 (0.0%) |
| 15 Years | 0 (0.0%) | 0 (0.0%) |
| 16 and 17 Years | 0 (0.0%) | 0 (0.0%) |
| 18 to 24 Years | 20 (4.5%) | 38 (7.1%) |
| 25 to 34 Years | 19 (2.0%) | 45 (5.0%) |
| 35 to 44 Years | 83 (9.9%) | 16 (2.9%) |
| 45 to 54 Years | 23 (2.3%) | 121 (13.8%) |
| 55 to 64 Years | 12 (1.8%) | 12 (2.5%) |
| 65 to 74 Years | 14 (4.3%) | 28 (8.9%) |
| 75 Years and over | 9 (4.5%) | 9 (3.2%) |
| Total | 180 (3.5%) | 284 (5.3%) |
Income Above Poverty by Sex and Age in Alderwood Manor
According to the poverty statistics in Alderwood Manor, males aged under 5 years and females aged 5 years are the age groups that are most secure financially, with 100.0% of males and 100.0% of females in these age groups living above the poverty line.
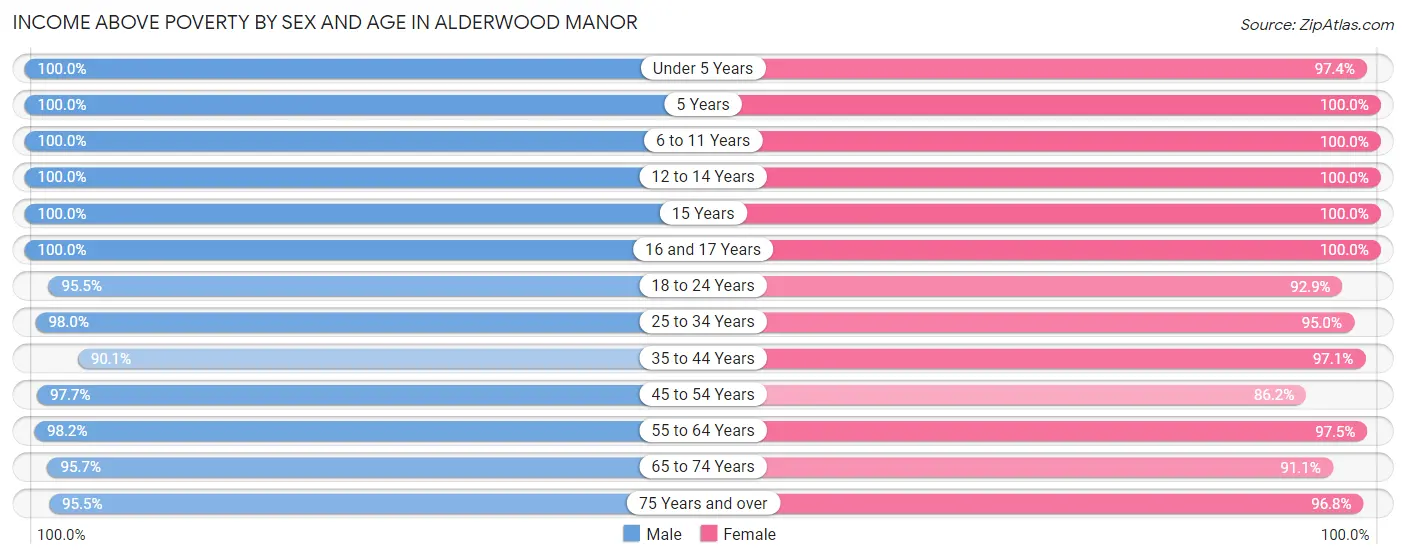
| Age Bracket | Male | Female |
| Under 5 Years | 275 (100.0%) | 571 (97.4%) |
| 5 Years | 64 (100.0%) | 75 (100.0%) |
| 6 to 11 Years | 188 (100.0%) | 228 (100.0%) |
| 12 to 14 Years | 180 (100.0%) | 215 (100.0%) |
| 15 Years | 18 (100.0%) | 60 (100.0%) |
| 16 and 17 Years | 34 (100.0%) | 194 (100.0%) |
| 18 to 24 Years | 428 (95.5%) | 498 (92.9%) |
| 25 to 34 Years | 918 (98.0%) | 861 (95.0%) |
| 35 to 44 Years | 757 (90.1%) | 537 (97.1%) |
| 45 to 54 Years | 970 (97.7%) | 754 (86.2%) |
| 55 to 64 Years | 667 (98.2%) | 476 (97.5%) |
| 65 to 74 Years | 315 (95.7%) | 286 (91.1%) |
| 75 Years and over | 189 (95.5%) | 271 (96.8%) |
| Total | 5,003 (96.5%) | 5,026 (94.7%) |
Income Below Poverty Among Married-Couple Families in Alderwood Manor
The poverty statistics for married-couple families in Alderwood Manor show that 1.1% or 21 of the total 1,888 families live below the poverty line. Families with no children have the highest poverty rate of 2.1%, comprising of 21 families. On the other hand, families with 1 or 2 children have the lowest poverty rate of 0.0%, which includes 0 families.
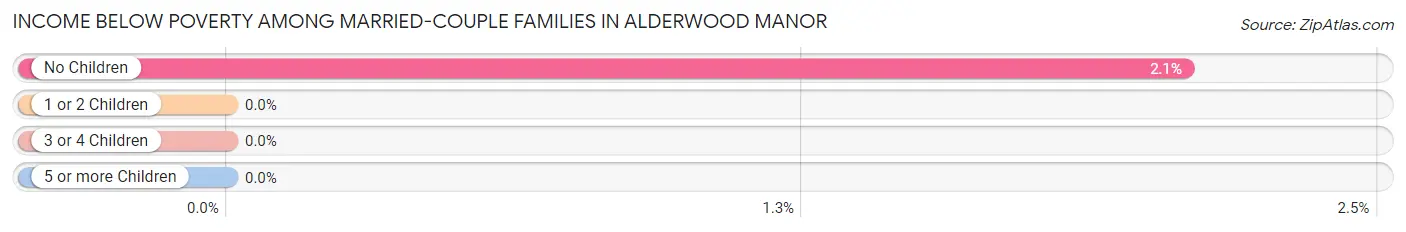
| Children | Above Poverty | Below Poverty |
| No Children | 989 (97.9%) | 21 (2.1%) |
| 1 or 2 Children | 732 (100.0%) | 0 (0.0%) |
| 3 or 4 Children | 106 (100.0%) | 0 (0.0%) |
| 5 or more Children | 40 (100.0%) | 0 (0.0%) |
| Total | 1,867 (98.9%) | 21 (1.1%) |
Income Below Poverty Among Single-Parent Households in Alderwood Manor
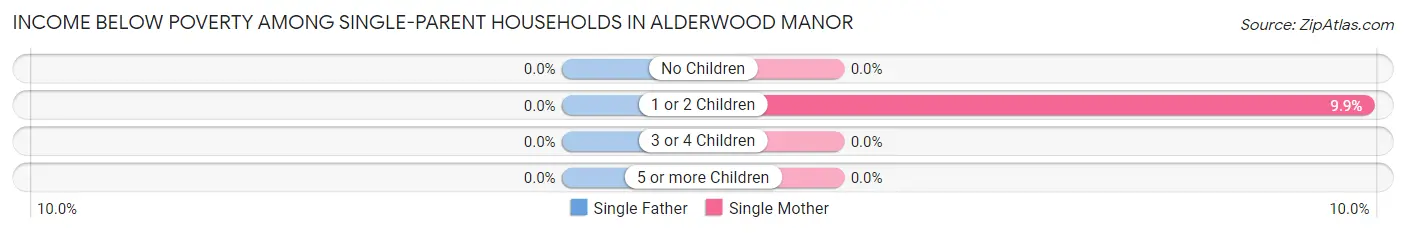
| Children | Single Father | Single Mother |
| No Children | 0 (0.0%) | 0 (0.0%) |
| 1 or 2 Children | 0 (0.0%) | 17 (9.9%) |
| 3 or 4 Children | 0 (0.0%) | 0 (0.0%) |
| 5 or more Children | 0 (0.0%) | 0 (0.0%) |
| Total | 0 (0.0%) | 17 (3.4%) |
Income Below Poverty Among Married-Couple vs Single-Parent Households in Alderwood Manor
The poverty data for Alderwood Manor shows that 21 of the married-couple family households (1.1%) and 17 of the single-parent households (2.5%) are living below the poverty level. Within the married-couple family households, those with no children have the highest poverty rate, with 21 households (2.1%) falling below the poverty line. Among the single-parent households, those with 1 or 2 children have the highest poverty rate, with 17 household (7.1%) living below poverty.
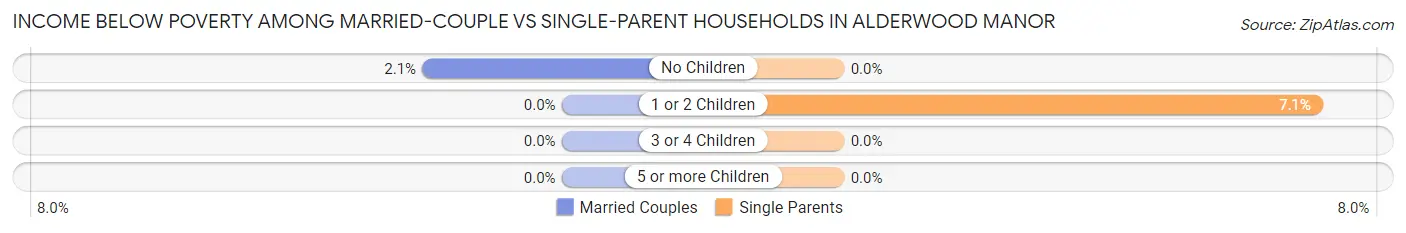
| Children | Married-Couple Families | Single-Parent Households |
| No Children | 21 (2.1%) | 0 (0.0%) |
| 1 or 2 Children | 0 (0.0%) | 17 (7.1%) |
| 3 or 4 Children | 0 (0.0%) | 0 (0.0%) |
| 5 or more Children | 0 (0.0%) | 0 (0.0%) |
| Total | 21 (1.1%) | 17 (2.5%) |
Race in Alderwood Manor
The most populous races in Alderwood Manor are White / Caucasian (6,337 | 60.2%), Asian (1,948 | 18.5%), and Hispanic or Latino (1,569 | 14.9%).
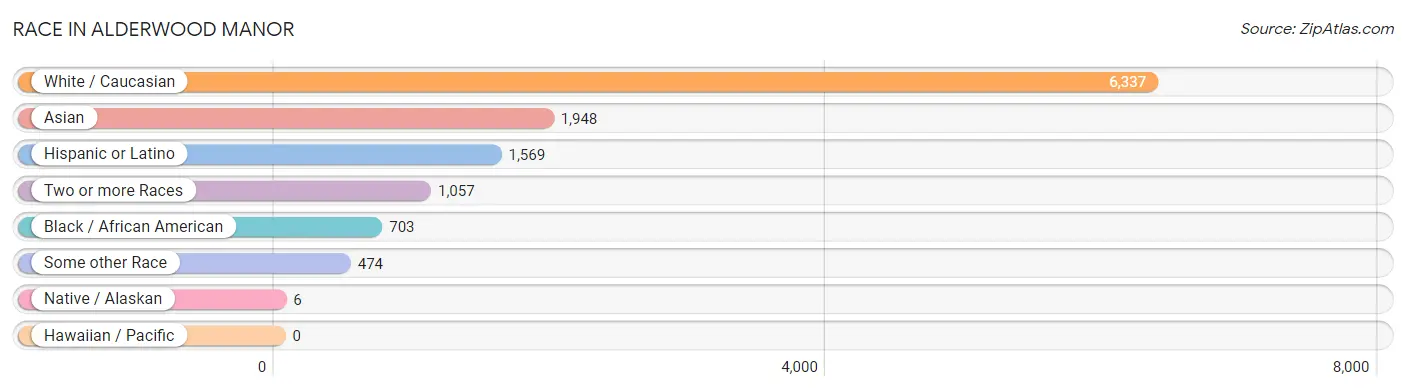
| Race | # Population | % Population |
| Asian | 1,948 | 18.5% |
| Black / African American | 703 | 6.7% |
| Hawaiian / Pacific | 0 | 0.0% |
| Hispanic or Latino | 1,569 | 14.9% |
| Native / Alaskan | 6 | 0.1% |
| White / Caucasian | 6,337 | 60.2% |
| Two or more Races | 1,057 | 10.0% |
| Some other Race | 474 | 4.5% |
| Total | 10,525 | 100.0% |
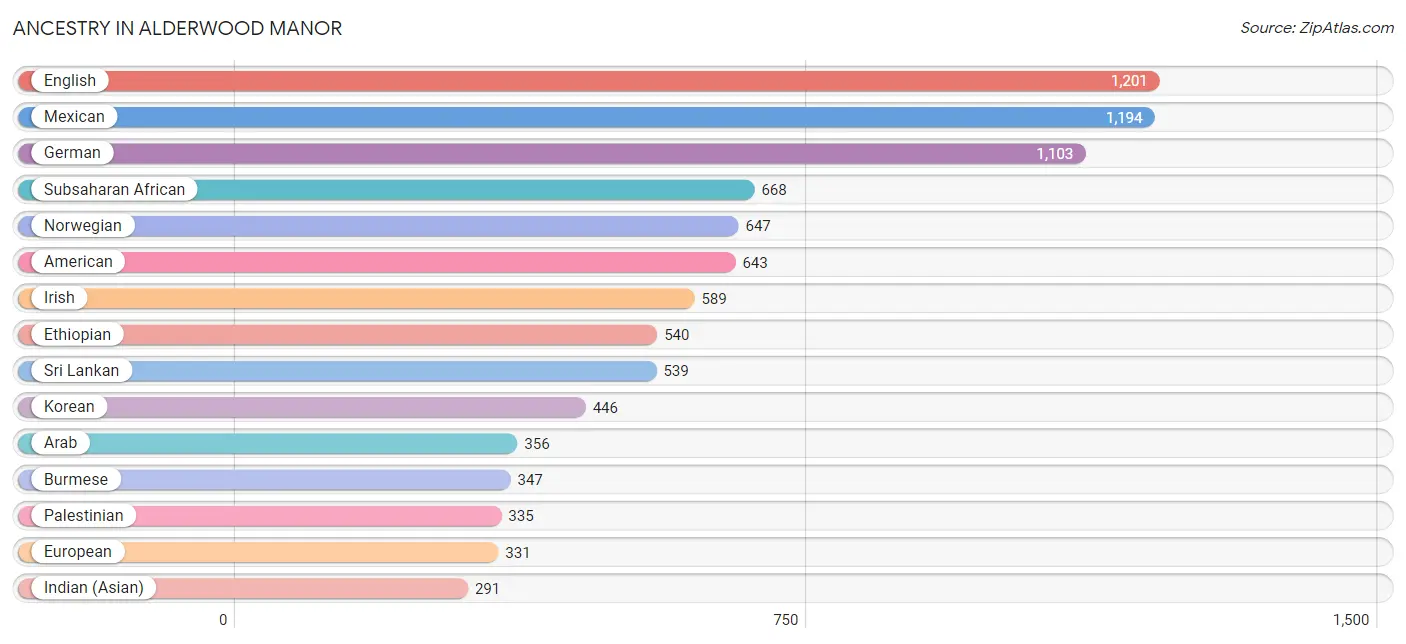
Ancestry in Alderwood Manor
The most populous ancestries reported in Alderwood Manor are English (1,201 | 11.4%), Mexican (1,194 | 11.3%), German (1,103 | 10.5%), Subsaharan African (668 | 6.4%), and Norwegian (647 | 6.1%), together accounting for 45.7% of all Alderwood Manor residents.
| Ancestry | # Population | % Population |
| Afghan | 8 | 0.1% |
| African | 16 | 0.2% |
| Aleut | 14 | 0.1% |
| American | 643 | 6.1% |
| Arab | 356 | 3.4% |
| Belgian | 1 | 0.0% |
| Bhutanese | 275 | 2.6% |
| Blackfeet | 43 | 0.4% |
| British | 69 | 0.7% |
| Burmese | 347 | 3.3% |
| Canadian | 17 | 0.2% |
| Central American | 95 | 0.9% |
| Cherokee | 102 | 1.0% |
| Chilean | 76 | 0.7% |
| Chippewa | 6 | 0.1% |
| Colville | 12 | 0.1% |
| Costa Rican | 11 | 0.1% |
| Croatian | 8 | 0.1% |
| Cuban | 9 | 0.1% |
| Czech | 1 | 0.0% |
| Czechoslovakian | 41 | 0.4% |
| Danish | 168 | 1.6% |
| Dutch | 57 | 0.5% |
| English | 1,201 | 11.4% |
| Estonian | 116 | 1.1% |
| Ethiopian | 540 | 5.1% |
| European | 331 | 3.1% |
| Filipino | 24 | 0.2% |
| Finnish | 14 | 0.1% |
| French | 209 | 2.0% |
| French Canadian | 66 | 0.6% |
| German | 1,103 | 10.5% |
| Greek | 171 | 1.6% |
| Guatemalan | 14 | 0.1% |
| Honduran | 70 | 0.7% |
| Hungarian | 20 | 0.2% |
| Icelander | 15 | 0.1% |
| Indian (Asian) | 291 | 2.8% |
| Indonesian | 64 | 0.6% |
| Inupiat | 5 | 0.1% |
| Iranian | 18 | 0.2% |
| Irish | 589 | 5.6% |
| Iroquois | 12 | 0.1% |
| Italian | 158 | 1.5% |
| Japanese | 14 | 0.1% |
| Korean | 446 | 4.2% |
| Laotian | 11 | 0.1% |
| Lithuanian | 19 | 0.2% |
| Malaysian | 59 | 0.6% |
| Mexican | 1,194 | 11.3% |
| Mexican American Indian | 95 | 0.9% |
| Native Hawaiian | 34 | 0.3% |
| Navajo | 4 | 0.0% |
| Northern European | 47 | 0.4% |
| Norwegian | 647 | 6.1% |
| Pakistani | 24 | 0.2% |
| Palestinian | 335 | 3.2% |
| Peruvian | 76 | 0.7% |
| Polish | 39 | 0.4% |
| Puerto Rican | 99 | 0.9% |
| Puget Sound Salish | 8 | 0.1% |
| Romanian | 30 | 0.3% |
| Russian | 237 | 2.2% |
| Scandinavian | 15 | 0.1% |
| Scotch-Irish | 57 | 0.5% |
| Scottish | 150 | 1.4% |
| Sioux | 32 | 0.3% |
| South American | 152 | 1.4% |
| Spanish | 20 | 0.2% |
| Sri Lankan | 539 | 5.1% |
| Subsaharan African | 668 | 6.4% |
| Swedish | 212 | 2.0% |
| Swiss | 12 | 0.1% |
| Thai | 173 | 1.6% |
| Tlingit-Haida | 4 | 0.0% |
| Ukrainian | 278 | 2.6% |
| Vietnamese | 28 | 0.3% |
| Welsh | 127 | 1.2% | View All 78 Rows |
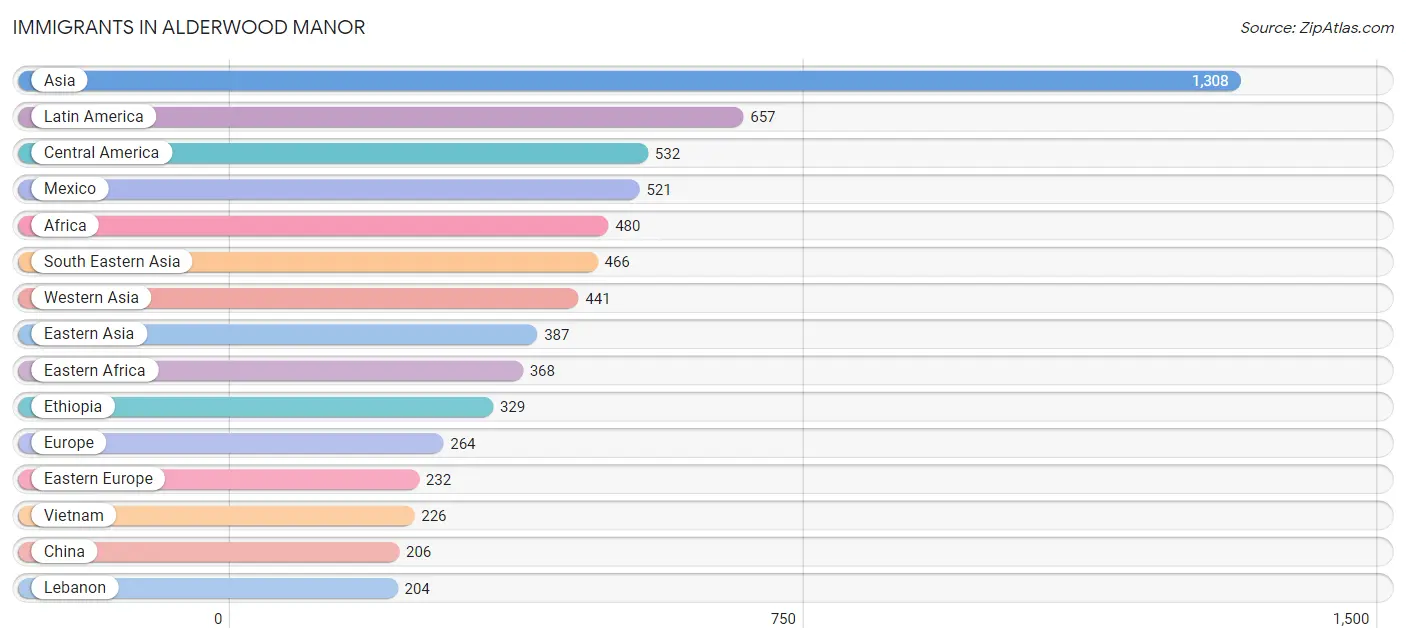
Immigrants in Alderwood Manor
The most numerous immigrant groups reported in Alderwood Manor came from Asia (1,308 | 12.4%), Latin America (657 | 6.2%), Central America (532 | 5.1%), Mexico (521 | 5.0%), and Africa (480 | 4.6%), together accounting for 33.2% of all Alderwood Manor residents.
| Immigration Origin | # Population | % Population |
| Afghanistan | 4 | 0.0% |
| Africa | 480 | 4.6% |
| Asia | 1,308 | 12.4% |
| Bangladesh | 10 | 0.1% |
| Belarus | 20 | 0.2% |
| Cambodia | 19 | 0.2% |
| Canada | 24 | 0.2% |
| Central America | 532 | 5.1% |
| Chile | 54 | 0.5% |
| China | 206 | 2.0% |
| Costa Rica | 11 | 0.1% |
| Eastern Africa | 368 | 3.5% |
| Eastern Asia | 387 | 3.7% |
| Eastern Europe | 232 | 2.2% |
| England | 22 | 0.2% |
| Eritrea | 39 | 0.4% |
| Ethiopia | 329 | 3.1% |
| Europe | 264 | 2.5% |
| Germany | 10 | 0.1% |
| Hong Kong | 14 | 0.1% |
| Hungary | 20 | 0.2% |
| Indonesia | 11 | 0.1% |
| Japan | 41 | 0.4% |
| Korea | 140 | 1.3% |
| Laos | 30 | 0.3% |
| Latin America | 657 | 6.2% |
| Lebanon | 204 | 1.9% |
| Mexico | 521 | 5.0% |
| Northern Europe | 22 | 0.2% |
| Peru | 71 | 0.7% |
| Philippines | 147 | 1.4% |
| Romania | 28 | 0.3% |
| Saudi Arabia | 79 | 0.7% |
| South America | 125 | 1.2% |
| South Central Asia | 14 | 0.1% |
| South Eastern Asia | 466 | 4.4% |
| Syria | 158 | 1.5% |
| Taiwan | 20 | 0.2% |
| Ukraine | 123 | 1.2% |
| Vietnam | 226 | 2.1% |
| Western Africa | 112 | 1.1% |
| Western Asia | 441 | 4.2% |
| Western Europe | 10 | 0.1% | View All 43 Rows |
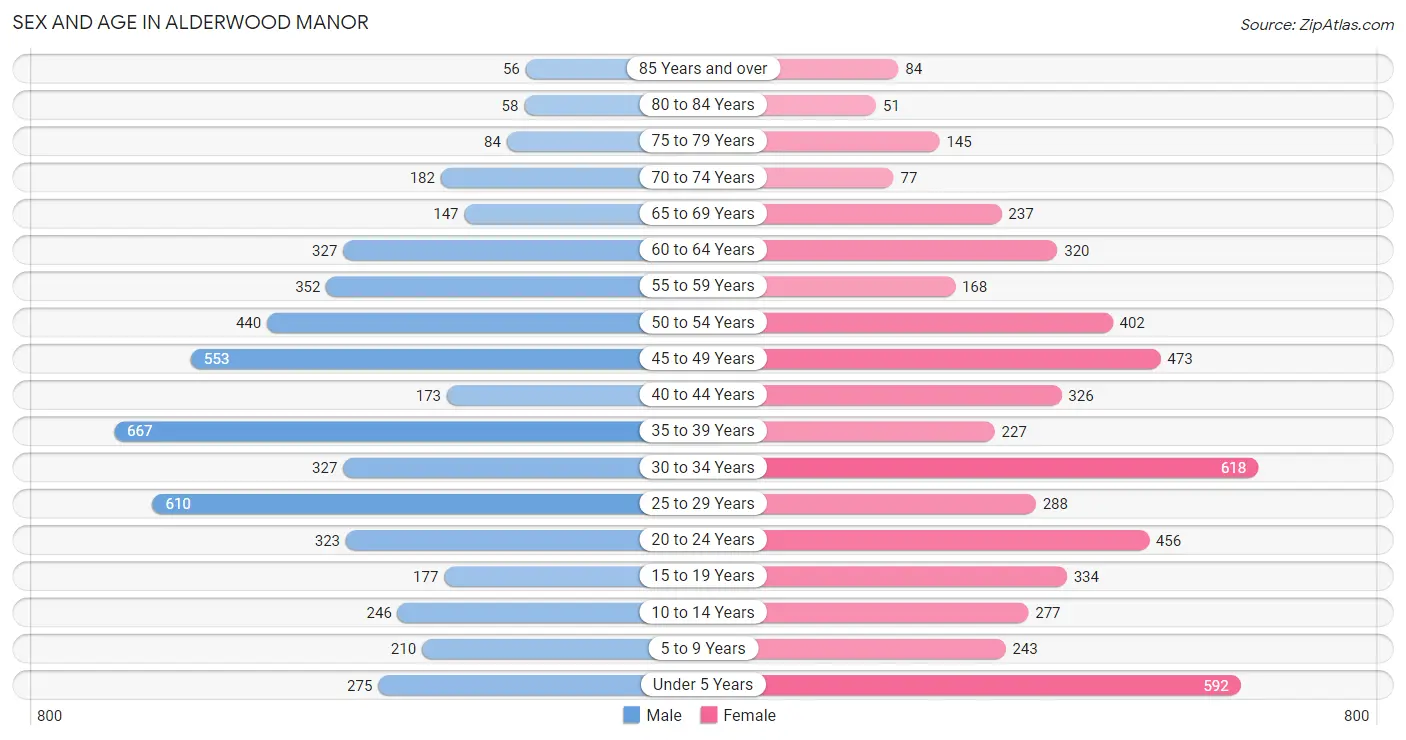
Sex and Age in Alderwood Manor
Sex and Age in Alderwood Manor
The most populous age groups in Alderwood Manor are 35 to 39 Years (667 | 12.8%) for men and 30 to 34 Years (618 | 11.6%) for women.
| Age Bracket | Male | Female |
| Under 5 Years | 275 (5.3%) | 592 (11.1%) |
| 5 to 9 Years | 210 (4.0%) | 243 (4.6%) |
| 10 to 14 Years | 246 (4.7%) | 277 (5.2%) |
| 15 to 19 Years | 177 (3.4%) | 334 (6.3%) |
| 20 to 24 Years | 323 (6.2%) | 456 (8.6%) |
| 25 to 29 Years | 610 (11.7%) | 288 (5.4%) |
| 30 to 34 Years | 327 (6.3%) | 618 (11.6%) |
| 35 to 39 Years | 667 (12.8%) | 227 (4.3%) |
| 40 to 44 Years | 173 (3.3%) | 326 (6.1%) |
| 45 to 49 Years | 553 (10.6%) | 473 (8.9%) |
| 50 to 54 Years | 440 (8.5%) | 402 (7.6%) |
| 55 to 59 Years | 352 (6.8%) | 168 (3.2%) |
| 60 to 64 Years | 327 (6.3%) | 320 (6.0%) |
| 65 to 69 Years | 147 (2.8%) | 237 (4.5%) |
| 70 to 74 Years | 182 (3.5%) | 77 (1.5%) |
| 75 to 79 Years | 84 (1.6%) | 145 (2.7%) |
| 80 to 84 Years | 58 (1.1%) | 51 (1.0%) |
| 85 Years and over | 56 (1.1%) | 84 (1.6%) |
| Total | 5,207 (100.0%) | 5,318 (100.0%) |
Families and Households in Alderwood Manor
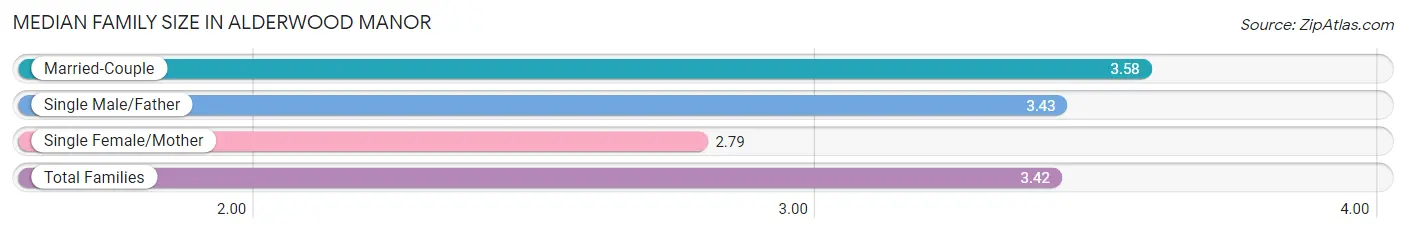
Median Family Size in Alderwood Manor
The median family size in Alderwood Manor is 3.42 persons per family, with married-couple families (1,888 | 73.3%) accounting for the largest median family size of 3.58 persons per family. On the other hand, single female/mother families (506 | 19.6%) represent the smallest median family size with 2.79 persons per family.
| Family Type | # Families | Family Size |
| Married-Couple | 1,888 (73.3%) | 3.58 |
| Single Male/Father | 182 (7.1%) | 3.43 |
| Single Female/Mother | 506 (19.6%) | 2.79 |
| Total Families | 2,576 (100.0%) | 3.42 |
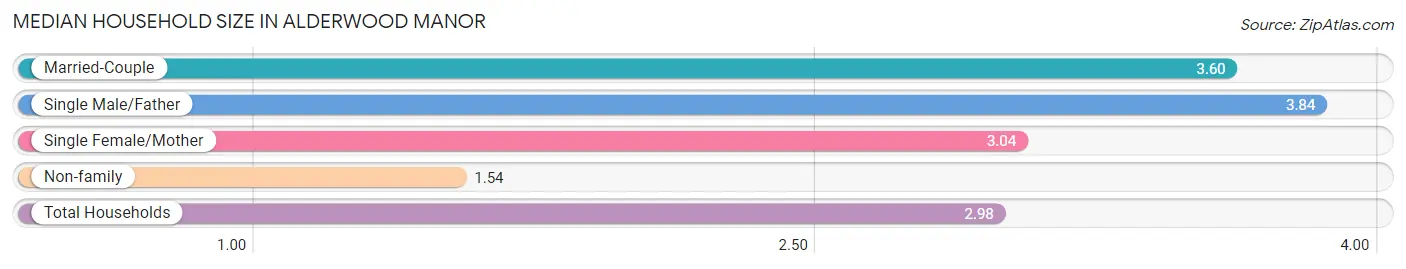
Median Household Size in Alderwood Manor
The median household size in Alderwood Manor is 2.98 persons per household, with single male/father households (182 | 5.2%) accounting for the largest median household size of 3.84 persons per household. non-family households (929 | 26.5%) represent the smallest median household size with 1.54 persons per household.
| Household Type | # Households | Household Size |
| Married-Couple | 1,888 (53.9%) | 3.60 |
| Single Male/Father | 182 (5.2%) | 3.84 |
| Single Female/Mother | 506 (14.4%) | 3.04 |
| Non-family | 929 (26.5%) | 1.54 |
| Total Households | 3,505 (100.0%) | 2.98 |
Household Size by Marriage Status in Alderwood Manor
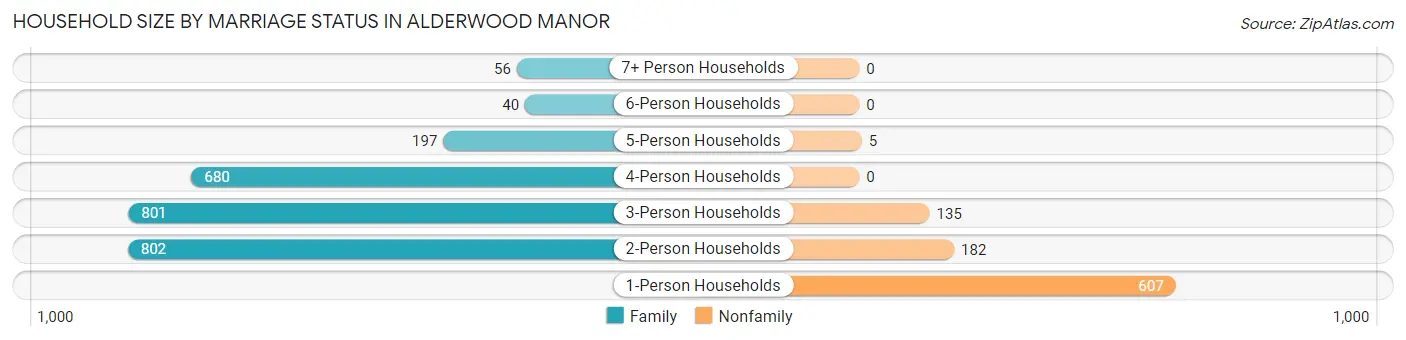
Out of a total of 3,505 households in Alderwood Manor, 2,576 (73.5%) are family households, while 929 (26.5%) are nonfamily households. The most numerous type of family households are 2-person households, comprising 802, and the most common type of nonfamily households are 1-person households, comprising 607.
| Household Size | Family Households | Nonfamily Households |
| 1-Person Households | - | 607 (17.3%) |
| 2-Person Households | 802 (22.9%) | 182 (5.2%) |
| 3-Person Households | 801 (22.9%) | 135 (3.8%) |
| 4-Person Households | 680 (19.4%) | 0 (0.0%) |
| 5-Person Households | 197 (5.6%) | 5 (0.1%) |
| 6-Person Households | 40 (1.1%) | 0 (0.0%) |
| 7+ Person Households | 56 (1.6%) | 0 (0.0%) |
| Total | 2,576 (73.5%) | 929 (26.5%) |
Female Fertility in Alderwood Manor
Fertility by Age in Alderwood Manor
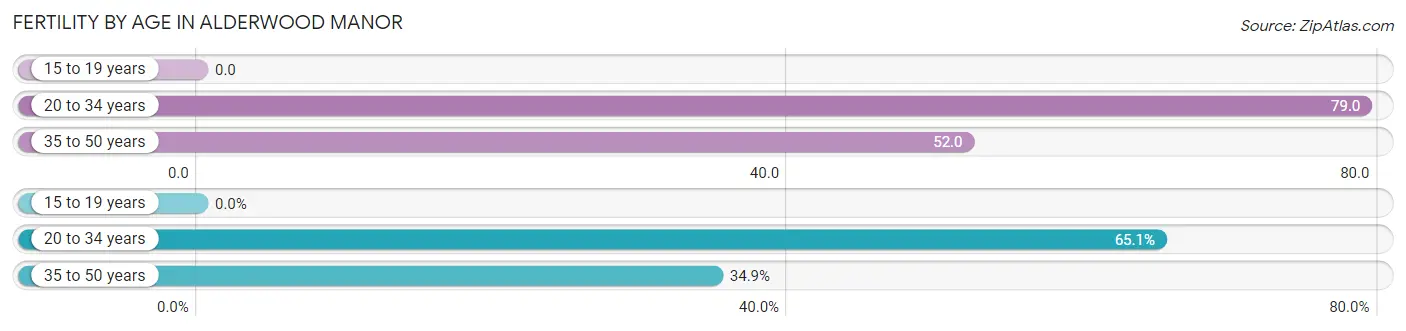
Average fertility rate in Alderwood Manor is 59.0 births per 1,000 women. Women in the age bracket of 20 to 34 years have the highest fertility rate with 79.0 births per 1,000 women. Women in the age bracket of 20 to 34 years acount for 65.1% of all women with births.
| Age Bracket | Women with Births | Births / 1,000 Women |
| 15 to 19 years | 0 (0.0%) | 0.0 |
| 20 to 34 years | 108 (65.1%) | 79.0 |
| 35 to 50 years | 58 (34.9%) | 52.0 |
| Total | 166 (100.0%) | 59.0 |
Fertility by Age by Marriage Status in Alderwood Manor
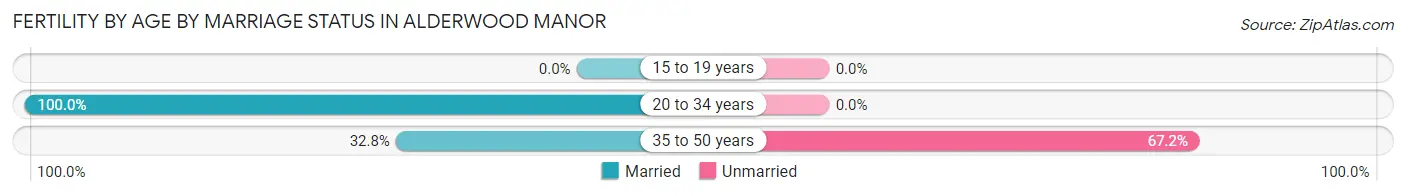
76.5% of women with births (166) in Alderwood Manor are married. The highest percentage of unmarried women with births falls into 35 to 50 years age bracket with 67.2% of them unmarried at the time of birth, while the lowest percentage of unmarried women with births belong to 20 to 34 years age bracket with 0.0% of them unmarried.
| Age Bracket | Married | Unmarried |
| 15 to 19 years | 0 (0.0%) | 0 (0.0%) |
| 20 to 34 years | 108 (100.0%) | 0 (0.0%) |
| 35 to 50 years | 19 (32.8%) | 39 (67.2%) |
| Total | 127 (76.5%) | 39 (23.5%) |
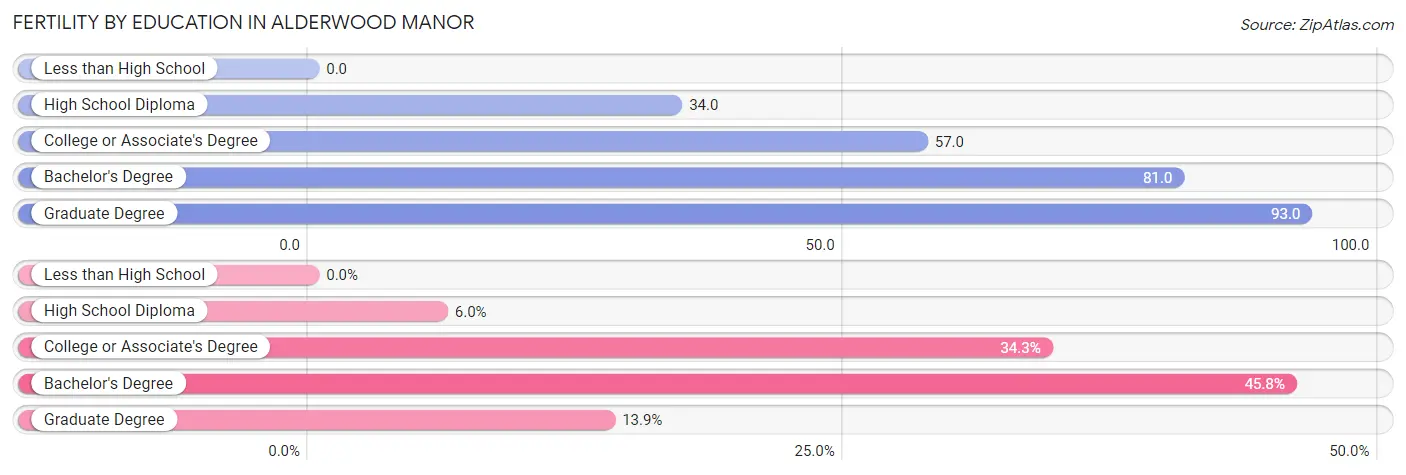
Fertility by Education in Alderwood Manor
| Educational Attainment | Women with Births | Births / 1,000 Women |
| Less than High School | 0 (0.0%) | 0.0 |
| High School Diploma | 10 (6.0%) | 34.0 |
| College or Associate's Degree | 57 (34.3%) | 57.0 |
| Bachelor's Degree | 76 (45.8%) | 81.0 |
| Graduate Degree | 23 (13.9%) | 93.0 |
| Total | 166 (100.0%) | 59.0 |
Fertility by Education by Marriage Status in Alderwood Manor
23.5% of women with births in Alderwood Manor are unmarried. Women with the educational attainment of high school diploma are most likely to be married with 100.0% of them married at childbirth, while women with the educational attainment of college or associate's degree are least likely to be married with 68.4% of them unmarried at childbirth.
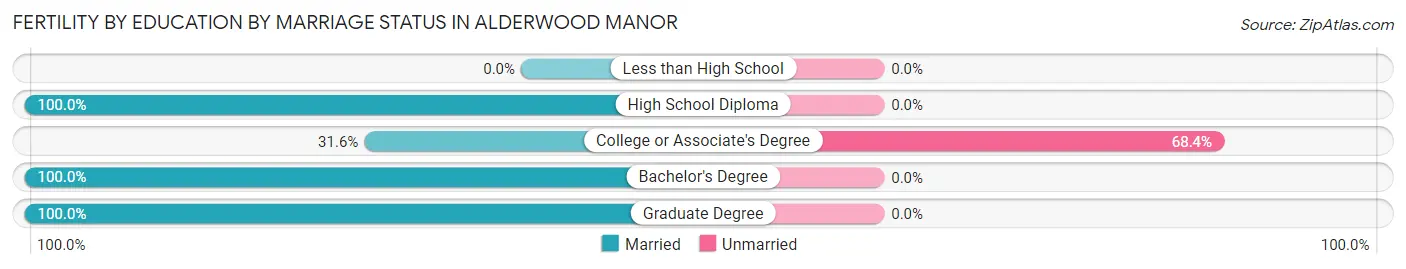
| Educational Attainment | Married | Unmarried |
| Less than High School | 0 (0.0%) | 0 (0.0%) |
| High School Diploma | 10 (100.0%) | 0 (0.0%) |
| College or Associate's Degree | 18 (31.6%) | 39 (68.4%) |
| Bachelor's Degree | 76 (100.0%) | 0 (0.0%) |
| Graduate Degree | 23 (100.0%) | 0 (0.0%) |
| Total | 127 (76.5%) | 39 (23.5%) |
Employment Characteristics in Alderwood Manor
Employment by Class of Employer in Alderwood Manor
Among the 5,330 employed individuals in Alderwood Manor, private company employees (3,223 | 60.5%), not-for-profit organizations (522 | 9.8%), and self-employed (not incorporated) (398 | 7.5%) make up the most common classes of employment.
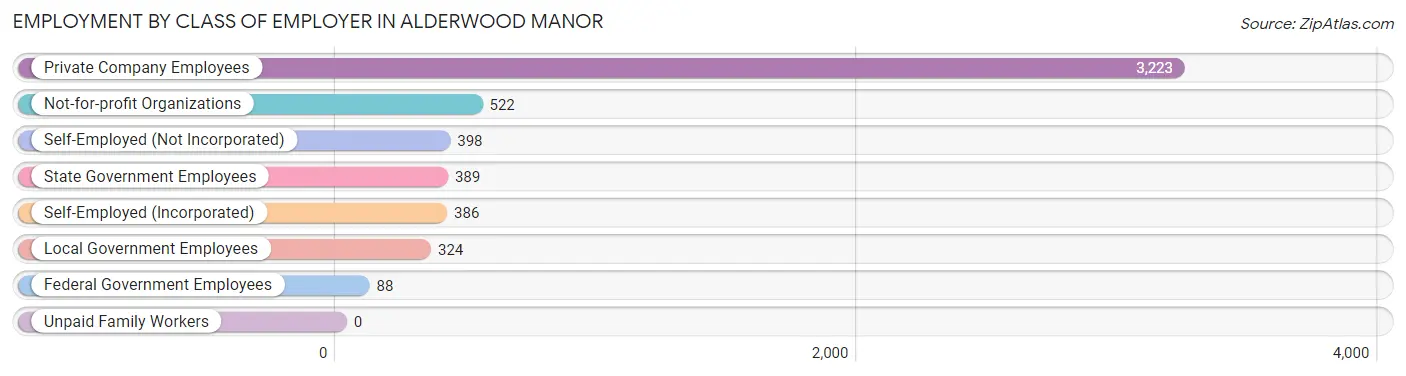
| Employer Class | # Employees | % Employees |
| Private Company Employees | 3,223 | 60.5% |
| Self-Employed (Incorporated) | 386 | 7.2% |
| Self-Employed (Not Incorporated) | 398 | 7.5% |
| Not-for-profit Organizations | 522 | 9.8% |
| Local Government Employees | 324 | 6.1% |
| State Government Employees | 389 | 7.3% |
| Federal Government Employees | 88 | 1.7% |
| Unpaid Family Workers | 0 | 0.0% |
| Total | 5,330 | 100.0% |
Employment Status by Age in Alderwood Manor
According to the labor force statistics for Alderwood Manor, out of the total population over 16 years of age (8,604), 67.0% or 5,765 individuals are in the labor force, with 4.8% or 277 of them unemployed. The age group with the highest labor force participation rate is 25 to 29 years, with 92.1% or 827 individuals in the labor force. Within the labor force, the 35 to 44 years age range has the highest percentage of unemployed individuals, with 8.9% or 107 of them being unemployed.
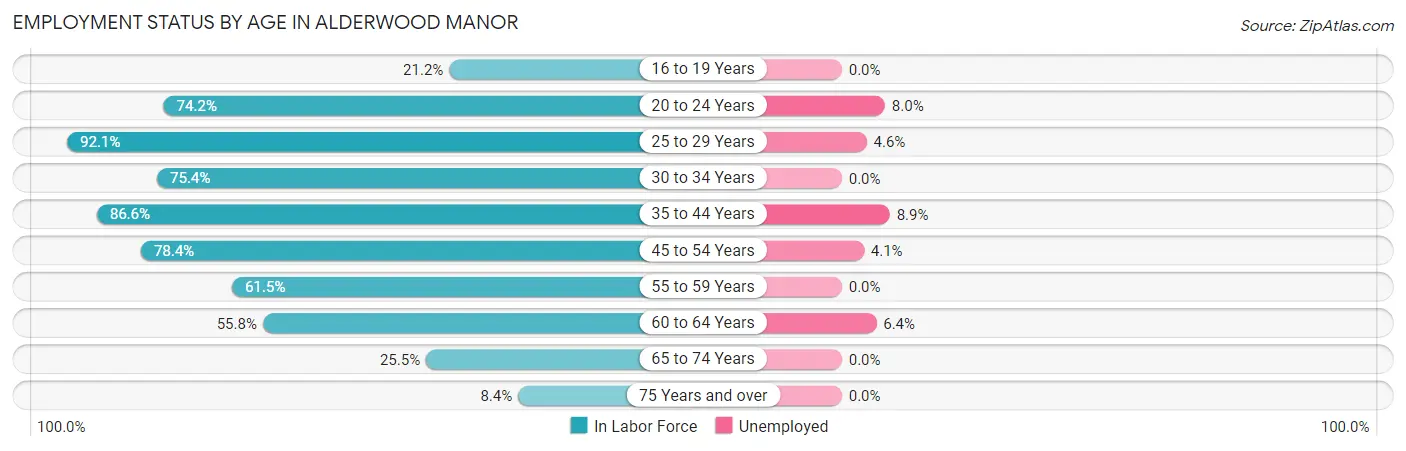
| Age Bracket | In Labor Force | Unemployed |
| 16 to 19 Years | 92 (21.2%) | 0 (0.0%) |
| 20 to 24 Years | 578 (74.2%) | 46 (8.0%) |
| 25 to 29 Years | 827 (92.1%) | 38 (4.6%) |
| 30 to 34 Years | 713 (75.4%) | 0 (0.0%) |
| 35 to 44 Years | 1,206 (86.6%) | 107 (8.9%) |
| 45 to 54 Years | 1,465 (78.4%) | 60 (4.1%) |
| 55 to 59 Years | 320 (61.5%) | 0 (0.0%) |
| 60 to 64 Years | 361 (55.8%) | 23 (6.4%) |
| 65 to 74 Years | 164 (25.5%) | 0 (0.0%) |
| 75 Years and over | 40 (8.4%) | 0 (0.0%) |
| Total | 5,765 (67.0%) | 277 (4.8%) |
Employment Status by Educational Attainment in Alderwood Manor
According to labor force statistics for Alderwood Manor, 78.0% of individuals (4,891) out of the total population between 25 and 64 years of age (6,271) are in the labor force, with 4.7% or 230 of them being unemployed. The group with the highest labor force participation rate are those with the educational attainment of bachelor's degree or higher, with 89.0% or 2,205 individuals in the labor force. Within the labor force, individuals with less than high school education have the highest percentage of unemployment, with 16.8% or 60 of them being unemployed.
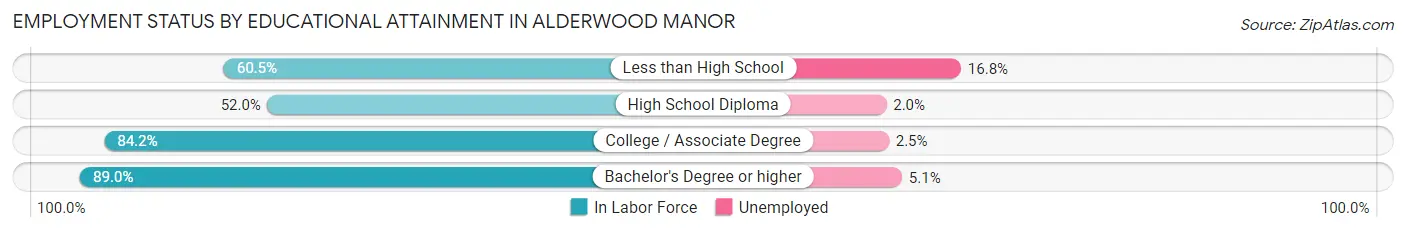
| Educational Attainment | In Labor Force | Unemployed |
| Less than High School | 357 (60.5%) | 99 (16.8%) |
| High School Diploma | 597 (52.0%) | 23 (2.0%) |
| College / Associate Degree | 1,729 (84.2%) | 51 (2.5%) |
| Bachelor's Degree or higher | 2,205 (89.0%) | 126 (5.1%) |
| Total | 4,891 (78.0%) | 295 (4.7%) |
Employment Occupations by Sex in Alderwood Manor
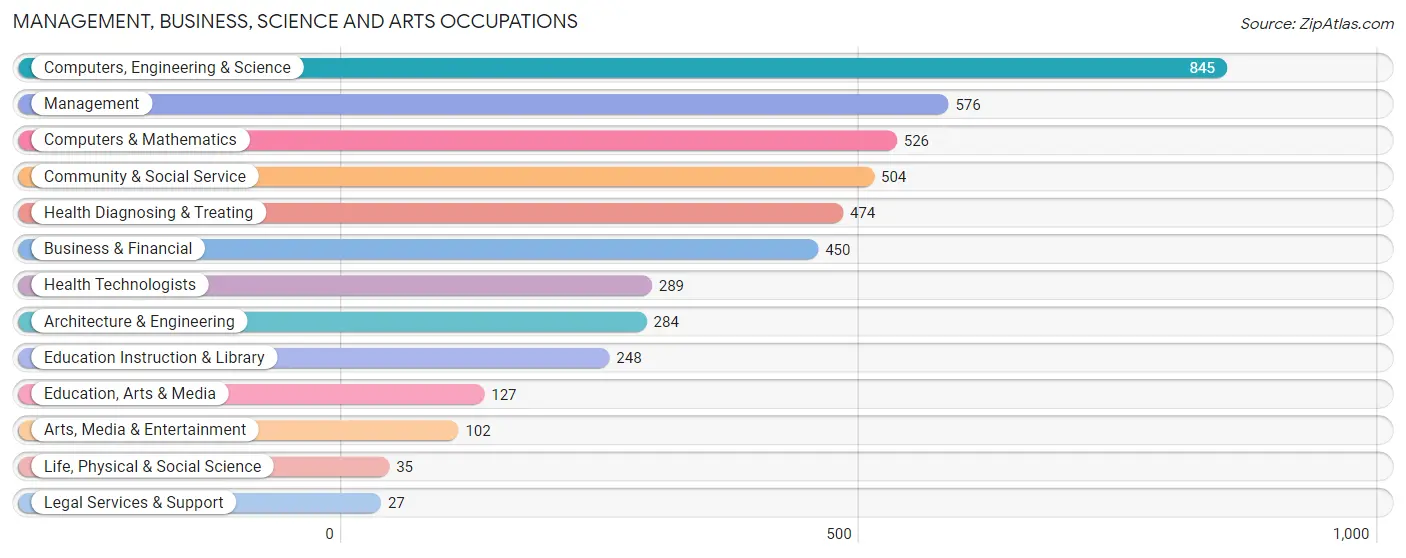
Management, Business, Science and Arts Occupations
The most common Management, Business, Science and Arts occupations in Alderwood Manor are Computers, Engineering & Science (845 | 15.4%), Management (576 | 10.5%), Computers & Mathematics (526 | 9.6%), Community & Social Service (504 | 9.2%), and Health Diagnosing & Treating (474 | 8.6%).
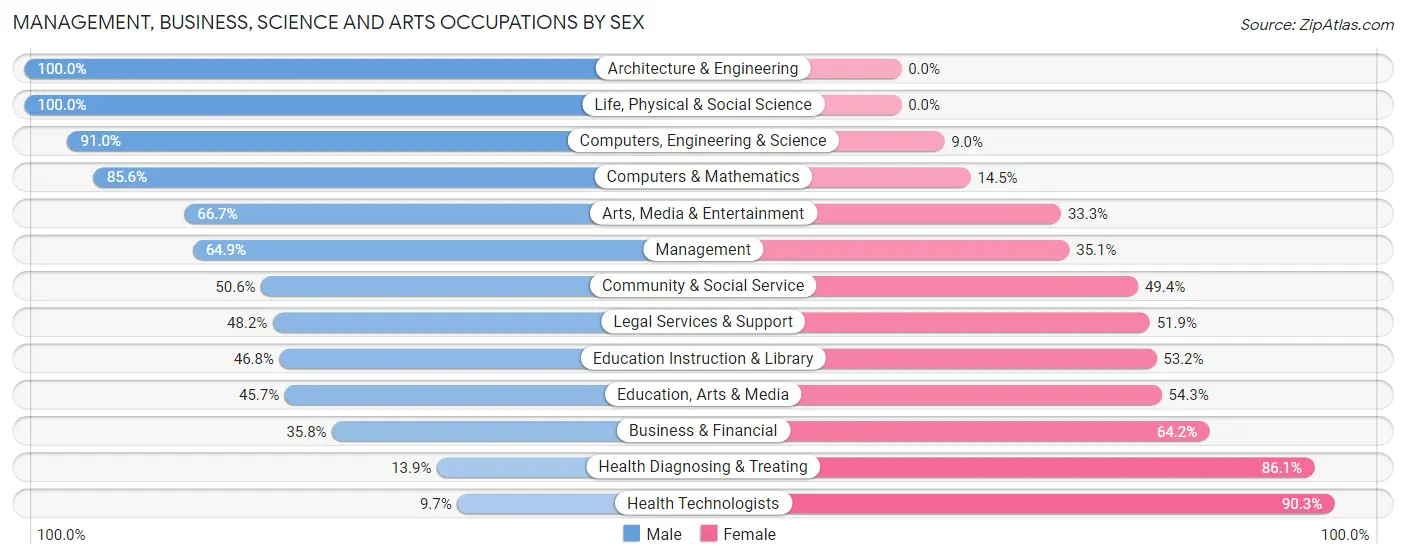
Management, Business, Science and Arts Occupations by Sex
Within the Management, Business, Science and Arts occupations in Alderwood Manor, the most male-oriented occupations are Architecture & Engineering (100.0%), Life, Physical & Social Science (100.0%), and Computers, Engineering & Science (91.0%), while the most female-oriented occupations are Health Technologists (90.3%), Health Diagnosing & Treating (86.1%), and Business & Financial (64.2%).
| Occupation | Male | Female |
| Management | 374 (64.9%) | 202 (35.1%) |
| Business & Financial | 161 (35.8%) | 289 (64.2%) |
| Computers, Engineering & Science | 769 (91.0%) | 76 (9.0%) |
| Computers & Mathematics | 450 (85.6%) | 76 (14.4%) |
| Architecture & Engineering | 284 (100.0%) | 0 (0.0%) |
| Life, Physical & Social Science | 35 (100.0%) | 0 (0.0%) |
| Community & Social Service | 255 (50.6%) | 249 (49.4%) |
| Education, Arts & Media | 58 (45.7%) | 69 (54.3%) |
| Legal Services & Support | 13 (48.1%) | 14 (51.8%) |
| Education Instruction & Library | 116 (46.8%) | 132 (53.2%) |
| Arts, Media & Entertainment | 68 (66.7%) | 34 (33.3%) |
| Health Diagnosing & Treating | 66 (13.9%) | 408 (86.1%) |
| Health Technologists | 28 (9.7%) | 261 (90.3%) |
| Total (Category) | 1,625 (57.0%) | 1,224 (43.0%) |
| Total (Overall) | 2,969 (54.1%) | 2,522 (45.9%) |
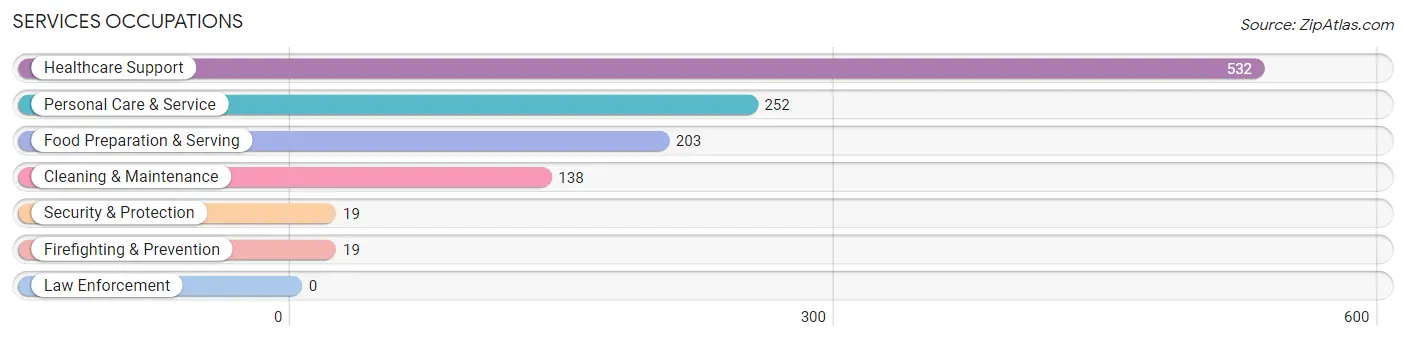
Services Occupations
The most common Services occupations in Alderwood Manor are Healthcare Support (532 | 9.7%), Personal Care & Service (252 | 4.6%), Food Preparation & Serving (203 | 3.7%), Cleaning & Maintenance (138 | 2.5%), and Security & Protection (19 | 0.4%).
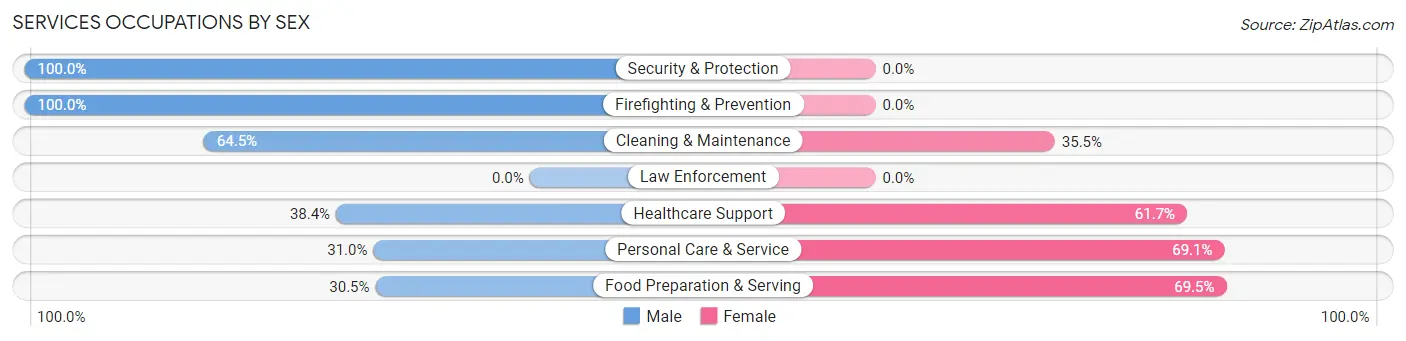
Services Occupations by Sex
Within the Services occupations in Alderwood Manor, the most male-oriented occupations are Security & Protection (100.0%), Firefighting & Prevention (100.0%), and Cleaning & Maintenance (64.5%), while the most female-oriented occupations are Food Preparation & Serving (69.5%), Personal Care & Service (69.1%), and Healthcare Support (61.7%).
| Occupation | Male | Female |
| Healthcare Support | 204 (38.4%) | 328 (61.7%) |
| Security & Protection | 19 (100.0%) | 0 (0.0%) |
| Firefighting & Prevention | 19 (100.0%) | 0 (0.0%) |
| Law Enforcement | 0 (0.0%) | 0 (0.0%) |
| Food Preparation & Serving | 62 (30.5%) | 141 (69.5%) |
| Cleaning & Maintenance | 89 (64.5%) | 49 (35.5%) |
| Personal Care & Service | 78 (30.9%) | 174 (69.1%) |
| Total (Category) | 452 (39.5%) | 692 (60.5%) |
| Total (Overall) | 2,969 (54.1%) | 2,522 (45.9%) |
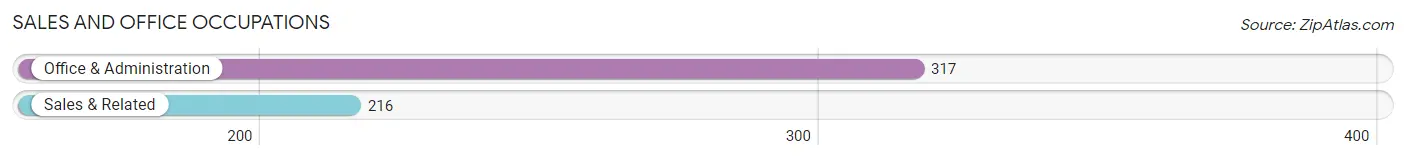
Sales and Office Occupations
The most common Sales and Office occupations in Alderwood Manor are Office & Administration (317 | 5.8%), and Sales & Related (216 | 3.9%).
Sales and Office Occupations by Sex
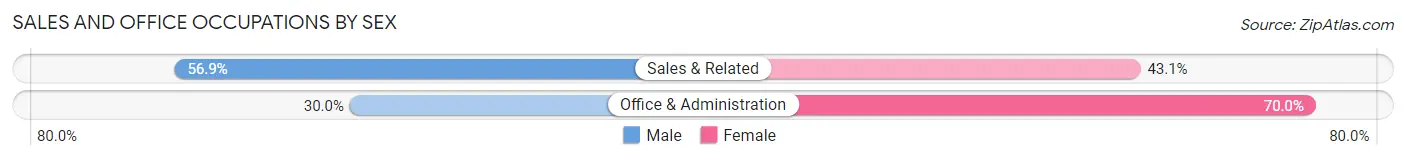
| Occupation | Male | Female |
| Sales & Related | 123 (56.9%) | 93 (43.1%) |
| Office & Administration | 95 (30.0%) | 222 (70.0%) |
| Total (Category) | 218 (40.9%) | 315 (59.1%) |
| Total (Overall) | 2,969 (54.1%) | 2,522 (45.9%) |
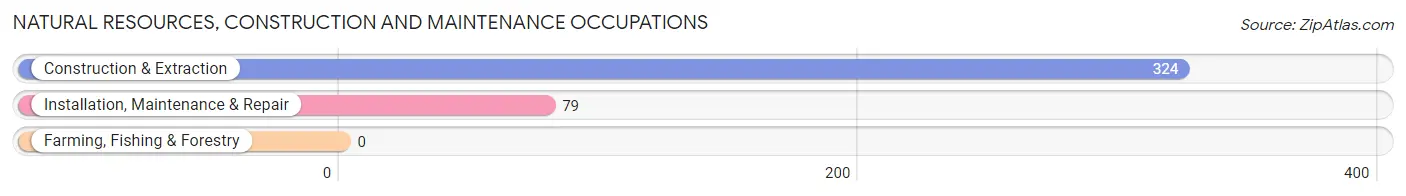
Natural Resources, Construction and Maintenance Occupations
The most common Natural Resources, Construction and Maintenance occupations in Alderwood Manor are Construction & Extraction (324 | 5.9%), and Installation, Maintenance & Repair (79 | 1.4%).
Natural Resources, Construction and Maintenance Occupations by Sex
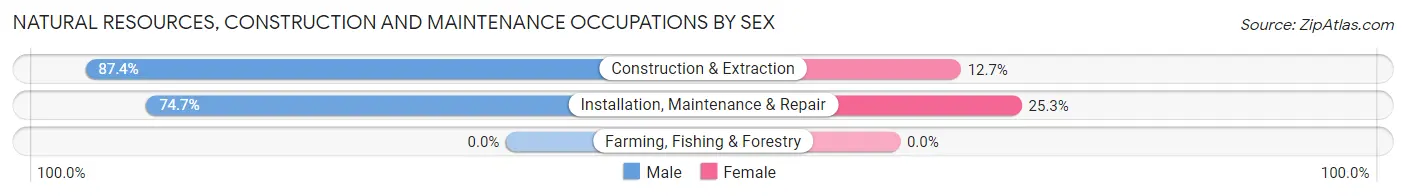
| Occupation | Male | Female |
| Farming, Fishing & Forestry | 0 (0.0%) | 0 (0.0%) |
| Construction & Extraction | 283 (87.4%) | 41 (12.7%) |
| Installation, Maintenance & Repair | 59 (74.7%) | 20 (25.3%) |
| Total (Category) | 342 (84.9%) | 61 (15.1%) |
| Total (Overall) | 2,969 (54.1%) | 2,522 (45.9%) |
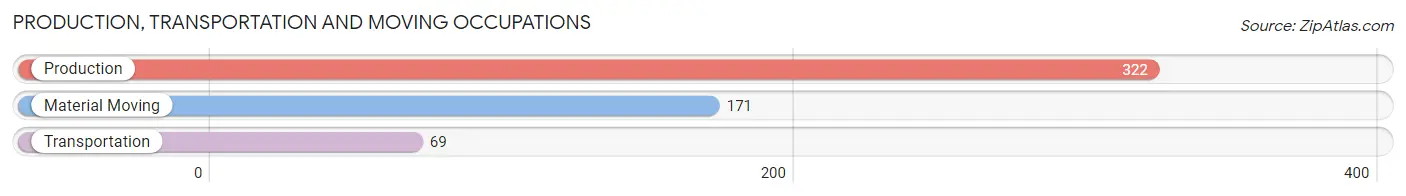
Production, Transportation and Moving Occupations
The most common Production, Transportation and Moving occupations in Alderwood Manor are Production (322 | 5.9%), Material Moving (171 | 3.1%), and Transportation (69 | 1.3%).
Production, Transportation and Moving Occupations by Sex
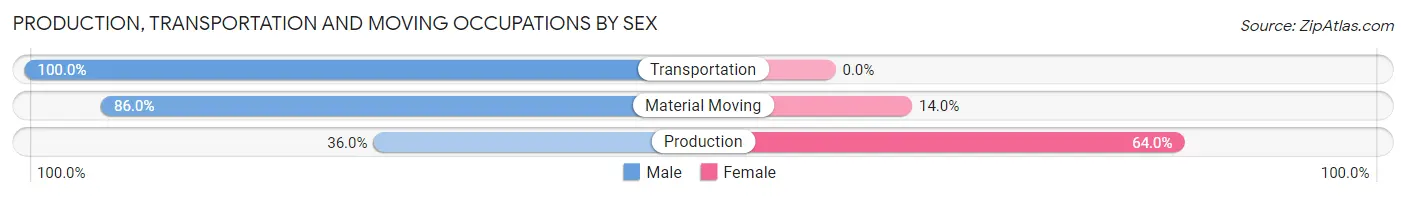
| Occupation | Male | Female |
| Production | 116 (36.0%) | 206 (64.0%) |
| Transportation | 69 (100.0%) | 0 (0.0%) |
| Material Moving | 147 (86.0%) | 24 (14.0%) |
| Total (Category) | 332 (59.1%) | 230 (40.9%) |
| Total (Overall) | 2,969 (54.1%) | 2,522 (45.9%) |
Employment Industries by Sex in Alderwood Manor
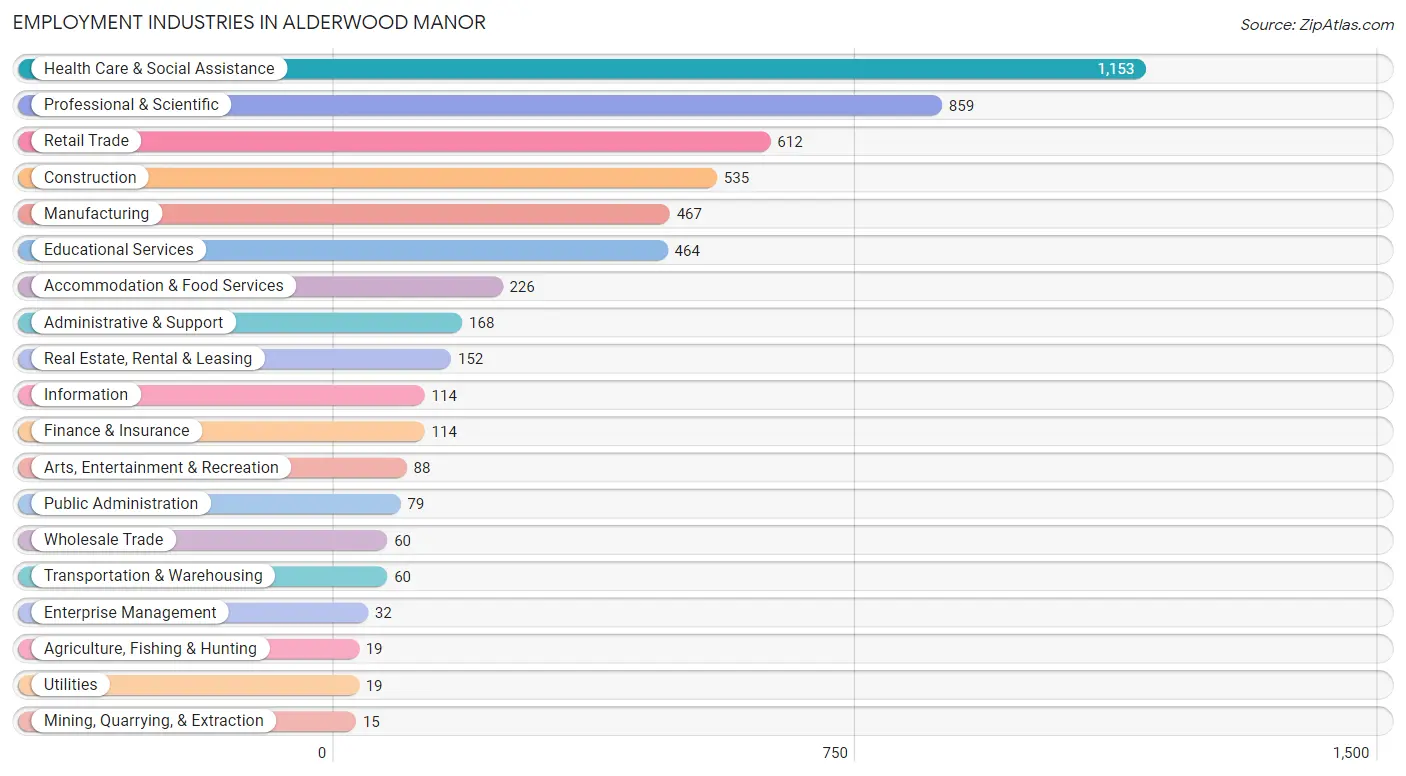
Employment Industries in Alderwood Manor
The major employment industries in Alderwood Manor include Health Care & Social Assistance (1,153 | 21.0%), Professional & Scientific (859 | 15.6%), Retail Trade (612 | 11.2%), Construction (535 | 9.7%), and Manufacturing (467 | 8.5%).
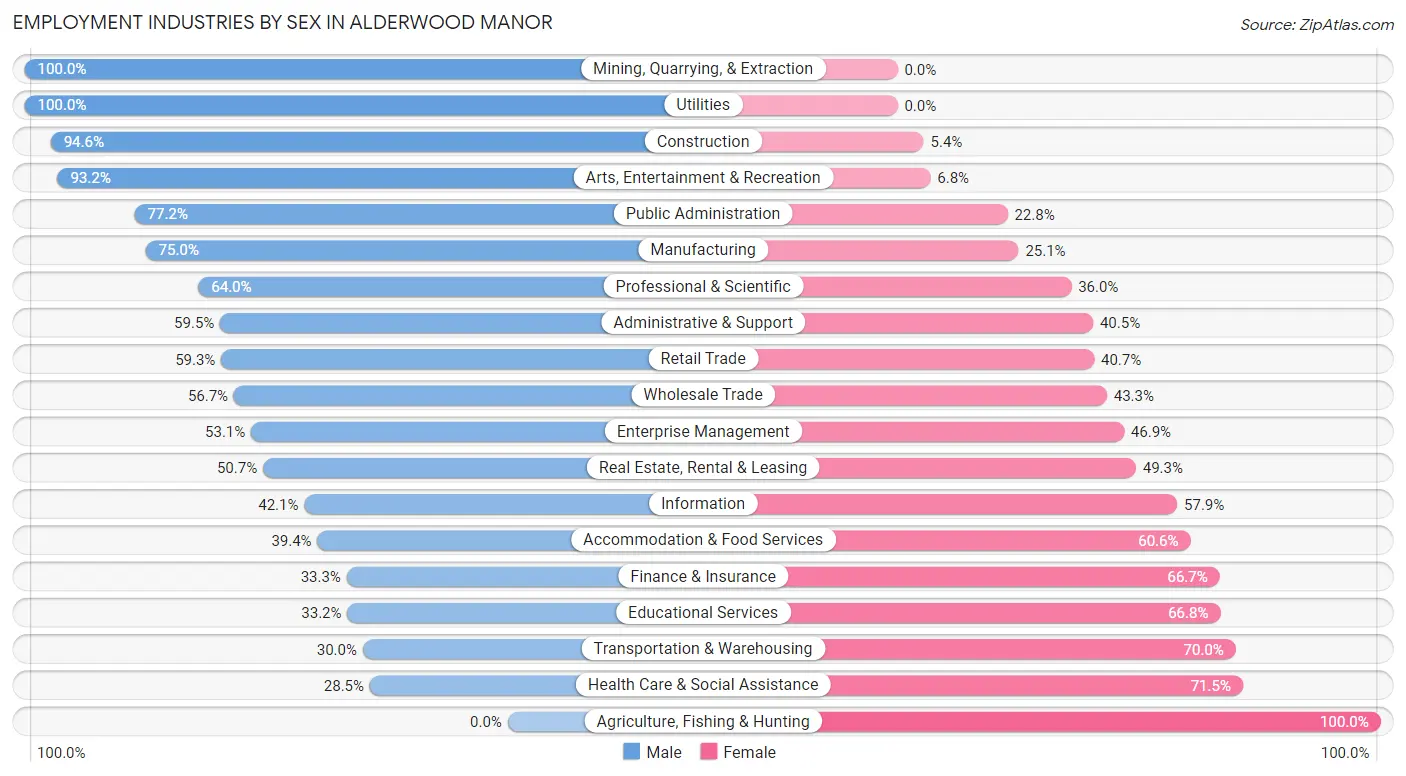
Employment Industries by Sex in Alderwood Manor
The Alderwood Manor industries that see more men than women are Mining, Quarrying, & Extraction (100.0%), Utilities (100.0%), and Construction (94.6%), whereas the industries that tend to have a higher number of women are Agriculture, Fishing & Hunting (100.0%), Health Care & Social Assistance (71.5%), and Transportation & Warehousing (70.0%).
| Industry | Male | Female |
| Agriculture, Fishing & Hunting | 0 (0.0%) | 19 (100.0%) |
| Mining, Quarrying, & Extraction | 15 (100.0%) | 0 (0.0%) |
| Construction | 506 (94.6%) | 29 (5.4%) |
| Manufacturing | 350 (75.0%) | 117 (25.1%) |
| Wholesale Trade | 34 (56.7%) | 26 (43.3%) |
| Retail Trade | 363 (59.3%) | 249 (40.7%) |
| Transportation & Warehousing | 18 (30.0%) | 42 (70.0%) |
| Utilities | 19 (100.0%) | 0 (0.0%) |
| Information | 48 (42.1%) | 66 (57.9%) |
| Finance & Insurance | 38 (33.3%) | 76 (66.7%) |
| Real Estate, Rental & Leasing | 77 (50.7%) | 75 (49.3%) |
| Professional & Scientific | 550 (64.0%) | 309 (36.0%) |
| Enterprise Management | 17 (53.1%) | 15 (46.9%) |
| Administrative & Support | 100 (59.5%) | 68 (40.5%) |
| Educational Services | 154 (33.2%) | 310 (66.8%) |
| Health Care & Social Assistance | 329 (28.5%) | 824 (71.5%) |
| Arts, Entertainment & Recreation | 82 (93.2%) | 6 (6.8%) |
| Accommodation & Food Services | 89 (39.4%) | 137 (60.6%) |
| Public Administration | 61 (77.2%) | 18 (22.8%) |
| Total | 2,969 (54.1%) | 2,522 (45.9%) |
Education in Alderwood Manor
School Enrollment in Alderwood Manor
The most common levels of schooling among the 2,397 students in Alderwood Manor are college / undergraduate (898 | 37.5%), middle school (467 | 19.5%), and high school (363 | 15.1%).
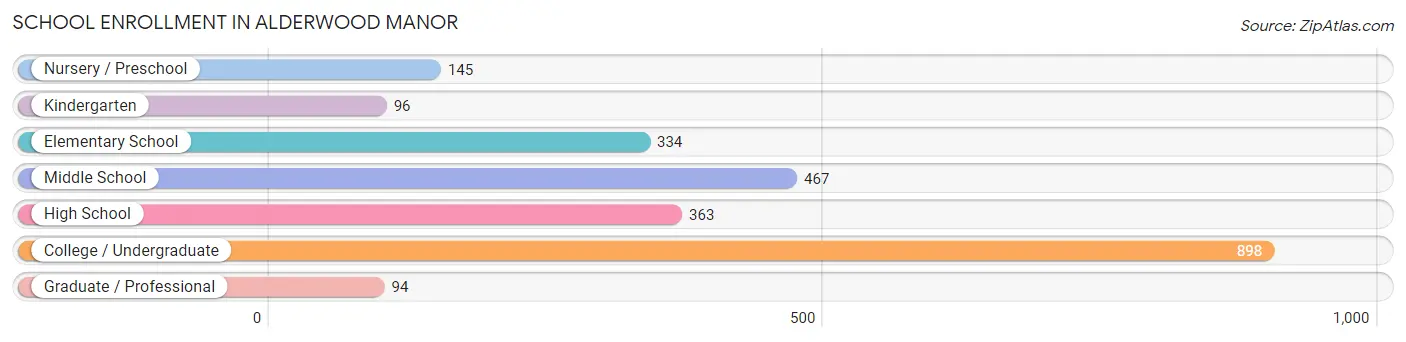
| School Level | # Students | % Students |
| Nursery / Preschool | 145 | 6.0% |
| Kindergarten | 96 | 4.0% |
| Elementary School | 334 | 13.9% |
| Middle School | 467 | 19.5% |
| High School | 363 | 15.1% |
| College / Undergraduate | 898 | 37.5% |
| Graduate / Professional | 94 | 3.9% |
| Total | 2,397 | 100.0% |
School Enrollment by Age by Funding Source in Alderwood Manor
Out of a total of 2,397 students who are enrolled in schools in Alderwood Manor, 482 (20.1%) attend a private institution, while the remaining 1,915 (79.9%) are enrolled in public schools. The age group of 3 to 4 year olds has the highest likelihood of being enrolled in private schools, with 93 (80.2% in the age bracket) enrolled. Conversely, the age group of 10 to 14 year olds has the lowest likelihood of being enrolled in a private school, with 503 (96.2% in the age bracket) attending a public institution.
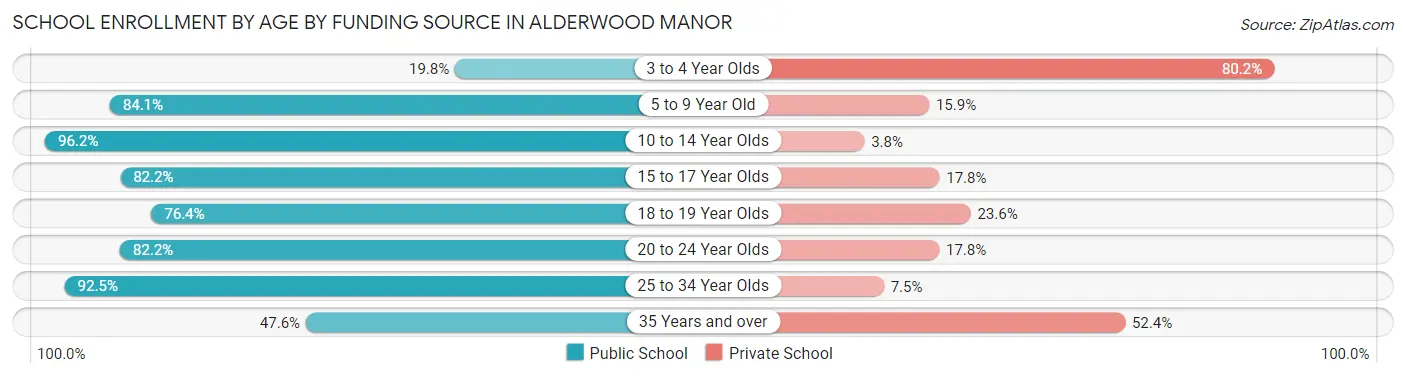
| Age Bracket | Public School | Private School |
| 3 to 4 Year Olds | 23 (19.8%) | 93 (80.2%) |
| 5 to 9 Year Old | 360 (84.1%) | 68 (15.9%) |
| 10 to 14 Year Olds | 503 (96.2%) | 20 (3.8%) |
| 15 to 17 Year Olds | 240 (82.2%) | 52 (17.8%) |
| 18 to 19 Year Olds | 97 (76.4%) | 30 (23.6%) |
| 20 to 24 Year Olds | 301 (82.2%) | 65 (17.8%) |
| 25 to 34 Year Olds | 273 (92.5%) | 22 (7.5%) |
| 35 Years and over | 119 (47.6%) | 131 (52.4%) |
| Total | 1,915 (79.9%) | 482 (20.1%) |
Educational Attainment by Field of Study in Alderwood Manor
Engineering (567 | 18.4%), business (507 | 16.4%), science & technology (315 | 10.2%), visual & performing arts (205 | 6.6%), and computers & mathematics (202 | 6.5%) are the most common fields of study among 3,089 individuals in Alderwood Manor who have obtained a bachelor's degree or higher.
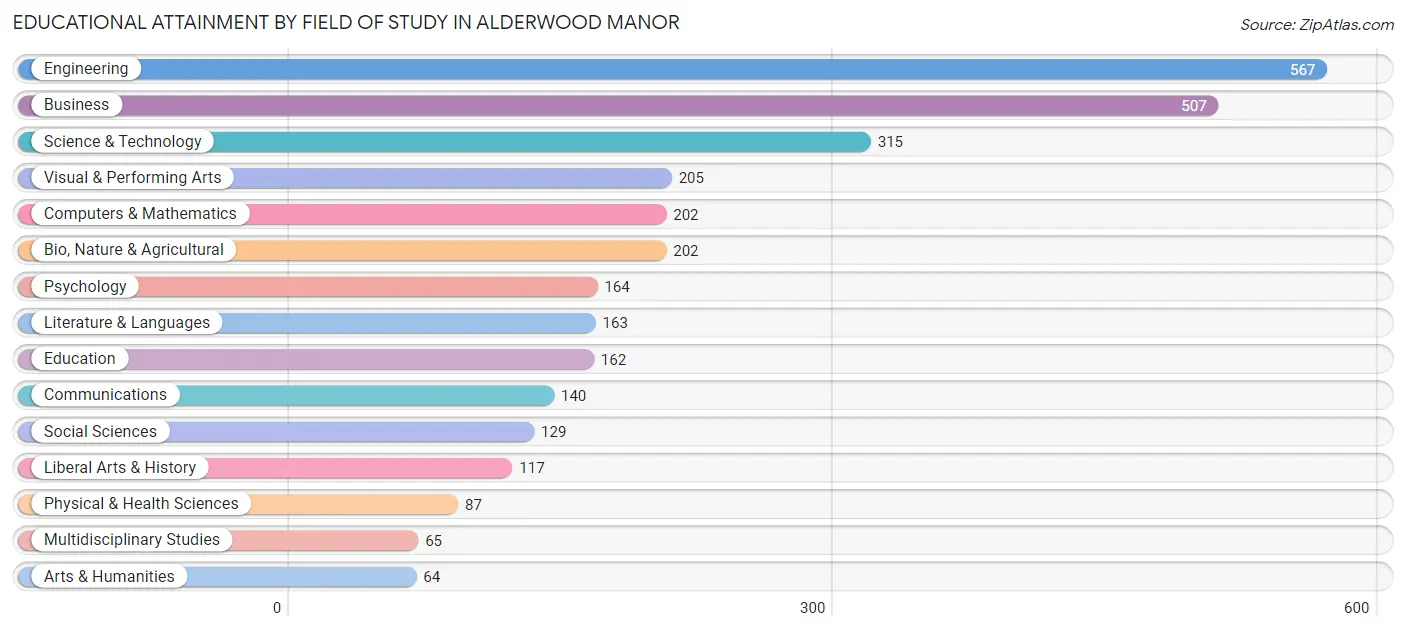
| Field of Study | # Graduates | % Graduates |
| Computers & Mathematics | 202 | 6.5% |
| Bio, Nature & Agricultural | 202 | 6.5% |
| Physical & Health Sciences | 87 | 2.8% |
| Psychology | 164 | 5.3% |
| Social Sciences | 129 | 4.2% |
| Engineering | 567 | 18.4% |
| Multidisciplinary Studies | 65 | 2.1% |
| Science & Technology | 315 | 10.2% |
| Business | 507 | 16.4% |
| Education | 162 | 5.2% |
| Literature & Languages | 163 | 5.3% |
| Liberal Arts & History | 117 | 3.8% |
| Visual & Performing Arts | 205 | 6.6% |
| Communications | 140 | 4.5% |
| Arts & Humanities | 64 | 2.1% |
| Total | 3,089 | 100.0% |
Transportation & Commute in Alderwood Manor
Vehicle Availability by Sex in Alderwood Manor
The most prevalent vehicle ownership categories in Alderwood Manor are males with 2 vehicles (981, accounting for 33.5%) and females with 2 vehicles (925, making up 40.9%).
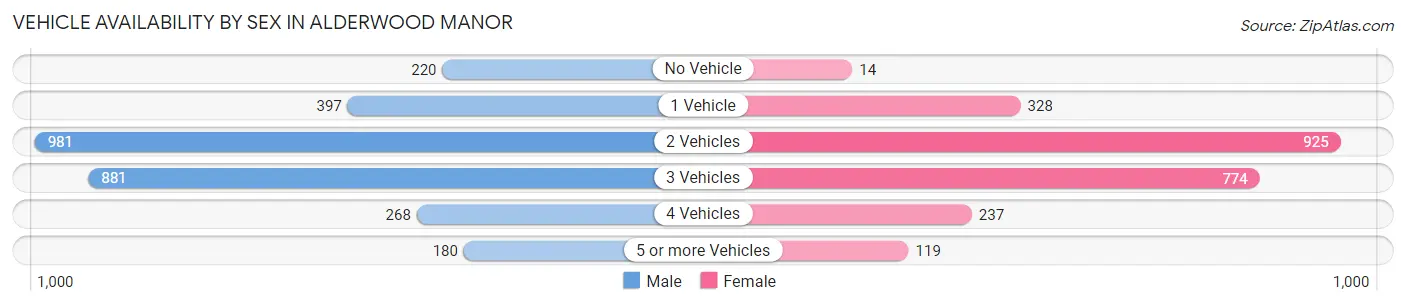
| Vehicles Available | Male | Female |
| No Vehicle | 220 (7.5%) | 14 (0.6%) |
| 1 Vehicle | 397 (13.6%) | 328 (13.7%) |
| 2 Vehicles | 981 (33.5%) | 925 (38.6%) |
| 3 Vehicles | 881 (30.1%) | 774 (32.3%) |
| 4 Vehicles | 268 (9.2%) | 237 (9.9%) |
| 5 or more Vehicles | 180 (6.1%) | 119 (5.0%) |
| Total | 2,927 (100.0%) | 2,397 (100.0%) |
Commute Time in Alderwood Manor
The most frequently occuring commute durations in Alderwood Manor are 20 to 24 minutes (575 commuters, 14.1%), 45 to 59 minutes (541 commuters, 13.2%), and 60 to 89 minutes (500 commuters, 12.2%).
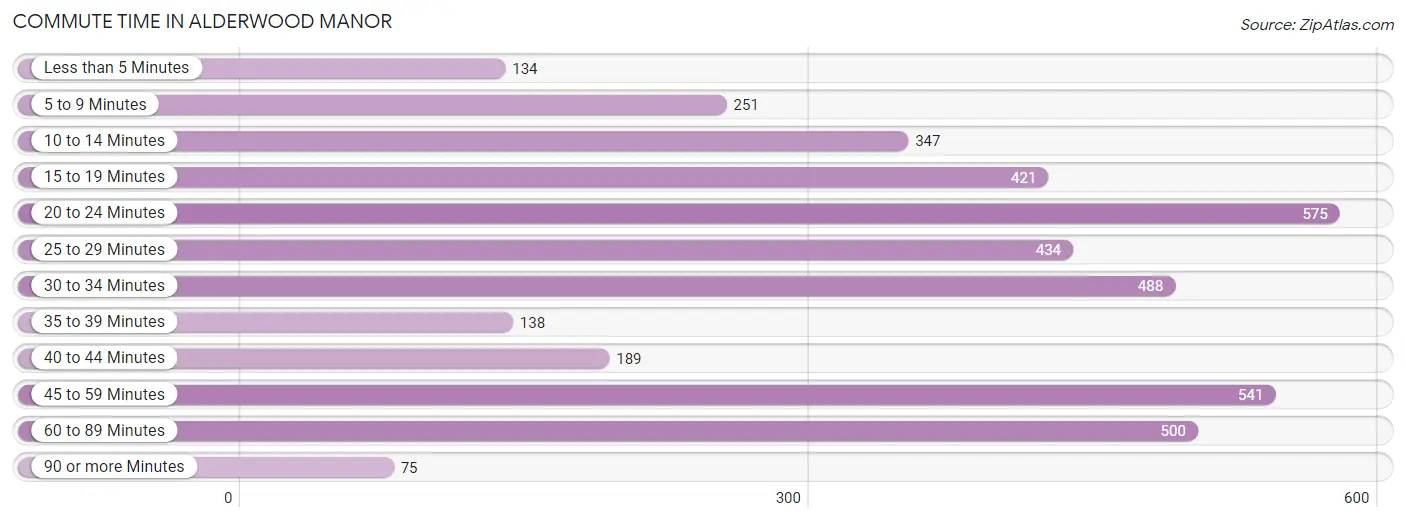
| Commute Time | # Commuters | % Commuters |
| Less than 5 Minutes | 134 | 3.3% |
| 5 to 9 Minutes | 251 | 6.1% |
| 10 to 14 Minutes | 347 | 8.5% |
| 15 to 19 Minutes | 421 | 10.3% |
| 20 to 24 Minutes | 575 | 14.1% |
| 25 to 29 Minutes | 434 | 10.6% |
| 30 to 34 Minutes | 488 | 11.9% |
| 35 to 39 Minutes | 138 | 3.4% |
| 40 to 44 Minutes | 189 | 4.6% |
| 45 to 59 Minutes | 541 | 13.2% |
| 60 to 89 Minutes | 500 | 12.2% |
| 90 or more Minutes | 75 | 1.8% |
Commute Time by Sex in Alderwood Manor
The most common commute times in Alderwood Manor are 45 to 59 minutes (390 commuters, 16.8%) for males and 25 to 29 minutes (264 commuters, 14.9%) for females.
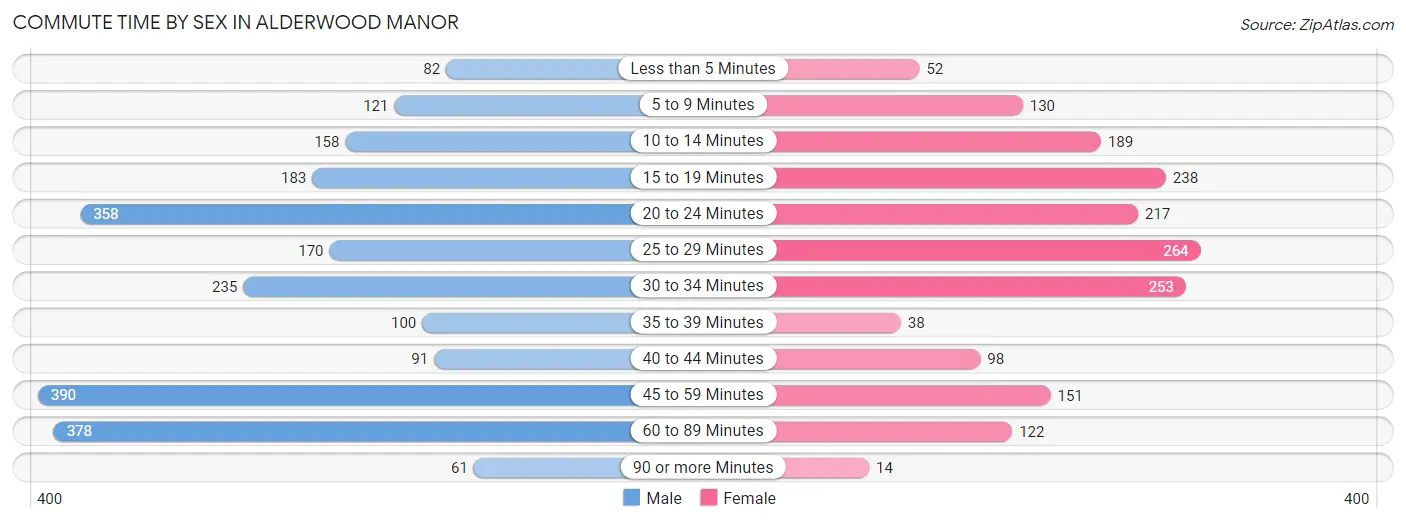
| Commute Time | Male | Female |
| Less than 5 Minutes | 82 (3.5%) | 52 (2.9%) |
| 5 to 9 Minutes | 121 (5.2%) | 130 (7.4%) |
| 10 to 14 Minutes | 158 (6.8%) | 189 (10.7%) |
| 15 to 19 Minutes | 183 (7.9%) | 238 (13.5%) |
| 20 to 24 Minutes | 358 (15.4%) | 217 (12.3%) |
| 25 to 29 Minutes | 170 (7.3%) | 264 (14.9%) |
| 30 to 34 Minutes | 235 (10.1%) | 253 (14.3%) |
| 35 to 39 Minutes | 100 (4.3%) | 38 (2.1%) |
| 40 to 44 Minutes | 91 (3.9%) | 98 (5.6%) |
| 45 to 59 Minutes | 390 (16.8%) | 151 (8.6%) |
| 60 to 89 Minutes | 378 (16.2%) | 122 (6.9%) |
| 90 or more Minutes | 61 (2.6%) | 14 (0.8%) |
Time of Departure to Work by Sex in Alderwood Manor
The most frequent times of departure to work in Alderwood Manor are 7:00 AM to 7:29 AM (674, 29.0%) for males and 8:00 AM to 8:29 AM (219, 12.4%) for females.
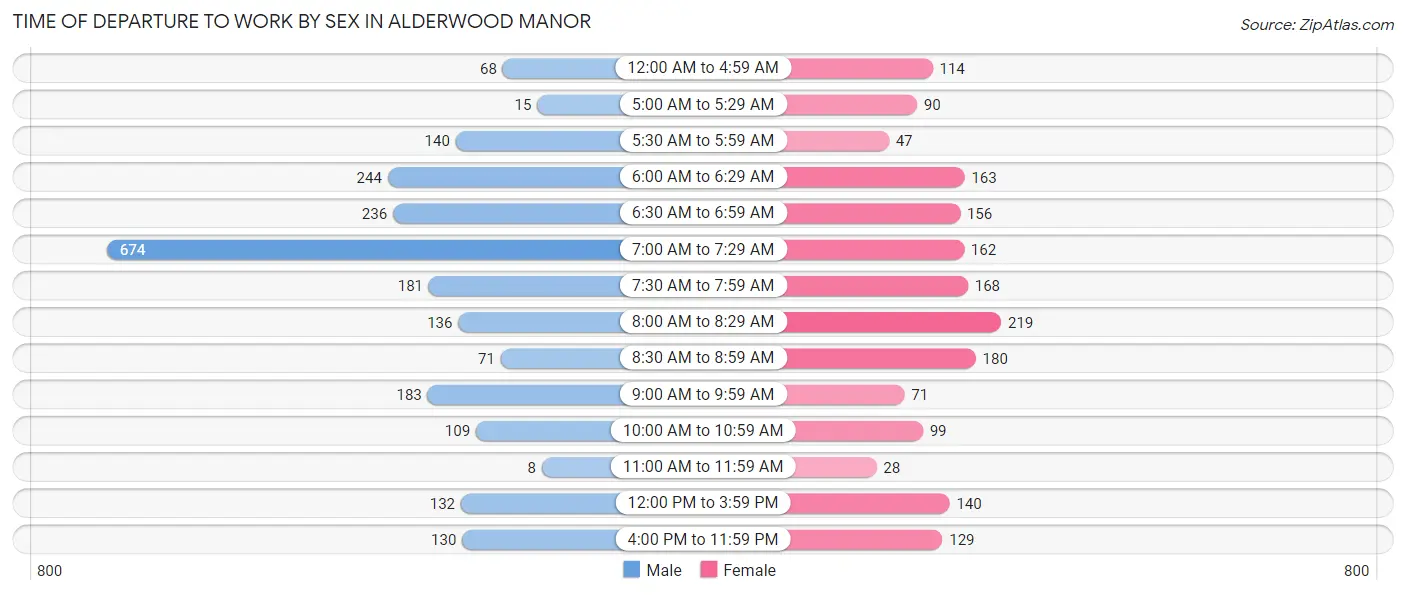
| Time of Departure | Male | Female |
| 12:00 AM to 4:59 AM | 68 (2.9%) | 114 (6.5%) |
| 5:00 AM to 5:29 AM | 15 (0.6%) | 90 (5.1%) |
| 5:30 AM to 5:59 AM | 140 (6.0%) | 47 (2.7%) |
| 6:00 AM to 6:29 AM | 244 (10.5%) | 163 (9.2%) |
| 6:30 AM to 6:59 AM | 236 (10.1%) | 156 (8.8%) |
| 7:00 AM to 7:29 AM | 674 (29.0%) | 162 (9.2%) |
| 7:30 AM to 7:59 AM | 181 (7.8%) | 168 (9.5%) |
| 8:00 AM to 8:29 AM | 136 (5.8%) | 219 (12.4%) |
| 8:30 AM to 8:59 AM | 71 (3.0%) | 180 (10.2%) |
| 9:00 AM to 9:59 AM | 183 (7.9%) | 71 (4.0%) |
| 10:00 AM to 10:59 AM | 109 (4.7%) | 99 (5.6%) |
| 11:00 AM to 11:59 AM | 8 (0.3%) | 28 (1.6%) |
| 12:00 PM to 3:59 PM | 132 (5.7%) | 140 (7.9%) |
| 4:00 PM to 11:59 PM | 130 (5.6%) | 129 (7.3%) |
| Total | 2,327 (100.0%) | 1,766 (100.0%) |
Housing Occupancy in Alderwood Manor
Occupancy by Ownership in Alderwood Manor
Of the total 3,505 dwellings in Alderwood Manor, owner-occupied units account for 2,422 (69.1%), while renter-occupied units make up 1,083 (30.9%).
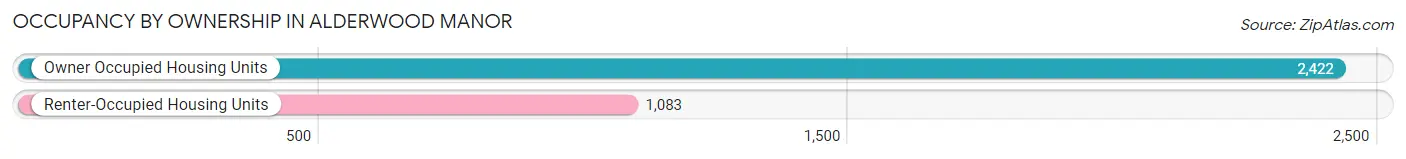
| Occupancy | # Housing Units | % Housing Units |
| Owner Occupied Housing Units | 2,422 | 69.1% |
| Renter-Occupied Housing Units | 1,083 | 30.9% |
| Total Occupied Housing Units | 3,505 | 100.0% |
Occupancy by Household Size in Alderwood Manor
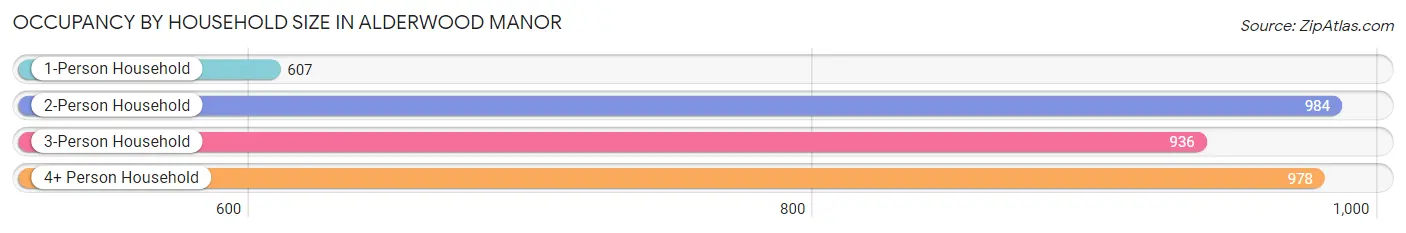
| Household Size | # Housing Units | % Housing Units |
| 1-Person Household | 607 | 17.3% |
| 2-Person Household | 984 | 28.1% |
| 3-Person Household | 936 | 26.7% |
| 4+ Person Household | 978 | 27.9% |
| Total Housing Units | 3,505 | 100.0% |
Occupancy by Ownership by Household Size in Alderwood Manor
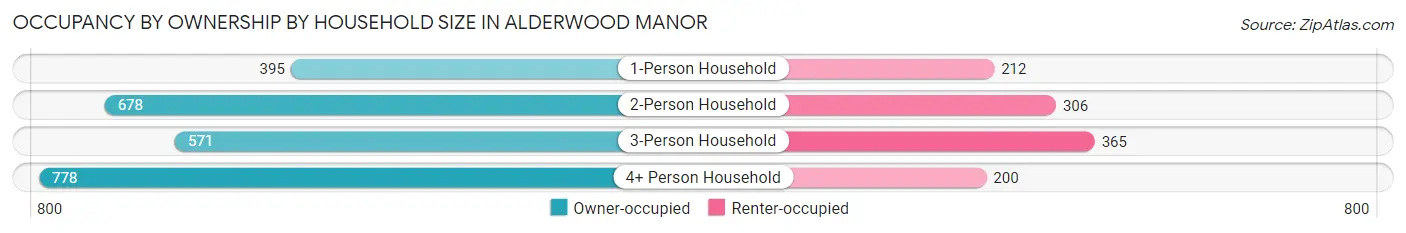
| Household Size | Owner-occupied | Renter-occupied |
| 1-Person Household | 395 (65.1%) | 212 (34.9%) |
| 2-Person Household | 678 (68.9%) | 306 (31.1%) |
| 3-Person Household | 571 (61.0%) | 365 (39.0%) |
| 4+ Person Household | 778 (79.5%) | 200 (20.4%) |
| Total Housing Units | 2,422 (69.1%) | 1,083 (30.9%) |
Occupancy by Educational Attainment in Alderwood Manor
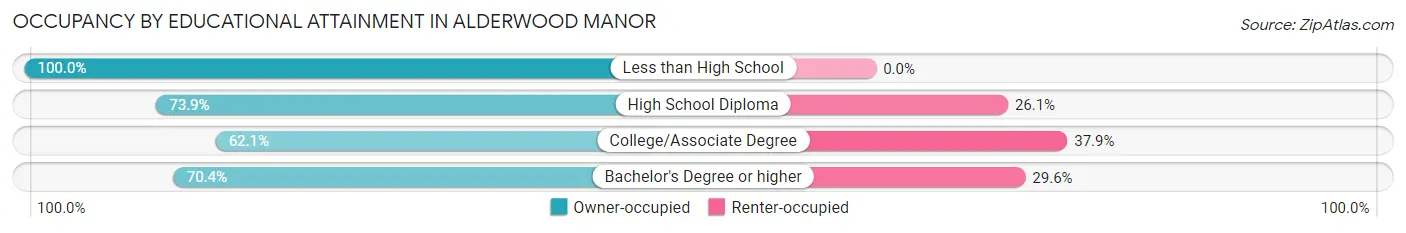
| Household Size | Owner-occupied | Renter-occupied |
| Less than High School | 110 (100.0%) | 0 (0.0%) |
| High School Diploma | 424 (73.9%) | 150 (26.1%) |
| College/Associate Degree | 734 (62.1%) | 448 (37.9%) |
| Bachelor's Degree or higher | 1,154 (70.4%) | 485 (29.6%) |
Occupancy by Age of Householder in Alderwood Manor
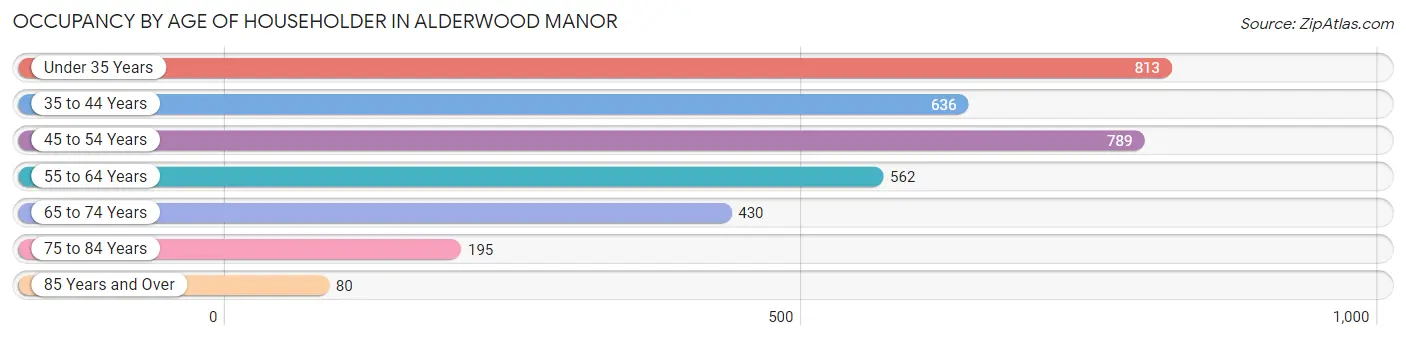
| Age Bracket | # Households | % Households |
| Under 35 Years | 813 | 23.2% |
| 35 to 44 Years | 636 | 18.1% |
| 45 to 54 Years | 789 | 22.5% |
| 55 to 64 Years | 562 | 16.0% |
| 65 to 74 Years | 430 | 12.3% |
| 75 to 84 Years | 195 | 5.6% |
| 85 Years and Over | 80 | 2.3% |
| Total | 3,505 | 100.0% |
Housing Finances in Alderwood Manor
Median Income by Occupancy in Alderwood Manor
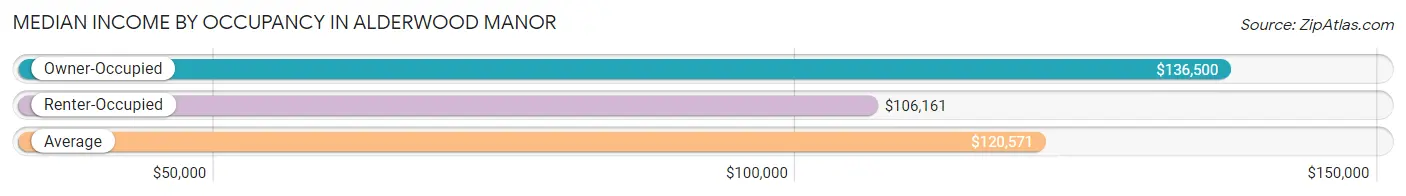
| Occupancy Type | # Households | Median Income |
| Owner-Occupied | 2,422 (69.1%) | $136,500 |
| Renter-Occupied | 1,083 (30.9%) | $106,161 |
| Average | 3,505 (100.0%) | $120,571 |
Occupancy by Householder Income Bracket in Alderwood Manor
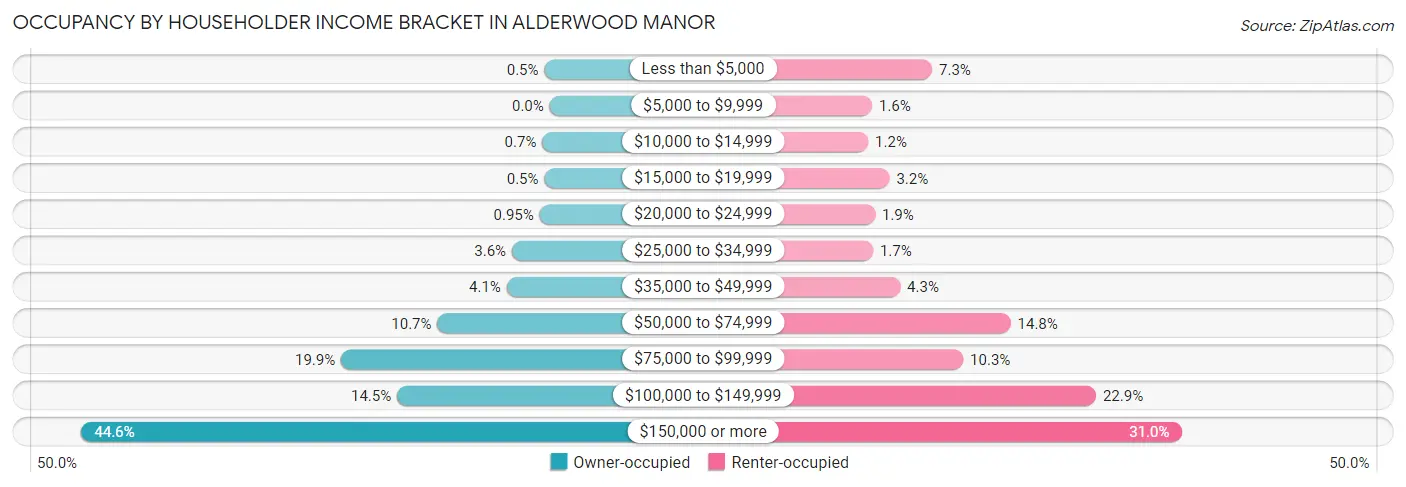
| Income Bracket | Owner-occupied | Renter-occupied |
| Less than $5,000 | 12 (0.5%) | 79 (7.3%) |
| $5,000 to $9,999 | 0 (0.0%) | 17 (1.6%) |
| $10,000 to $14,999 | 17 (0.7%) | 13 (1.2%) |
| $15,000 to $19,999 | 12 (0.5%) | 35 (3.2%) |
| $20,000 to $24,999 | 23 (0.9%) | 20 (1.8%) |
| $25,000 to $34,999 | 87 (3.6%) | 18 (1.7%) |
| $35,000 to $49,999 | 99 (4.1%) | 46 (4.3%) |
| $50,000 to $74,999 | 259 (10.7%) | 160 (14.8%) |
| $75,000 to $99,999 | 481 (19.9%) | 111 (10.2%) |
| $100,000 to $149,999 | 352 (14.5%) | 248 (22.9%) |
| $150,000 or more | 1,080 (44.6%) | 336 (31.0%) |
| Total | 2,422 (100.0%) | 1,083 (100.0%) |
Monthly Housing Cost Tiers in Alderwood Manor
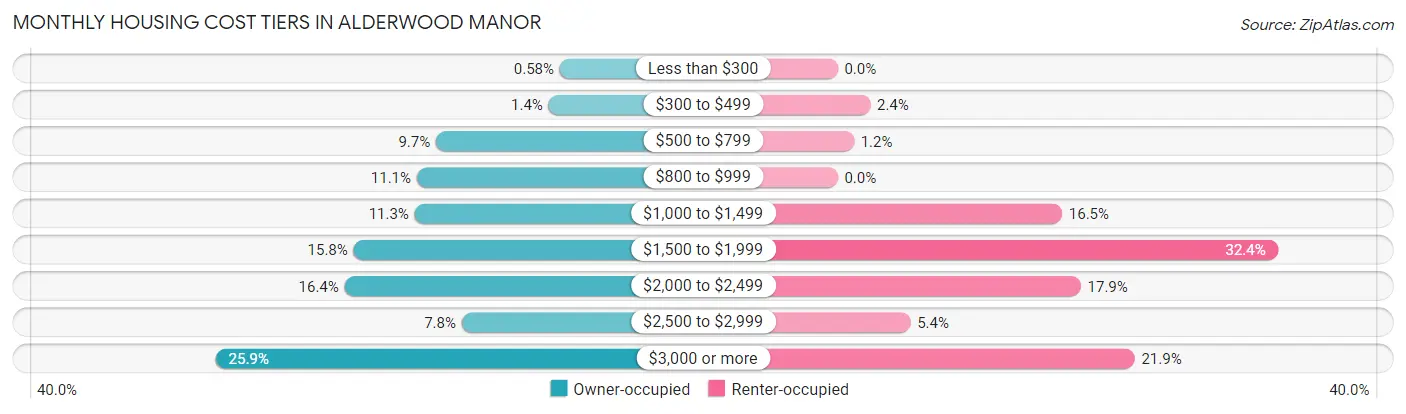
| Monthly Cost | Owner-occupied | Renter-occupied |
| Less than $300 | 14 (0.6%) | 0 (0.0%) |
| $300 to $499 | 34 (1.4%) | 26 (2.4%) |
| $500 to $799 | 235 (9.7%) | 13 (1.2%) |
| $800 to $999 | 269 (11.1%) | 0 (0.0%) |
| $1,000 to $1,499 | 273 (11.3%) | 179 (16.5%) |
| $1,500 to $1,999 | 382 (15.8%) | 351 (32.4%) |
| $2,000 to $2,499 | 398 (16.4%) | 194 (17.9%) |
| $2,500 to $2,999 | 189 (7.8%) | 58 (5.4%) |
| $3,000 or more | 628 (25.9%) | 237 (21.9%) |
| Total | 2,422 (100.0%) | 1,083 (100.0%) |
Physical Housing Characteristics in Alderwood Manor
Housing Structures in Alderwood Manor
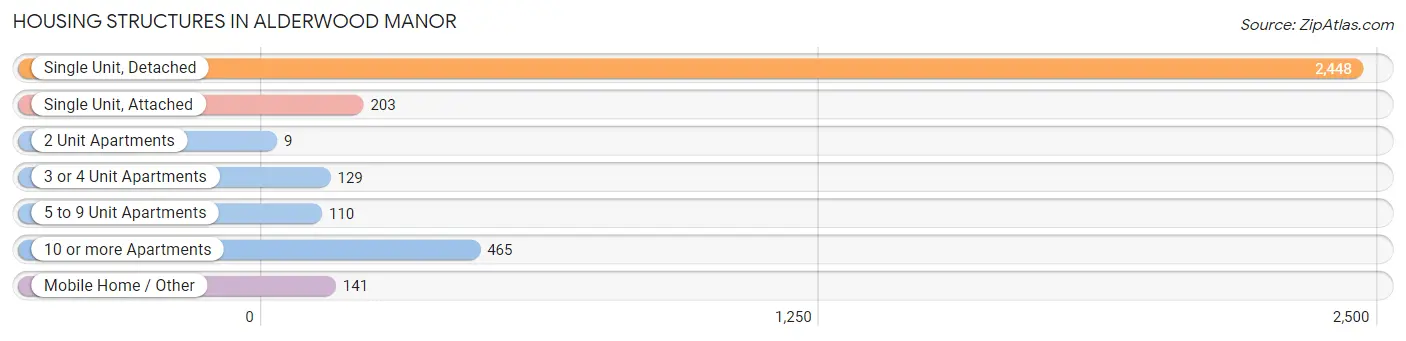
| Structure Type | # Housing Units | % Housing Units |
| Single Unit, Detached | 2,448 | 69.8% |
| Single Unit, Attached | 203 | 5.8% |
| 2 Unit Apartments | 9 | 0.3% |
| 3 or 4 Unit Apartments | 129 | 3.7% |
| 5 to 9 Unit Apartments | 110 | 3.1% |
| 10 or more Apartments | 465 | 13.3% |
| Mobile Home / Other | 141 | 4.0% |
| Total | 3,505 | 100.0% |
Housing Structures by Occupancy in Alderwood Manor
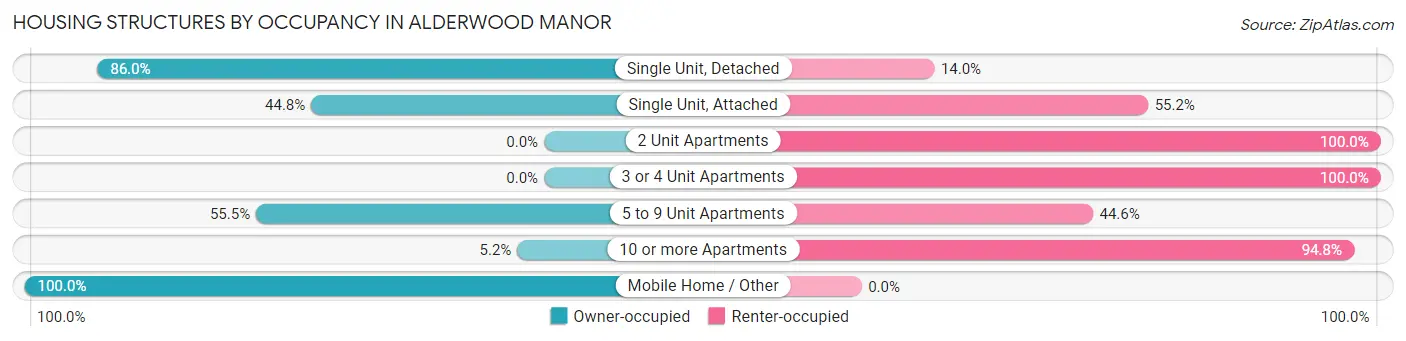
| Structure Type | Owner-occupied | Renter-occupied |
| Single Unit, Detached | 2,105 (86.0%) | 343 (14.0%) |
| Single Unit, Attached | 91 (44.8%) | 112 (55.2%) |
| 2 Unit Apartments | 0 (0.0%) | 9 (100.0%) |
| 3 or 4 Unit Apartments | 0 (0.0%) | 129 (100.0%) |
| 5 to 9 Unit Apartments | 61 (55.4%) | 49 (44.6%) |
| 10 or more Apartments | 24 (5.2%) | 441 (94.8%) |
| Mobile Home / Other | 141 (100.0%) | 0 (0.0%) |
| Total | 2,422 (69.1%) | 1,083 (30.9%) |
Housing Structures by Number of Rooms in Alderwood Manor
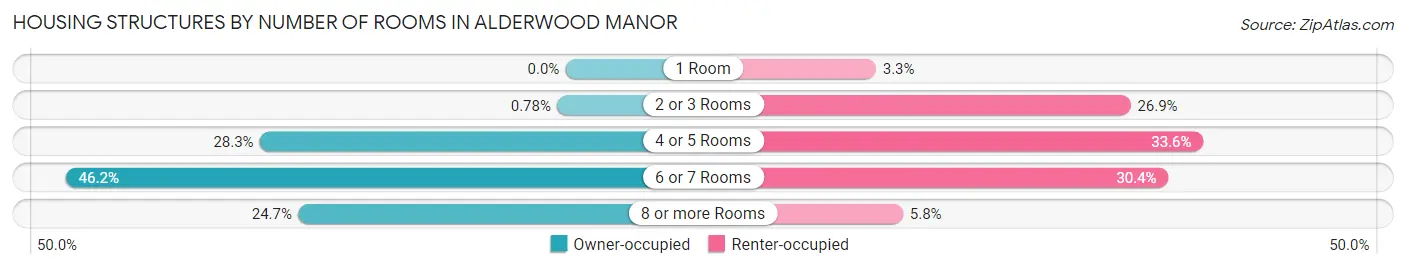
| Number of Rooms | Owner-occupied | Renter-occupied |
| 1 Room | 0 (0.0%) | 36 (3.3%) |
| 2 or 3 Rooms | 19 (0.8%) | 291 (26.9%) |
| 4 or 5 Rooms | 685 (28.3%) | 364 (33.6%) |
| 6 or 7 Rooms | 1,119 (46.2%) | 329 (30.4%) |
| 8 or more Rooms | 599 (24.7%) | 63 (5.8%) |
| Total | 2,422 (100.0%) | 1,083 (100.0%) |
Housing Structure by Heating Type in Alderwood Manor
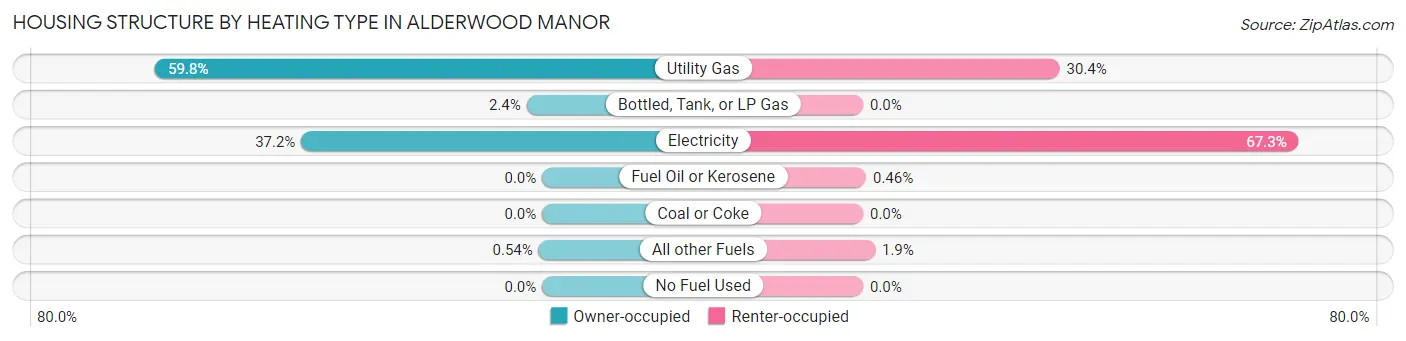
| Heating Type | Owner-occupied | Renter-occupied |
| Utility Gas | 1,449 (59.8%) | 329 (30.4%) |
| Bottled, Tank, or LP Gas | 58 (2.4%) | 0 (0.0%) |
| Electricity | 902 (37.2%) | 729 (67.3%) |
| Fuel Oil or Kerosene | 0 (0.0%) | 5 (0.5%) |
| Coal or Coke | 0 (0.0%) | 0 (0.0%) |
| All other Fuels | 13 (0.5%) | 20 (1.8%) |
| No Fuel Used | 0 (0.0%) | 0 (0.0%) |
| Total | 2,422 (100.0%) | 1,083 (100.0%) |
Household Vehicle Usage in Alderwood Manor
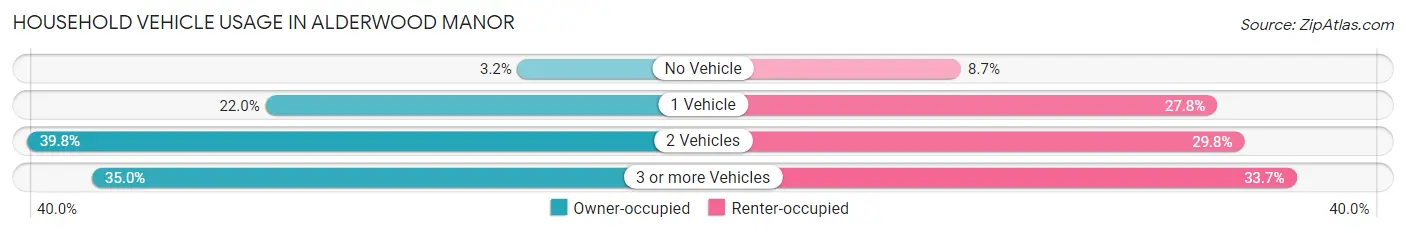
| Vehicles per Household | Owner-occupied | Renter-occupied |
| No Vehicle | 77 (3.2%) | 94 (8.7%) |
| 1 Vehicle | 533 (22.0%) | 301 (27.8%) |
| 2 Vehicles | 965 (39.8%) | 323 (29.8%) |
| 3 or more Vehicles | 847 (35.0%) | 365 (33.7%) |
| Total | 2,422 (100.0%) | 1,083 (100.0%) |
Real Estate & Mortgages in Alderwood Manor
Real Estate and Mortgage Overview in Alderwood Manor
| Characteristic | Without Mortgage | With Mortgage |
| Housing Units | 719 | 1,703 |
| Median Property Value | $568,800 | $643,100 |
| Median Household Income | $98,472 | $782 |
| Monthly Housing Costs | $854 | $628 |
| Real Estate Taxes | $5,012 | $10 |
Property Value by Mortgage Status in Alderwood Manor
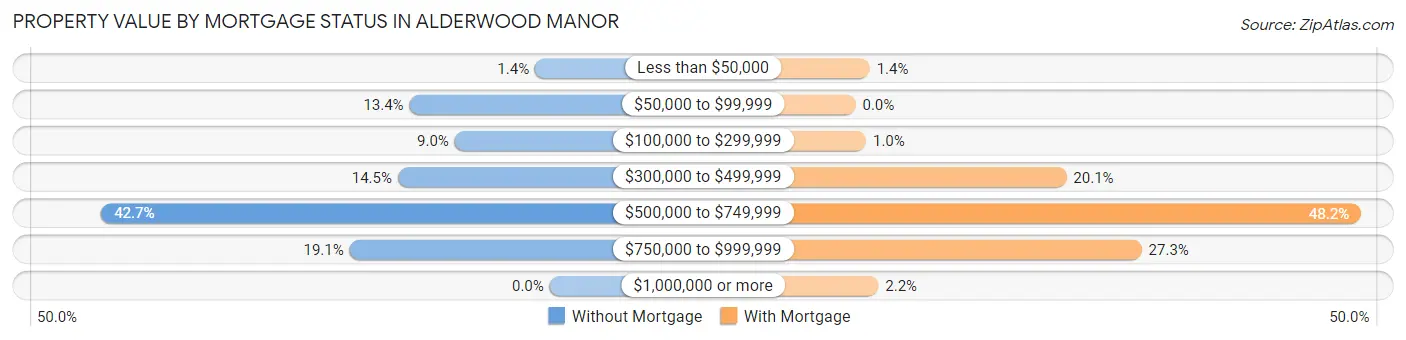
| Property Value | Without Mortgage | With Mortgage |
| Less than $50,000 | 10 (1.4%) | 23 (1.3%) |
| $50,000 to $99,999 | 96 (13.4%) | 0 (0.0%) |
| $100,000 to $299,999 | 65 (9.0%) | 17 (1.0%) |
| $300,000 to $499,999 | 104 (14.5%) | 342 (20.1%) |
| $500,000 to $749,999 | 307 (42.7%) | 820 (48.1%) |
| $750,000 to $999,999 | 137 (19.1%) | 464 (27.3%) |
| $1,000,000 or more | 0 (0.0%) | 37 (2.2%) |
| Total | 719 (100.0%) | 1,703 (100.0%) |
Household Income by Mortgage Status in Alderwood Manor
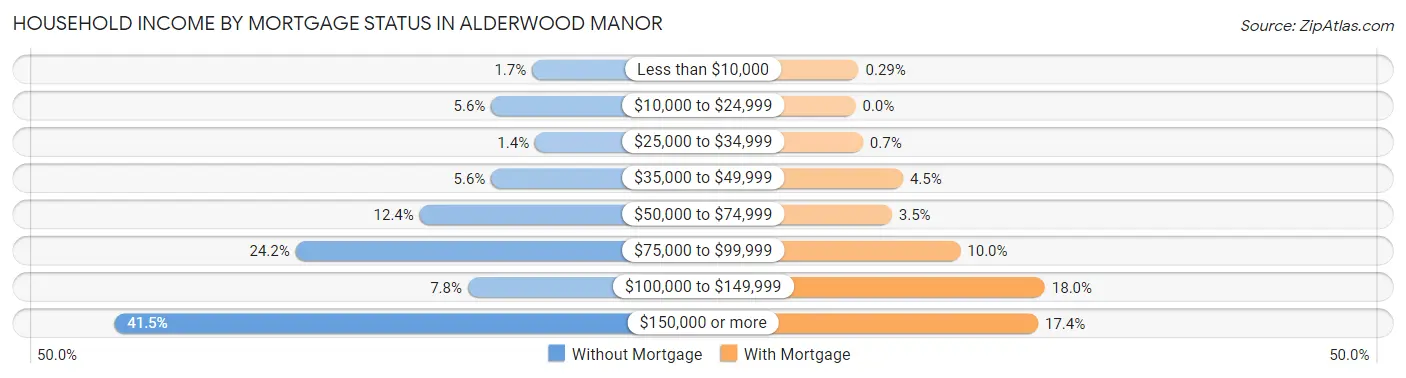
| Household Income | Without Mortgage | With Mortgage |
| Less than $10,000 | 12 (1.7%) | 5 (0.3%) |
| $10,000 to $24,999 | 40 (5.6%) | 0 (0.0%) |
| $25,000 to $34,999 | 10 (1.4%) | 12 (0.7%) |
| $35,000 to $49,999 | 40 (5.6%) | 77 (4.5%) |
| $50,000 to $74,999 | 89 (12.4%) | 59 (3.5%) |
| $75,000 to $99,999 | 174 (24.2%) | 170 (10.0%) |
| $100,000 to $149,999 | 56 (7.8%) | 307 (18.0%) |
| $150,000 or more | 298 (41.4%) | 296 (17.4%) |
| Total | 719 (100.0%) | 1,703 (100.0%) |
Property Value to Household Income Ratio in Alderwood Manor
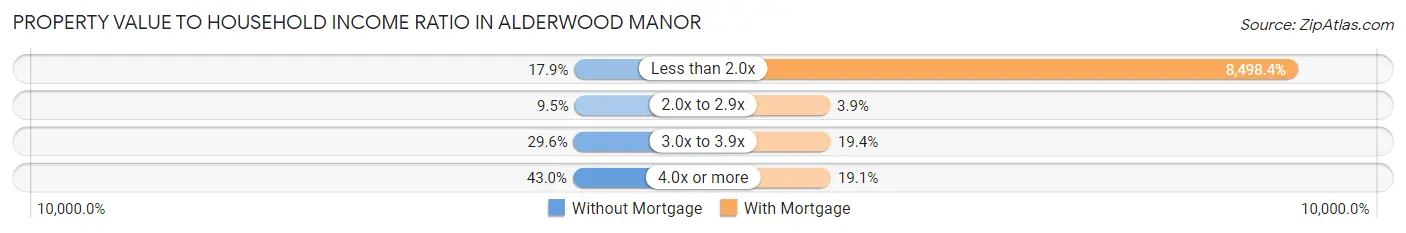
| Value-to-Income Ratio | Without Mortgage | With Mortgage |
| Less than 2.0x | 129 (17.9%) | 144,728 (8,498.4%) |
| 2.0x to 2.9x | 68 (9.5%) | 67 (3.9%) |
| 3.0x to 3.9x | 213 (29.6%) | 330 (19.4%) |
| 4.0x or more | 309 (43.0%) | 326 (19.1%) |
| Total | 719 (100.0%) | 1,703 (100.0%) |
Real Estate Taxes by Mortgage Status in Alderwood Manor
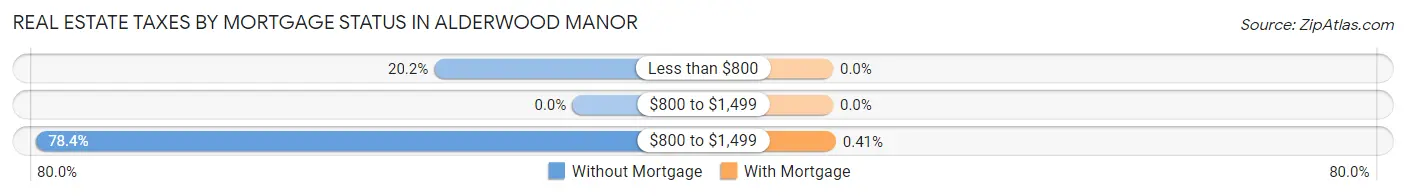
| Property Taxes | Without Mortgage | With Mortgage |
| Less than $800 | 145 (20.2%) | 0 (0.0%) |
| $800 to $1,499 | 0 (0.0%) | 0 (0.0%) |
| $800 to $1,499 | 564 (78.4%) | 7 (0.4%) |
| Total | 719 (100.0%) | 1,703 (100.0%) |
Health & Disability in Alderwood Manor
Health Insurance Coverage by Age in Alderwood Manor
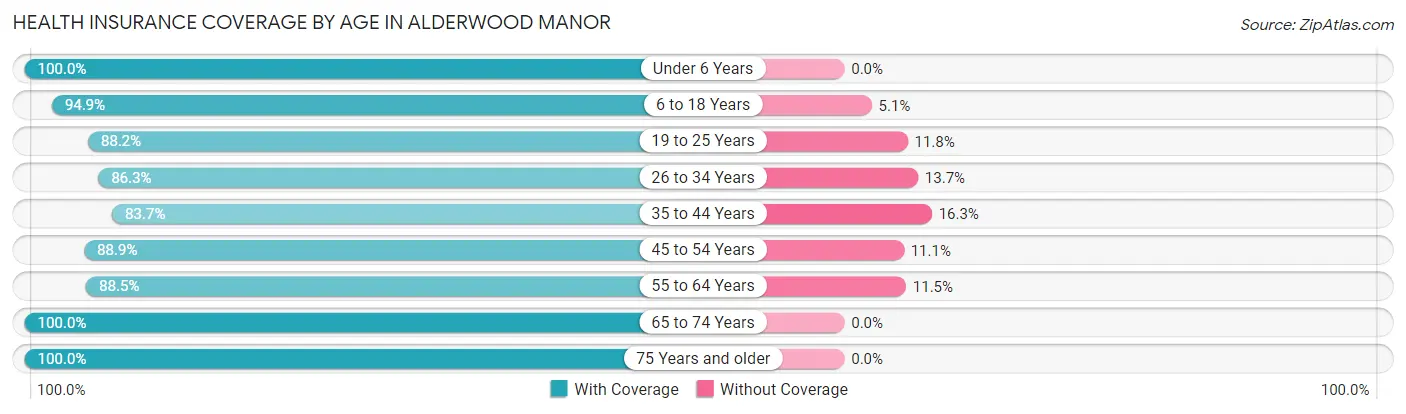
| Age Bracket | With Coverage | Without Coverage |
| Under 6 Years | 1,006 (100.0%) | 0 (0.0%) |
| 6 to 18 Years | 1,213 (94.9%) | 65 (5.1%) |
| 19 to 25 Years | 897 (88.2%) | 120 (11.8%) |
| 26 to 34 Years | 1,445 (86.3%) | 230 (13.7%) |
| 35 to 44 Years | 1,166 (83.7%) | 227 (16.3%) |
| 45 to 54 Years | 1,661 (88.9%) | 207 (11.1%) |
| 55 to 64 Years | 1,033 (88.5%) | 134 (11.5%) |
| 65 to 74 Years | 643 (100.0%) | 0 (0.0%) |
| 75 Years and older | 478 (100.0%) | 0 (0.0%) |
| Total | 9,542 (90.7%) | 983 (9.3%) |
Health Insurance Coverage by Citizenship Status in Alderwood Manor
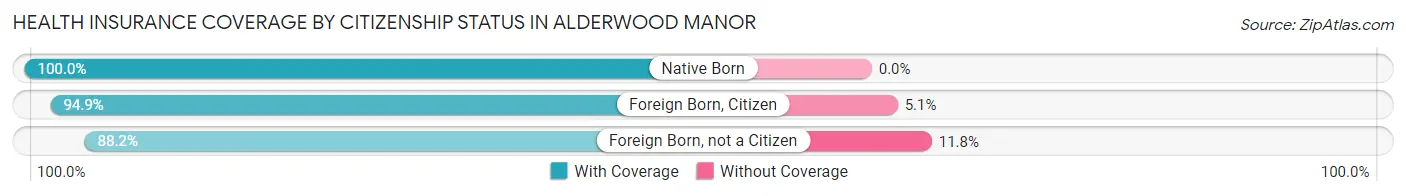
| Citizenship Status | With Coverage | Without Coverage |
| Native Born | 1,006 (100.0%) | 0 (0.0%) |
| Foreign Born, Citizen | 1,213 (94.9%) | 65 (5.1%) |
| Foreign Born, not a Citizen | 897 (88.2%) | 120 (11.8%) |
Health Insurance Coverage by Household Income in Alderwood Manor
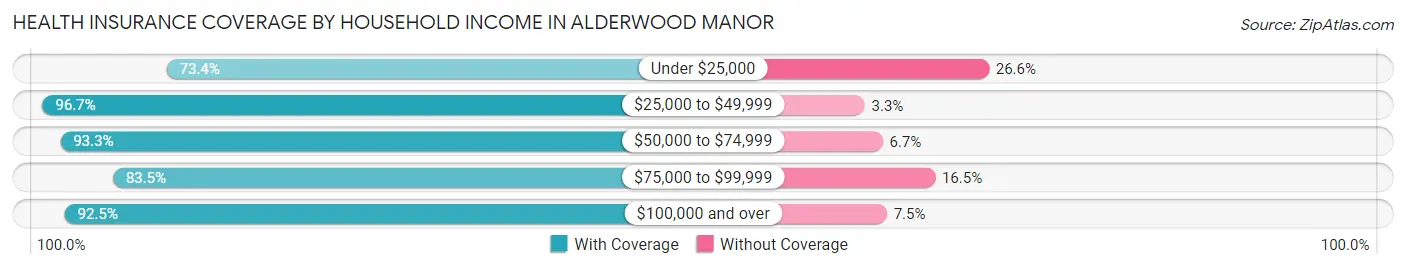
| Household Income | With Coverage | Without Coverage |
| Under $25,000 | 218 (73.4%) | 79 (26.6%) |
| $25,000 to $49,999 | 841 (96.7%) | 29 (3.3%) |
| $50,000 to $74,999 | 908 (93.3%) | 65 (6.7%) |
| $75,000 to $99,999 | 1,733 (83.5%) | 343 (16.5%) |
| $100,000 and over | 5,777 (92.5%) | 467 (7.5%) |
Public vs Private Health Insurance Coverage by Age in Alderwood Manor
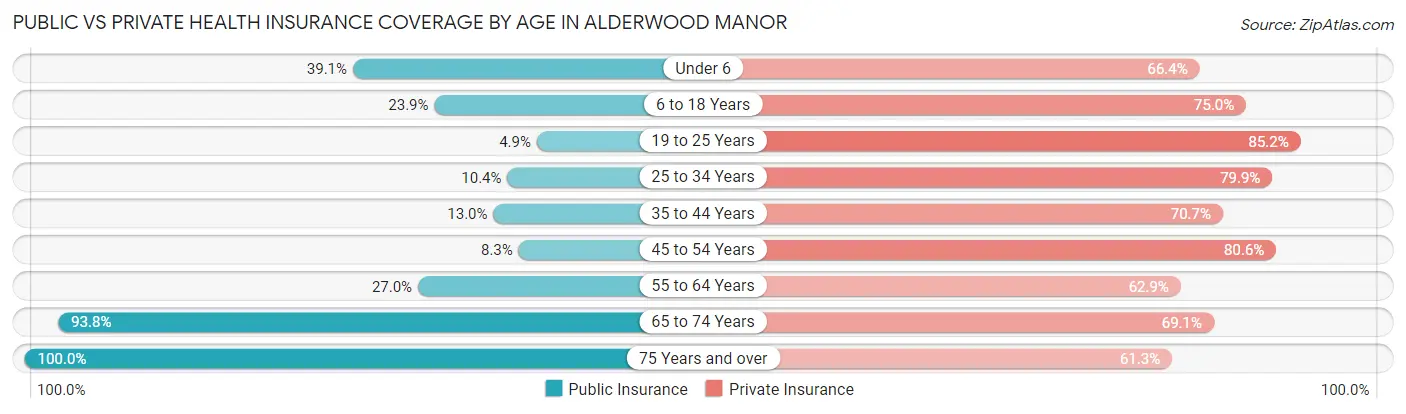
| Age Bracket | Public Insurance | Private Insurance |
| Under 6 | 393 (39.1%) | 668 (66.4%) |
| 6 to 18 Years | 306 (23.9%) | 959 (75.0%) |
| 19 to 25 Years | 50 (4.9%) | 866 (85.2%) |
| 25 to 34 Years | 174 (10.4%) | 1,338 (79.9%) |
| 35 to 44 Years | 181 (13.0%) | 985 (70.7%) |
| 45 to 54 Years | 155 (8.3%) | 1,506 (80.6%) |
| 55 to 64 Years | 315 (27.0%) | 734 (62.9%) |
| 65 to 74 Years | 603 (93.8%) | 444 (69.1%) |
| 75 Years and over | 478 (100.0%) | 293 (61.3%) |
| Total | 2,655 (25.2%) | 7,793 (74.0%) |
Disability Status by Sex by Age in Alderwood Manor
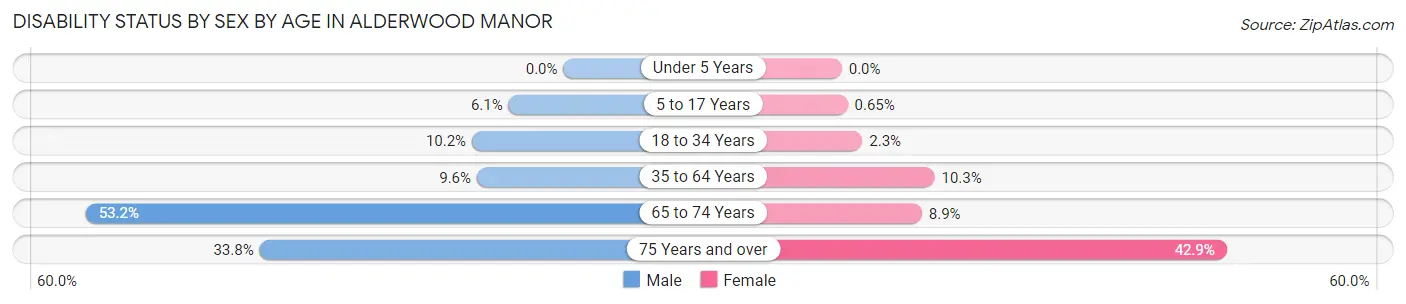
| Age Bracket | Male | Female |
| Under 5 Years | 0 (0.0%) | 0 (0.0%) |
| 5 to 17 Years | 31 (6.1%) | 5 (0.6%) |
| 18 to 34 Years | 141 (10.2%) | 33 (2.3%) |
| 35 to 64 Years | 242 (9.6%) | 198 (10.3%) |
| 65 to 74 Years | 175 (53.2%) | 28 (8.9%) |
| 75 Years and over | 67 (33.8%) | 120 (42.9%) |
Disability Class by Sex by Age in Alderwood Manor
Disability Class: Hearing Difficulty
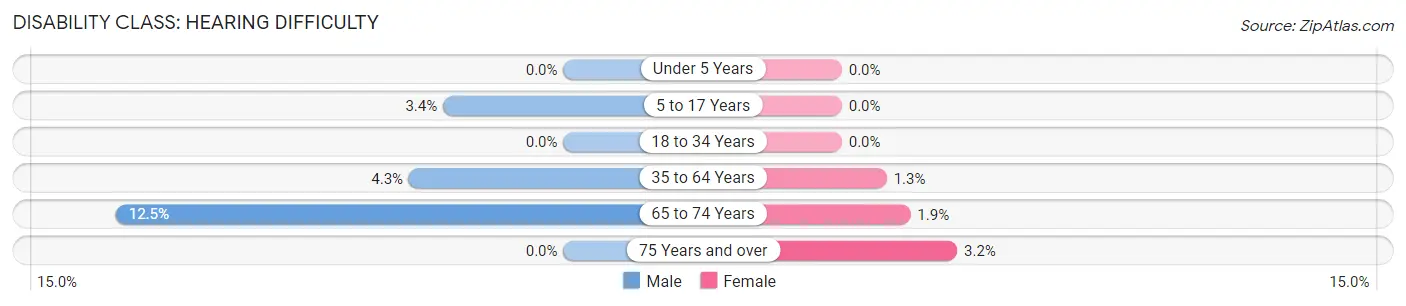
| Age Bracket | Male | Female |
| Under 5 Years | 0 (0.0%) | 0 (0.0%) |
| 5 to 17 Years | 17 (3.4%) | 0 (0.0%) |
| 18 to 34 Years | 0 (0.0%) | 0 (0.0%) |
| 35 to 64 Years | 108 (4.3%) | 24 (1.3%) |
| 65 to 74 Years | 41 (12.5%) | 6 (1.9%) |
| 75 Years and over | 0 (0.0%) | 9 (3.2%) |
Disability Class: Vision Difficulty
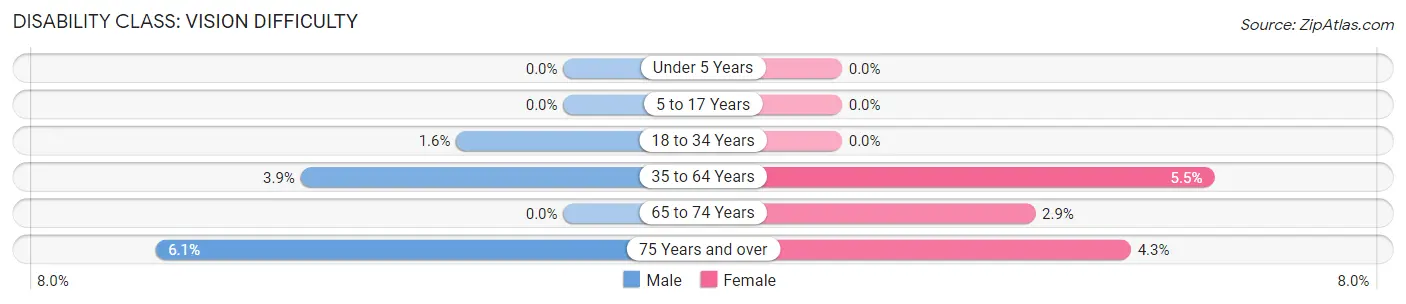
| Age Bracket | Male | Female |
| Under 5 Years | 0 (0.0%) | 0 (0.0%) |
| 5 to 17 Years | 0 (0.0%) | 0 (0.0%) |
| 18 to 34 Years | 22 (1.6%) | 0 (0.0%) |
| 35 to 64 Years | 98 (3.9%) | 106 (5.5%) |
| 65 to 74 Years | 0 (0.0%) | 9 (2.9%) |
| 75 Years and over | 12 (6.1%) | 12 (4.3%) |
Disability Class: Cognitive Difficulty
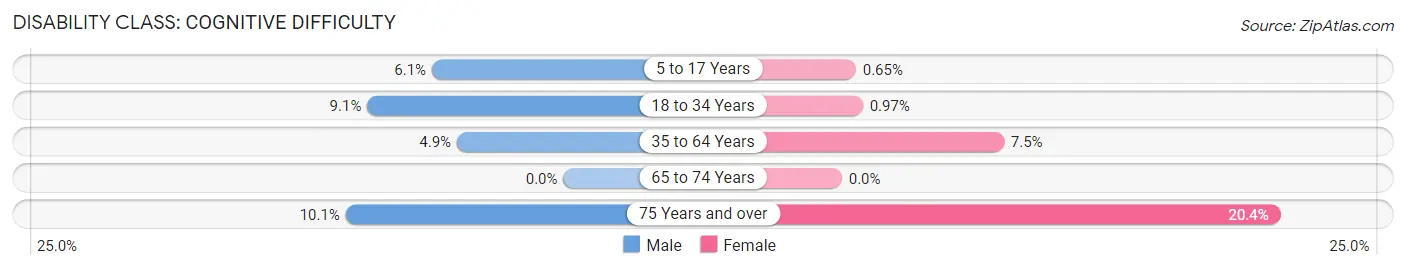
| Age Bracket | Male | Female |
| 5 to 17 Years | 31 (6.1%) | 5 (0.6%) |
| 18 to 34 Years | 126 (9.1%) | 14 (1.0%) |
| 35 to 64 Years | 124 (4.9%) | 144 (7.5%) |
| 65 to 74 Years | 0 (0.0%) | 0 (0.0%) |
| 75 Years and over | 20 (10.1%) | 57 (20.4%) |
Disability Class: Ambulatory Difficulty
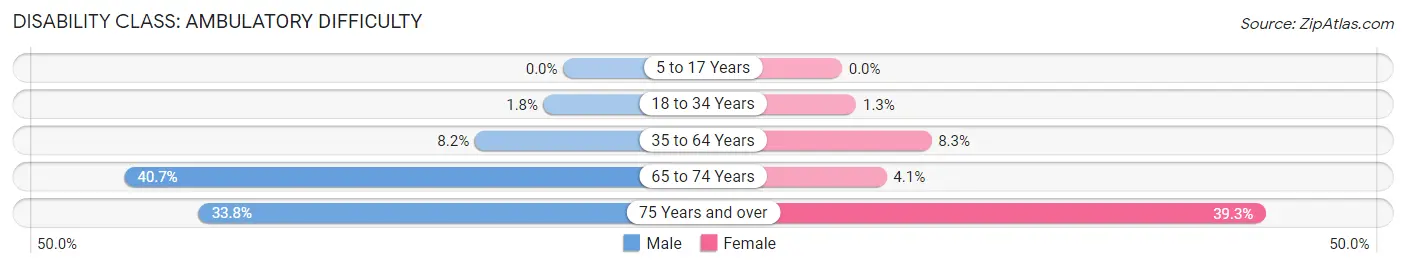
| Age Bracket | Male | Female |
| 5 to 17 Years | 0 (0.0%) | 0 (0.0%) |
| 18 to 34 Years | 25 (1.8%) | 19 (1.3%) |
| 35 to 64 Years | 206 (8.2%) | 159 (8.3%) |
| 65 to 74 Years | 134 (40.7%) | 13 (4.1%) |
| 75 Years and over | 67 (33.8%) | 110 (39.3%) |
Disability Class: Self-Care Difficulty
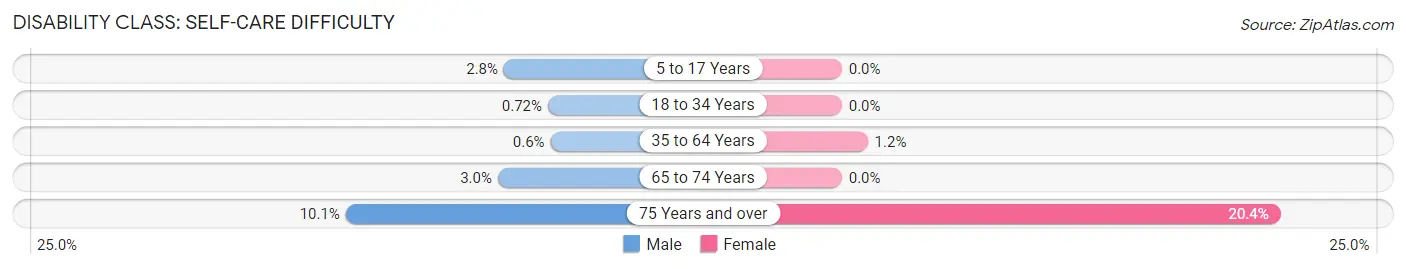
| Age Bracket | Male | Female |
| 5 to 17 Years | 14 (2.8%) | 0 (0.0%) |
| 18 to 34 Years | 10 (0.7%) | 0 (0.0%) |
| 35 to 64 Years | 15 (0.6%) | 23 (1.2%) |
| 65 to 74 Years | 10 (3.0%) | 0 (0.0%) |
| 75 Years and over | 20 (10.1%) | 57 (20.4%) |
Technology Access in Alderwood Manor
Computing Device Access in Alderwood Manor
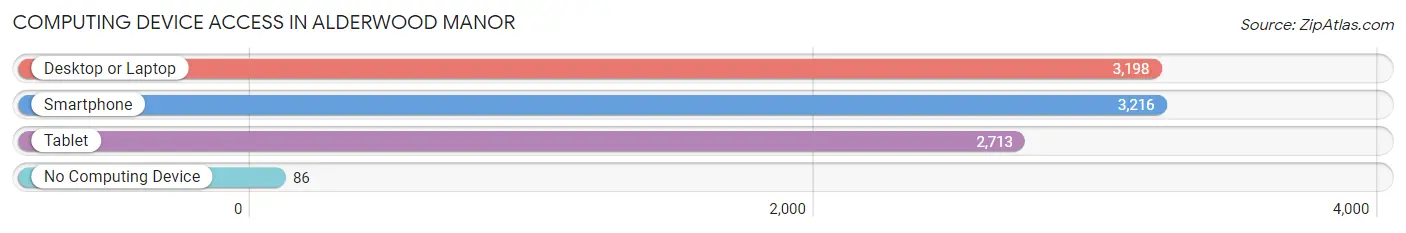
| Device Type | # Households | % Households |
| Desktop or Laptop | 3,198 | 91.2% |
| Smartphone | 3,216 | 91.7% |
| Tablet | 2,713 | 77.4% |
| No Computing Device | 86 | 2.5% |
| Total | 3,505 | 100.0% |
Internet Access in Alderwood Manor
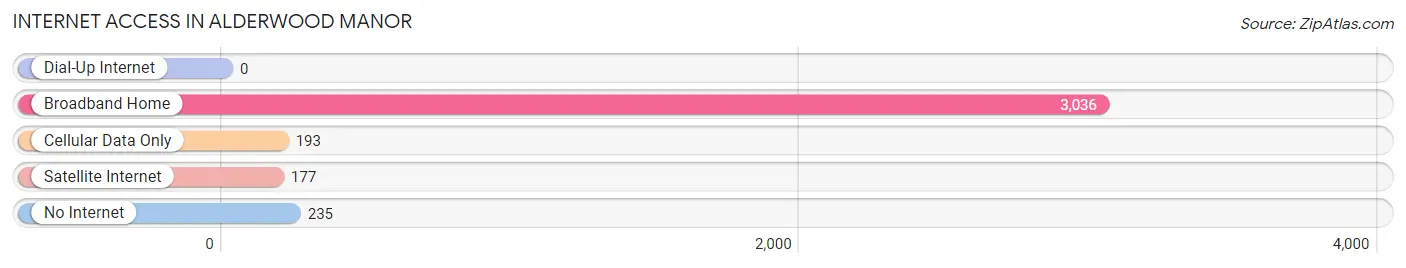
| Internet Type | # Households | % Households |
| Dial-Up Internet | 0 | 0.0% |
| Broadband Home | 3,036 | 86.6% |
| Cellular Data Only | 193 | 5.5% |
| Satellite Internet | 177 | 5.1% |
| No Internet | 235 | 6.7% |
| Total | 3,505 | 100.0% |
Alderwood Manor Summary
Alderwood Manor is a census-designated place (CDP) located in Snohomish County, Washington, United States. The population was 8,845 at the 2010 census.
History
Alderwood Manor was first settled in the late 1800s by homesteaders who were attracted to the area by its abundant timber resources. The area was originally known as Alderwood, and the name was changed to Alderwood Manor in the early 1900s. The name was chosen to reflect the rural, agricultural character of the area.
The area was primarily a farming community until the 1950s, when the population began to grow rapidly due to the influx of people from Seattle and other nearby cities. The population continued to grow throughout the 1960s and 1970s, and by the 1980s, Alderwood Manor had become a suburban community.
Geography
Alderwood Manor is located in Snohomish County, Washington, at 47°51'N 122°13'W (47.851, -122.213). It is bordered to the north by Lynnwood, to the east by Mill Creek, to the south by Bothell, and to the west by Lake Forest Park.
The CDP has a total area of 4 2 square miles 10 8 km2 all of it land
Economy
Alderwood Manor is primarily a residential community, but it does have a few businesses. The largest employer in the area is the Alderwood Mall, which is a large shopping center located in the center of the CDP. Other businesses in the area include restaurants, banks, and other retail stores.
Demographics
As of the 2010 census, there were 8,845 people, 3,541 households, and 2,541 families residing in the CDP. The population density was 2,097.3 people per square mile (808.7/km2). There were 3,717 housing units at an average density of 890.2 per square mile (344.2/km2). The racial makeup of the CDP was 79.2% White, 5.2% African American, 0.7% Native American, 8.2% Asian, 0.3% Pacific Islander, 2.7% from other races, and 3.7% from two or more races. Hispanic or Latino of any race were 6.7% of the population.
There were 3,541 households, out of which 33.2% had children under the age of 18 living with them, 57.2% were married couples living together, 9.7% had a female householder with no husband present, and 29.2% were non-families. 22.7% of all households were made up of individuals, and 6.2% had someone living alone who was 65 years of age or older. The average household size was 2.51 and the average family size was 2.97.
In the CDP, the population was spread out, with 24.2% under the age of 18, 7.2% from 18 to 24, 30.2% from 25 to 44, 27.2% from 45 to 64, and 11.2% who were 65 years of age or older. The median age was 38 years. For every 100 females, there were 94.2 males. For every 100 females age 18 and over, there were 91.3 males.
The median income for a household in the CDP was $63,917, and the median income for a family was $71,917. Males had a median income of $50,000 versus $37,500 for females. The per capita income for the CDP was $30,917. About 4.2% of families and 5.7% of the population were below the poverty line, including 6.7% of those under age 18 and 4.2% of those age 65 or over.
Common Questions
What is Per Capita Income in Alderwood Manor?
Per Capita income in Alderwood Manor is $47,801.
What is the Median Family Income in Alderwood Manor?
Median Family Income in Alderwood Manor is $126,937.
What is the Median Household income in Alderwood Manor?
Median Household Income in Alderwood Manor is $120,571.
What is Income or Wage Gap in Alderwood Manor?
Income or Wage Gap in Alderwood Manor is 23.7%.
Women in Alderwood Manor earn 76.3 cents for every dollar earned by a man.
What is Inequality or Gini Index in Alderwood Manor?
Inequality or Gini Index in Alderwood Manor is 0.36.
What is the Total Population of Alderwood Manor?
Total Population of Alderwood Manor is 10,525.
What is the Total Male Population of Alderwood Manor?
Total Male Population of Alderwood Manor is 5,207.
What is the Total Female Population of Alderwood Manor?
Total Female Population of Alderwood Manor is 5,318.
What is the Ratio of Males per 100 Females in Alderwood Manor?
There are 97.91 Males per 100 Females in Alderwood Manor.
What is the Ratio of Females per 100 Males in Alderwood Manor?
There are 102.13 Females per 100 Males in Alderwood Manor.
What is the Median Population Age in Alderwood Manor?
Median Population Age in Alderwood Manor is 36.3 Years.
What is the Average Family Size in Alderwood Manor
Average Family Size in Alderwood Manor is 3.4 People.
What is the Average Household Size in Alderwood Manor
Average Household Size in Alderwood Manor is 3.0 People.
How Large is the Labor Force in Alderwood Manor?
There are 5,765 People in the Labor Forcein in Alderwood Manor.
What is the Percentage of People in the Labor Force in Alderwood Manor?
67.0% of People are in the Labor Force in Alderwood Manor.
What is the Unemployment Rate in Alderwood Manor?
Unemployment Rate in Alderwood Manor is 4.8%.