Zip Codes with the Highest Percentage of Population Employed in Architecture & Engineering in Bellevue, WA
RELATED REPORTS & OPTIONS
Architecture & Engineering
Bellevue
Compare Zip Codes
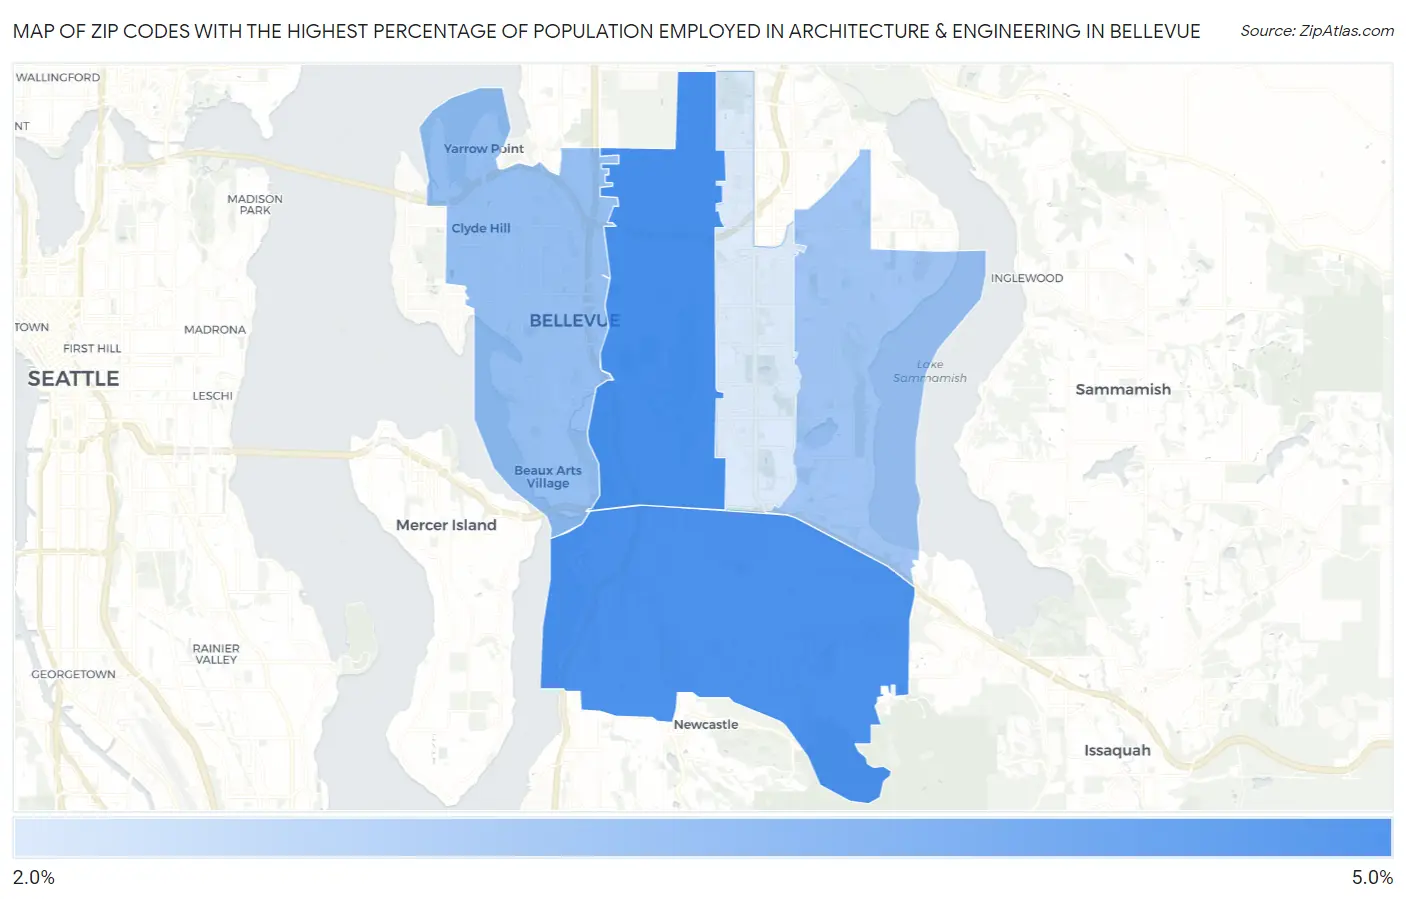
Map of Zip Codes with the Highest Percentage of Population Employed in Architecture & Engineering in Bellevue
2.3%
4.8%
Zip Codes with the Highest Percentage of Population Employed in Architecture & Engineering in Bellevue, WA
| Zip Code | % Employed | vs State | vs National | |
| 1. | 98005 | 4.8% | 2.8%(+2.03)#48 | 2.1%(+2.67)#1,809 |
| 2. | 98006 | 4.7% | 2.8%(+1.93)#55 | 2.1%(+2.58)#1,901 |
| 3. | 98004 | 3.5% | 2.8%(+0.685)#109 | 2.1%(+1.33)#3,800 |
| 4. | 98008 | 3.3% | 2.8%(+0.488)#125 | 2.1%(+1.13)#4,254 |
| 5. | 98007 | 2.3% | 2.8%(-0.539)#205 | 2.1%(+0.103)#8,189 |
1
Common Questions
What are the Top 3 Zip Codes with the Highest Percentage of Population Employed in Architecture & Engineering in Bellevue, WA?
Top 3 Zip Codes with the Highest Percentage of Population Employed in Architecture & Engineering in Bellevue, WA are:
What zip code has the Highest Percentage of Population Employed in Architecture & Engineering in Bellevue, WA?
98005 has the Highest Percentage of Population Employed in Architecture & Engineering in Bellevue, WA with 4.8%.
What is the Percentage of Population Employed in Architecture & Engineering in Bellevue, WA?
Percentage of Population Employed in Architecture & Engineering in Bellevue is 3.7%.
What is the Percentage of Population Employed in Architecture & Engineering in Washington?
Percentage of Population Employed in Architecture & Engineering in Washington is 2.8%.
What is the Percentage of Population Employed in Architecture & Engineering in the United States?
Percentage of Population Employed in Architecture & Engineering in the United States is 2.1%.