Zip Codes with the Highest Percentage of Population Employed in Architecture & Engineering in Renton, WA
RELATED REPORTS & OPTIONS
Architecture & Engineering
Renton
Compare Zip Codes
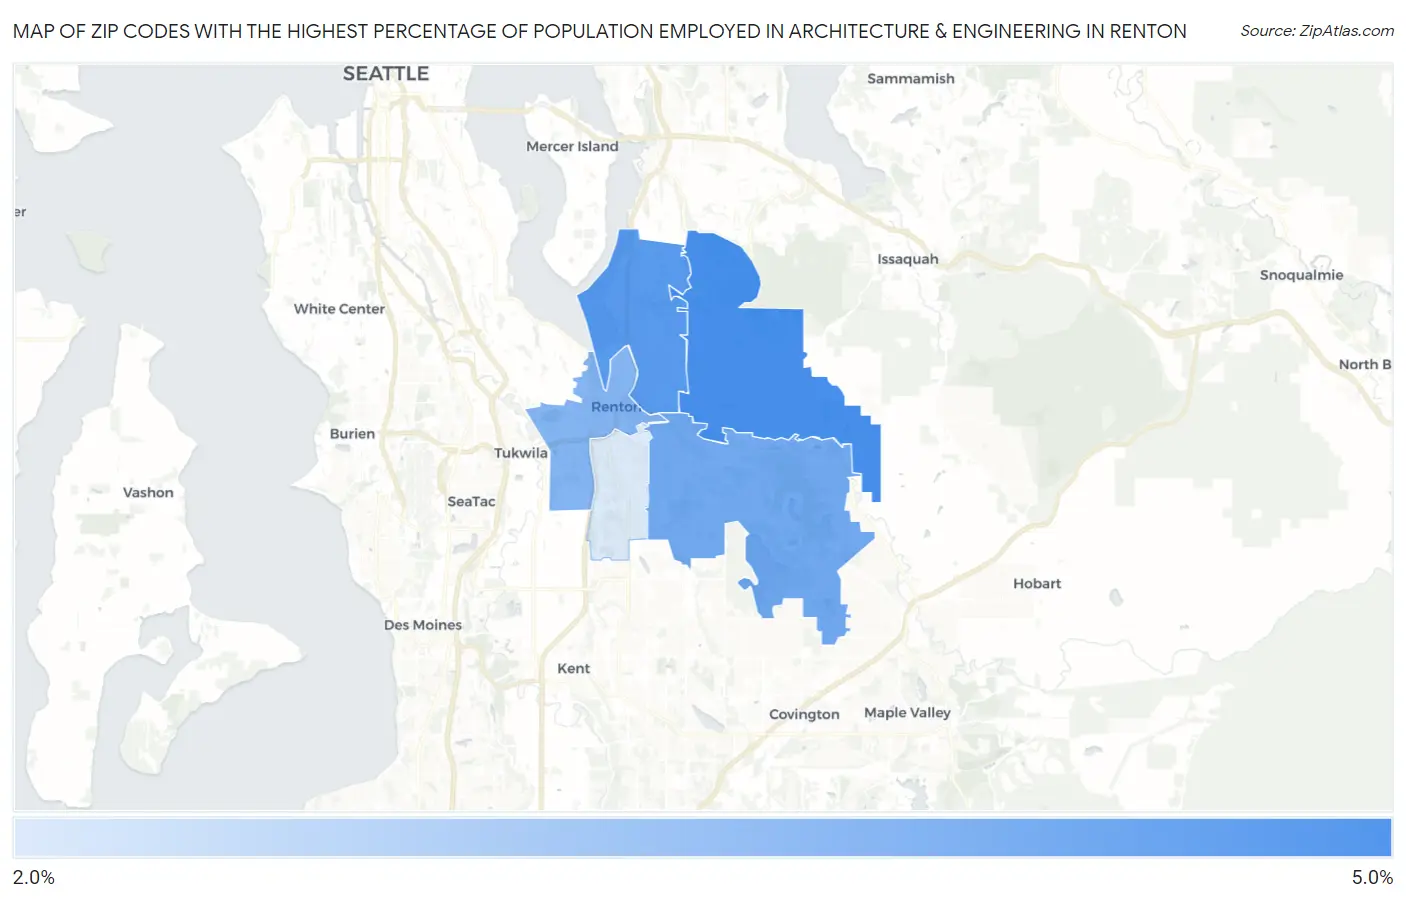
Map of Zip Codes with the Highest Percentage of Population Employed in Architecture & Engineering in Renton
2.7%
4.2%
Zip Codes with the Highest Percentage of Population Employed in Architecture & Engineering in Renton, WA
| Zip Code | % Employed | vs State | vs National | |
| 1. | 98059 | 4.2% | 2.8%(+1.42)#72 | 2.1%(+2.06)#2,478 |
| 2. | 98056 | 4.1% | 2.8%(+1.26)#77 | 2.1%(+1.90)#2,692 |
| 3. | 98058 | 3.8% | 2.8%(+0.962)#93 | 2.1%(+1.60)#3,189 |
| 4. | 98057 | 3.6% | 2.8%(+0.805)#101 | 2.1%(+1.45)#3,524 |
| 5. | 98055 | 2.7% | 2.8%(-0.105)#166 | 2.1%(+0.537)#6,221 |
1
Common Questions
What are the Top 3 Zip Codes with the Highest Percentage of Population Employed in Architecture & Engineering in Renton, WA?
Top 3 Zip Codes with the Highest Percentage of Population Employed in Architecture & Engineering in Renton, WA are:
What zip code has the Highest Percentage of Population Employed in Architecture & Engineering in Renton, WA?
98059 has the Highest Percentage of Population Employed in Architecture & Engineering in Renton, WA with 4.2%.
What is the Percentage of Population Employed in Architecture & Engineering in Renton, WA?
Percentage of Population Employed in Architecture & Engineering in Renton is 3.4%.
What is the Percentage of Population Employed in Architecture & Engineering in Washington?
Percentage of Population Employed in Architecture & Engineering in Washington is 2.8%.
What is the Percentage of Population Employed in Architecture & Engineering in the United States?
Percentage of Population Employed in Architecture & Engineering in the United States is 2.1%.