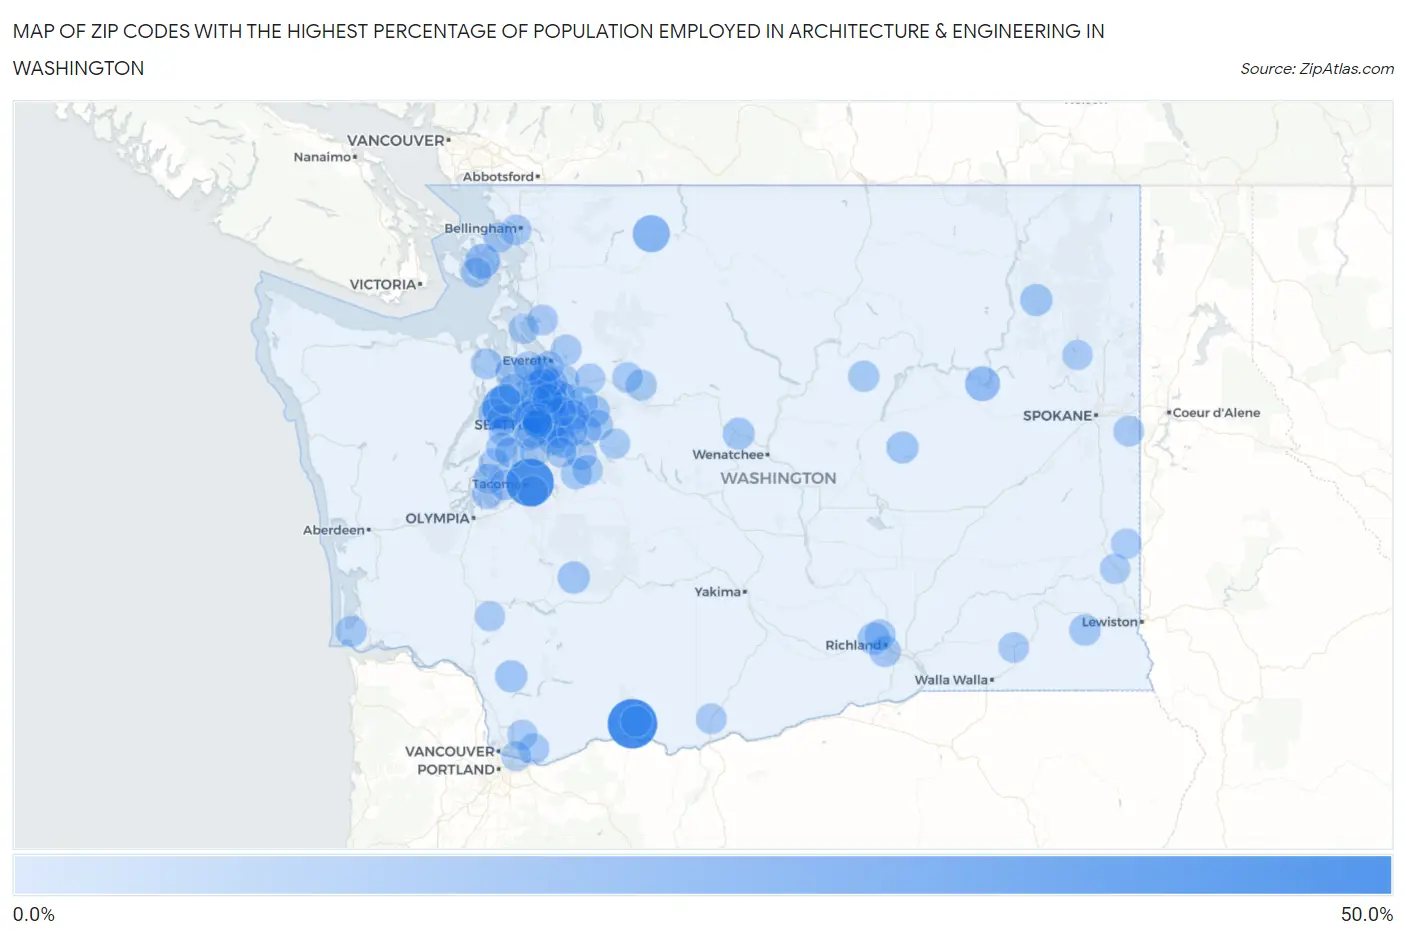
Zip Codes with the Highest Percentage of Population Employed in Architecture & Engineering in Washington
RELATED REPORTS & OPTIONS
Architecture & Engineering
Washington
Compare Zip Codes
Map of Zip Codes with the Highest Percentage of Population Employed in Architecture & Engineering in Washington
0.0%
50.0%
Zip Codes with the Highest Percentage of Population Employed in Architecture & Engineering in Washington
| Zip Code | % Employed | vs State | vs National | |
| 1. | 98623 | 50.0% | 2.8%(+47.2)#1 | 2.1%(+47.9)#17 |
| 2. | 98421 | 45.5% | 2.8%(+42.7)#2 | 2.1%(+43.3)#21 |
| 3. | 98345 | 34.3% | 2.8%(+31.5)#3 | 2.1%(+32.2)#47 |
| 4. | 98283 | 19.7% | 2.8%(+16.9)#4 | 2.1%(+17.5)#97 |
| 5. | 98195 | 14.6% | 2.8%(+11.8)#5 | 2.1%(+12.4)#155 |
| 6. | 99147 | 14.3% | 2.8%(+11.5)#6 | 2.1%(+12.1)#166 |
| 7. | 98222 | 14.3% | 2.8%(+11.5)#7 | 2.1%(+12.1)#167 |
| 8. | 98355 | 8.7% | 2.8%(+5.86)#8 | 2.1%(+6.50)#469 |
| 9. | 98625 | 8.4% | 2.8%(+5.61)#9 | 2.1%(+6.25)#502 |
| 10. | 99101 | 8.1% | 2.8%(+5.31)#10 | 2.1%(+5.95)#553 |
| 11. | 99353 | 8.0% | 2.8%(+5.26)#11 | 2.1%(+5.90)#564 |
| 12. | 98014 | 7.9% | 2.8%(+5.10)#12 | 2.1%(+5.74)#588 |
| 13. | 98860 | 7.8% | 2.8%(+5.02)#13 | 2.1%(+5.66)#607 |
| 14. | 98275 | 7.7% | 2.8%(+4.87)#14 | 2.1%(+5.51)#628 |
| 15. | 98821 | 7.5% | 2.8%(+4.75)#15 | 2.1%(+5.39)#650 |
| 16. | 99352 | 6.6% | 2.8%(+3.76)#16 | 2.1%(+4.40)#868 |
| 17. | 98020 | 6.5% | 2.8%(+3.67)#17 | 2.1%(+4.31)#904 |
| 18. | 98672 | 6.3% | 2.8%(+3.51)#18 | 2.1%(+4.15)#959 |
| 19. | 98624 | 6.3% | 2.8%(+3.49)#19 | 2.1%(+4.13)#965 |
| 20. | 99347 | 6.3% | 2.8%(+3.47)#20 | 2.1%(+4.11)#971 |
| 21. | 98103 | 6.1% | 2.8%(+3.31)#21 | 2.1%(+3.95)#1,042 |
| 22. | 98340 | 6.0% | 2.8%(+3.22)#22 | 2.1%(+3.86)#1,076 |
| 23. | 98830 | 5.9% | 2.8%(+3.09)#23 | 2.1%(+3.73)#1,139 |
| 24. | 98010 | 5.9% | 2.8%(+3.08)#24 | 2.1%(+3.72)#1,149 |
| 25. | 98383 | 5.8% | 2.8%(+2.97)#25 | 2.1%(+3.61)#1,188 |
| 26. | 98296 | 5.8% | 2.8%(+2.96)#26 | 2.1%(+3.61)#1,193 |
| 27. | 98077 | 5.7% | 2.8%(+2.93)#27 | 2.1%(+3.57)#1,213 |
| 28. | 98072 | 5.7% | 2.8%(+2.88)#28 | 2.1%(+3.52)#1,235 |
| 29. | 98121 | 5.6% | 2.8%(+2.82)#29 | 2.1%(+3.47)#1,274 |
| 30. | 98256 | 5.6% | 2.8%(+2.80)#30 | 2.1%(+3.45)#1,283 |
| 31. | 98311 | 5.5% | 2.8%(+2.69)#31 | 2.1%(+3.34)#1,334 |
| 32. | 98107 | 5.4% | 2.8%(+2.63)#32 | 2.1%(+3.27)#1,373 |
| 33. | 99354 | 5.4% | 2.8%(+2.63)#33 | 2.1%(+3.27)#1,376 |
| 34. | 98019 | 5.4% | 2.8%(+2.62)#34 | 2.1%(+3.26)#1,381 |
| 35. | 98021 | 5.4% | 2.8%(+2.57)#35 | 2.1%(+3.21)#1,410 |
| 36. | 98115 | 5.3% | 2.8%(+2.52)#36 | 2.1%(+3.16)#1,444 |
| 37. | 98011 | 5.3% | 2.8%(+2.52)#37 | 2.1%(+3.16)#1,446 |
| 38. | 98325 | 5.2% | 2.8%(+2.42)#38 | 2.1%(+3.06)#1,511 |
| 39. | 98443 | 5.0% | 2.8%(+2.19)#39 | 2.1%(+2.83)#1,682 |
| 40. | 98065 | 5.0% | 2.8%(+2.16)#40 | 2.1%(+2.81)#1,693 |
| 41. | 98012 | 4.9% | 2.8%(+2.14)#41 | 2.1%(+2.78)#1,706 |
| 42. | 98258 | 4.9% | 2.8%(+2.12)#42 | 2.1%(+2.76)#1,723 |
| 43. | 98040 | 4.9% | 2.8%(+2.11)#43 | 2.1%(+2.75)#1,731 |
| 44. | 98607 | 4.9% | 2.8%(+2.11)#44 | 2.1%(+2.75)#1,746 |
| 45. | 98024 | 4.9% | 2.8%(+2.08)#45 | 2.1%(+2.72)#1,767 |
| 46. | 98337 | 4.9% | 2.8%(+2.07)#46 | 2.1%(+2.71)#1,779 |
| 47. | 98144 | 4.8% | 2.8%(+2.03)#47 | 2.1%(+2.67)#1,808 |
| 48. | 98005 | 4.8% | 2.8%(+2.03)#48 | 2.1%(+2.67)#1,809 |
| 49. | 98074 | 4.8% | 2.8%(+2.03)#49 | 2.1%(+2.67)#1,810 |
| 50. | 98038 | 4.8% | 2.8%(+2.01)#50 | 2.1%(+2.65)#1,835 |
| 51. | 98033 | 4.8% | 2.8%(+2.01)#51 | 2.1%(+2.65)#1,836 |
| 52. | 98620 | 4.7% | 2.8%(+1.95)#52 | 2.1%(+2.59)#1,890 |
| 53. | 98087 | 4.7% | 2.8%(+1.94)#53 | 2.1%(+2.59)#1,893 |
| 54. | 98292 | 4.7% | 2.8%(+1.94)#54 | 2.1%(+2.58)#1,895 |
| 55. | 98006 | 4.7% | 2.8%(+1.93)#55 | 2.1%(+2.58)#1,901 |
| 56. | 98199 | 4.6% | 2.8%(+1.79)#56 | 2.1%(+2.43)#2,037 |
| 57. | 98251 | 4.6% | 2.8%(+1.78)#57 | 2.1%(+2.42)#2,044 |
| 58. | 98351 | 4.6% | 2.8%(+1.78)#58 | 2.1%(+2.42)#2,045 |
| 59. | 98329 | 4.6% | 2.8%(+1.77)#59 | 2.1%(+2.41)#2,053 |
| 60. | 98136 | 4.5% | 2.8%(+1.76)#60 | 2.1%(+2.40)#2,073 |
| 61. | 99023 | 4.5% | 2.8%(+1.75)#61 | 2.1%(+2.40)#2,075 |
| 62. | 98349 | 4.5% | 2.8%(+1.68)#62 | 2.1%(+2.32)#2,165 |
| 63. | 98053 | 4.4% | 2.8%(+1.65)#63 | 2.1%(+2.29)#2,205 |
| 64. | 99361 | 4.4% | 2.8%(+1.63)#64 | 2.1%(+2.27)#2,223 |
| 65. | 98034 | 4.3% | 2.8%(+1.49)#65 | 2.1%(+2.14)#2,384 |
| 66. | 98261 | 4.3% | 2.8%(+1.49)#66 | 2.1%(+2.13)#2,388 |
| 67. | 98102 | 4.3% | 2.8%(+1.47)#67 | 2.1%(+2.11)#2,414 |
| 68. | 98333 | 4.3% | 2.8%(+1.47)#68 | 2.1%(+2.11)#2,416 |
| 69. | 98026 | 4.2% | 2.8%(+1.45)#69 | 2.1%(+2.09)#2,445 |
| 70. | 99161 | 4.2% | 2.8%(+1.44)#70 | 2.1%(+2.08)#2,462 |
| 71. | 98126 | 4.2% | 2.8%(+1.44)#71 | 2.1%(+2.08)#2,464 |
| 72. | 98059 | 4.2% | 2.8%(+1.42)#72 | 2.1%(+2.06)#2,478 |
| 73. | 98225 | 4.2% | 2.8%(+1.42)#73 | 2.1%(+2.06)#2,487 |
| 74. | 98037 | 4.2% | 2.8%(+1.39)#74 | 2.1%(+2.03)#2,511 |
| 75. | 98133 | 4.2% | 2.8%(+1.37)#75 | 2.1%(+2.01)#2,540 |
| 76. | 98367 | 4.2% | 2.8%(+1.36)#76 | 2.1%(+2.00)#2,551 |
| 77. | 98056 | 4.1% | 2.8%(+1.26)#77 | 2.1%(+1.90)#2,692 |
| 78. | 98346 | 4.0% | 2.8%(+1.23)#78 | 2.1%(+1.87)#2,733 |
| 79. | 98029 | 4.0% | 2.8%(+1.22)#79 | 2.1%(+1.86)#2,751 |
| 80. | 99163 | 4.0% | 2.8%(+1.20)#80 | 2.1%(+1.84)#2,777 |
| 81. | 98052 | 4.0% | 2.8%(+1.19)#81 | 2.1%(+1.84)#2,788 |
| 82. | 98203 | 4.0% | 2.8%(+1.19)#82 | 2.1%(+1.83)#2,792 |
| 83. | 98166 | 4.0% | 2.8%(+1.18)#83 | 2.1%(+1.83)#2,810 |
| 84. | 98282 | 4.0% | 2.8%(+1.18)#84 | 2.1%(+1.82)#2,815 |
| 85. | 98262 | 4.0% | 2.8%(+1.18)#85 | 2.1%(+1.82)#2,816 |
| 86. | 98109 | 3.9% | 2.8%(+1.16)#86 | 2.1%(+1.80)#2,848 |
| 87. | 98272 | 3.9% | 2.8%(+1.08)#87 | 2.1%(+1.72)#2,977 |
| 88. | 98028 | 3.8% | 2.8%(+1.06)#88 | 2.1%(+1.70)#3,005 |
| 89. | 98359 | 3.8% | 2.8%(+1.06)#89 | 2.1%(+1.70)#3,008 |
| 90. | 98370 | 3.8% | 2.8%(+1.05)#90 | 2.1%(+1.69)#3,028 |
| 91. | 98606 | 3.8% | 2.8%(+1.02)#91 | 2.1%(+1.66)#3,075 |
| 92. | 98104 | 3.8% | 2.8%(+0.978)#92 | 2.1%(+1.62)#3,155 |
| 93. | 98058 | 3.8% | 2.8%(+0.962)#93 | 2.1%(+1.60)#3,189 |
| 94. | 98045 | 3.7% | 2.8%(+0.942)#94 | 2.1%(+1.58)#3,231 |
| 95. | 98236 | 3.7% | 2.8%(+0.918)#95 | 2.1%(+1.56)#3,271 |
| 96. | 98101 | 3.7% | 2.8%(+0.900)#96 | 2.1%(+1.54)#3,312 |
| 97. | 98051 | 3.7% | 2.8%(+0.877)#97 | 2.1%(+1.52)#3,364 |
| 98. | 99110 | 3.6% | 2.8%(+0.858)#98 | 2.1%(+1.50)#3,404 |
| 99. | 98591 | 3.6% | 2.8%(+0.854)#99 | 2.1%(+1.50)#3,416 |
| 100. | 98683 | 3.6% | 2.8%(+0.837)#100 | 2.1%(+1.48)#3,455 |
Common Questions
What are the Top 10 Zip Codes with the Highest Percentage of Population Employed in Architecture & Engineering in Washington?
Top 10 Zip Codes with the Highest Percentage of Population Employed in Architecture & Engineering in Washington are:
What zip code has the Highest Percentage of Population Employed in Architecture & Engineering in Washington?
98623 has the Highest Percentage of Population Employed in Architecture & Engineering in Washington with 50.0%.
What is the Percentage of Population Employed in Architecture & Engineering in the State of Washington?
Percentage of Population Employed in Architecture & Engineering in Washington is 2.8%.
What is the Percentage of Population Employed in Architecture & Engineering in the United States?
Percentage of Population Employed in Architecture & Engineering in the United States is 2.1%.