Martha Lake, WA Map & Demographics
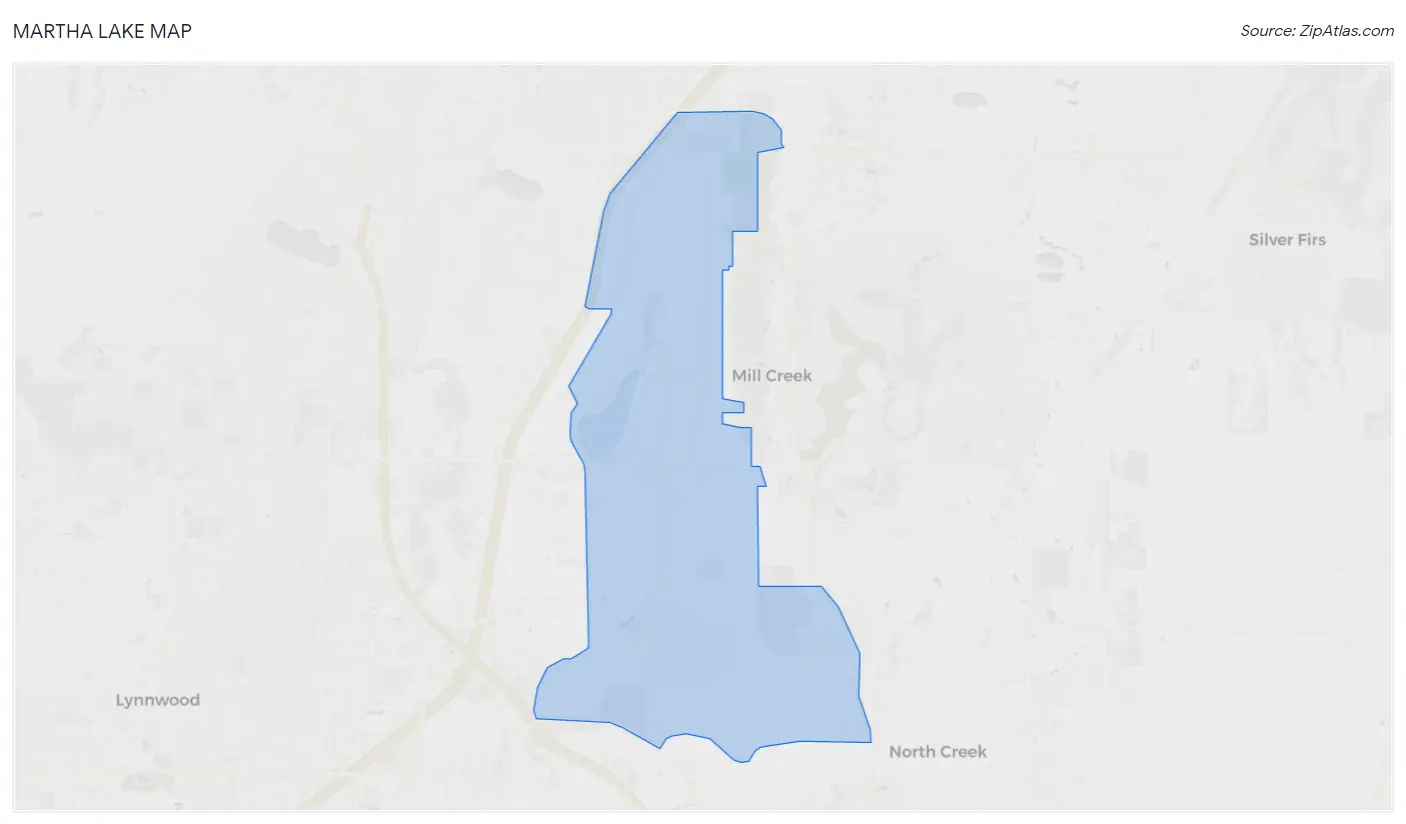
Martha Lake Map
Martha Lake Overview
$50,674
PER CAPITA INCOME
$145,898
AVG FAMILY INCOME
$132,844
AVG HOUSEHOLD INCOME
35.6%
WAGE / INCOME GAP [ % ]
64.4¢/ $1
WAGE / INCOME GAP [ $ ]
$13,725
FAMILY INCOME DEFICIT
0.38
INEQUALITY / GINI INDEX
23,259
TOTAL POPULATION
11,755
MALE POPULATION
11,504
FEMALE POPULATION
102.18
MALES / 100 FEMALES
97.86
FEMALES / 100 MALES
34.7
MEDIAN AGE
3.4
AVG FAMILY SIZE
2.9
AVG HOUSEHOLD SIZE
13,462
LABOR FORCE [ PEOPLE ]
74.7%
PERCENT IN LABOR FORCE
4.4%
UNEMPLOYMENT RATE
Income in Martha Lake
Income Overview in Martha Lake
Per Capita Income in Martha Lake is $50,674, while median incomes of families and households are $145,898 and $132,844 respectively.
| Characteristic | Number | Measure |
| Per Capita Income | 23,259 | $50,674 |
| Median Family Income | 5,795 | $145,898 |
| Mean Family Income | 5,795 | $161,532 |
| Median Household Income | 7,966 | $132,844 |
| Mean Household Income | 7,966 | $145,820 |
| Income Deficit | 5,795 | $13,725 |
| Wage / Income Gap (%) | 23,259 | 35.61% |
| Wage / Income Gap ($) | 23,259 | 64.39¢ per $1 |
| Gini / Inequality Index | 23,259 | 0.38 |
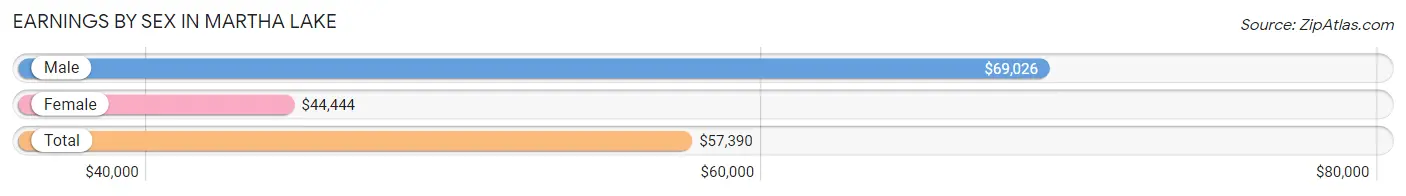
Earnings by Sex in Martha Lake
Average Earnings in Martha Lake are $57,390, $69,026 for men and $44,444 for women, a difference of 35.6%.
| Sex | Number | Average Earnings |
| Male | 7,411 (53.6%) | $69,026 |
| Female | 6,404 (46.4%) | $44,444 |
| Total | 13,815 (100.0%) | $57,390 |
Earnings by Sex by Income Bracket in Martha Lake
The most common earnings brackets in Martha Lake are $100,000+ for men (2,532 | 34.2%) and $100,000+ for women (1,081 | 16.9%).
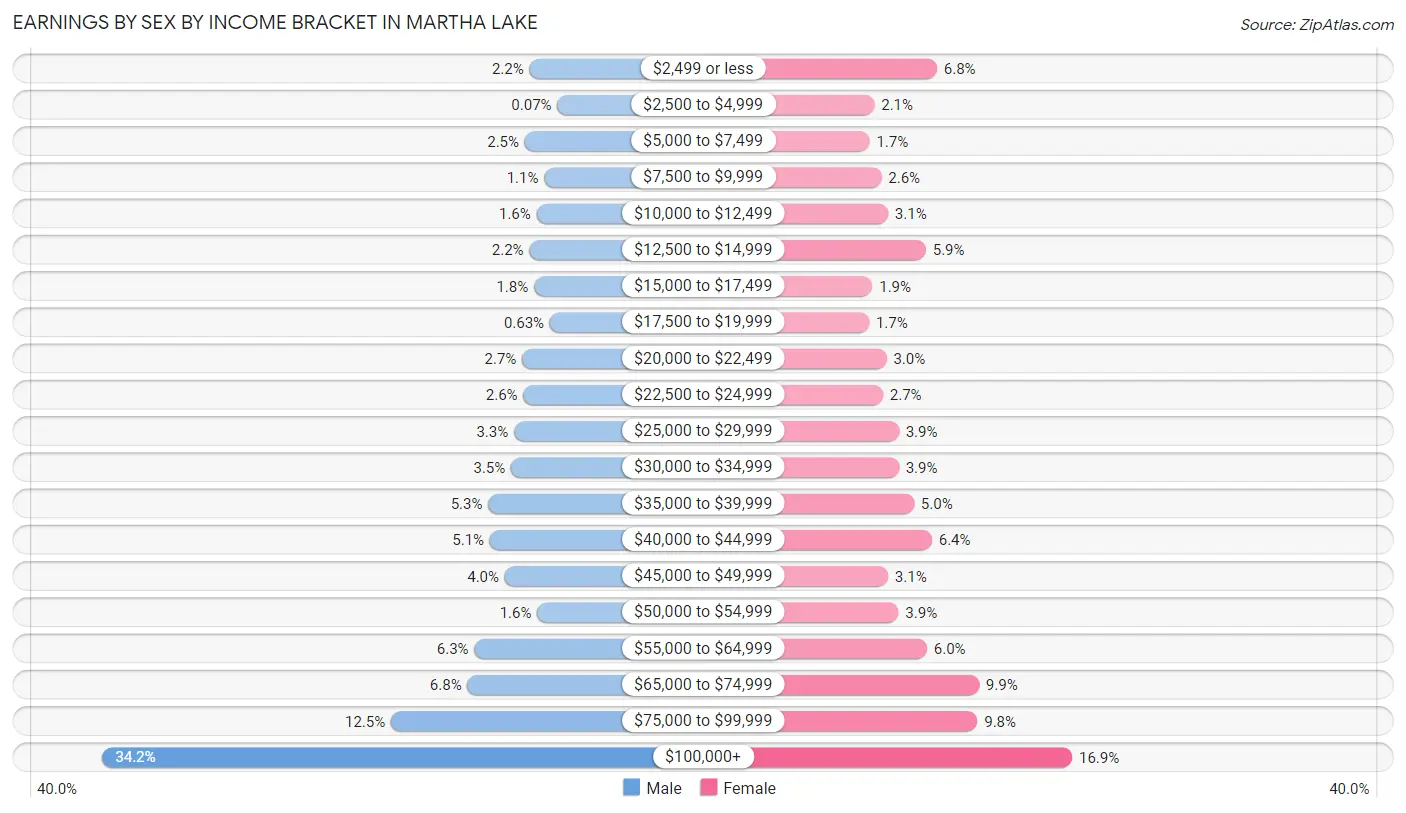
| Income | Male | Female |
| $2,499 or less | 160 (2.2%) | 432 (6.8%) |
| $2,500 to $4,999 | 5 (0.1%) | 132 (2.1%) |
| $5,000 to $7,499 | 186 (2.5%) | 109 (1.7%) |
| $7,500 to $9,999 | 78 (1.1%) | 166 (2.6%) |
| $10,000 to $12,499 | 121 (1.6%) | 197 (3.1%) |
| $12,500 to $14,999 | 161 (2.2%) | 379 (5.9%) |
| $15,000 to $17,499 | 135 (1.8%) | 122 (1.9%) |
| $17,500 to $19,999 | 47 (0.6%) | 106 (1.7%) |
| $20,000 to $22,499 | 201 (2.7%) | 190 (3.0%) |
| $22,500 to $24,999 | 194 (2.6%) | 173 (2.7%) |
| $25,000 to $29,999 | 246 (3.3%) | 249 (3.9%) |
| $30,000 to $34,999 | 262 (3.5%) | 249 (3.9%) |
| $35,000 to $39,999 | 389 (5.2%) | 322 (5.0%) |
| $40,000 to $44,999 | 380 (5.1%) | 408 (6.4%) |
| $45,000 to $49,999 | 297 (4.0%) | 197 (3.1%) |
| $50,000 to $54,999 | 117 (1.6%) | 248 (3.9%) |
| $55,000 to $64,999 | 466 (6.3%) | 384 (6.0%) |
| $65,000 to $74,999 | 505 (6.8%) | 634 (9.9%) |
| $75,000 to $99,999 | 929 (12.5%) | 626 (9.8%) |
| $100,000+ | 2,532 (34.2%) | 1,081 (16.9%) |
| Total | 7,411 (100.0%) | 6,404 (100.0%) |
Earnings by Sex by Educational Attainment in Martha Lake
Average earnings in Martha Lake are $78,838 for men and $51,841 for women, a difference of 34.2%. Men with an educational attainment of graduate degree enjoy the highest average annual earnings of $114,705, while those with less than high school education earn the least with $26,641. Women with an educational attainment of graduate degree earn the most with the average annual earnings of $72,386, while those with less than high school education have the smallest earnings of $34,010.
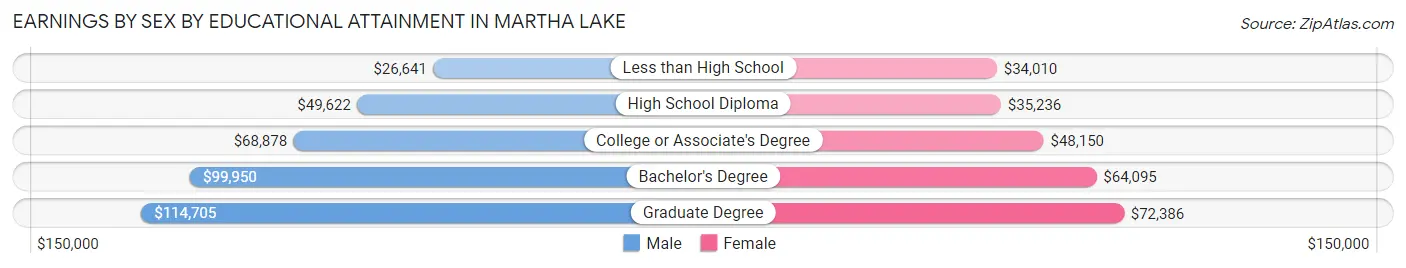
| Educational Attainment | Male Income | Female Income |
| Less than High School | $26,641 | $34,010 |
| High School Diploma | $49,622 | $35,236 |
| College or Associate's Degree | $68,878 | $48,150 |
| Bachelor's Degree | $99,950 | $64,095 |
| Graduate Degree | $114,705 | $72,386 |
| Total | $78,838 | $51,841 |
Family Income in Martha Lake
Family Income Brackets in Martha Lake
According to the Martha Lake family income data, there are 1,628 families falling into the $200,000+ income range, which is the most common income bracket and makes up 28.1% of all families.
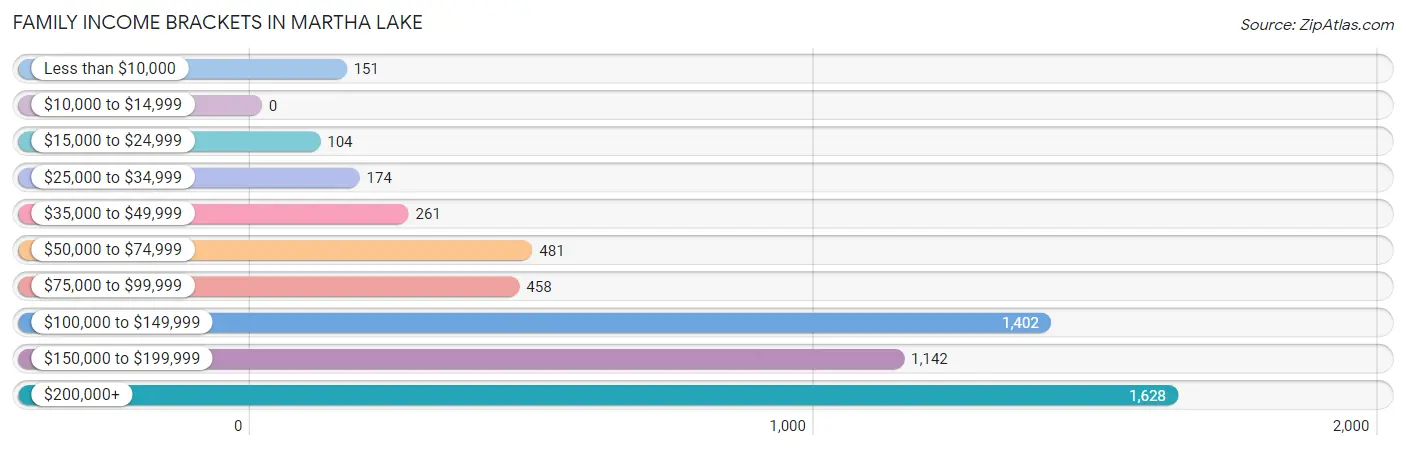
| Income Bracket | # Families | % Families |
| Less than $10,000 | 151 | 2.6% |
| $10,000 to $14,999 | 0 | 0.0% |
| $15,000 to $24,999 | 104 | 1.8% |
| $25,000 to $34,999 | 174 | 3.0% |
| $35,000 to $49,999 | 261 | 4.5% |
| $50,000 to $74,999 | 481 | 8.3% |
| $75,000 to $99,999 | 458 | 7.9% |
| $100,000 to $149,999 | 1,402 | 24.2% |
| $150,000 to $199,999 | 1,142 | 19.7% |
| $200,000+ | 1,628 | 28.1% |
Family Income by Famaliy Size in Martha Lake
7+ person families (160 | 2.8%) account for the highest median family income in Martha Lake with $178,214 per family, while 2-person families (2,162 | 37.3%) have the highest median income of $64,532 per family member.
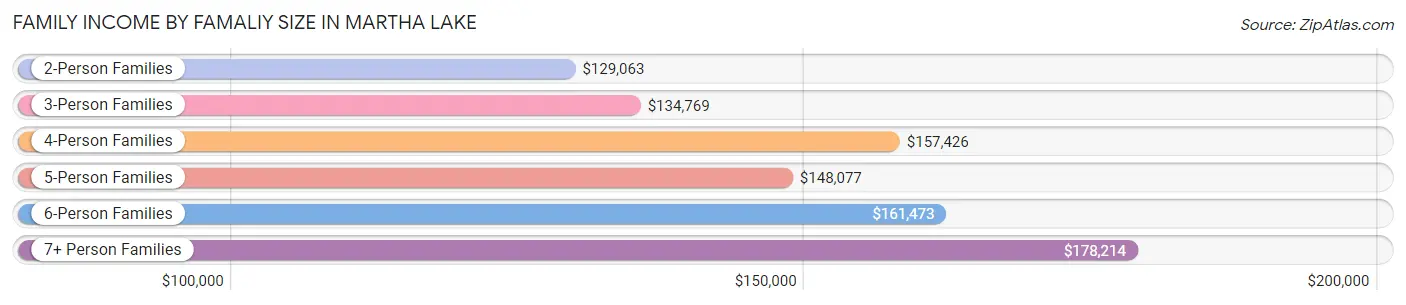
| Income Bracket | # Families | Median Income |
| 2-Person Families | 2,162 (37.3%) | $129,063 |
| 3-Person Families | 1,360 (23.5%) | $134,769 |
| 4-Person Families | 1,251 (21.6%) | $157,426 |
| 5-Person Families | 436 (7.5%) | $148,077 |
| 6-Person Families | 426 (7.3%) | $161,473 |
| 7+ Person Families | 160 (2.8%) | $178,214 |
| Total | 5,795 (100.0%) | $145,898 |
Family Income by Number of Earners in Martha Lake
The median family income in Martha Lake is $145,898, with families comprising 3+ earners (987) having the highest median family income of $169,702, while families with no earners (578) have the lowest median family income of $45,577, accounting for 17.0% and 10.0% of families, respectively.
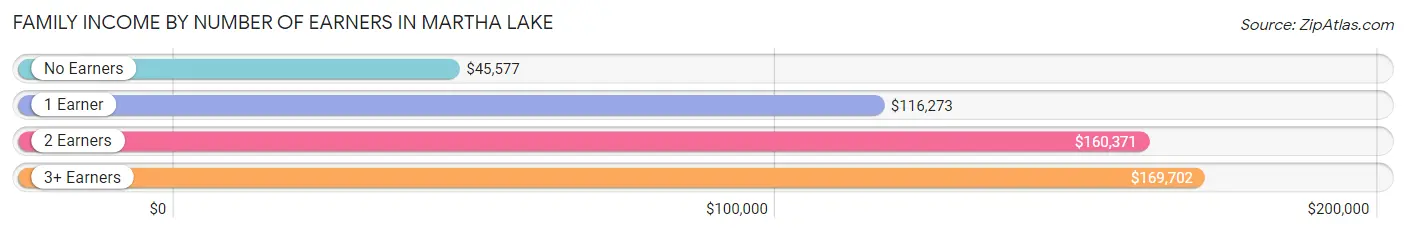
| Number of Earners | # Families | Median Income |
| No Earners | 578 (10.0%) | $45,577 |
| 1 Earner | 1,057 (18.2%) | $116,273 |
| 2 Earners | 3,173 (54.7%) | $160,371 |
| 3+ Earners | 987 (17.0%) | $169,702 |
| Total | 5,795 (100.0%) | $145,898 |
Household Income in Martha Lake
Household Income Brackets in Martha Lake
With 1,896 households falling in the category, the $200,000+ income range is the most frequent in Martha Lake, accounting for 23.8% of all households. In contrast, only 64 households (0.8%) fall into the $10,000 to $14,999 income bracket, making it the least populous group.
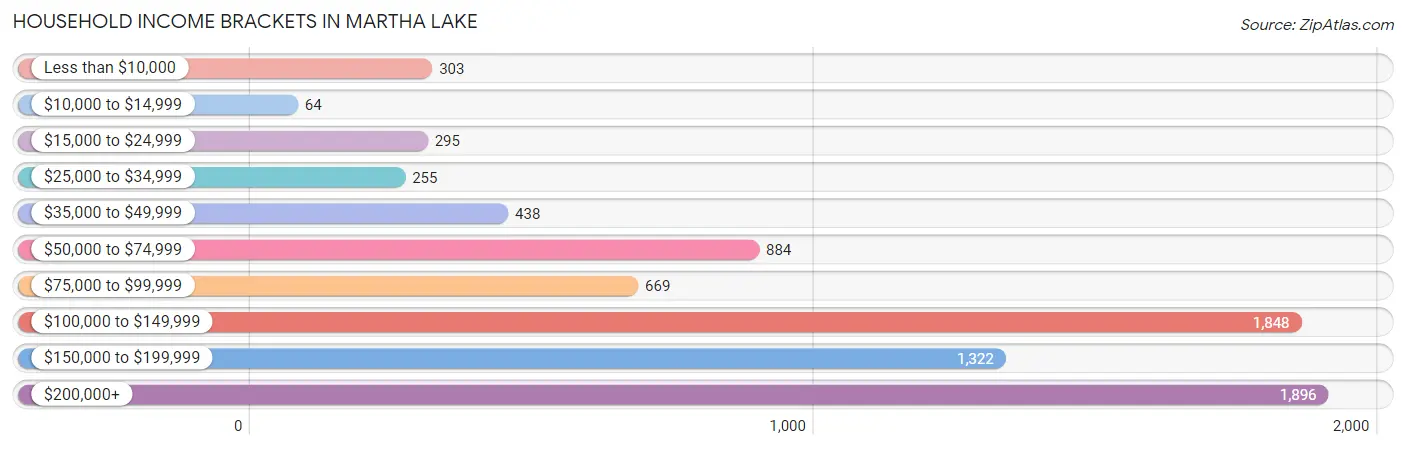
| Income Bracket | # Households | % Households |
| Less than $10,000 | 303 | 3.8% |
| $10,000 to $14,999 | 64 | 0.8% |
| $15,000 to $24,999 | 295 | 3.7% |
| $25,000 to $34,999 | 255 | 3.2% |
| $35,000 to $49,999 | 438 | 5.5% |
| $50,000 to $74,999 | 884 | 11.1% |
| $75,000 to $99,999 | 669 | 8.4% |
| $100,000 to $149,999 | 1,848 | 23.2% |
| $150,000 to $199,999 | 1,322 | 16.6% |
| $200,000+ | 1,896 | 23.8% |
Household Income by Householder Age in Martha Lake
The median household income in Martha Lake is $132,844, with the highest median household income of $146,804 found in the 45 to 64 years age bracket for the primary householder. A total of 2,741 households (34.4%) fall into this category. Meanwhile, the 15 to 24 years age bracket for the primary householder has the lowest median household income of $0, with 197 households (2.5%) in this group.
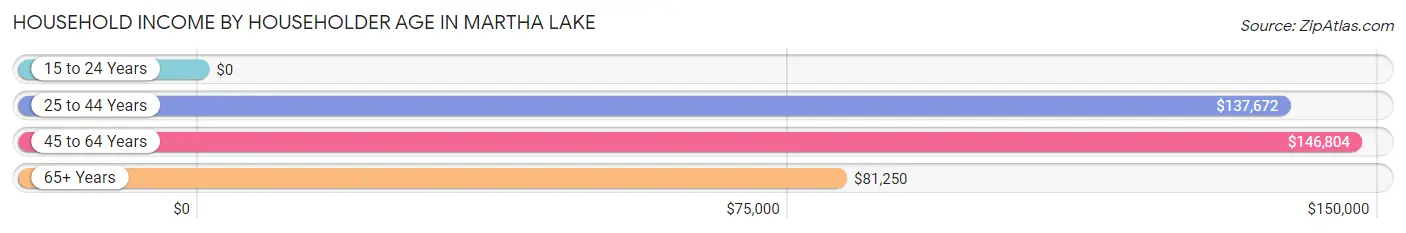
| Income Bracket | # Households | Median Income |
| 15 to 24 Years | 197 (2.5%) | $0 |
| 25 to 44 Years | 3,846 (48.3%) | $137,672 |
| 45 to 64 Years | 2,741 (34.4%) | $146,804 |
| 65+ Years | 1,182 (14.8%) | $81,250 |
| Total | 7,966 (100.0%) | $132,844 |
Poverty in Martha Lake
Income Below Poverty by Sex and Age in Martha Lake
With 8.5% poverty level for males and 10.8% for females among the residents of Martha Lake, 12 to 14 year old males and 6 to 11 year old females are the most vulnerable to poverty, with 213 males (23.5%) and 265 females (23.0%) in their respective age groups living below the poverty level.
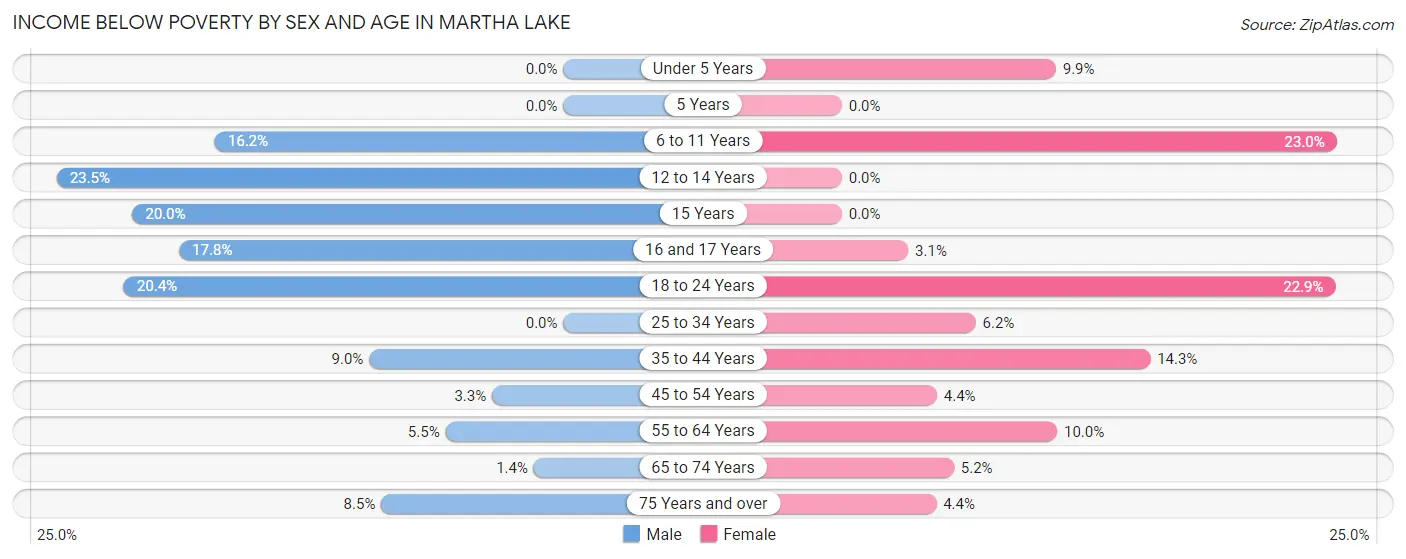
| Age Bracket | Male | Female |
| Under 5 Years | 0 (0.0%) | 90 (9.9%) |
| 5 Years | 0 (0.0%) | 0 (0.0%) |
| 6 to 11 Years | 130 (16.2%) | 265 (23.0%) |
| 12 to 14 Years | 213 (23.5%) | 0 (0.0%) |
| 15 Years | 23 (20.0%) | 0 (0.0%) |
| 16 and 17 Years | 46 (17.8%) | 10 (3.1%) |
| 18 to 24 Years | 217 (20.4%) | 237 (22.9%) |
| 25 to 34 Years | 0 (0.0%) | 119 (6.2%) |
| 35 to 44 Years | 200 (9.0%) | 315 (14.3%) |
| 45 to 54 Years | 42 (3.3%) | 58 (4.4%) |
| 55 to 64 Years | 58 (5.5%) | 90 (10.0%) |
| 65 to 74 Years | 12 (1.4%) | 40 (5.2%) |
| 75 Years and over | 44 (8.5%) | 17 (4.4%) |
| Total | 985 (8.5%) | 1,241 (10.8%) |
Income Above Poverty by Sex and Age in Martha Lake
According to the poverty statistics in Martha Lake, males aged under 5 years and females aged 5 years are the age groups that are most secure financially, with 100.0% of males and 100.0% of females in these age groups living above the poverty line.
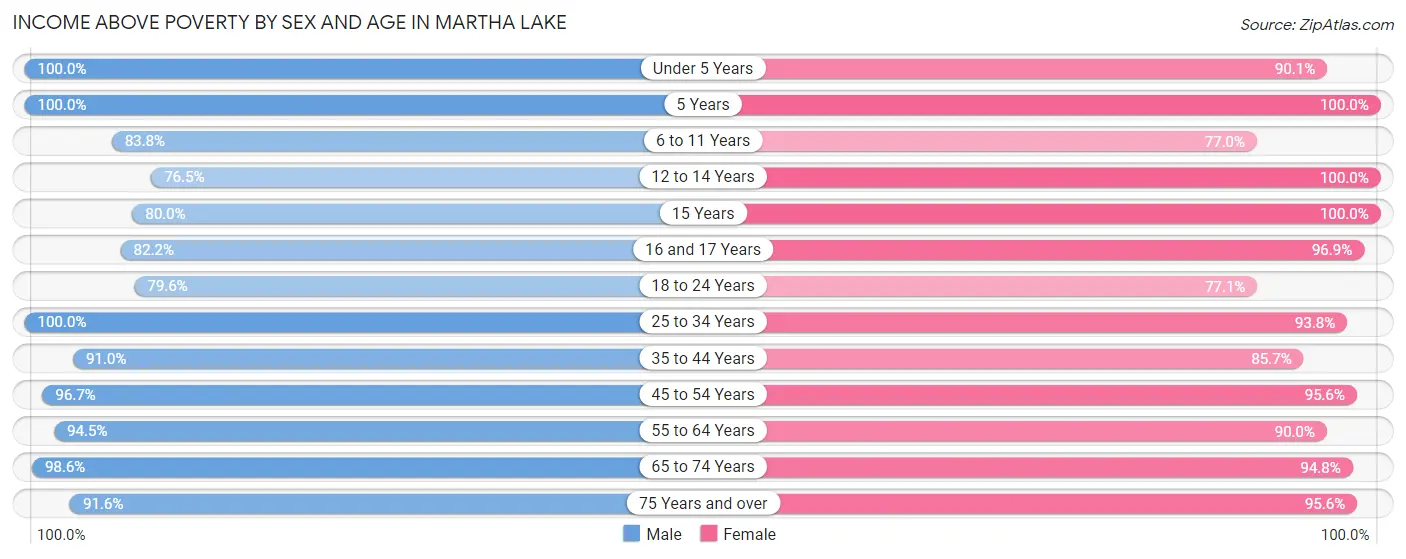
| Age Bracket | Male | Female |
| Under 5 Years | 493 (100.0%) | 816 (90.1%) |
| 5 Years | 141 (100.0%) | 107 (100.0%) |
| 6 to 11 Years | 674 (83.8%) | 889 (77.0%) |
| 12 to 14 Years | 693 (76.5%) | 367 (100.0%) |
| 15 Years | 92 (80.0%) | 120 (100.0%) |
| 16 and 17 Years | 212 (82.2%) | 315 (96.9%) |
| 18 to 24 Years | 847 (79.6%) | 798 (77.1%) |
| 25 to 34 Years | 1,904 (100.0%) | 1,796 (93.8%) |
| 35 to 44 Years | 2,020 (91.0%) | 1,886 (85.7%) |
| 45 to 54 Years | 1,228 (96.7%) | 1,258 (95.6%) |
| 55 to 64 Years | 1,003 (94.5%) | 811 (90.0%) |
| 65 to 74 Years | 862 (98.6%) | 729 (94.8%) |
| 75 Years and over | 477 (91.5%) | 371 (95.6%) |
| Total | 10,646 (91.5%) | 10,263 (89.2%) |
Income Below Poverty Among Married-Couple Families in Martha Lake
The poverty statistics for married-couple families in Martha Lake show that 3.5% or 172 of the total 4,839 families live below the poverty line. Families with 3 or 4 children have the highest poverty rate of 23.5%, comprising of 93 families. On the other hand, families with 5 or more children have the lowest poverty rate of 0.0%, which includes 0 families.
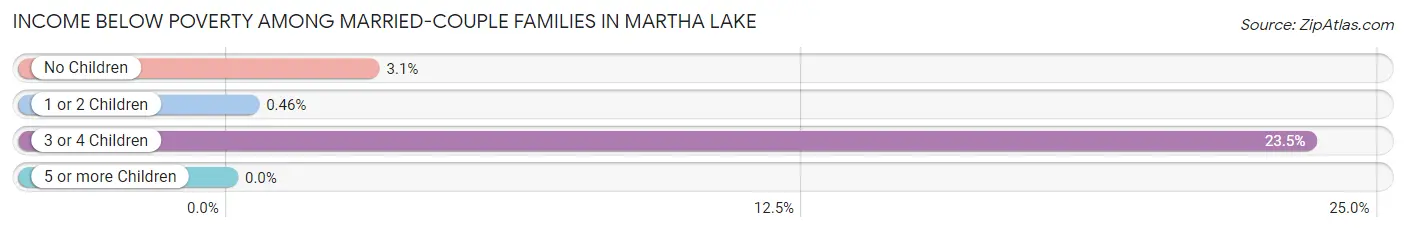
| Children | Above Poverty | Below Poverty |
| No Children | 2,172 (96.9%) | 69 (3.1%) |
| 1 or 2 Children | 2,162 (99.5%) | 10 (0.5%) |
| 3 or 4 Children | 303 (76.5%) | 93 (23.5%) |
| 5 or more Children | 30 (100.0%) | 0 (0.0%) |
| Total | 4,667 (96.5%) | 172 (3.5%) |
Income Below Poverty Among Single-Parent Households in Martha Lake
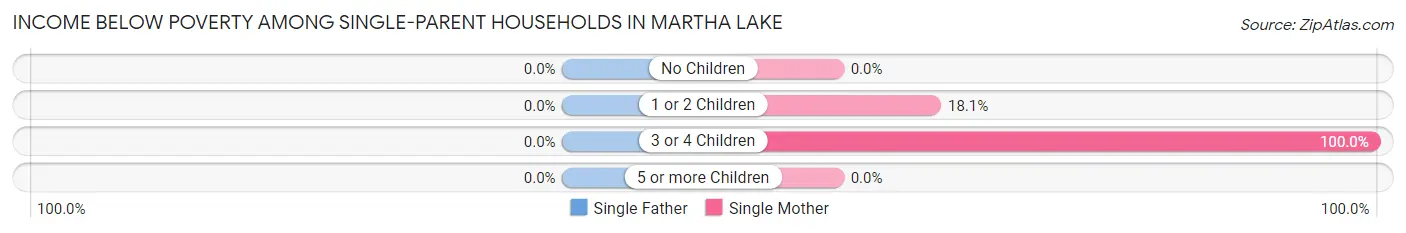
| Children | Single Father | Single Mother |
| No Children | 0 (0.0%) | 0 (0.0%) |
| 1 or 2 Children | 0 (0.0%) | 43 (18.1%) |
| 3 or 4 Children | 0 (0.0%) | 114 (100.0%) |
| 5 or more Children | 0 (0.0%) | 0 (0.0%) |
| Total | 0 (0.0%) | 157 (23.9%) |
Income Below Poverty Among Married-Couple vs Single-Parent Households in Martha Lake
The poverty data for Martha Lake shows that 172 of the married-couple family households (3.5%) and 157 of the single-parent households (16.4%) are living below the poverty level. Within the married-couple family households, those with 3 or 4 children have the highest poverty rate, with 93 households (23.5%) falling below the poverty line. Among the single-parent households, those with 3 or 4 children have the highest poverty rate, with 114 household (76.5%) living below poverty.
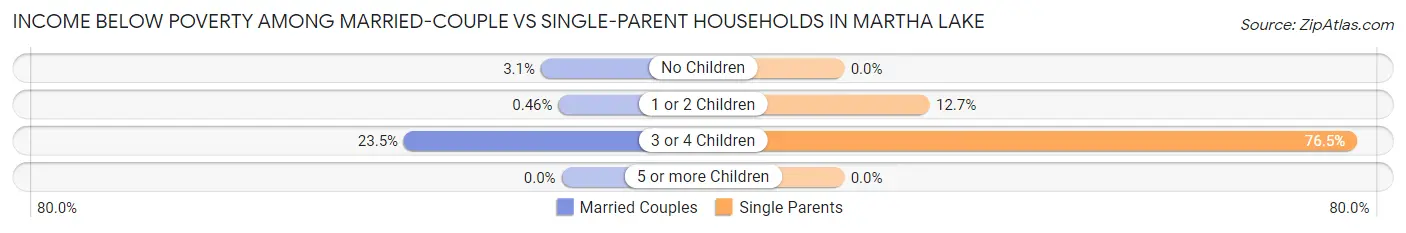
| Children | Married-Couple Families | Single-Parent Households |
| No Children | 69 (3.1%) | 0 (0.0%) |
| 1 or 2 Children | 10 (0.5%) | 43 (12.7%) |
| 3 or 4 Children | 93 (23.5%) | 114 (76.5%) |
| 5 or more Children | 0 (0.0%) | 0 (0.0%) |
| Total | 172 (3.5%) | 157 (16.4%) |
Race in Martha Lake
The most populous races in Martha Lake are White / Caucasian (13,322 | 57.3%), Asian (5,289 | 22.7%), and Hispanic or Latino (2,388 | 10.3%).
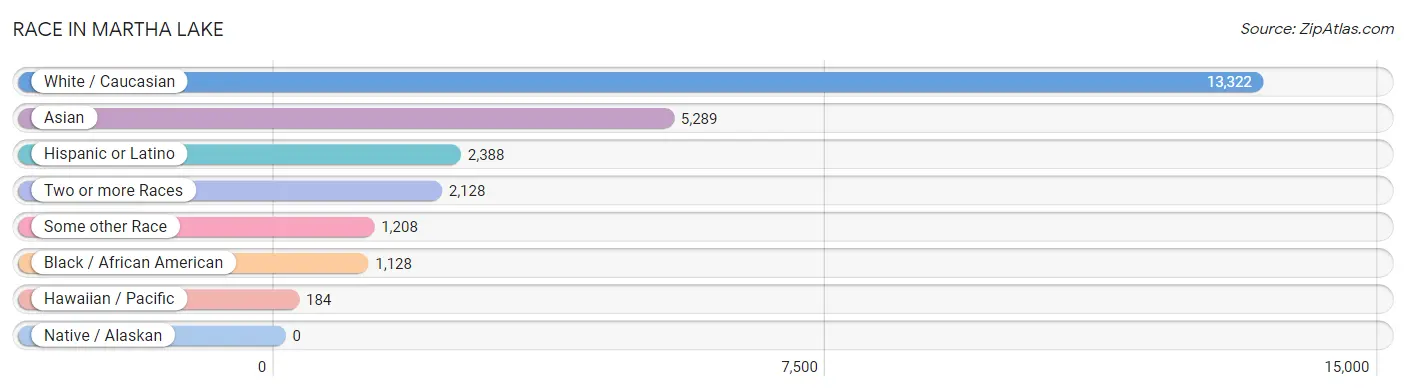
| Race | # Population | % Population |
| Asian | 5,289 | 22.7% |
| Black / African American | 1,128 | 4.9% |
| Hawaiian / Pacific | 184 | 0.8% |
| Hispanic or Latino | 2,388 | 10.3% |
| Native / Alaskan | 0 | 0.0% |
| White / Caucasian | 13,322 | 57.3% |
| Two or more Races | 2,128 | 9.1% |
| Some other Race | 1,208 | 5.2% |
| Total | 23,259 | 100.0% |
Ancestry in Martha Lake
The most populous ancestries reported in Martha Lake are German (2,509 | 10.8%), Irish (2,280 | 9.8%), Indian (Asian) (1,950 | 8.4%), English (1,542 | 6.6%), and Mexican (1,407 | 6.0%), together accounting for 41.6% of all Martha Lake residents.
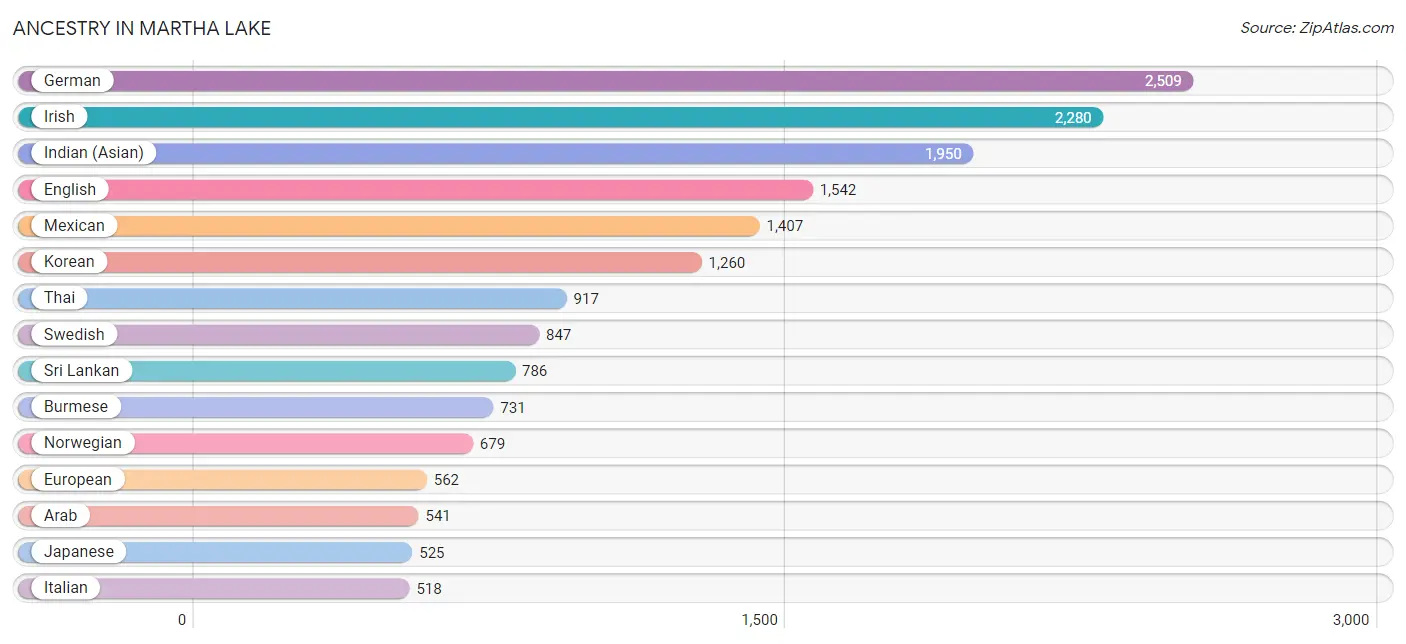
| Ancestry | # Population | % Population |
| African | 123 | 0.5% |
| American | 414 | 1.8% |
| Arab | 541 | 2.3% |
| Armenian | 86 | 0.4% |
| Austrian | 5 | 0.0% |
| Basque | 30 | 0.1% |
| Belgian | 22 | 0.1% |
| Bhutanese | 205 | 0.9% |
| Blackfeet | 43 | 0.2% |
| British | 168 | 0.7% |
| Bulgarian | 181 | 0.8% |
| Burmese | 731 | 3.1% |
| Canadian | 82 | 0.4% |
| Central American | 278 | 1.2% |
| Cherokee | 123 | 0.5% |
| Choctaw | 37 | 0.2% |
| Colombian | 54 | 0.2% |
| Czech | 228 | 1.0% |
| Czechoslovakian | 66 | 0.3% |
| Danish | 168 | 0.7% |
| Dutch | 76 | 0.3% |
| Eastern European | 37 | 0.2% |
| Ecuadorian | 17 | 0.1% |
| Egyptian | 116 | 0.5% |
| English | 1,542 | 6.6% |
| Ethiopian | 41 | 0.2% |
| European | 562 | 2.4% |
| Filipino | 34 | 0.2% |
| Finnish | 417 | 1.8% |
| French | 462 | 2.0% |
| French Canadian | 10 | 0.0% |
| German | 2,509 | 10.8% |
| Greek | 16 | 0.1% |
| Guamanian / Chamorro | 424 | 1.8% |
| Guatemalan | 11 | 0.1% |
| Hungarian | 14 | 0.1% |
| Indian (Asian) | 1,950 | 8.4% |
| Iranian | 140 | 0.6% |
| Iraqi | 11 | 0.1% |
| Irish | 2,280 | 9.8% |
| Italian | 518 | 2.2% |
| Japanese | 525 | 2.3% |
| Korean | 1,260 | 5.4% |
| Laotian | 53 | 0.2% |
| Latvian | 14 | 0.1% |
| Liberian | 56 | 0.2% |
| Lithuanian | 25 | 0.1% |
| Mexican | 1,407 | 6.0% |
| Moroccan | 86 | 0.4% |
| Native Hawaiian | 221 | 0.9% |
| Northern European | 47 | 0.2% |
| Norwegian | 679 | 2.9% |
| Pakistani | 55 | 0.2% |
| Palestinian | 15 | 0.1% |
| Polish | 312 | 1.3% |
| Portuguese | 73 | 0.3% |
| Potawatomi | 22 | 0.1% |
| Puerto Rican | 507 | 2.2% |
| Romanian | 64 | 0.3% |
| Russian | 511 | 2.2% |
| Salvadoran | 267 | 1.1% |
| Samoan | 3 | 0.0% |
| Scandinavian | 254 | 1.1% |
| Scotch-Irish | 114 | 0.5% |
| Scottish | 464 | 2.0% |
| Slovak | 33 | 0.1% |
| Slovene | 15 | 0.1% |
| South American | 89 | 0.4% |
| Spaniard | 101 | 0.4% |
| Sri Lankan | 786 | 3.4% |
| Subsaharan African | 338 | 1.5% |
| Swedish | 847 | 3.6% |
| Swiss | 12 | 0.1% |
| Syrian | 36 | 0.2% |
| Thai | 917 | 3.9% |
| Tlingit-Haida | 190 | 0.8% |
| Tongan | 79 | 0.3% |
| Turkish | 21 | 0.1% |
| Ugandan | 105 | 0.4% |
| Ukrainian | 400 | 1.7% |
| Venezuelan | 18 | 0.1% |
| Welsh | 162 | 0.7% |
| West Indian | 59 | 0.3% |
| Yugoslavian | 17 | 0.1% | View All 84 Rows |
Immigrants in Martha Lake
The most numerous immigrant groups reported in Martha Lake came from Asia (3,953 | 17.0%), South Eastern Asia (1,471 | 6.3%), Eastern Asia (1,170 | 5.0%), Europe (1,161 | 5.0%), and South Central Asia (1,033 | 4.4%), together accounting for 37.8% of all Martha Lake residents.
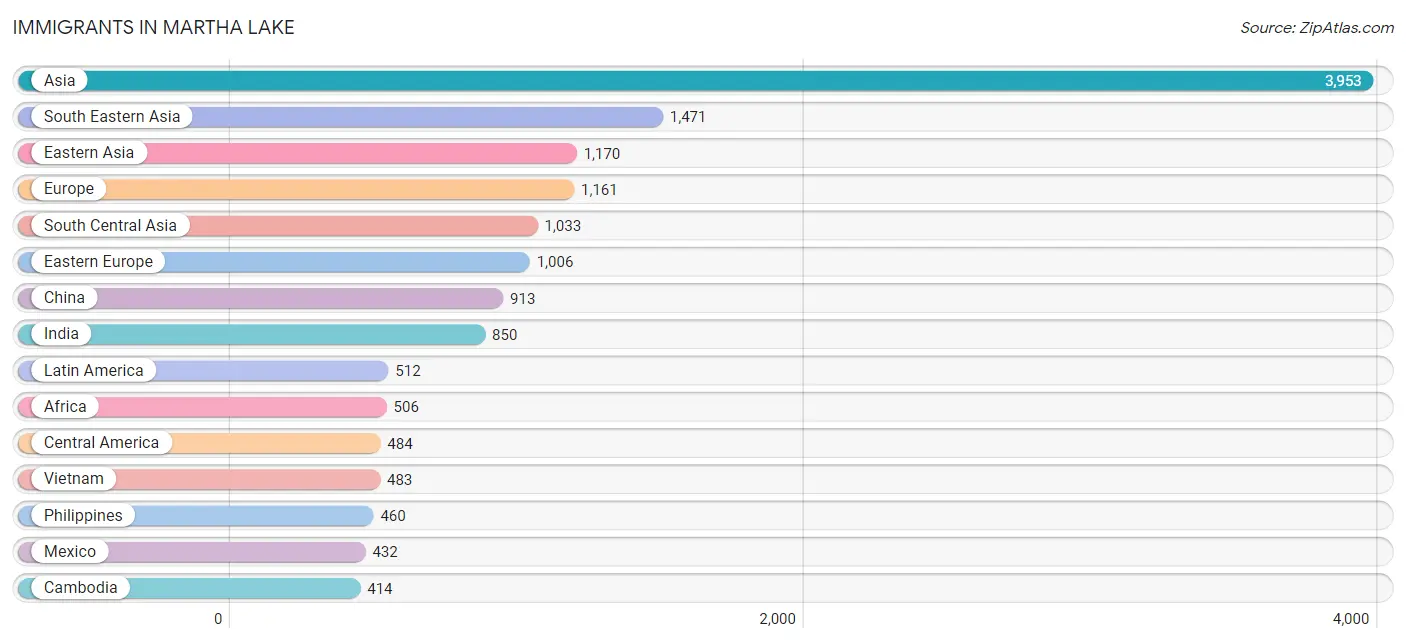
| Immigration Origin | # Population | % Population |
| Africa | 506 | 2.2% |
| Armenia | 14 | 0.1% |
| Asia | 3,953 | 17.0% |
| Belarus | 26 | 0.1% |
| Bosnia and Herzegovina | 17 | 0.1% |
| Brazil | 10 | 0.0% |
| Bulgaria | 129 | 0.5% |
| Cambodia | 414 | 1.8% |
| Canada | 59 | 0.3% |
| Central America | 484 | 2.1% |
| China | 913 | 3.9% |
| Czechoslovakia | 40 | 0.2% |
| Eastern Africa | 161 | 0.7% |
| Eastern Asia | 1,170 | 5.0% |
| Eastern Europe | 1,006 | 4.3% |
| Egypt | 116 | 0.5% |
| El Salvador | 52 | 0.2% |
| England | 11 | 0.1% |
| Ethiopia | 20 | 0.1% |
| Europe | 1,161 | 5.0% |
| Germany | 32 | 0.1% |
| Hong Kong | 75 | 0.3% |
| India | 850 | 3.6% |
| Indonesia | 59 | 0.3% |
| Ireland | 28 | 0.1% |
| Italy | 2 | 0.0% |
| Japan | 53 | 0.2% |
| Jordan | 32 | 0.1% |
| Kazakhstan | 35 | 0.2% |
| Kenya | 23 | 0.1% |
| Korea | 204 | 0.9% |
| Latin America | 512 | 2.2% |
| Latvia | 53 | 0.2% |
| Mexico | 432 | 1.9% |
| Middle Africa | 21 | 0.1% |
| Morocco | 142 | 0.6% |
| Nepal | 42 | 0.2% |
| Northern Africa | 258 | 1.1% |
| Northern Europe | 94 | 0.4% |
| Oceania | 69 | 0.3% |
| Pakistan | 33 | 0.1% |
| Philippines | 460 | 2.0% |
| Poland | 55 | 0.2% |
| Romania | 119 | 0.5% |
| Russia | 87 | 0.4% |
| South America | 28 | 0.1% |
| South Central Asia | 1,033 | 4.4% |
| South Eastern Asia | 1,471 | 6.3% |
| Southern Europe | 2 | 0.0% |
| Sri Lanka | 44 | 0.2% |
| Sweden | 55 | 0.2% |
| Syria | 233 | 1.0% |
| Taiwan | 63 | 0.3% |
| Thailand | 55 | 0.2% |
| Uganda | 105 | 0.4% |
| Ukraine | 397 | 1.7% |
| Uzbekistan | 13 | 0.1% |
| Venezuela | 18 | 0.1% |
| Vietnam | 483 | 2.1% |
| Western Asia | 279 | 1.2% |
| Western Europe | 32 | 0.1% |
| Zaire | 21 | 0.1% | View All 62 Rows |
Sex and Age in Martha Lake
Sex and Age in Martha Lake
The most populous age groups in Martha Lake are 40 to 44 Years (1,291 | 11.0%) for men and 30 to 34 Years (1,157 | 10.1%) for women.
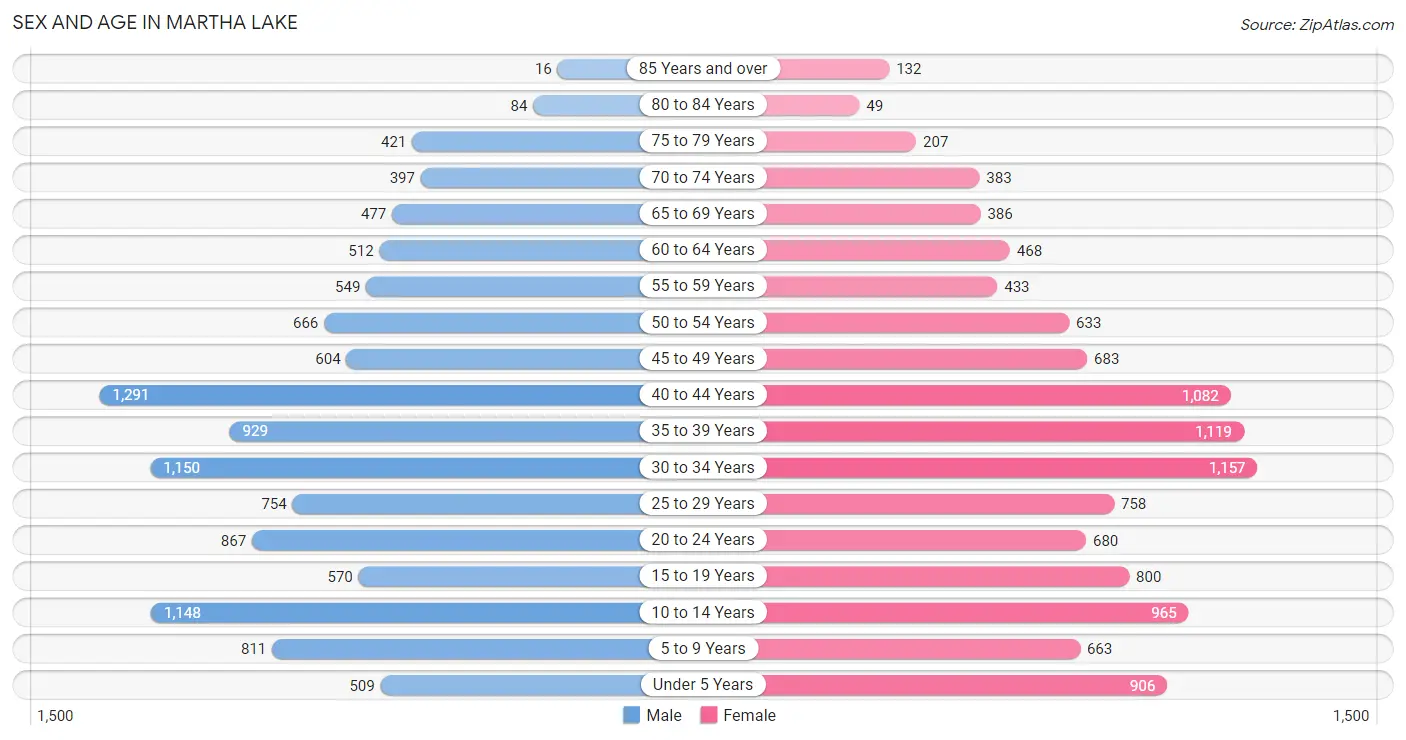
| Age Bracket | Male | Female |
| Under 5 Years | 509 (4.3%) | 906 (7.9%) |
| 5 to 9 Years | 811 (6.9%) | 663 (5.8%) |
| 10 to 14 Years | 1,148 (9.8%) | 965 (8.4%) |
| 15 to 19 Years | 570 (4.9%) | 800 (7.0%) |
| 20 to 24 Years | 867 (7.4%) | 680 (5.9%) |
| 25 to 29 Years | 754 (6.4%) | 758 (6.6%) |
| 30 to 34 Years | 1,150 (9.8%) | 1,157 (10.1%) |
| 35 to 39 Years | 929 (7.9%) | 1,119 (9.7%) |
| 40 to 44 Years | 1,291 (11.0%) | 1,082 (9.4%) |
| 45 to 49 Years | 604 (5.1%) | 683 (5.9%) |
| 50 to 54 Years | 666 (5.7%) | 633 (5.5%) |
| 55 to 59 Years | 549 (4.7%) | 433 (3.8%) |
| 60 to 64 Years | 512 (4.4%) | 468 (4.1%) |
| 65 to 69 Years | 477 (4.1%) | 386 (3.4%) |
| 70 to 74 Years | 397 (3.4%) | 383 (3.3%) |
| 75 to 79 Years | 421 (3.6%) | 207 (1.8%) |
| 80 to 84 Years | 84 (0.7%) | 49 (0.4%) |
| 85 Years and over | 16 (0.1%) | 132 (1.1%) |
| Total | 11,755 (100.0%) | 11,504 (100.0%) |
Families and Households in Martha Lake
Median Family Size in Martha Lake
The median family size in Martha Lake is 3.37 persons per family, with married-couple families (4,839 | 83.5%) accounting for the largest median family size of 3.43 persons per family. On the other hand, single male/father families (300 | 5.2%) represent the smallest median family size with 2.92 persons per family.
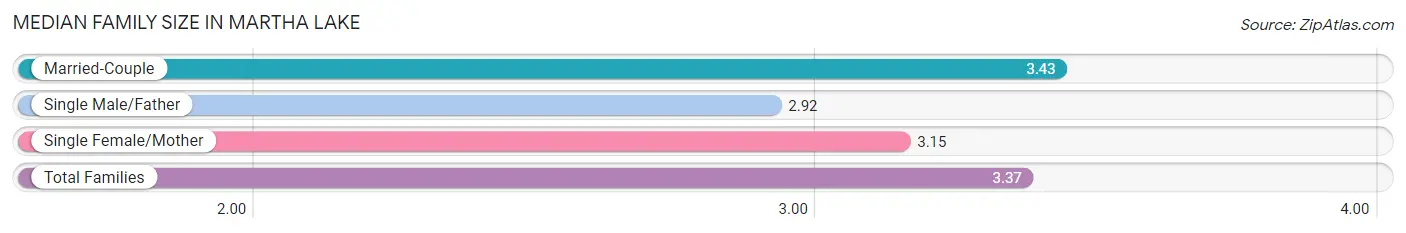
| Family Type | # Families | Family Size |
| Married-Couple | 4,839 (83.5%) | 3.43 |
| Single Male/Father | 300 (5.2%) | 2.92 |
| Single Female/Mother | 656 (11.3%) | 3.15 |
| Total Families | 5,795 (100.0%) | 3.37 |
Median Household Size in Martha Lake
The median household size in Martha Lake is 2.91 persons per household, with married-couple households (4,839 | 60.8%) accounting for the largest median household size of 3.49 persons per household. non-family households (2,171 | 27.3%) represent the smallest median household size with 1.42 persons per household.
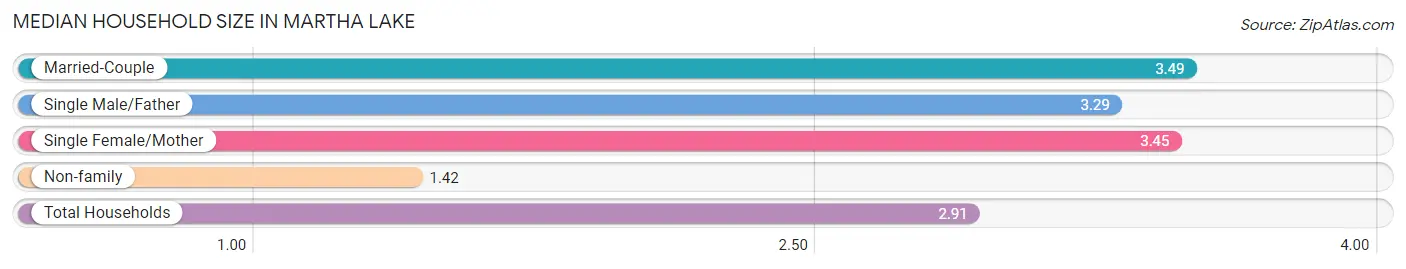
| Household Type | # Households | Household Size |
| Married-Couple | 4,839 (60.8%) | 3.49 |
| Single Male/Father | 300 (3.8%) | 3.29 |
| Single Female/Mother | 656 (8.2%) | 3.45 |
| Non-family | 2,171 (27.3%) | 1.42 |
| Total Households | 7,966 (100.0%) | 2.91 |
Household Size by Marriage Status in Martha Lake
Out of a total of 7,966 households in Martha Lake, 5,795 (72.8%) are family households, while 2,171 (27.3%) are nonfamily households. The most numerous type of family households are 2-person households, comprising 2,080, and the most common type of nonfamily households are 1-person households, comprising 1,299.
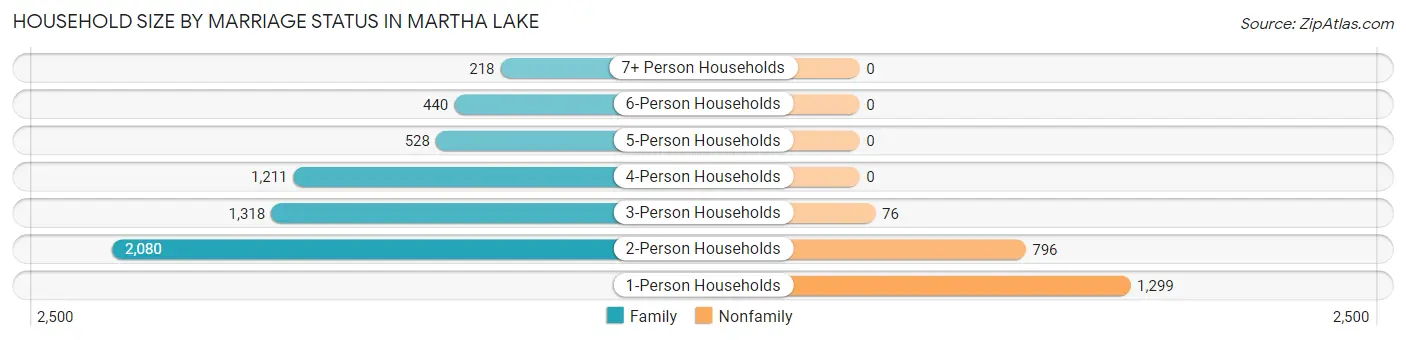
| Household Size | Family Households | Nonfamily Households |
| 1-Person Households | - | 1,299 (16.3%) |
| 2-Person Households | 2,080 (26.1%) | 796 (10.0%) |
| 3-Person Households | 1,318 (16.6%) | 76 (0.9%) |
| 4-Person Households | 1,211 (15.2%) | 0 (0.0%) |
| 5-Person Households | 528 (6.6%) | 0 (0.0%) |
| 6-Person Households | 440 (5.5%) | 0 (0.0%) |
| 7+ Person Households | 218 (2.7%) | 0 (0.0%) |
| Total | 5,795 (72.8%) | 2,171 (27.3%) |
Female Fertility in Martha Lake
Fertility by Age in Martha Lake
Average fertility rate in Martha Lake is 34.0 births per 1,000 women. Women in the age bracket of 20 to 34 years have the highest fertility rate with 55.0 births per 1,000 women. Women in the age bracket of 20 to 34 years acount for 65.7% of all women with births.
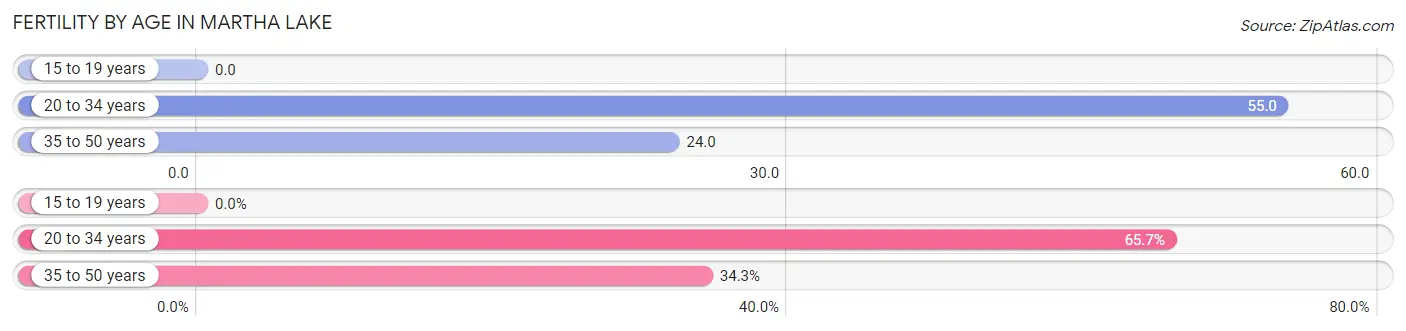
| Age Bracket | Women with Births | Births / 1,000 Women |
| 15 to 19 years | 0 (0.0%) | 0.0 |
| 20 to 34 years | 142 (65.7%) | 55.0 |
| 35 to 50 years | 74 (34.3%) | 24.0 |
| Total | 216 (100.0%) | 34.0 |
Fertility by Age by Marriage Status in Martha Lake
88.4% of women with births (216) in Martha Lake are married. The highest percentage of unmarried women with births falls into 35 to 50 years age bracket with 33.8% of them unmarried at the time of birth, while the lowest percentage of unmarried women with births belong to 20 to 34 years age bracket with 0.0% of them unmarried.
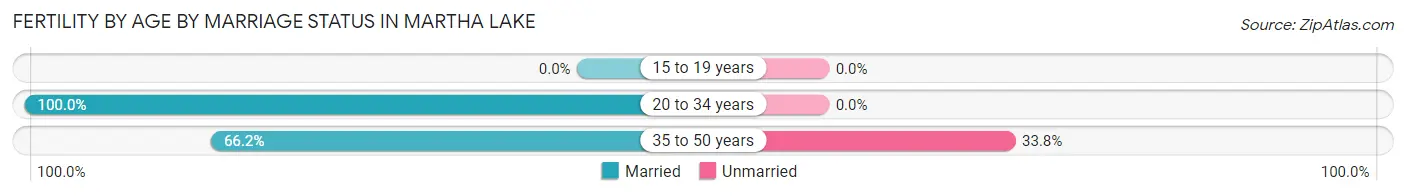
| Age Bracket | Married | Unmarried |
| 15 to 19 years | 0 (0.0%) | 0 (0.0%) |
| 20 to 34 years | 142 (100.0%) | 0 (0.0%) |
| 35 to 50 years | 49 (66.2%) | 25 (33.8%) |
| Total | 191 (88.4%) | 25 (11.6%) |
Fertility by Education in Martha Lake
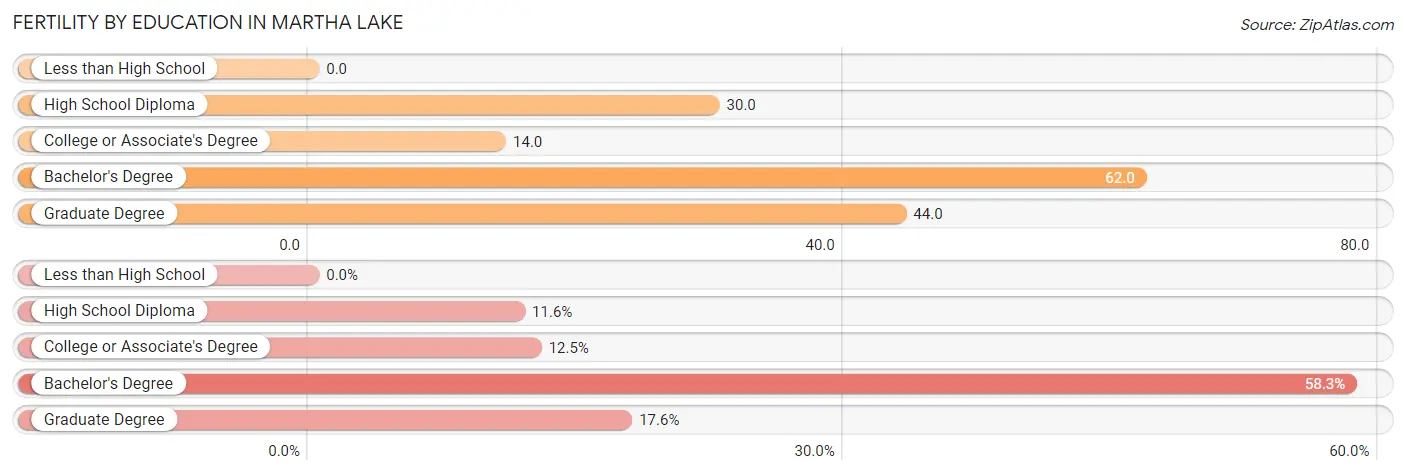
| Educational Attainment | Women with Births | Births / 1,000 Women |
| Less than High School | 0 (0.0%) | 0.0 |
| High School Diploma | 25 (11.6%) | 30.0 |
| College or Associate's Degree | 27 (12.5%) | 14.0 |
| Bachelor's Degree | 126 (58.3%) | 62.0 |
| Graduate Degree | 38 (17.6%) | 44.0 |
| Total | 216 (100.0%) | 34.0 |
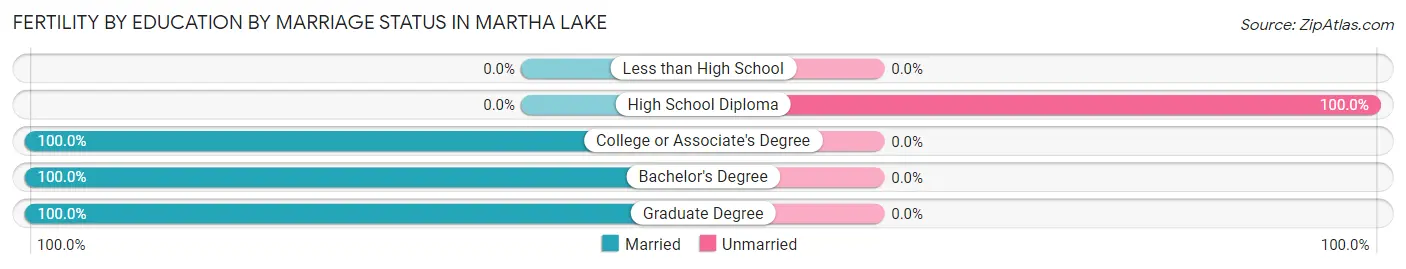
Fertility by Education by Marriage Status in Martha Lake
11.6% of women with births in Martha Lake are unmarried. Women with the educational attainment of college or associate's degree are most likely to be married with 100.0% of them married at childbirth, while women with the educational attainment of high school diploma are least likely to be married with 100.0% of them unmarried at childbirth.
| Educational Attainment | Married | Unmarried |
| Less than High School | 0 (0.0%) | 0 (0.0%) |
| High School Diploma | 0 (0.0%) | 25 (100.0%) |
| College or Associate's Degree | 27 (100.0%) | 0 (0.0%) |
| Bachelor's Degree | 126 (100.0%) | 0 (0.0%) |
| Graduate Degree | 38 (100.0%) | 0 (0.0%) |
| Total | 191 (88.4%) | 25 (11.6%) |
Employment Characteristics in Martha Lake
Employment by Class of Employer in Martha Lake
Among the 12,565 employed individuals in Martha Lake, private company employees (9,040 | 72.0%), not-for-profit organizations (1,163 | 9.3%), and local government employees (761 | 6.1%) make up the most common classes of employment.
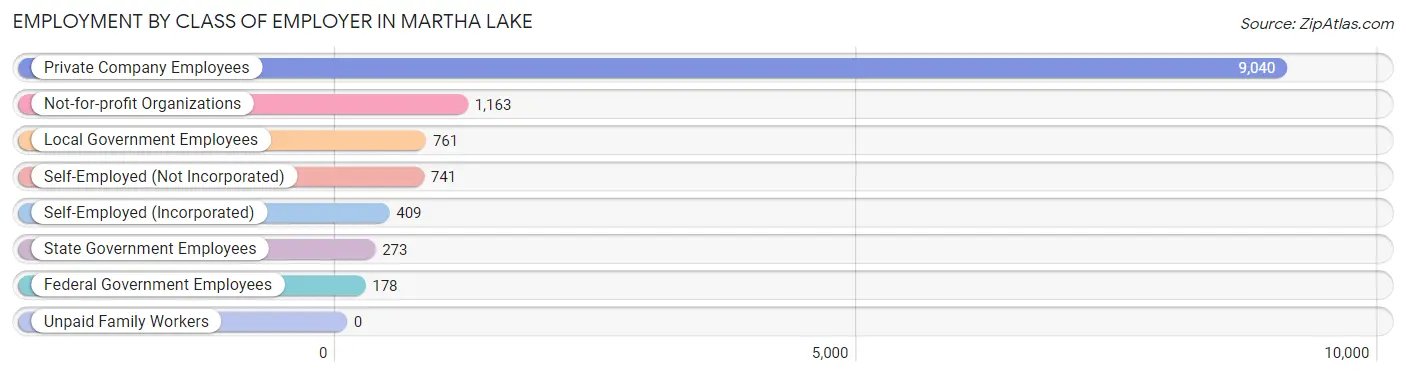
| Employer Class | # Employees | % Employees |
| Private Company Employees | 9,040 | 72.0% |
| Self-Employed (Incorporated) | 409 | 3.3% |
| Self-Employed (Not Incorporated) | 741 | 5.9% |
| Not-for-profit Organizations | 1,163 | 9.3% |
| Local Government Employees | 761 | 6.1% |
| State Government Employees | 273 | 2.2% |
| Federal Government Employees | 178 | 1.4% |
| Unpaid Family Workers | 0 | 0.0% |
| Total | 12,565 | 100.0% |
Employment Status by Age in Martha Lake
According to the labor force statistics for Martha Lake, out of the total population over 16 years of age (18,022), 74.7% or 13,462 individuals are in the labor force, with 4.4% or 592 of them unemployed. The age group with the highest labor force participation rate is 30 to 34 years, with 92.8% or 2,141 individuals in the labor force. Within the labor force, the 75 years and over age range has the highest percentage of unemployed individuals, with 17.3% or 17 of them being unemployed.
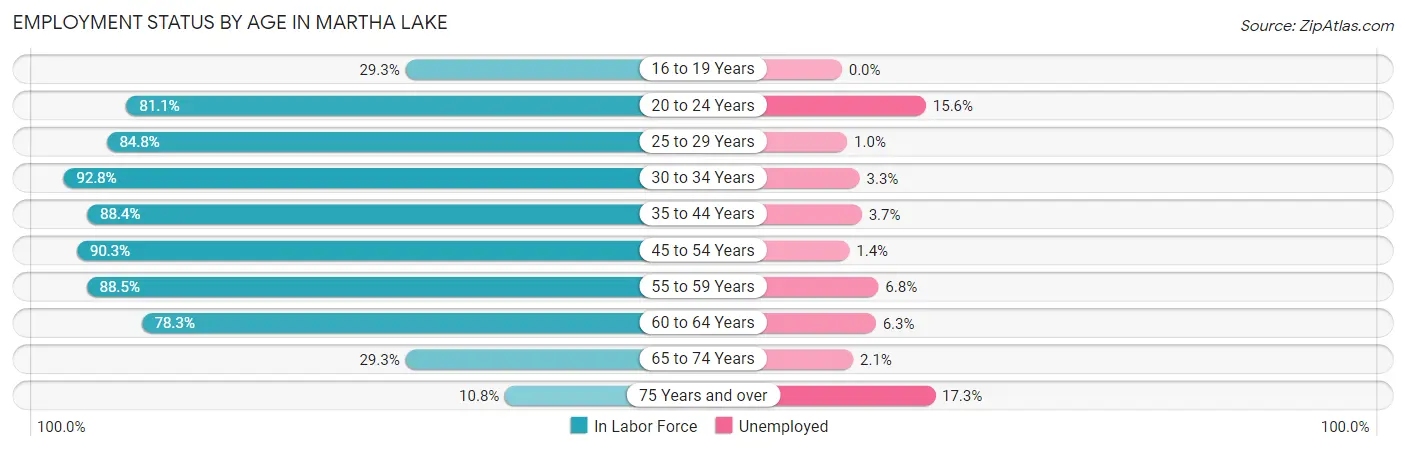
| Age Bracket | In Labor Force | Unemployed |
| 16 to 19 Years | 333 (29.3%) | 0 (0.0%) |
| 20 to 24 Years | 1,255 (81.1%) | 196 (15.6%) |
| 25 to 29 Years | 1,282 (84.8%) | 13 (1.0%) |
| 30 to 34 Years | 2,141 (92.8%) | 71 (3.3%) |
| 35 to 44 Years | 3,908 (88.4%) | 145 (3.7%) |
| 45 to 54 Years | 2,335 (90.3%) | 33 (1.4%) |
| 55 to 59 Years | 869 (88.5%) | 59 (6.8%) |
| 60 to 64 Years | 767 (78.3%) | 48 (6.3%) |
| 65 to 74 Years | 481 (29.3%) | 10 (2.1%) |
| 75 Years and over | 98 (10.8%) | 17 (17.3%) |
| Total | 13,462 (74.7%) | 592 (4.4%) |
Employment Status by Educational Attainment in Martha Lake
According to labor force statistics for Martha Lake, 88.4% of individuals (11,305) out of the total population between 25 and 64 years of age (12,788) are in the labor force, with 3.3% or 373 of them being unemployed. The group with the highest labor force participation rate are those with the educational attainment of bachelor's degree or higher, with 91.8% or 5,601 individuals in the labor force. Within the labor force, individuals with high school diploma education have the highest percentage of unemployment, with 11.2% or 193 of them being unemployed.
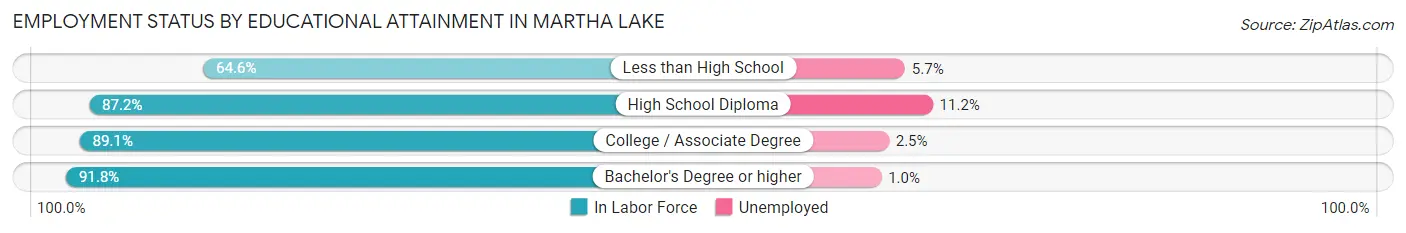
| Educational Attainment | In Labor Force | Unemployed |
| Less than High School | 597 (64.6%) | 53 (5.7%) |
| High School Diploma | 1,722 (87.2%) | 221 (11.2%) |
| College / Associate Degree | 3,375 (89.1%) | 95 (2.5%) |
| Bachelor's Degree or higher | 5,601 (91.8%) | 61 (1.0%) |
| Total | 11,305 (88.4%) | 422 (3.3%) |
Employment Occupations by Sex in Martha Lake
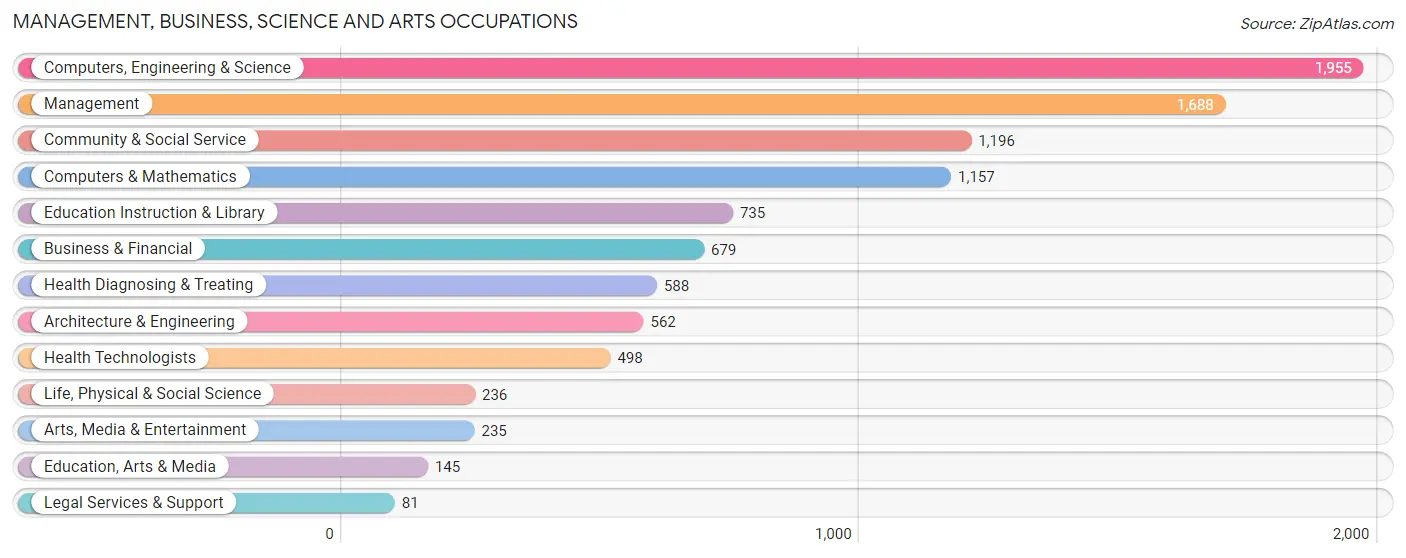
Management, Business, Science and Arts Occupations
The most common Management, Business, Science and Arts occupations in Martha Lake are Computers, Engineering & Science (1,955 | 15.3%), Management (1,688 | 13.2%), Community & Social Service (1,196 | 9.3%), Computers & Mathematics (1,157 | 9.0%), and Education Instruction & Library (735 | 5.7%).
Management, Business, Science and Arts Occupations by Sex
Within the Management, Business, Science and Arts occupations in Martha Lake, the most male-oriented occupations are Architecture & Engineering (88.4%), Computers & Mathematics (78.3%), and Computers, Engineering & Science (75.9%), while the most female-oriented occupations are Legal Services & Support (90.1%), Health Technologists (89.8%), and Health Diagnosing & Treating (87.8%).
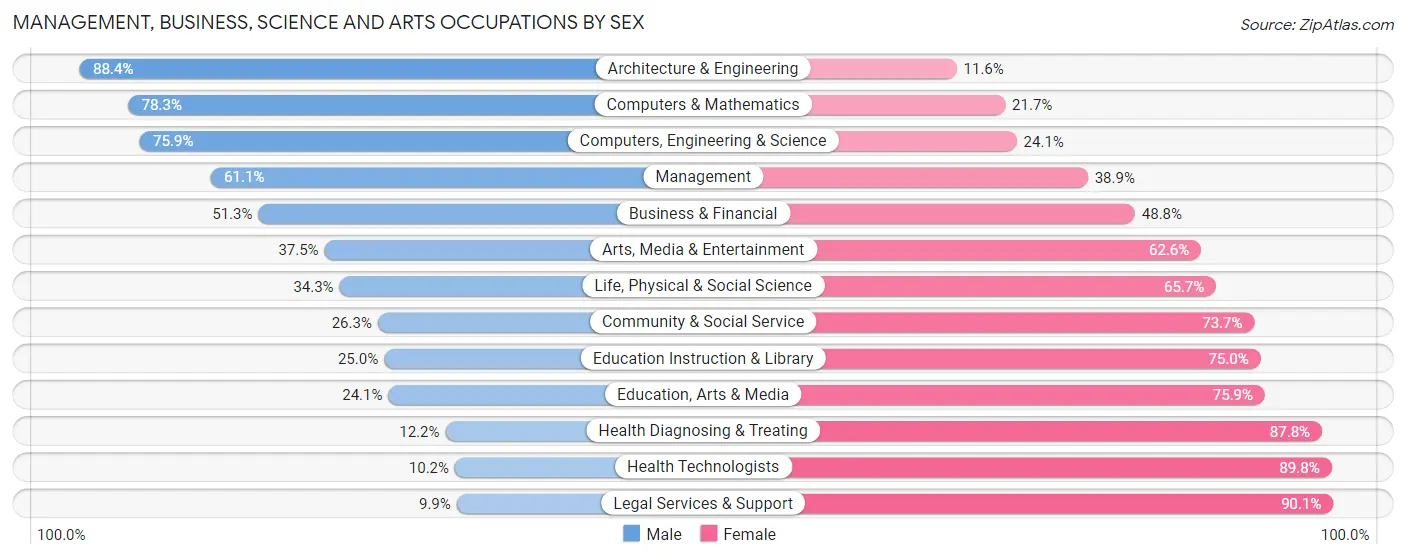
| Occupation | Male | Female |
| Management | 1,031 (61.1%) | 657 (38.9%) |
| Business & Financial | 348 (51.2%) | 331 (48.7%) |
| Computers, Engineering & Science | 1,484 (75.9%) | 471 (24.1%) |
| Computers & Mathematics | 906 (78.3%) | 251 (21.7%) |
| Architecture & Engineering | 497 (88.4%) | 65 (11.6%) |
| Life, Physical & Social Science | 81 (34.3%) | 155 (65.7%) |
| Community & Social Service | 315 (26.3%) | 881 (73.7%) |
| Education, Arts & Media | 35 (24.1%) | 110 (75.9%) |
| Legal Services & Support | 8 (9.9%) | 73 (90.1%) |
| Education Instruction & Library | 184 (25.0%) | 551 (75.0%) |
| Arts, Media & Entertainment | 88 (37.4%) | 147 (62.5%) |
| Health Diagnosing & Treating | 72 (12.2%) | 516 (87.8%) |
| Health Technologists | 51 (10.2%) | 447 (89.8%) |
| Total (Category) | 3,250 (53.2%) | 2,856 (46.8%) |
| Total (Overall) | 6,944 (54.2%) | 5,863 (45.8%) |
Services Occupations
The most common Services occupations in Martha Lake are Healthcare Support (559 | 4.4%), Food Preparation & Serving (439 | 3.4%), Cleaning & Maintenance (292 | 2.3%), Personal Care & Service (189 | 1.5%), and Security & Protection (143 | 1.1%).
Services Occupations by Sex
Within the Services occupations in Martha Lake, the most male-oriented occupations are Law Enforcement (100.0%), Security & Protection (88.8%), and Firefighting & Prevention (82.0%), while the most female-oriented occupations are Personal Care & Service (87.8%), Healthcare Support (84.1%), and Food Preparation & Serving (53.8%).
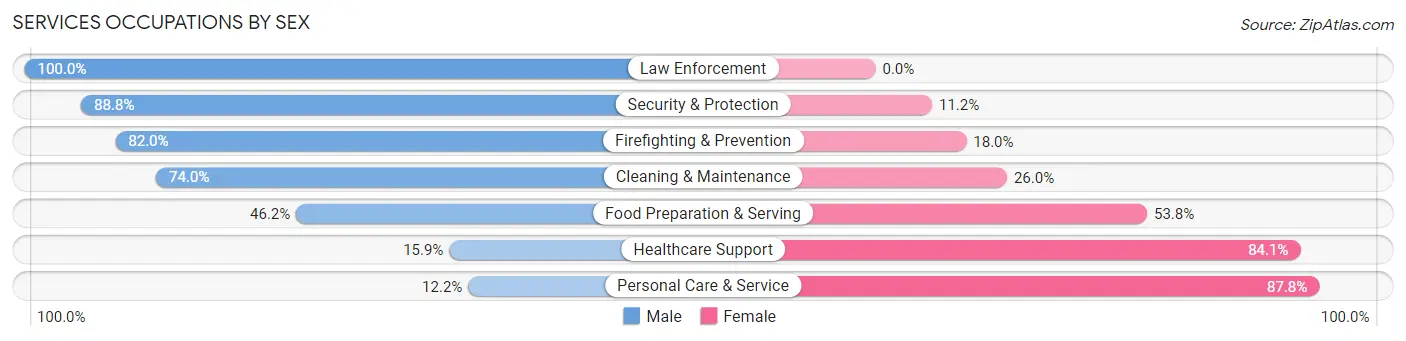
| Occupation | Male | Female |
| Healthcare Support | 89 (15.9%) | 470 (84.1%) |
| Security & Protection | 127 (88.8%) | 16 (11.2%) |
| Firefighting & Prevention | 73 (82.0%) | 16 (18.0%) |
| Law Enforcement | 54 (100.0%) | 0 (0.0%) |
| Food Preparation & Serving | 203 (46.2%) | 236 (53.8%) |
| Cleaning & Maintenance | 216 (74.0%) | 76 (26.0%) |
| Personal Care & Service | 23 (12.2%) | 166 (87.8%) |
| Total (Category) | 658 (40.6%) | 964 (59.4%) |
| Total (Overall) | 6,944 (54.2%) | 5,863 (45.8%) |
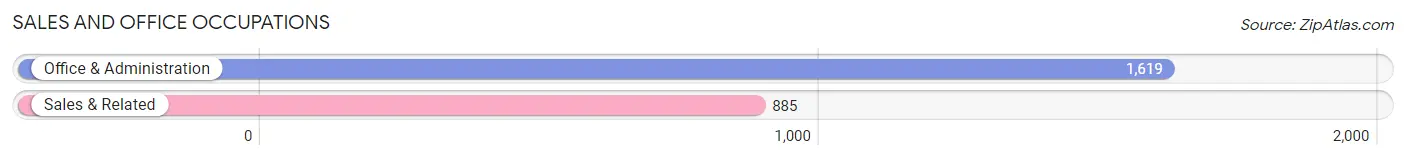
Sales and Office Occupations
The most common Sales and Office occupations in Martha Lake are Office & Administration (1,619 | 12.6%), and Sales & Related (885 | 6.9%).
Sales and Office Occupations by Sex
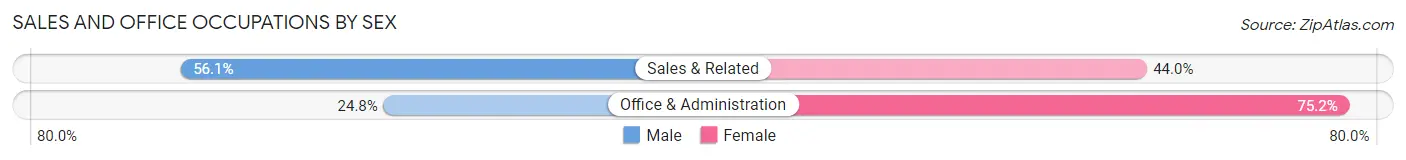
| Occupation | Male | Female |
| Sales & Related | 496 (56.0%) | 389 (44.0%) |
| Office & Administration | 401 (24.8%) | 1,218 (75.2%) |
| Total (Category) | 897 (35.8%) | 1,607 (64.2%) |
| Total (Overall) | 6,944 (54.2%) | 5,863 (45.8%) |
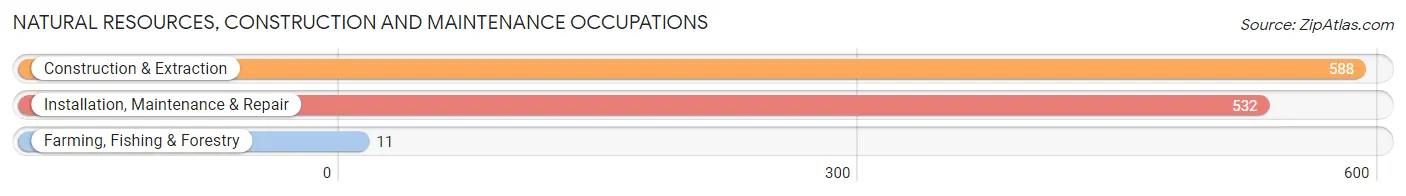
Natural Resources, Construction and Maintenance Occupations
The most common Natural Resources, Construction and Maintenance occupations in Martha Lake are Construction & Extraction (588 | 4.6%), Installation, Maintenance & Repair (532 | 4.2%), and Farming, Fishing & Forestry (11 | 0.1%).
Natural Resources, Construction and Maintenance Occupations by Sex
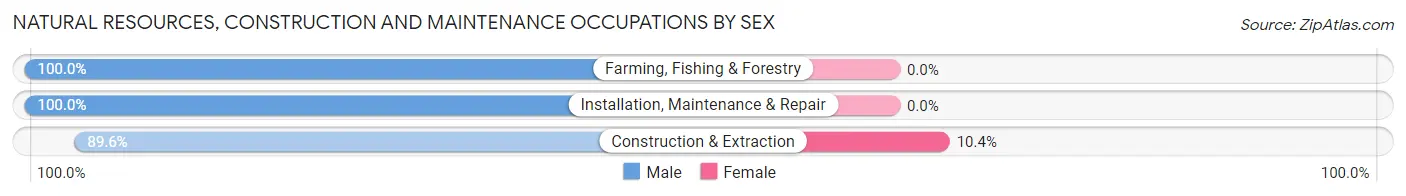
| Occupation | Male | Female |
| Farming, Fishing & Forestry | 11 (100.0%) | 0 (0.0%) |
| Construction & Extraction | 527 (89.6%) | 61 (10.4%) |
| Installation, Maintenance & Repair | 532 (100.0%) | 0 (0.0%) |
| Total (Category) | 1,070 (94.6%) | 61 (5.4%) |
| Total (Overall) | 6,944 (54.2%) | 5,863 (45.8%) |
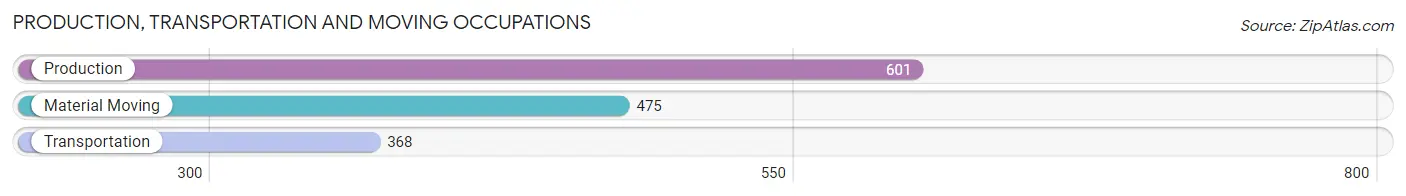
Production, Transportation and Moving Occupations
The most common Production, Transportation and Moving occupations in Martha Lake are Production (601 | 4.7%), Material Moving (475 | 3.7%), and Transportation (368 | 2.9%).
Production, Transportation and Moving Occupations by Sex
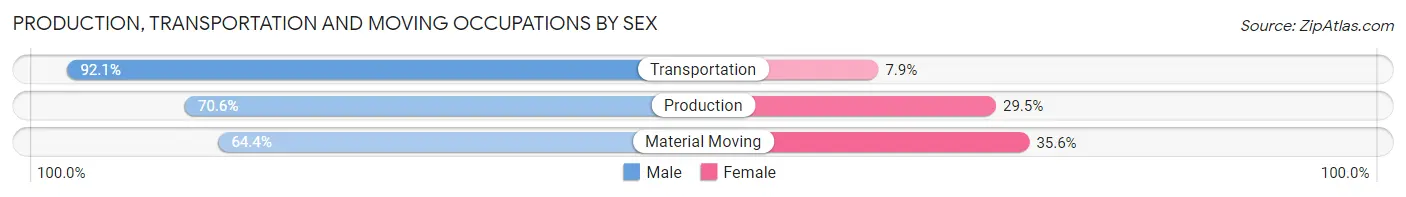
| Occupation | Male | Female |
| Production | 424 (70.6%) | 177 (29.4%) |
| Transportation | 339 (92.1%) | 29 (7.9%) |
| Material Moving | 306 (64.4%) | 169 (35.6%) |
| Total (Category) | 1,069 (74.0%) | 375 (26.0%) |
| Total (Overall) | 6,944 (54.2%) | 5,863 (45.8%) |
Employment Industries by Sex in Martha Lake
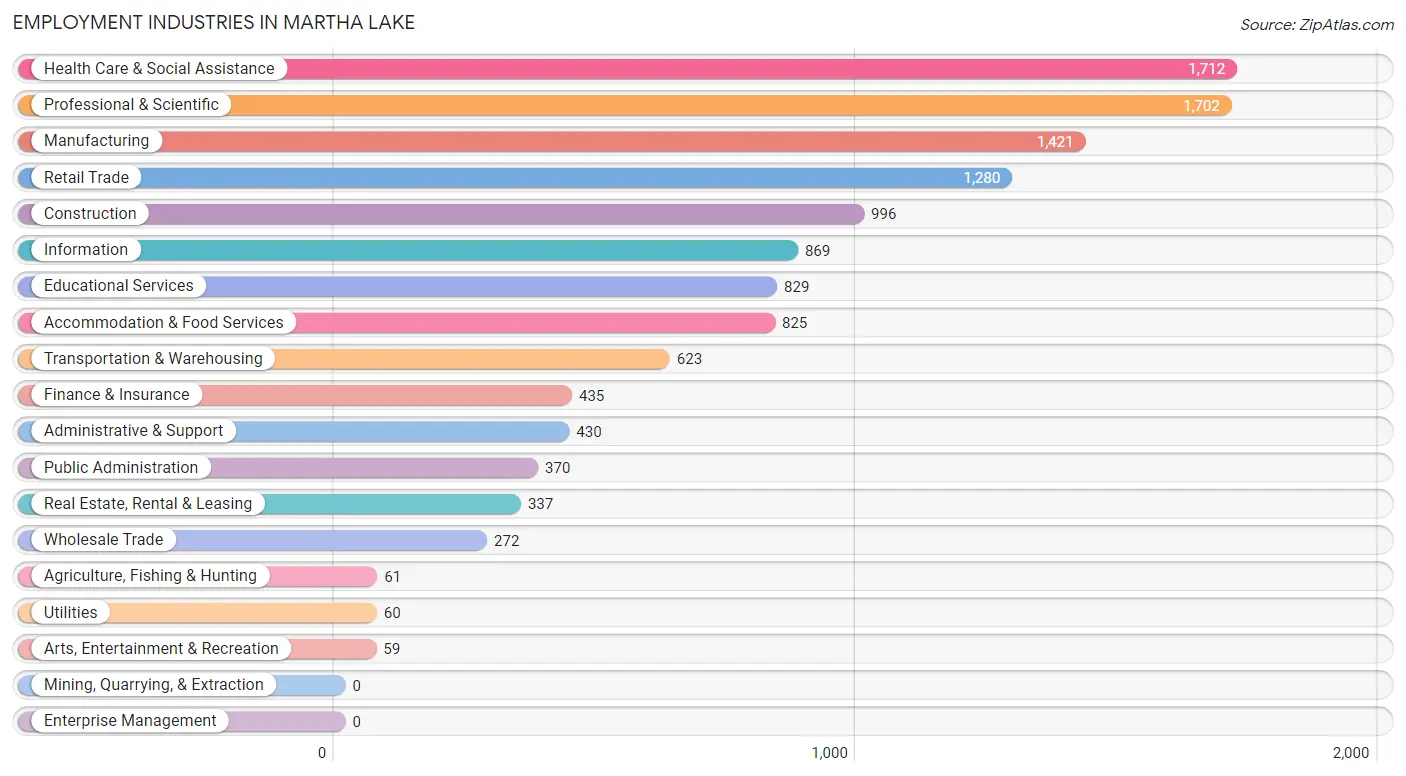
Employment Industries in Martha Lake
The major employment industries in Martha Lake include Health Care & Social Assistance (1,712 | 13.4%), Professional & Scientific (1,702 | 13.3%), Manufacturing (1,421 | 11.1%), Retail Trade (1,280 | 10.0%), and Construction (996 | 7.8%).
Employment Industries by Sex in Martha Lake
The Martha Lake industries that see more men than women are Agriculture, Fishing & Hunting (100.0%), Wholesale Trade (91.2%), and Construction (82.4%), whereas the industries that tend to have a higher number of women are Health Care & Social Assistance (92.2%), Finance & Insurance (72.6%), and Educational Services (63.8%).
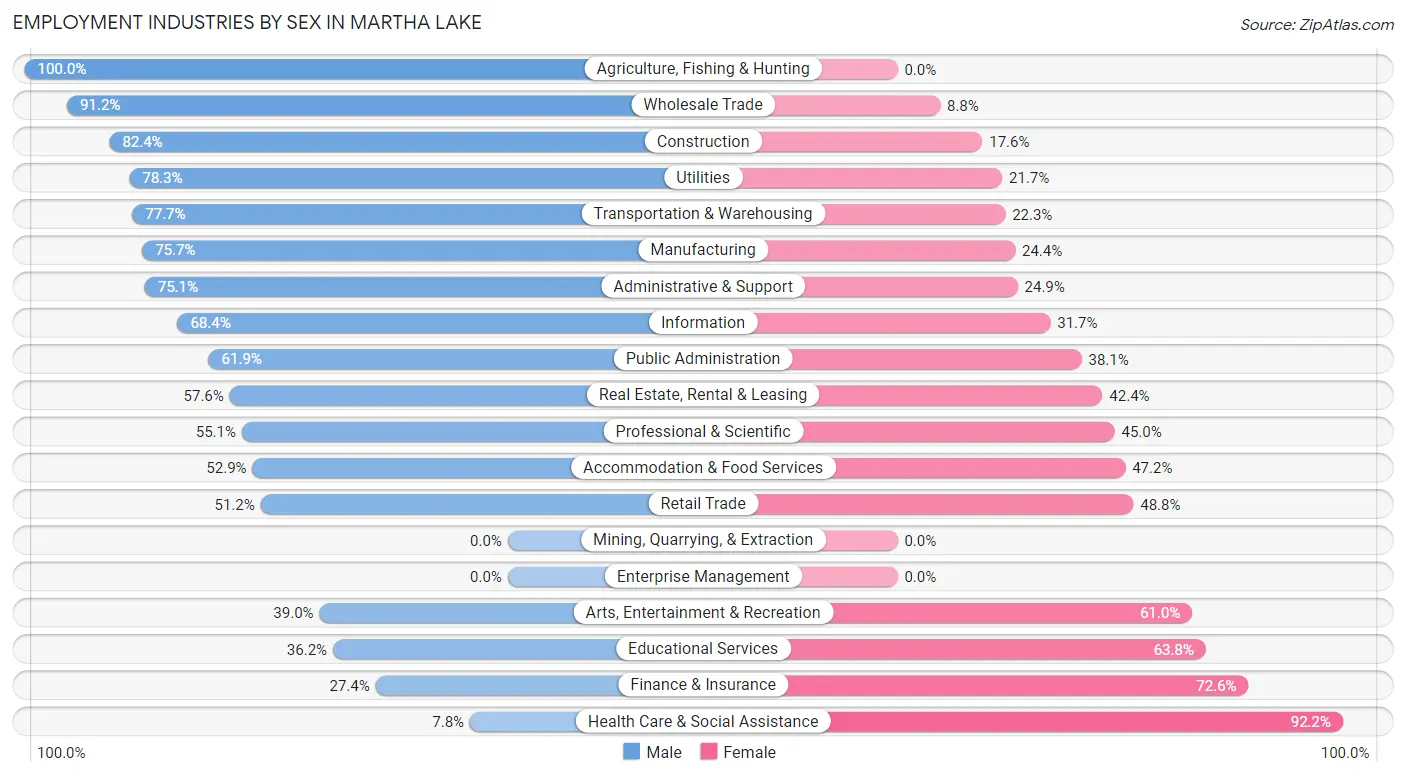
| Industry | Male | Female |
| Agriculture, Fishing & Hunting | 61 (100.0%) | 0 (0.0%) |
| Mining, Quarrying, & Extraction | 0 (0.0%) | 0 (0.0%) |
| Construction | 821 (82.4%) | 175 (17.6%) |
| Manufacturing | 1,075 (75.6%) | 346 (24.3%) |
| Wholesale Trade | 248 (91.2%) | 24 (8.8%) |
| Retail Trade | 655 (51.2%) | 625 (48.8%) |
| Transportation & Warehousing | 484 (77.7%) | 139 (22.3%) |
| Utilities | 47 (78.3%) | 13 (21.7%) |
| Information | 594 (68.3%) | 275 (31.7%) |
| Finance & Insurance | 119 (27.4%) | 316 (72.6%) |
| Real Estate, Rental & Leasing | 194 (57.6%) | 143 (42.4%) |
| Professional & Scientific | 937 (55.0%) | 765 (45.0%) |
| Enterprise Management | 0 (0.0%) | 0 (0.0%) |
| Administrative & Support | 323 (75.1%) | 107 (24.9%) |
| Educational Services | 300 (36.2%) | 529 (63.8%) |
| Health Care & Social Assistance | 134 (7.8%) | 1,578 (92.2%) |
| Arts, Entertainment & Recreation | 23 (39.0%) | 36 (61.0%) |
| Accommodation & Food Services | 436 (52.8%) | 389 (47.1%) |
| Public Administration | 229 (61.9%) | 141 (38.1%) |
| Total | 6,944 (54.2%) | 5,863 (45.8%) |
Education in Martha Lake
School Enrollment in Martha Lake
The most common levels of schooling among the 5,928 students in Martha Lake are middle school (1,937 | 32.7%), elementary school (1,188 | 20.0%), and high school (974 | 16.4%).
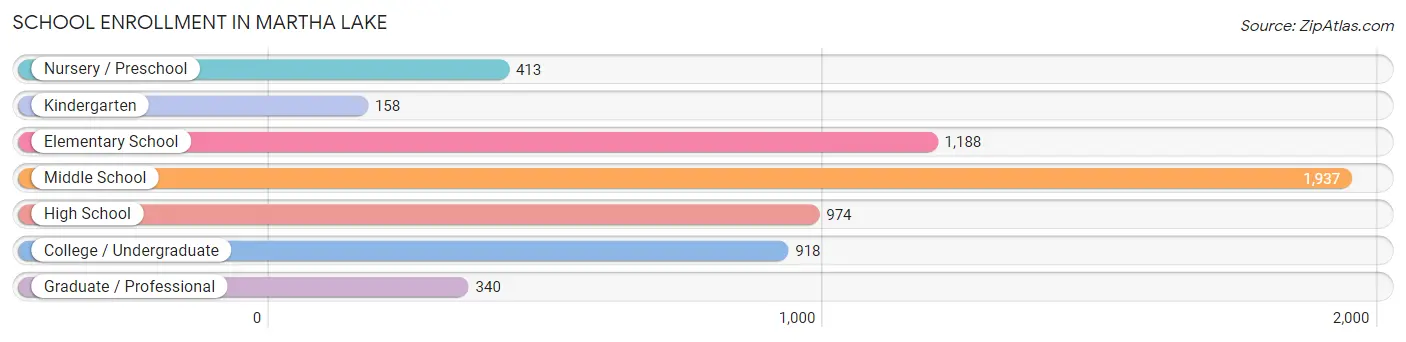
| School Level | # Students | % Students |
| Nursery / Preschool | 413 | 7.0% |
| Kindergarten | 158 | 2.7% |
| Elementary School | 1,188 | 20.0% |
| Middle School | 1,937 | 32.7% |
| High School | 974 | 16.4% |
| College / Undergraduate | 918 | 15.5% |
| Graduate / Professional | 340 | 5.7% |
| Total | 5,928 | 100.0% |
School Enrollment by Age by Funding Source in Martha Lake
Out of a total of 5,928 students who are enrolled in schools in Martha Lake, 1,067 (18.0%) attend a private institution, while the remaining 4,861 (82.0%) are enrolled in public schools. The age group of 3 to 4 year olds has the highest likelihood of being enrolled in private schools, with 301 (90.7% in the age bracket) enrolled. Conversely, the age group of 18 to 19 year olds has the lowest likelihood of being enrolled in a private school, with 337 (94.7% in the age bracket) attending a public institution.
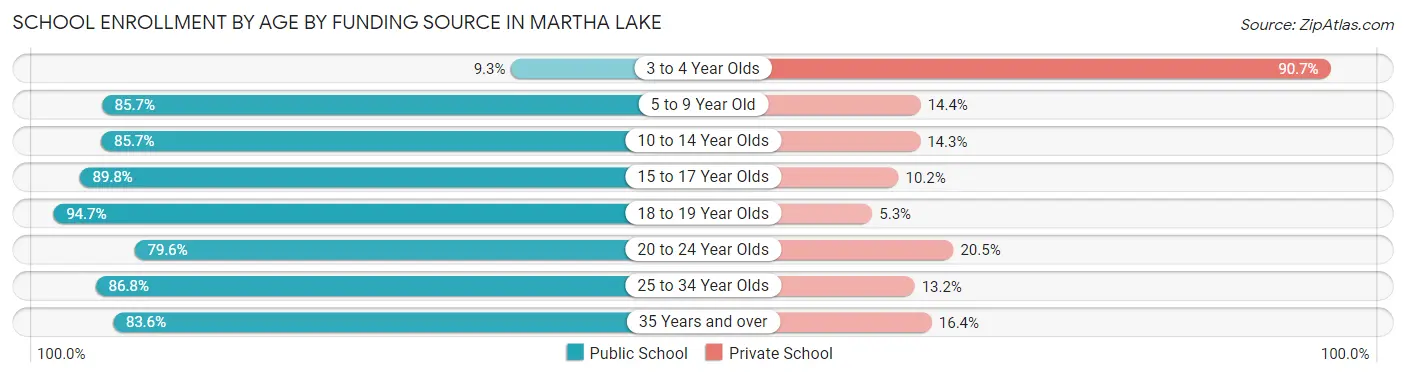
| Age Bracket | Public School | Private School |
| 3 to 4 Year Olds | 31 (9.3%) | 301 (90.7%) |
| 5 to 9 Year Old | 1,152 (85.7%) | 193 (14.3%) |
| 10 to 14 Year Olds | 1,780 (85.7%) | 296 (14.3%) |
| 15 to 17 Year Olds | 703 (89.8%) | 80 (10.2%) |
| 18 to 19 Year Olds | 337 (94.7%) | 19 (5.3%) |
| 20 to 24 Year Olds | 354 (79.5%) | 91 (20.4%) |
| 25 to 34 Year Olds | 328 (86.8%) | 50 (13.2%) |
| 35 Years and over | 178 (83.6%) | 35 (16.4%) |
| Total | 4,861 (82.0%) | 1,067 (18.0%) |
Educational Attainment by Field of Study in Martha Lake
Business (1,229 | 16.4%), engineering (1,066 | 14.2%), science & technology (899 | 12.0%), computers & mathematics (777 | 10.4%), and bio, nature & agricultural (464 | 6.2%) are the most common fields of study among 7,486 individuals in Martha Lake who have obtained a bachelor's degree or higher.
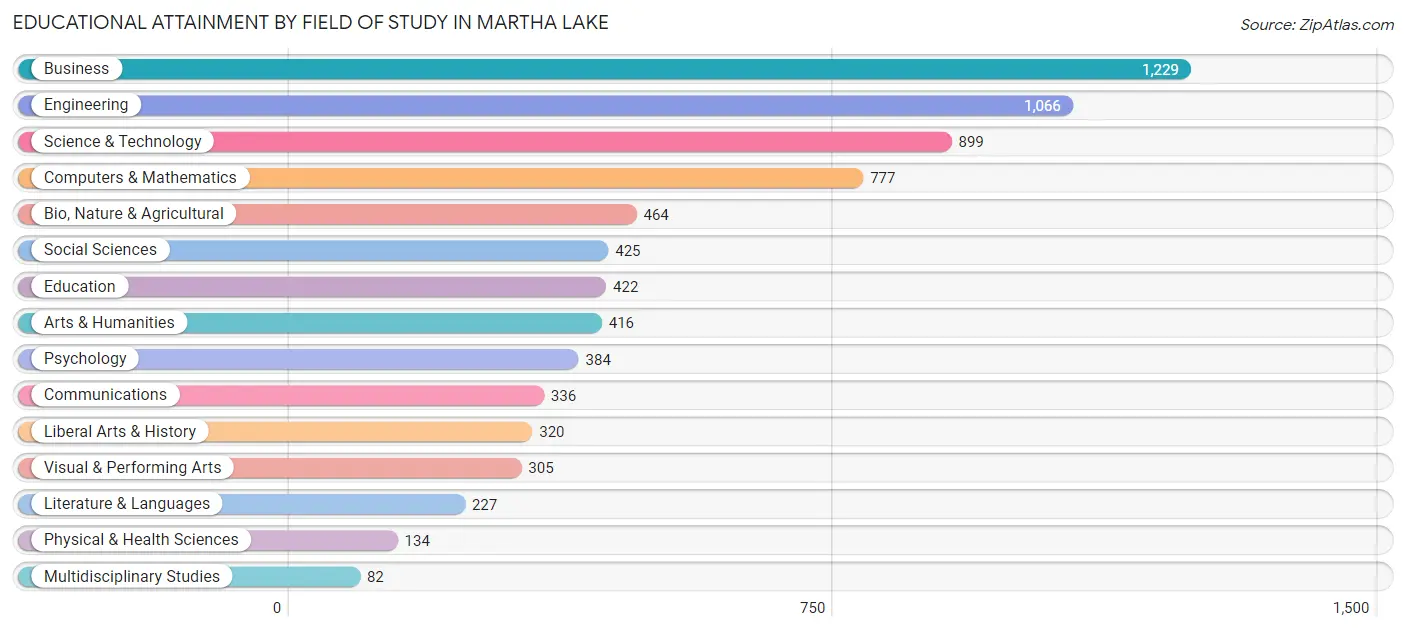
| Field of Study | # Graduates | % Graduates |
| Computers & Mathematics | 777 | 10.4% |
| Bio, Nature & Agricultural | 464 | 6.2% |
| Physical & Health Sciences | 134 | 1.8% |
| Psychology | 384 | 5.1% |
| Social Sciences | 425 | 5.7% |
| Engineering | 1,066 | 14.2% |
| Multidisciplinary Studies | 82 | 1.1% |
| Science & Technology | 899 | 12.0% |
| Business | 1,229 | 16.4% |
| Education | 422 | 5.6% |
| Literature & Languages | 227 | 3.0% |
| Liberal Arts & History | 320 | 4.3% |
| Visual & Performing Arts | 305 | 4.1% |
| Communications | 336 | 4.5% |
| Arts & Humanities | 416 | 5.6% |
| Total | 7,486 | 100.0% |
Transportation & Commute in Martha Lake
Vehicle Availability by Sex in Martha Lake
The most prevalent vehicle ownership categories in Martha Lake are males with 2 vehicles (3,416, accounting for 49.9%) and females with 2 vehicles (3,025, making up 59.7%).
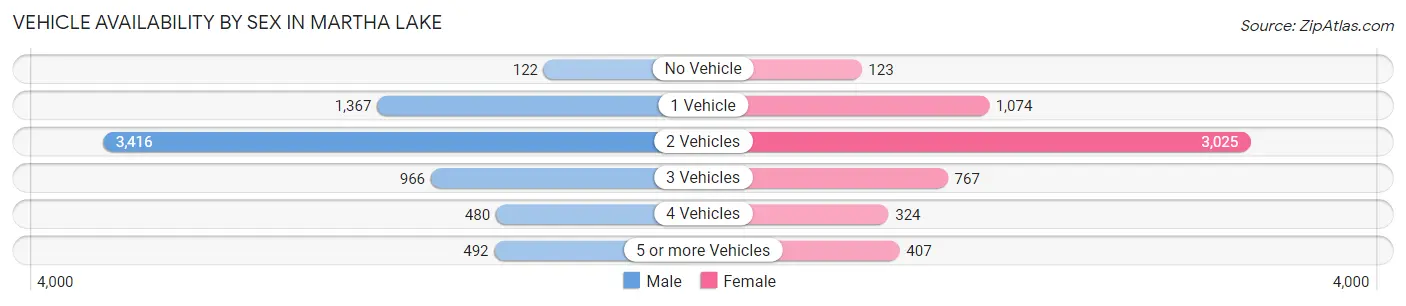
| Vehicles Available | Male | Female |
| No Vehicle | 122 (1.8%) | 123 (2.1%) |
| 1 Vehicle | 1,367 (20.0%) | 1,074 (18.8%) |
| 2 Vehicles | 3,416 (49.9%) | 3,025 (52.9%) |
| 3 Vehicles | 966 (14.1%) | 767 (13.4%) |
| 4 Vehicles | 480 (7.0%) | 324 (5.7%) |
| 5 or more Vehicles | 492 (7.2%) | 407 (7.1%) |
| Total | 6,843 (100.0%) | 5,720 (100.0%) |
Commute Time in Martha Lake
The most frequently occuring commute durations in Martha Lake are 30 to 34 minutes (1,627 commuters, 16.5%), 20 to 24 minutes (1,509 commuters, 15.3%), and 15 to 19 minutes (1,195 commuters, 12.1%).
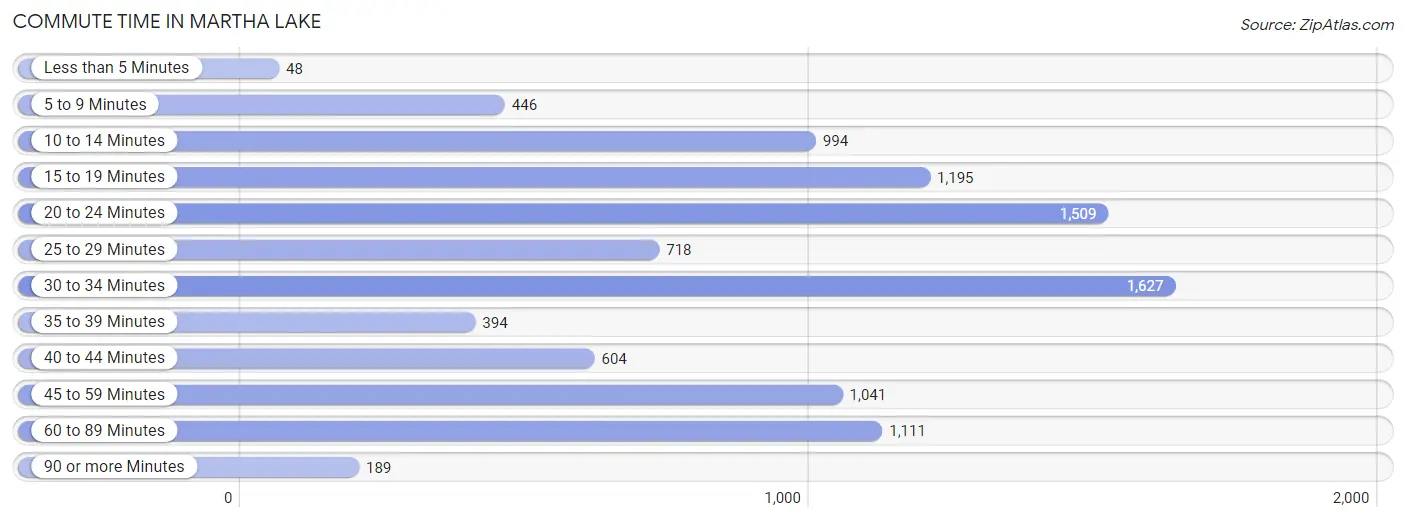
| Commute Time | # Commuters | % Commuters |
| Less than 5 Minutes | 48 | 0.5% |
| 5 to 9 Minutes | 446 | 4.5% |
| 10 to 14 Minutes | 994 | 10.1% |
| 15 to 19 Minutes | 1,195 | 12.1% |
| 20 to 24 Minutes | 1,509 | 15.3% |
| 25 to 29 Minutes | 718 | 7.3% |
| 30 to 34 Minutes | 1,627 | 16.5% |
| 35 to 39 Minutes | 394 | 4.0% |
| 40 to 44 Minutes | 604 | 6.1% |
| 45 to 59 Minutes | 1,041 | 10.5% |
| 60 to 89 Minutes | 1,111 | 11.3% |
| 90 or more Minutes | 189 | 1.9% |
Commute Time by Sex in Martha Lake
The most common commute times in Martha Lake are 30 to 34 minutes (954 commuters, 17.4%) for males and 20 to 24 minutes (877 commuters, 19.9%) for females.
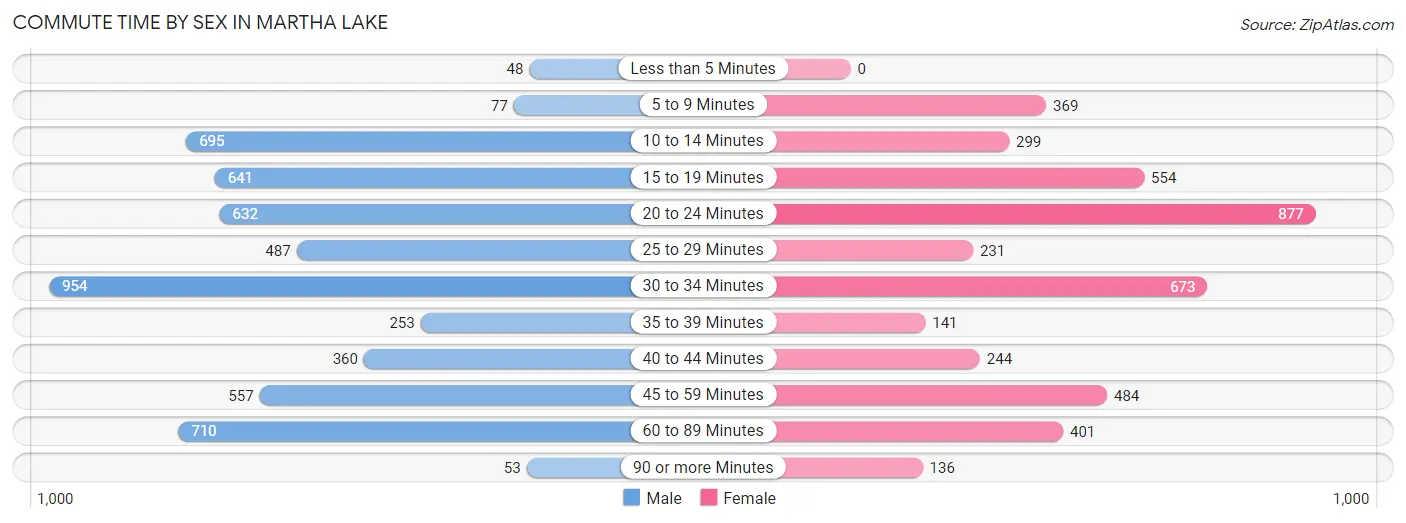
| Commute Time | Male | Female |
| Less than 5 Minutes | 48 (0.9%) | 0 (0.0%) |
| 5 to 9 Minutes | 77 (1.4%) | 369 (8.4%) |
| 10 to 14 Minutes | 695 (12.7%) | 299 (6.8%) |
| 15 to 19 Minutes | 641 (11.7%) | 554 (12.6%) |
| 20 to 24 Minutes | 632 (11.6%) | 877 (19.9%) |
| 25 to 29 Minutes | 487 (8.9%) | 231 (5.2%) |
| 30 to 34 Minutes | 954 (17.4%) | 673 (15.3%) |
| 35 to 39 Minutes | 253 (4.6%) | 141 (3.2%) |
| 40 to 44 Minutes | 360 (6.6%) | 244 (5.5%) |
| 45 to 59 Minutes | 557 (10.2%) | 484 (11.0%) |
| 60 to 89 Minutes | 710 (13.0%) | 401 (9.1%) |
| 90 or more Minutes | 53 (1.0%) | 136 (3.1%) |
Time of Departure to Work by Sex in Martha Lake
The most frequent times of departure to work in Martha Lake are 5:00 AM to 5:29 AM (662, 12.1%) for males and 7:00 AM to 7:29 AM (665, 15.1%) for females.
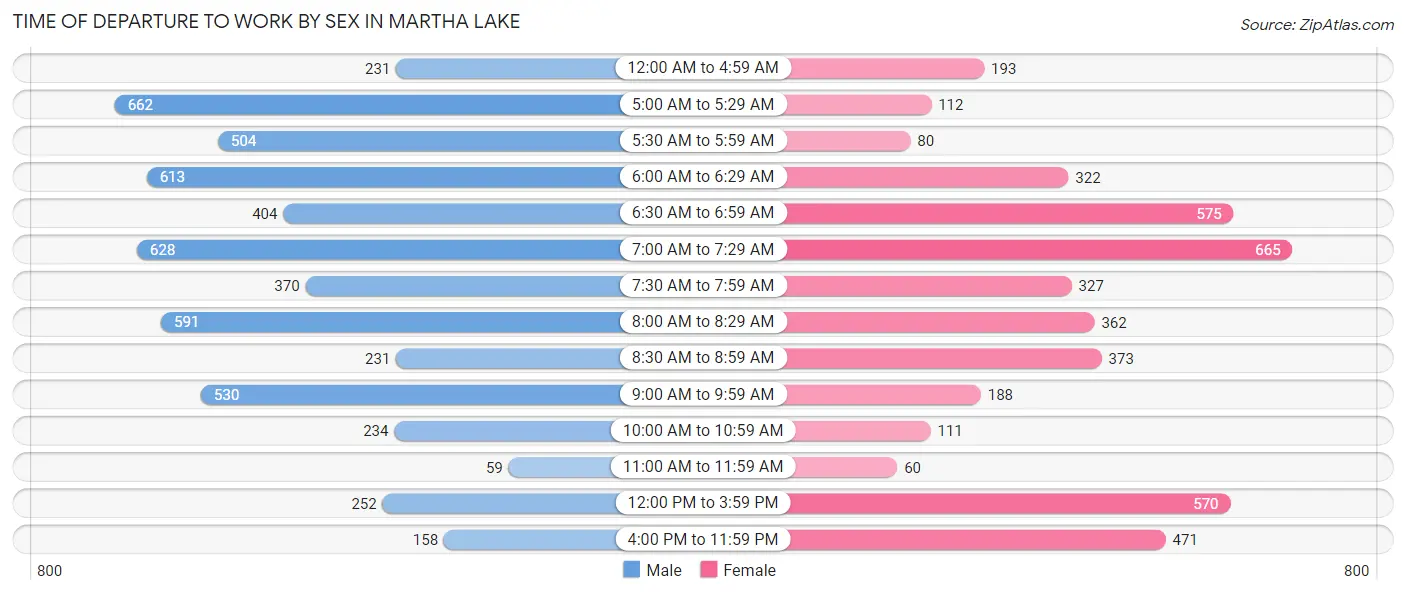
| Time of Departure | Male | Female |
| 12:00 AM to 4:59 AM | 231 (4.2%) | 193 (4.4%) |
| 5:00 AM to 5:29 AM | 662 (12.1%) | 112 (2.5%) |
| 5:30 AM to 5:59 AM | 504 (9.2%) | 80 (1.8%) |
| 6:00 AM to 6:29 AM | 613 (11.2%) | 322 (7.3%) |
| 6:30 AM to 6:59 AM | 404 (7.4%) | 575 (13.0%) |
| 7:00 AM to 7:29 AM | 628 (11.5%) | 665 (15.1%) |
| 7:30 AM to 7:59 AM | 370 (6.8%) | 327 (7.4%) |
| 8:00 AM to 8:29 AM | 591 (10.8%) | 362 (8.2%) |
| 8:30 AM to 8:59 AM | 231 (4.2%) | 373 (8.5%) |
| 9:00 AM to 9:59 AM | 530 (9.7%) | 188 (4.3%) |
| 10:00 AM to 10:59 AM | 234 (4.3%) | 111 (2.5%) |
| 11:00 AM to 11:59 AM | 59 (1.1%) | 60 (1.4%) |
| 12:00 PM to 3:59 PM | 252 (4.6%) | 570 (12.9%) |
| 4:00 PM to 11:59 PM | 158 (2.9%) | 471 (10.7%) |
| Total | 5,467 (100.0%) | 4,409 (100.0%) |
Housing Occupancy in Martha Lake
Occupancy by Ownership in Martha Lake
Of the total 7,966 dwellings in Martha Lake, owner-occupied units account for 5,141 (64.5%), while renter-occupied units make up 2,825 (35.5%).
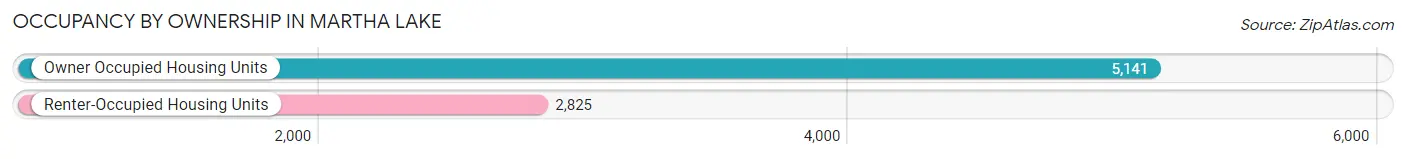
| Occupancy | # Housing Units | % Housing Units |
| Owner Occupied Housing Units | 5,141 | 64.5% |
| Renter-Occupied Housing Units | 2,825 | 35.5% |
| Total Occupied Housing Units | 7,966 | 100.0% |
Occupancy by Household Size in Martha Lake
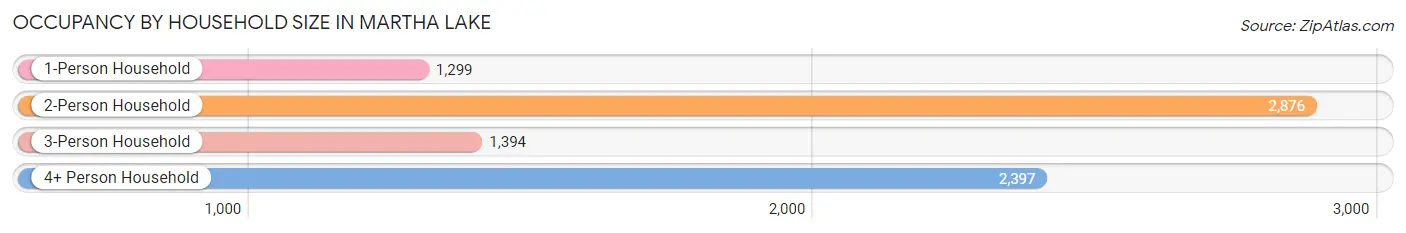
| Household Size | # Housing Units | % Housing Units |
| 1-Person Household | 1,299 | 16.3% |
| 2-Person Household | 2,876 | 36.1% |
| 3-Person Household | 1,394 | 17.5% |
| 4+ Person Household | 2,397 | 30.1% |
| Total Housing Units | 7,966 | 100.0% |
Occupancy by Ownership by Household Size in Martha Lake
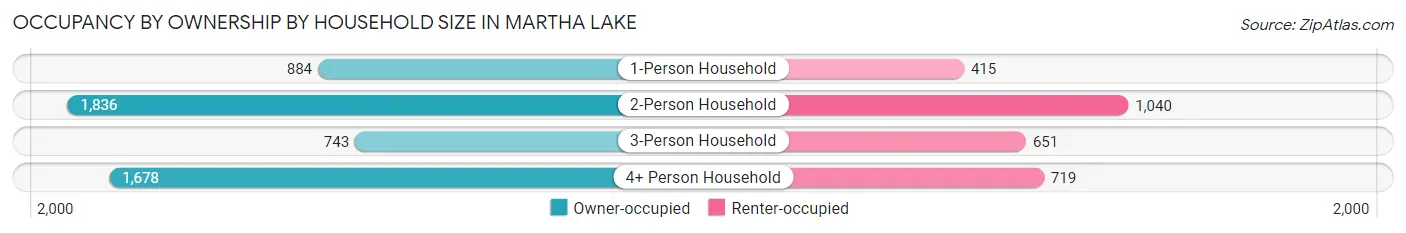
| Household Size | Owner-occupied | Renter-occupied |
| 1-Person Household | 884 (68.0%) | 415 (32.0%) |
| 2-Person Household | 1,836 (63.8%) | 1,040 (36.2%) |
| 3-Person Household | 743 (53.3%) | 651 (46.7%) |
| 4+ Person Household | 1,678 (70.0%) | 719 (30.0%) |
| Total Housing Units | 5,141 (64.5%) | 2,825 (35.5%) |
Occupancy by Educational Attainment in Martha Lake
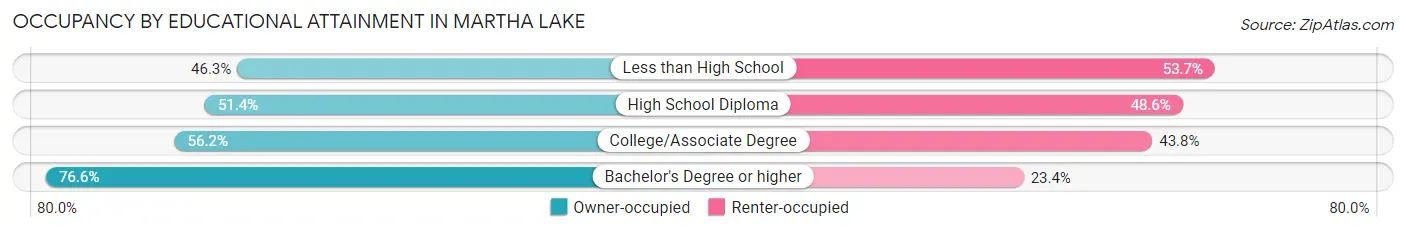
| Household Size | Owner-occupied | Renter-occupied |
| Less than High School | 243 (46.3%) | 282 (53.7%) |
| High School Diploma | 611 (51.4%) | 578 (48.6%) |
| College/Associate Degree | 1,383 (56.2%) | 1,078 (43.8%) |
| Bachelor's Degree or higher | 2,904 (76.6%) | 887 (23.4%) |
Occupancy by Age of Householder in Martha Lake
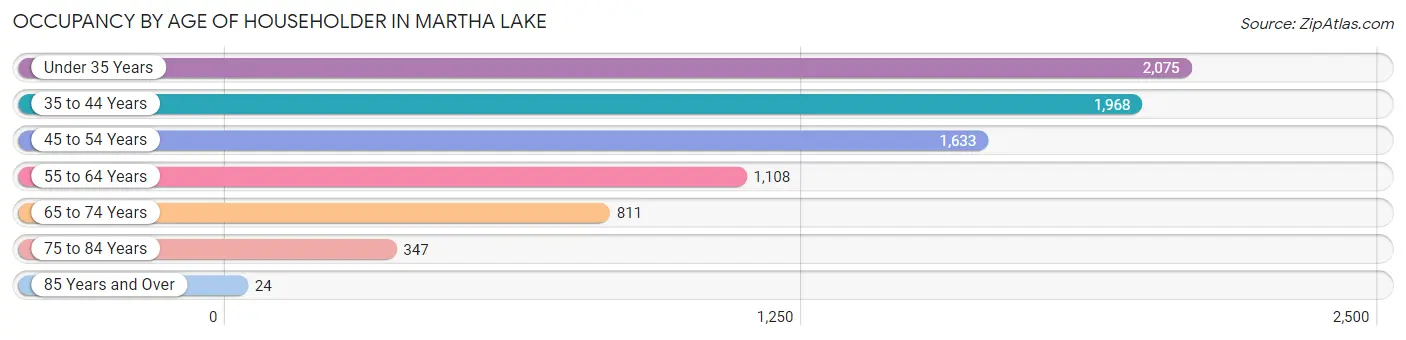
| Age Bracket | # Households | % Households |
| Under 35 Years | 2,075 | 26.1% |
| 35 to 44 Years | 1,968 | 24.7% |
| 45 to 54 Years | 1,633 | 20.5% |
| 55 to 64 Years | 1,108 | 13.9% |
| 65 to 74 Years | 811 | 10.2% |
| 75 to 84 Years | 347 | 4.4% |
| 85 Years and Over | 24 | 0.3% |
| Total | 7,966 | 100.0% |
Housing Finances in Martha Lake
Median Income by Occupancy in Martha Lake
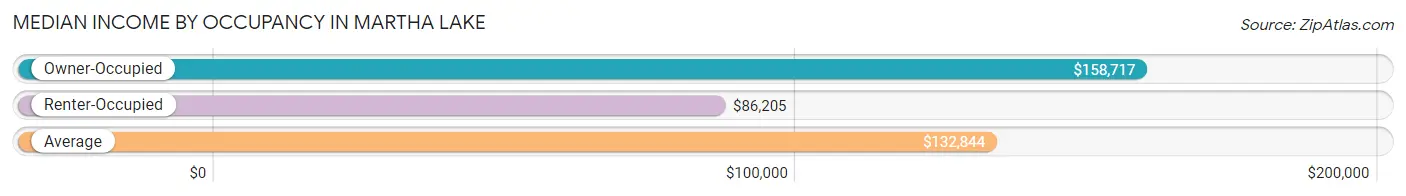
| Occupancy Type | # Households | Median Income |
| Owner-Occupied | 5,141 (64.5%) | $158,717 |
| Renter-Occupied | 2,825 (35.5%) | $86,205 |
| Average | 7,966 (100.0%) | $132,844 |
Occupancy by Householder Income Bracket in Martha Lake
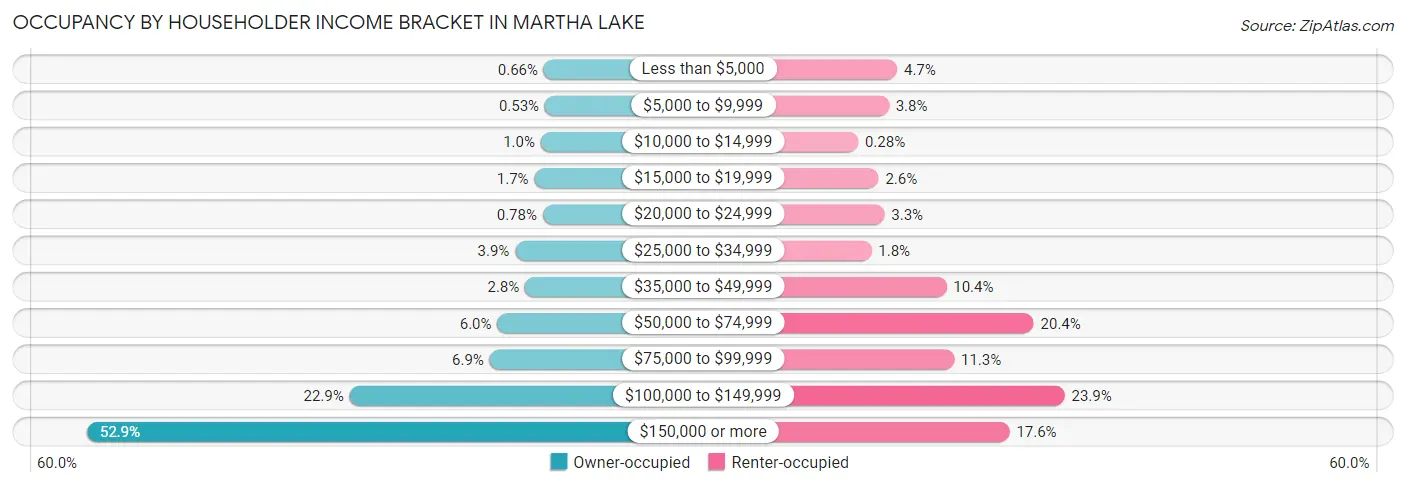
| Income Bracket | Owner-occupied | Renter-occupied |
| Less than $5,000 | 34 (0.7%) | 134 (4.7%) |
| $5,000 to $9,999 | 27 (0.5%) | 107 (3.8%) |
| $10,000 to $14,999 | 52 (1.0%) | 8 (0.3%) |
| $15,000 to $19,999 | 89 (1.7%) | 74 (2.6%) |
| $20,000 to $24,999 | 40 (0.8%) | 93 (3.3%) |
| $25,000 to $34,999 | 202 (3.9%) | 51 (1.8%) |
| $35,000 to $49,999 | 144 (2.8%) | 293 (10.4%) |
| $50,000 to $74,999 | 307 (6.0%) | 575 (20.3%) |
| $75,000 to $99,999 | 352 (6.9%) | 318 (11.3%) |
| $100,000 to $149,999 | 1,175 (22.9%) | 675 (23.9%) |
| $150,000 or more | 2,719 (52.9%) | 497 (17.6%) |
| Total | 5,141 (100.0%) | 2,825 (100.0%) |
Monthly Housing Cost Tiers in Martha Lake
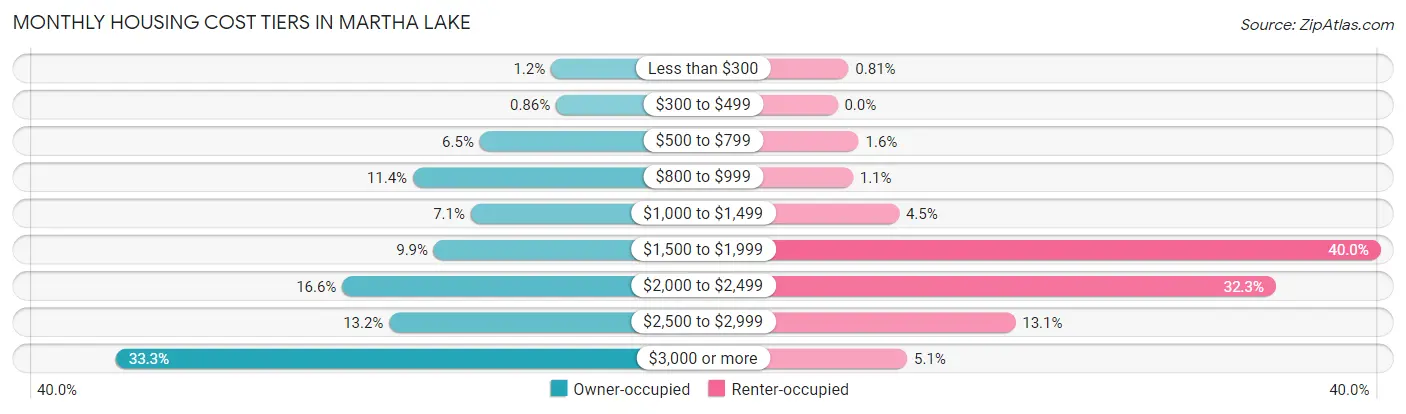
| Monthly Cost | Owner-occupied | Renter-occupied |
| Less than $300 | 63 (1.2%) | 23 (0.8%) |
| $300 to $499 | 44 (0.9%) | 0 (0.0%) |
| $500 to $799 | 333 (6.5%) | 44 (1.6%) |
| $800 to $999 | 586 (11.4%) | 32 (1.1%) |
| $1,000 to $1,499 | 367 (7.1%) | 128 (4.5%) |
| $1,500 to $1,999 | 507 (9.9%) | 1,130 (40.0%) |
| $2,000 to $2,499 | 854 (16.6%) | 912 (32.3%) |
| $2,500 to $2,999 | 676 (13.2%) | 370 (13.1%) |
| $3,000 or more | 1,711 (33.3%) | 145 (5.1%) |
| Total | 5,141 (100.0%) | 2,825 (100.0%) |
Physical Housing Characteristics in Martha Lake
Housing Structures in Martha Lake
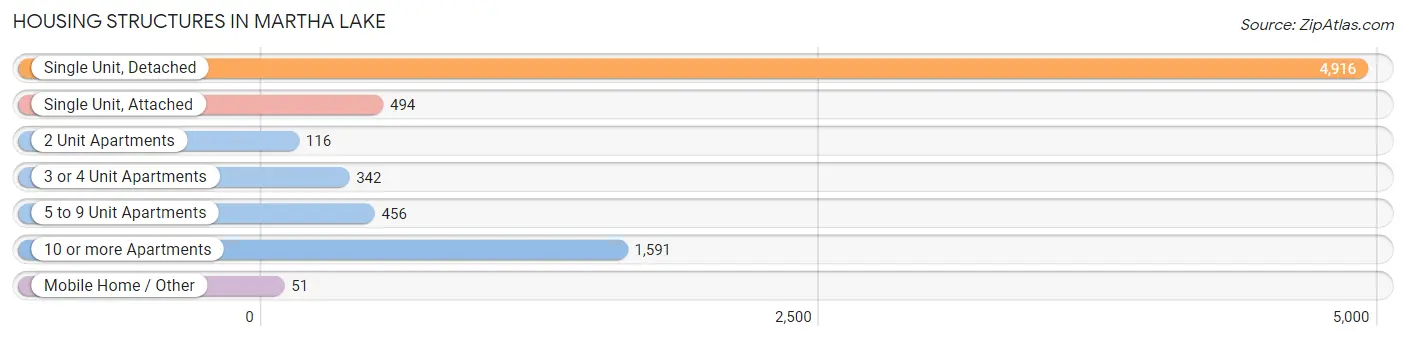
| Structure Type | # Housing Units | % Housing Units |
| Single Unit, Detached | 4,916 | 61.7% |
| Single Unit, Attached | 494 | 6.2% |
| 2 Unit Apartments | 116 | 1.5% |
| 3 or 4 Unit Apartments | 342 | 4.3% |
| 5 to 9 Unit Apartments | 456 | 5.7% |
| 10 or more Apartments | 1,591 | 20.0% |
| Mobile Home / Other | 51 | 0.6% |
| Total | 7,966 | 100.0% |
Housing Structures by Occupancy in Martha Lake
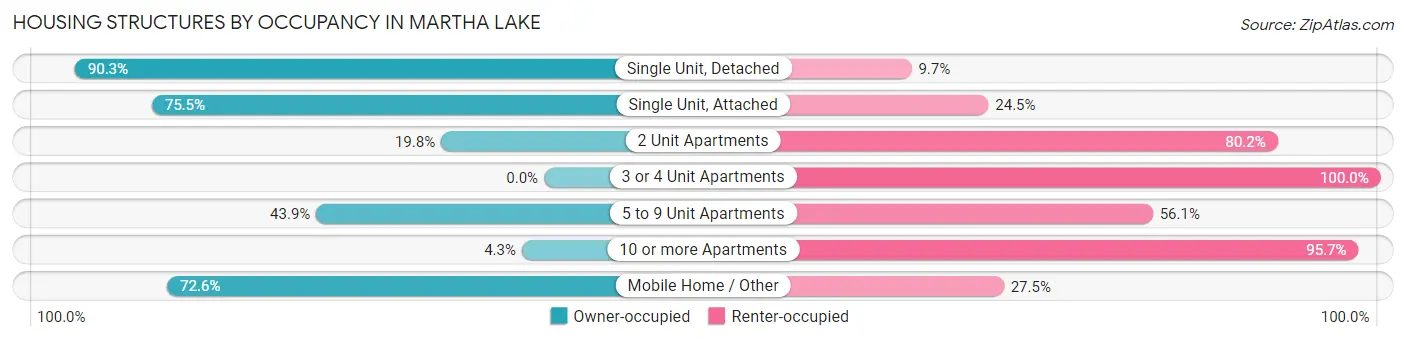
| Structure Type | Owner-occupied | Renter-occupied |
| Single Unit, Detached | 4,440 (90.3%) | 476 (9.7%) |
| Single Unit, Attached | 373 (75.5%) | 121 (24.5%) |
| 2 Unit Apartments | 23 (19.8%) | 93 (80.2%) |
| 3 or 4 Unit Apartments | 0 (0.0%) | 342 (100.0%) |
| 5 to 9 Unit Apartments | 200 (43.9%) | 256 (56.1%) |
| 10 or more Apartments | 68 (4.3%) | 1,523 (95.7%) |
| Mobile Home / Other | 37 (72.6%) | 14 (27.5%) |
| Total | 5,141 (64.5%) | 2,825 (35.5%) |
Housing Structures by Number of Rooms in Martha Lake
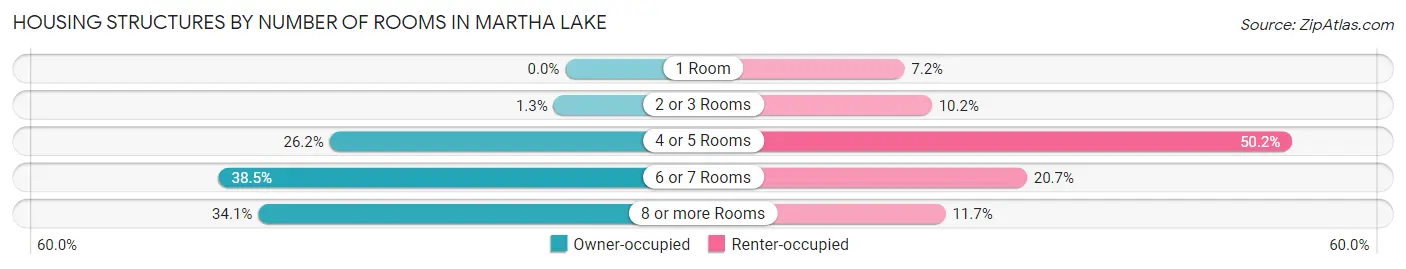
| Number of Rooms | Owner-occupied | Renter-occupied |
| 1 Room | 0 (0.0%) | 202 (7.1%) |
| 2 or 3 Rooms | 67 (1.3%) | 288 (10.2%) |
| 4 or 5 Rooms | 1,345 (26.2%) | 1,418 (50.2%) |
| 6 or 7 Rooms | 1,977 (38.5%) | 586 (20.7%) |
| 8 or more Rooms | 1,752 (34.1%) | 331 (11.7%) |
| Total | 5,141 (100.0%) | 2,825 (100.0%) |
Housing Structure by Heating Type in Martha Lake
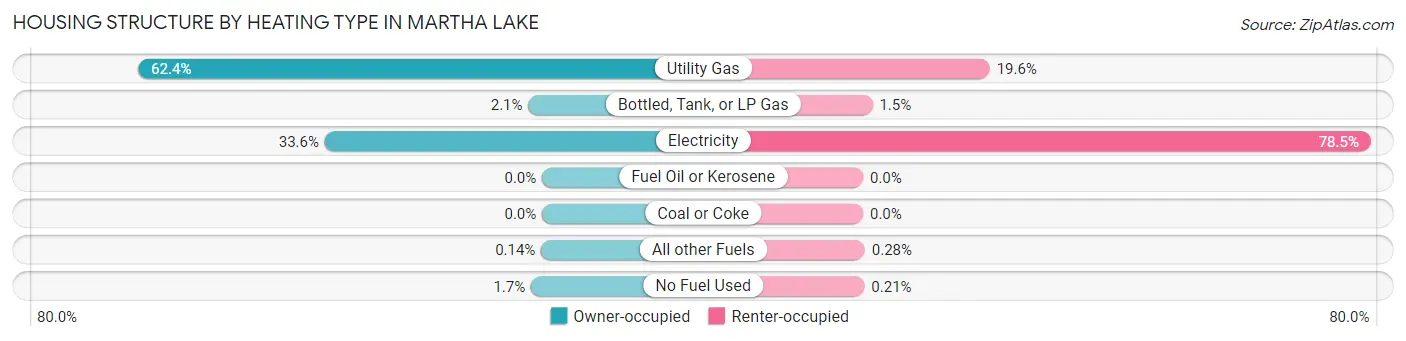
| Heating Type | Owner-occupied | Renter-occupied |
| Utility Gas | 3,210 (62.4%) | 553 (19.6%) |
| Bottled, Tank, or LP Gas | 109 (2.1%) | 41 (1.5%) |
| Electricity | 1,727 (33.6%) | 2,217 (78.5%) |
| Fuel Oil or Kerosene | 0 (0.0%) | 0 (0.0%) |
| Coal or Coke | 0 (0.0%) | 0 (0.0%) |
| All other Fuels | 7 (0.1%) | 8 (0.3%) |
| No Fuel Used | 88 (1.7%) | 6 (0.2%) |
| Total | 5,141 (100.0%) | 2,825 (100.0%) |
Household Vehicle Usage in Martha Lake
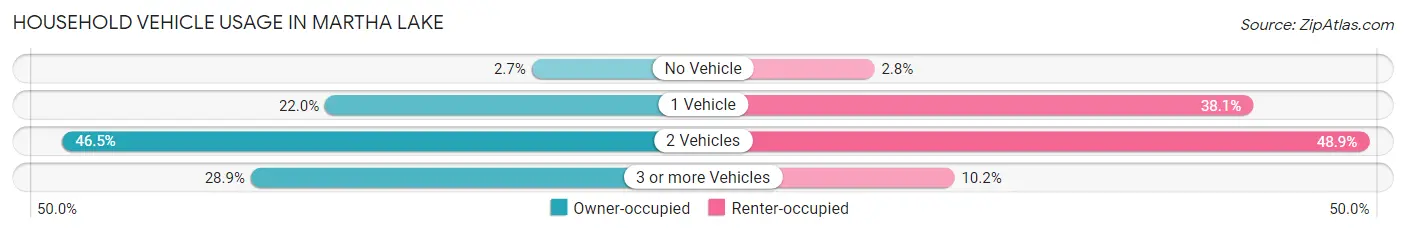
| Vehicles per Household | Owner-occupied | Renter-occupied |
| No Vehicle | 138 (2.7%) | 78 (2.8%) |
| 1 Vehicle | 1,129 (22.0%) | 1,076 (38.1%) |
| 2 Vehicles | 2,389 (46.5%) | 1,382 (48.9%) |
| 3 or more Vehicles | 1,485 (28.9%) | 289 (10.2%) |
| Total | 5,141 (100.0%) | 2,825 (100.0%) |
Real Estate & Mortgages in Martha Lake
Real Estate and Mortgage Overview in Martha Lake
| Characteristic | Without Mortgage | With Mortgage |
| Housing Units | 1,073 | 4,068 |
| Median Property Value | $644,400 | $684,600 |
| Median Household Income | $110,125 | $2,328 |
| Monthly Housing Costs | $896 | $1,711 |
| Real Estate Taxes | $6,147 | $78 |
Property Value by Mortgage Status in Martha Lake
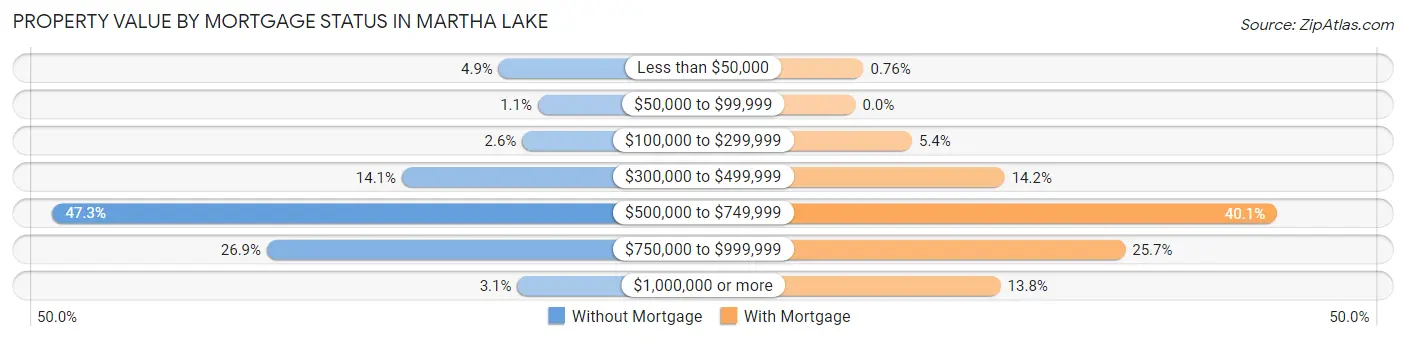
| Property Value | Without Mortgage | With Mortgage |
| Less than $50,000 | 52 (4.9%) | 31 (0.8%) |
| $50,000 to $99,999 | 12 (1.1%) | 0 (0.0%) |
| $100,000 to $299,999 | 28 (2.6%) | 219 (5.4%) |
| $300,000 to $499,999 | 151 (14.1%) | 578 (14.2%) |
| $500,000 to $749,999 | 508 (47.3%) | 1,633 (40.1%) |
| $750,000 to $999,999 | 289 (26.9%) | 1,045 (25.7%) |
| $1,000,000 or more | 33 (3.1%) | 562 (13.8%) |
| Total | 1,073 (100.0%) | 4,068 (100.0%) |
Household Income by Mortgage Status in Martha Lake
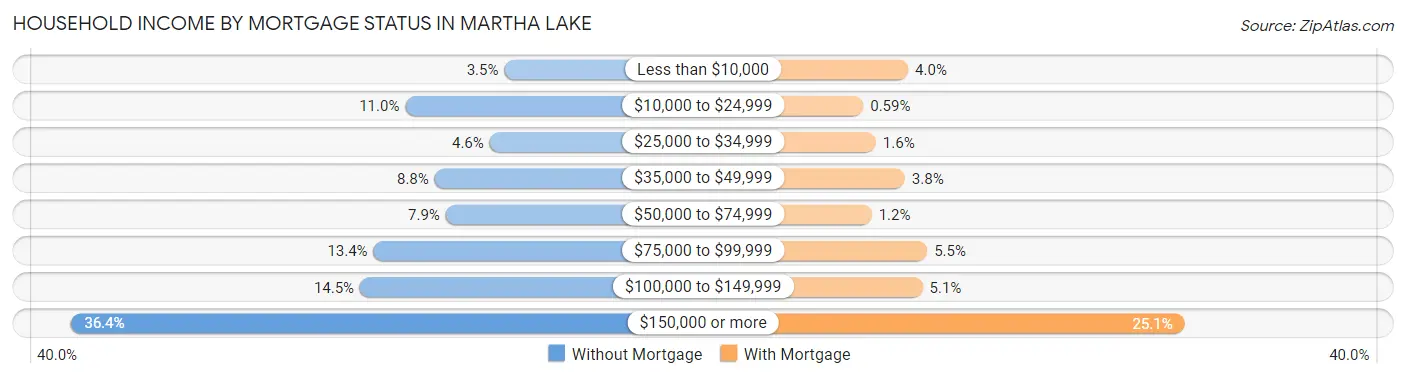
| Household Income | Without Mortgage | With Mortgage |
| Less than $10,000 | 37 (3.5%) | 163 (4.0%) |
| $10,000 to $24,999 | 118 (11.0%) | 24 (0.6%) |
| $25,000 to $34,999 | 49 (4.6%) | 63 (1.5%) |
| $35,000 to $49,999 | 94 (8.8%) | 153 (3.8%) |
| $50,000 to $74,999 | 85 (7.9%) | 50 (1.2%) |
| $75,000 to $99,999 | 144 (13.4%) | 222 (5.5%) |
| $100,000 to $149,999 | 155 (14.4%) | 208 (5.1%) |
| $150,000 or more | 391 (36.4%) | 1,020 (25.1%) |
| Total | 1,073 (100.0%) | 4,068 (100.0%) |
Property Value to Household Income Ratio in Martha Lake
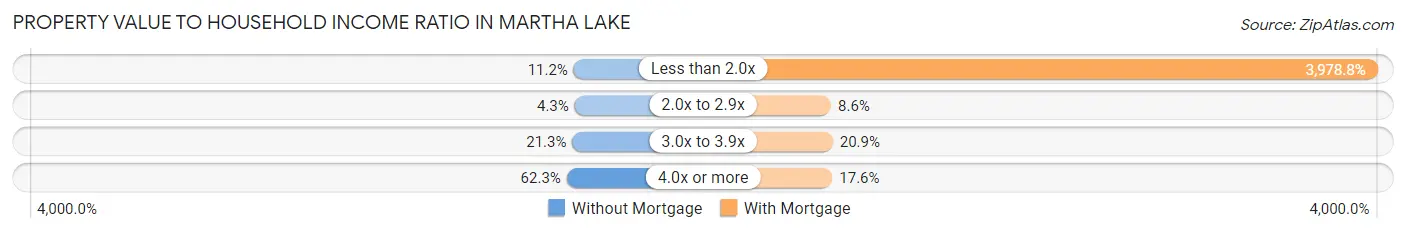
| Value-to-Income Ratio | Without Mortgage | With Mortgage |
| Less than 2.0x | 120 (11.2%) | 161,858 (3,978.8%) |
| 2.0x to 2.9x | 46 (4.3%) | 349 (8.6%) |
| 3.0x to 3.9x | 229 (21.3%) | 851 (20.9%) |
| 4.0x or more | 668 (62.3%) | 716 (17.6%) |
| Total | 1,073 (100.0%) | 4,068 (100.0%) |
Real Estate Taxes by Mortgage Status in Martha Lake
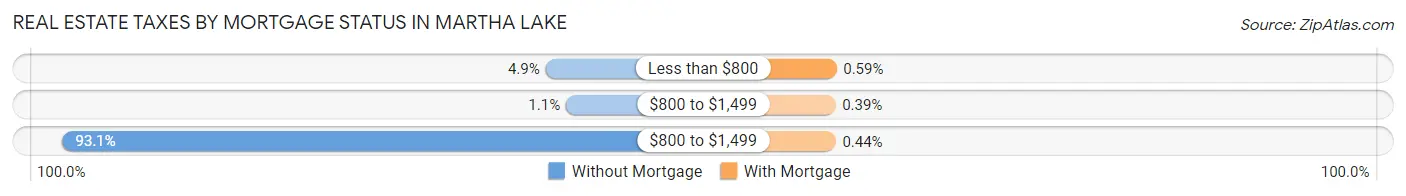
| Property Taxes | Without Mortgage | With Mortgage |
| Less than $800 | 52 (4.9%) | 24 (0.6%) |
| $800 to $1,499 | 12 (1.1%) | 16 (0.4%) |
| $800 to $1,499 | 999 (93.1%) | 18 (0.4%) |
| Total | 1,073 (100.0%) | 4,068 (100.0%) |
Health & Disability in Martha Lake
Health Insurance Coverage by Age in Martha Lake
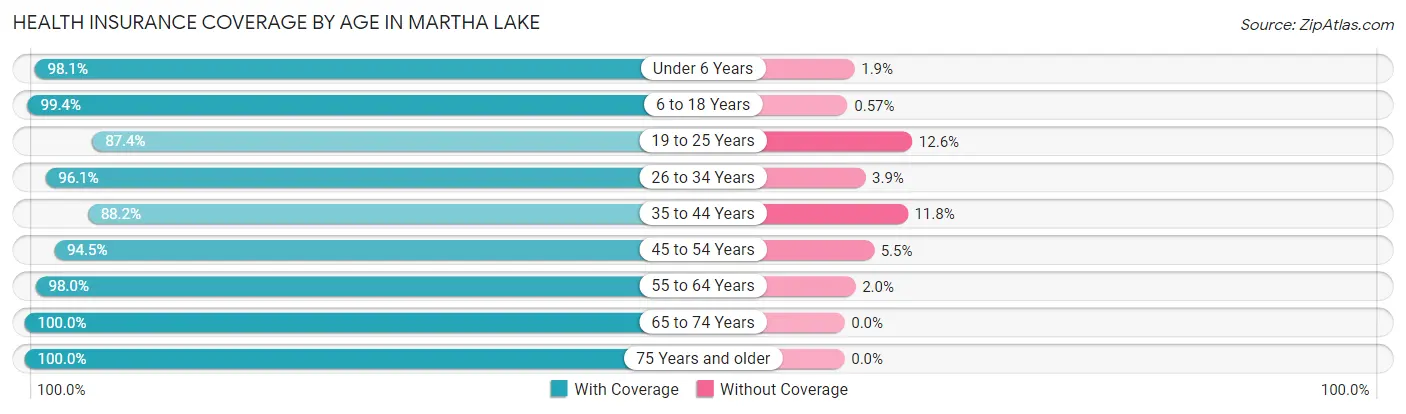
| Age Bracket | With Coverage | Without Coverage |
| Under 6 Years | 1,632 (98.1%) | 31 (1.9%) |
| 6 to 18 Years | 4,351 (99.4%) | 25 (0.6%) |
| 19 to 25 Years | 1,747 (87.4%) | 252 (12.6%) |
| 26 to 34 Years | 3,538 (96.1%) | 143 (3.9%) |
| 35 to 44 Years | 3,870 (88.2%) | 517 (11.8%) |
| 45 to 54 Years | 2,427 (94.5%) | 141 (5.5%) |
| 55 to 64 Years | 1,922 (98.0%) | 40 (2.0%) |
| 65 to 74 Years | 1,643 (100.0%) | 0 (0.0%) |
| 75 Years and older | 909 (100.0%) | 0 (0.0%) |
| Total | 22,039 (95.0%) | 1,149 (5.0%) |
Health Insurance Coverage by Citizenship Status in Martha Lake
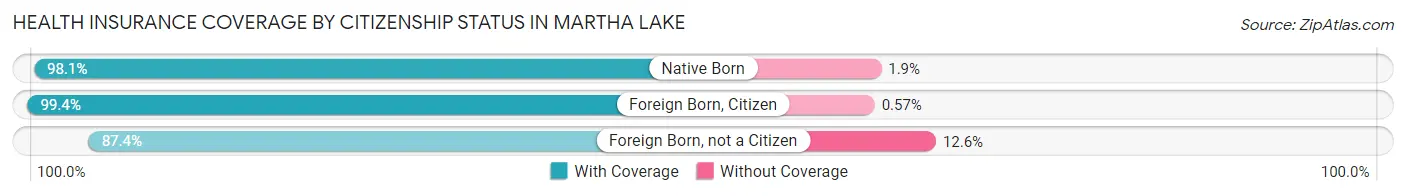
| Citizenship Status | With Coverage | Without Coverage |
| Native Born | 1,632 (98.1%) | 31 (1.9%) |
| Foreign Born, Citizen | 4,351 (99.4%) | 25 (0.6%) |
| Foreign Born, not a Citizen | 1,747 (87.4%) | 252 (12.6%) |
Health Insurance Coverage by Household Income in Martha Lake
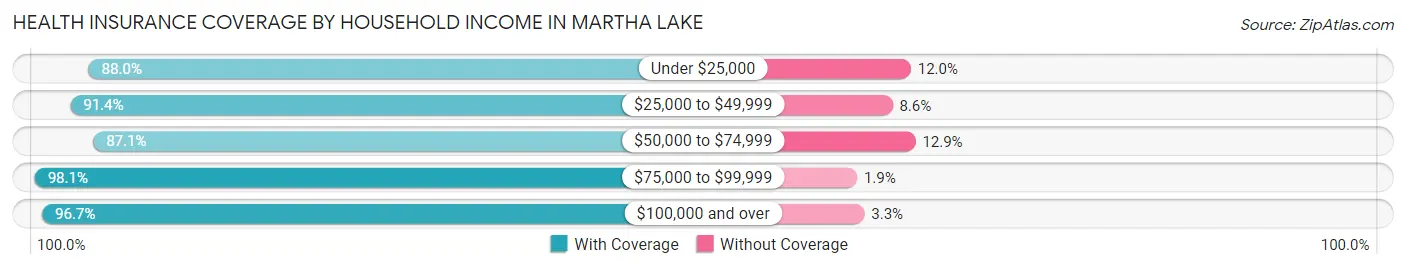
| Household Income | With Coverage | Without Coverage |
| Under $25,000 | 1,270 (88.0%) | 173 (12.0%) |
| $25,000 to $49,999 | 1,613 (91.4%) | 151 (8.6%) |
| $50,000 to $74,999 | 1,775 (87.1%) | 262 (12.9%) |
| $75,000 to $99,999 | 1,756 (98.1%) | 34 (1.9%) |
| $100,000 and over | 15,554 (96.7%) | 529 (3.3%) |
Public vs Private Health Insurance Coverage by Age in Martha Lake
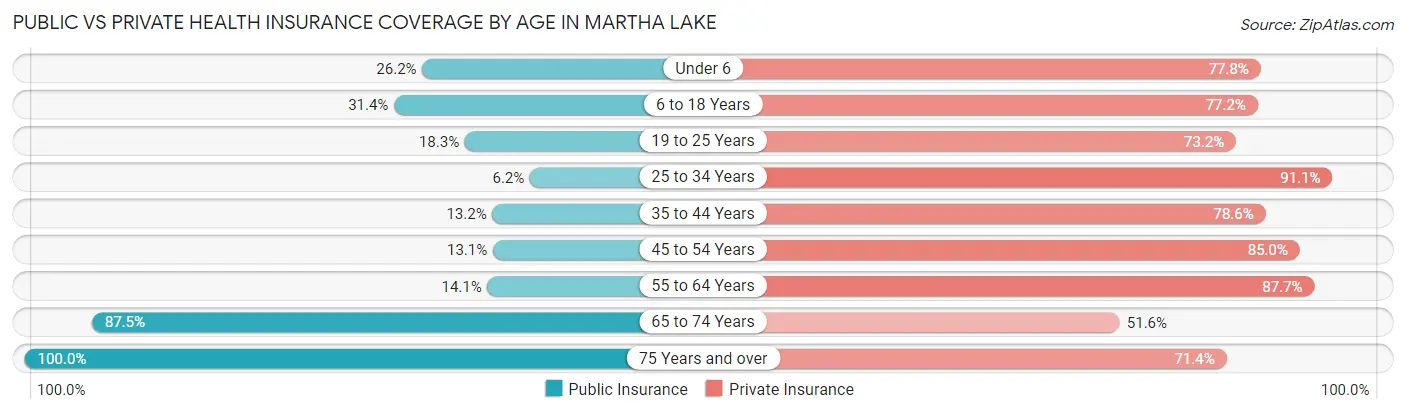
| Age Bracket | Public Insurance | Private Insurance |
| Under 6 | 435 (26.2%) | 1,293 (77.7%) |
| 6 to 18 Years | 1,374 (31.4%) | 3,378 (77.2%) |
| 19 to 25 Years | 365 (18.3%) | 1,463 (73.2%) |
| 25 to 34 Years | 227 (6.2%) | 3,352 (91.1%) |
| 35 to 44 Years | 577 (13.2%) | 3,450 (78.6%) |
| 45 to 54 Years | 335 (13.1%) | 2,183 (85.0%) |
| 55 to 64 Years | 276 (14.1%) | 1,721 (87.7%) |
| 65 to 74 Years | 1,438 (87.5%) | 848 (51.6%) |
| 75 Years and over | 909 (100.0%) | 649 (71.4%) |
| Total | 5,936 (25.6%) | 18,337 (79.1%) |
Disability Status by Sex by Age in Martha Lake
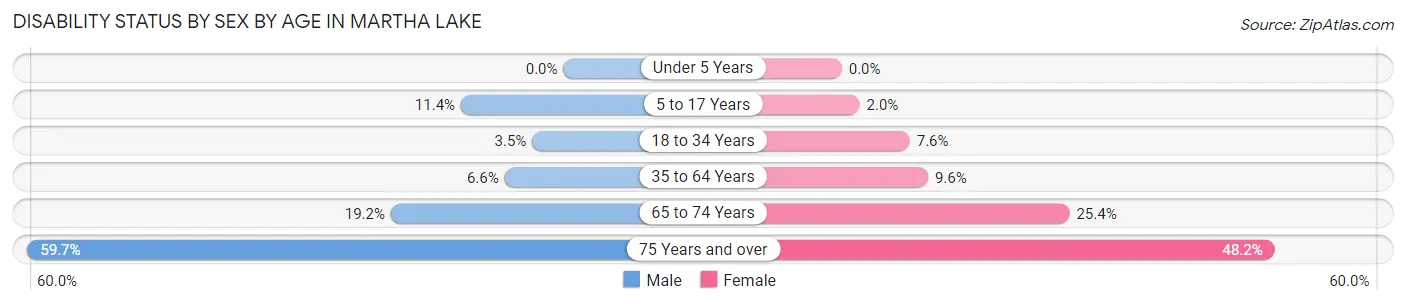
| Age Bracket | Male | Female |
| Under 5 Years | 0 (0.0%) | 0 (0.0%) |
| 5 to 17 Years | 266 (11.4%) | 41 (2.0%) |
| 18 to 34 Years | 103 (3.5%) | 222 (7.6%) |
| 35 to 64 Years | 297 (6.6%) | 421 (9.6%) |
| 65 to 74 Years | 168 (19.2%) | 195 (25.4%) |
| 75 Years and over | 311 (59.7%) | 187 (48.2%) |
Disability Class by Sex by Age in Martha Lake
Disability Class: Hearing Difficulty
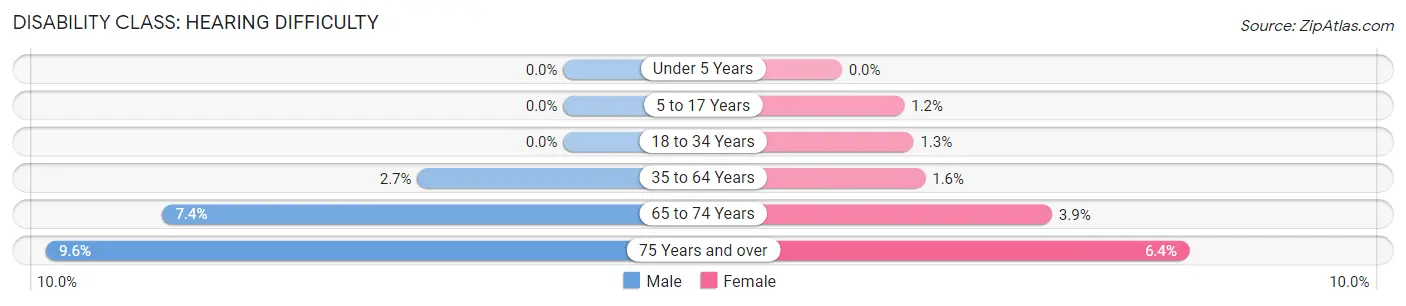
| Age Bracket | Male | Female |
| Under 5 Years | 0 (0.0%) | 0 (0.0%) |
| 5 to 17 Years | 0 (0.0%) | 24 (1.2%) |
| 18 to 34 Years | 0 (0.0%) | 39 (1.3%) |
| 35 to 64 Years | 123 (2.7%) | 68 (1.5%) |
| 65 to 74 Years | 65 (7.4%) | 30 (3.9%) |
| 75 Years and over | 50 (9.6%) | 25 (6.4%) |
Disability Class: Vision Difficulty
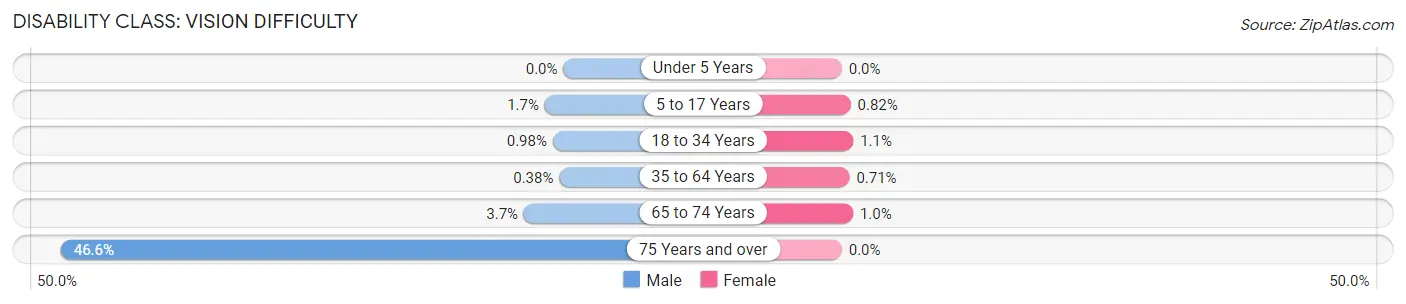
| Age Bracket | Male | Female |
| Under 5 Years | 0 (0.0%) | 0 (0.0%) |
| 5 to 17 Years | 40 (1.7%) | 17 (0.8%) |
| 18 to 34 Years | 29 (1.0%) | 31 (1.1%) |
| 35 to 64 Years | 17 (0.4%) | 31 (0.7%) |
| 65 to 74 Years | 32 (3.7%) | 8 (1.0%) |
| 75 Years and over | 243 (46.6%) | 0 (0.0%) |
Disability Class: Cognitive Difficulty
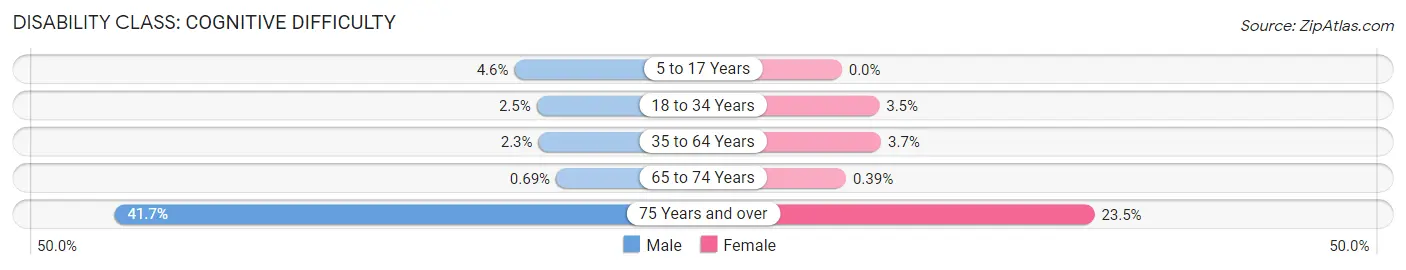
| Age Bracket | Male | Female |
| 5 to 17 Years | 106 (4.5%) | 0 (0.0%) |
| 18 to 34 Years | 74 (2.5%) | 102 (3.5%) |
| 35 to 64 Years | 105 (2.3%) | 160 (3.6%) |
| 65 to 74 Years | 6 (0.7%) | 3 (0.4%) |
| 75 Years and over | 217 (41.6%) | 91 (23.4%) |
Disability Class: Ambulatory Difficulty
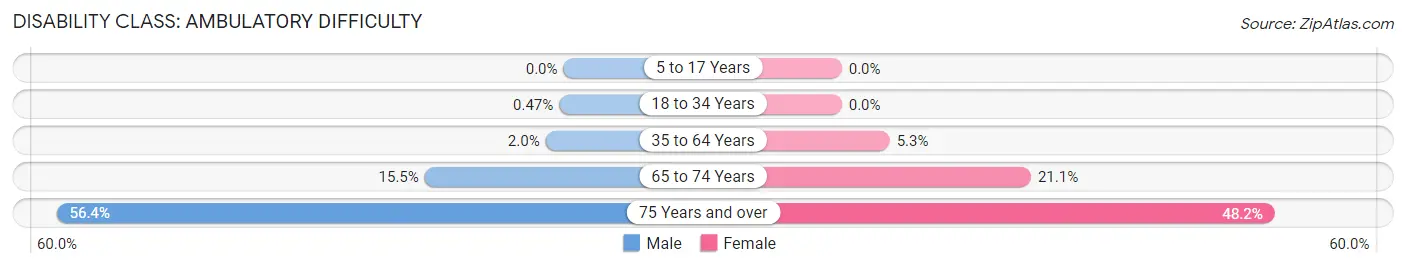
| Age Bracket | Male | Female |
| 5 to 17 Years | 0 (0.0%) | 0 (0.0%) |
| 18 to 34 Years | 14 (0.5%) | 0 (0.0%) |
| 35 to 64 Years | 90 (2.0%) | 234 (5.3%) |
| 65 to 74 Years | 135 (15.4%) | 162 (21.1%) |
| 75 Years and over | 294 (56.4%) | 187 (48.2%) |
Disability Class: Self-Care Difficulty
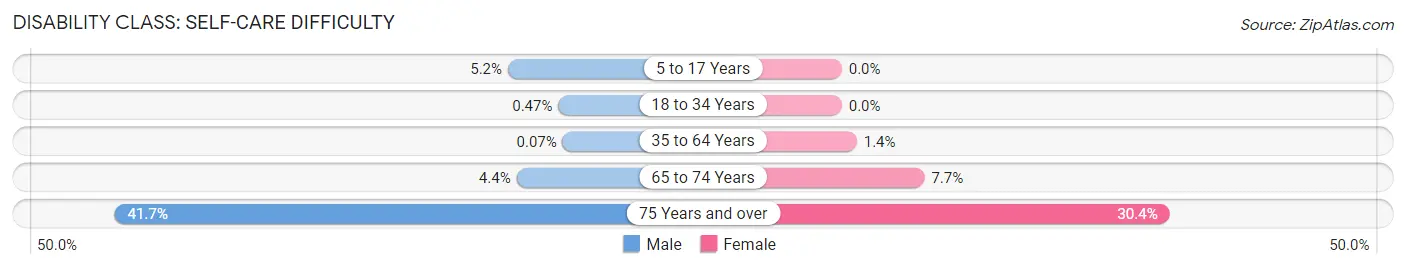
| Age Bracket | Male | Female |
| 5 to 17 Years | 120 (5.1%) | 0 (0.0%) |
| 18 to 34 Years | 14 (0.5%) | 0 (0.0%) |
| 35 to 64 Years | 3 (0.1%) | 61 (1.4%) |
| 65 to 74 Years | 38 (4.3%) | 59 (7.7%) |
| 75 Years and over | 217 (41.6%) | 118 (30.4%) |
Technology Access in Martha Lake
Computing Device Access in Martha Lake
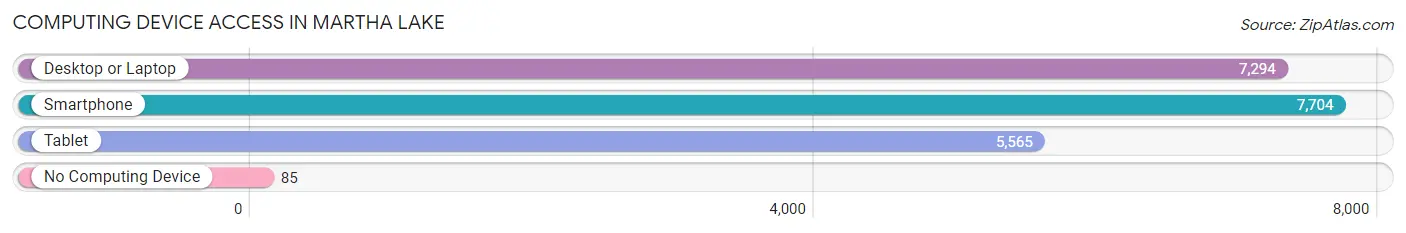
| Device Type | # Households | % Households |
| Desktop or Laptop | 7,294 | 91.6% |
| Smartphone | 7,704 | 96.7% |
| Tablet | 5,565 | 69.9% |
| No Computing Device | 85 | 1.1% |
| Total | 7,966 | 100.0% |
Internet Access in Martha Lake
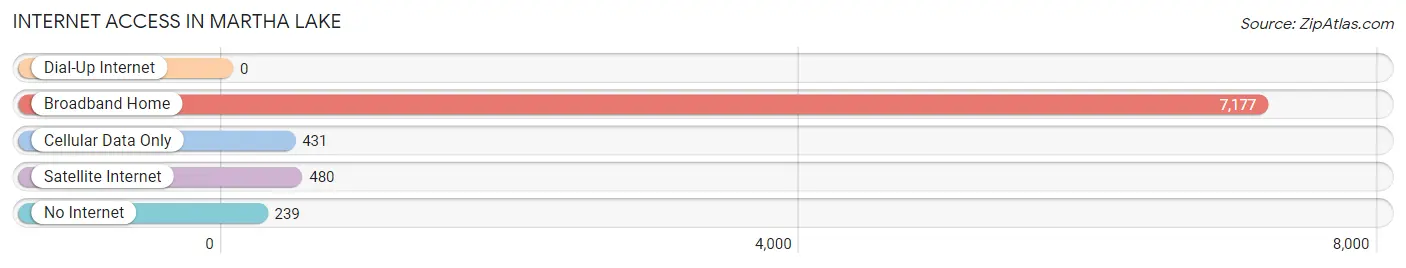
| Internet Type | # Households | % Households |
| Dial-Up Internet | 0 | 0.0% |
| Broadband Home | 7,177 | 90.1% |
| Cellular Data Only | 431 | 5.4% |
| Satellite Internet | 480 | 6.0% |
| No Internet | 239 | 3.0% |
| Total | 7,966 | 100.0% |
Martha Lake Summary
Martha Lake is a small unincorporated community located in Snohomish County, Washington, United States. It is situated in the northern part of the county, approximately 10 miles north of the city of Everett. The population of Martha Lake was estimated to be 4,845 in 2019.
History
Martha Lake was first settled in the late 1800s by homesteaders who were attracted to the area by its abundant natural resources. The area was originally known as "Martha's Lake" after Martha Anderson, one of the first settlers. The name was eventually shortened to Martha Lake.
In the early 1900s, the area was primarily used for logging and farming. The first school in the area was built in 1910 and the first post office opened in 1912.
In the 1950s, the area began to experience rapid growth as the Seattle-Everett metropolitan area expanded. The population of Martha Lake increased from 1,000 in 1950 to 4,845 in 2019.
Geography
Martha Lake is located in the northern part of Snohomish County, approximately 10 miles north of the city of Everett. It is situated in the foothills of the Cascade Mountains and is surrounded by forests and wetlands. The area is known for its natural beauty and is home to several parks and trails.
The climate in Martha Lake is mild and temperate, with warm summers and cool winters. The average annual temperature is around 50°F (10°C).
Economy
Martha Lake is primarily a residential community, with most of its residents commuting to nearby cities for work. The area is home to several small businesses, including restaurants, retail stores, and professional services.
The area is also home to several large employers, including Boeing, Microsoft, and Amazon. These companies provide employment opportunities for many of the area's residents.
Demographics
As of 2019, the population of Martha Lake was estimated to be 4,845. The racial makeup of the area is predominantly white (83.3%), followed by Asian (7.2%), Hispanic or Latino (4.7%), and African American (2.2%).
The median household income in Martha Lake is $90,845, which is significantly higher than the national average of $61,937. The median home value is $521,400, which is also significantly higher than the national average of $184,700.
Conclusion
Martha Lake is a small unincorporated community located in Snohomish County, Washington. It is situated in the northern part of the county, approximately 10 miles north of the city of Everett. The area is known for its natural beauty and is home to several parks and trails. The population of Martha Lake was estimated to be 4,845 in 2019. The economy of the area is primarily driven by the nearby cities of Seattle and Everett, with many of the area's residents commuting to these cities for work. The median household income in Martha Lake is significantly higher than the national average, and the median home value is also significantly higher than the national average.
Common Questions
What is Per Capita Income in Martha Lake?
Per Capita income in Martha Lake is $50,674.
What is the Median Family Income in Martha Lake?
Median Family Income in Martha Lake is $145,898.
What is the Median Household income in Martha Lake?
Median Household Income in Martha Lake is $132,844.
What is Income or Wage Gap in Martha Lake?
Income or Wage Gap in Martha Lake is 35.6%.
Women in Martha Lake earn 64.4 cents for every dollar earned by a man.
What is Family Income Deficit in Martha Lake?
Family Income Deficit in Martha Lake is $13,725.
Families that are below poverty line in Martha Lake earn $13,725 less on average than the poverty threshold level.
What is Inequality or Gini Index in Martha Lake?
Inequality or Gini Index in Martha Lake is 0.38.
What is the Total Population of Martha Lake?
Total Population of Martha Lake is 23,259.
What is the Total Male Population of Martha Lake?
Total Male Population of Martha Lake is 11,755.
What is the Total Female Population of Martha Lake?
Total Female Population of Martha Lake is 11,504.
What is the Ratio of Males per 100 Females in Martha Lake?
There are 102.18 Males per 100 Females in Martha Lake.
What is the Ratio of Females per 100 Males in Martha Lake?
There are 97.86 Females per 100 Males in Martha Lake.
What is the Median Population Age in Martha Lake?
Median Population Age in Martha Lake is 34.7 Years.
What is the Average Family Size in Martha Lake
Average Family Size in Martha Lake is 3.4 People.
What is the Average Household Size in Martha Lake
Average Household Size in Martha Lake is 2.9 People.
How Large is the Labor Force in Martha Lake?
There are 13,462 People in the Labor Forcein in Martha Lake.
What is the Percentage of People in the Labor Force in Martha Lake?
74.7% of People are in the Labor Force in Martha Lake.
What is the Unemployment Rate in Martha Lake?
Unemployment Rate in Martha Lake is 4.4%.