North Fort Lewis, WA Map & Demographics
North Fort Lewis Map
North Fort Lewis Overview
$24,151
PER CAPITA INCOME
$70,260
AVG FAMILY INCOME
$67,708
AVG HOUSEHOLD INCOME
14.7%
WAGE / INCOME GAP [ % ]
85.3¢/ $1
WAGE / INCOME GAP [ $ ]
0.31
INEQUALITY / GINI INDEX
6,022
TOTAL POPULATION
3,556
MALE POPULATION
2,466
FEMALE POPULATION
144.20
MALES / 100 FEMALES
69.35
FEMALES / 100 MALES
24.2
MEDIAN AGE
3.6
AVG FAMILY SIZE
3.6
AVG HOUSEHOLD SIZE
3,480
LABOR FORCE [ PEOPLE ]
80.1%
PERCENT IN LABOR FORCE
14.7%
UNEMPLOYMENT RATE
Income in North Fort Lewis
Income Overview in North Fort Lewis
Per Capita Income in North Fort Lewis is $24,151, while median incomes of families and households are $70,260 and $67,708 respectively.
| Characteristic | Number | Measure |
| Per Capita Income | 6,022 | $24,151 |
| Median Family Income | 1,111 | $70,260 |
| Mean Family Income | 1,111 | $78,358 |
| Median Household Income | 1,127 | $67,708 |
| Mean Household Income | 1,127 | $77,981 |
| Income Deficit | 1,111 | $0 |
| Wage / Income Gap (%) | 6,022 | 14.73% |
| Wage / Income Gap ($) | 6,022 | 85.27¢ per $1 |
| Gini / Inequality Index | 6,022 | 0.31 |
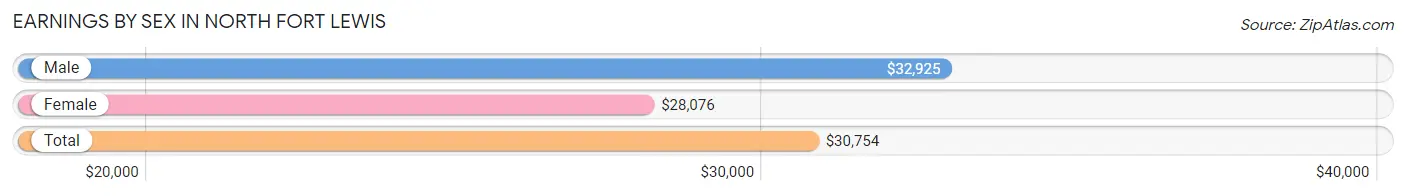
Earnings by Sex in North Fort Lewis
Average Earnings in North Fort Lewis are $30,754, $32,925 for men and $28,076 for women, a difference of 14.7%.
| Sex | Number | Average Earnings |
| Male | 2,557 (72.7%) | $32,925 |
| Female | 962 (27.3%) | $28,076 |
| Total | 3,519 (100.0%) | $30,754 |
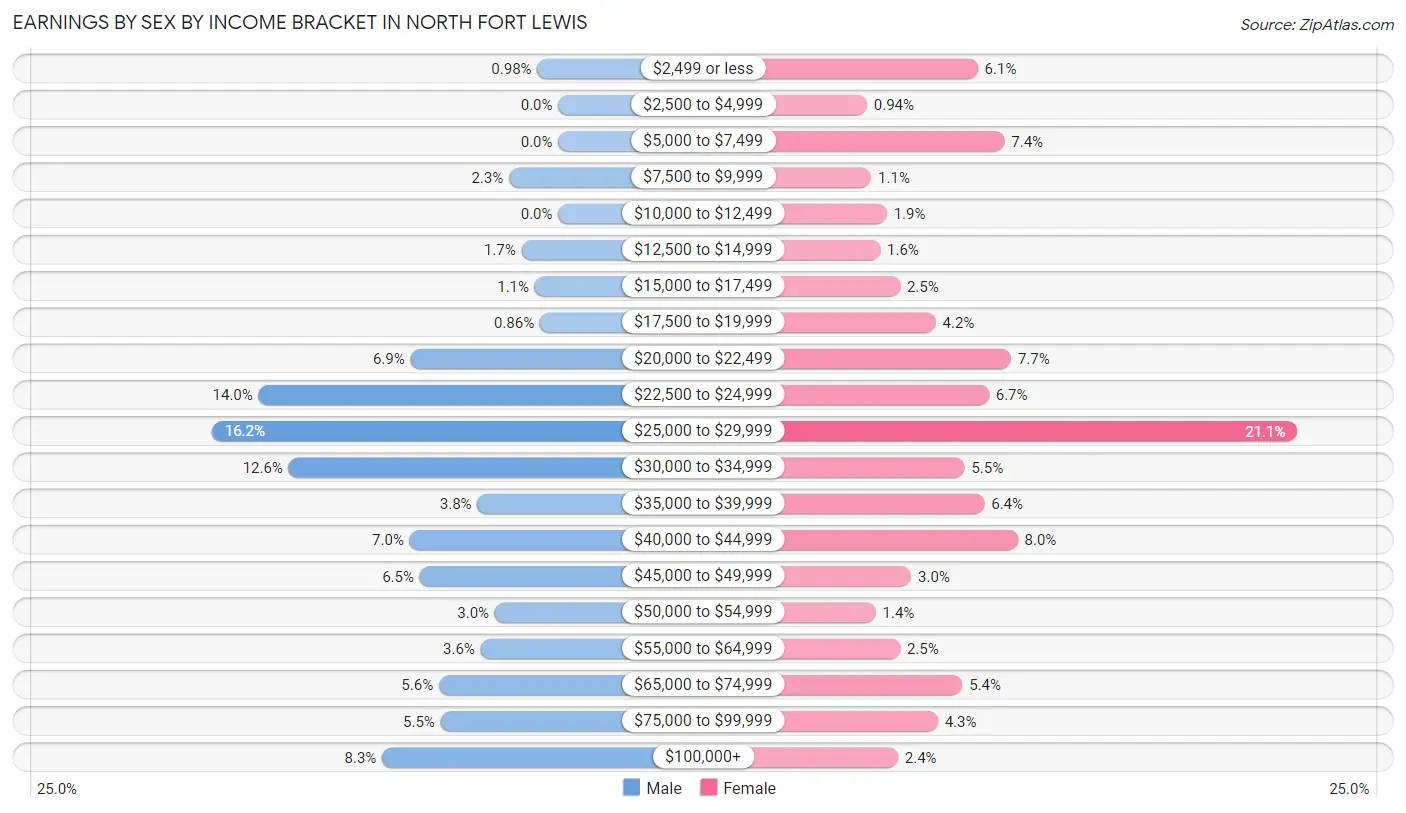
Earnings by Sex by Income Bracket in North Fort Lewis
The most common earnings brackets in North Fort Lewis are $25,000 to $29,999 for men (415 | 16.2%) and $25,000 to $29,999 for women (203 | 21.1%).
| Income | Male | Female |
| $2,499 or less | 25 (1.0%) | 59 (6.1%) |
| $2,500 to $4,999 | 0 (0.0%) | 9 (0.9%) |
| $5,000 to $7,499 | 0 (0.0%) | 71 (7.4%) |
| $7,500 to $9,999 | 59 (2.3%) | 11 (1.1%) |
| $10,000 to $12,499 | 0 (0.0%) | 18 (1.9%) |
| $12,500 to $14,999 | 44 (1.7%) | 15 (1.6%) |
| $15,000 to $17,499 | 28 (1.1%) | 24 (2.5%) |
| $17,500 to $19,999 | 22 (0.9%) | 40 (4.2%) |
| $20,000 to $22,499 | 177 (6.9%) | 74 (7.7%) |
| $22,500 to $24,999 | 359 (14.0%) | 64 (6.7%) |
| $25,000 to $29,999 | 415 (16.2%) | 203 (21.1%) |
| $30,000 to $34,999 | 323 (12.6%) | 53 (5.5%) |
| $35,000 to $39,999 | 97 (3.8%) | 62 (6.4%) |
| $40,000 to $44,999 | 178 (7.0%) | 77 (8.0%) |
| $45,000 to $49,999 | 166 (6.5%) | 29 (3.0%) |
| $50,000 to $54,999 | 76 (3.0%) | 13 (1.3%) |
| $55,000 to $64,999 | 93 (3.6%) | 24 (2.5%) |
| $65,000 to $74,999 | 143 (5.6%) | 52 (5.4%) |
| $75,000 to $99,999 | 141 (5.5%) | 41 (4.3%) |
| $100,000+ | 211 (8.3%) | 23 (2.4%) |
| Total | 2,557 (100.0%) | 962 (100.0%) |
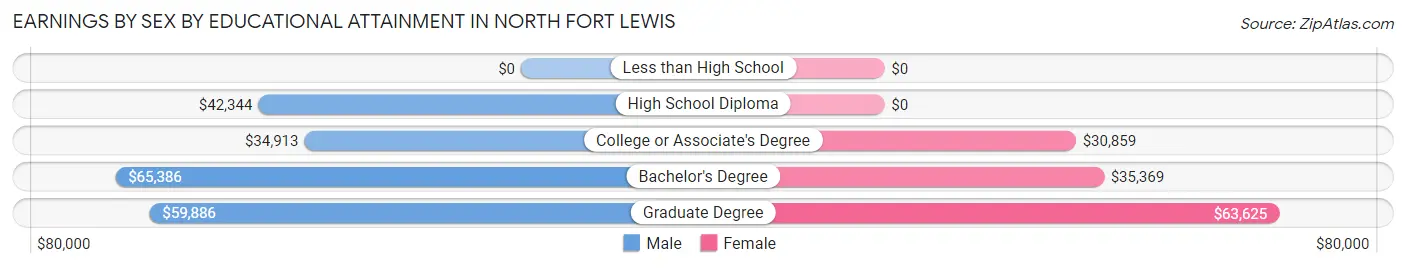
Earnings by Sex by Educational Attainment in North Fort Lewis
Average earnings in North Fort Lewis are $46,440 for men and $31,852 for women, a difference of 31.4%. Men with an educational attainment of bachelor's degree enjoy the highest average annual earnings of $65,386, while those with college or associate's degree education earn the least with $34,913. Women with an educational attainment of graduate degree earn the most with the average annual earnings of $63,625, while those with college or associate's degree education have the smallest earnings of $30,859.
| Educational Attainment | Male Income | Female Income |
| Less than High School | - | - |
| High School Diploma | $42,344 | $0 |
| College or Associate's Degree | $34,913 | $30,859 |
| Bachelor's Degree | $65,386 | $35,369 |
| Graduate Degree | $59,886 | $63,625 |
| Total | $46,440 | $31,852 |
Family Income in North Fort Lewis
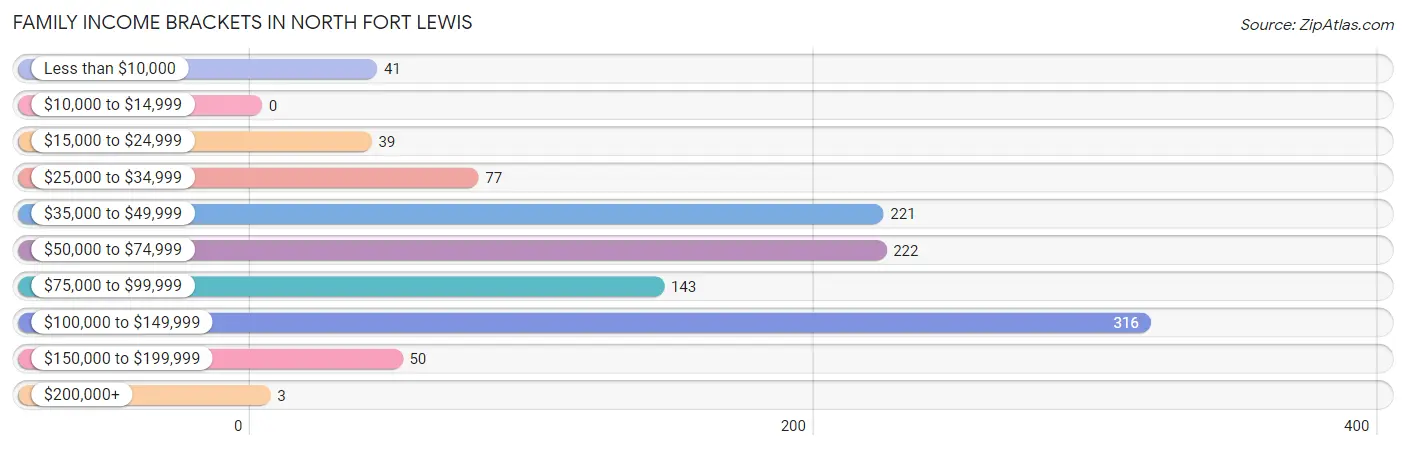
Family Income Brackets in North Fort Lewis
According to the North Fort Lewis family income data, there are 316 families falling into the $100,000 to $149,999 income range, which is the most common income bracket and makes up 28.4% of all families.
| Income Bracket | # Families | % Families |
| Less than $10,000 | 41 | 3.7% |
| $10,000 to $14,999 | 0 | 0.0% |
| $15,000 to $24,999 | 39 | 3.5% |
| $25,000 to $34,999 | 77 | 6.9% |
| $35,000 to $49,999 | 221 | 19.9% |
| $50,000 to $74,999 | 222 | 20.0% |
| $75,000 to $99,999 | 143 | 12.9% |
| $100,000 to $149,999 | 316 | 28.4% |
| $150,000 to $199,999 | 50 | 4.5% |
| $200,000+ | 3 | 0.3% |
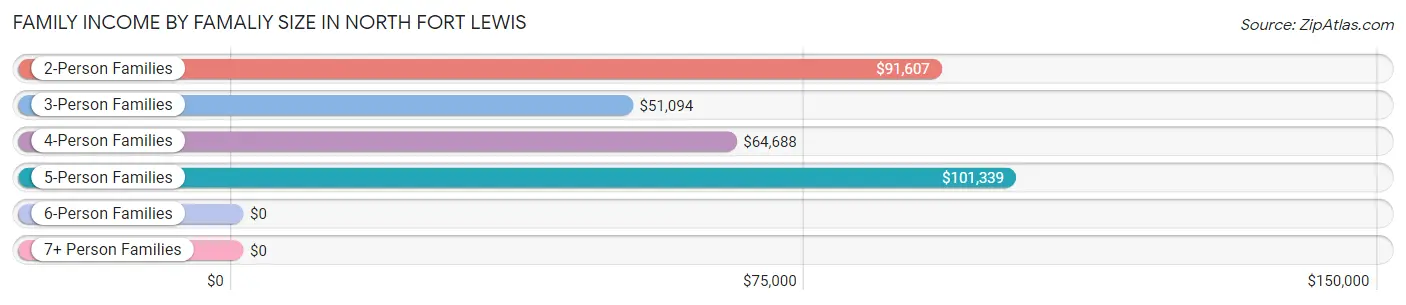
Family Income by Famaliy Size in North Fort Lewis
5-person families (147 | 13.2%) account for the highest median family income in North Fort Lewis with $101,339 per family, while 2-person families (229 | 20.6%) have the highest median income of $45,804 per family member.
| Income Bracket | # Families | Median Income |
| 2-Person Families | 229 (20.6%) | $91,607 |
| 3-Person Families | 173 (15.6%) | $51,094 |
| 4-Person Families | 483 (43.5%) | $64,688 |
| 5-Person Families | 147 (13.2%) | $101,339 |
| 6-Person Families | 68 (6.1%) | $0 |
| 7+ Person Families | 11 (1.0%) | $0 |
| Total | 1,111 (100.0%) | $70,260 |
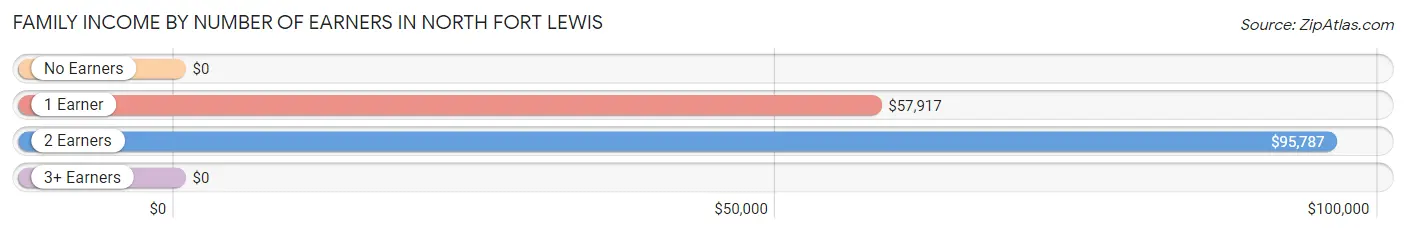
Family Income by Number of Earners in North Fort Lewis
| Number of Earners | # Families | Median Income |
| No Earners | 7 (0.6%) | $0 |
| 1 Earner | 632 (56.9%) | $57,917 |
| 2 Earners | 453 (40.8%) | $95,787 |
| 3+ Earners | 19 (1.7%) | $0 |
| Total | 1,111 (100.0%) | $70,260 |
Household Income in North Fort Lewis
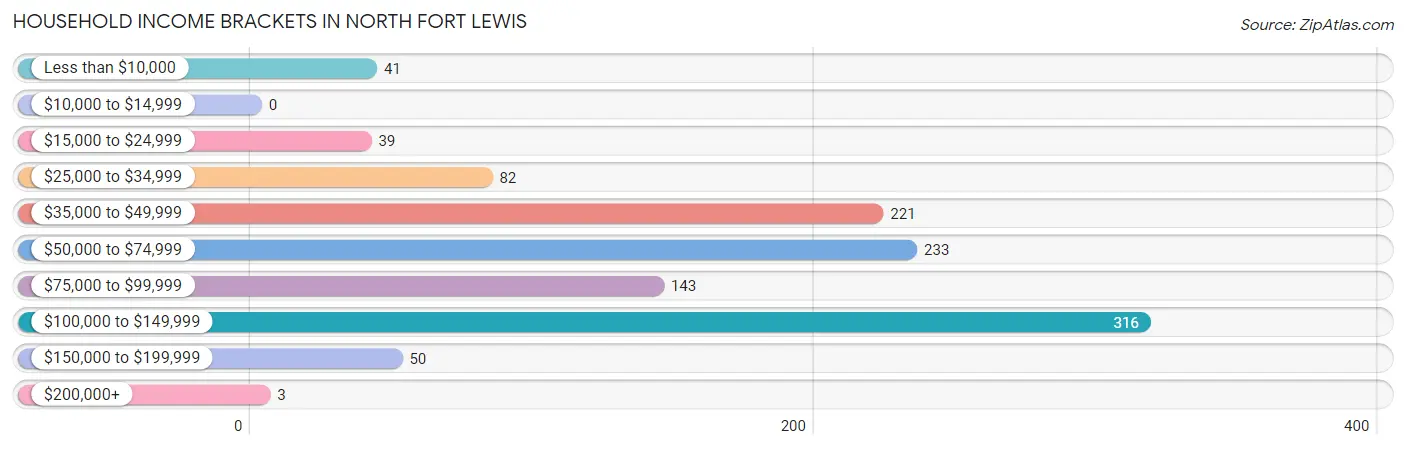
Household Income Brackets in North Fort Lewis
With 316 households falling in the category, the $100,000 to $149,999 income range is the most frequent in North Fort Lewis, accounting for 28.0% of all households.
| Income Bracket | # Households | % Households |
| Less than $10,000 | 41 | 3.6% |
| $10,000 to $14,999 | 0 | 0.0% |
| $15,000 to $24,999 | 39 | 3.5% |
| $25,000 to $34,999 | 82 | 7.3% |
| $35,000 to $49,999 | 221 | 19.6% |
| $50,000 to $74,999 | 233 | 20.7% |
| $75,000 to $99,999 | 143 | 12.7% |
| $100,000 to $149,999 | 316 | 28.0% |
| $150,000 to $199,999 | 50 | 4.4% |
| $200,000+ | 3 | 0.3% |
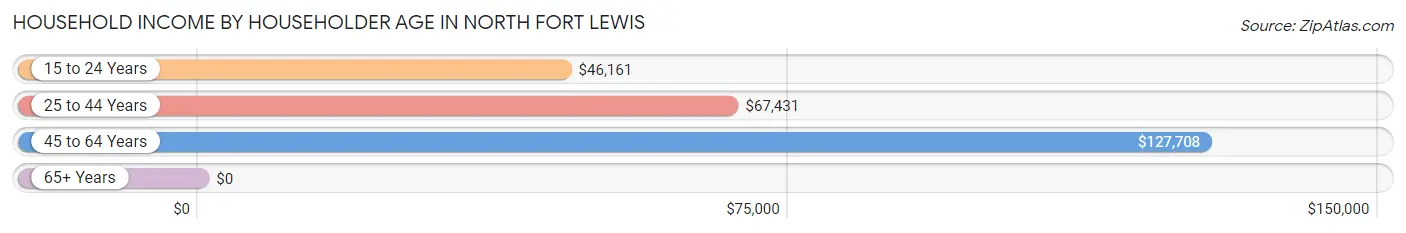
Household Income by Householder Age in North Fort Lewis
The median household income in North Fort Lewis is $67,708, with the highest median household income of $127,708 found in the 45 to 64 years age bracket for the primary householder. A total of 105 households (9.3%) fall into this category.
| Income Bracket | # Households | Median Income |
| 15 to 24 Years | 61 (5.4%) | $46,161 |
| 25 to 44 Years | 961 (85.3%) | $67,431 |
| 45 to 64 Years | 105 (9.3%) | $127,708 |
| 65+ Years | 0 (0.0%) | $0 |
| Total | 1,127 (100.0%) | $67,708 |
Poverty in North Fort Lewis
Income Below Poverty by Sex and Age in North Fort Lewis
With 17.1% poverty level for males and 12.6% for females among the residents of North Fort Lewis, 5 year old males and under 5 year old females are the most vulnerable to poverty, with 48 males (45.3%) and 110 females (31.4%) in their respective age groups living below the poverty level.
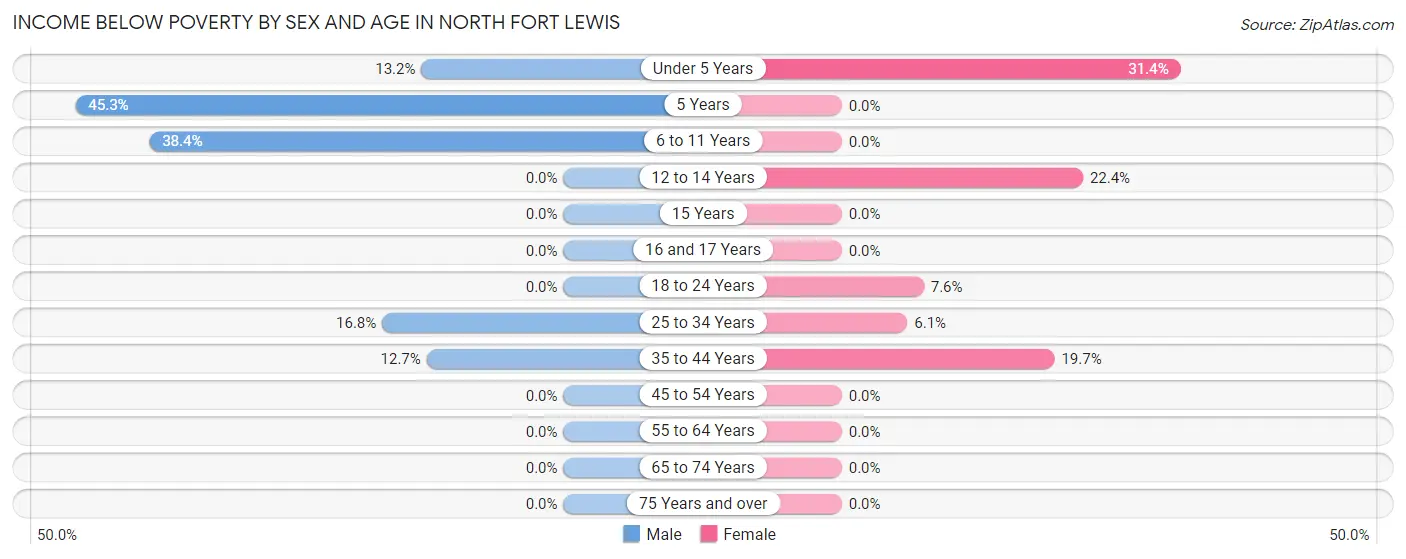
| Age Bracket | Male | Female |
| Under 5 Years | 34 (13.2%) | 110 (31.4%) |
| 5 Years | 48 (45.3%) | 0 (0.0%) |
| 6 to 11 Years | 108 (38.4%) | 0 (0.0%) |
| 12 to 14 Years | 0 (0.0%) | 32 (22.4%) |
| 15 Years | 0 (0.0%) | 0 (0.0%) |
| 16 and 17 Years | 0 (0.0%) | 0 (0.0%) |
| 18 to 24 Years | 0 (0.0%) | 15 (7.6%) |
| 25 to 34 Years | 91 (16.8%) | 32 (6.1%) |
| 35 to 44 Years | 57 (12.7%) | 75 (19.7%) |
| 45 to 54 Years | 0 (0.0%) | 0 (0.0%) |
| 55 to 64 Years | 0 (0.0%) | 0 (0.0%) |
| 65 to 74 Years | 0 (0.0%) | 0 (0.0%) |
| 75 Years and over | 0 (0.0%) | 0 (0.0%) |
| Total | 338 (17.1%) | 264 (12.6%) |
Income Above Poverty by Sex and Age in North Fort Lewis
According to the poverty statistics in North Fort Lewis, males aged 12 to 14 years and females aged 5 years are the age groups that are most secure financially, with 100.0% of males and 100.0% of females in these age groups living above the poverty line.
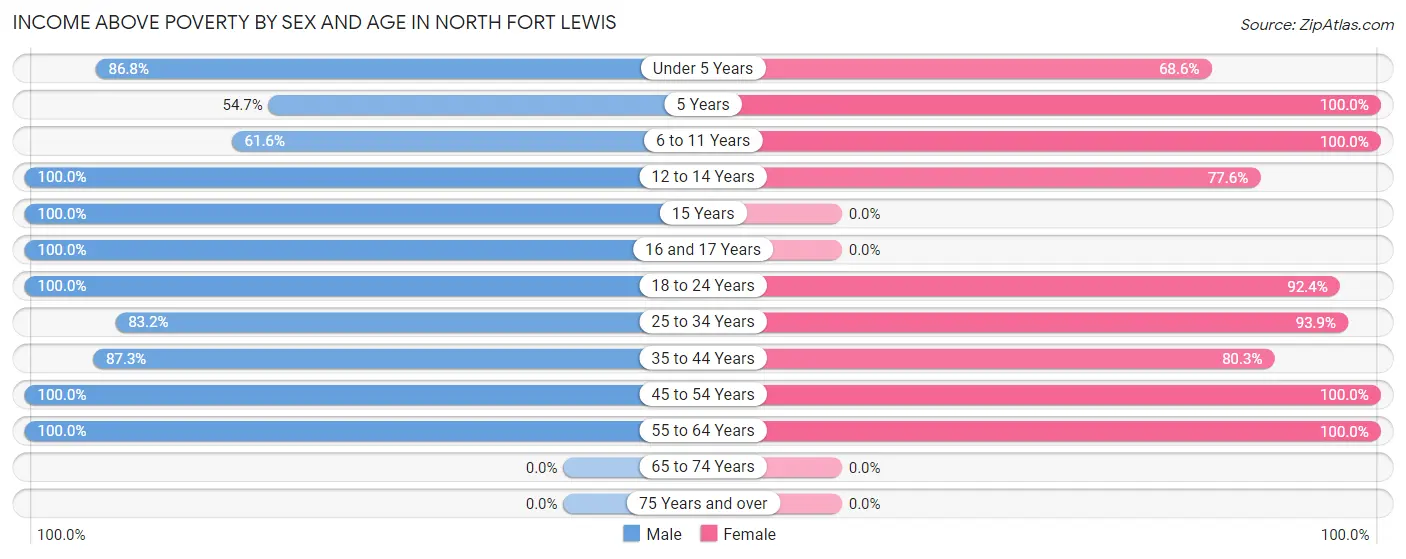
| Age Bracket | Male | Female |
| Under 5 Years | 224 (86.8%) | 240 (68.6%) |
| 5 Years | 58 (54.7%) | 59 (100.0%) |
| 6 to 11 Years | 173 (61.6%) | 334 (100.0%) |
| 12 to 14 Years | 91 (100.0%) | 111 (77.6%) |
| 15 Years | 55 (100.0%) | 0 (0.0%) |
| 16 and 17 Years | 15 (100.0%) | 0 (0.0%) |
| 18 to 24 Years | 77 (100.0%) | 182 (92.4%) |
| 25 to 34 Years | 450 (83.2%) | 494 (93.9%) |
| 35 to 44 Years | 392 (87.3%) | 305 (80.3%) |
| 45 to 54 Years | 92 (100.0%) | 81 (100.0%) |
| 55 to 64 Years | 11 (100.0%) | 25 (100.0%) |
| 65 to 74 Years | 0 (0.0%) | 0 (0.0%) |
| 75 Years and over | 0 (0.0%) | 0 (0.0%) |
| Total | 1,638 (82.9%) | 1,831 (87.4%) |
Income Below Poverty Among Married-Couple Families in North Fort Lewis
The poverty statistics for married-couple families in North Fort Lewis show that 11.4% or 120 of the total 1,049 families live below the poverty line. Families with 3 or 4 children have the highest poverty rate of 35.5%, comprising of 70 families. On the other hand, families with no children have the lowest poverty rate of 0.0%, which includes 0 families.
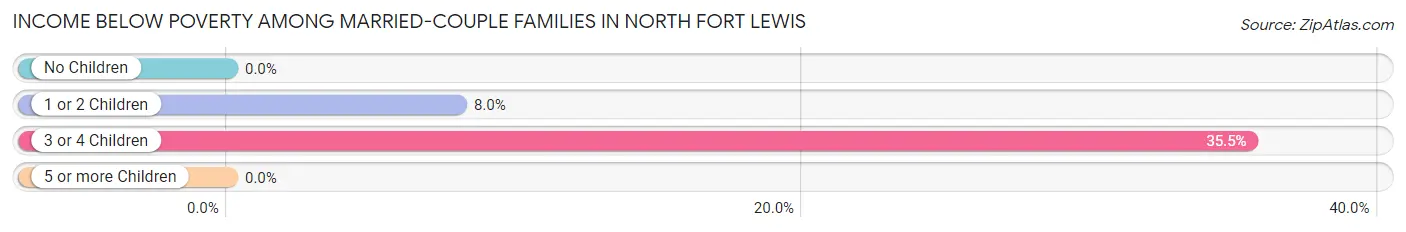
| Children | Above Poverty | Below Poverty |
| No Children | 214 (100.0%) | 0 (0.0%) |
| 1 or 2 Children | 577 (92.0%) | 50 (8.0%) |
| 3 or 4 Children | 127 (64.5%) | 70 (35.5%) |
| 5 or more Children | 11 (100.0%) | 0 (0.0%) |
| Total | 929 (88.6%) | 120 (11.4%) |
Income Below Poverty Among Single-Parent Households in North Fort Lewis
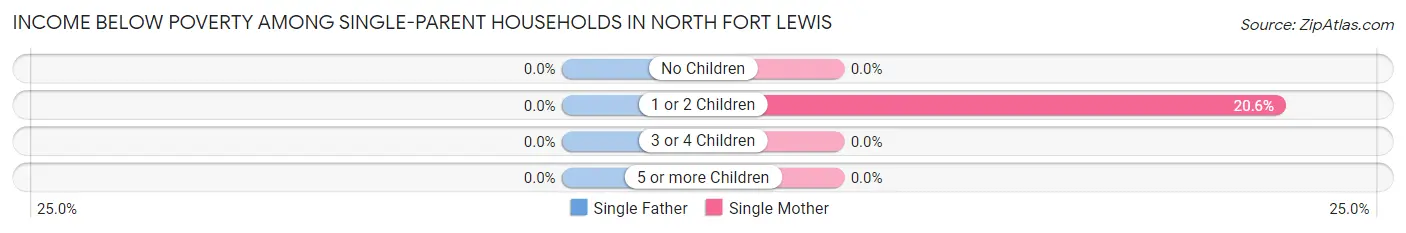
| Children | Single Father | Single Mother |
| No Children | 0 (0.0%) | 0 (0.0%) |
| 1 or 2 Children | 0 (0.0%) | 7 (20.6%) |
| 3 or 4 Children | 0 (0.0%) | 0 (0.0%) |
| 5 or more Children | 0 (0.0%) | 0 (0.0%) |
| Total | 0 (0.0%) | 7 (14.9%) |
Income Below Poverty Among Married-Couple vs Single-Parent Households in North Fort Lewis
The poverty data for North Fort Lewis shows that 120 of the married-couple family households (11.4%) and 7 of the single-parent households (11.3%) are living below the poverty level. Within the married-couple family households, those with 3 or 4 children have the highest poverty rate, with 70 households (35.5%) falling below the poverty line. Among the single-parent households, those with 1 or 2 children have the highest poverty rate, with 7 household (20.6%) living below poverty.
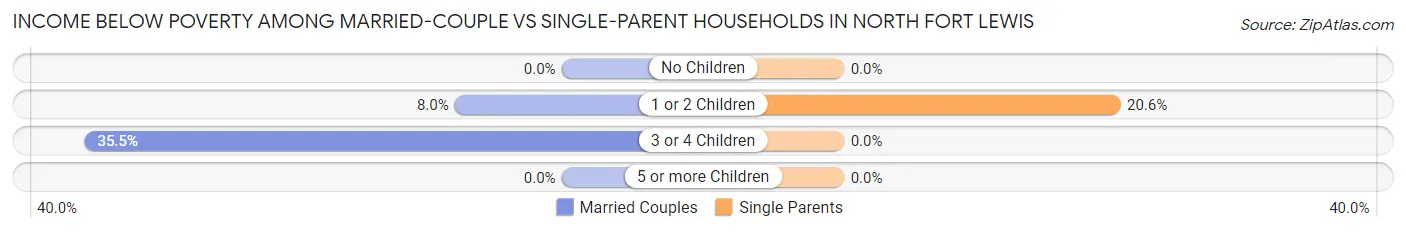
| Children | Married-Couple Families | Single-Parent Households |
| No Children | 0 (0.0%) | 0 (0.0%) |
| 1 or 2 Children | 50 (8.0%) | 7 (20.6%) |
| 3 or 4 Children | 70 (35.5%) | 0 (0.0%) |
| 5 or more Children | 0 (0.0%) | 0 (0.0%) |
| Total | 120 (11.4%) | 7 (11.3%) |
Race in North Fort Lewis
The most populous races in North Fort Lewis are White / Caucasian (3,984 | 66.2%), Hispanic or Latino (1,072 | 17.8%), and Black / African American (646 | 10.7%).
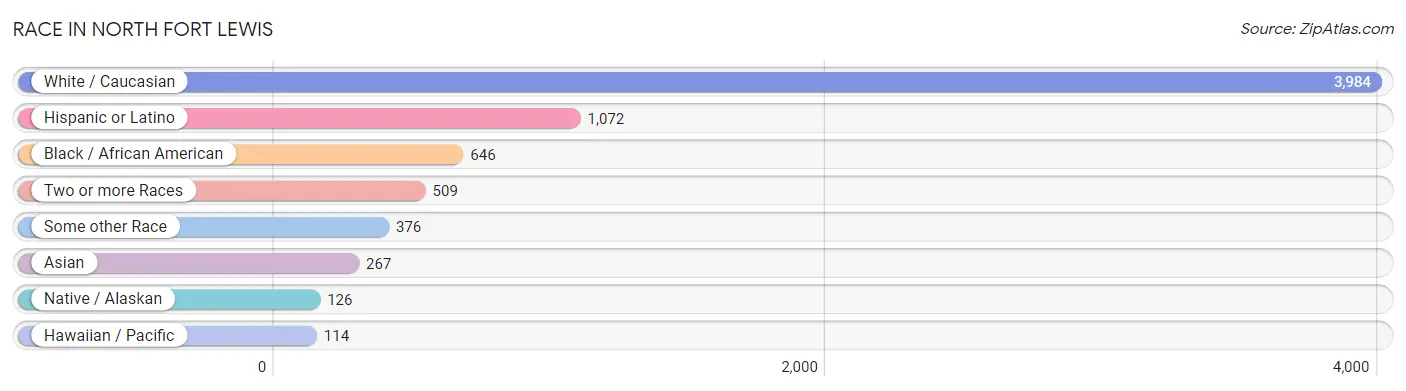
| Race | # Population | % Population |
| Asian | 267 | 4.4% |
| Black / African American | 646 | 10.7% |
| Hawaiian / Pacific | 114 | 1.9% |
| Hispanic or Latino | 1,072 | 17.8% |
| Native / Alaskan | 126 | 2.1% |
| White / Caucasian | 3,984 | 66.2% |
| Two or more Races | 509 | 8.5% |
| Some other Race | 376 | 6.2% |
| Total | 6,022 | 100.0% |
Ancestry in North Fort Lewis
The most populous ancestries reported in North Fort Lewis are German (1,062 | 17.6%), Mexican (668 | 11.1%), Irish (482 | 8.0%), English (453 | 7.5%), and Puerto Rican (280 | 4.6%), together accounting for 48.9% of all North Fort Lewis residents.
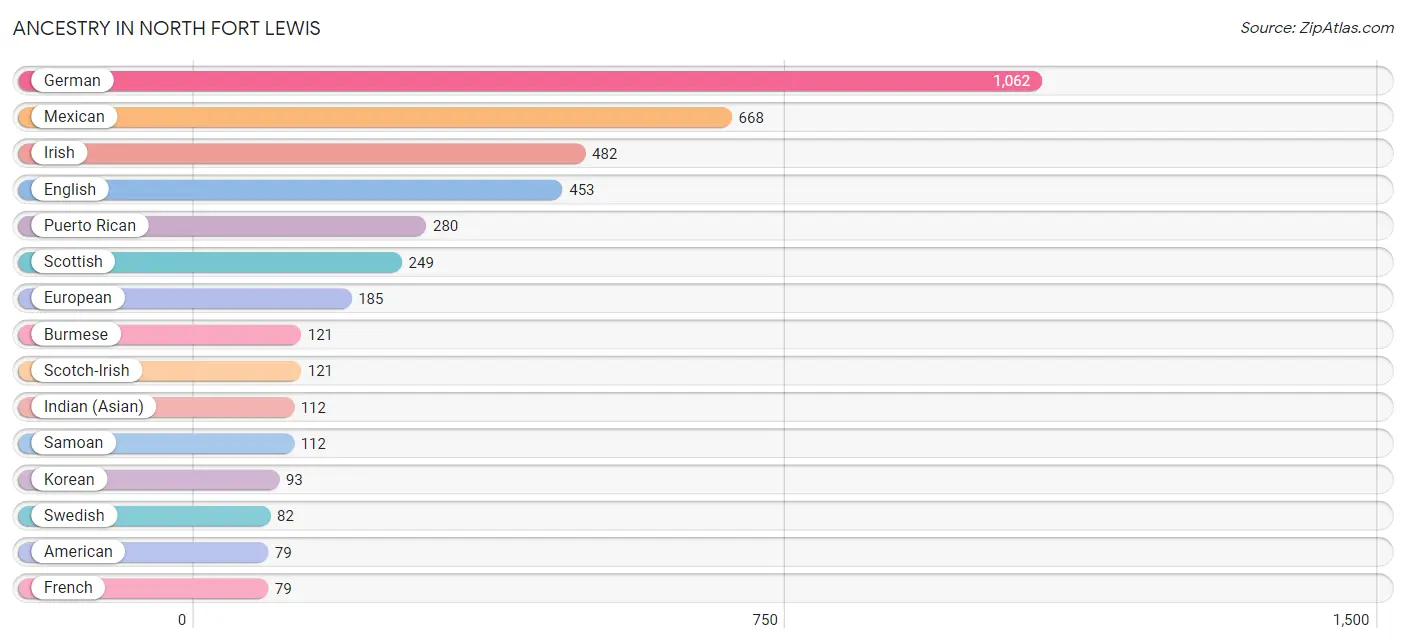
| Ancestry | # Population | % Population |
| African | 14 | 0.2% |
| Albanian | 16 | 0.3% |
| American | 79 | 1.3% |
| Armenian | 16 | 0.3% |
| Austrian | 5 | 0.1% |
| Bhutanese | 51 | 0.9% |
| Blackfeet | 8 | 0.1% |
| British | 35 | 0.6% |
| Burmese | 121 | 2.0% |
| Central American | 5 | 0.1% |
| Central American Indian | 10 | 0.2% |
| Cherokee | 35 | 0.6% |
| Czech | 22 | 0.4% |
| Dominican | 20 | 0.3% |
| Dutch | 23 | 0.4% |
| Ecuadorian | 7 | 0.1% |
| English | 453 | 7.5% |
| Ethiopian | 33 | 0.5% |
| European | 185 | 3.1% |
| French | 79 | 1.3% |
| German | 1,062 | 17.6% |
| German Russian | 45 | 0.7% |
| Ghanaian | 6 | 0.1% |
| Guamanian / Chamorro | 46 | 0.8% |
| Hungarian | 9 | 0.2% |
| Indian (Asian) | 112 | 1.9% |
| Iranian | 21 | 0.4% |
| Irish | 482 | 8.0% |
| Italian | 73 | 1.2% |
| Jamaican | 16 | 0.3% |
| Japanese | 19 | 0.3% |
| Korean | 93 | 1.5% |
| Lithuanian | 10 | 0.2% |
| Mexican | 668 | 11.1% |
| Navajo | 25 | 0.4% |
| Norwegian | 14 | 0.2% |
| Pakistani | 7 | 0.1% |
| Peruvian | 7 | 0.1% |
| Polish | 51 | 0.9% |
| Portuguese | 5 | 0.1% |
| Puerto Rican | 280 | 4.6% |
| Salvadoran | 5 | 0.1% |
| Samoan | 112 | 1.9% |
| Scandinavian | 26 | 0.4% |
| Scotch-Irish | 121 | 2.0% |
| Scottish | 249 | 4.1% |
| South American | 14 | 0.2% |
| Spaniard | 23 | 0.4% |
| Sri Lankan | 32 | 0.5% |
| Subsaharan African | 53 | 0.9% |
| Swedish | 82 | 1.4% |
| U.S. Virgin Islander | 7 | 0.1% |
| Ukrainian | 7 | 0.1% |
| Welsh | 5 | 0.1% | View All 54 Rows |
Immigrants in North Fort Lewis
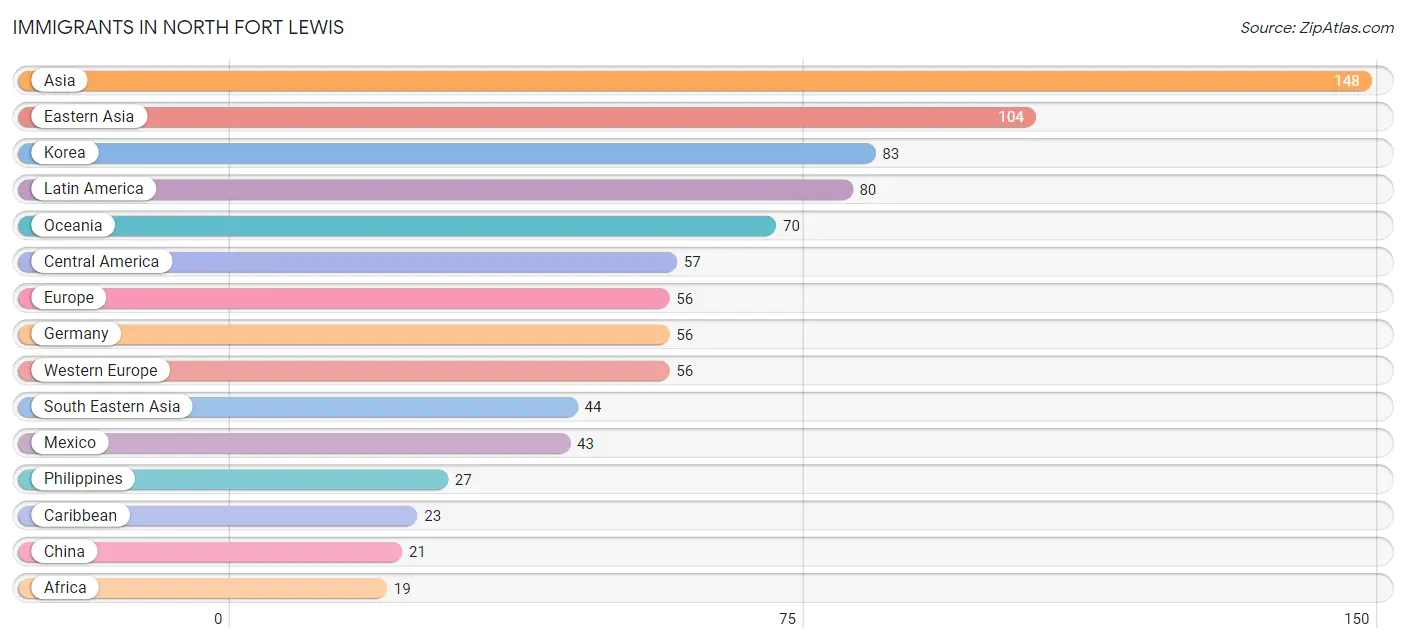
The most numerous immigrant groups reported in North Fort Lewis came from Asia (148 | 2.5%), Eastern Asia (104 | 1.7%), Korea (83 | 1.4%), Latin America (80 | 1.3%), and Oceania (70 | 1.2%), together accounting for 8.1% of all North Fort Lewis residents.
| Immigration Origin | # Population | % Population |
| Africa | 19 | 0.3% |
| Asia | 148 | 2.5% |
| Cameroon | 6 | 0.1% |
| Caribbean | 23 | 0.4% |
| Central America | 57 | 0.9% |
| China | 21 | 0.4% |
| Dominican Republic | 7 | 0.1% |
| Eastern Africa | 13 | 0.2% |
| Eastern Asia | 104 | 1.7% |
| El Salvador | 14 | 0.2% |
| Ethiopia | 13 | 0.2% |
| Europe | 56 | 0.9% |
| Germany | 56 | 0.9% |
| Indonesia | 17 | 0.3% |
| Jamaica | 16 | 0.3% |
| Korea | 83 | 1.4% |
| Latin America | 80 | 1.3% |
| Mexico | 43 | 0.7% |
| Micronesia | 2 | 0.0% |
| Middle Africa | 6 | 0.1% |
| Oceania | 70 | 1.2% |
| Philippines | 27 | 0.4% |
| South Eastern Asia | 44 | 0.7% |
| Western Europe | 56 | 0.9% | View All 24 Rows |
Sex and Age in North Fort Lewis
Sex and Age in North Fort Lewis
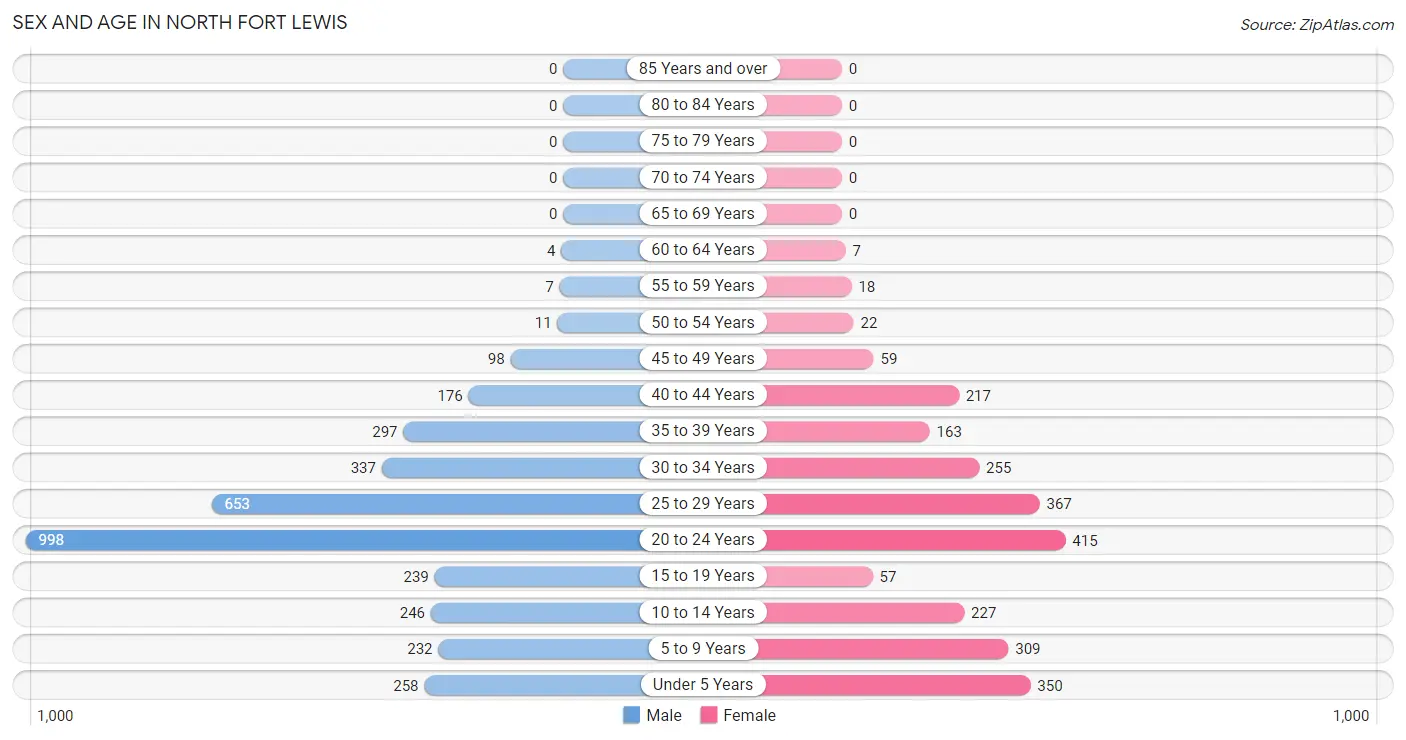
The most populous age groups in North Fort Lewis are 20 to 24 Years (998 | 28.1%) for men and 20 to 24 Years (415 | 16.8%) for women.
| Age Bracket | Male | Female |
| Under 5 Years | 258 (7.3%) | 350 (14.2%) |
| 5 to 9 Years | 232 (6.5%) | 309 (12.5%) |
| 10 to 14 Years | 246 (6.9%) | 227 (9.2%) |
| 15 to 19 Years | 239 (6.7%) | 57 (2.3%) |
| 20 to 24 Years | 998 (28.1%) | 415 (16.8%) |
| 25 to 29 Years | 653 (18.4%) | 367 (14.9%) |
| 30 to 34 Years | 337 (9.5%) | 255 (10.3%) |
| 35 to 39 Years | 297 (8.4%) | 163 (6.6%) |
| 40 to 44 Years | 176 (5.0%) | 217 (8.8%) |
| 45 to 49 Years | 98 (2.8%) | 59 (2.4%) |
| 50 to 54 Years | 11 (0.3%) | 22 (0.9%) |
| 55 to 59 Years | 7 (0.2%) | 18 (0.7%) |
| 60 to 64 Years | 4 (0.1%) | 7 (0.3%) |
| 65 to 69 Years | 0 (0.0%) | 0 (0.0%) |
| 70 to 74 Years | 0 (0.0%) | 0 (0.0%) |
| 75 to 79 Years | 0 (0.0%) | 0 (0.0%) |
| 80 to 84 Years | 0 (0.0%) | 0 (0.0%) |
| 85 Years and over | 0 (0.0%) | 0 (0.0%) |
| Total | 3,556 (100.0%) | 2,466 (100.0%) |
Families and Households in North Fort Lewis
Median Family Size in North Fort Lewis
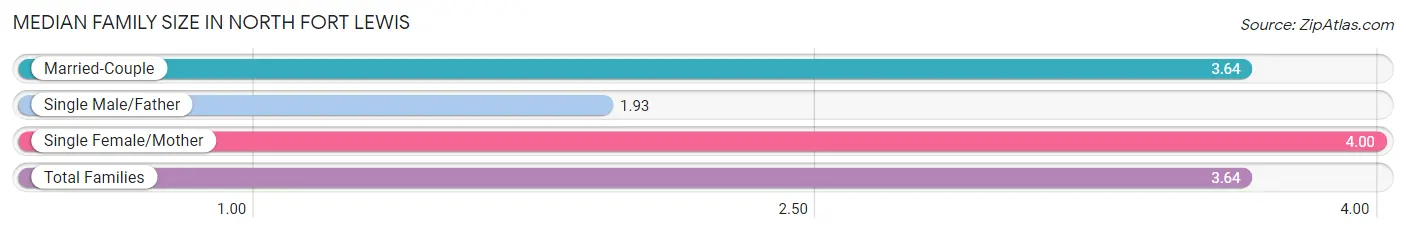
The median family size in North Fort Lewis is 3.64 persons per family, with single female/mother families (47 | 4.2%) accounting for the largest median family size of 4 persons per family. On the other hand, single male/father families (15 | 1.3%) represent the smallest median family size with 1.93 persons per family.
| Family Type | # Families | Family Size |
| Married-Couple | 1,049 (94.4%) | 3.64 |
| Single Male/Father | 15 (1.3%) | 1.93 |
| Single Female/Mother | 47 (4.2%) | 4.00 |
| Total Families | 1,111 (100.0%) | 3.64 |
Median Household Size in North Fort Lewis
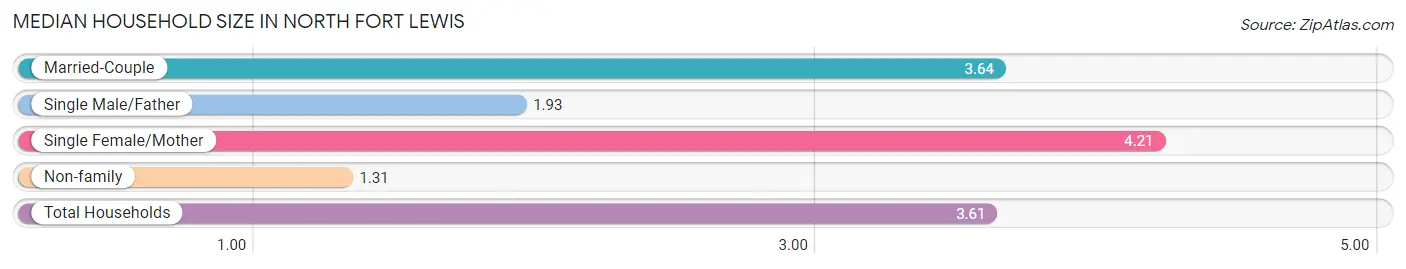
The median household size in North Fort Lewis is 3.61 persons per household, with single female/mother households (47 | 4.2%) accounting for the largest median household size of 4.21 persons per household. non-family households (16 | 1.4%) represent the smallest median household size with 1.31 persons per household.
| Household Type | # Households | Household Size |
| Married-Couple | 1,049 (93.1%) | 3.64 |
| Single Male/Father | 15 (1.3%) | 1.93 |
| Single Female/Mother | 47 (4.2%) | 4.21 |
| Non-family | 16 (1.4%) | 1.31 |
| Total Households | 1,127 (100.0%) | 3.61 |
Household Size by Marriage Status in North Fort Lewis
Out of a total of 1,127 households in North Fort Lewis, 1,111 (98.6%) are family households, while 16 (1.4%) are nonfamily households. The most numerous type of family households are 4-person households, comprising 473, and the most common type of nonfamily households are 1-person households, comprising 11.
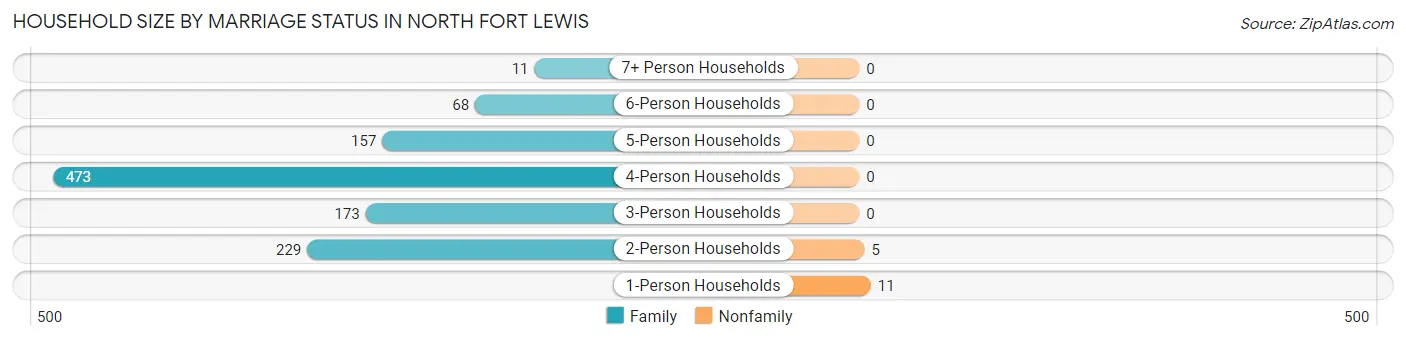
| Household Size | Family Households | Nonfamily Households |
| 1-Person Households | - | 11 (1.0%) |
| 2-Person Households | 229 (20.3%) | 5 (0.4%) |
| 3-Person Households | 173 (15.3%) | 0 (0.0%) |
| 4-Person Households | 473 (42.0%) | 0 (0.0%) |
| 5-Person Households | 157 (13.9%) | 0 (0.0%) |
| 6-Person Households | 68 (6.0%) | 0 (0.0%) |
| 7+ Person Households | 11 (1.0%) | 0 (0.0%) |
| Total | 1,111 (98.6%) | 16 (1.4%) |
Female Fertility in North Fort Lewis
Fertility by Age in North Fort Lewis
Average fertility rate in North Fort Lewis is 113.0 births per 1,000 women. Women in the age bracket of 35 to 50 years have the highest fertility rate with 121.0 births per 1,000 women. Women in the age bracket of 20 to 34 years acount for 69.4% of all women with births.
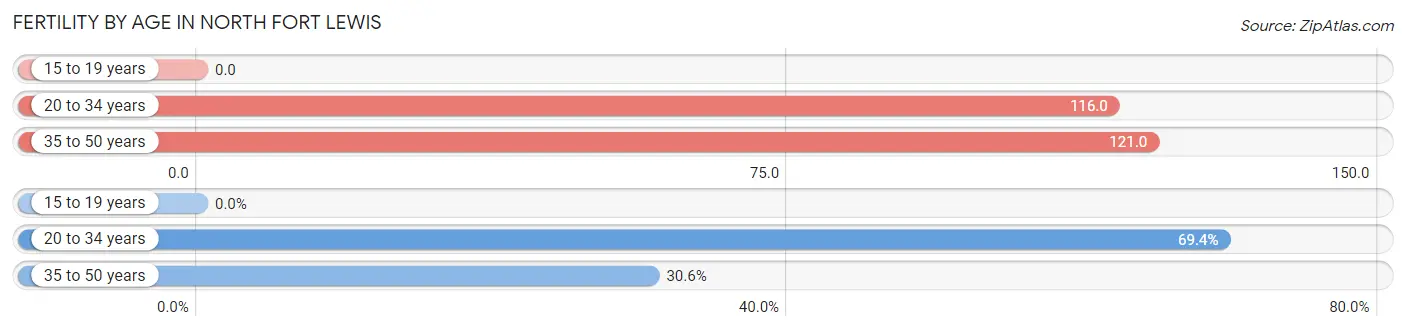
| Age Bracket | Women with Births | Births / 1,000 Women |
| 15 to 19 years | 0 (0.0%) | 0.0 |
| 20 to 34 years | 120 (69.4%) | 116.0 |
| 35 to 50 years | 53 (30.6%) | 121.0 |
| Total | 173 (100.0%) | 113.0 |
Fertility by Age by Marriage Status in North Fort Lewis
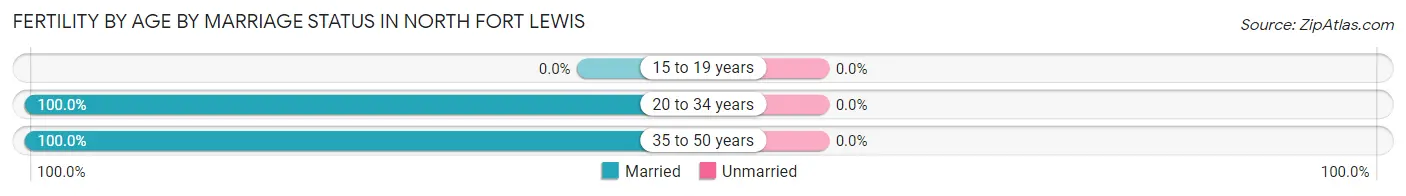
| Age Bracket | Married | Unmarried |
| 15 to 19 years | 0 (0.0%) | 0 (0.0%) |
| 20 to 34 years | 120 (100.0%) | 0 (0.0%) |
| 35 to 50 years | 53 (100.0%) | 0 (0.0%) |
| Total | 173 (100.0%) | 0 (0.0%) |
Fertility by Education in North Fort Lewis
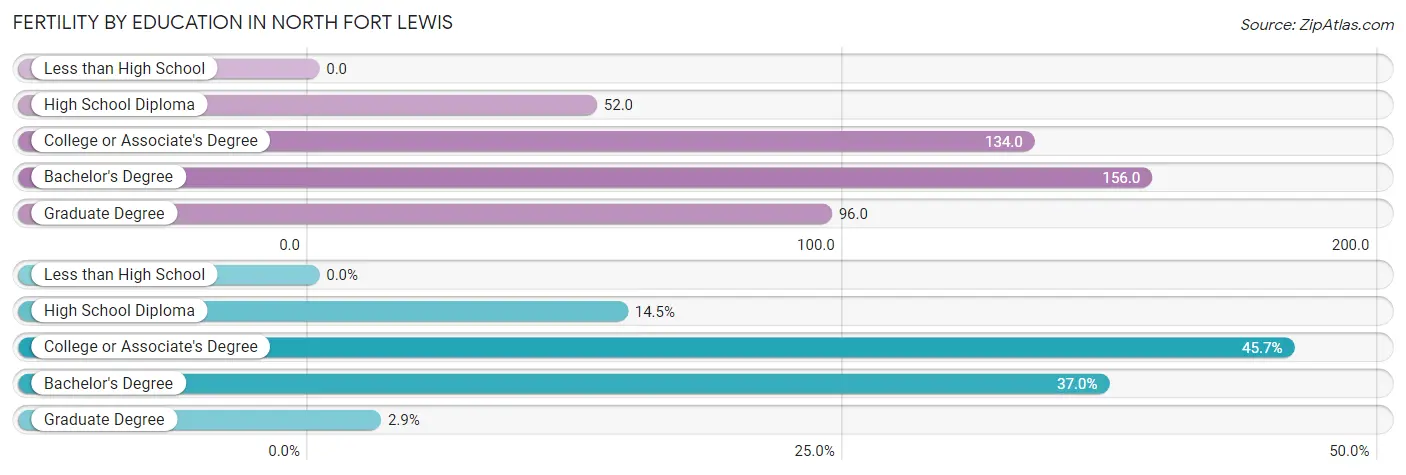
| Educational Attainment | Women with Births | Births / 1,000 Women |
| Less than High School | 0 (0.0%) | 0.0 |
| High School Diploma | 25 (14.4%) | 52.0 |
| College or Associate's Degree | 79 (45.7%) | 134.0 |
| Bachelor's Degree | 64 (37.0%) | 156.0 |
| Graduate Degree | 5 (2.9%) | 96.0 |
| Total | 173 (100.0%) | 113.0 |
Fertility by Education by Marriage Status in North Fort Lewis
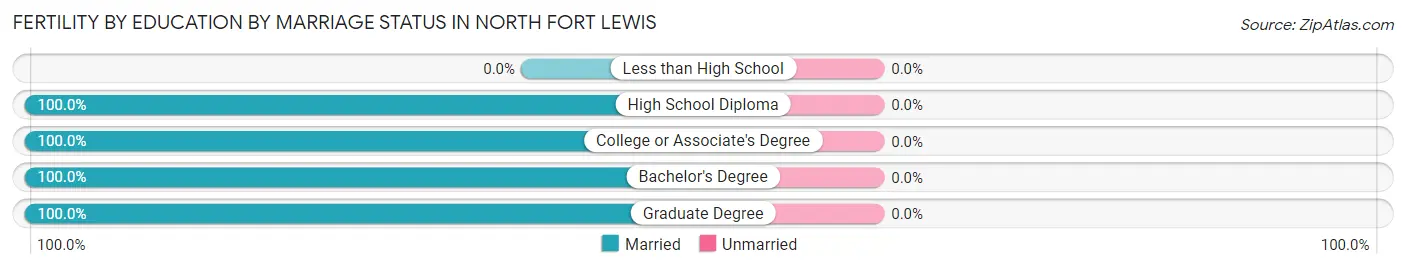
| Educational Attainment | Married | Unmarried |
| Less than High School | 0 (0.0%) | 0 (0.0%) |
| High School Diploma | 25 (100.0%) | 0 (0.0%) |
| College or Associate's Degree | 79 (100.0%) | 0 (0.0%) |
| Bachelor's Degree | 64 (100.0%) | 0 (0.0%) |
| Graduate Degree | 5 (100.0%) | 0 (0.0%) |
| Total | 173 (100.0%) | 0 (0.0%) |
Employment Characteristics in North Fort Lewis
Employment by Class of Employer in North Fort Lewis
Among the 3,349 employed individuals in North Fort Lewis, federal government employees (2,882 | 86.1%), private company employees (354 | 10.6%), and self-employed (not incorporated) (42 | 1.3%) make up the most common classes of employment.
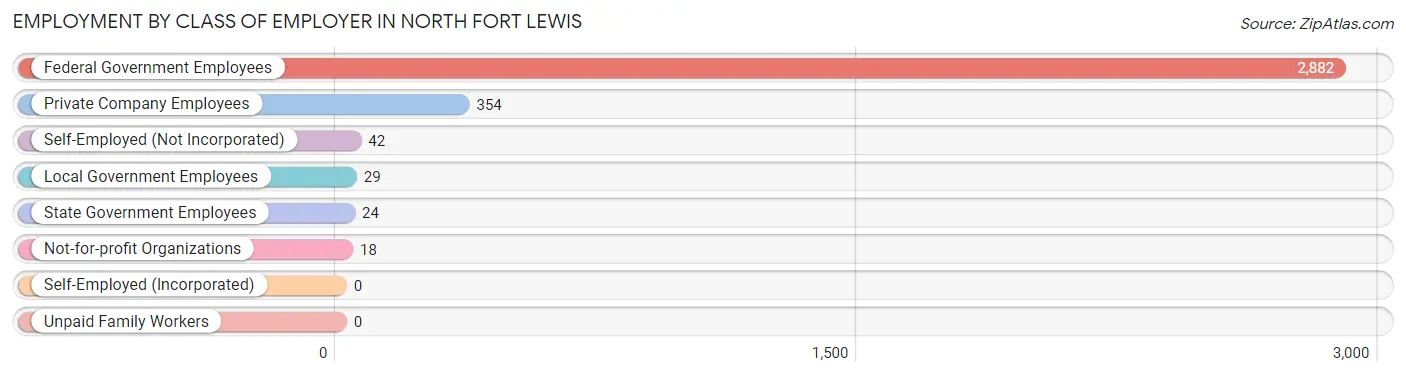
| Employer Class | # Employees | % Employees |
| Private Company Employees | 354 | 10.6% |
| Self-Employed (Incorporated) | 0 | 0.0% |
| Self-Employed (Not Incorporated) | 42 | 1.3% |
| Not-for-profit Organizations | 18 | 0.5% |
| Local Government Employees | 29 | 0.9% |
| State Government Employees | 24 | 0.7% |
| Federal Government Employees | 2,882 | 86.1% |
| Unpaid Family Workers | 0 | 0.0% |
| Total | 3,349 | 100.0% |
Employment Status by Age in North Fort Lewis
According to the labor force statistics for North Fort Lewis, out of the total population over 16 years of age (4,345), 80.1% or 3,480 individuals are in the labor force, with 14.7% or 512 of them unemployed. The age group with the highest labor force participation rate is 60 to 64 years, with 100.0% or 11 individuals in the labor force. Within the labor force, the 16 to 19 years age range has the highest percentage of unemployed individuals, with 50.0% or 106 of them being unemployed.
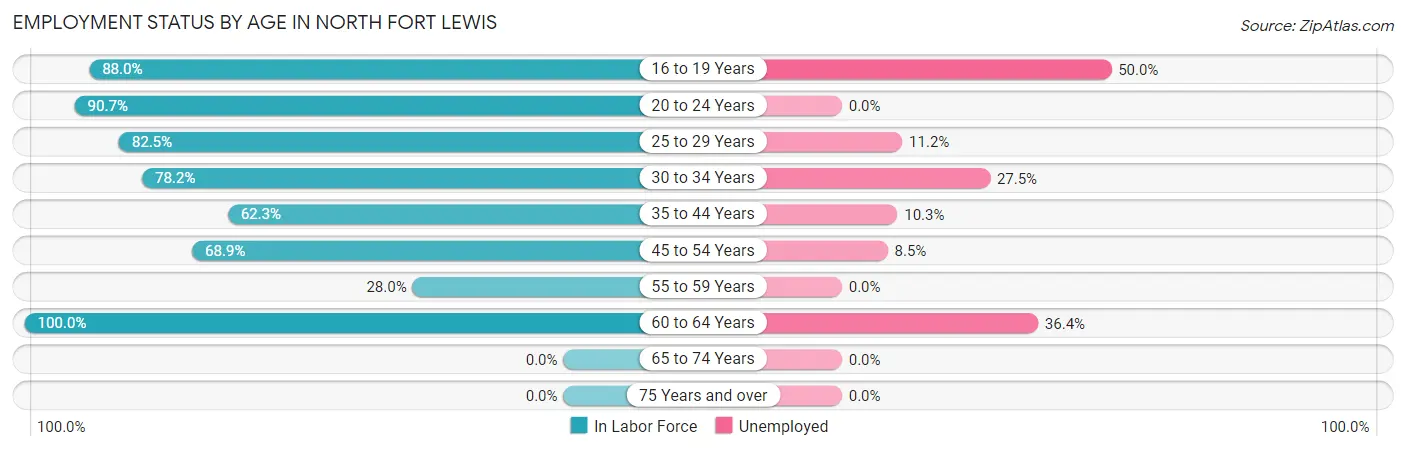
| Age Bracket | In Labor Force | Unemployed |
| 16 to 19 Years | 212 (88.0%) | 106 (50.0%) |
| 20 to 24 Years | 1,282 (90.7%) | 0 (0.0%) |
| 25 to 29 Years | 842 (82.5%) | 94 (11.2%) |
| 30 to 34 Years | 463 (78.2%) | 127 (27.5%) |
| 35 to 44 Years | 531 (62.3%) | 55 (10.3%) |
| 45 to 54 Years | 131 (68.9%) | 11 (8.5%) |
| 55 to 59 Years | 7 (28.0%) | 0 (0.0%) |
| 60 to 64 Years | 11 (100.0%) | 4 (36.4%) |
| 65 to 74 Years | 0 (0.0%) | 0 (0.0%) |
| 75 Years and over | 0 (0.0%) | 0 (0.0%) |
| Total | 3,480 (80.1%) | 512 (14.7%) |
Employment Status by Educational Attainment in North Fort Lewis
According to labor force statistics for North Fort Lewis, 73.8% of individuals (1,986) out of the total population between 25 and 64 years of age (2,691) are in the labor force, with 15.4% or 306 of them being unemployed. The group with the highest labor force participation rate are those with the educational attainment of bachelor's degree or higher, with 85.3% or 774 individuals in the labor force. Within the labor force, individuals with bachelor's degree or higher education have the highest percentage of unemployment, with 19.7% or 152 of them being unemployed.
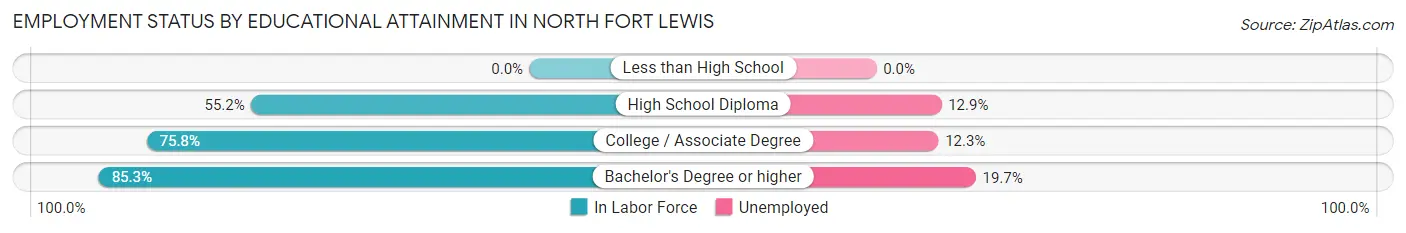
| Educational Attainment | In Labor Force | Unemployed |
| Less than High School | 0 (0.0%) | 0 (0.0%) |
| High School Diploma | 283 (55.2%) | 66 (12.9%) |
| College / Associate Degree | 928 (75.8%) | 151 (12.3%) |
| Bachelor's Degree or higher | 774 (85.3%) | 179 (19.7%) |
| Total | 1,986 (73.8%) | 414 (15.4%) |
Employment Occupations by Sex in North Fort Lewis
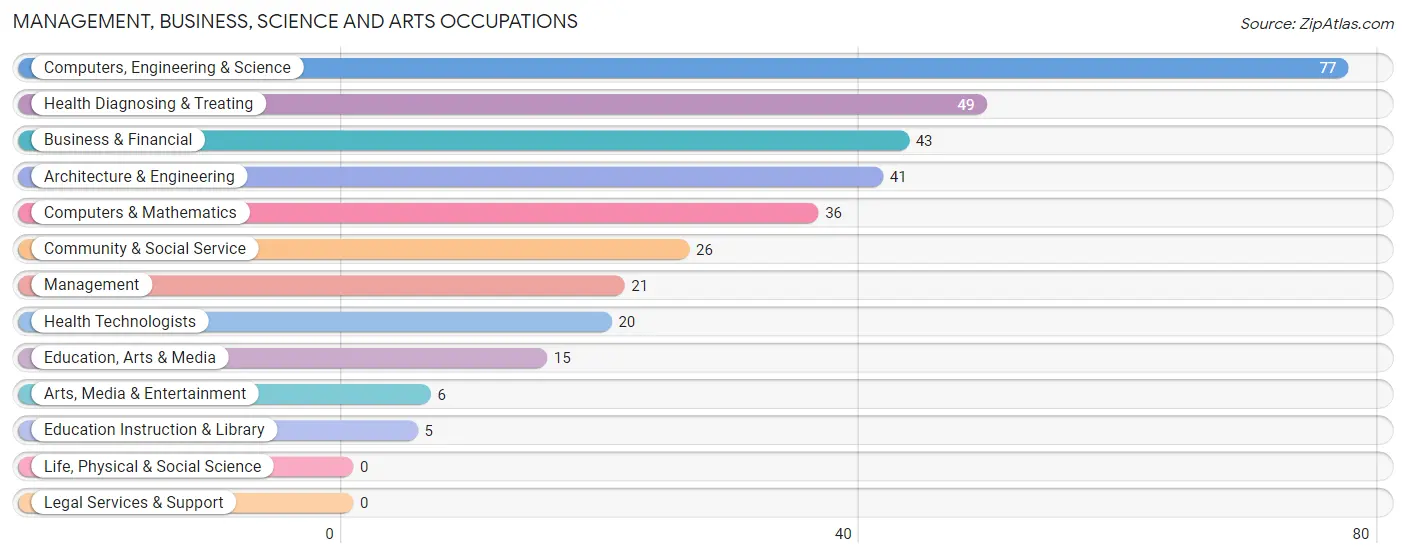
Management, Business, Science and Arts Occupations
The most common Management, Business, Science and Arts occupations in North Fort Lewis are Computers, Engineering & Science (77 | 13.1%), Health Diagnosing & Treating (49 | 8.4%), Business & Financial (43 | 7.3%), Architecture & Engineering (41 | 7.0%), and Computers & Mathematics (36 | 6.1%).
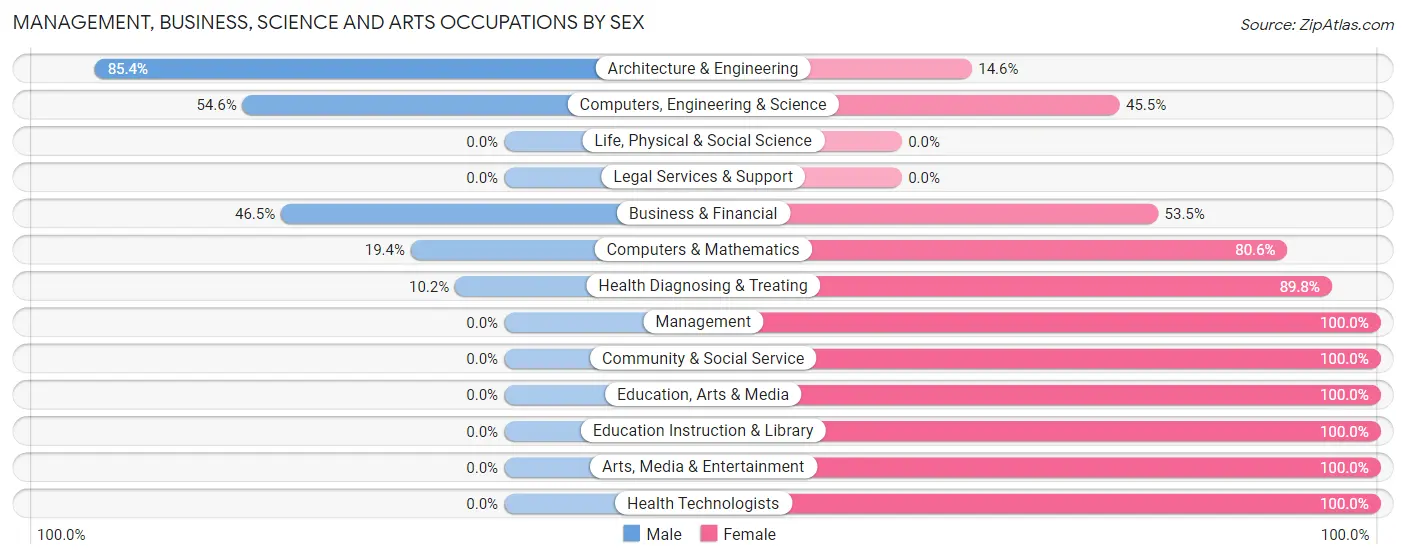
Management, Business, Science and Arts Occupations by Sex
Within the Management, Business, Science and Arts occupations in North Fort Lewis, the most male-oriented occupations are Architecture & Engineering (85.4%), Computers, Engineering & Science (54.5%), and Business & Financial (46.5%), while the most female-oriented occupations are Management (100.0%), Community & Social Service (100.0%), and Education, Arts & Media (100.0%).
| Occupation | Male | Female |
| Management | 0 (0.0%) | 21 (100.0%) |
| Business & Financial | 20 (46.5%) | 23 (53.5%) |
| Computers, Engineering & Science | 42 (54.5%) | 35 (45.5%) |
| Computers & Mathematics | 7 (19.4%) | 29 (80.6%) |
| Architecture & Engineering | 35 (85.4%) | 6 (14.6%) |
| Life, Physical & Social Science | 0 (0.0%) | 0 (0.0%) |
| Community & Social Service | 0 (0.0%) | 26 (100.0%) |
| Education, Arts & Media | 0 (0.0%) | 15 (100.0%) |
| Legal Services & Support | 0 (0.0%) | 0 (0.0%) |
| Education Instruction & Library | 0 (0.0%) | 5 (100.0%) |
| Arts, Media & Entertainment | 0 (0.0%) | 6 (100.0%) |
| Health Diagnosing & Treating | 5 (10.2%) | 44 (89.8%) |
| Health Technologists | 0 (0.0%) | 20 (100.0%) |
| Total (Category) | 67 (31.0%) | 149 (69.0%) |
| Total (Overall) | 197 (33.6%) | 390 (66.4%) |
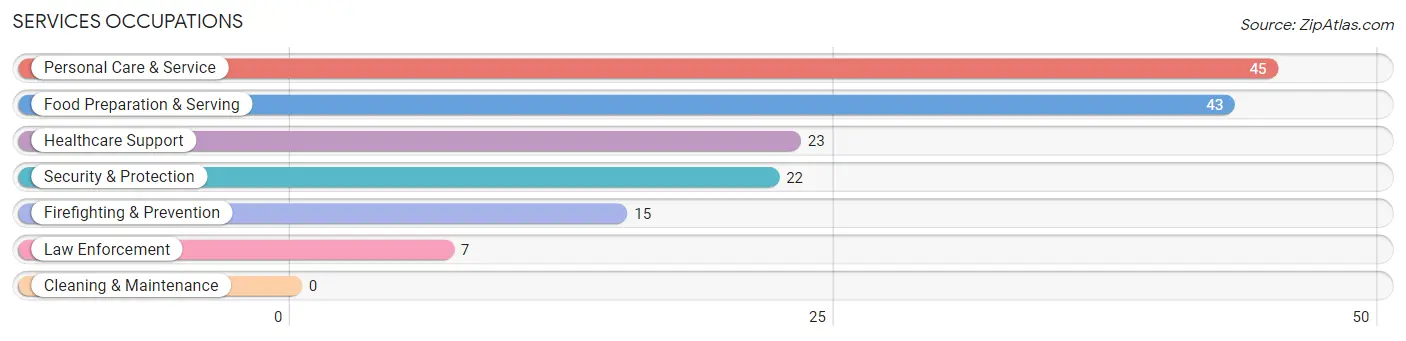
Services Occupations
The most common Services occupations in North Fort Lewis are Personal Care & Service (45 | 7.7%), Food Preparation & Serving (43 | 7.3%), Healthcare Support (23 | 3.9%), Security & Protection (22 | 3.7%), and Firefighting & Prevention (15 | 2.6%).
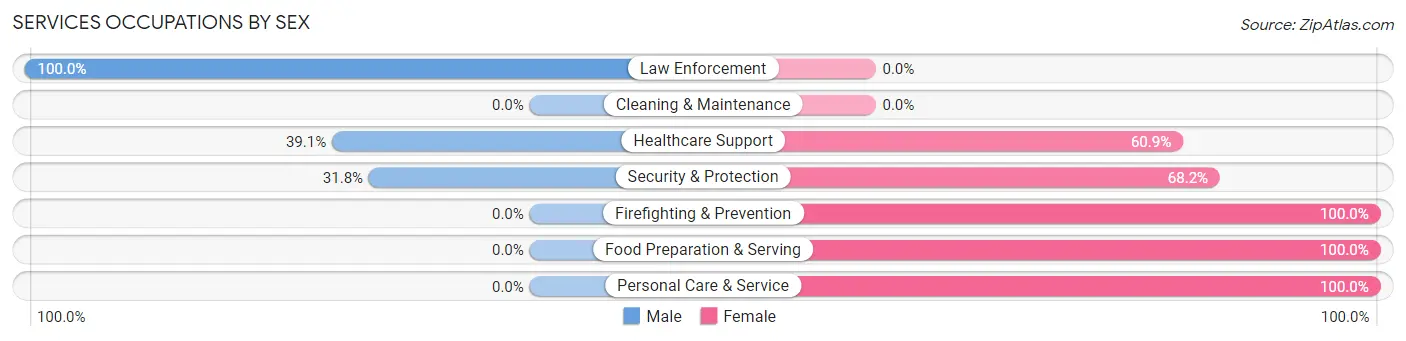
Services Occupations by Sex
Within the Services occupations in North Fort Lewis, the most male-oriented occupations are Law Enforcement (100.0%), Healthcare Support (39.1%), and Security & Protection (31.8%), while the most female-oriented occupations are Firefighting & Prevention (100.0%), Food Preparation & Serving (100.0%), and Personal Care & Service (100.0%).
| Occupation | Male | Female |
| Healthcare Support | 9 (39.1%) | 14 (60.9%) |
| Security & Protection | 7 (31.8%) | 15 (68.2%) |
| Firefighting & Prevention | 0 (0.0%) | 15 (100.0%) |
| Law Enforcement | 7 (100.0%) | 0 (0.0%) |
| Food Preparation & Serving | 0 (0.0%) | 43 (100.0%) |
| Cleaning & Maintenance | 0 (0.0%) | 0 (0.0%) |
| Personal Care & Service | 0 (0.0%) | 45 (100.0%) |
| Total (Category) | 16 (12.0%) | 117 (88.0%) |
| Total (Overall) | 197 (33.6%) | 390 (66.4%) |
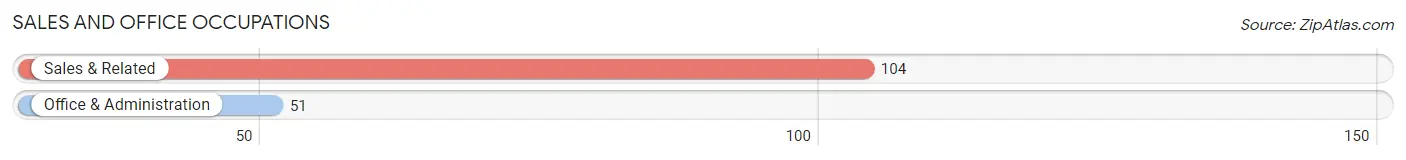
Sales and Office Occupations
The most common Sales and Office occupations in North Fort Lewis are Sales & Related (104 | 17.7%), and Office & Administration (51 | 8.7%).
Sales and Office Occupations by Sex
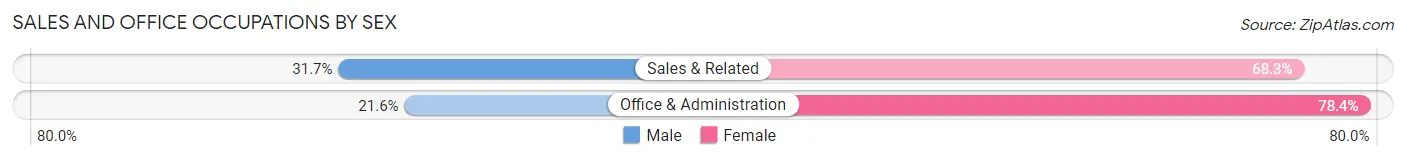
| Occupation | Male | Female |
| Sales & Related | 33 (31.7%) | 71 (68.3%) |
| Office & Administration | 11 (21.6%) | 40 (78.4%) |
| Total (Category) | 44 (28.4%) | 111 (71.6%) |
| Total (Overall) | 197 (33.6%) | 390 (66.4%) |
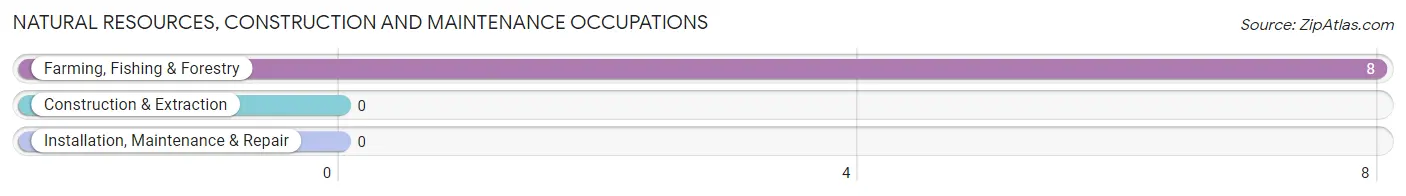
Natural Resources, Construction and Maintenance Occupations
The most common Natural Resources, Construction and Maintenance occupations in North Fort Lewis are , and Farming, Fishing & Forestry (8 | 1.4%).
Natural Resources, Construction and Maintenance Occupations by Sex
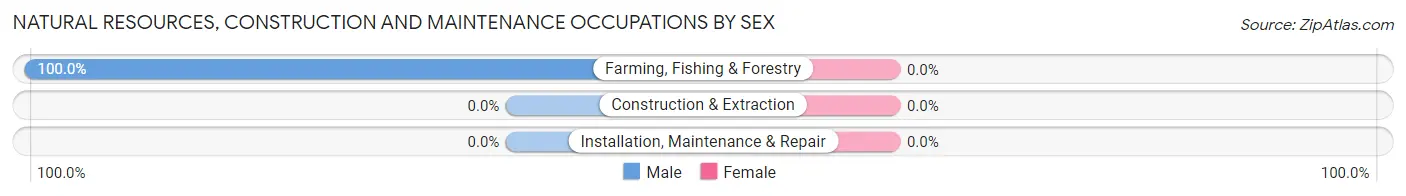
| Occupation | Male | Female |
| Farming, Fishing & Forestry | 8 (100.0%) | 0 (0.0%) |
| Construction & Extraction | 0 (0.0%) | 0 (0.0%) |
| Installation, Maintenance & Repair | 0 (0.0%) | 0 (0.0%) |
| Total (Category) | 8 (100.0%) | 0 (0.0%) |
| Total (Overall) | 197 (33.6%) | 390 (66.4%) |
Production, Transportation and Moving Occupations
The most common Production, Transportation and Moving occupations in North Fort Lewis are Production (54 | 9.2%), and Material Moving (21 | 3.6%).

Production, Transportation and Moving Occupations by Sex
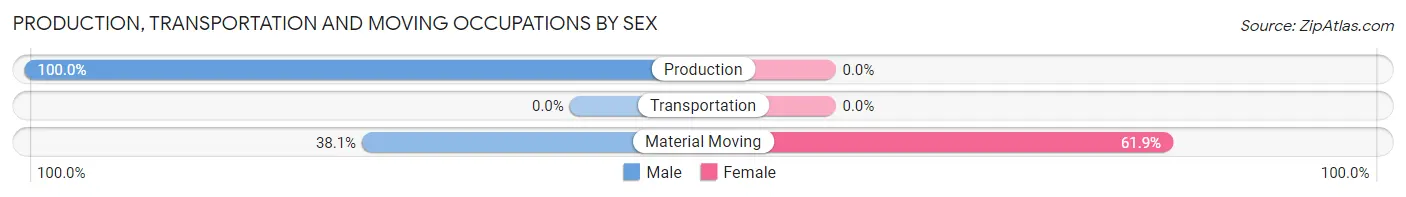
| Occupation | Male | Female |
| Production | 54 (100.0%) | 0 (0.0%) |
| Transportation | 0 (0.0%) | 0 (0.0%) |
| Material Moving | 8 (38.1%) | 13 (61.9%) |
| Total (Category) | 62 (82.7%) | 13 (17.3%) |
| Total (Overall) | 197 (33.6%) | 390 (66.4%) |
Employment Industries by Sex in North Fort Lewis
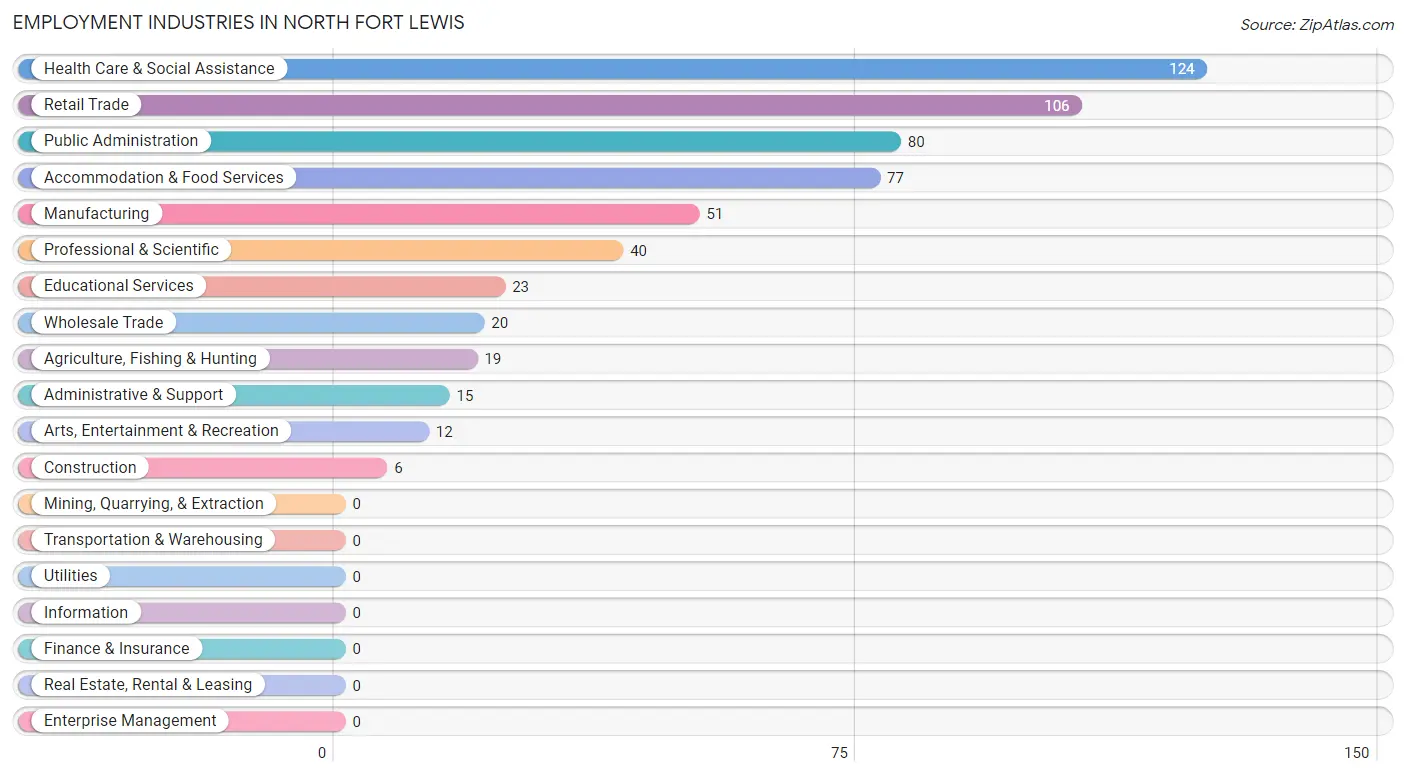
Employment Industries in North Fort Lewis
The major employment industries in North Fort Lewis include Health Care & Social Assistance (124 | 21.1%), Retail Trade (106 | 18.1%), Public Administration (80 | 13.6%), Accommodation & Food Services (77 | 13.1%), and Manufacturing (51 | 8.7%).
Employment Industries by Sex in North Fort Lewis
The North Fort Lewis industries that see more men than women are Manufacturing (100.0%), Wholesale Trade (100.0%), and Public Administration (61.3%), whereas the industries that tend to have a higher number of women are Construction (100.0%), Administrative & Support (100.0%), and Educational Services (100.0%).
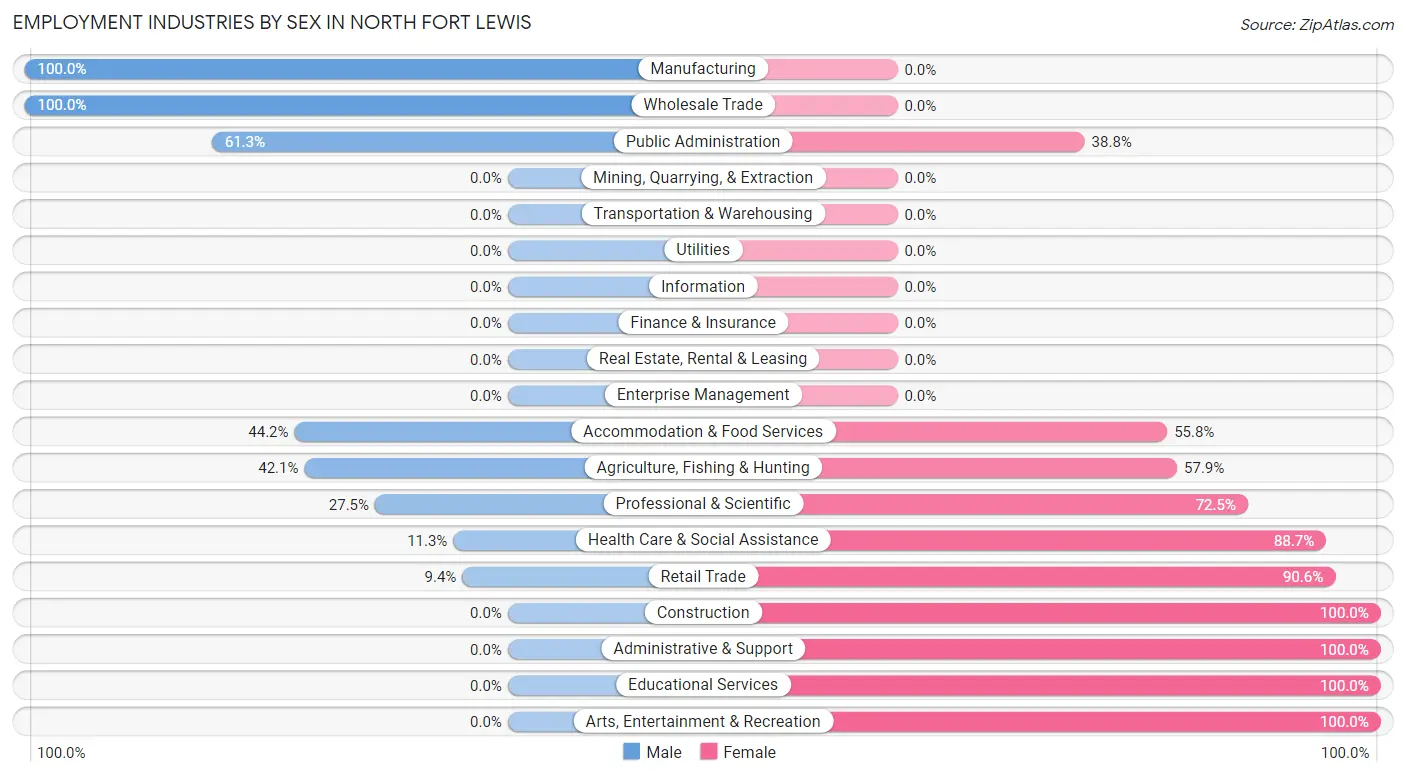
| Industry | Male | Female |
| Agriculture, Fishing & Hunting | 8 (42.1%) | 11 (57.9%) |
| Mining, Quarrying, & Extraction | 0 (0.0%) | 0 (0.0%) |
| Construction | 0 (0.0%) | 6 (100.0%) |
| Manufacturing | 51 (100.0%) | 0 (0.0%) |
| Wholesale Trade | 20 (100.0%) | 0 (0.0%) |
| Retail Trade | 10 (9.4%) | 96 (90.6%) |
| Transportation & Warehousing | 0 (0.0%) | 0 (0.0%) |
| Utilities | 0 (0.0%) | 0 (0.0%) |
| Information | 0 (0.0%) | 0 (0.0%) |
| Finance & Insurance | 0 (0.0%) | 0 (0.0%) |
| Real Estate, Rental & Leasing | 0 (0.0%) | 0 (0.0%) |
| Professional & Scientific | 11 (27.5%) | 29 (72.5%) |
| Enterprise Management | 0 (0.0%) | 0 (0.0%) |
| Administrative & Support | 0 (0.0%) | 15 (100.0%) |
| Educational Services | 0 (0.0%) | 23 (100.0%) |
| Health Care & Social Assistance | 14 (11.3%) | 110 (88.7%) |
| Arts, Entertainment & Recreation | 0 (0.0%) | 12 (100.0%) |
| Accommodation & Food Services | 34 (44.2%) | 43 (55.8%) |
| Public Administration | 49 (61.3%) | 31 (38.8%) |
| Total | 197 (33.6%) | 390 (66.4%) |
Education in North Fort Lewis
School Enrollment in North Fort Lewis
The most common levels of schooling among the 1,502 students in North Fort Lewis are elementary school (452 | 30.1%), college / undergraduate (372 | 24.8%), and middle school (312 | 20.8%).
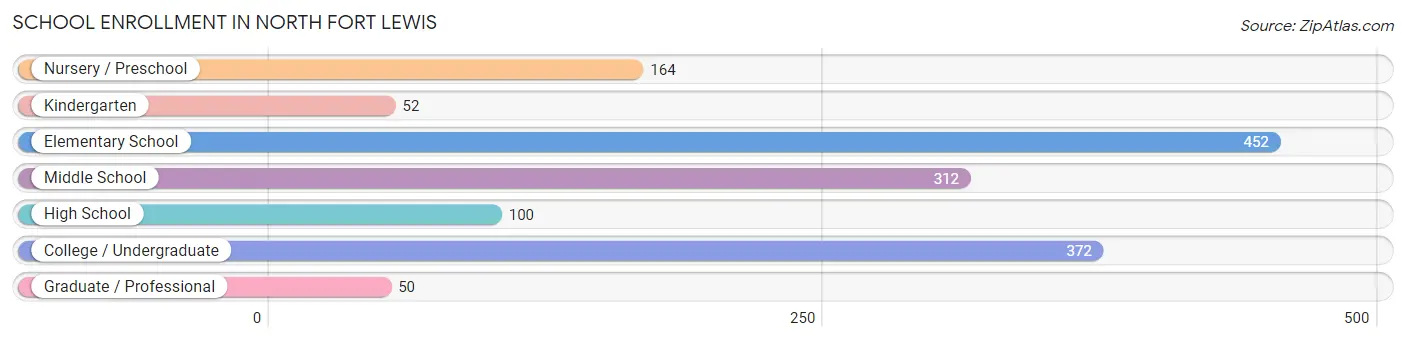
| School Level | # Students | % Students |
| Nursery / Preschool | 164 | 10.9% |
| Kindergarten | 52 | 3.5% |
| Elementary School | 452 | 30.1% |
| Middle School | 312 | 20.8% |
| High School | 100 | 6.7% |
| College / Undergraduate | 372 | 24.8% |
| Graduate / Professional | 50 | 3.3% |
| Total | 1,502 | 100.0% |
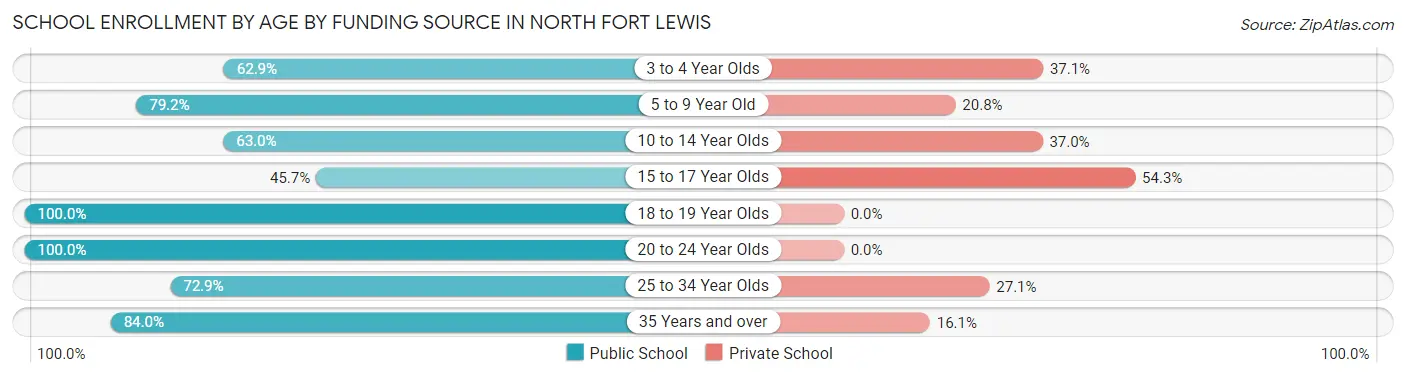
School Enrollment by Age by Funding Source in North Fort Lewis
Out of a total of 1,502 students who are enrolled in schools in North Fort Lewis, 385 (25.6%) attend a private institution, while the remaining 1,117 (74.4%) are enrolled in public schools. The age group of 15 to 17 year olds has the highest likelihood of being enrolled in private schools, with 38 (54.3% in the age bracket) enrolled. Conversely, the age group of 18 to 19 year olds has the lowest likelihood of being enrolled in a private school, with 21 (100.0% in the age bracket) attending a public institution.
| Age Bracket | Public School | Private School |
| 3 to 4 Year Olds | 83 (62.9%) | 49 (37.1%) |
| 5 to 9 Year Old | 350 (79.2%) | 92 (20.8%) |
| 10 to 14 Year Olds | 262 (63.0%) | 154 (37.0%) |
| 15 to 17 Year Olds | 32 (45.7%) | 38 (54.3%) |
| 18 to 19 Year Olds | 21 (100.0%) | 0 (0.0%) |
| 20 to 24 Year Olds | 200 (100.0%) | 0 (0.0%) |
| 25 to 34 Year Olds | 102 (72.9%) | 38 (27.1%) |
| 35 Years and over | 68 (84.0%) | 13 (16.1%) |
| Total | 1,117 (74.4%) | 385 (25.6%) |
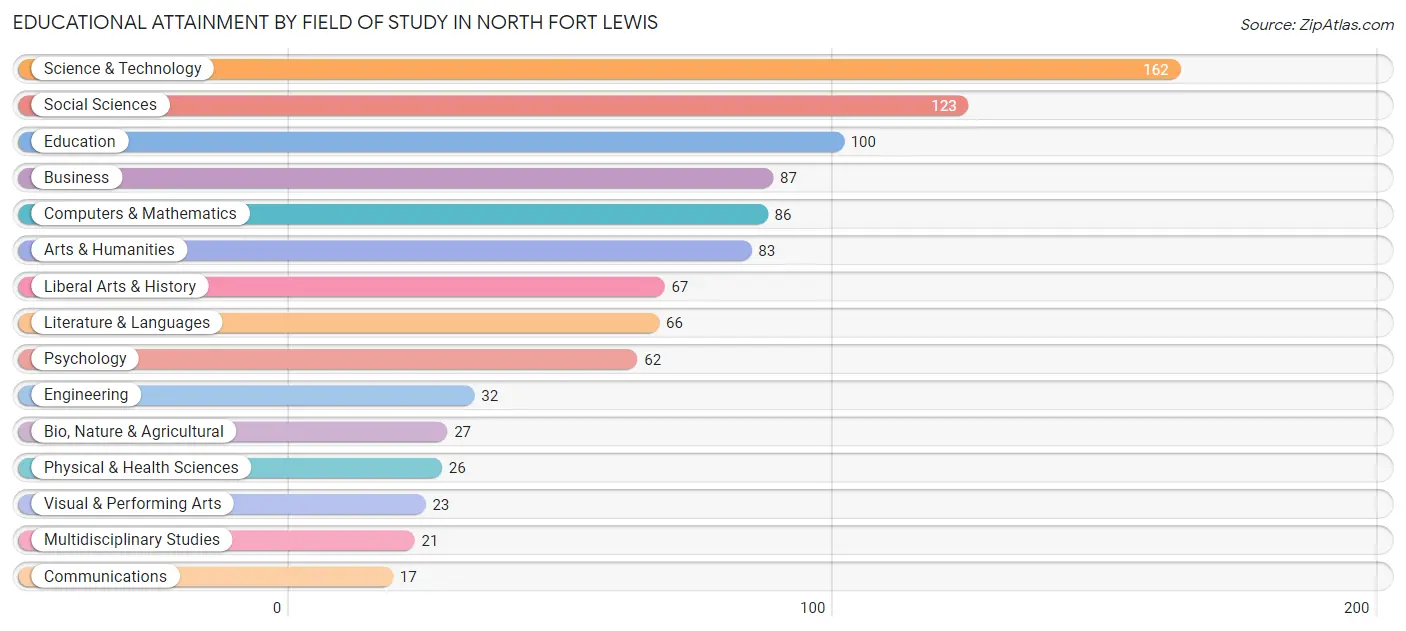
Educational Attainment by Field of Study in North Fort Lewis
Science & technology (162 | 16.5%), social sciences (123 | 12.5%), education (100 | 10.2%), business (87 | 8.9%), and computers & mathematics (86 | 8.8%) are the most common fields of study among 982 individuals in North Fort Lewis who have obtained a bachelor's degree or higher.
| Field of Study | # Graduates | % Graduates |
| Computers & Mathematics | 86 | 8.8% |
| Bio, Nature & Agricultural | 27 | 2.8% |
| Physical & Health Sciences | 26 | 2.6% |
| Psychology | 62 | 6.3% |
| Social Sciences | 123 | 12.5% |
| Engineering | 32 | 3.3% |
| Multidisciplinary Studies | 21 | 2.1% |
| Science & Technology | 162 | 16.5% |
| Business | 87 | 8.9% |
| Education | 100 | 10.2% |
| Literature & Languages | 66 | 6.7% |
| Liberal Arts & History | 67 | 6.8% |
| Visual & Performing Arts | 23 | 2.3% |
| Communications | 17 | 1.7% |
| Arts & Humanities | 83 | 8.5% |
| Total | 982 | 100.0% |
Transportation & Commute in North Fort Lewis
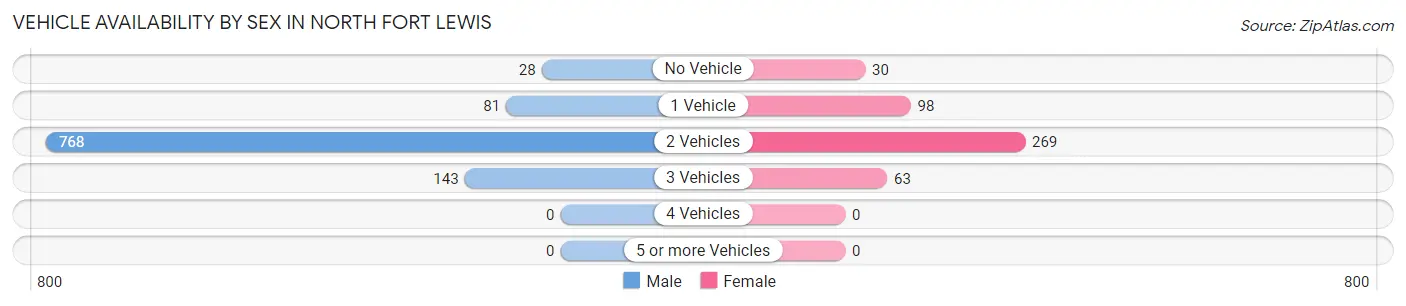
Vehicle Availability by Sex in North Fort Lewis
The most prevalent vehicle ownership categories in North Fort Lewis are males with 2 vehicles (768, accounting for 75.3%) and females with 2 vehicles (269, making up 167.0%).
| Vehicles Available | Male | Female |
| No Vehicle | 28 (2.8%) | 30 (6.5%) |
| 1 Vehicle | 81 (7.9%) | 98 (21.3%) |
| 2 Vehicles | 768 (75.3%) | 269 (58.5%) |
| 3 Vehicles | 143 (14.0%) | 63 (13.7%) |
| 4 Vehicles | 0 (0.0%) | 0 (0.0%) |
| 5 or more Vehicles | 0 (0.0%) | 0 (0.0%) |
| Total | 1,020 (100.0%) | 460 (100.0%) |
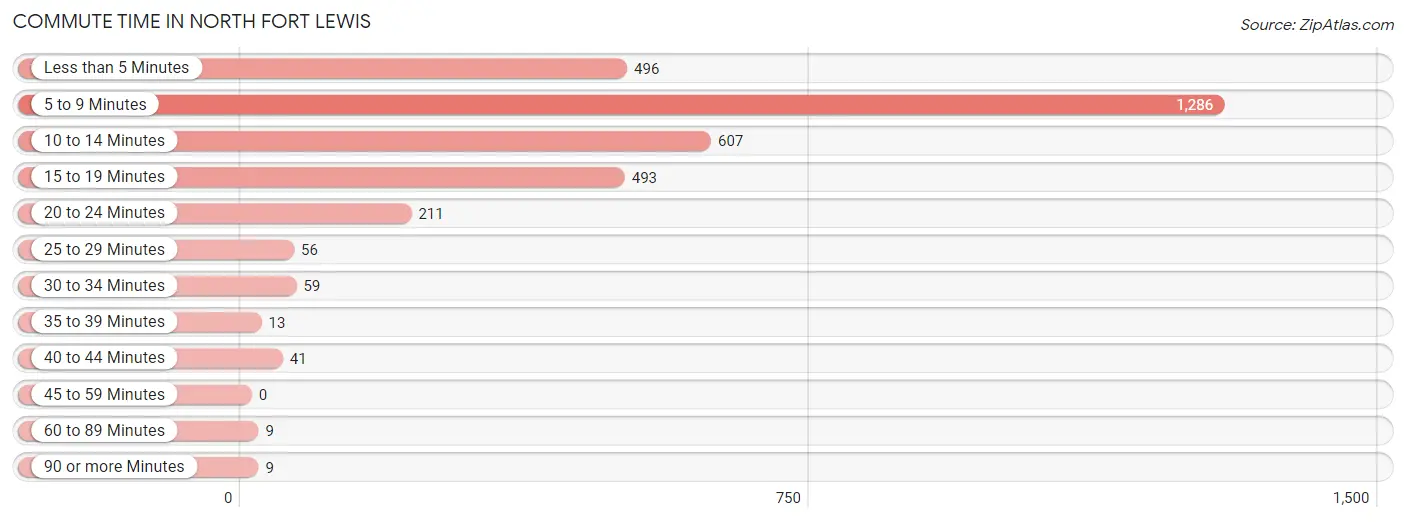
Commute Time in North Fort Lewis
The most frequently occuring commute durations in North Fort Lewis are 5 to 9 minutes (1,286 commuters, 39.2%), 10 to 14 minutes (607 commuters, 18.5%), and less than 5 minutes (496 commuters, 15.1%).
| Commute Time | # Commuters | % Commuters |
| Less than 5 Minutes | 496 | 15.1% |
| 5 to 9 Minutes | 1,286 | 39.2% |
| 10 to 14 Minutes | 607 | 18.5% |
| 15 to 19 Minutes | 493 | 15.0% |
| 20 to 24 Minutes | 211 | 6.4% |
| 25 to 29 Minutes | 56 | 1.7% |
| 30 to 34 Minutes | 59 | 1.8% |
| 35 to 39 Minutes | 13 | 0.4% |
| 40 to 44 Minutes | 41 | 1.3% |
| 45 to 59 Minutes | 0 | 0.0% |
| 60 to 89 Minutes | 9 | 0.3% |
| 90 or more Minutes | 9 | 0.3% |
Commute Time by Sex in North Fort Lewis
The most common commute times in North Fort Lewis are 5 to 9 minutes (971 commuters, 39.0%) for males and 5 to 9 minutes (315 commuters, 40.0%) for females.
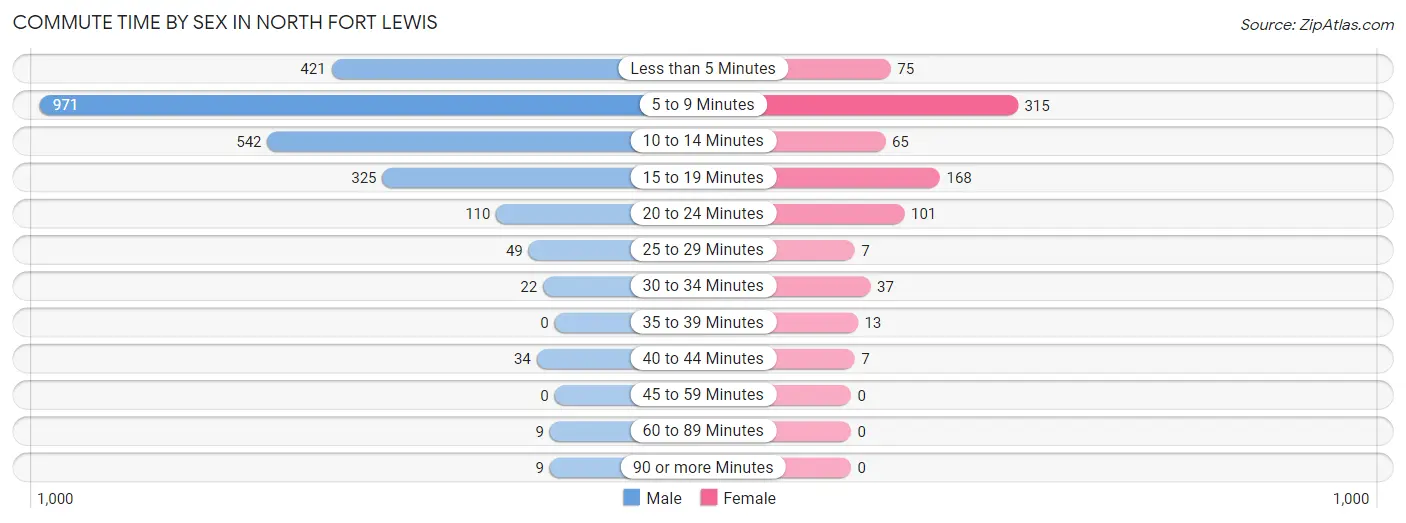
| Commute Time | Male | Female |
| Less than 5 Minutes | 421 (16.9%) | 75 (9.5%) |
| 5 to 9 Minutes | 971 (39.0%) | 315 (40.0%) |
| 10 to 14 Minutes | 542 (21.7%) | 65 (8.3%) |
| 15 to 19 Minutes | 325 (13.0%) | 168 (21.3%) |
| 20 to 24 Minutes | 110 (4.4%) | 101 (12.8%) |
| 25 to 29 Minutes | 49 (2.0%) | 7 (0.9%) |
| 30 to 34 Minutes | 22 (0.9%) | 37 (4.7%) |
| 35 to 39 Minutes | 0 (0.0%) | 13 (1.7%) |
| 40 to 44 Minutes | 34 (1.4%) | 7 (0.9%) |
| 45 to 59 Minutes | 0 (0.0%) | 0 (0.0%) |
| 60 to 89 Minutes | 9 (0.4%) | 0 (0.0%) |
| 90 or more Minutes | 9 (0.4%) | 0 (0.0%) |
Time of Departure to Work by Sex in North Fort Lewis
The most frequent times of departure to work in North Fort Lewis are 6:00 AM to 6:29 AM (650, 26.1%) for males and 6:00 AM to 6:29 AM (156, 19.8%) for females.
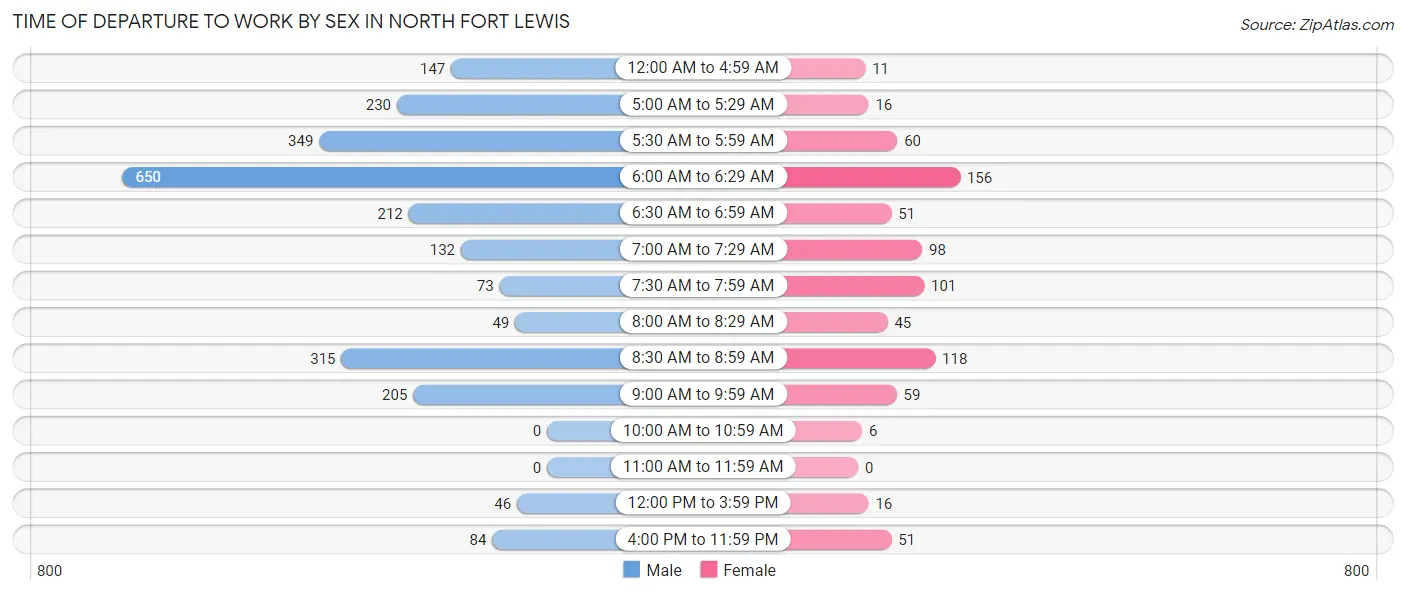
| Time of Departure | Male | Female |
| 12:00 AM to 4:59 AM | 147 (5.9%) | 11 (1.4%) |
| 5:00 AM to 5:29 AM | 230 (9.2%) | 16 (2.0%) |
| 5:30 AM to 5:59 AM | 349 (14.0%) | 60 (7.6%) |
| 6:00 AM to 6:29 AM | 650 (26.1%) | 156 (19.8%) |
| 6:30 AM to 6:59 AM | 212 (8.5%) | 51 (6.5%) |
| 7:00 AM to 7:29 AM | 132 (5.3%) | 98 (12.4%) |
| 7:30 AM to 7:59 AM | 73 (2.9%) | 101 (12.8%) |
| 8:00 AM to 8:29 AM | 49 (2.0%) | 45 (5.7%) |
| 8:30 AM to 8:59 AM | 315 (12.6%) | 118 (15.0%) |
| 9:00 AM to 9:59 AM | 205 (8.2%) | 59 (7.5%) |
| 10:00 AM to 10:59 AM | 0 (0.0%) | 6 (0.8%) |
| 11:00 AM to 11:59 AM | 0 (0.0%) | 0 (0.0%) |
| 12:00 PM to 3:59 PM | 46 (1.8%) | 16 (2.0%) |
| 4:00 PM to 11:59 PM | 84 (3.4%) | 51 (6.5%) |
| Total | 2,492 (100.0%) | 788 (100.0%) |
Housing Occupancy in North Fort Lewis
Occupancy by Ownership in North Fort Lewis
Of the total 1,127 dwellings in North Fort Lewis, owner-occupied units account for 0 (0.0%), while renter-occupied units make up 1,127 (100.0%).
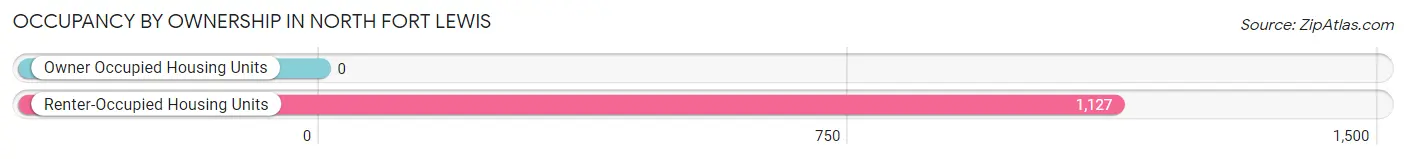
| Occupancy | # Housing Units | % Housing Units |
| Owner Occupied Housing Units | 0 | 0.0% |
| Renter-Occupied Housing Units | 1,127 | 100.0% |
| Total Occupied Housing Units | 1,127 | 100.0% |
Occupancy by Household Size in North Fort Lewis
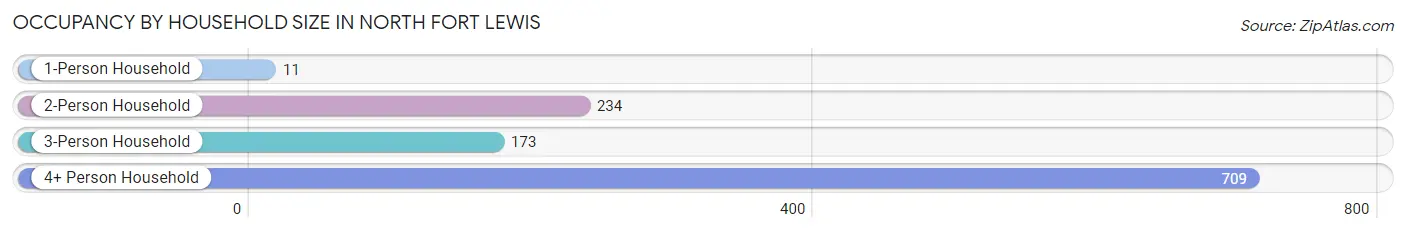
| Household Size | # Housing Units | % Housing Units |
| 1-Person Household | 11 | 1.0% |
| 2-Person Household | 234 | 20.8% |
| 3-Person Household | 173 | 15.3% |
| 4+ Person Household | 709 | 62.9% |
| Total Housing Units | 1,127 | 100.0% |
Occupancy by Ownership by Household Size in North Fort Lewis
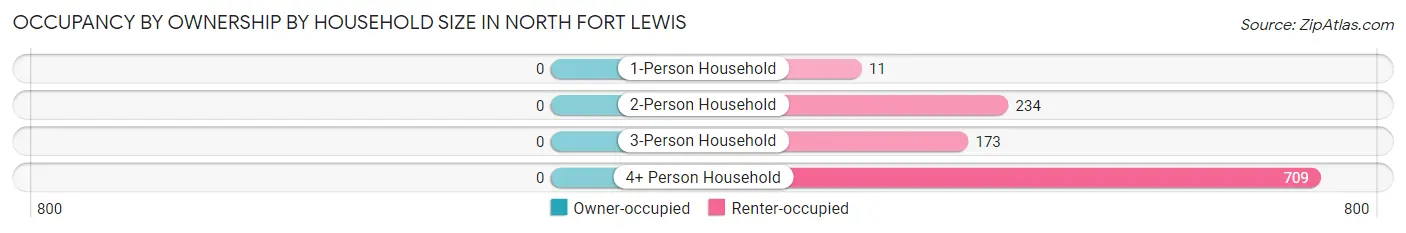
| Household Size | Owner-occupied | Renter-occupied |
| 1-Person Household | 0 (0.0%) | 11 (100.0%) |
| 2-Person Household | 0 (0.0%) | 234 (100.0%) |
| 3-Person Household | 0 (0.0%) | 173 (100.0%) |
| 4+ Person Household | 0 (0.0%) | 709 (100.0%) |
| Total Housing Units | 0 (0.0%) | 1,127 (100.0%) |
Occupancy by Educational Attainment in North Fort Lewis
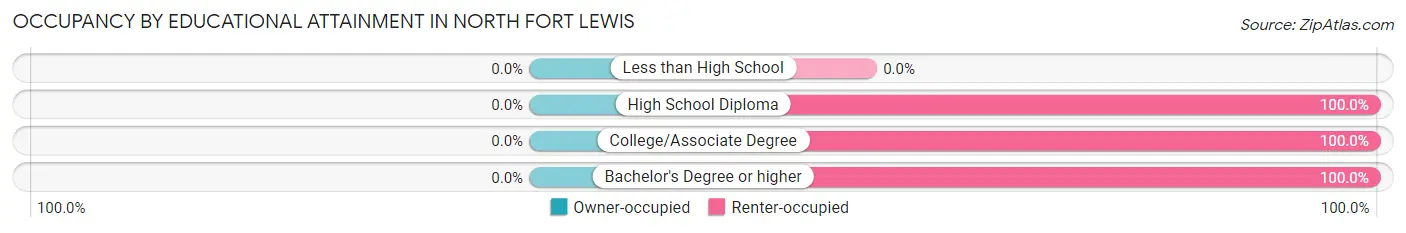
| Household Size | Owner-occupied | Renter-occupied |
| Less than High School | 0 (0.0%) | 0 (0.0%) |
| High School Diploma | 0 (0.0%) | 75 (100.0%) |
| College/Associate Degree | 0 (0.0%) | 573 (100.0%) |
| Bachelor's Degree or higher | 0 (0.0%) | 479 (100.0%) |
Occupancy by Age of Householder in North Fort Lewis
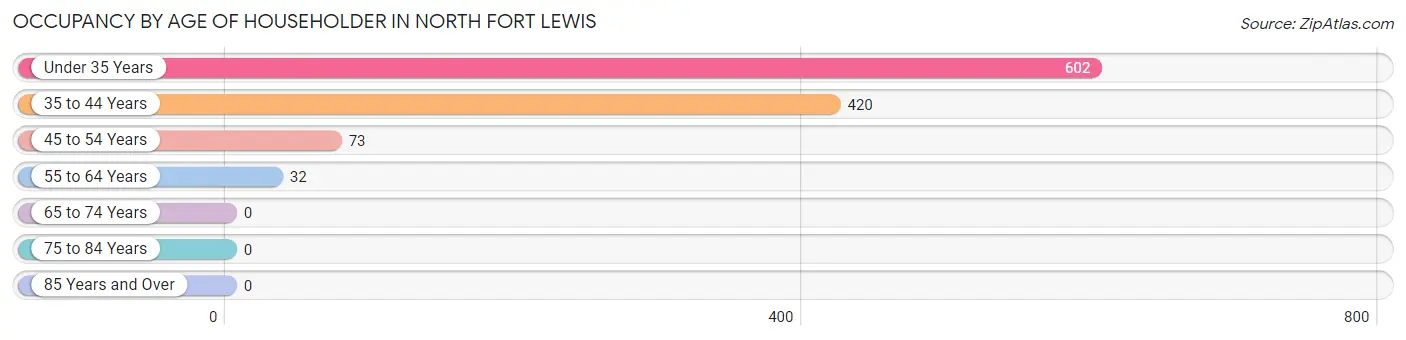
| Age Bracket | # Households | % Households |
| Under 35 Years | 602 | 53.4% |
| 35 to 44 Years | 420 | 37.3% |
| 45 to 54 Years | 73 | 6.5% |
| 55 to 64 Years | 32 | 2.8% |
| 65 to 74 Years | 0 | 0.0% |
| 75 to 84 Years | 0 | 0.0% |
| 85 Years and Over | 0 | 0.0% |
| Total | 1,127 | 100.0% |
Housing Finances in North Fort Lewis
Median Income by Occupancy in North Fort Lewis
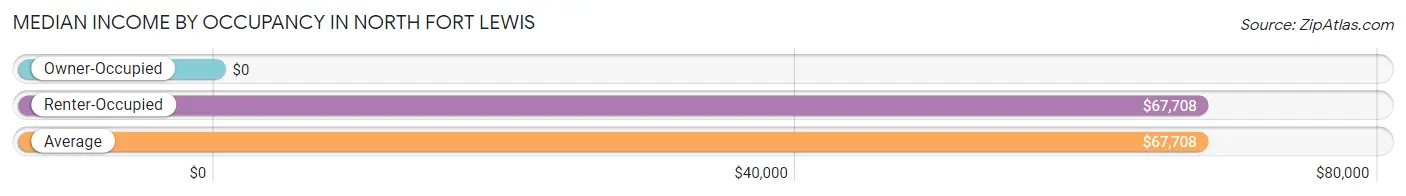
| Occupancy Type | # Households | Median Income |
| Owner-Occupied | 0 (0.0%) | $0 |
| Renter-Occupied | 1,127 (100.0%) | $67,708 |
| Average | 1,127 (100.0%) | $67,708 |
Occupancy by Householder Income Bracket in North Fort Lewis
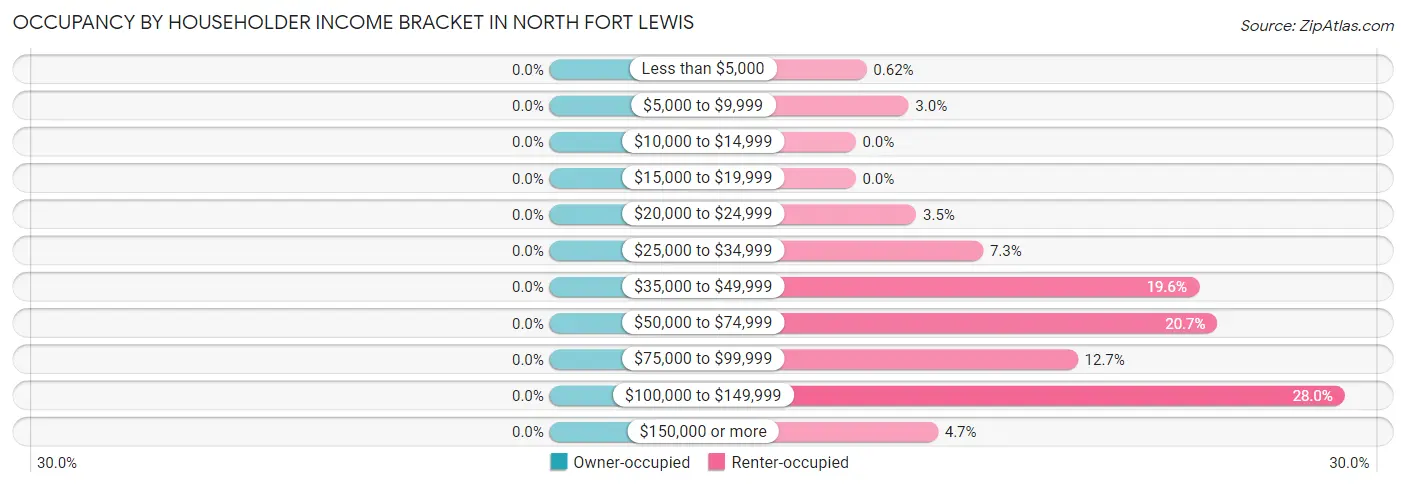
| Income Bracket | Owner-occupied | Renter-occupied |
| Less than $5,000 | 0 (0.0%) | 7 (0.6%) |
| $5,000 to $9,999 | 0 (0.0%) | 34 (3.0%) |
| $10,000 to $14,999 | 0 (0.0%) | 0 (0.0%) |
| $15,000 to $19,999 | 0 (0.0%) | 0 (0.0%) |
| $20,000 to $24,999 | 0 (0.0%) | 39 (3.5%) |
| $25,000 to $34,999 | 0 (0.0%) | 82 (7.3%) |
| $35,000 to $49,999 | 0 (0.0%) | 221 (19.6%) |
| $50,000 to $74,999 | 0 (0.0%) | 233 (20.7%) |
| $75,000 to $99,999 | 0 (0.0%) | 143 (12.7%) |
| $100,000 to $149,999 | 0 (0.0%) | 315 (28.0%) |
| $150,000 or more | 0 (0.0%) | 53 (4.7%) |
| Total | 0 (0.0%) | 1,127 (100.0%) |
Monthly Housing Cost Tiers in North Fort Lewis
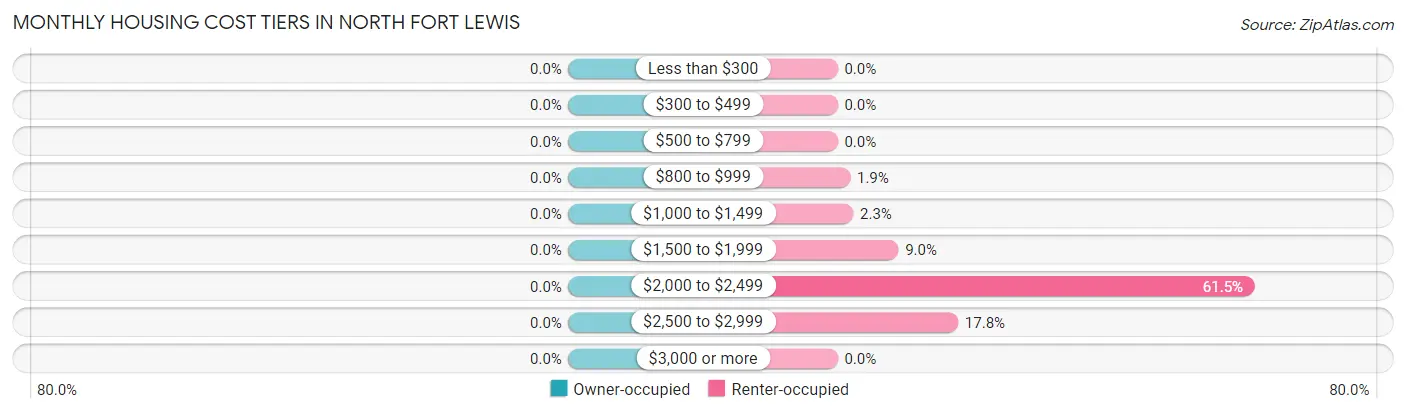
| Monthly Cost | Owner-occupied | Renter-occupied |
| Less than $300 | 0 (0.0%) | 0 (0.0%) |
| $300 to $499 | 0 (0.0%) | 0 (0.0%) |
| $500 to $799 | 0 (0.0%) | 0 (0.0%) |
| $800 to $999 | 0 (0.0%) | 21 (1.9%) |
| $1,000 to $1,499 | 0 (0.0%) | 26 (2.3%) |
| $1,500 to $1,999 | 0 (0.0%) | 101 (9.0%) |
| $2,000 to $2,499 | 0 (0.0%) | 693 (61.5%) |
| $2,500 to $2,999 | 0 (0.0%) | 200 (17.7%) |
| $3,000 or more | 0 (0.0%) | 0 (0.0%) |
| Total | 0 (0.0%) | 1,127 (100.0%) |
Physical Housing Characteristics in North Fort Lewis
Housing Structures in North Fort Lewis
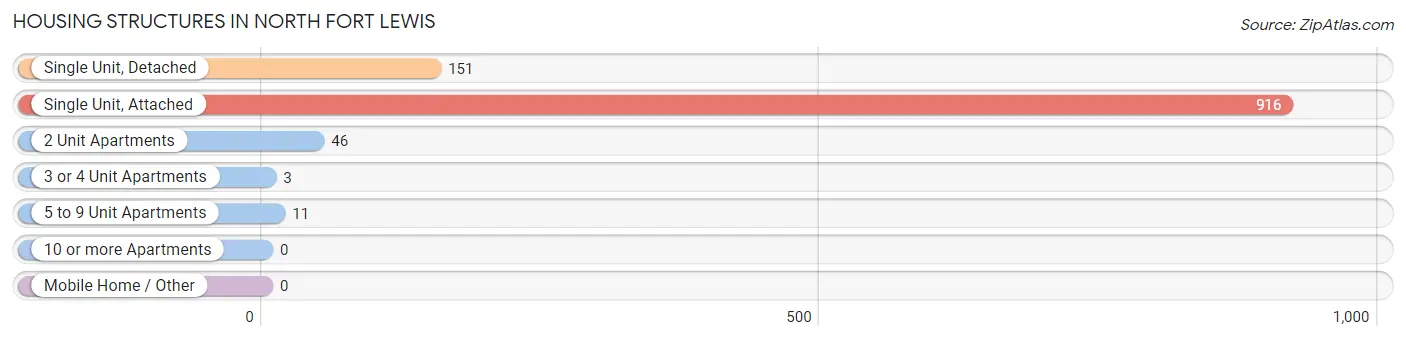
| Structure Type | # Housing Units | % Housing Units |
| Single Unit, Detached | 151 | 13.4% |
| Single Unit, Attached | 916 | 81.3% |
| 2 Unit Apartments | 46 | 4.1% |
| 3 or 4 Unit Apartments | 3 | 0.3% |
| 5 to 9 Unit Apartments | 11 | 1.0% |
| 10 or more Apartments | 0 | 0.0% |
| Mobile Home / Other | 0 | 0.0% |
| Total | 1,127 | 100.0% |
Housing Structures by Occupancy in North Fort Lewis
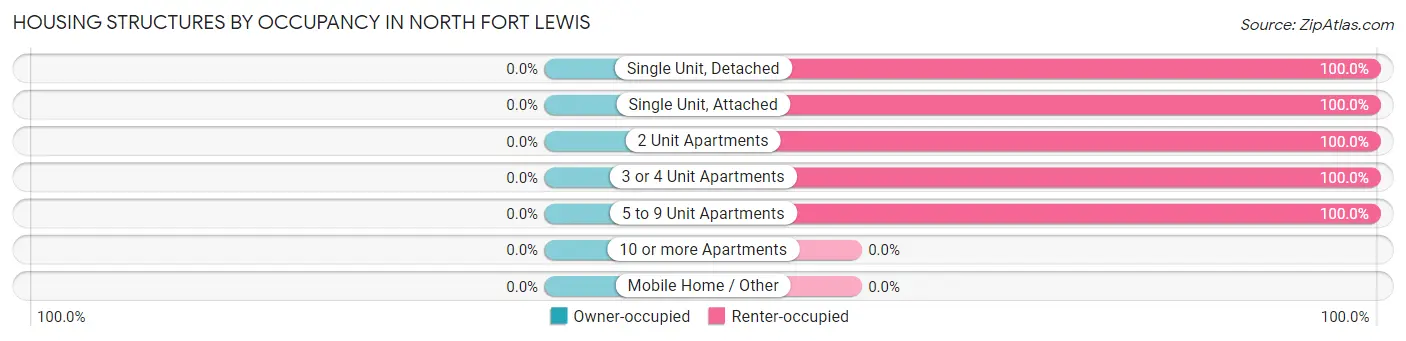
| Structure Type | Owner-occupied | Renter-occupied |
| Single Unit, Detached | 0 (0.0%) | 151 (100.0%) |
| Single Unit, Attached | 0 (0.0%) | 916 (100.0%) |
| 2 Unit Apartments | 0 (0.0%) | 46 (100.0%) |
| 3 or 4 Unit Apartments | 0 (0.0%) | 3 (100.0%) |
| 5 to 9 Unit Apartments | 0 (0.0%) | 11 (100.0%) |
| 10 or more Apartments | 0 (0.0%) | 0 (0.0%) |
| Mobile Home / Other | 0 (0.0%) | 0 (0.0%) |
| Total | 0 (0.0%) | 1,127 (100.0%) |
Housing Structures by Number of Rooms in North Fort Lewis
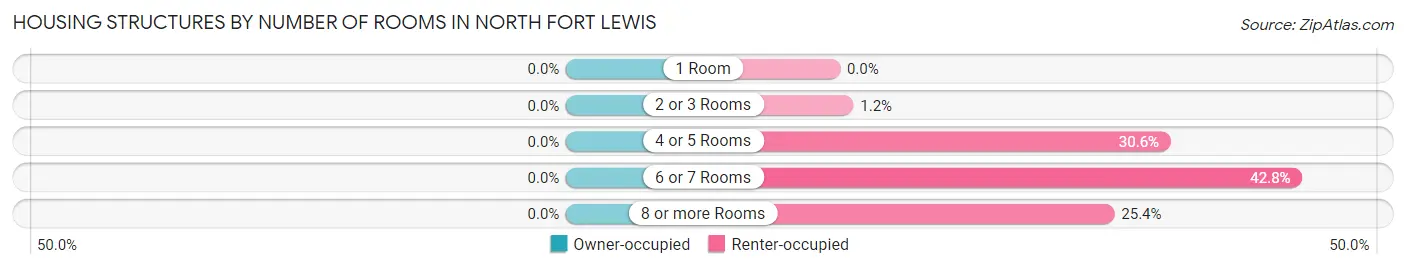
| Number of Rooms | Owner-occupied | Renter-occupied |
| 1 Room | 0 (0.0%) | 0 (0.0%) |
| 2 or 3 Rooms | 0 (0.0%) | 14 (1.2%) |
| 4 or 5 Rooms | 0 (0.0%) | 345 (30.6%) |
| 6 or 7 Rooms | 0 (0.0%) | 482 (42.8%) |
| 8 or more Rooms | 0 (0.0%) | 286 (25.4%) |
| Total | 0 (0.0%) | 1,127 (100.0%) |
Housing Structure by Heating Type in North Fort Lewis
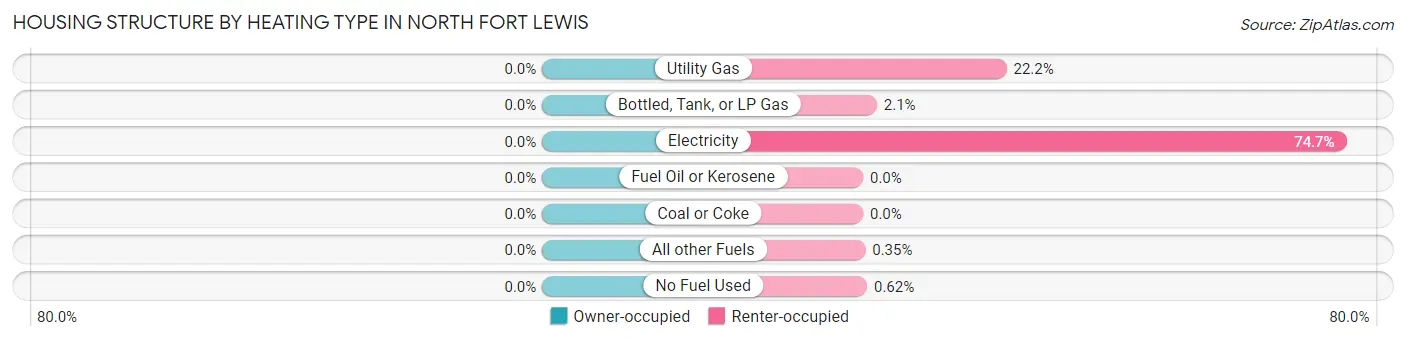
| Heating Type | Owner-occupied | Renter-occupied |
| Utility Gas | 0 (0.0%) | 250 (22.2%) |
| Bottled, Tank, or LP Gas | 0 (0.0%) | 24 (2.1%) |
| Electricity | 0 (0.0%) | 842 (74.7%) |
| Fuel Oil or Kerosene | 0 (0.0%) | 0 (0.0%) |
| Coal or Coke | 0 (0.0%) | 0 (0.0%) |
| All other Fuels | 0 (0.0%) | 4 (0.4%) |
| No Fuel Used | 0 (0.0%) | 7 (0.6%) |
| Total | 0 (0.0%) | 1,127 (100.0%) |
Household Vehicle Usage in North Fort Lewis
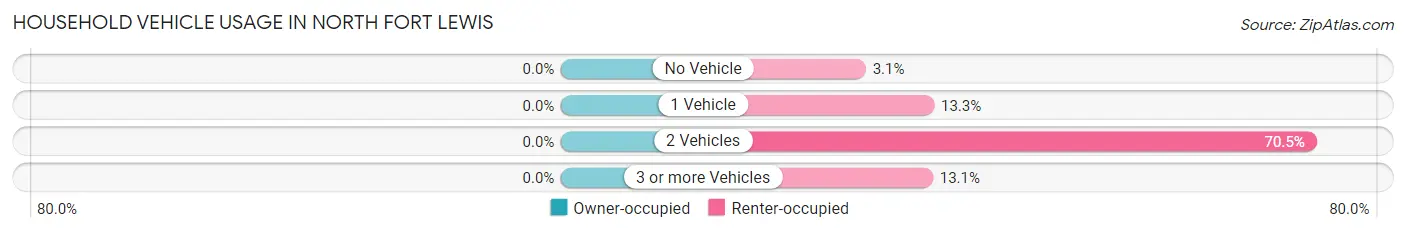
| Vehicles per Household | Owner-occupied | Renter-occupied |
| No Vehicle | 0 (0.0%) | 35 (3.1%) |
| 1 Vehicle | 0 (0.0%) | 150 (13.3%) |
| 2 Vehicles | 0 (0.0%) | 794 (70.5%) |
| 3 or more Vehicles | 0 (0.0%) | 148 (13.1%) |
| Total | 0 (0.0%) | 1,127 (100.0%) |
Real Estate & Mortgages in North Fort Lewis
Real Estate and Mortgage Overview in North Fort Lewis
| Characteristic | Without Mortgage | With Mortgage |
| Housing Units | 0 | 0 |
| Median Property Value | - | - |
| Median Household Income | - | - |
| Monthly Housing Costs | - | - |
| Real Estate Taxes | - | - |
Property Value by Mortgage Status in North Fort Lewis
| Property Value | Without Mortgage | With Mortgage |
| Less than $50,000 | 0 (0.0%) | 0 (0.0%) |
| $50,000 to $99,999 | 0 (0.0%) | 0 (0.0%) |
| $100,000 to $299,999 | 0 (0.0%) | 0 (0.0%) |
| $300,000 to $499,999 | 0 (0.0%) | 0 (0.0%) |
| $500,000 to $749,999 | 0 (0.0%) | 0 (0.0%) |
| $750,000 to $999,999 | 0 (0.0%) | 0 (0.0%) |
| $1,000,000 or more | 0 (0.0%) | 0 (0.0%) |
| Total | 0 (0.0%) | 0 (0.0%) |
Household Income by Mortgage Status in North Fort Lewis
| Household Income | Without Mortgage | With Mortgage |
| Less than $10,000 | 0 (0.0%) | 0 (0.0%) |
| $10,000 to $24,999 | 0 (0.0%) | 0 (0.0%) |
| $25,000 to $34,999 | 0 (0.0%) | 0 (0.0%) |
| $35,000 to $49,999 | 0 (0.0%) | 0 (0.0%) |
| $50,000 to $74,999 | 0 (0.0%) | 0 (0.0%) |
| $75,000 to $99,999 | 0 (0.0%) | 0 (0.0%) |
| $100,000 to $149,999 | 0 (0.0%) | 0 (0.0%) |
| $150,000 or more | 0 (0.0%) | 0 (0.0%) |
| Total | 0 (0.0%) | 0 (0.0%) |
Property Value to Household Income Ratio in North Fort Lewis
| Value-to-Income Ratio | Without Mortgage | With Mortgage |
| Less than 2.0x | 0 (0.0%) | 0 (0.0%) |
| 2.0x to 2.9x | 0 (0.0%) | 0 (0.0%) |
| 3.0x to 3.9x | 0 (0.0%) | 0 (0.0%) |
| 4.0x or more | 0 (0.0%) | 0 (0.0%) |
| Total | 0 (0.0%) | 0 (0.0%) |
Real Estate Taxes by Mortgage Status in North Fort Lewis
| Property Taxes | Without Mortgage | With Mortgage |
| Less than $800 | 0 (0.0%) | 0 (0.0%) |
| $800 to $1,499 | 0 (0.0%) | 0 (0.0%) |
| $800 to $1,499 | 0 (0.0%) | 0 (0.0%) |
| Total | 0 (0.0%) | 0 (0.0%) |
Health & Disability in North Fort Lewis
Health Insurance Coverage by Age in North Fort Lewis
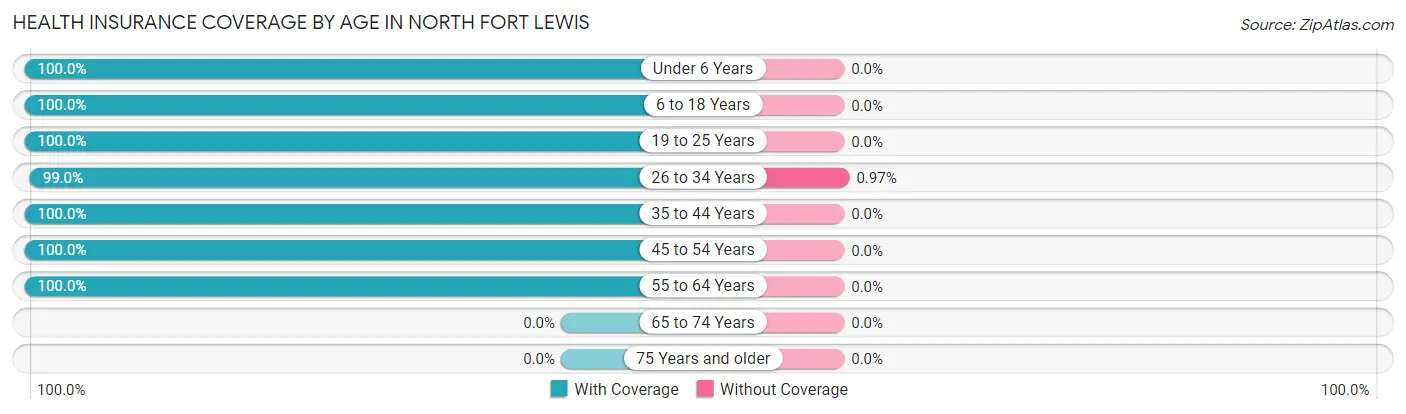
| Age Bracket | With Coverage | Without Coverage |
| Under 6 Years | 773 (100.0%) | 0 (0.0%) |
| 6 to 18 Years | 955 (100.0%) | 0 (0.0%) |
| 19 to 25 Years | 235 (100.0%) | 0 (0.0%) |
| 26 to 34 Years | 513 (99.0%) | 5 (1.0%) |
| 35 to 44 Years | 483 (100.0%) | 0 (0.0%) |
| 45 to 54 Years | 101 (100.0%) | 0 (0.0%) |
| 55 to 64 Years | 29 (100.0%) | 0 (0.0%) |
| 65 to 74 Years | 0 (0.0%) | 0 (0.0%) |
| 75 Years and older | 0 (0.0%) | 0 (0.0%) |
| Total | 3,089 (99.8%) | 5 (0.2%) |
Health Insurance Coverage by Citizenship Status in North Fort Lewis
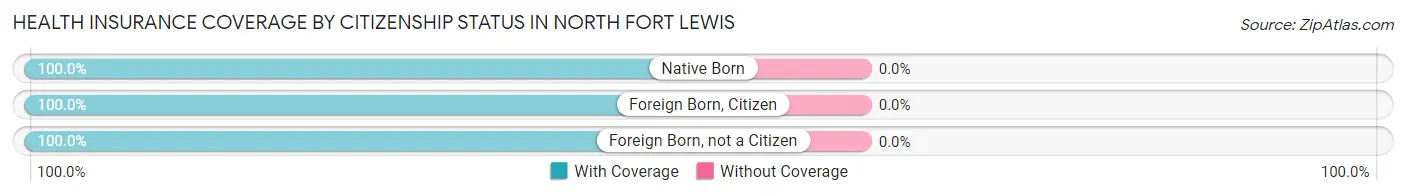
| Citizenship Status | With Coverage | Without Coverage |
| Native Born | 773 (100.0%) | 0 (0.0%) |
| Foreign Born, Citizen | 955 (100.0%) | 0 (0.0%) |
| Foreign Born, not a Citizen | 235 (100.0%) | 0 (0.0%) |
Health Insurance Coverage by Household Income in North Fort Lewis
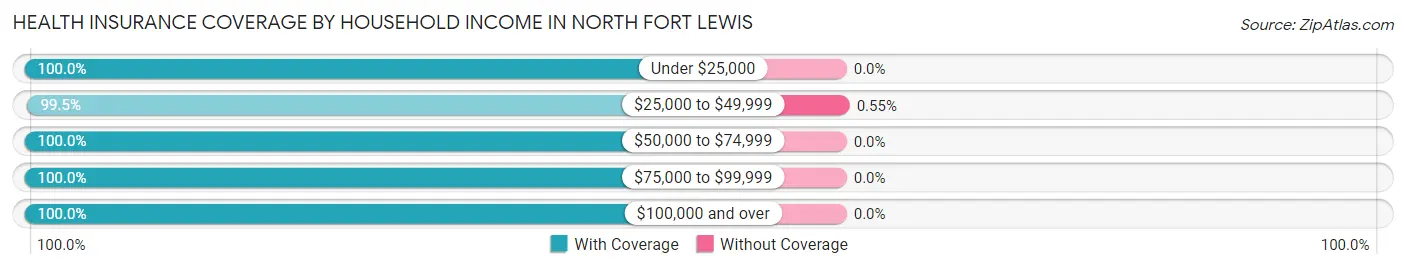
| Household Income | With Coverage | Without Coverage |
| Under $25,000 | 217 (100.0%) | 0 (0.0%) |
| $25,000 to $49,999 | 900 (99.5%) | 5 (0.5%) |
| $50,000 to $74,999 | 567 (100.0%) | 0 (0.0%) |
| $75,000 to $99,999 | 298 (100.0%) | 0 (0.0%) |
| $100,000 and over | 1,107 (100.0%) | 0 (0.0%) |
Public vs Private Health Insurance Coverage by Age in North Fort Lewis
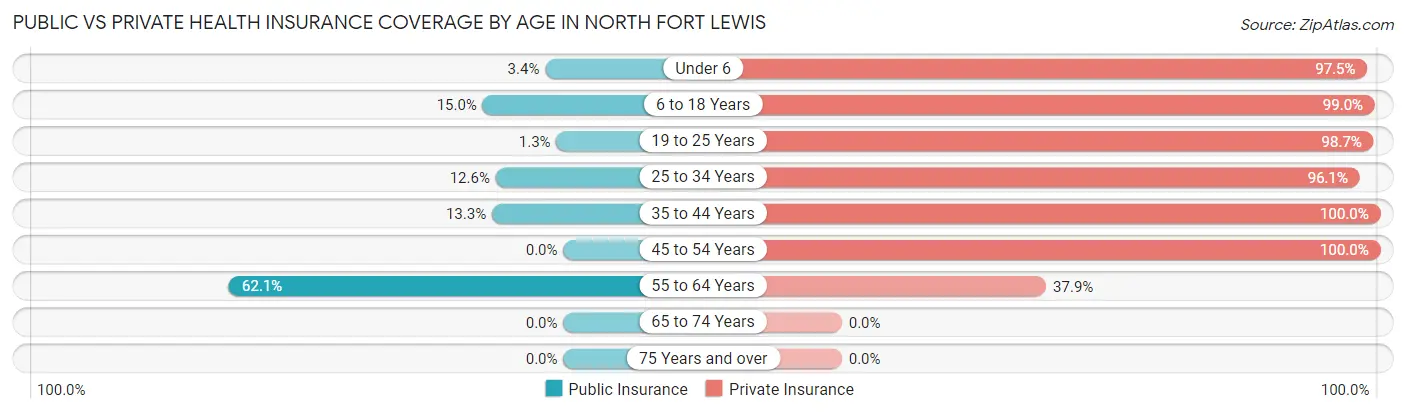
| Age Bracket | Public Insurance | Private Insurance |
| Under 6 | 26 (3.4%) | 754 (97.5%) |
| 6 to 18 Years | 143 (15.0%) | 945 (99.0%) |
| 19 to 25 Years | 3 (1.3%) | 232 (98.7%) |
| 25 to 34 Years | 65 (12.6%) | 498 (96.1%) |
| 35 to 44 Years | 64 (13.3%) | 483 (100.0%) |
| 45 to 54 Years | 0 (0.0%) | 101 (100.0%) |
| 55 to 64 Years | 18 (62.1%) | 11 (37.9%) |
| 65 to 74 Years | 0 (0.0%) | 0 (0.0%) |
| 75 Years and over | 0 (0.0%) | 0 (0.0%) |
| Total | 319 (10.3%) | 3,024 (97.7%) |
Disability Status by Sex by Age in North Fort Lewis
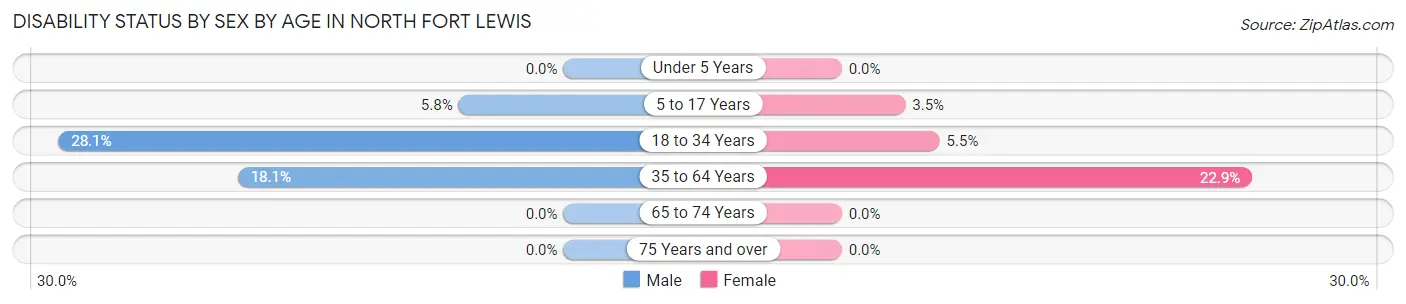
| Age Bracket | Male | Female |
| Under 5 Years | 0 (0.0%) | 0 (0.0%) |
| 5 to 17 Years | 32 (5.8%) | 19 (3.5%) |
| 18 to 34 Years | 36 (28.1%) | 36 (5.4%) |
| 35 to 64 Years | 31 (18.1%) | 101 (22.9%) |
| 65 to 74 Years | 0 (0.0%) | 0 (0.0%) |
| 75 Years and over | 0 (0.0%) | 0 (0.0%) |
Disability Class by Sex by Age in North Fort Lewis
Disability Class: Hearing Difficulty
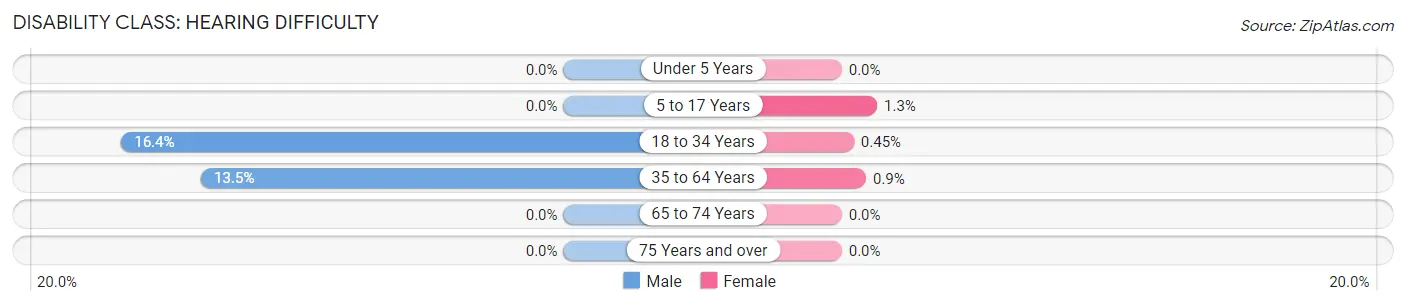
| Age Bracket | Male | Female |
| Under 5 Years | 0 (0.0%) | 0 (0.0%) |
| 5 to 17 Years | 0 (0.0%) | 7 (1.3%) |
| 18 to 34 Years | 21 (16.4%) | 3 (0.4%) |
| 35 to 64 Years | 23 (13.5%) | 4 (0.9%) |
| 65 to 74 Years | 0 (0.0%) | 0 (0.0%) |
| 75 Years and over | 0 (0.0%) | 0 (0.0%) |
Disability Class: Vision Difficulty
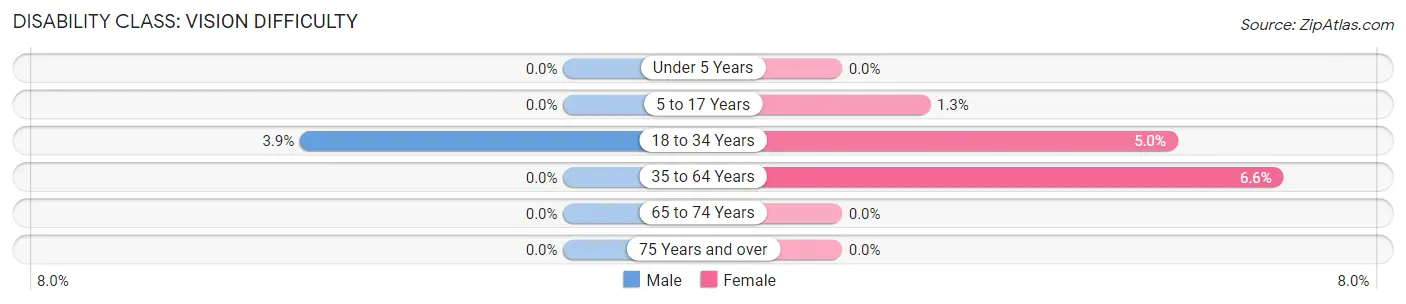
| Age Bracket | Male | Female |
| Under 5 Years | 0 (0.0%) | 0 (0.0%) |
| 5 to 17 Years | 0 (0.0%) | 7 (1.3%) |
| 18 to 34 Years | 5 (3.9%) | 33 (5.0%) |
| 35 to 64 Years | 0 (0.0%) | 29 (6.6%) |
| 65 to 74 Years | 0 (0.0%) | 0 (0.0%) |
| 75 Years and over | 0 (0.0%) | 0 (0.0%) |
Disability Class: Cognitive Difficulty
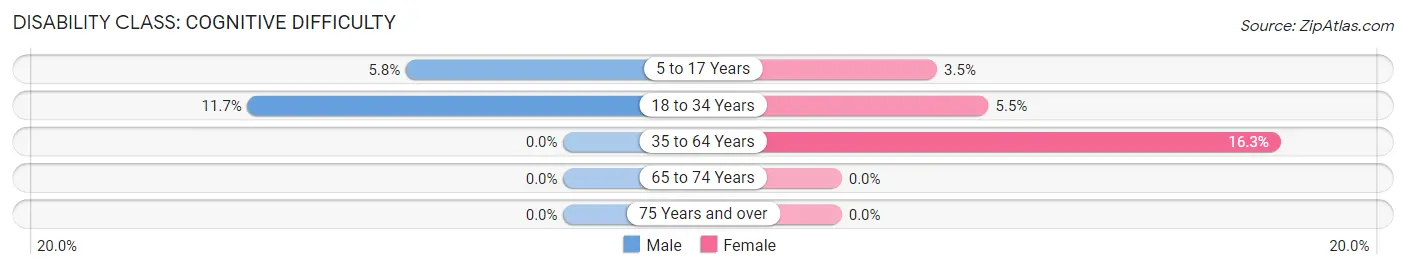
| Age Bracket | Male | Female |
| 5 to 17 Years | 32 (5.8%) | 19 (3.5%) |
| 18 to 34 Years | 15 (11.7%) | 36 (5.4%) |
| 35 to 64 Years | 0 (0.0%) | 72 (16.3%) |
| 65 to 74 Years | 0 (0.0%) | 0 (0.0%) |
| 75 Years and over | 0 (0.0%) | 0 (0.0%) |
Disability Class: Ambulatory Difficulty
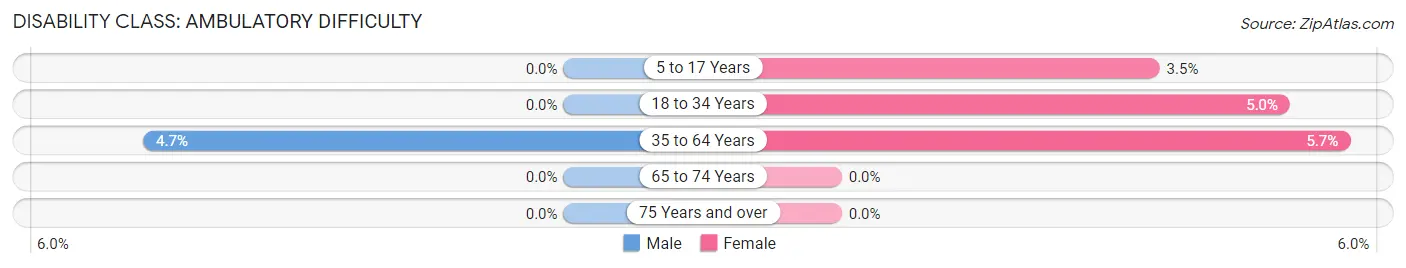
| Age Bracket | Male | Female |
| 5 to 17 Years | 0 (0.0%) | 19 (3.5%) |
| 18 to 34 Years | 0 (0.0%) | 33 (5.0%) |
| 35 to 64 Years | 8 (4.7%) | 25 (5.7%) |
| 65 to 74 Years | 0 (0.0%) | 0 (0.0%) |
| 75 Years and over | 0 (0.0%) | 0 (0.0%) |
Disability Class: Self-Care Difficulty
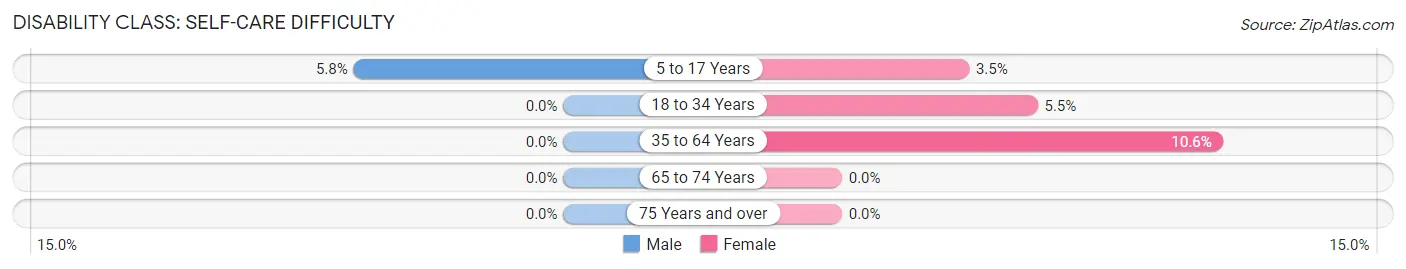
| Age Bracket | Male | Female |
| 5 to 17 Years | 32 (5.8%) | 19 (3.5%) |
| 18 to 34 Years | 0 (0.0%) | 36 (5.4%) |
| 35 to 64 Years | 0 (0.0%) | 47 (10.6%) |
| 65 to 74 Years | 0 (0.0%) | 0 (0.0%) |
| 75 Years and over | 0 (0.0%) | 0 (0.0%) |
Technology Access in North Fort Lewis
Computing Device Access in North Fort Lewis
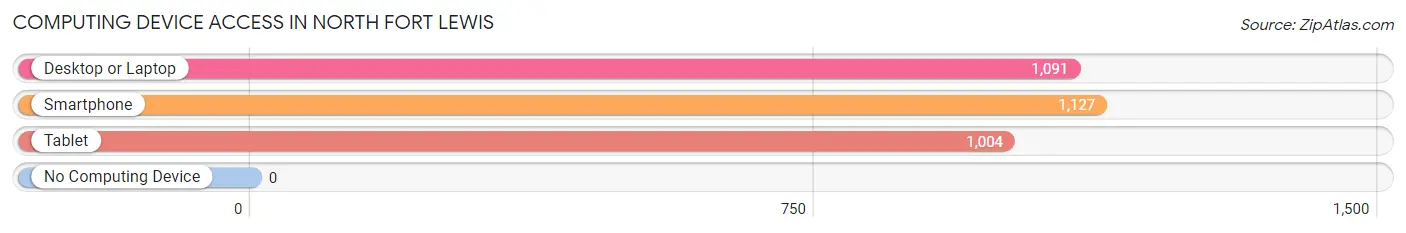
| Device Type | # Households | % Households |
| Desktop or Laptop | 1,091 | 96.8% |
| Smartphone | 1,127 | 100.0% |
| Tablet | 1,004 | 89.1% |
| No Computing Device | 0 | 0.0% |
| Total | 1,127 | 100.0% |
Internet Access in North Fort Lewis
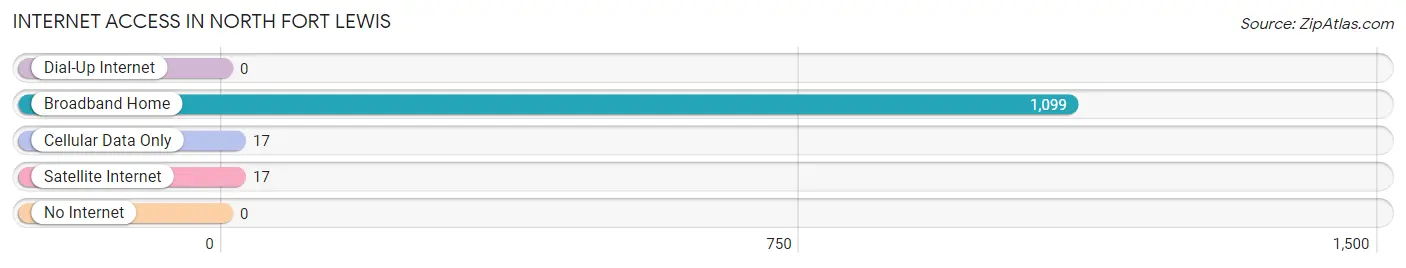
| Internet Type | # Households | % Households |
| Dial-Up Internet | 0 | 0.0% |
| Broadband Home | 1,099 | 97.5% |
| Cellular Data Only | 17 | 1.5% |
| Satellite Internet | 17 | 1.5% |
| No Internet | 0 | 0.0% |
| Total | 1,127 | 100.0% |
North Fort Lewis Summary
Fort Lewis is a United States Army installation located in Pierce County, Washington, near the city of Tacoma. It is the largest military installation in the Pacific Northwest and is home to the I Corps and the 62nd Airlift Wing. The base was established in 1917 and has been an important part of the region’s history ever since.
Geography
Fort Lewis is located in the Puget Sound region of Washington State, approximately 30 miles south of Seattle and 40 miles north of Olympia. The base is situated on the western side of the Cascade Mountains, and is bordered by the cities of Tacoma, Lakewood, and DuPont. The base covers an area of approximately 87,000 acres, and is home to a variety of terrain, including forests, wetlands, and grasslands.
Economy
Fort Lewis is a major economic driver for the region, providing jobs and economic activity to the surrounding communities. The base is home to over 20,000 military personnel and their families, and employs over 10,000 civilian personnel. The base also houses a variety of businesses, including retail stores, restaurants, and other services. In addition, the base is home to a number of research and development facilities, as well as a number of military schools and training centers.
Demographics
As of the 2010 census, the population of Fort Lewis was 8,845. The racial makeup of the base was 79.3% White, 8.2% African American, 4.2% Asian, 0.7% Native American, and 0.2% Pacific Islander. The median household income was $50,845, and the median family income was $60,845.
History
Fort Lewis was established in 1917 as Camp Lewis, and was named after Meriwether Lewis of the Lewis and Clark Expedition. The base was initially used as a training center for World War I soldiers, and was later used as a staging area for troops heading to the Pacific Theater during World War II. In 1947, the base was renamed Fort Lewis, and in 1950 it became the home of the 9th Infantry Division. During the Vietnam War, the base was used as a staging area for troops heading to the conflict. In the 1980s, the base was home to the 7th Infantry Division, and in the 1990s it became the home of the I Corps.
Today, Fort Lewis is an important part of the region’s economy and culture. The base is home to a variety of military units, and is also home to a number of research and development facilities. In addition, the base is home to a variety of businesses, including retail stores, restaurants, and other services. The base also serves as a major employer for the region, providing jobs and economic activity to the surrounding communities.
Common Questions
What is Per Capita Income in North Fort Lewis?
Per Capita income in North Fort Lewis is $24,151.
What is the Median Family Income in North Fort Lewis?
Median Family Income in North Fort Lewis is $70,260.
What is the Median Household income in North Fort Lewis?
Median Household Income in North Fort Lewis is $67,708.
What is Income or Wage Gap in North Fort Lewis?
Income or Wage Gap in North Fort Lewis is 14.7%.
Women in North Fort Lewis earn 85.3 cents for every dollar earned by a man.
What is Inequality or Gini Index in North Fort Lewis?
Inequality or Gini Index in North Fort Lewis is 0.31.
What is the Total Population of North Fort Lewis?
Total Population of North Fort Lewis is 6,022.
What is the Total Male Population of North Fort Lewis?
Total Male Population of North Fort Lewis is 3,556.
What is the Total Female Population of North Fort Lewis?
Total Female Population of North Fort Lewis is 2,466.
What is the Ratio of Males per 100 Females in North Fort Lewis?
There are 144.20 Males per 100 Females in North Fort Lewis.
What is the Ratio of Females per 100 Males in North Fort Lewis?
There are 69.35 Females per 100 Males in North Fort Lewis.
What is the Median Population Age in North Fort Lewis?
Median Population Age in North Fort Lewis is 24.2 Years.
What is the Average Family Size in North Fort Lewis
Average Family Size in North Fort Lewis is 3.6 People.
What is the Average Household Size in North Fort Lewis
Average Household Size in North Fort Lewis is 3.6 People.
How Large is the Labor Force in North Fort Lewis?
There are 3,480 People in the Labor Forcein in North Fort Lewis.
What is the Percentage of People in the Labor Force in North Fort Lewis?
80.1% of People are in the Labor Force in North Fort Lewis.
What is the Unemployment Rate in North Fort Lewis?
Unemployment Rate in North Fort Lewis is 14.7%.