Hansville, WA Map & Demographics
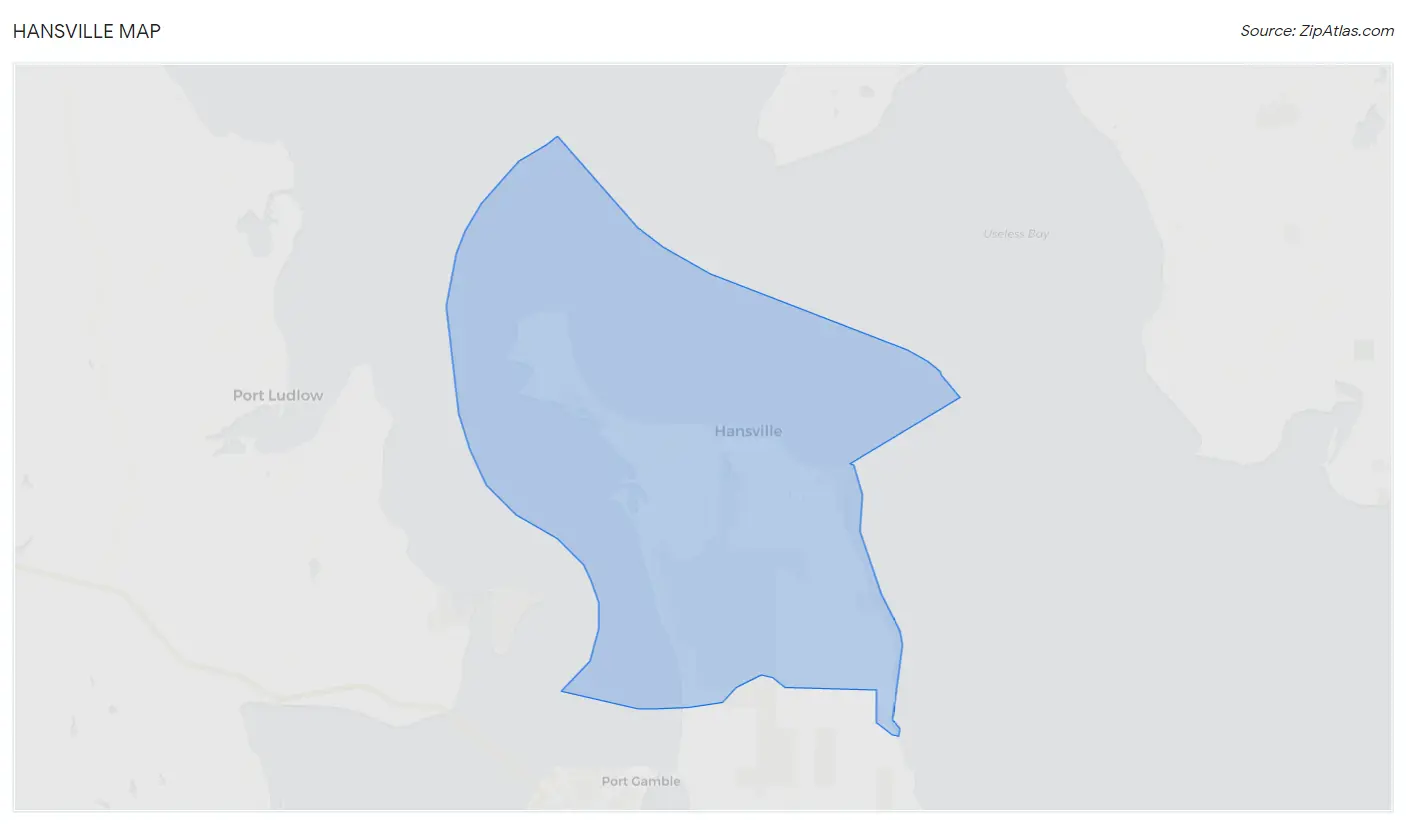
Hansville Map
Hansville Overview
$59,754
PER CAPITA INCOME
$121,393
AVG FAMILY INCOME
$97,331
AVG HOUSEHOLD INCOME
35.6%
WAGE / INCOME GAP [ % ]
64.4¢/ $1
WAGE / INCOME GAP [ $ ]
0.33
INEQUALITY / GINI INDEX
3,246
TOTAL POPULATION
1,525
MALE POPULATION
1,721
FEMALE POPULATION
88.61
MALES / 100 FEMALES
112.85
FEMALES / 100 MALES
66.0
MEDIAN AGE
2.4
AVG FAMILY SIZE
2.0
AVG HOUSEHOLD SIZE
1,030
LABOR FORCE [ PEOPLE ]
33.8%
PERCENT IN LABOR FORCE
0.9%
UNEMPLOYMENT RATE
Hansville Zip Codes
Hansville Area Codes
Income in Hansville
Income Overview in Hansville
Per Capita Income in Hansville is $59,754, while median incomes of families and households are $121,393 and $97,331 respectively.
| Characteristic | Number | Measure |
| Per Capita Income | 3,246 | $59,754 |
| Median Family Income | 1,114 | $121,393 |
| Mean Family Income | 1,114 | $128,168 |
| Median Household Income | 1,616 | $97,331 |
| Mean Household Income | 1,616 | $110,871 |
| Income Deficit | 1,114 | $0 |
| Wage / Income Gap (%) | 3,246 | 35.59% |
| Wage / Income Gap ($) | 3,246 | 64.41¢ per $1 |
| Gini / Inequality Index | 3,246 | 0.33 |
Earnings by Sex in Hansville
Average Earnings in Hansville are $68,419, $73,482 for men and $47,333 for women, a difference of 35.6%.
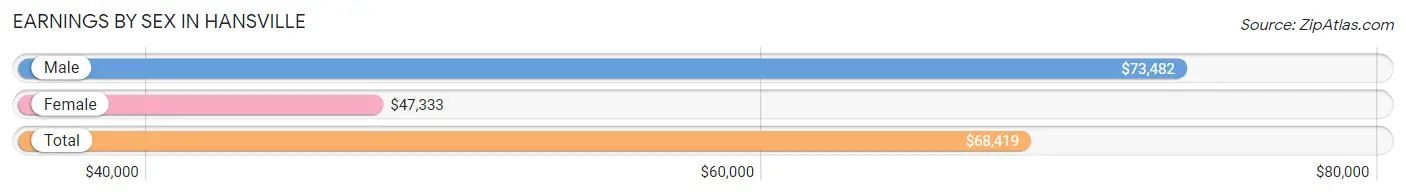
| Sex | Number | Average Earnings |
| Male | 633 (53.1%) | $73,482 |
| Female | 560 (46.9%) | $47,333 |
| Total | 1,193 (100.0%) | $68,419 |
Earnings by Sex by Income Bracket in Hansville
The most common earnings brackets in Hansville are $100,000+ for men (186 | 29.4%) and $75,000 to $99,999 for women (123 | 22.0%).
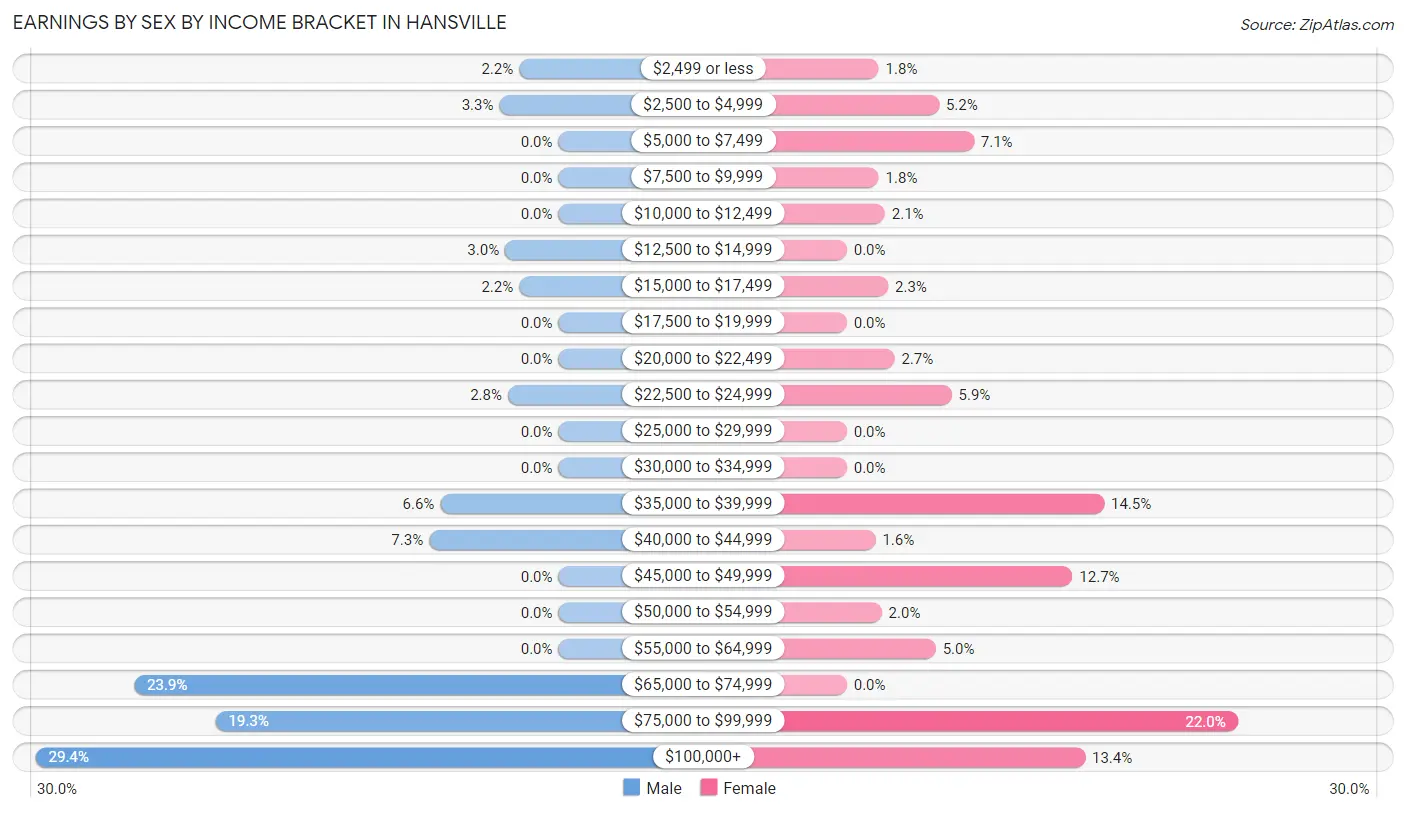
| Income | Male | Female |
| $2,499 or less | 14 (2.2%) | 10 (1.8%) |
| $2,500 to $4,999 | 21 (3.3%) | 29 (5.2%) |
| $5,000 to $7,499 | 0 (0.0%) | 40 (7.1%) |
| $7,500 to $9,999 | 0 (0.0%) | 10 (1.8%) |
| $10,000 to $12,499 | 0 (0.0%) | 12 (2.1%) |
| $12,500 to $14,999 | 19 (3.0%) | 0 (0.0%) |
| $15,000 to $17,499 | 14 (2.2%) | 13 (2.3%) |
| $17,500 to $19,999 | 0 (0.0%) | 0 (0.0%) |
| $20,000 to $22,499 | 0 (0.0%) | 15 (2.7%) |
| $22,500 to $24,999 | 18 (2.8%) | 33 (5.9%) |
| $25,000 to $29,999 | 0 (0.0%) | 0 (0.0%) |
| $30,000 to $34,999 | 0 (0.0%) | 0 (0.0%) |
| $35,000 to $39,999 | 42 (6.6%) | 81 (14.5%) |
| $40,000 to $44,999 | 46 (7.3%) | 9 (1.6%) |
| $45,000 to $49,999 | 0 (0.0%) | 71 (12.7%) |
| $50,000 to $54,999 | 0 (0.0%) | 11 (2.0%) |
| $55,000 to $64,999 | 0 (0.0%) | 28 (5.0%) |
| $65,000 to $74,999 | 151 (23.8%) | 0 (0.0%) |
| $75,000 to $99,999 | 122 (19.3%) | 123 (22.0%) |
| $100,000+ | 186 (29.4%) | 75 (13.4%) |
| Total | 633 (100.0%) | 560 (100.0%) |
Earnings by Sex by Educational Attainment in Hansville
Average earnings in Hansville are $80,172 for men and $48,201 for women, a difference of 39.9%. Men with an educational attainment of graduate degree enjoy the highest average annual earnings of $120,750, while those with college or associate's degree education earn the least with $69,298. Women with an educational attainment of graduate degree earn the most with the average annual earnings of $81,597, while those with college or associate's degree education have the smallest earnings of $46,167.
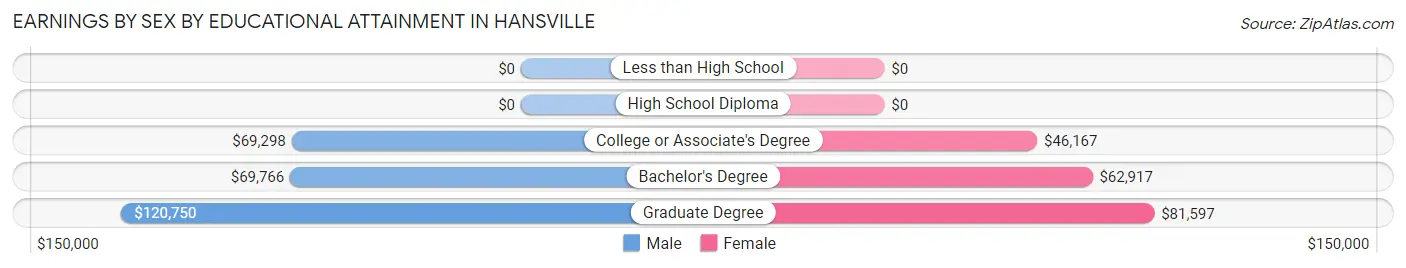
| Educational Attainment | Male Income | Female Income |
| Less than High School | - | - |
| High School Diploma | - | - |
| College or Associate's Degree | $69,298 | $46,167 |
| Bachelor's Degree | $69,766 | $62,917 |
| Graduate Degree | $120,750 | $81,597 |
| Total | $80,172 | $48,201 |
Family Income in Hansville
Family Income Brackets in Hansville
According to the Hansville family income data, there are 280 families falling into the $150,000 to $199,999 income range, which is the most common income bracket and makes up 25.1% of all families.
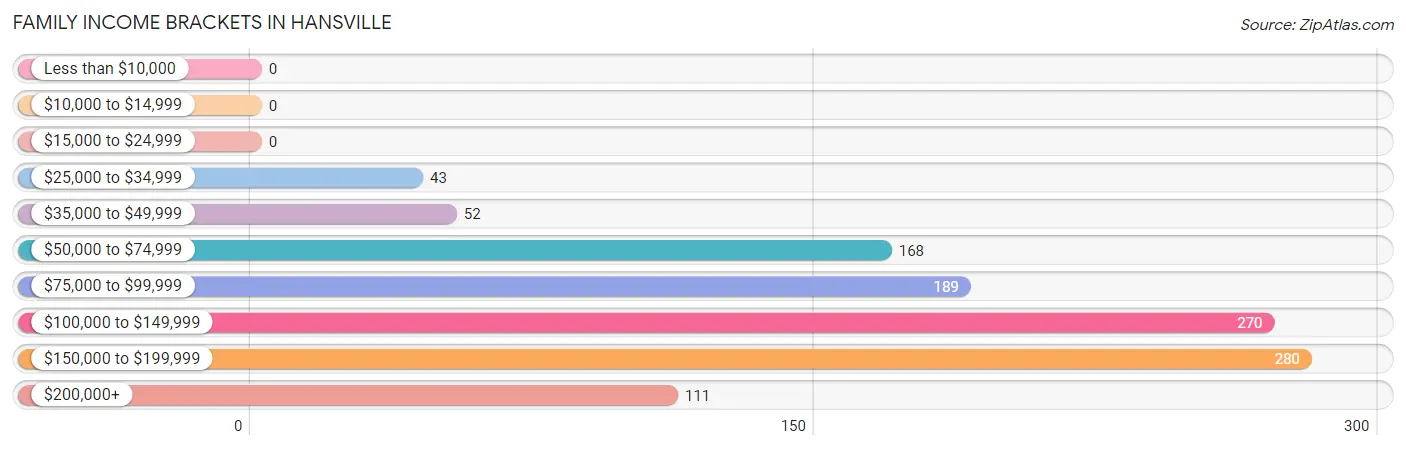
| Income Bracket | # Families | % Families |
| Less than $10,000 | 0 | 0.0% |
| $10,000 to $14,999 | 0 | 0.0% |
| $15,000 to $24,999 | 0 | 0.0% |
| $25,000 to $34,999 | 43 | 3.9% |
| $35,000 to $49,999 | 52 | 4.7% |
| $50,000 to $74,999 | 168 | 15.1% |
| $75,000 to $99,999 | 189 | 17.0% |
| $100,000 to $149,999 | 270 | 24.2% |
| $150,000 to $199,999 | 280 | 25.1% |
| $200,000+ | 111 | 10.0% |
Family Income by Famaliy Size in Hansville
4-person families (69 | 6.2%) account for the highest median family income in Hansville with $175,074 per family, while 2-person families (910 | 81.7%) have the highest median income of $52,614 per family member.
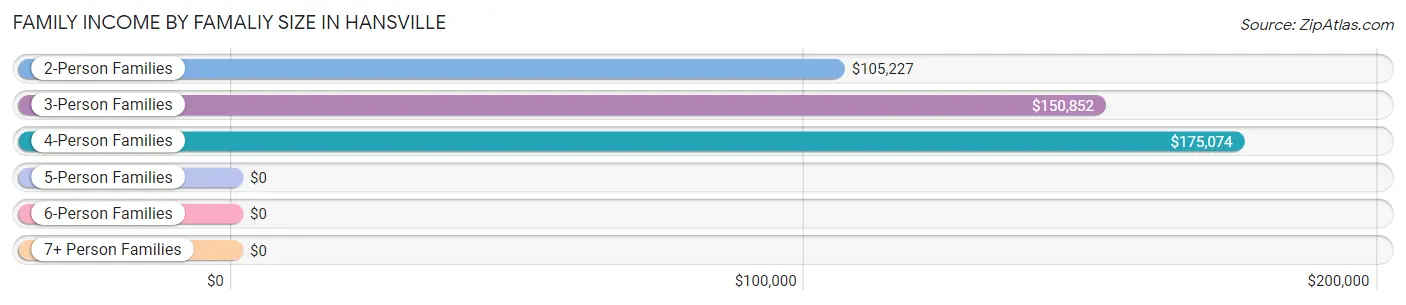
| Income Bracket | # Families | Median Income |
| 2-Person Families | 910 (81.7%) | $105,227 |
| 3-Person Families | 119 (10.7%) | $150,852 |
| 4-Person Families | 69 (6.2%) | $175,074 |
| 5-Person Families | 16 (1.4%) | $0 |
| 6-Person Families | 0 (0.0%) | $0 |
| 7+ Person Families | 0 (0.0%) | $0 |
| Total | 1,114 (100.0%) | $121,393 |
Family Income by Number of Earners in Hansville
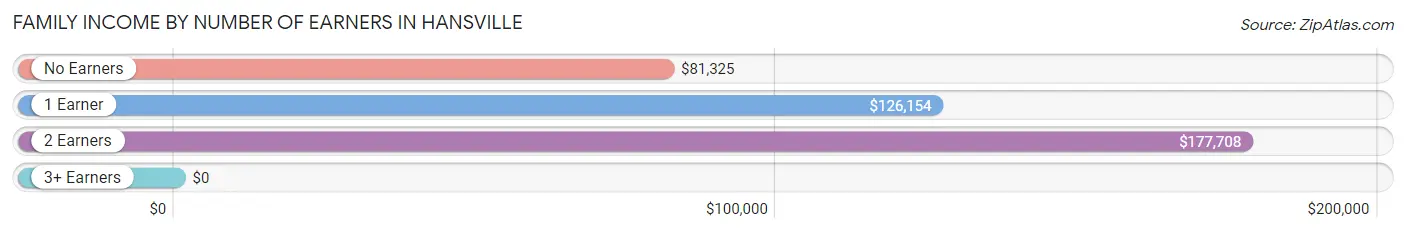
| Number of Earners | # Families | Median Income |
| No Earners | 573 (51.4%) | $81,325 |
| 1 Earner | 232 (20.8%) | $126,154 |
| 2 Earners | 281 (25.2%) | $177,708 |
| 3+ Earners | 28 (2.5%) | $0 |
| Total | 1,114 (100.0%) | $121,393 |
Household Income in Hansville
Household Income Brackets in Hansville
With 359 households falling in the category, the $50,000 to $74,999 income range is the most frequent in Hansville, accounting for 22.2% of all households.
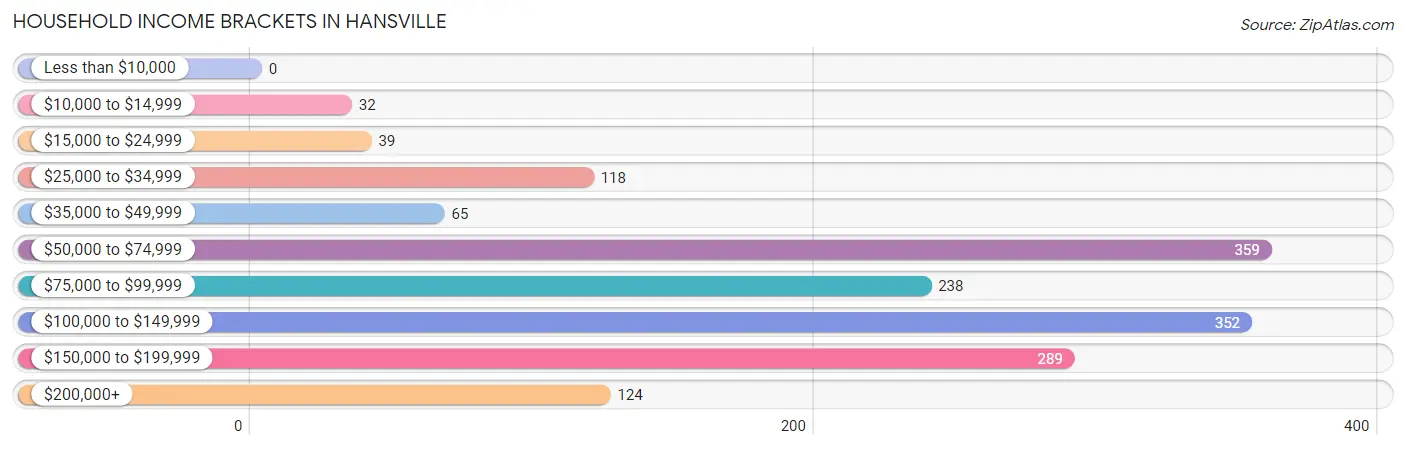
| Income Bracket | # Households | % Households |
| Less than $10,000 | 0 | 0.0% |
| $10,000 to $14,999 | 32 | 2.0% |
| $15,000 to $24,999 | 39 | 2.4% |
| $25,000 to $34,999 | 118 | 7.3% |
| $35,000 to $49,999 | 65 | 4.0% |
| $50,000 to $74,999 | 359 | 22.2% |
| $75,000 to $99,999 | 238 | 14.7% |
| $100,000 to $149,999 | 352 | 21.8% |
| $150,000 to $199,999 | 289 | 17.9% |
| $200,000+ | 124 | 7.7% |
Household Income by Householder Age in Hansville
The median household income in Hansville is $97,331, with the highest median household income of $176,397 found in the 25 to 44 years age bracket for the primary householder. A total of 153 households (9.5%) fall into this category.
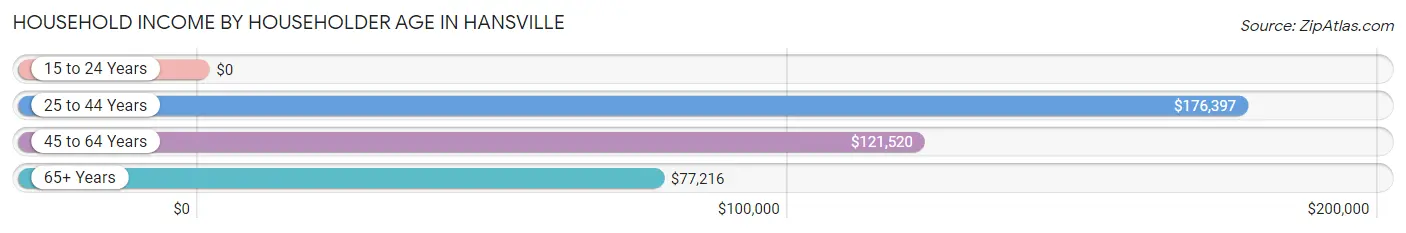
| Income Bracket | # Households | Median Income |
| 15 to 24 Years | 0 (0.0%) | $0 |
| 25 to 44 Years | 153 (9.5%) | $176,397 |
| 45 to 64 Years | 478 (29.6%) | $121,520 |
| 65+ Years | 985 (61.0%) | $77,216 |
| Total | 1,616 (100.0%) | $97,331 |
Poverty in Hansville
Income Below Poverty by Sex and Age in Hansville
With 0.8% poverty level for males and 1.9% for females among the residents of Hansville, 18 to 24 year old males and 55 to 64 year old females are the most vulnerable to poverty, with 12 males (36.4%) and 20 females (6.5%) in their respective age groups living below the poverty level.
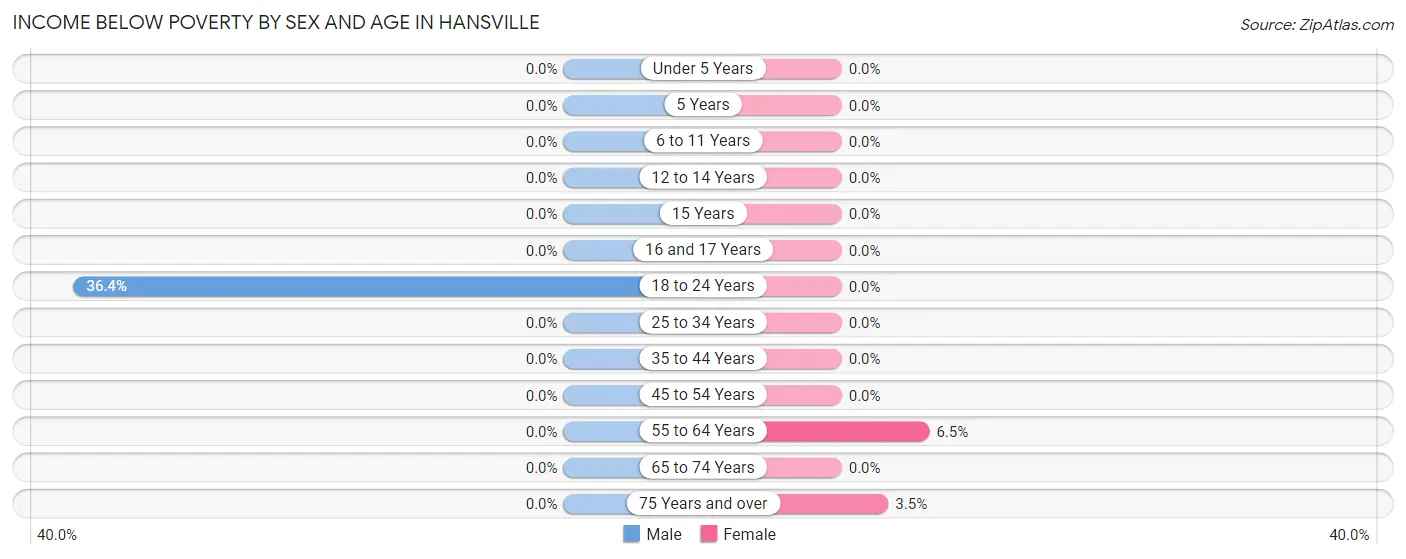
| Age Bracket | Male | Female |
| Under 5 Years | 0 (0.0%) | 0 (0.0%) |
| 5 Years | 0 (0.0%) | 0 (0.0%) |
| 6 to 11 Years | 0 (0.0%) | 0 (0.0%) |
| 12 to 14 Years | 0 (0.0%) | 0 (0.0%) |
| 15 Years | 0 (0.0%) | 0 (0.0%) |
| 16 and 17 Years | 0 (0.0%) | 0 (0.0%) |
| 18 to 24 Years | 12 (36.4%) | 0 (0.0%) |
| 25 to 34 Years | 0 (0.0%) | 0 (0.0%) |
| 35 to 44 Years | 0 (0.0%) | 0 (0.0%) |
| 45 to 54 Years | 0 (0.0%) | 0 (0.0%) |
| 55 to 64 Years | 0 (0.0%) | 20 (6.5%) |
| 65 to 74 Years | 0 (0.0%) | 0 (0.0%) |
| 75 Years and over | 0 (0.0%) | 12 (3.5%) |
| Total | 12 (0.8%) | 32 (1.9%) |
Income Above Poverty by Sex and Age in Hansville
According to the poverty statistics in Hansville, males aged under 5 years and females aged under 5 years are the age groups that are most secure financially, with 100.0% of males and 100.0% of females in these age groups living above the poverty line.
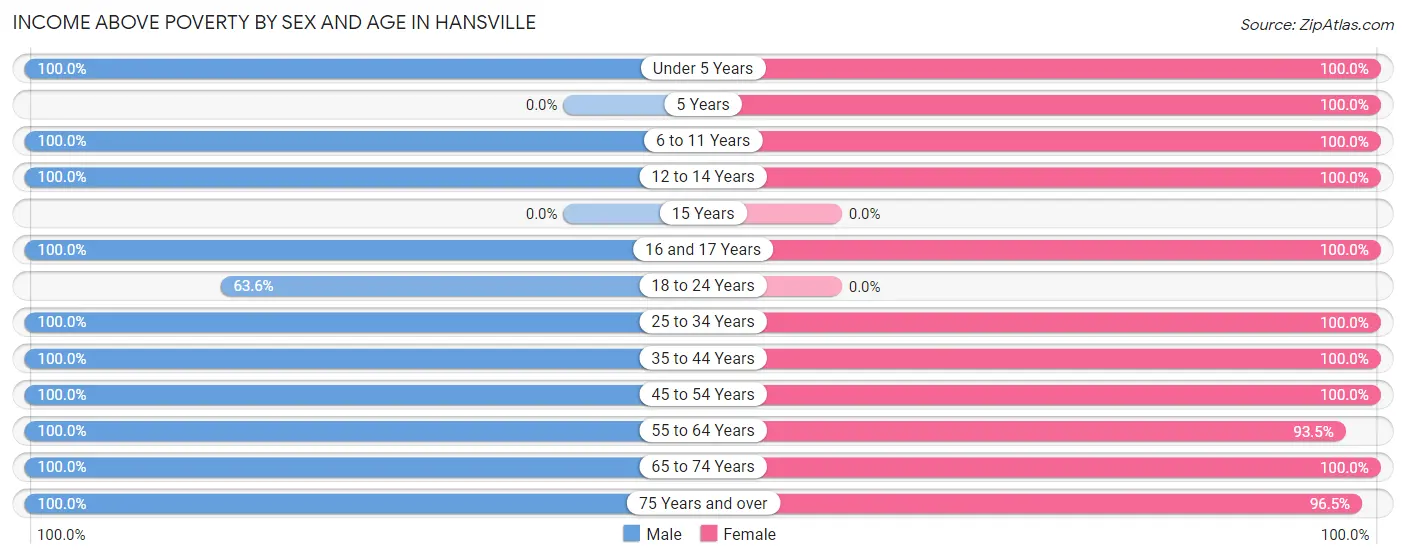
| Age Bracket | Male | Female |
| Under 5 Years | 25 (100.0%) | 26 (100.0%) |
| 5 Years | 0 (0.0%) | 19 (100.0%) |
| 6 to 11 Years | 32 (100.0%) | 39 (100.0%) |
| 12 to 14 Years | 14 (100.0%) | 44 (100.0%) |
| 15 Years | 0 (0.0%) | 0 (0.0%) |
| 16 and 17 Years | 38 (100.0%) | 49 (100.0%) |
| 18 to 24 Years | 21 (63.6%) | 0 (0.0%) |
| 25 to 34 Years | 46 (100.0%) | 61 (100.0%) |
| 35 to 44 Years | 62 (100.0%) | 139 (100.0%) |
| 45 to 54 Years | 207 (100.0%) | 66 (100.0%) |
| 55 to 64 Years | 337 (100.0%) | 287 (93.5%) |
| 65 to 74 Years | 394 (100.0%) | 624 (100.0%) |
| 75 Years and over | 337 (100.0%) | 335 (96.5%) |
| Total | 1,513 (99.2%) | 1,689 (98.1%) |
Income Below Poverty Among Married-Couple Families in Hansville
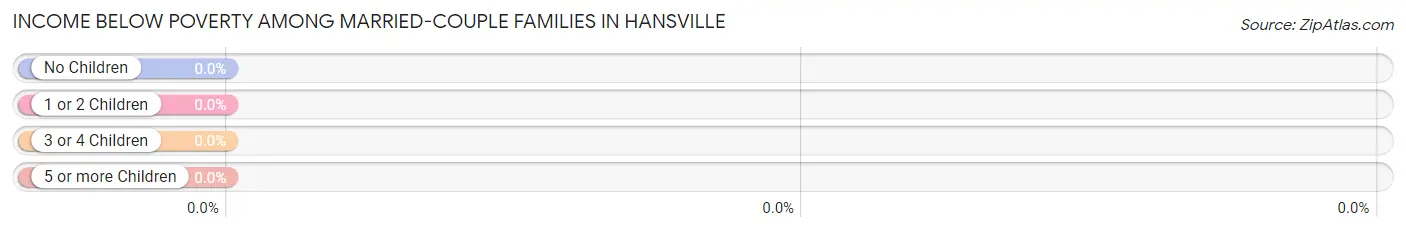
| Children | Above Poverty | Below Poverty |
| No Children | 902 (100.0%) | 0 (0.0%) |
| 1 or 2 Children | 120 (100.0%) | 0 (0.0%) |
| 3 or 4 Children | 16 (100.0%) | 0 (0.0%) |
| 5 or more Children | 0 (0.0%) | 0 (0.0%) |
| Total | 1,038 (100.0%) | 0 (0.0%) |
Income Below Poverty Among Single-Parent Households in Hansville
| Children | Single Father | Single Mother |
| No Children | 0 (0.0%) | 0 (0.0%) |
| 1 or 2 Children | 0 (0.0%) | 0 (0.0%) |
| 3 or 4 Children | 0 (0.0%) | 0 (0.0%) |
| 5 or more Children | 0 (0.0%) | 0 (0.0%) |
| Total | 0 (0.0%) | 0 (0.0%) |
Income Below Poverty Among Married-Couple vs Single-Parent Households in Hansville
| Children | Married-Couple Families | Single-Parent Households |
| No Children | 0 (0.0%) | 0 (0.0%) |
| 1 or 2 Children | 0 (0.0%) | 0 (0.0%) |
| 3 or 4 Children | 0 (0.0%) | 0 (0.0%) |
| 5 or more Children | 0 (0.0%) | 0 (0.0%) |
| Total | 0 (0.0%) | 0 (0.0%) |
Race in Hansville
The most populous races in Hansville are White / Caucasian (2,985 | 92.0%), Two or more Races (152 | 4.7%), and Hispanic or Latino (89 | 2.7%).
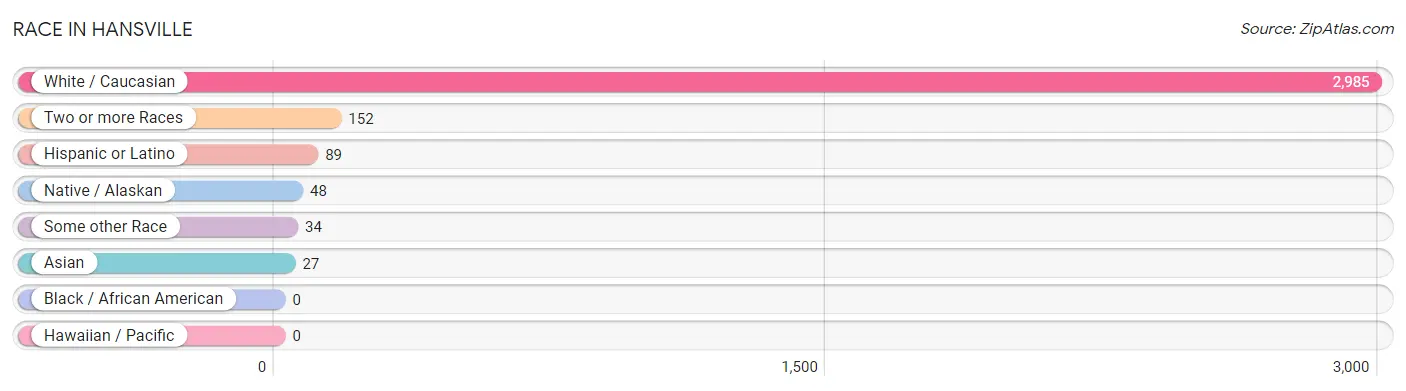
| Race | # Population | % Population |
| Asian | 27 | 0.8% |
| Black / African American | 0 | 0.0% |
| Hawaiian / Pacific | 0 | 0.0% |
| Hispanic or Latino | 89 | 2.7% |
| Native / Alaskan | 48 | 1.5% |
| White / Caucasian | 2,985 | 92.0% |
| Two or more Races | 152 | 4.7% |
| Some other Race | 34 | 1.1% |
| Total | 3,246 | 100.0% |
Ancestry in Hansville
The most populous ancestries reported in Hansville are English (672 | 20.7%), German (629 | 19.4%), Irish (528 | 16.3%), Norwegian (494 | 15.2%), and Scottish (194 | 6.0%), together accounting for 77.5% of all Hansville residents.
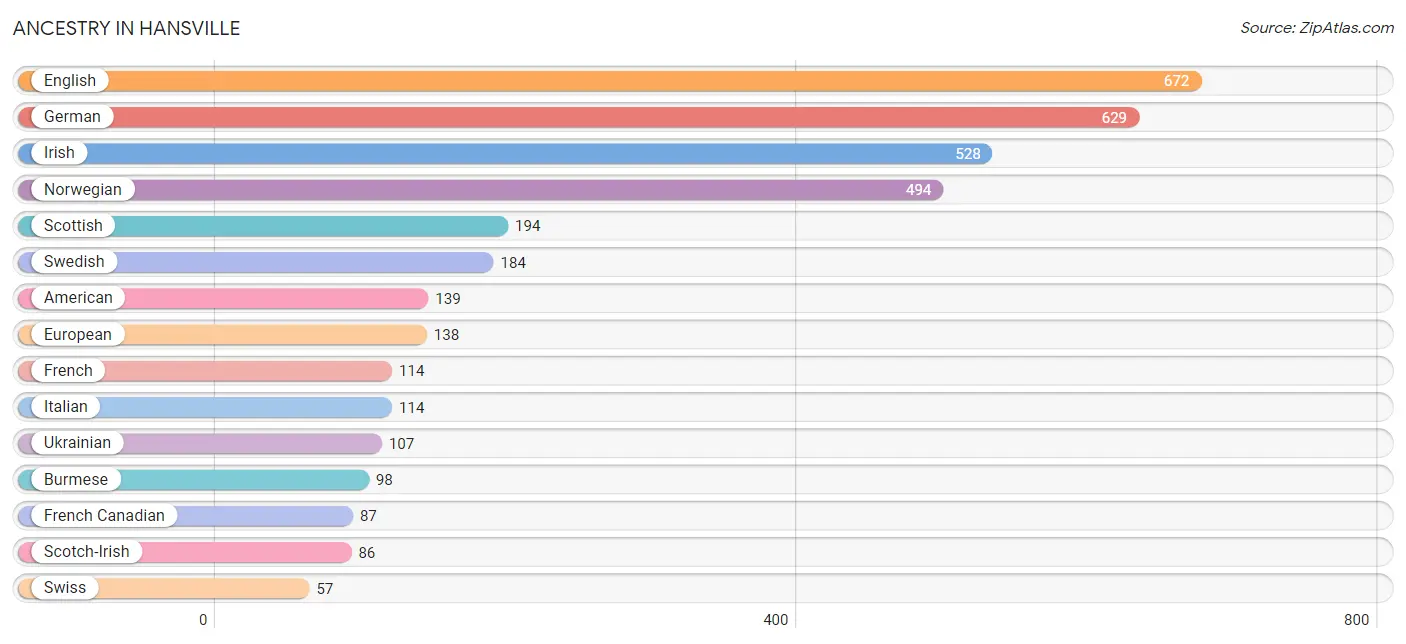
| Ancestry | # Population | % Population |
| American | 139 | 4.3% |
| Bhutanese | 20 | 0.6% |
| Brazilian | 31 | 1.0% |
| British | 13 | 0.4% |
| Burmese | 98 | 3.0% |
| Central American | 48 | 1.5% |
| Croatian | 49 | 1.5% |
| Czech | 43 | 1.3% |
| Dutch | 14 | 0.4% |
| English | 672 | 20.7% |
| European | 138 | 4.3% |
| Finnish | 30 | 0.9% |
| French | 114 | 3.5% |
| French Canadian | 87 | 2.7% |
| German | 629 | 19.4% |
| Irish | 528 | 16.3% |
| Italian | 114 | 3.5% |
| Lithuanian | 48 | 1.5% |
| Mexican | 7 | 0.2% |
| Native Hawaiian | 9 | 0.3% |
| Norwegian | 494 | 15.2% |
| Panamanian | 48 | 1.5% |
| Polish | 38 | 1.2% |
| Puerto Rican | 34 | 1.1% |
| Scotch-Irish | 86 | 2.6% |
| Scottish | 194 | 6.0% |
| Slavic | 18 | 0.5% |
| Swedish | 184 | 5.7% |
| Swiss | 57 | 1.8% |
| Ukrainian | 107 | 3.3% |
| Welsh | 23 | 0.7% | View All 31 Rows |
Immigrants in Hansville
The most numerous immigrant groups reported in Hansville came from Europe (176 | 5.4%), Northern Europe (140 | 4.3%), Norway (111 | 3.4%), Eastern Europe (35 | 1.1%), and Ukraine (35 | 1.1%), together accounting for 15.3% of all Hansville residents.
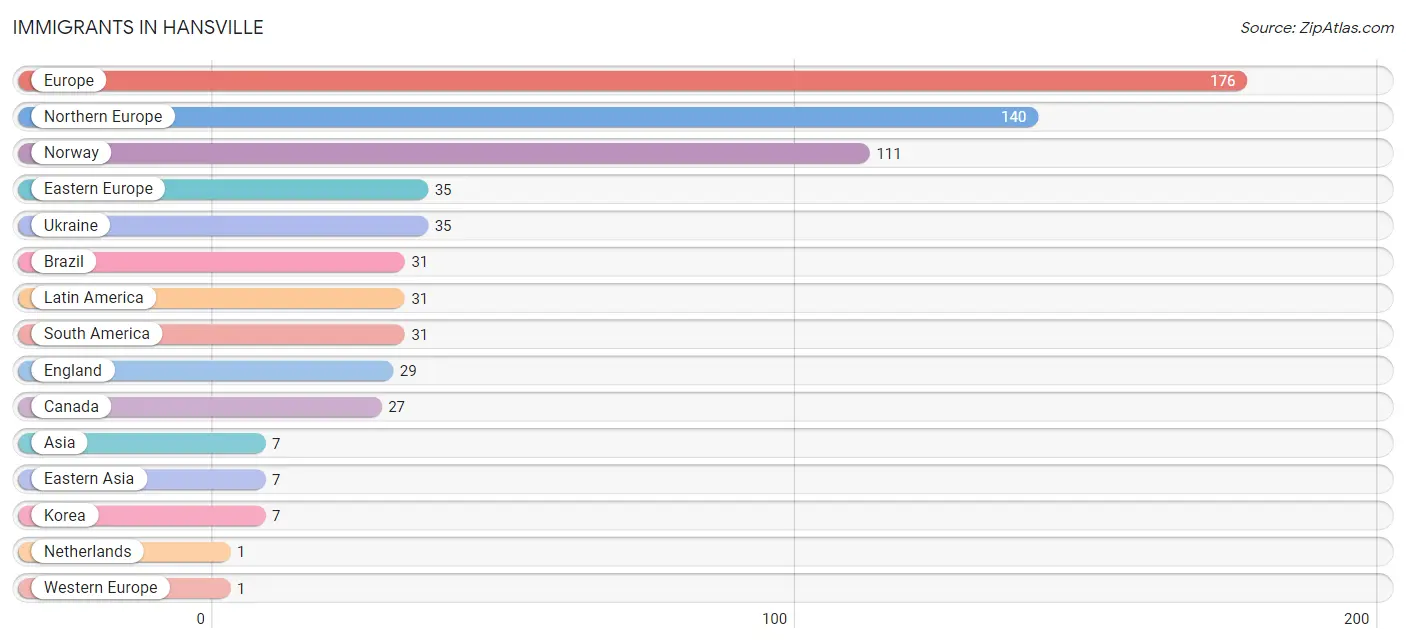
| Immigration Origin | # Population | % Population |
| Asia | 7 | 0.2% |
| Brazil | 31 | 1.0% |
| Canada | 27 | 0.8% |
| Eastern Asia | 7 | 0.2% |
| Eastern Europe | 35 | 1.1% |
| England | 29 | 0.9% |
| Europe | 176 | 5.4% |
| Korea | 7 | 0.2% |
| Latin America | 31 | 1.0% |
| Netherlands | 1 | 0.0% |
| Northern Europe | 140 | 4.3% |
| Norway | 111 | 3.4% |
| South America | 31 | 1.0% |
| Ukraine | 35 | 1.1% |
| Western Europe | 1 | 0.0% | View All 15 Rows |
Sex and Age in Hansville
Sex and Age in Hansville
The most populous age groups in Hansville are 70 to 74 Years (237 | 15.5%) for men and 65 to 69 Years (344 | 20.0%) for women.
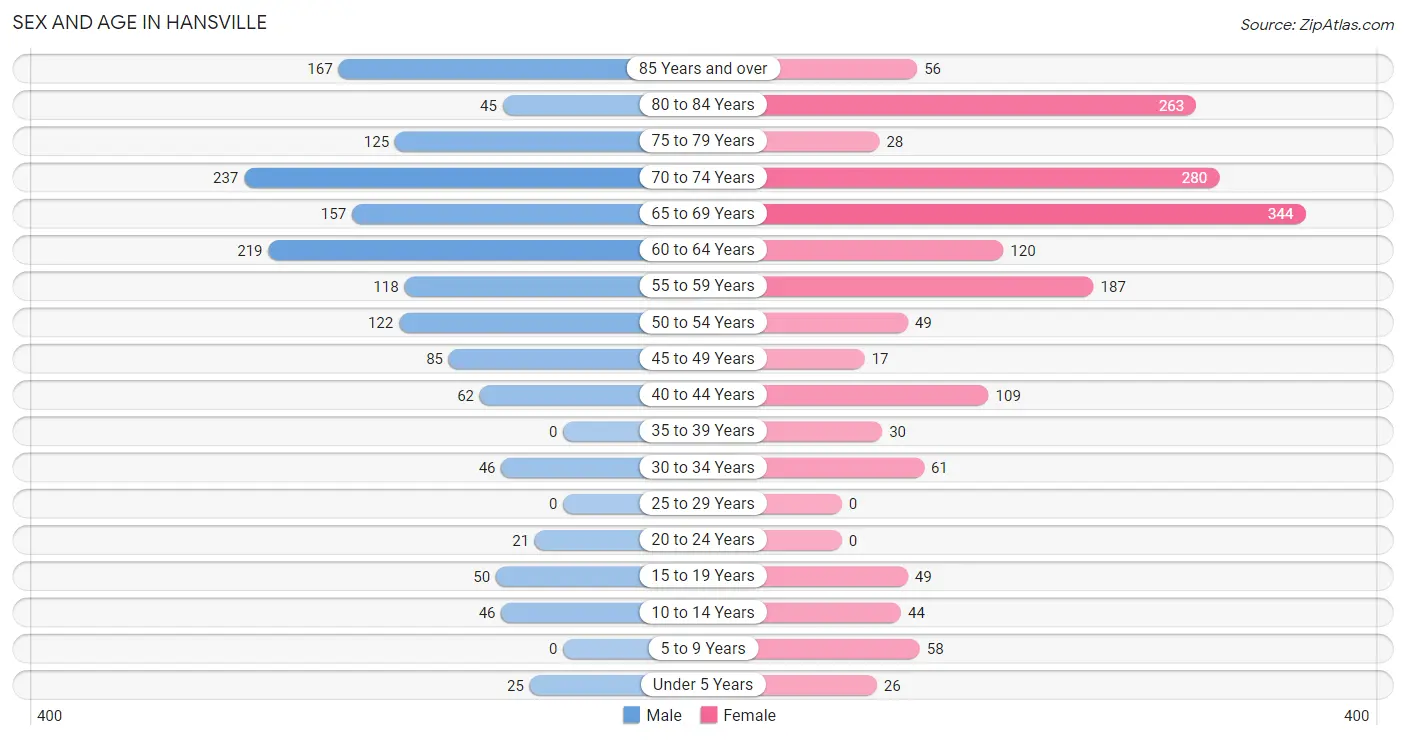
| Age Bracket | Male | Female |
| Under 5 Years | 25 (1.6%) | 26 (1.5%) |
| 5 to 9 Years | 0 (0.0%) | 58 (3.4%) |
| 10 to 14 Years | 46 (3.0%) | 44 (2.6%) |
| 15 to 19 Years | 50 (3.3%) | 49 (2.9%) |
| 20 to 24 Years | 21 (1.4%) | 0 (0.0%) |
| 25 to 29 Years | 0 (0.0%) | 0 (0.0%) |
| 30 to 34 Years | 46 (3.0%) | 61 (3.5%) |
| 35 to 39 Years | 0 (0.0%) | 30 (1.7%) |
| 40 to 44 Years | 62 (4.1%) | 109 (6.3%) |
| 45 to 49 Years | 85 (5.6%) | 17 (1.0%) |
| 50 to 54 Years | 122 (8.0%) | 49 (2.9%) |
| 55 to 59 Years | 118 (7.7%) | 187 (10.9%) |
| 60 to 64 Years | 219 (14.4%) | 120 (7.0%) |
| 65 to 69 Years | 157 (10.3%) | 344 (20.0%) |
| 70 to 74 Years | 237 (15.5%) | 280 (16.3%) |
| 75 to 79 Years | 125 (8.2%) | 28 (1.6%) |
| 80 to 84 Years | 45 (2.9%) | 263 (15.3%) |
| 85 Years and over | 167 (11.0%) | 56 (3.3%) |
| Total | 1,525 (100.0%) | 1,721 (100.0%) |
Families and Households in Hansville
Median Family Size in Hansville
The median family size in Hansville is 2.43 persons per family, with single female/mother families (32 | 2.9%) accounting for the largest median family size of 2.91 persons per family. On the other hand, single male/father families (44 | 4.0%) represent the smallest median family size with 2.39 persons per family.
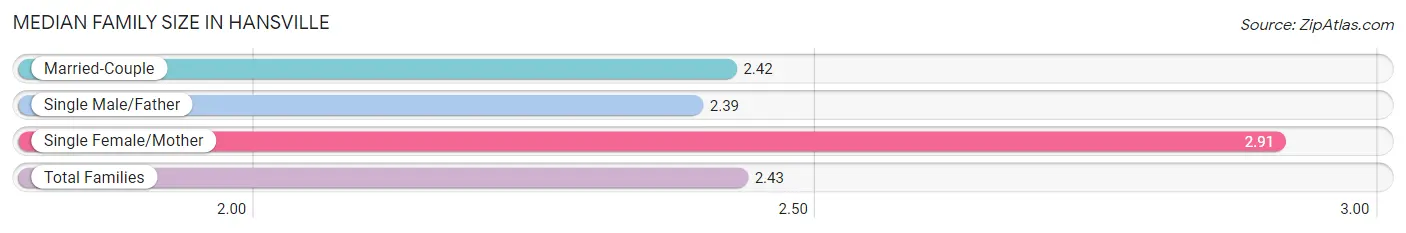
| Family Type | # Families | Family Size |
| Married-Couple | 1,038 (93.2%) | 2.42 |
| Single Male/Father | 44 (4.0%) | 2.39 |
| Single Female/Mother | 32 (2.9%) | 2.91 |
| Total Families | 1,114 (100.0%) | 2.43 |
Median Household Size in Hansville
The median household size in Hansville is 2.01 persons per household, with single female/mother households (32 | 2.0%) accounting for the largest median household size of 2.91 persons per household. non-family households (502 | 31.1%) represent the smallest median household size with 1.05 persons per household.
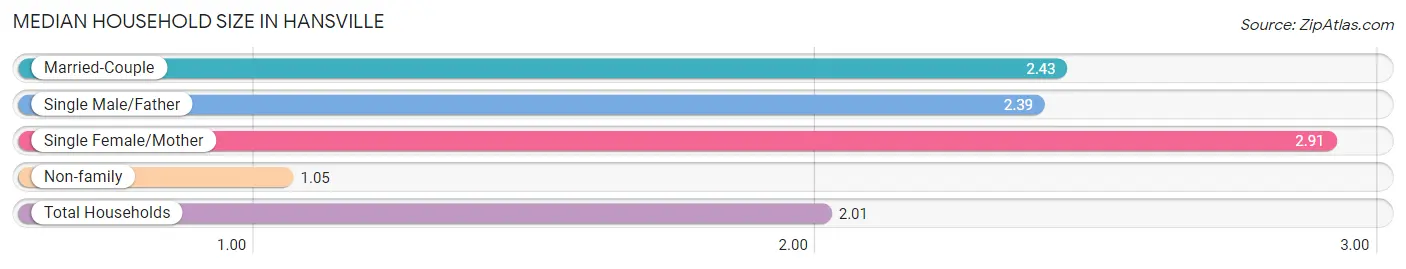
| Household Type | # Households | Household Size |
| Married-Couple | 1,038 (64.2%) | 2.43 |
| Single Male/Father | 44 (2.7%) | 2.39 |
| Single Female/Mother | 32 (2.0%) | 2.91 |
| Non-family | 502 (31.1%) | 1.05 |
| Total Households | 1,616 (100.0%) | 2.01 |
Household Size by Marriage Status in Hansville
Out of a total of 1,616 households in Hansville, 1,114 (68.9%) are family households, while 502 (31.1%) are nonfamily households. The most numerous type of family households are 2-person households, comprising 901, and the most common type of nonfamily households are 1-person households, comprising 475.
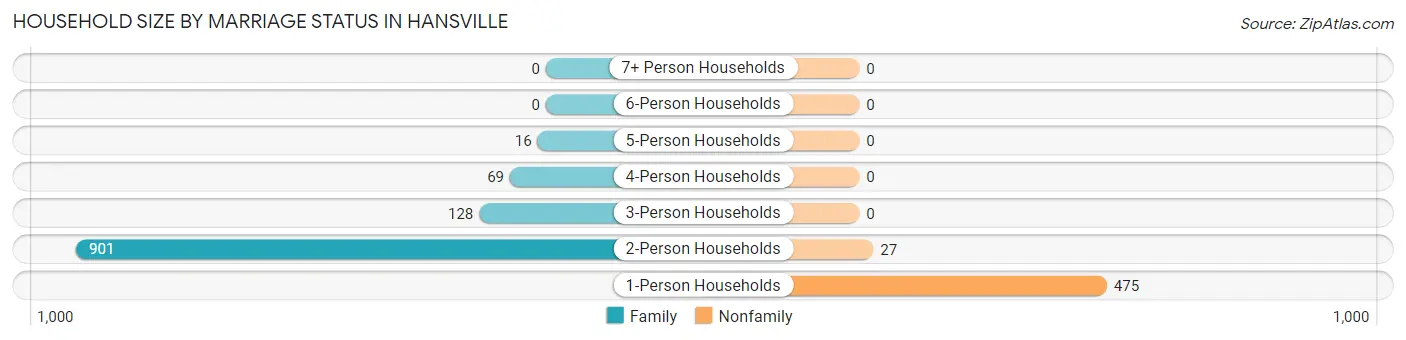
| Household Size | Family Households | Nonfamily Households |
| 1-Person Households | - | 475 (29.4%) |
| 2-Person Households | 901 (55.7%) | 27 (1.7%) |
| 3-Person Households | 128 (7.9%) | 0 (0.0%) |
| 4-Person Households | 69 (4.3%) | 0 (0.0%) |
| 5-Person Households | 16 (1.0%) | 0 (0.0%) |
| 6-Person Households | 0 (0.0%) | 0 (0.0%) |
| 7+ Person Households | 0 (0.0%) | 0 (0.0%) |
| Total | 1,114 (68.9%) | 502 (31.1%) |
Female Fertility in Hansville
Fertility by Age in Hansville
Average fertility rate in Hansville is 53.0 births per 1,000 women. Women in the age bracket of 35 to 50 years have the highest fertility rate with 90.0 births per 1,000 women. Women in the age bracket of 35 to 50 years acount for 100.0% of all women with births.
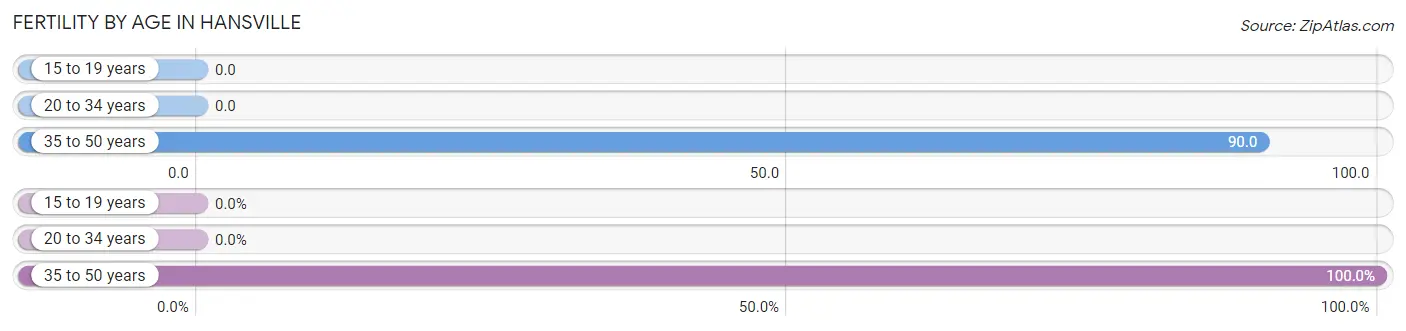
| Age Bracket | Women with Births | Births / 1,000 Women |
| 15 to 19 years | 0 (0.0%) | 0.0 |
| 20 to 34 years | 0 (0.0%) | 0.0 |
| 35 to 50 years | 14 (100.0%) | 90.0 |
| Total | 14 (100.0%) | 53.0 |
Fertility by Age by Marriage Status in Hansville
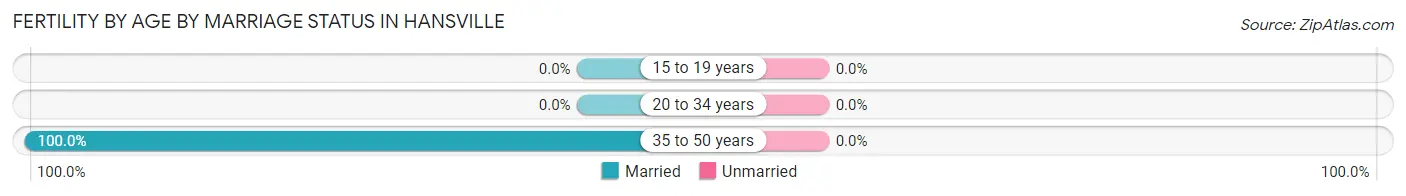
| Age Bracket | Married | Unmarried |
| 15 to 19 years | 0 (0.0%) | 0 (0.0%) |
| 20 to 34 years | 0 (0.0%) | 0 (0.0%) |
| 35 to 50 years | 14 (100.0%) | 0 (0.0%) |
| Total | 14 (100.0%) | 0 (0.0%) |
Fertility by Education in Hansville
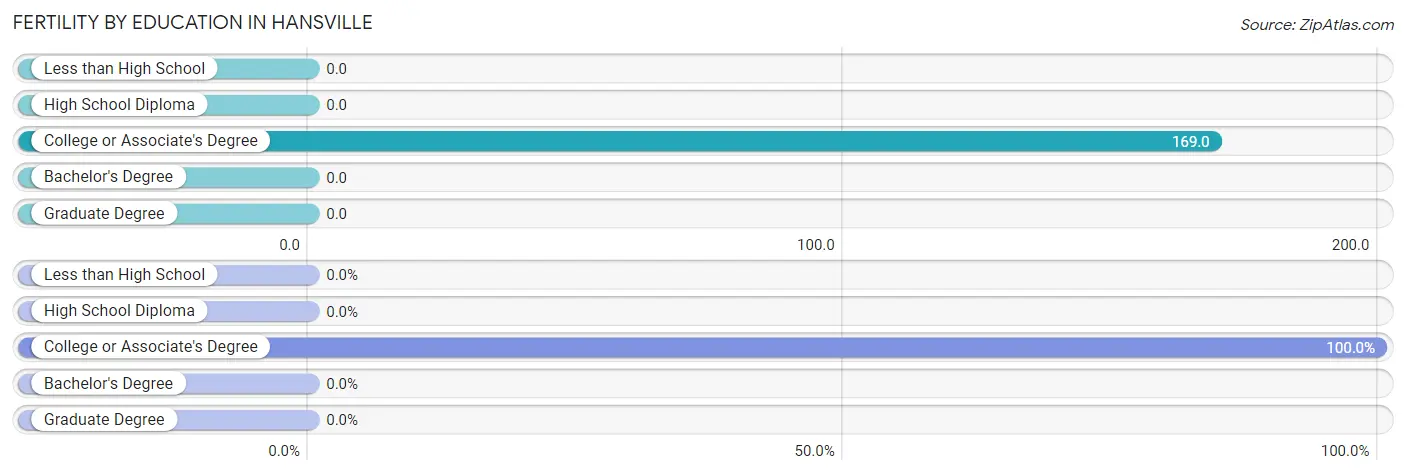
| Educational Attainment | Women with Births | Births / 1,000 Women |
| Less than High School | 0 (0.0%) | 0.0 |
| High School Diploma | 0 (0.0%) | 0.0 |
| College or Associate's Degree | 14 (100.0%) | 169.0 |
| Bachelor's Degree | 0 (0.0%) | 0.0 |
| Graduate Degree | 0 (0.0%) | 0.0 |
| Total | 14 (100.0%) | 53.0 |
Fertility by Education by Marriage Status in Hansville
| Educational Attainment | Married | Unmarried |
| Less than High School | 0 (0.0%) | 0 (0.0%) |
| High School Diploma | 0 (0.0%) | 0 (0.0%) |
| College or Associate's Degree | 14 (100.0%) | 0 (0.0%) |
| Bachelor's Degree | 0 (0.0%) | 0 (0.0%) |
| Graduate Degree | 0 (0.0%) | 0 (0.0%) |
| Total | 14 (100.0%) | 0 (0.0%) |
Employment Characteristics in Hansville
Employment by Class of Employer in Hansville
Among the 953 employed individuals in Hansville, private company employees (350 | 36.7%), local government employees (224 | 23.5%), and federal government employees (118 | 12.4%) make up the most common classes of employment.
| Employer Class | # Employees | % Employees |
| Private Company Employees | 350 | 36.7% |
| Self-Employed (Incorporated) | 31 | 3.3% |
| Self-Employed (Not Incorporated) | 114 | 12.0% |
| Not-for-profit Organizations | 30 | 3.2% |
| Local Government Employees | 224 | 23.5% |
| State Government Employees | 86 | 9.0% |
| Federal Government Employees | 118 | 12.4% |
| Unpaid Family Workers | 0 | 0.0% |
| Total | 953 | 100.0% |
Employment Status by Age in Hansville
According to the labor force statistics for Hansville, out of the total population over 16 years of age (3,047), 33.8% or 1,030 individuals are in the labor force, with 0.9% or 9 of them unemployed. The age group with the highest labor force participation rate is 45 to 54 years, with 95.6% or 261 individuals in the labor force. Within the labor force, the 45 to 54 years age range has the highest percentage of unemployed individuals, with 3.4% or 9 of them being unemployed.
| Age Bracket | In Labor Force | Unemployed |
| 16 to 19 Years | 27 (27.3%) | 0 (0.0%) |
| 20 to 24 Years | 0 (0.0%) | 0 (0.0%) |
| 25 to 29 Years | 0 (0.0%) | 0 (0.0%) |
| 30 to 34 Years | 85 (79.4%) | 0 (0.0%) |
| 35 to 44 Years | 171 (85.1%) | 0 (0.0%) |
| 45 to 54 Years | 261 (95.6%) | 9 (3.4%) |
| 55 to 59 Years | 217 (71.1%) | 0 (0.0%) |
| 60 to 64 Years | 175 (51.6%) | 0 (0.0%) |
| 65 to 74 Years | 84 (8.3%) | 0 (0.0%) |
| 75 Years and over | 8 (1.2%) | 0 (0.0%) |
| Total | 1,030 (33.8%) | 9 (0.9%) |
Employment Status by Educational Attainment in Hansville
According to labor force statistics for Hansville, 74.2% of individuals (909) out of the total population between 25 and 64 years of age (1,225) are in the labor force, with 1.0% or 9 of them being unemployed. The group with the highest labor force participation rate are those with the educational attainment of bachelor's degree or higher, with 82.6% or 370 individuals in the labor force. Within the labor force, individuals with bachelor's degree or higher education have the highest percentage of unemployment, with 2.4% or 9 of them being unemployed.
| Educational Attainment | In Labor Force | Unemployed |
| Less than High School | 37 (62.7%) | 0 (0.0%) |
| High School Diploma | 123 (54.7%) | 0 (0.0%) |
| College / Associate Degree | 379 (76.9%) | 0 (0.0%) |
| Bachelor's Degree or higher | 370 (82.6%) | 11 (2.4%) |
| Total | 909 (74.2%) | 12 (1.0%) |
Employment Occupations by Sex in Hansville
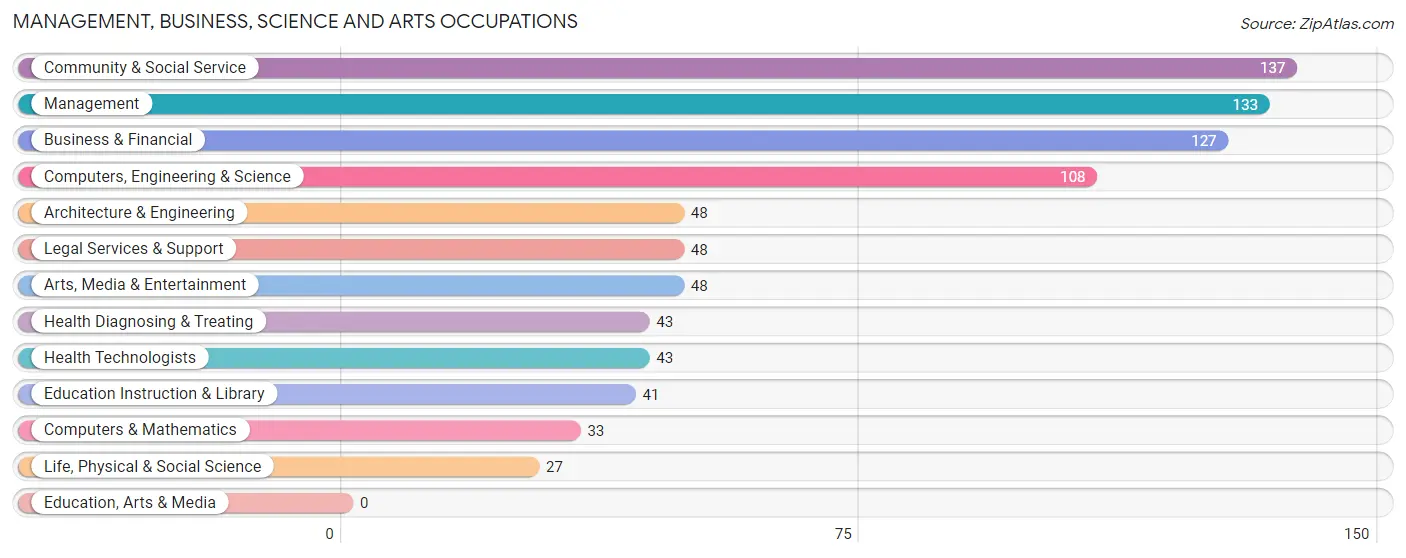
Management, Business, Science and Arts Occupations
The most common Management, Business, Science and Arts occupations in Hansville are Community & Social Service (137 | 13.4%), Management (133 | 13.0%), Business & Financial (127 | 12.4%), Computers, Engineering & Science (108 | 10.6%), and Architecture & Engineering (48 | 4.7%).
Management, Business, Science and Arts Occupations by Sex
Within the Management, Business, Science and Arts occupations in Hansville, the most male-oriented occupations are Computers & Mathematics (100.0%), Architecture & Engineering (100.0%), and Computers, Engineering & Science (88.0%), while the most female-oriented occupations are Legal Services & Support (100.0%), Education Instruction & Library (100.0%), and Health Diagnosing & Treating (100.0%).
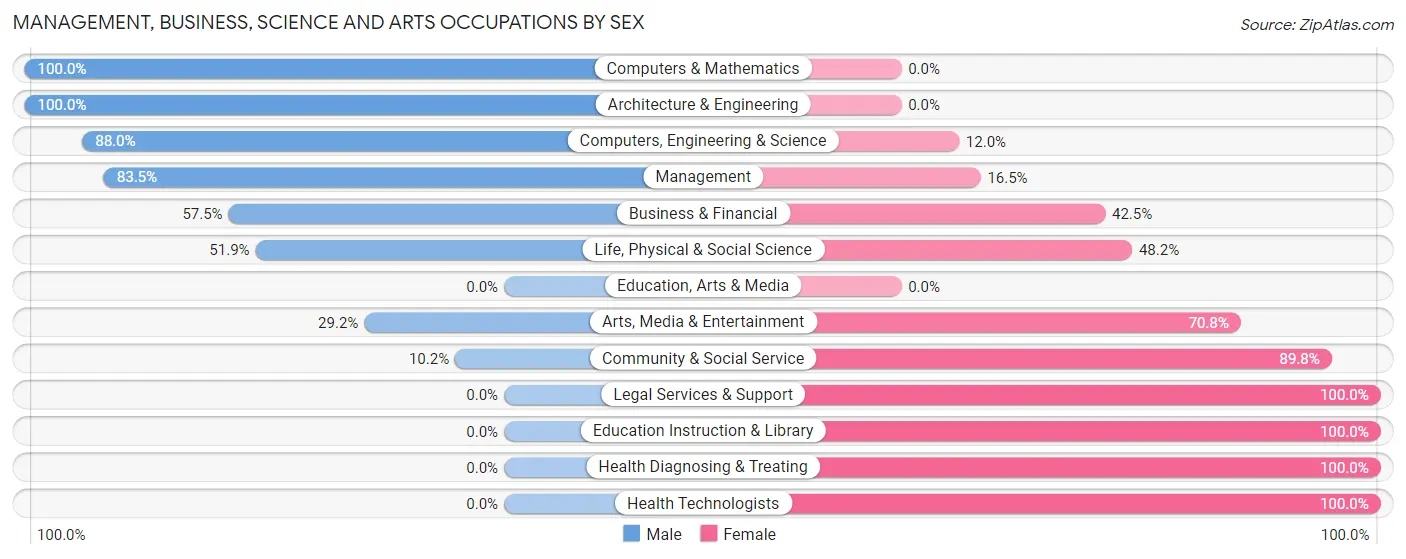
| Occupation | Male | Female |
| Management | 111 (83.5%) | 22 (16.5%) |
| Business & Financial | 73 (57.5%) | 54 (42.5%) |
| Computers, Engineering & Science | 95 (88.0%) | 13 (12.0%) |
| Computers & Mathematics | 33 (100.0%) | 0 (0.0%) |
| Architecture & Engineering | 48 (100.0%) | 0 (0.0%) |
| Life, Physical & Social Science | 14 (51.8%) | 13 (48.1%) |
| Community & Social Service | 14 (10.2%) | 123 (89.8%) |
| Education, Arts & Media | 0 (0.0%) | 0 (0.0%) |
| Legal Services & Support | 0 (0.0%) | 48 (100.0%) |
| Education Instruction & Library | 0 (0.0%) | 41 (100.0%) |
| Arts, Media & Entertainment | 14 (29.2%) | 34 (70.8%) |
| Health Diagnosing & Treating | 0 (0.0%) | 43 (100.0%) |
| Health Technologists | 0 (0.0%) | 43 (100.0%) |
| Total (Category) | 293 (53.5%) | 255 (46.5%) |
| Total (Overall) | 560 (54.9%) | 460 (45.1%) |
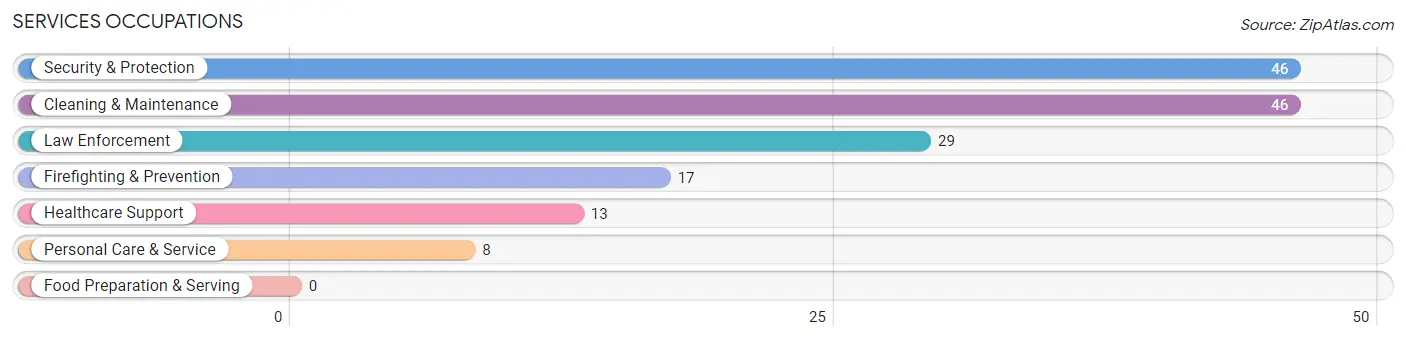
Services Occupations
The most common Services occupations in Hansville are Security & Protection (46 | 4.5%), Cleaning & Maintenance (46 | 4.5%), Law Enforcement (29 | 2.8%), Firefighting & Prevention (17 | 1.7%), and Healthcare Support (13 | 1.3%).
Services Occupations by Sex
Within the Services occupations in Hansville, the most male-oriented occupations are Healthcare Support (100.0%), Cleaning & Maintenance (100.0%), and Personal Care & Service (100.0%), while the most female-oriented occupations are Firefighting & Prevention (100.0%), Security & Protection (58.7%), and Law Enforcement (34.5%).
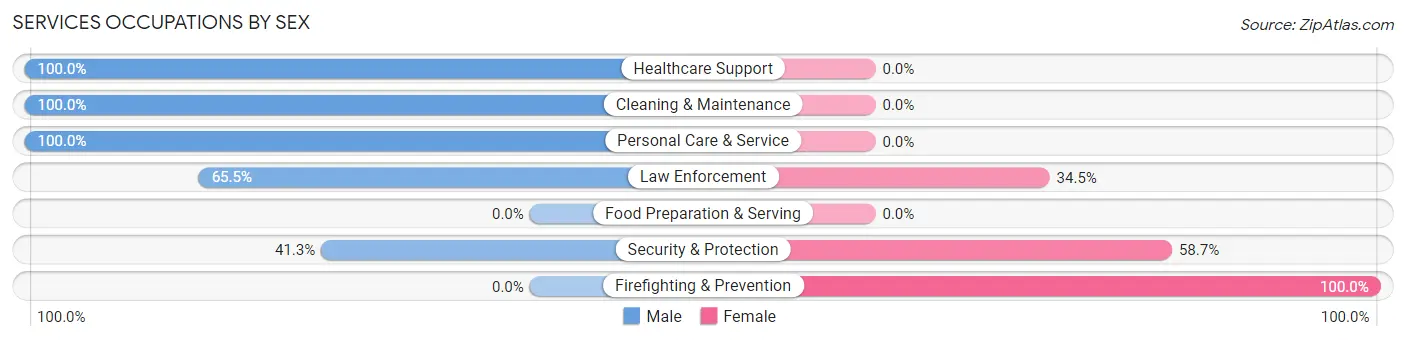
| Occupation | Male | Female |
| Healthcare Support | 13 (100.0%) | 0 (0.0%) |
| Security & Protection | 19 (41.3%) | 27 (58.7%) |
| Firefighting & Prevention | 0 (0.0%) | 17 (100.0%) |
| Law Enforcement | 19 (65.5%) | 10 (34.5%) |
| Food Preparation & Serving | 0 (0.0%) | 0 (0.0%) |
| Cleaning & Maintenance | 46 (100.0%) | 0 (0.0%) |
| Personal Care & Service | 8 (100.0%) | 0 (0.0%) |
| Total (Category) | 86 (76.1%) | 27 (23.9%) |
| Total (Overall) | 560 (54.9%) | 460 (45.1%) |
Sales and Office Occupations
The most common Sales and Office occupations in Hansville are Office & Administration (74 | 7.2%), and Sales & Related (49 | 4.8%).

Sales and Office Occupations by Sex

| Occupation | Male | Female |
| Sales & Related | 34 (69.4%) | 15 (30.6%) |
| Office & Administration | 0 (0.0%) | 74 (100.0%) |
| Total (Category) | 34 (27.6%) | 89 (72.4%) |
| Total (Overall) | 560 (54.9%) | 460 (45.1%) |
Natural Resources, Construction and Maintenance Occupations
The most common Natural Resources, Construction and Maintenance occupations in Hansville are Construction & Extraction (67 | 6.6%), and Installation, Maintenance & Repair (57 | 5.6%).

Natural Resources, Construction and Maintenance Occupations by Sex

| Occupation | Male | Female |
| Farming, Fishing & Forestry | 0 (0.0%) | 0 (0.0%) |
| Construction & Extraction | 59 (88.1%) | 8 (11.9%) |
| Installation, Maintenance & Repair | 57 (100.0%) | 0 (0.0%) |
| Total (Category) | 116 (93.5%) | 8 (6.5%) |
| Total (Overall) | 560 (54.9%) | 460 (45.1%) |
Production, Transportation and Moving Occupations
The most common Production, Transportation and Moving occupations in Hansville are Production (87 | 8.5%), and Transportation (25 | 2.5%).
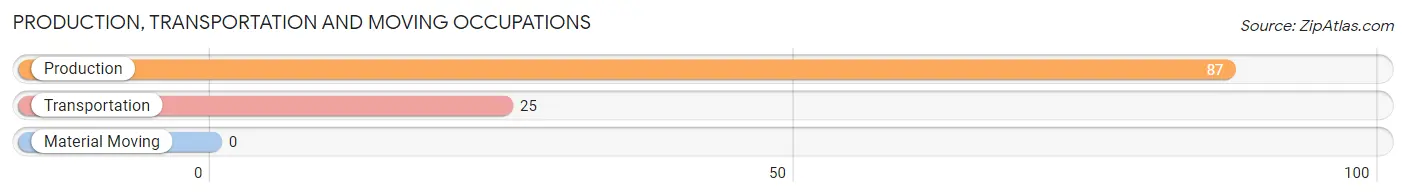
Production, Transportation and Moving Occupations by Sex

| Occupation | Male | Female |
| Production | 31 (35.6%) | 56 (64.4%) |
| Transportation | 0 (0.0%) | 25 (100.0%) |
| Material Moving | 0 (0.0%) | 0 (0.0%) |
| Total (Category) | 31 (27.7%) | 81 (72.3%) |
| Total (Overall) | 560 (54.9%) | 460 (45.1%) |
Employment Industries by Sex in Hansville
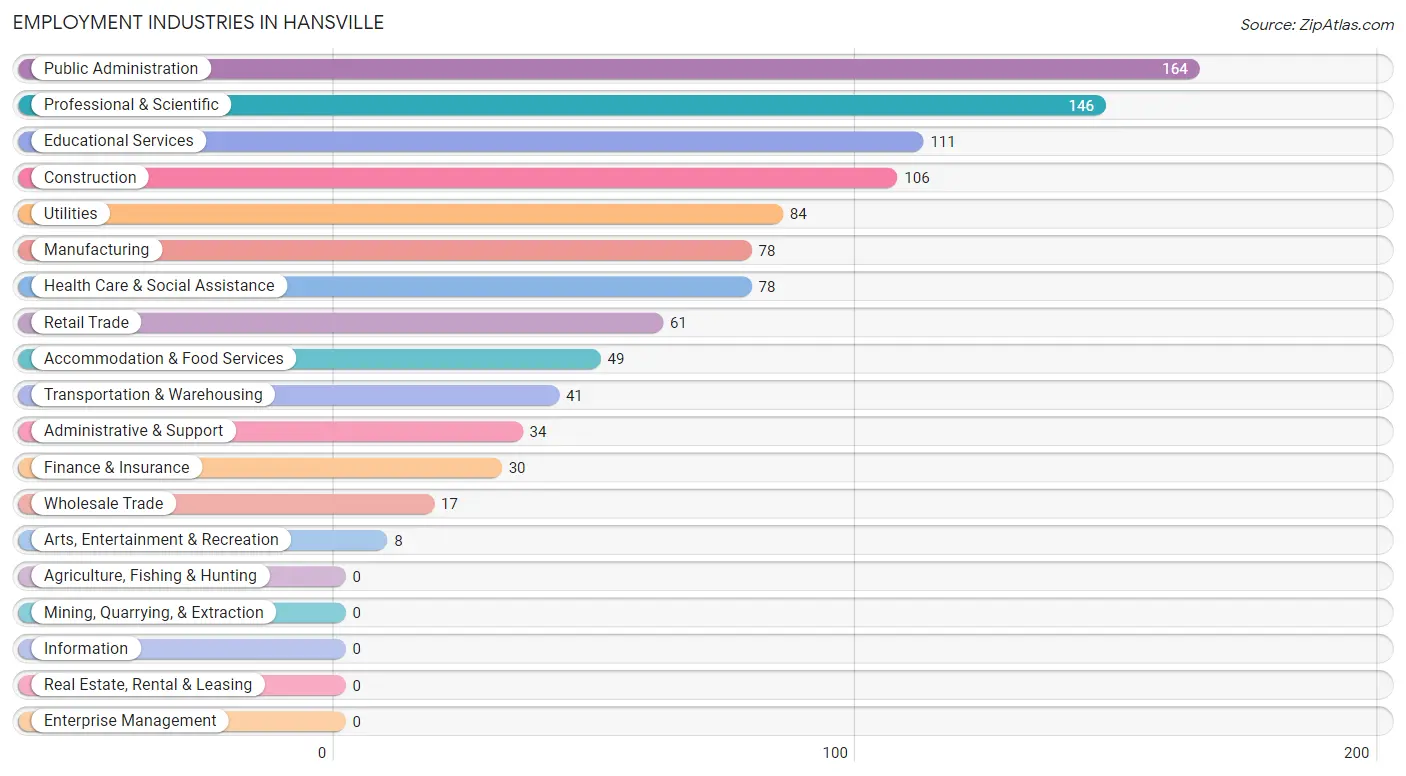
Employment Industries in Hansville
The major employment industries in Hansville include Public Administration (164 | 16.1%), Professional & Scientific (146 | 14.3%), Educational Services (111 | 10.9%), Construction (106 | 10.4%), and Utilities (84 | 8.2%).
Employment Industries by Sex in Hansville
The Hansville industries that see more men than women are Wholesale Trade (100.0%), Utilities (100.0%), and Arts, Entertainment & Recreation (100.0%), whereas the industries that tend to have a higher number of women are Transportation & Warehousing (100.0%), Administrative & Support (100.0%), and Accommodation & Food Services (100.0%).
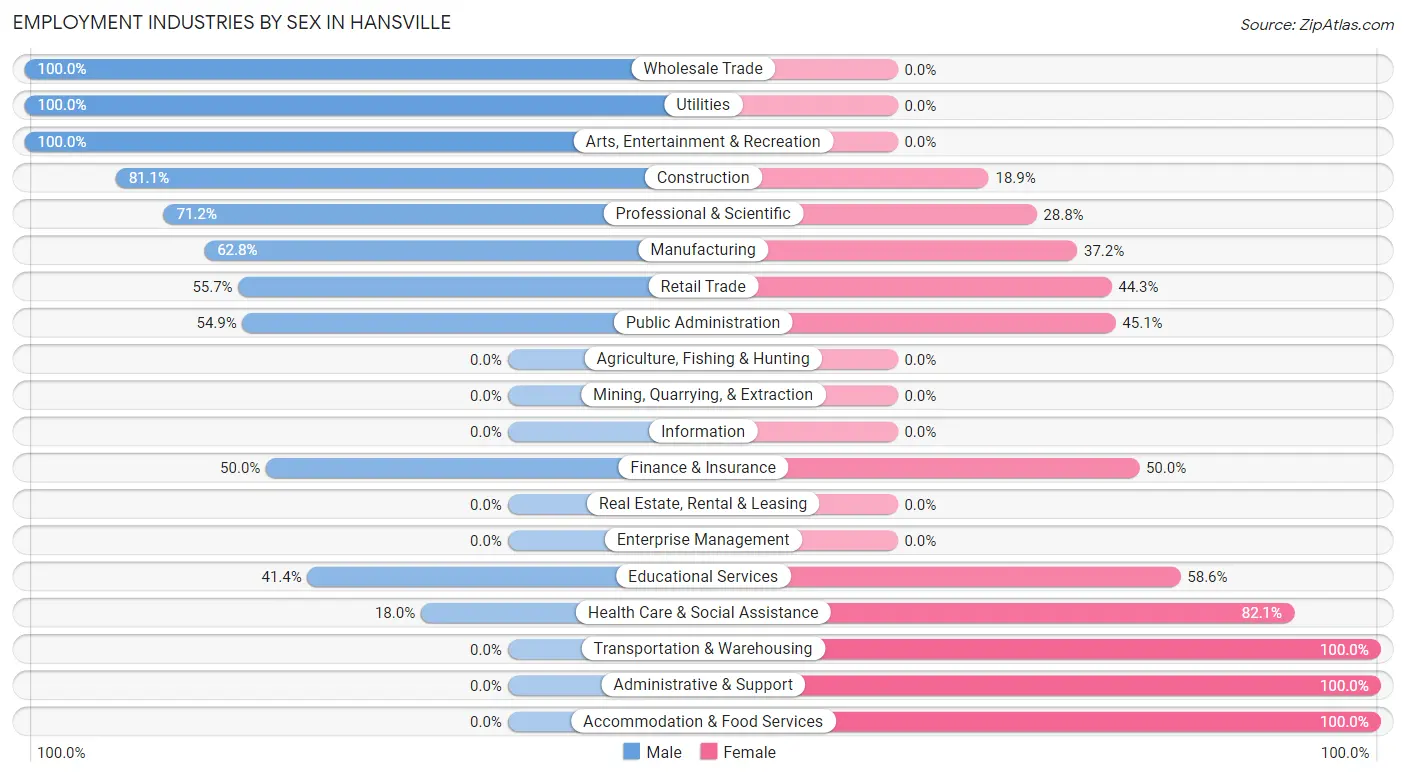
| Industry | Male | Female |
| Agriculture, Fishing & Hunting | 0 (0.0%) | 0 (0.0%) |
| Mining, Quarrying, & Extraction | 0 (0.0%) | 0 (0.0%) |
| Construction | 86 (81.1%) | 20 (18.9%) |
| Manufacturing | 49 (62.8%) | 29 (37.2%) |
| Wholesale Trade | 17 (100.0%) | 0 (0.0%) |
| Retail Trade | 34 (55.7%) | 27 (44.3%) |
| Transportation & Warehousing | 0 (0.0%) | 41 (100.0%) |
| Utilities | 84 (100.0%) | 0 (0.0%) |
| Information | 0 (0.0%) | 0 (0.0%) |
| Finance & Insurance | 15 (50.0%) | 15 (50.0%) |
| Real Estate, Rental & Leasing | 0 (0.0%) | 0 (0.0%) |
| Professional & Scientific | 104 (71.2%) | 42 (28.8%) |
| Enterprise Management | 0 (0.0%) | 0 (0.0%) |
| Administrative & Support | 0 (0.0%) | 34 (100.0%) |
| Educational Services | 46 (41.4%) | 65 (58.6%) |
| Health Care & Social Assistance | 14 (17.9%) | 64 (82.1%) |
| Arts, Entertainment & Recreation | 8 (100.0%) | 0 (0.0%) |
| Accommodation & Food Services | 0 (0.0%) | 49 (100.0%) |
| Public Administration | 90 (54.9%) | 74 (45.1%) |
| Total | 560 (54.9%) | 460 (45.1%) |
Education in Hansville
School Enrollment in Hansville
The most common levels of schooling among the 294 students in Hansville are high school (124 | 42.2%), middle school (48 | 16.3%), and college / undergraduate (47 | 16.0%).
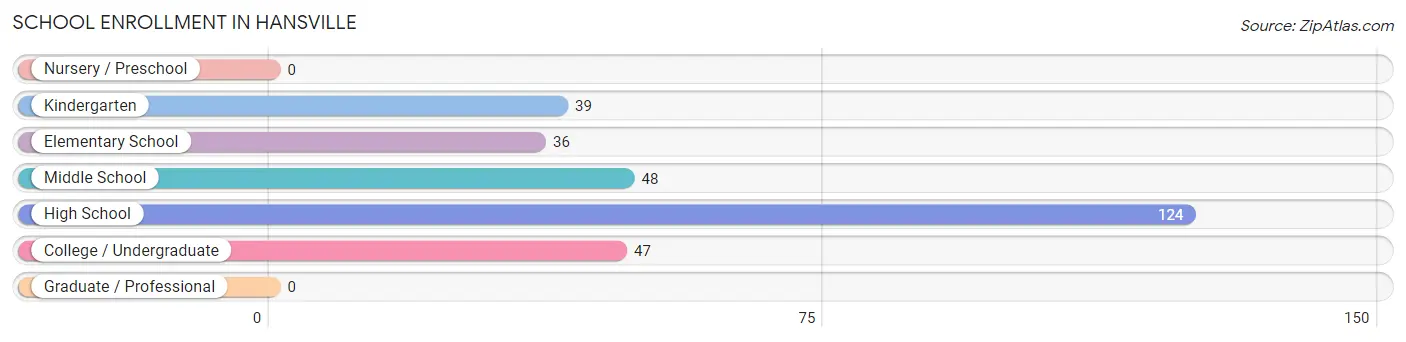
| School Level | # Students | % Students |
| Nursery / Preschool | 0 | 0.0% |
| Kindergarten | 39 | 13.3% |
| Elementary School | 36 | 12.2% |
| Middle School | 48 | 16.3% |
| High School | 124 | 42.2% |
| College / Undergraduate | 47 | 16.0% |
| Graduate / Professional | 0 | 0.0% |
| Total | 294 | 100.0% |
School Enrollment by Age by Funding Source in Hansville
Out of a total of 294 students who are enrolled in schools in Hansville, 38 (12.9%) attend a private institution, while the remaining 256 (87.1%) are enrolled in public schools. The age group of 20 to 24 year olds has the highest likelihood of being enrolled in private schools, with 21 (100.0% in the age bracket) enrolled. Conversely, the age group of 5 to 9 year old has the lowest likelihood of being enrolled in a private school, with 58 (100.0% in the age bracket) attending a public institution.
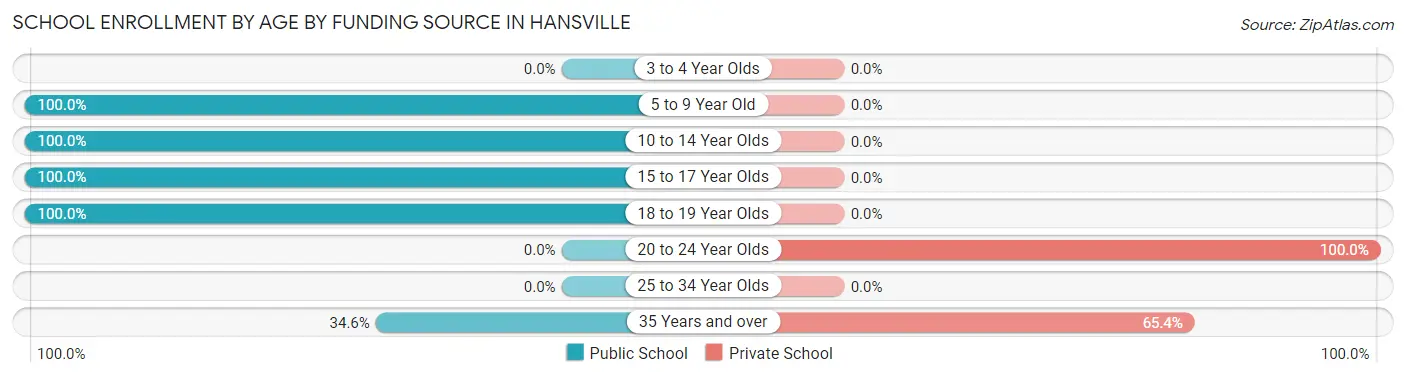
| Age Bracket | Public School | Private School |
| 3 to 4 Year Olds | 0 (0.0%) | 0 (0.0%) |
| 5 to 9 Year Old | 58 (100.0%) | 0 (0.0%) |
| 10 to 14 Year Olds | 90 (100.0%) | 0 (0.0%) |
| 15 to 17 Year Olds | 87 (100.0%) | 0 (0.0%) |
| 18 to 19 Year Olds | 12 (100.0%) | 0 (0.0%) |
| 20 to 24 Year Olds | 0 (0.0%) | 21 (100.0%) |
| 25 to 34 Year Olds | 0 (0.0%) | 0 (0.0%) |
| 35 Years and over | 9 (34.6%) | 17 (65.4%) |
| Total | 256 (87.1%) | 38 (12.9%) |
Educational Attainment by Field of Study in Hansville
Education (417 | 28.7%), arts & humanities (162 | 11.2%), physical & health sciences (146 | 10.1%), computers & mathematics (132 | 9.1%), and engineering (117 | 8.1%) are the most common fields of study among 1,453 individuals in Hansville who have obtained a bachelor's degree or higher.
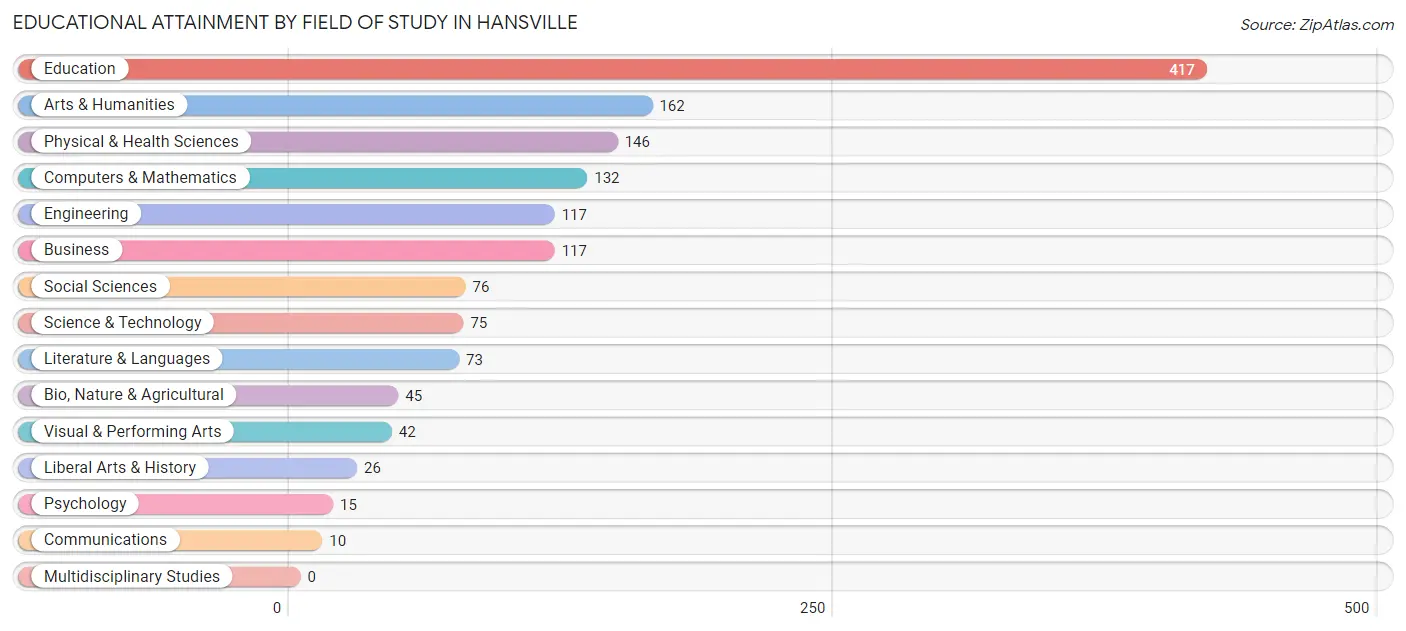
| Field of Study | # Graduates | % Graduates |
| Computers & Mathematics | 132 | 9.1% |
| Bio, Nature & Agricultural | 45 | 3.1% |
| Physical & Health Sciences | 146 | 10.1% |
| Psychology | 15 | 1.0% |
| Social Sciences | 76 | 5.2% |
| Engineering | 117 | 8.1% |
| Multidisciplinary Studies | 0 | 0.0% |
| Science & Technology | 75 | 5.2% |
| Business | 117 | 8.1% |
| Education | 417 | 28.7% |
| Literature & Languages | 73 | 5.0% |
| Liberal Arts & History | 26 | 1.8% |
| Visual & Performing Arts | 42 | 2.9% |
| Communications | 10 | 0.7% |
| Arts & Humanities | 162 | 11.2% |
| Total | 1,453 | 100.0% |
Transportation & Commute in Hansville
Vehicle Availability by Sex in Hansville
The most prevalent vehicle ownership categories in Hansville are males with 3 vehicles (200, accounting for 38.7%) and females with 3 vehicles (142, making up 45.9%).
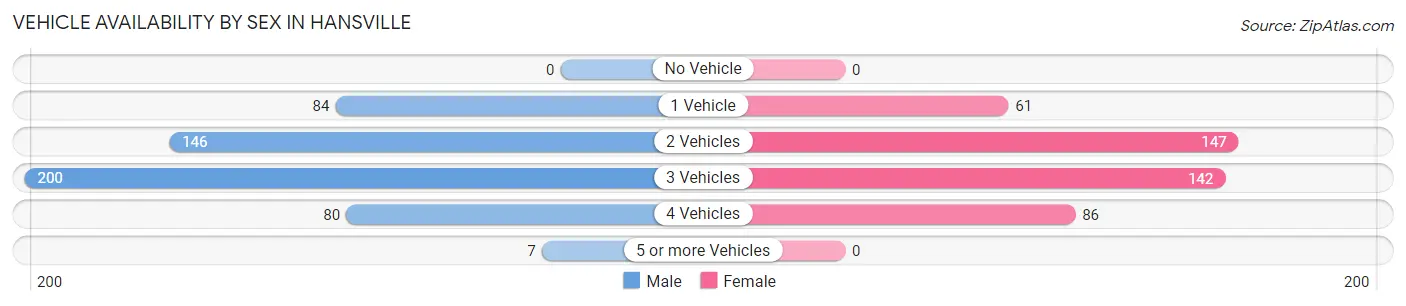
| Vehicles Available | Male | Female |
| No Vehicle | 0 (0.0%) | 0 (0.0%) |
| 1 Vehicle | 84 (16.3%) | 61 (14.0%) |
| 2 Vehicles | 146 (28.2%) | 147 (33.7%) |
| 3 Vehicles | 200 (38.7%) | 142 (32.6%) |
| 4 Vehicles | 80 (15.5%) | 86 (19.7%) |
| 5 or more Vehicles | 7 (1.3%) | 0 (0.0%) |
| Total | 517 (100.0%) | 436 (100.0%) |
Commute Time in Hansville
The most frequently occuring commute durations in Hansville are 15 to 19 minutes (153 commuters, 18.1%), 90 or more minutes (134 commuters, 15.9%), and 30 to 34 minutes (123 commuters, 14.6%).
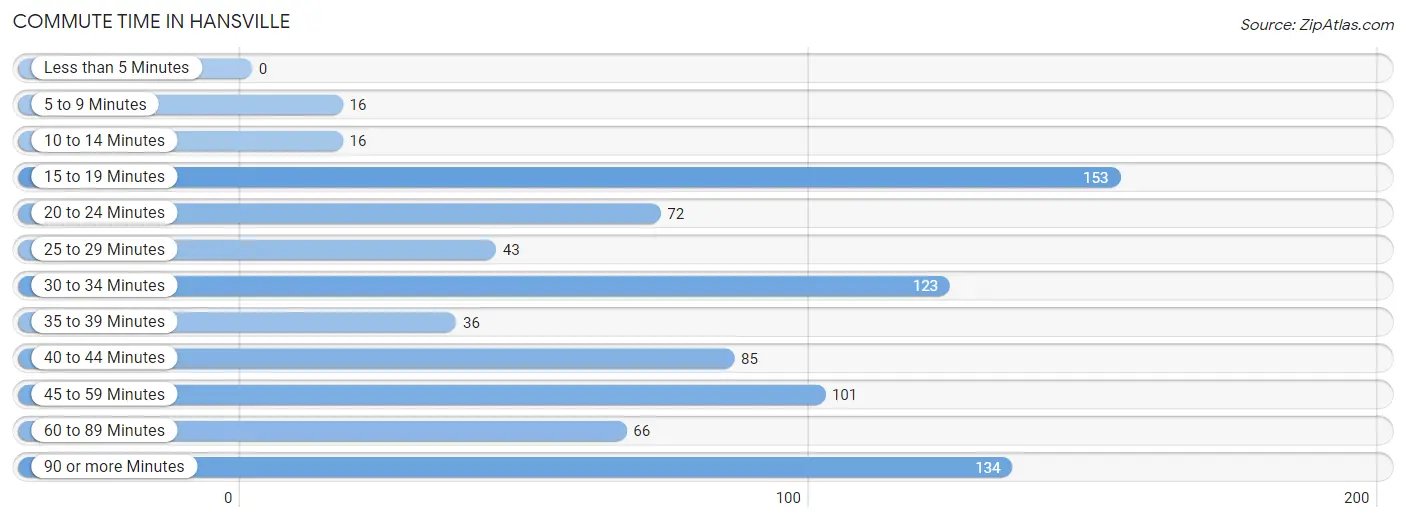
| Commute Time | # Commuters | % Commuters |
| Less than 5 Minutes | 0 | 0.0% |
| 5 to 9 Minutes | 16 | 1.9% |
| 10 to 14 Minutes | 16 | 1.9% |
| 15 to 19 Minutes | 153 | 18.1% |
| 20 to 24 Minutes | 72 | 8.5% |
| 25 to 29 Minutes | 43 | 5.1% |
| 30 to 34 Minutes | 123 | 14.6% |
| 35 to 39 Minutes | 36 | 4.3% |
| 40 to 44 Minutes | 85 | 10.1% |
| 45 to 59 Minutes | 101 | 11.9% |
| 60 to 89 Minutes | 66 | 7.8% |
| 90 or more Minutes | 134 | 15.9% |
Commute Time by Sex in Hansville
The most common commute times in Hansville are 90 or more minutes (108 commuters, 23.2%) for males and 45 to 59 minutes (88 commuters, 23.2%) for females.
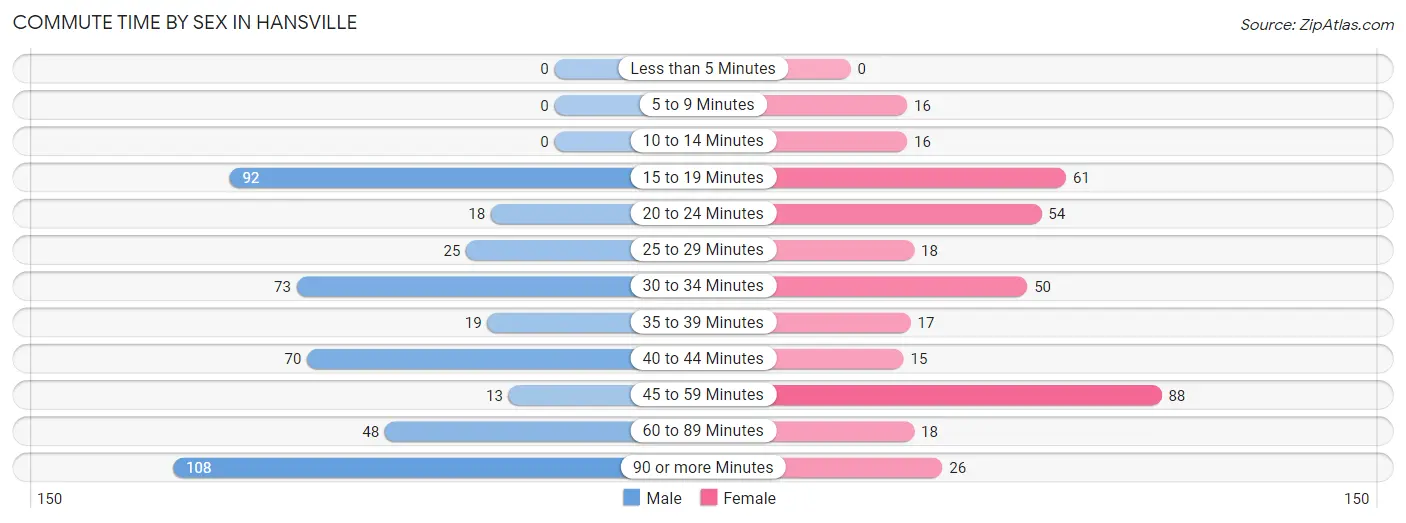
| Commute Time | Male | Female |
| Less than 5 Minutes | 0 (0.0%) | 0 (0.0%) |
| 5 to 9 Minutes | 0 (0.0%) | 16 (4.2%) |
| 10 to 14 Minutes | 0 (0.0%) | 16 (4.2%) |
| 15 to 19 Minutes | 92 (19.7%) | 61 (16.1%) |
| 20 to 24 Minutes | 18 (3.9%) | 54 (14.2%) |
| 25 to 29 Minutes | 25 (5.4%) | 18 (4.8%) |
| 30 to 34 Minutes | 73 (15.7%) | 50 (13.2%) |
| 35 to 39 Minutes | 19 (4.1%) | 17 (4.5%) |
| 40 to 44 Minutes | 70 (15.0%) | 15 (4.0%) |
| 45 to 59 Minutes | 13 (2.8%) | 88 (23.2%) |
| 60 to 89 Minutes | 48 (10.3%) | 18 (4.8%) |
| 90 or more Minutes | 108 (23.2%) | 26 (6.9%) |
Time of Departure to Work by Sex in Hansville
The most frequent times of departure to work in Hansville are 6:00 AM to 6:29 AM (96, 20.6%) for males and 6:30 AM to 6:59 AM (71, 18.7%) for females.
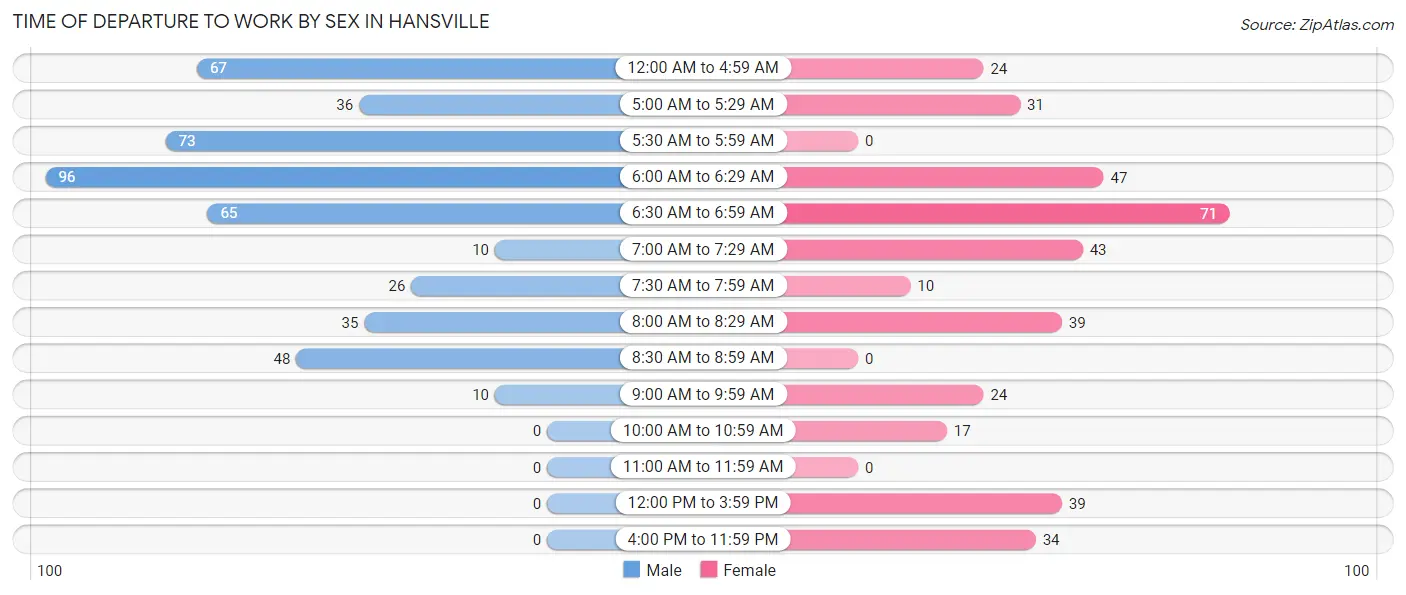
| Time of Departure | Male | Female |
| 12:00 AM to 4:59 AM | 67 (14.4%) | 24 (6.3%) |
| 5:00 AM to 5:29 AM | 36 (7.7%) | 31 (8.2%) |
| 5:30 AM to 5:59 AM | 73 (15.7%) | 0 (0.0%) |
| 6:00 AM to 6:29 AM | 96 (20.6%) | 47 (12.4%) |
| 6:30 AM to 6:59 AM | 65 (14.0%) | 71 (18.7%) |
| 7:00 AM to 7:29 AM | 10 (2.1%) | 43 (11.4%) |
| 7:30 AM to 7:59 AM | 26 (5.6%) | 10 (2.6%) |
| 8:00 AM to 8:29 AM | 35 (7.5%) | 39 (10.3%) |
| 8:30 AM to 8:59 AM | 48 (10.3%) | 0 (0.0%) |
| 9:00 AM to 9:59 AM | 10 (2.1%) | 24 (6.3%) |
| 10:00 AM to 10:59 AM | 0 (0.0%) | 17 (4.5%) |
| 11:00 AM to 11:59 AM | 0 (0.0%) | 0 (0.0%) |
| 12:00 PM to 3:59 PM | 0 (0.0%) | 39 (10.3%) |
| 4:00 PM to 11:59 PM | 0 (0.0%) | 34 (9.0%) |
| Total | 466 (100.0%) | 379 (100.0%) |
Housing Occupancy in Hansville
Occupancy by Ownership in Hansville
Of the total 1,616 dwellings in Hansville, owner-occupied units account for 1,455 (90.0%), while renter-occupied units make up 161 (10.0%).
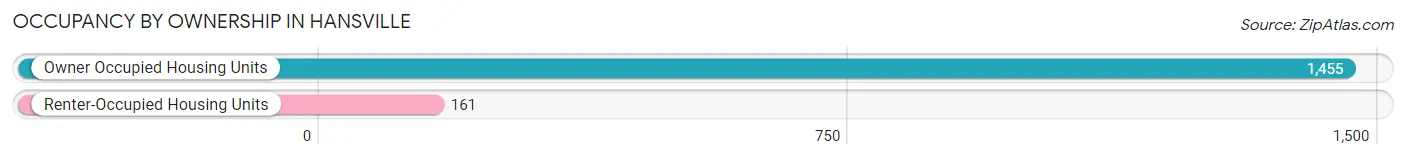
| Occupancy | # Housing Units | % Housing Units |
| Owner Occupied Housing Units | 1,455 | 90.0% |
| Renter-Occupied Housing Units | 161 | 10.0% |
| Total Occupied Housing Units | 1,616 | 100.0% |
Occupancy by Household Size in Hansville
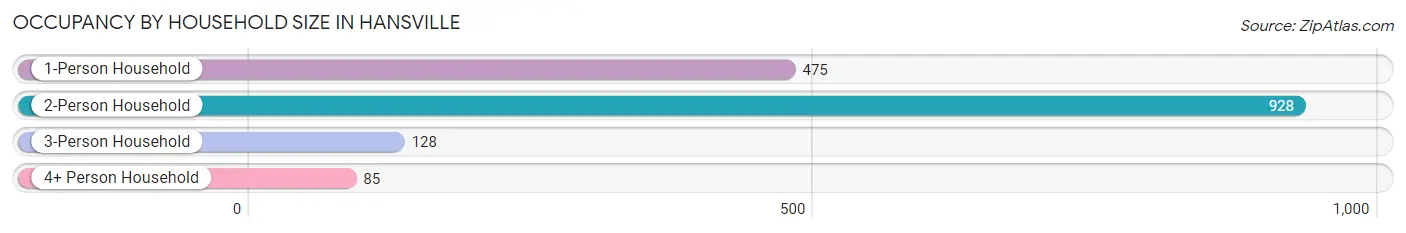
| Household Size | # Housing Units | % Housing Units |
| 1-Person Household | 475 | 29.4% |
| 2-Person Household | 928 | 57.4% |
| 3-Person Household | 128 | 7.9% |
| 4+ Person Household | 85 | 5.3% |
| Total Housing Units | 1,616 | 100.0% |
Occupancy by Ownership by Household Size in Hansville
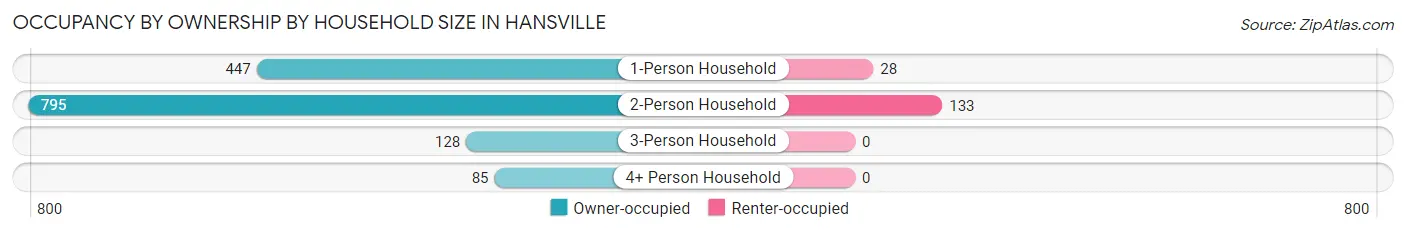
| Household Size | Owner-occupied | Renter-occupied |
| 1-Person Household | 447 (94.1%) | 28 (5.9%) |
| 2-Person Household | 795 (85.7%) | 133 (14.3%) |
| 3-Person Household | 128 (100.0%) | 0 (0.0%) |
| 4+ Person Household | 85 (100.0%) | 0 (0.0%) |
| Total Housing Units | 1,455 (90.0%) | 161 (10.0%) |
Occupancy by Educational Attainment in Hansville
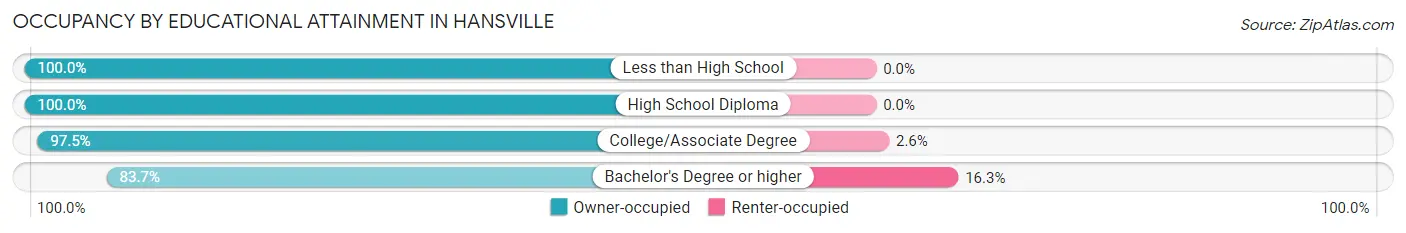
| Household Size | Owner-occupied | Renter-occupied |
| Less than High School | 8 (100.0%) | 0 (0.0%) |
| High School Diploma | 222 (100.0%) | 0 (0.0%) |
| College/Associate Degree | 458 (97.5%) | 12 (2.5%) |
| Bachelor's Degree or higher | 767 (83.7%) | 149 (16.3%) |
Occupancy by Age of Householder in Hansville
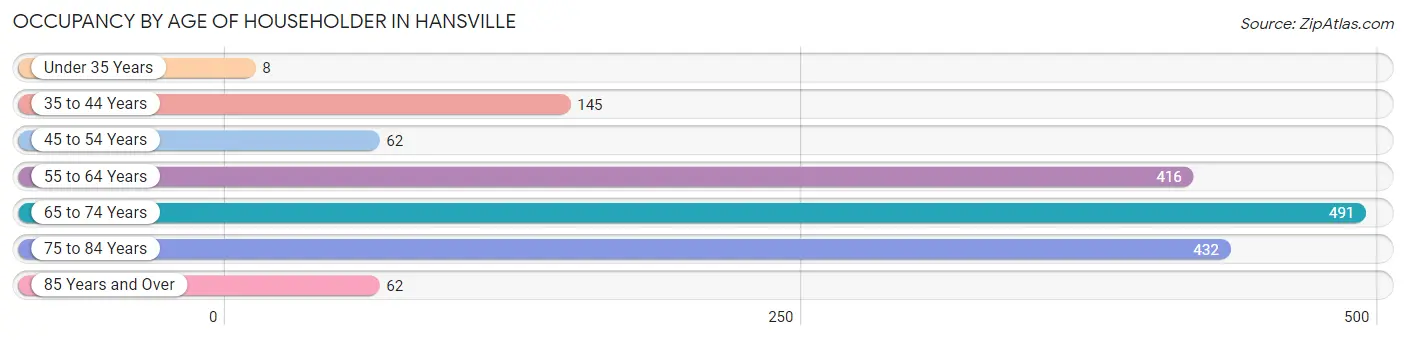
| Age Bracket | # Households | % Households |
| Under 35 Years | 8 | 0.5% |
| 35 to 44 Years | 145 | 9.0% |
| 45 to 54 Years | 62 | 3.8% |
| 55 to 64 Years | 416 | 25.7% |
| 65 to 74 Years | 491 | 30.4% |
| 75 to 84 Years | 432 | 26.7% |
| 85 Years and Over | 62 | 3.8% |
| Total | 1,616 | 100.0% |
Housing Finances in Hansville
Median Income by Occupancy in Hansville
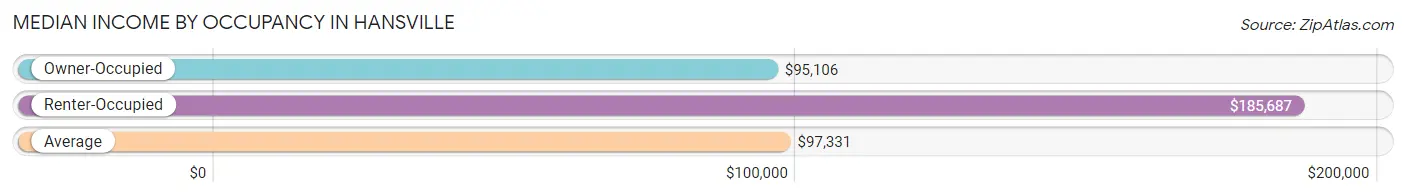
| Occupancy Type | # Households | Median Income |
| Owner-Occupied | 1,455 (90.0%) | $95,106 |
| Renter-Occupied | 161 (10.0%) | $185,687 |
| Average | 1,616 (100.0%) | $97,331 |
Occupancy by Householder Income Bracket in Hansville
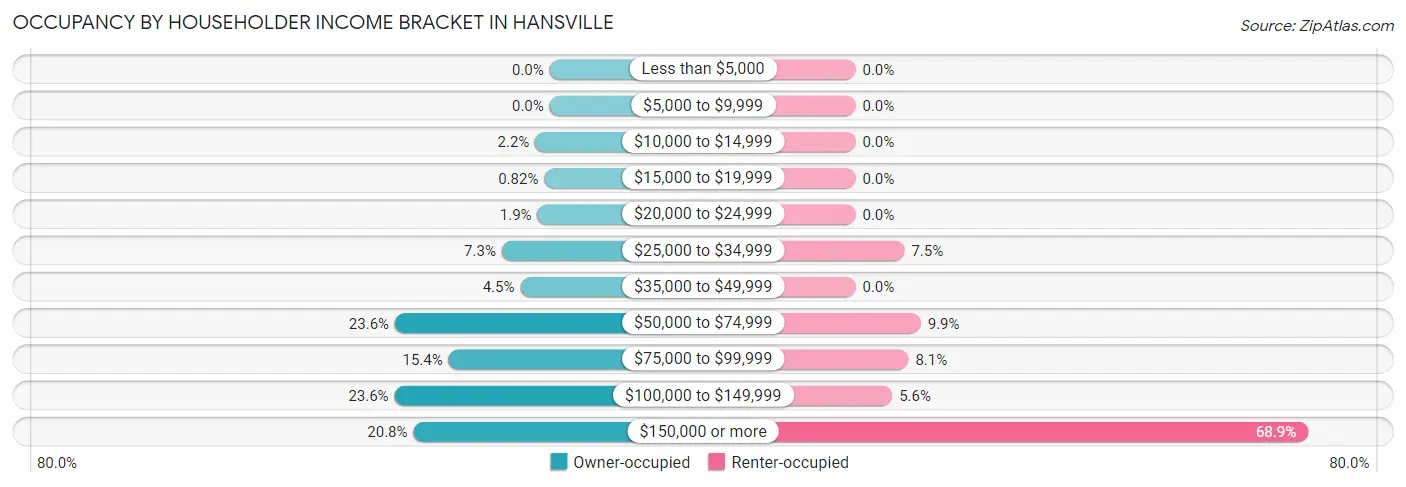
| Income Bracket | Owner-occupied | Renter-occupied |
| Less than $5,000 | 0 (0.0%) | 0 (0.0%) |
| $5,000 to $9,999 | 0 (0.0%) | 0 (0.0%) |
| $10,000 to $14,999 | 32 (2.2%) | 0 (0.0%) |
| $15,000 to $19,999 | 12 (0.8%) | 0 (0.0%) |
| $20,000 to $24,999 | 27 (1.9%) | 0 (0.0%) |
| $25,000 to $34,999 | 106 (7.3%) | 12 (7.4%) |
| $35,000 to $49,999 | 65 (4.5%) | 0 (0.0%) |
| $50,000 to $74,999 | 343 (23.6%) | 16 (9.9%) |
| $75,000 to $99,999 | 224 (15.4%) | 13 (8.1%) |
| $100,000 to $149,999 | 344 (23.6%) | 9 (5.6%) |
| $150,000 or more | 302 (20.8%) | 111 (68.9%) |
| Total | 1,455 (100.0%) | 161 (100.0%) |
Monthly Housing Cost Tiers in Hansville
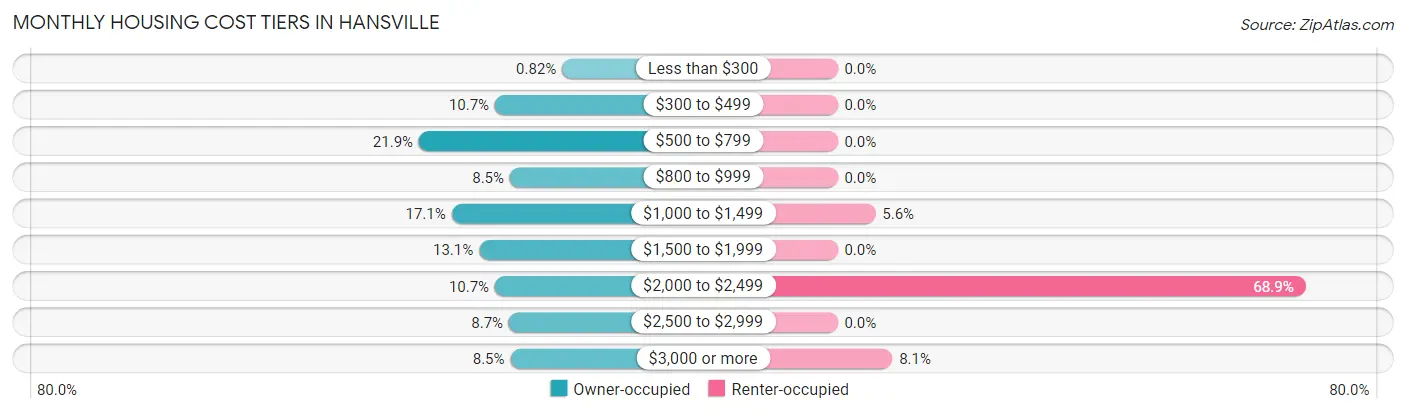
| Monthly Cost | Owner-occupied | Renter-occupied |
| Less than $300 | 12 (0.8%) | 0 (0.0%) |
| $300 to $499 | 156 (10.7%) | 0 (0.0%) |
| $500 to $799 | 319 (21.9%) | 0 (0.0%) |
| $800 to $999 | 124 (8.5%) | 0 (0.0%) |
| $1,000 to $1,499 | 249 (17.1%) | 9 (5.6%) |
| $1,500 to $1,999 | 190 (13.1%) | 0 (0.0%) |
| $2,000 to $2,499 | 156 (10.7%) | 111 (68.9%) |
| $2,500 to $2,999 | 126 (8.7%) | 0 (0.0%) |
| $3,000 or more | 123 (8.5%) | 13 (8.1%) |
| Total | 1,455 (100.0%) | 161 (100.0%) |
Physical Housing Characteristics in Hansville
Housing Structures in Hansville
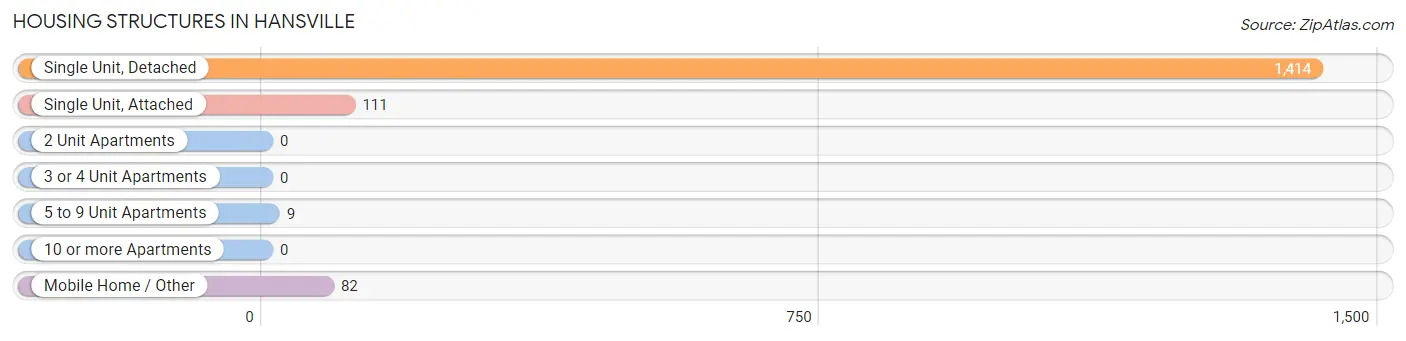
| Structure Type | # Housing Units | % Housing Units |
| Single Unit, Detached | 1,414 | 87.5% |
| Single Unit, Attached | 111 | 6.9% |
| 2 Unit Apartments | 0 | 0.0% |
| 3 or 4 Unit Apartments | 0 | 0.0% |
| 5 to 9 Unit Apartments | 9 | 0.6% |
| 10 or more Apartments | 0 | 0.0% |
| Mobile Home / Other | 82 | 5.1% |
| Total | 1,616 | 100.0% |
Housing Structures by Occupancy in Hansville
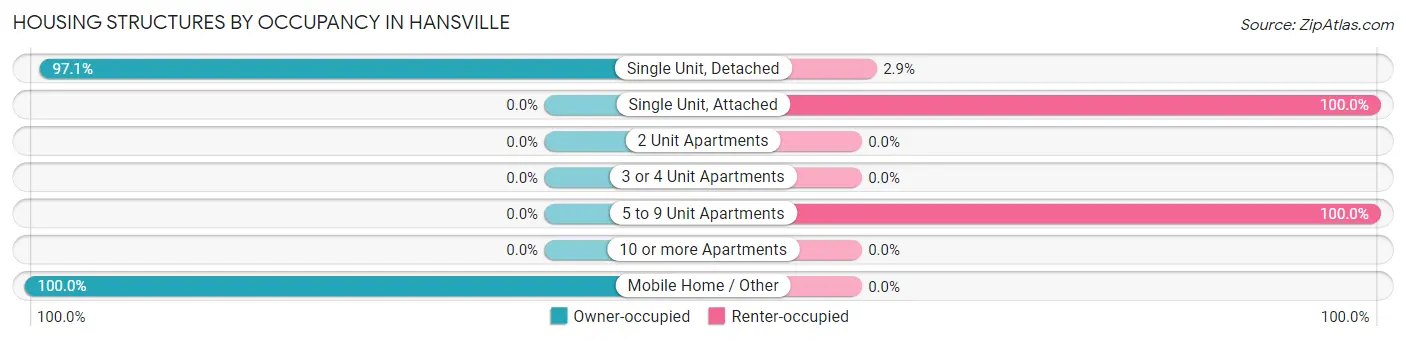
| Structure Type | Owner-occupied | Renter-occupied |
| Single Unit, Detached | 1,373 (97.1%) | 41 (2.9%) |
| Single Unit, Attached | 0 (0.0%) | 111 (100.0%) |
| 2 Unit Apartments | 0 (0.0%) | 0 (0.0%) |
| 3 or 4 Unit Apartments | 0 (0.0%) | 0 (0.0%) |
| 5 to 9 Unit Apartments | 0 (0.0%) | 9 (100.0%) |
| 10 or more Apartments | 0 (0.0%) | 0 (0.0%) |
| Mobile Home / Other | 82 (100.0%) | 0 (0.0%) |
| Total | 1,455 (90.0%) | 161 (10.0%) |
Housing Structures by Number of Rooms in Hansville
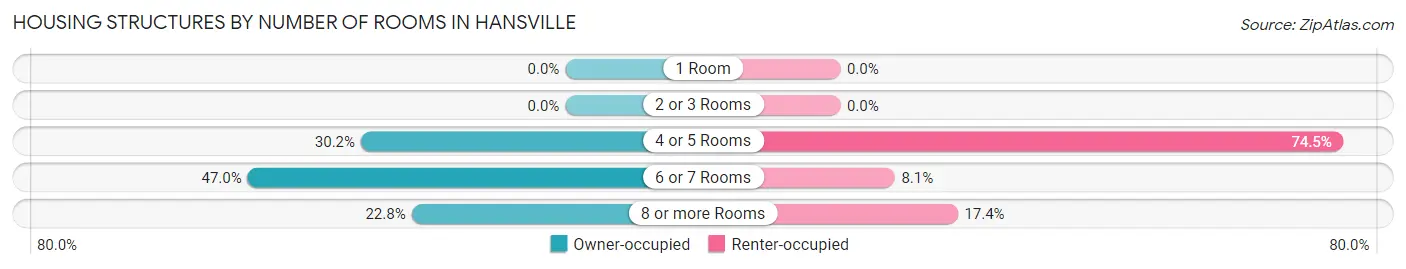
| Number of Rooms | Owner-occupied | Renter-occupied |
| 1 Room | 0 (0.0%) | 0 (0.0%) |
| 2 or 3 Rooms | 0 (0.0%) | 0 (0.0%) |
| 4 or 5 Rooms | 440 (30.2%) | 120 (74.5%) |
| 6 or 7 Rooms | 684 (47.0%) | 13 (8.1%) |
| 8 or more Rooms | 331 (22.8%) | 28 (17.4%) |
| Total | 1,455 (100.0%) | 161 (100.0%) |
Housing Structure by Heating Type in Hansville
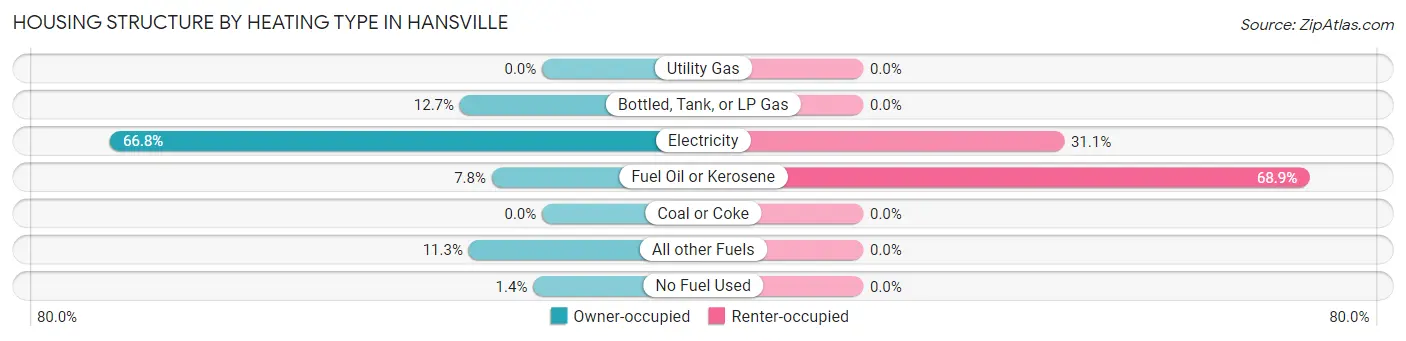
| Heating Type | Owner-occupied | Renter-occupied |
| Utility Gas | 0 (0.0%) | 0 (0.0%) |
| Bottled, Tank, or LP Gas | 185 (12.7%) | 0 (0.0%) |
| Electricity | 972 (66.8%) | 50 (31.1%) |
| Fuel Oil or Kerosene | 113 (7.8%) | 111 (68.9%) |
| Coal or Coke | 0 (0.0%) | 0 (0.0%) |
| All other Fuels | 165 (11.3%) | 0 (0.0%) |
| No Fuel Used | 20 (1.4%) | 0 (0.0%) |
| Total | 1,455 (100.0%) | 161 (100.0%) |
Household Vehicle Usage in Hansville
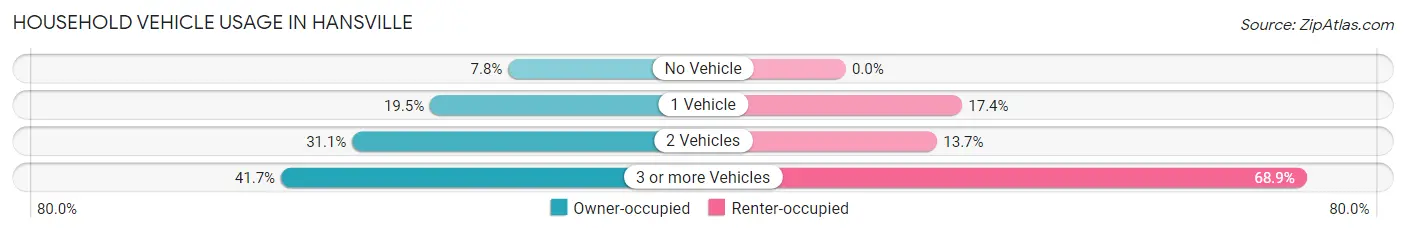
| Vehicles per Household | Owner-occupied | Renter-occupied |
| No Vehicle | 113 (7.8%) | 0 (0.0%) |
| 1 Vehicle | 283 (19.5%) | 28 (17.4%) |
| 2 Vehicles | 452 (31.1%) | 22 (13.7%) |
| 3 or more Vehicles | 607 (41.7%) | 111 (68.9%) |
| Total | 1,455 (100.0%) | 161 (100.0%) |
Real Estate & Mortgages in Hansville
Real Estate and Mortgage Overview in Hansville
| Characteristic | Without Mortgage | With Mortgage |
| Housing Units | 625 | 830 |
| Median Property Value | $510,800 | $432,800 |
| Median Household Income | $95,694 | $195 |
| Monthly Housing Costs | $592 | $123 |
| Real Estate Taxes | $2,905 | $0 |
Property Value by Mortgage Status in Hansville
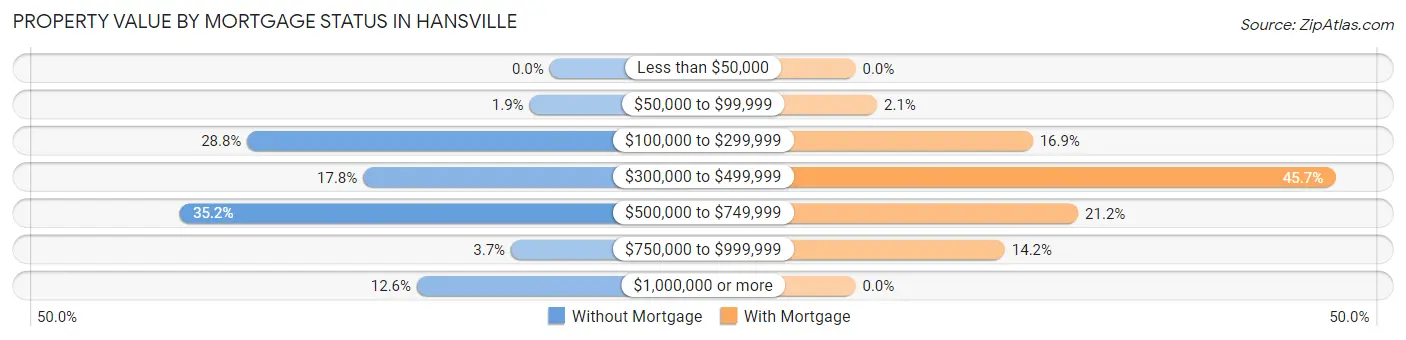
| Property Value | Without Mortgage | With Mortgage |
| Less than $50,000 | 0 (0.0%) | 0 (0.0%) |
| $50,000 to $99,999 | 12 (1.9%) | 17 (2.1%) |
| $100,000 to $299,999 | 180 (28.8%) | 140 (16.9%) |
| $300,000 to $499,999 | 111 (17.8%) | 379 (45.7%) |
| $500,000 to $749,999 | 220 (35.2%) | 176 (21.2%) |
| $750,000 to $999,999 | 23 (3.7%) | 118 (14.2%) |
| $1,000,000 or more | 79 (12.6%) | 0 (0.0%) |
| Total | 625 (100.0%) | 830 (100.0%) |
Household Income by Mortgage Status in Hansville
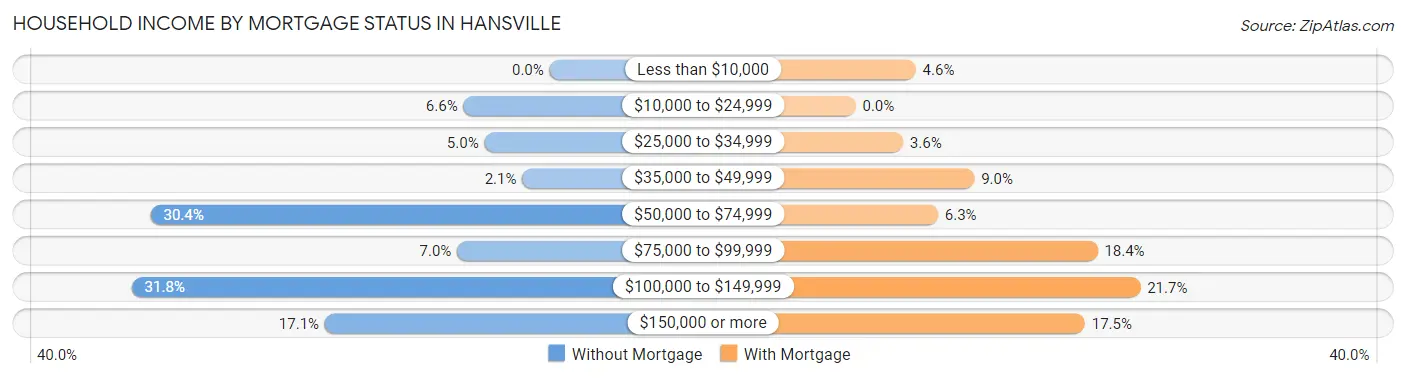
| Household Income | Without Mortgage | With Mortgage |
| Less than $10,000 | 0 (0.0%) | 38 (4.6%) |
| $10,000 to $24,999 | 41 (6.6%) | 0 (0.0%) |
| $25,000 to $34,999 | 31 (5.0%) | 30 (3.6%) |
| $35,000 to $49,999 | 13 (2.1%) | 75 (9.0%) |
| $50,000 to $74,999 | 190 (30.4%) | 52 (6.3%) |
| $75,000 to $99,999 | 44 (7.0%) | 153 (18.4%) |
| $100,000 to $149,999 | 199 (31.8%) | 180 (21.7%) |
| $150,000 or more | 107 (17.1%) | 145 (17.5%) |
| Total | 625 (100.0%) | 830 (100.0%) |
Property Value to Household Income Ratio in Hansville
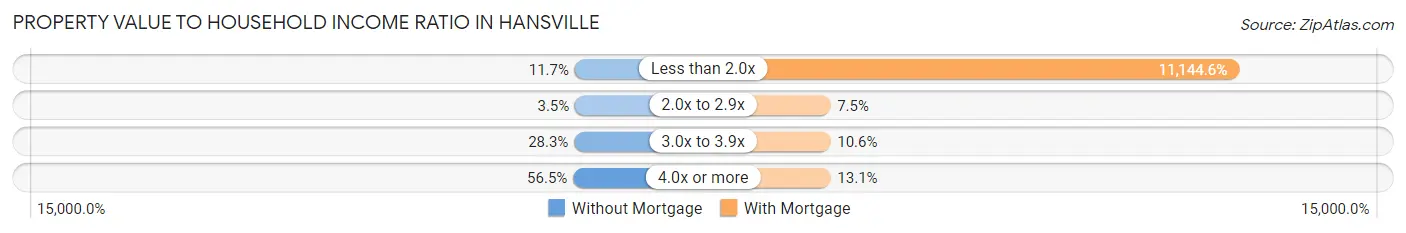
| Value-to-Income Ratio | Without Mortgage | With Mortgage |
| Less than 2.0x | 73 (11.7%) | 92,500 (11,144.6%) |
| 2.0x to 2.9x | 22 (3.5%) | 62 (7.5%) |
| 3.0x to 3.9x | 177 (28.3%) | 88 (10.6%) |
| 4.0x or more | 353 (56.5%) | 109 (13.1%) |
| Total | 625 (100.0%) | 830 (100.0%) |
Real Estate Taxes by Mortgage Status in Hansville
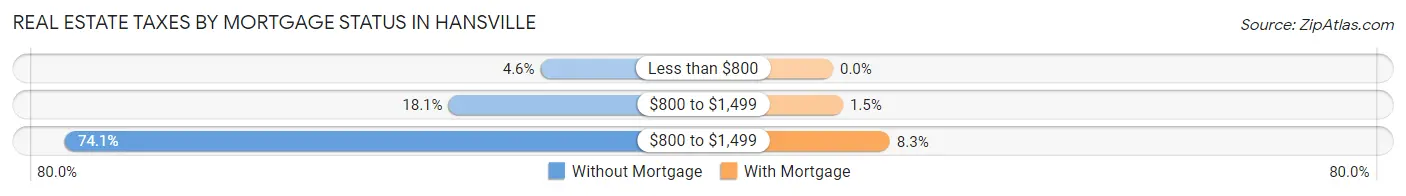
| Property Taxes | Without Mortgage | With Mortgage |
| Less than $800 | 29 (4.6%) | 0 (0.0%) |
| $800 to $1,499 | 113 (18.1%) | 12 (1.5%) |
| $800 to $1,499 | 463 (74.1%) | 69 (8.3%) |
| Total | 625 (100.0%) | 830 (100.0%) |
Health & Disability in Hansville
Health Insurance Coverage by Age in Hansville
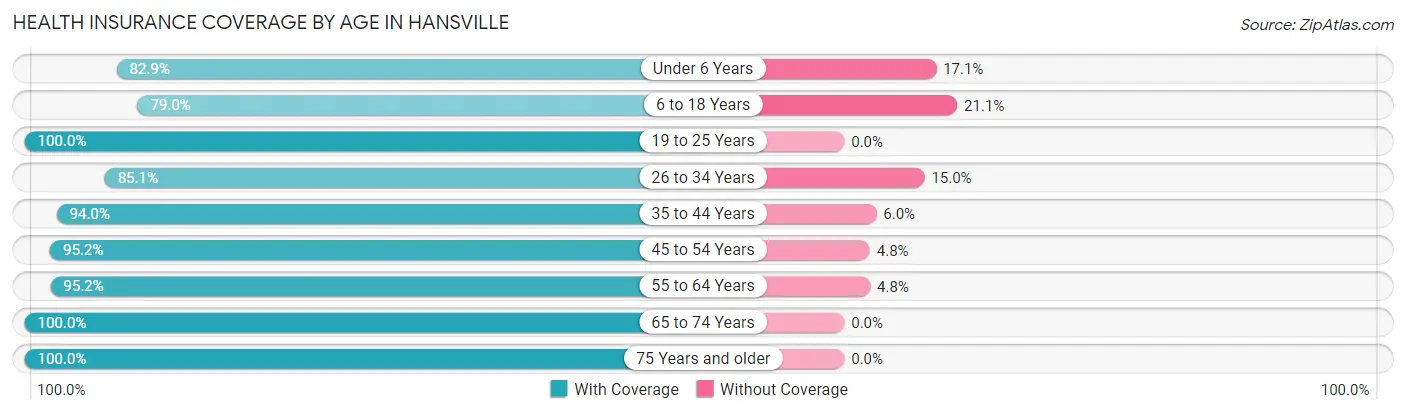
| Age Bracket | With Coverage | Without Coverage |
| Under 6 Years | 58 (82.9%) | 12 (17.1%) |
| 6 to 18 Years | 180 (78.9%) | 48 (21.0%) |
| 19 to 25 Years | 21 (100.0%) | 0 (0.0%) |
| 26 to 34 Years | 91 (85.1%) | 16 (14.9%) |
| 35 to 44 Years | 189 (94.0%) | 12 (6.0%) |
| 45 to 54 Years | 260 (95.2%) | 13 (4.8%) |
| 55 to 64 Years | 613 (95.2%) | 31 (4.8%) |
| 65 to 74 Years | 1,018 (100.0%) | 0 (0.0%) |
| 75 Years and older | 684 (100.0%) | 0 (0.0%) |
| Total | 3,114 (95.9%) | 132 (4.1%) |
Health Insurance Coverage by Citizenship Status in Hansville

| Citizenship Status | With Coverage | Without Coverage |
| Native Born | 58 (82.9%) | 12 (17.1%) |
| Foreign Born, Citizen | 180 (78.9%) | 48 (21.0%) |
| Foreign Born, not a Citizen | 21 (100.0%) | 0 (0.0%) |
Health Insurance Coverage by Household Income in Hansville
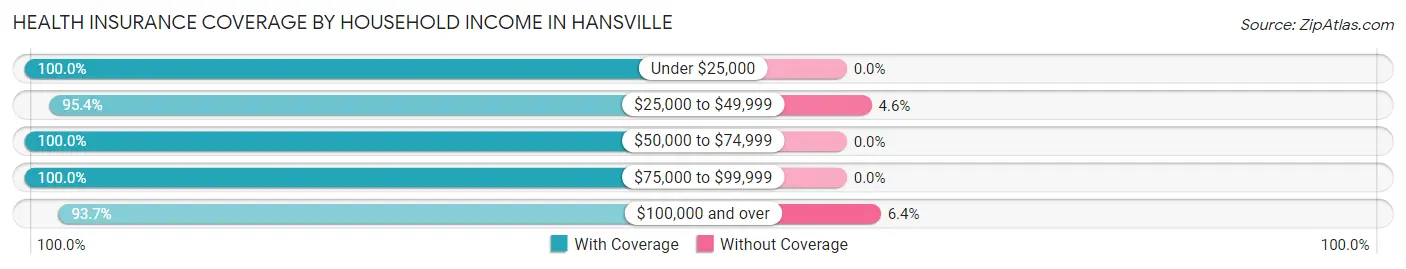
| Household Income | With Coverage | Without Coverage |
| Under $25,000 | 71 (100.0%) | 0 (0.0%) |
| $25,000 to $49,999 | 267 (95.4%) | 13 (4.6%) |
| $50,000 to $74,999 | 545 (100.0%) | 0 (0.0%) |
| $75,000 to $99,999 | 476 (100.0%) | 0 (0.0%) |
| $100,000 and over | 1,755 (93.6%) | 119 (6.4%) |
Public vs Private Health Insurance Coverage by Age in Hansville
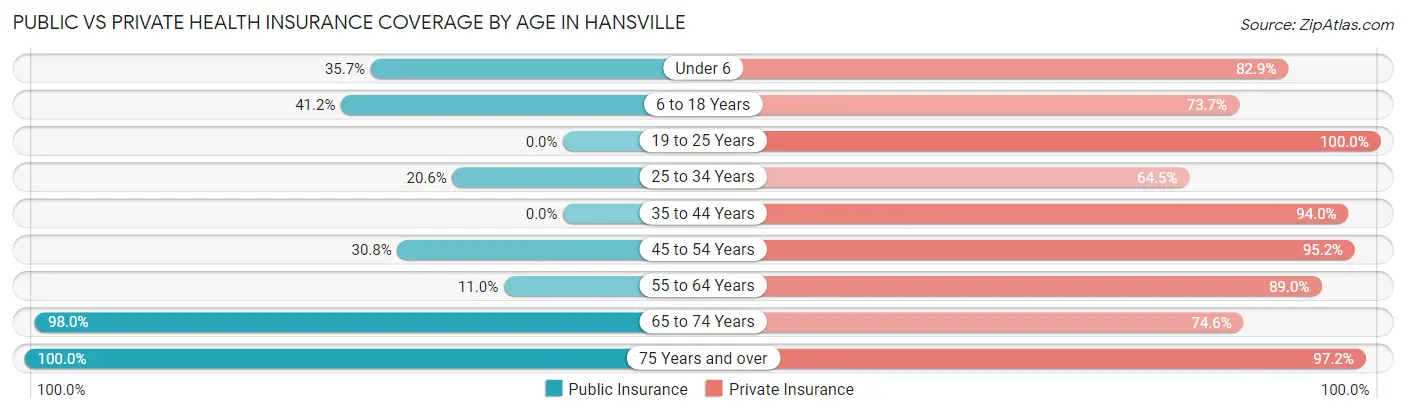
| Age Bracket | Public Insurance | Private Insurance |
| Under 6 | 25 (35.7%) | 58 (82.9%) |
| 6 to 18 Years | 94 (41.2%) | 168 (73.7%) |
| 19 to 25 Years | 0 (0.0%) | 21 (100.0%) |
| 25 to 34 Years | 22 (20.6%) | 69 (64.5%) |
| 35 to 44 Years | 0 (0.0%) | 189 (94.0%) |
| 45 to 54 Years | 84 (30.8%) | 260 (95.2%) |
| 55 to 64 Years | 71 (11.0%) | 573 (89.0%) |
| 65 to 74 Years | 998 (98.0%) | 759 (74.6%) |
| 75 Years and over | 684 (100.0%) | 665 (97.2%) |
| Total | 1,978 (60.9%) | 2,762 (85.1%) |
Disability Status by Sex by Age in Hansville
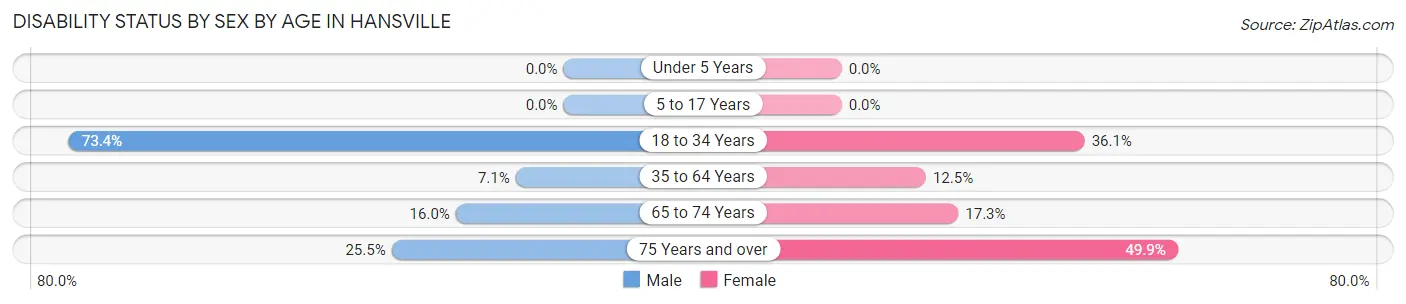
| Age Bracket | Male | Female |
| Under 5 Years | 0 (0.0%) | 0 (0.0%) |
| 5 to 17 Years | 0 (0.0%) | 0 (0.0%) |
| 18 to 34 Years | 58 (73.4%) | 22 (36.1%) |
| 35 to 64 Years | 43 (7.1%) | 64 (12.5%) |
| 65 to 74 Years | 63 (16.0%) | 108 (17.3%) |
| 75 Years and over | 86 (25.5%) | 173 (49.9%) |
Disability Class by Sex by Age in Hansville
Disability Class: Hearing Difficulty
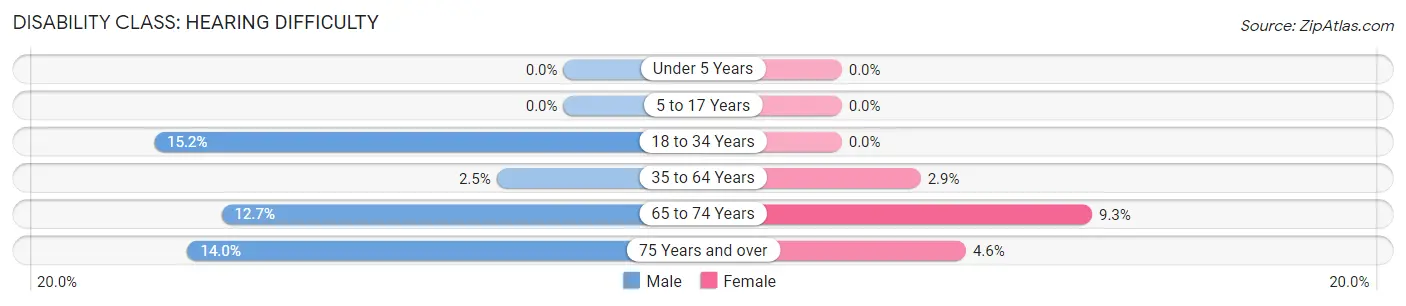
| Age Bracket | Male | Female |
| Under 5 Years | 0 (0.0%) | 0 (0.0%) |
| 5 to 17 Years | 0 (0.0%) | 0 (0.0%) |
| 18 to 34 Years | 12 (15.2%) | 0 (0.0%) |
| 35 to 64 Years | 15 (2.5%) | 15 (2.9%) |
| 65 to 74 Years | 50 (12.7%) | 58 (9.3%) |
| 75 Years and over | 47 (14.0%) | 16 (4.6%) |
Disability Class: Vision Difficulty
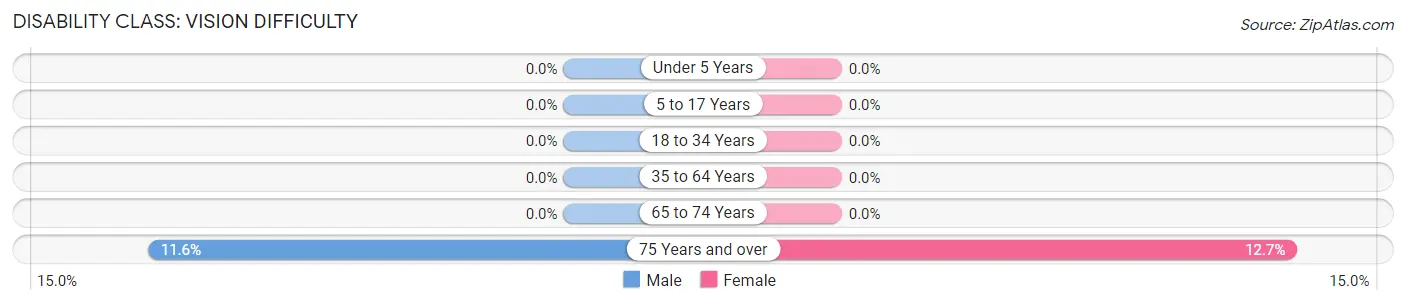
| Age Bracket | Male | Female |
| Under 5 Years | 0 (0.0%) | 0 (0.0%) |
| 5 to 17 Years | 0 (0.0%) | 0 (0.0%) |
| 18 to 34 Years | 0 (0.0%) | 0 (0.0%) |
| 35 to 64 Years | 0 (0.0%) | 0 (0.0%) |
| 65 to 74 Years | 0 (0.0%) | 0 (0.0%) |
| 75 Years and over | 39 (11.6%) | 44 (12.7%) |
Disability Class: Cognitive Difficulty
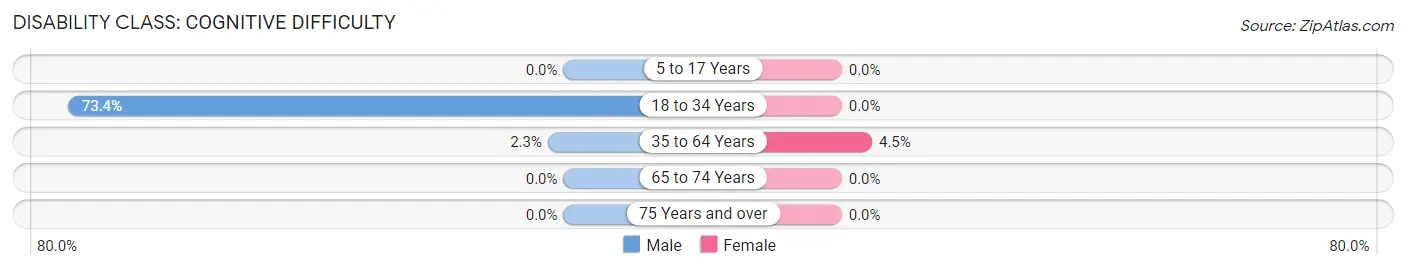
| Age Bracket | Male | Female |
| 5 to 17 Years | 0 (0.0%) | 0 (0.0%) |
| 18 to 34 Years | 58 (73.4%) | 0 (0.0%) |
| 35 to 64 Years | 14 (2.3%) | 23 (4.5%) |
| 65 to 74 Years | 0 (0.0%) | 0 (0.0%) |
| 75 Years and over | 0 (0.0%) | 0 (0.0%) |
Disability Class: Ambulatory Difficulty
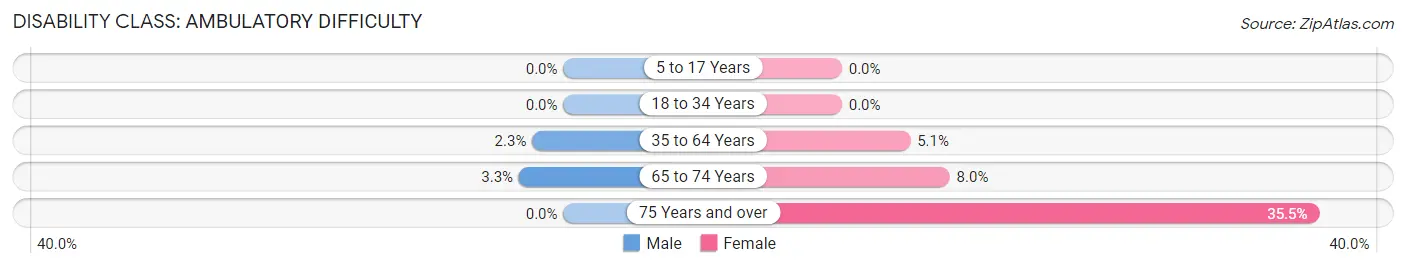
| Age Bracket | Male | Female |
| 5 to 17 Years | 0 (0.0%) | 0 (0.0%) |
| 18 to 34 Years | 0 (0.0%) | 0 (0.0%) |
| 35 to 64 Years | 14 (2.3%) | 26 (5.1%) |
| 65 to 74 Years | 13 (3.3%) | 50 (8.0%) |
| 75 Years and over | 0 (0.0%) | 123 (35.4%) |
Disability Class: Self-Care Difficulty
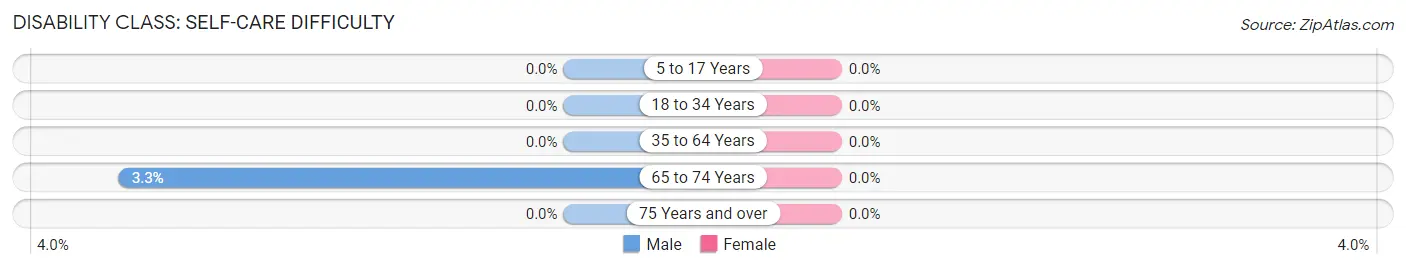
| Age Bracket | Male | Female |
| 5 to 17 Years | 0 (0.0%) | 0 (0.0%) |
| 18 to 34 Years | 0 (0.0%) | 0 (0.0%) |
| 35 to 64 Years | 0 (0.0%) | 0 (0.0%) |
| 65 to 74 Years | 13 (3.3%) | 0 (0.0%) |
| 75 Years and over | 0 (0.0%) | 0 (0.0%) |
Technology Access in Hansville
Computing Device Access in Hansville
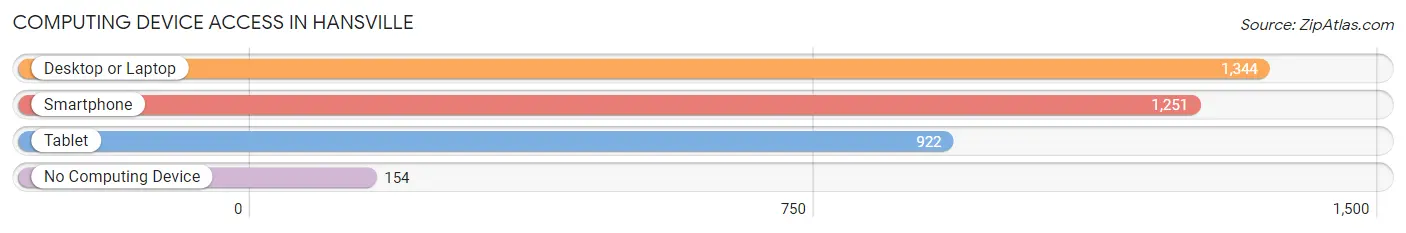
| Device Type | # Households | % Households |
| Desktop or Laptop | 1,344 | 83.2% |
| Smartphone | 1,251 | 77.4% |
| Tablet | 922 | 57.1% |
| No Computing Device | 154 | 9.5% |
| Total | 1,616 | 100.0% |
Internet Access in Hansville
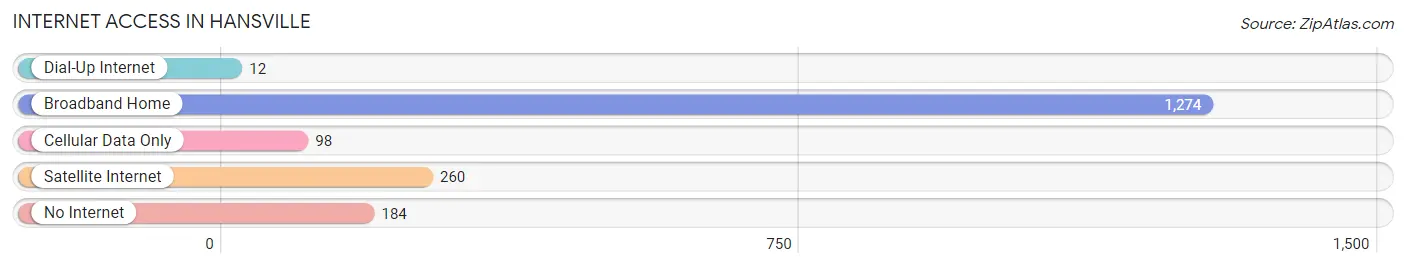
| Internet Type | # Households | % Households |
| Dial-Up Internet | 12 | 0.7% |
| Broadband Home | 1,274 | 78.8% |
| Cellular Data Only | 98 | 6.1% |
| Satellite Internet | 260 | 16.1% |
| No Internet | 184 | 11.4% |
| Total | 1,616 | 100.0% |
Hansville Summary
Hansville is a small unincorporated community located in Kitsap County, Washington, United States. It is situated on the northern tip of the Kitsap Peninsula, approximately 25 miles northwest of Seattle. The population of Hansville was 1,717 at the 2010 census.
History
Hansville was first settled in the late 1800s by Norwegian immigrants who named the area after their hometown of Hansvoll, Norway. The first post office was established in 1891 and the town was officially incorporated in 1895. The town was originally a logging and fishing community, but in the early 1900s, it became a popular summer resort destination.
Geography
Hansville is located at the northern tip of the Kitsap Peninsula, approximately 25 miles northwest of Seattle. It is bordered by the Hood Canal to the east and the Strait of Juan de Fuca to the west. The town is situated on a small peninsula, with the main part of the town located on the east side of the peninsula and a smaller portion on the west side. The town is surrounded by forests and is home to several parks, including Point No Point County Park and Scenic Beach State Park.
Economy
Hansville is primarily a residential community, with most of its residents commuting to nearby cities for work. The town is home to several small businesses, including a grocery store, a hardware store, and a few restaurants. The town is also home to a marina, which provides access to the Hood Canal and the Strait of Juan de Fuca.
Demographics
As of the 2010 census, the population of Hansville was 1,717. The racial makeup of the town was 94.3% White, 0.7% African American, 0.7% Native American, 0.7% Asian, 0.2% Pacific Islander, 0.7% from other races, and 2.5% from two or more races. Hispanic or Latino of any race were 3.2% of the population.
The median income for a household in Hansville was $50,938, and the median income for a family was $58,750. The per capita income for the town was $25,945. About 8.3% of families and 10.2% of the population were below the poverty line, including 14.3% of those under age 18 and 4.2% of those age 65 or over.
Common Questions
What is Per Capita Income in Hansville?
Per Capita income in Hansville is $59,754.
What is the Median Family Income in Hansville?
Median Family Income in Hansville is $121,393.
What is the Median Household income in Hansville?
Median Household Income in Hansville is $97,331.
What is Income or Wage Gap in Hansville?
Income or Wage Gap in Hansville is 35.6%.
Women in Hansville earn 64.4 cents for every dollar earned by a man.
What is Inequality or Gini Index in Hansville?
Inequality or Gini Index in Hansville is 0.33.
What is the Total Population of Hansville?
Total Population of Hansville is 3,246.
What is the Total Male Population of Hansville?
Total Male Population of Hansville is 1,525.
What is the Total Female Population of Hansville?
Total Female Population of Hansville is 1,721.
What is the Ratio of Males per 100 Females in Hansville?
There are 88.61 Males per 100 Females in Hansville.
What is the Ratio of Females per 100 Males in Hansville?
There are 112.85 Females per 100 Males in Hansville.
What is the Median Population Age in Hansville?
Median Population Age in Hansville is 66.0 Years.
What is the Average Family Size in Hansville
Average Family Size in Hansville is 2.4 People.
What is the Average Household Size in Hansville
Average Household Size in Hansville is 2.0 People.
How Large is the Labor Force in Hansville?
There are 1,030 People in the Labor Forcein in Hansville.
What is the Percentage of People in the Labor Force in Hansville?
33.8% of People are in the Labor Force in Hansville.
What is the Unemployment Rate in Hansville?
Unemployment Rate in Hansville is 0.9%.