Verlot, WA Map & Demographics
Verlot Map
Verlot Overview
$65,440
PER CAPITA INCOME
$250,001
AVG FAMILY INCOME
50.6%
WAGE / INCOME GAP [ % ]
49.4¢/ $1
WAGE / INCOME GAP [ $ ]
0.43
INEQUALITY / GINI INDEX
329
TOTAL POPULATION
184
MALE POPULATION
145
FEMALE POPULATION
126.90
MALES / 100 FEMALES
78.80
FEMALES / 100 MALES
60.6
MEDIAN AGE
2.7
AVG FAMILY SIZE
1.9
AVG HOUSEHOLD SIZE
175
LABOR FORCE [ PEOPLE ]
53.2%
PERCENT IN LABOR FORCE
Income in Verlot
Income Overview in Verlot
| Characteristic | Number | Measure |
| Per Capita Income | 329 | $65,440 |
| Median Family Income | 72 | $250,001 |
| Mean Family Income | 72 | $205,393 |
| Median Household Income | 177 | $0 |
| Mean Household Income | 177 | $120,487 |
| Income Deficit | 72 | $0 |
| Wage / Income Gap (%) | 329 | 50.64% |
| Wage / Income Gap ($) | 329 | 49.36¢ per $1 |
| Gini / Inequality Index | 329 | 0.43 |
Earnings by Sex in Verlot
Average Earnings in Verlot are $69,593, $138,750 for men and $68,486 for women, a difference of 50.6%.
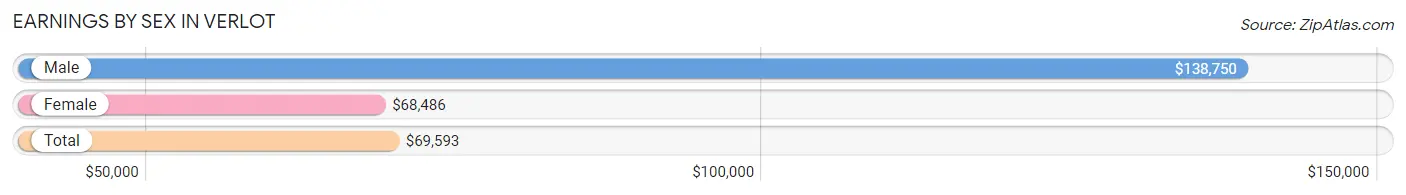
| Sex | Number | Average Earnings |
| Male | 98 (56.0%) | $138,750 |
| Female | 77 (44.0%) | $68,486 |
| Total | 175 (100.0%) | $69,593 |
Earnings by Sex by Income Bracket in Verlot
The most common earnings brackets in Verlot are $100,000+ for men (56 | 57.1%) and $65,000 to $74,999 for women (52 | 67.5%).
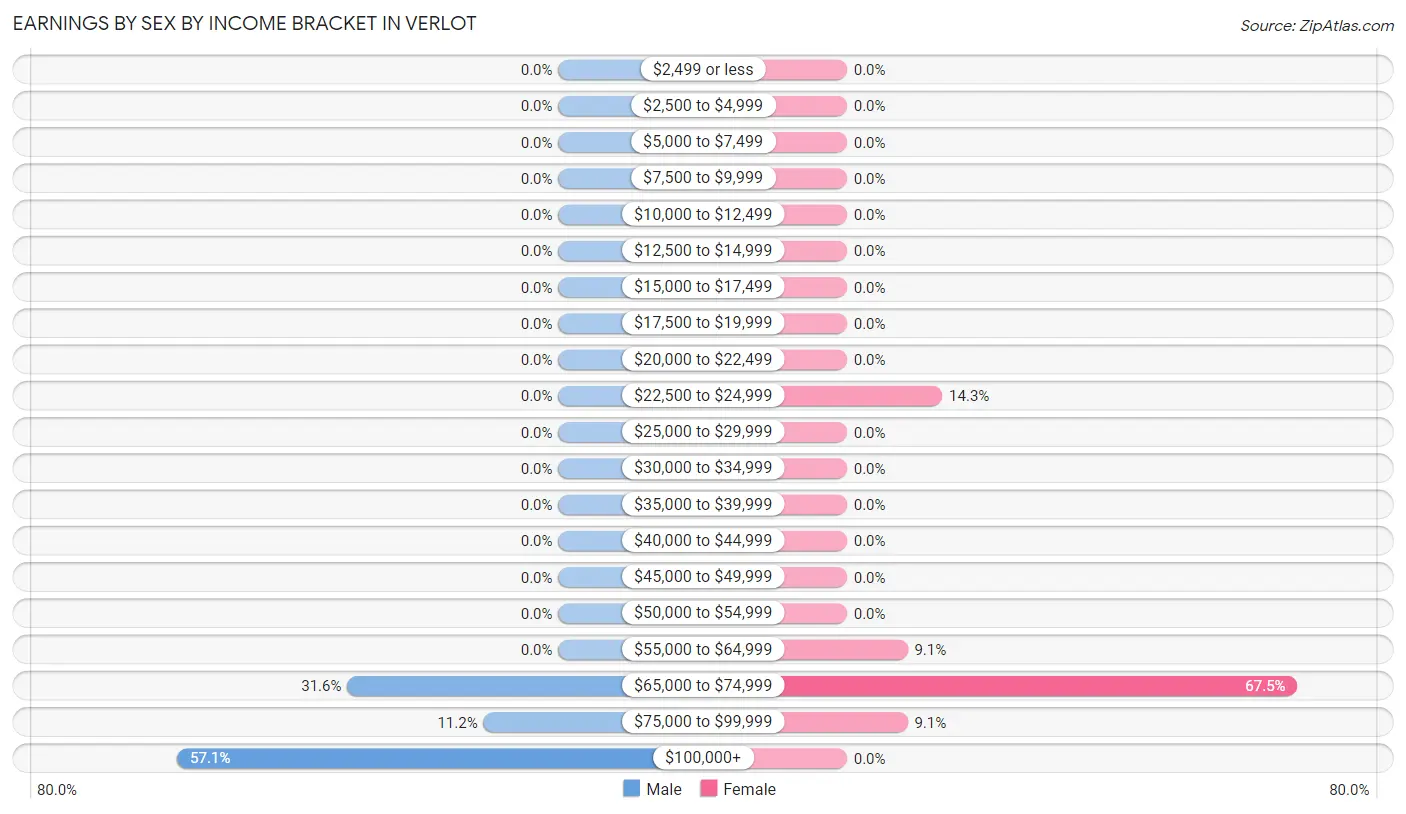
| Income | Male | Female |
| $2,499 or less | 0 (0.0%) | 0 (0.0%) |
| $2,500 to $4,999 | 0 (0.0%) | 0 (0.0%) |
| $5,000 to $7,499 | 0 (0.0%) | 0 (0.0%) |
| $7,500 to $9,999 | 0 (0.0%) | 0 (0.0%) |
| $10,000 to $12,499 | 0 (0.0%) | 0 (0.0%) |
| $12,500 to $14,999 | 0 (0.0%) | 0 (0.0%) |
| $15,000 to $17,499 | 0 (0.0%) | 0 (0.0%) |
| $17,500 to $19,999 | 0 (0.0%) | 0 (0.0%) |
| $20,000 to $22,499 | 0 (0.0%) | 0 (0.0%) |
| $22,500 to $24,999 | 0 (0.0%) | 11 (14.3%) |
| $25,000 to $29,999 | 0 (0.0%) | 0 (0.0%) |
| $30,000 to $34,999 | 0 (0.0%) | 0 (0.0%) |
| $35,000 to $39,999 | 0 (0.0%) | 0 (0.0%) |
| $40,000 to $44,999 | 0 (0.0%) | 0 (0.0%) |
| $45,000 to $49,999 | 0 (0.0%) | 0 (0.0%) |
| $50,000 to $54,999 | 0 (0.0%) | 0 (0.0%) |
| $55,000 to $64,999 | 0 (0.0%) | 7 (9.1%) |
| $65,000 to $74,999 | 31 (31.6%) | 52 (67.5%) |
| $75,000 to $99,999 | 11 (11.2%) | 7 (9.1%) |
| $100,000+ | 56 (57.1%) | 0 (0.0%) |
| Total | 98 (100.0%) | 77 (100.0%) |
Earnings by Sex by Educational Attainment in Verlot
| Educational Attainment | Male Income | Female Income |
| Less than High School | - | - |
| High School Diploma | - | - |
| College or Associate's Degree | - | - |
| Bachelor's Degree | - | - |
| Graduate Degree | - | - |
| Total | $160,791 | $68,486 |
Family Income in Verlot
Family Income Brackets in Verlot
According to the Verlot family income data, there are 49 families falling into the $200,000+ income range, which is the most common income bracket and makes up 68.1% of all families.
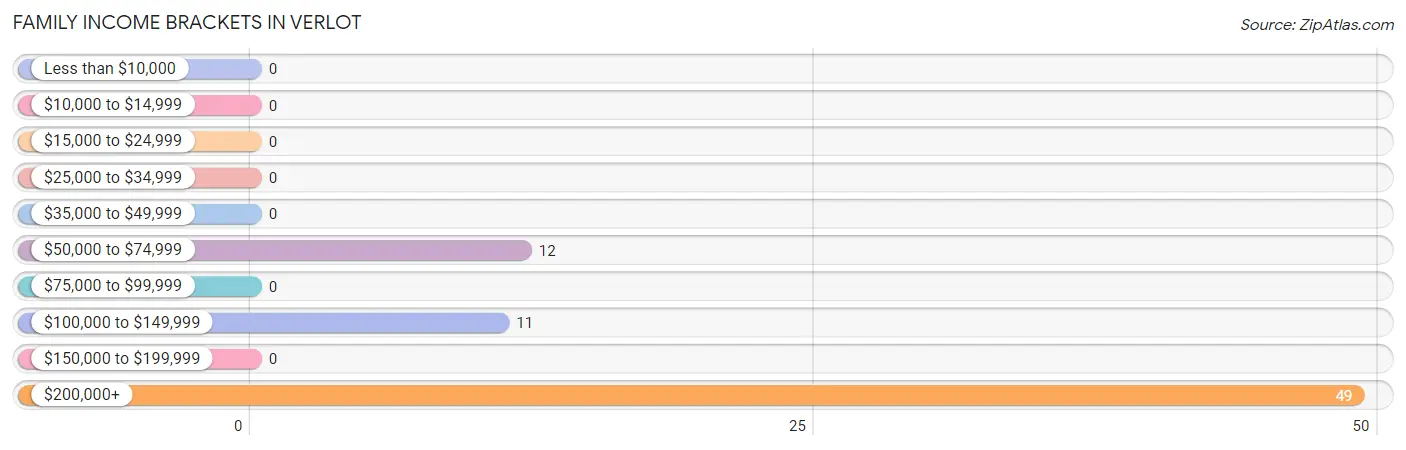
| Income Bracket | # Families | % Families |
| Less than $10,000 | 0 | 0.0% |
| $10,000 to $14,999 | 0 | 0.0% |
| $15,000 to $24,999 | 0 | 0.0% |
| $25,000 to $34,999 | 0 | 0.0% |
| $35,000 to $49,999 | 0 | 0.0% |
| $50,000 to $74,999 | 12 | 16.7% |
| $75,000 to $99,999 | 0 | 0.0% |
| $100,000 to $149,999 | 11 | 15.3% |
| $150,000 to $199,999 | 0 | 0.0% |
| $200,000+ | 49 | 68.1% |
Family Income by Famaliy Size in Verlot
| Income Bracket | # Families | Median Income |
| 2-Person Families | 23 (31.9%) | $0 |
| 3-Person Families | 49 (68.1%) | $0 |
| 4-Person Families | 0 (0.0%) | $0 |
| 5-Person Families | 0 (0.0%) | $0 |
| 6-Person Families | 0 (0.0%) | $0 |
| 7+ Person Families | 0 (0.0%) | $0 |
| Total | 72 (100.0%) | $250,001 |
Family Income by Number of Earners in Verlot
| Number of Earners | # Families | Median Income |
| No Earners | 12 (16.7%) | $0 |
| 1 Earner | 0 (0.0%) | $0 |
| 2 Earners | 60 (83.3%) | $0 |
| 3+ Earners | 0 (0.0%) | $0 |
| Total | 72 (100.0%) | $250,001 |
Household Income in Verlot
Household Income Brackets in Verlot
With 56 households falling in the category, the $200,000+ income range is the most frequent in Verlot, accounting for 31.6% of all households.
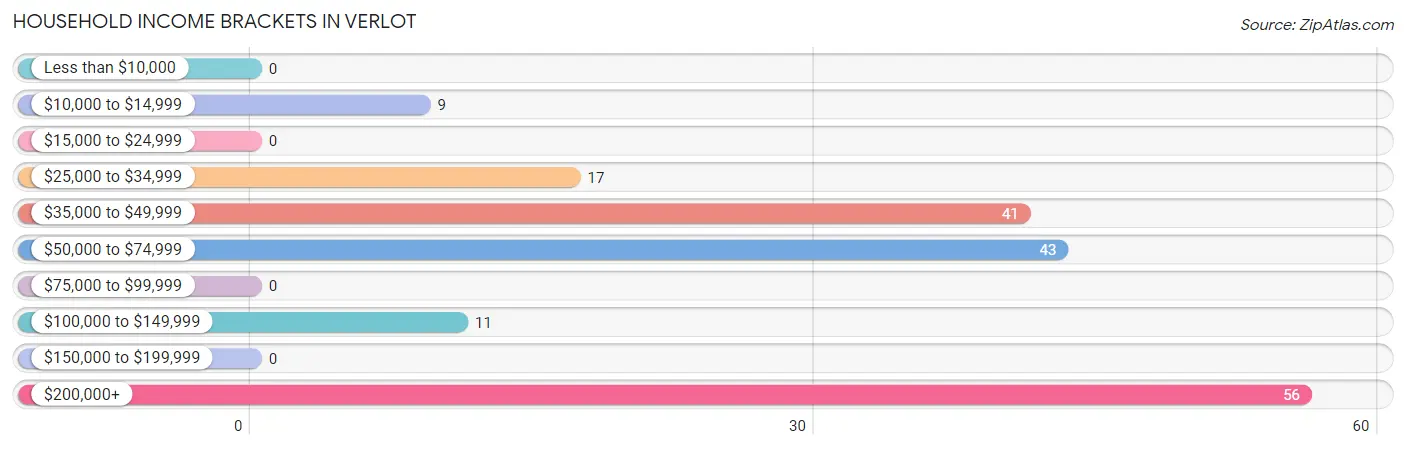
| Income Bracket | # Households | % Households |
| Less than $10,000 | 0 | 0.0% |
| $10,000 to $14,999 | 9 | 5.1% |
| $15,000 to $24,999 | 0 | 0.0% |
| $25,000 to $34,999 | 17 | 9.6% |
| $35,000 to $49,999 | 41 | 23.2% |
| $50,000 to $74,999 | 43 | 24.3% |
| $75,000 to $99,999 | 0 | 0.0% |
| $100,000 to $149,999 | 11 | 6.2% |
| $150,000 to $199,999 | 0 | 0.0% |
| $200,000+ | 56 | 31.6% |
Household Income by Householder Age in Verlot
The median household income in Verlot is $0, with the highest median household income of $250,001 found in the 45 to 64 years age bracket for the primary householder. A total of 65 households (36.7%) fall into this category. Meanwhile, the 15 to 24 years age bracket for the primary householder has the lowest median household income of $0, with 31 households (17.5%) in this group.
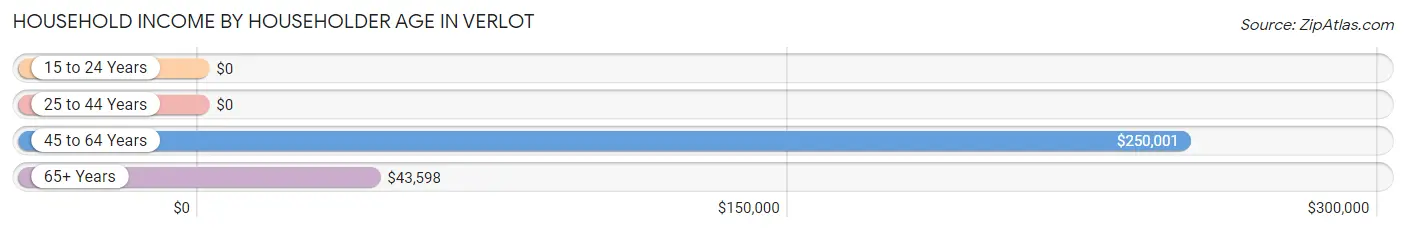
| Income Bracket | # Households | Median Income |
| 15 to 24 Years | 31 (17.5%) | $0 |
| 25 to 44 Years | 11 (6.2%) | $0 |
| 45 to 64 Years | 65 (36.7%) | $250,001 |
| 65+ Years | 70 (39.6%) | $43,598 |
| Total | 177 (100.0%) | $0 |
Poverty in Verlot
Income Below Poverty by Sex and Age in Verlot
With 8.7% poverty level for males and 5.5% for females among the residents of Verlot, 55 to 64 year old males and 45 to 54 year old females are the most vulnerable to poverty, with 16 males (22.2%) and 8 females (53.3%) in their respective age groups living below the poverty level.
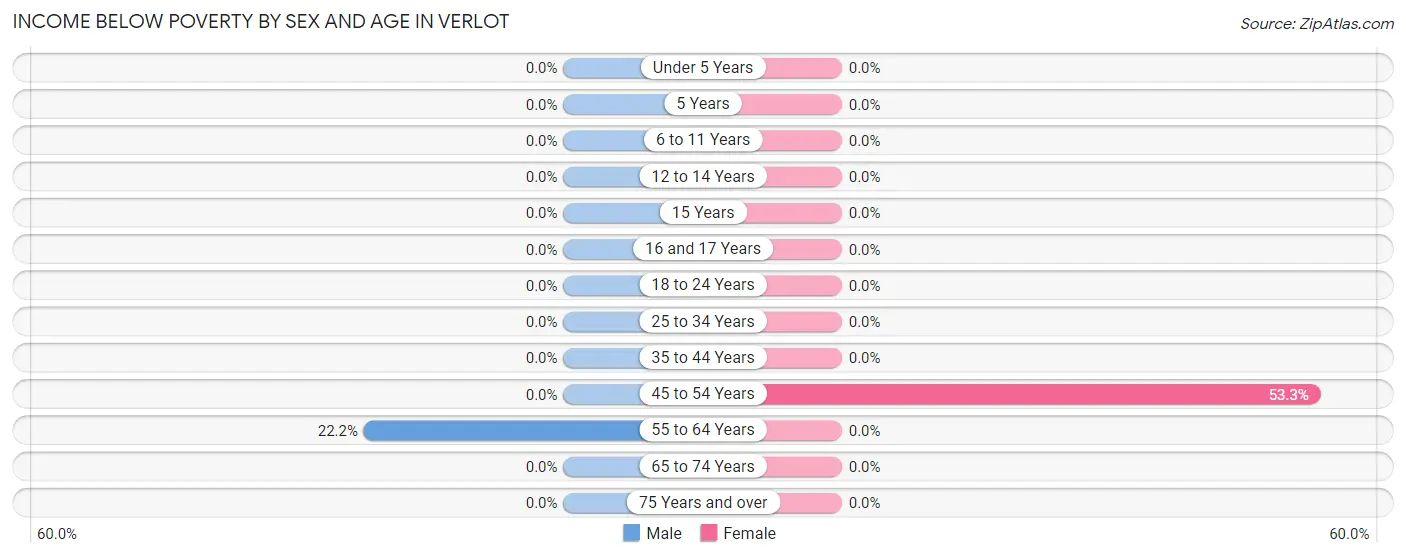
| Age Bracket | Male | Female |
| Under 5 Years | 0 (0.0%) | 0 (0.0%) |
| 5 Years | 0 (0.0%) | 0 (0.0%) |
| 6 to 11 Years | 0 (0.0%) | 0 (0.0%) |
| 12 to 14 Years | 0 (0.0%) | 0 (0.0%) |
| 15 Years | 0 (0.0%) | 0 (0.0%) |
| 16 and 17 Years | 0 (0.0%) | 0 (0.0%) |
| 18 to 24 Years | 0 (0.0%) | 0 (0.0%) |
| 25 to 34 Years | 0 (0.0%) | 0 (0.0%) |
| 35 to 44 Years | 0 (0.0%) | 0 (0.0%) |
| 45 to 54 Years | 0 (0.0%) | 8 (53.3%) |
| 55 to 64 Years | 16 (22.2%) | 0 (0.0%) |
| 65 to 74 Years | 0 (0.0%) | 0 (0.0%) |
| 75 Years and over | 0 (0.0%) | 0 (0.0%) |
| Total | 16 (8.7%) | 8 (5.5%) |
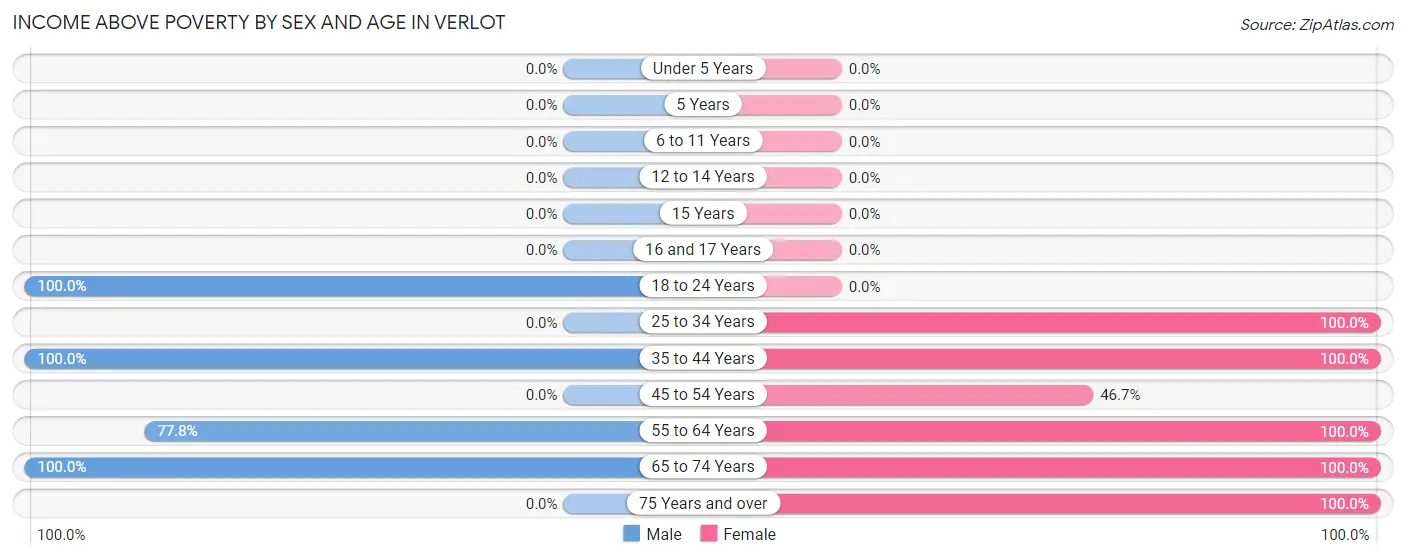
Income Above Poverty by Sex and Age in Verlot
According to the poverty statistics in Verlot, males aged 18 to 24 years and females aged 25 to 34 years are the age groups that are most secure financially, with 100.0% of males and 100.0% of females in these age groups living above the poverty line.
| Age Bracket | Male | Female |
| Under 5 Years | 0 (0.0%) | 0 (0.0%) |
| 5 Years | 0 (0.0%) | 0 (0.0%) |
| 6 to 11 Years | 0 (0.0%) | 0 (0.0%) |
| 12 to 14 Years | 0 (0.0%) | 0 (0.0%) |
| 15 Years | 0 (0.0%) | 0 (0.0%) |
| 16 and 17 Years | 0 (0.0%) | 0 (0.0%) |
| 18 to 24 Years | 31 (100.0%) | 0 (0.0%) |
| 25 to 34 Years | 0 (0.0%) | 52 (100.0%) |
| 35 to 44 Years | 11 (100.0%) | 11 (100.0%) |
| 45 to 54 Years | 0 (0.0%) | 7 (46.7%) |
| 55 to 64 Years | 56 (77.8%) | 7 (100.0%) |
| 65 to 74 Years | 70 (100.0%) | 15 (100.0%) |
| 75 Years and over | 0 (0.0%) | 45 (100.0%) |
| Total | 168 (91.3%) | 137 (94.5%) |
Income Below Poverty Among Married-Couple Families in Verlot
| Children | Above Poverty | Below Poverty |
| No Children | 23 (100.0%) | 0 (0.0%) |
| 1 or 2 Children | 0 (0.0%) | 0 (0.0%) |
| 3 or 4 Children | 0 (0.0%) | 0 (0.0%) |
| 5 or more Children | 0 (0.0%) | 0 (0.0%) |
| Total | 23 (100.0%) | 0 (0.0%) |
Income Below Poverty Among Single-Parent Households in Verlot
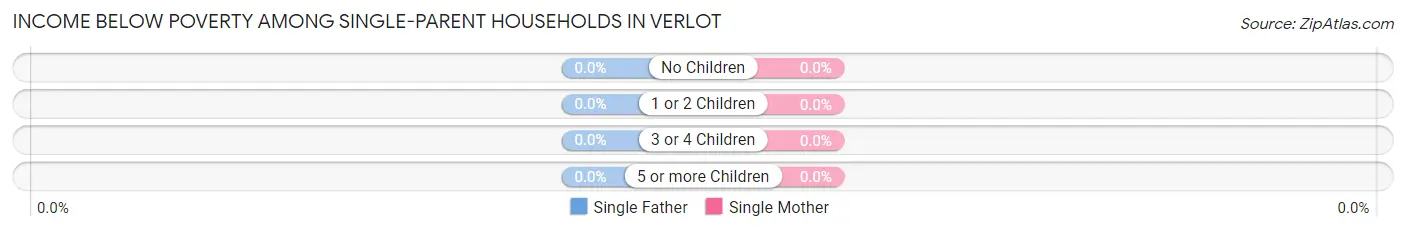
| Children | Single Father | Single Mother |
| No Children | 0 (0.0%) | 0 (0.0%) |
| 1 or 2 Children | 0 (0.0%) | 0 (0.0%) |
| 3 or 4 Children | 0 (0.0%) | 0 (0.0%) |
| 5 or more Children | 0 (0.0%) | 0 (0.0%) |
| Total | 0 (0.0%) | 0 (0.0%) |
Income Below Poverty Among Married-Couple vs Single-Parent Households in Verlot
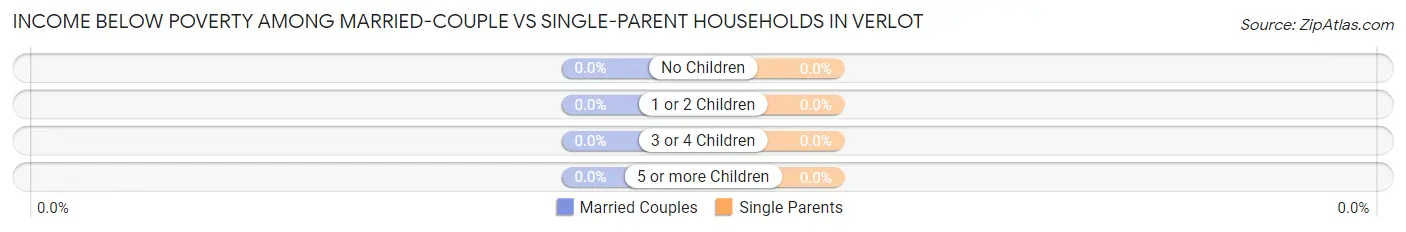
| Children | Married-Couple Families | Single-Parent Households |
| No Children | 0 (0.0%) | 0 (0.0%) |
| 1 or 2 Children | 0 (0.0%) | 0 (0.0%) |
| 3 or 4 Children | 0 (0.0%) | 0 (0.0%) |
| 5 or more Children | 0 (0.0%) | 0 (0.0%) |
| Total | 0 (0.0%) | 0 (0.0%) |
Race in Verlot
The most populous races in Verlot are , and White / Caucasian (329 | 100.0%).
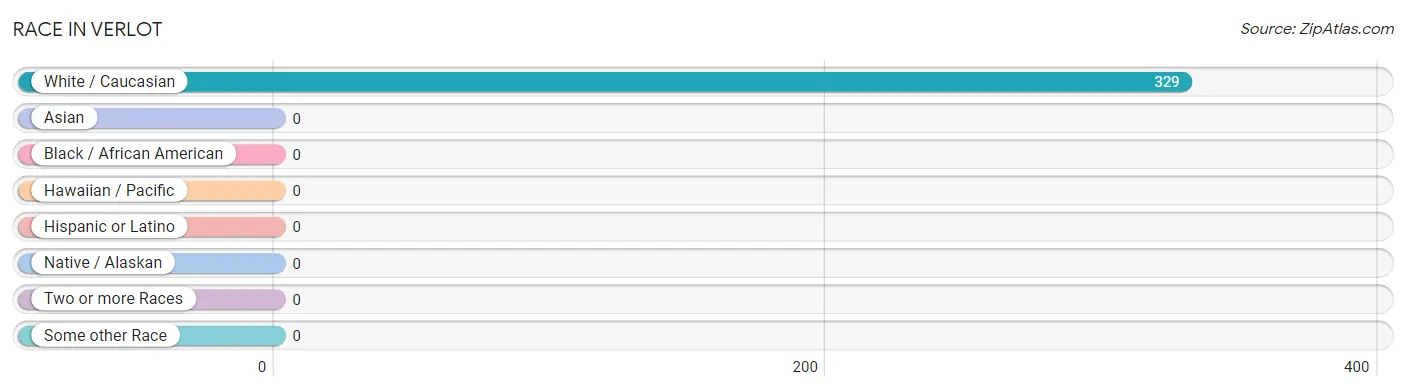
| Race | # Population | % Population |
| Asian | 0 | 0.0% |
| Black / African American | 0 | 0.0% |
| Hawaiian / Pacific | 0 | 0.0% |
| Hispanic or Latino | 0 | 0.0% |
| Native / Alaskan | 0 | 0.0% |
| White / Caucasian | 329 | 100.0% |
| Two or more Races | 0 | 0.0% |
| Some other Race | 0 | 0.0% |
| Total | 329 | 100.0% |
Ancestry in Verlot
The most populous ancestries reported in Verlot are Scotch-Irish (38 | 11.6%), American (36 | 10.9%), Irish (25 | 7.6%), German (23 | 7.0%), and Welsh (17 | 5.2%), together accounting for 42.3% of all Verlot residents.
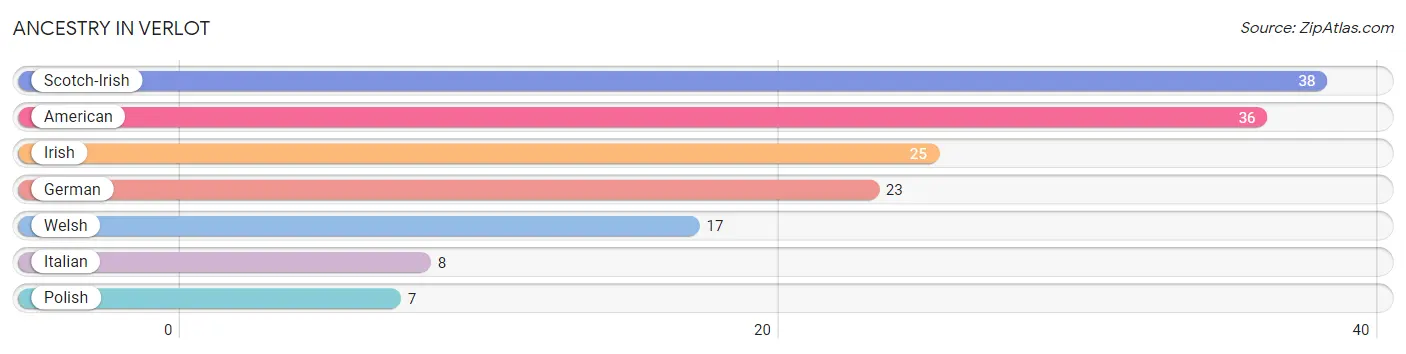
| Ancestry | # Population | % Population |
| American | 36 | 10.9% |
| German | 23 | 7.0% |
| Irish | 25 | 7.6% |
| Italian | 8 | 2.4% |
| Polish | 7 | 2.1% |
| Scotch-Irish | 38 | 11.6% |
| Welsh | 17 | 5.2% | View All 7 Rows |
Immigrants in Verlot
The most numerous immigrant groups reported in Verlot came from Europe (7 | 2.1%), Germany (7 | 2.1%), and Western Europe (7 | 2.1%), together accounting for 6.4% of all Verlot residents.
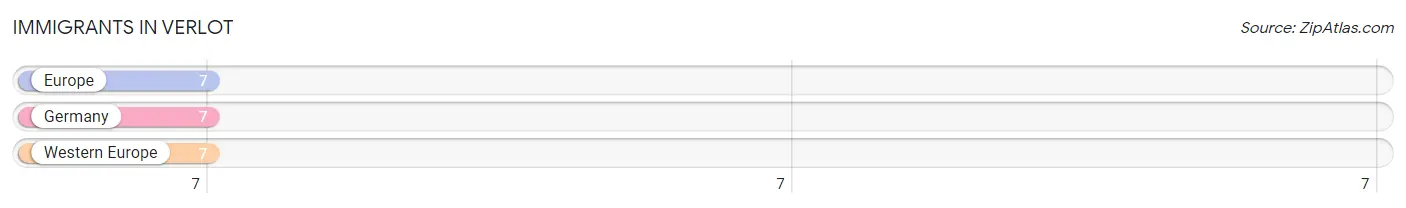
| Immigration Origin | # Population | % Population |
| Europe | 7 | 2.1% |
| Germany | 7 | 2.1% |
| Western Europe | 7 | 2.1% | View All 3 Rows |
Sex and Age in Verlot
Sex and Age in Verlot
The most populous age groups in Verlot are 60 to 64 Years (65 | 35.3%) for men and 30 to 34 Years (52 | 35.9%) for women.
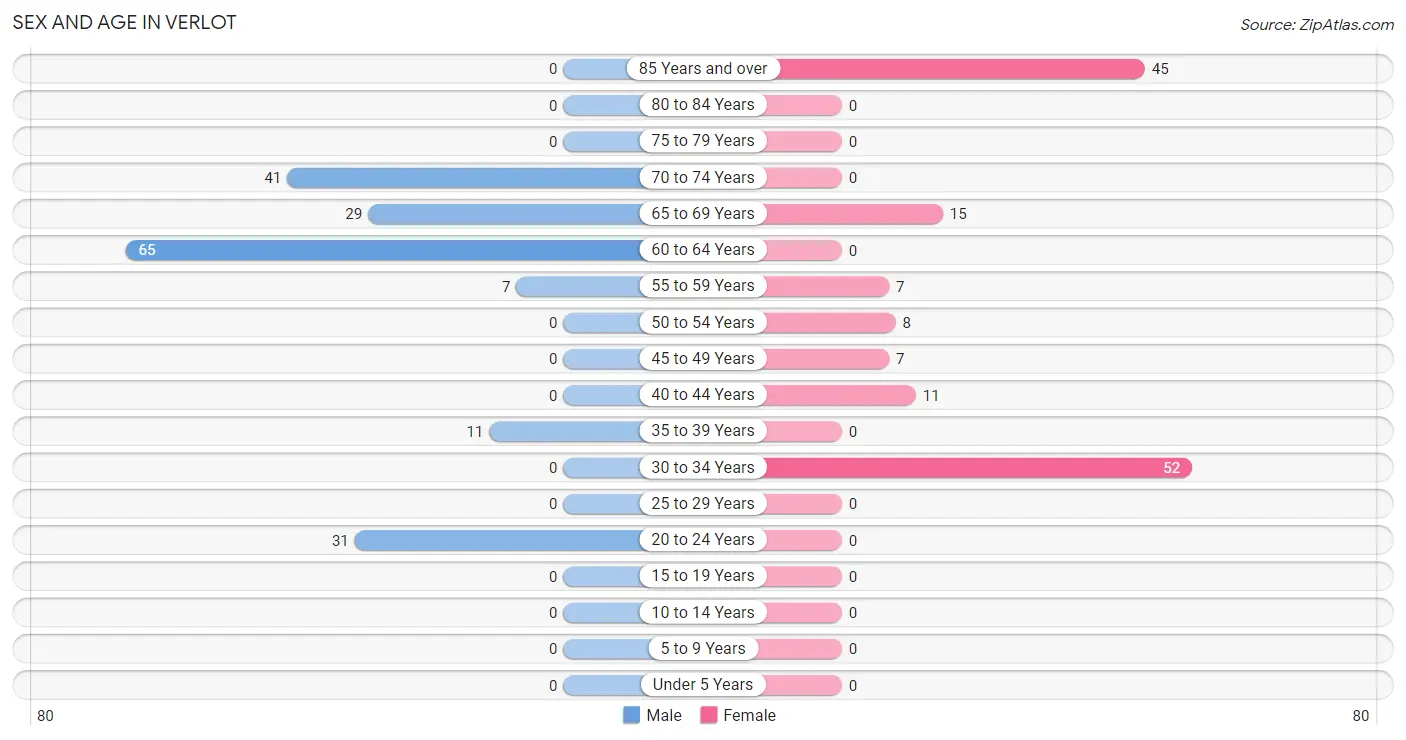
| Age Bracket | Male | Female |
| Under 5 Years | 0 (0.0%) | 0 (0.0%) |
| 5 to 9 Years | 0 (0.0%) | 0 (0.0%) |
| 10 to 14 Years | 0 (0.0%) | 0 (0.0%) |
| 15 to 19 Years | 0 (0.0%) | 0 (0.0%) |
| 20 to 24 Years | 31 (16.9%) | 0 (0.0%) |
| 25 to 29 Years | 0 (0.0%) | 0 (0.0%) |
| 30 to 34 Years | 0 (0.0%) | 52 (35.9%) |
| 35 to 39 Years | 11 (6.0%) | 0 (0.0%) |
| 40 to 44 Years | 0 (0.0%) | 11 (7.6%) |
| 45 to 49 Years | 0 (0.0%) | 7 (4.8%) |
| 50 to 54 Years | 0 (0.0%) | 8 (5.5%) |
| 55 to 59 Years | 7 (3.8%) | 7 (4.8%) |
| 60 to 64 Years | 65 (35.3%) | 0 (0.0%) |
| 65 to 69 Years | 29 (15.8%) | 15 (10.3%) |
| 70 to 74 Years | 41 (22.3%) | 0 (0.0%) |
| 75 to 79 Years | 0 (0.0%) | 0 (0.0%) |
| 80 to 84 Years | 0 (0.0%) | 0 (0.0%) |
| 85 Years and over | 0 (0.0%) | 45 (31.0%) |
| Total | 184 (100.0%) | 145 (100.0%) |
Families and Households in Verlot
Median Family Size in Verlot
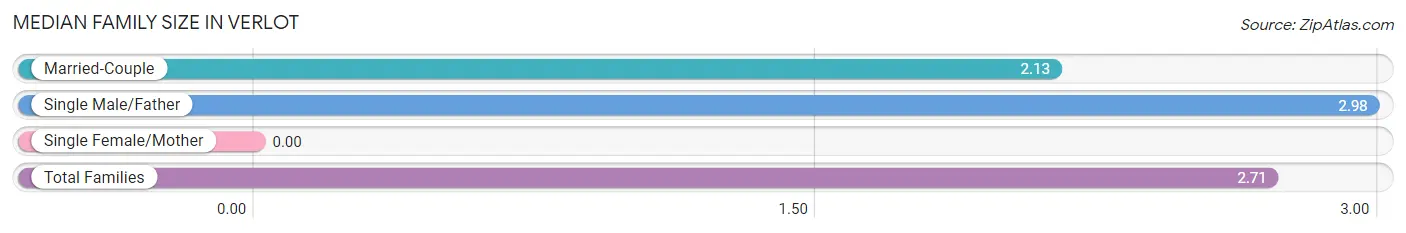
| Family Type | # Families | Family Size |
| Married-Couple | 23 (31.9%) | 2.13 |
| Single Male/Father | 49 (68.1%) | 2.98 |
| Single Female/Mother | 0 (0.0%) | - |
| Total Families | 72 (100.0%) | 2.71 |
Median Household Size in Verlot
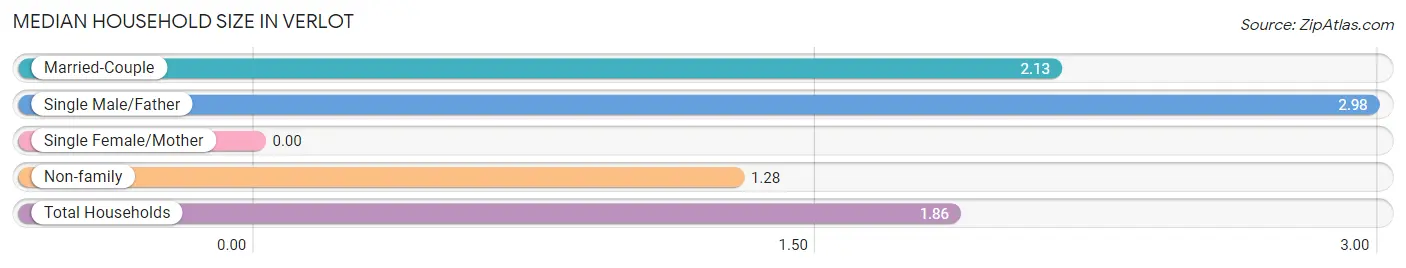
| Household Type | # Households | Household Size |
| Married-Couple | 23 (13.0%) | 2.13 |
| Single Male/Father | 49 (27.7%) | 2.98 |
| Single Female/Mother | 0 (0.0%) | - |
| Non-family | 105 (59.3%) | 1.28 |
| Total Households | 177 (100.0%) | 1.86 |
Household Size by Marriage Status in Verlot
Out of a total of 177 households in Verlot, 72 (40.7%) are family households, while 105 (59.3%) are nonfamily households. The most numerous type of family households are 3-person households, comprising 49, and the most common type of nonfamily households are 1-person households, comprising 89.
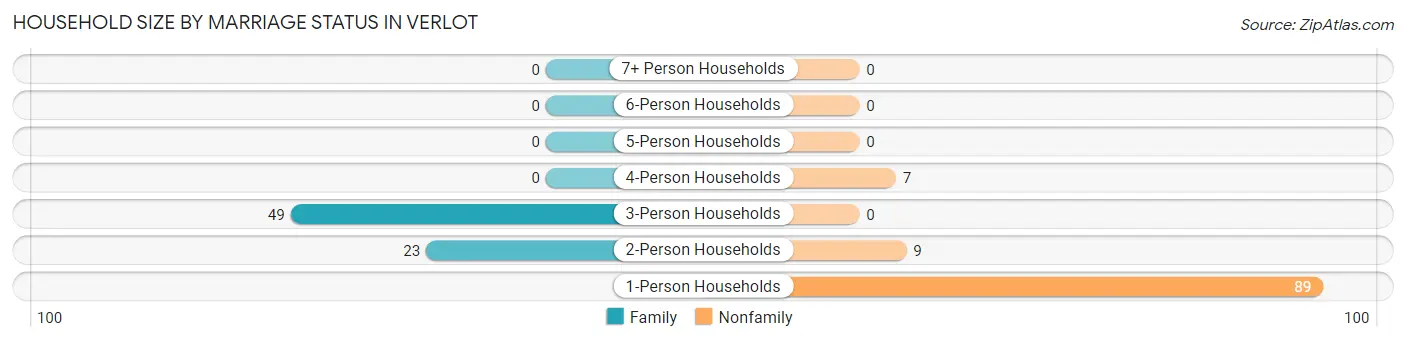
| Household Size | Family Households | Nonfamily Households |
| 1-Person Households | - | 89 (50.3%) |
| 2-Person Households | 23 (13.0%) | 9 (5.1%) |
| 3-Person Households | 49 (27.7%) | 0 (0.0%) |
| 4-Person Households | 0 (0.0%) | 7 (4.0%) |
| 5-Person Households | 0 (0.0%) | 0 (0.0%) |
| 6-Person Households | 0 (0.0%) | 0 (0.0%) |
| 7+ Person Households | 0 (0.0%) | 0 (0.0%) |
| Total | 72 (40.7%) | 105 (59.3%) |
Female Fertility in Verlot
Fertility by Age in Verlot
| Age Bracket | Women with Births | Births / 1,000 Women |
| 15 to 19 years | 0 (0.0%) | 0.0 |
| 20 to 34 years | 0 (0.0%) | 0.0 |
| 35 to 50 years | 0 (0.0%) | 0.0 |
| Total | 0 (0.0%) | 0.0 |
Fertility by Age by Marriage Status in Verlot
| Age Bracket | Married | Unmarried |
| 15 to 19 years | 0 (0.0%) | 0 (0.0%) |
| 20 to 34 years | 0 (0.0%) | 0 (0.0%) |
| 35 to 50 years | 0 (0.0%) | 0 (0.0%) |
| Total | 0 (0.0%) | 0 (0.0%) |
Fertility by Education in Verlot
| Educational Attainment | Women with Births | Births / 1,000 Women |
| Less than High School | 0 (0.0%) | 0.0 |
| High School Diploma | 0 (0.0%) | 0.0 |
| College or Associate's Degree | 0 (0.0%) | 0.0 |
| Bachelor's Degree | 0 (0.0%) | 0.0 |
| Graduate Degree | 0 (0.0%) | 0.0 |
| Total | 0 (0.0%) | 0.0 |
Fertility by Education by Marriage Status in Verlot
| Educational Attainment | Married | Unmarried |
| Less than High School | 0 (0.0%) | 0 (0.0%) |
| High School Diploma | 0 (0.0%) | 0 (0.0%) |
| College or Associate's Degree | 0 (0.0%) | 0 (0.0%) |
| Bachelor's Degree | 0 (0.0%) | 0 (0.0%) |
| Graduate Degree | 0 (0.0%) | 0 (0.0%) |
| Total | 0 (0.0%) | 0 (0.0%) |
Employment Characteristics in Verlot
Employment by Class of Employer in Verlot
Among the 175 employed individuals in Verlot, private company employees (164 | 93.7%), and federal government employees (11 | 6.3%) make up the most common classes of employment.
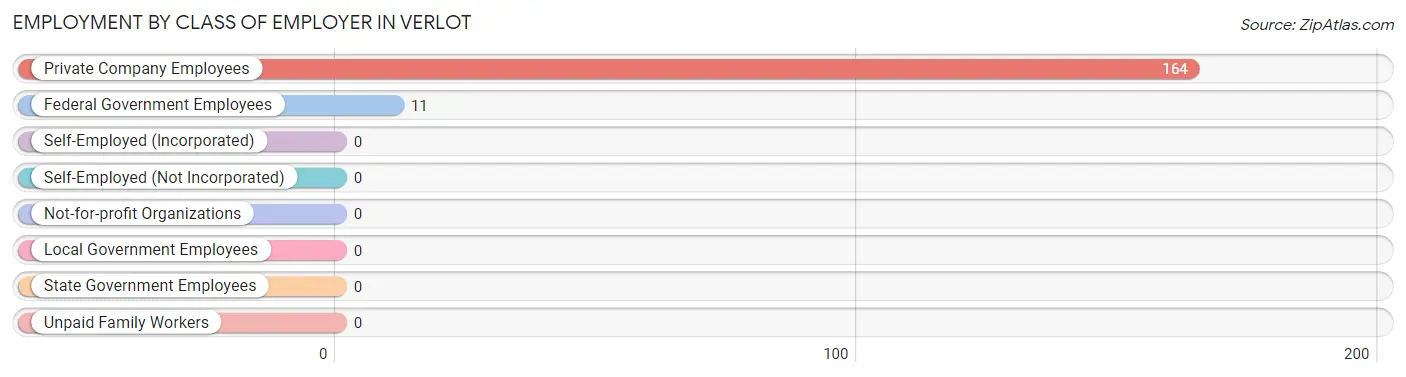
| Employer Class | # Employees | % Employees |
| Private Company Employees | 164 | 93.7% |
| Self-Employed (Incorporated) | 0 | 0.0% |
| Self-Employed (Not Incorporated) | 0 | 0.0% |
| Not-for-profit Organizations | 0 | 0.0% |
| Local Government Employees | 0 | 0.0% |
| State Government Employees | 0 | 0.0% |
| Federal Government Employees | 11 | 6.3% |
| Unpaid Family Workers | 0 | 0.0% |
| Total | 175 | 100.0% |
Employment Status by Age in Verlot
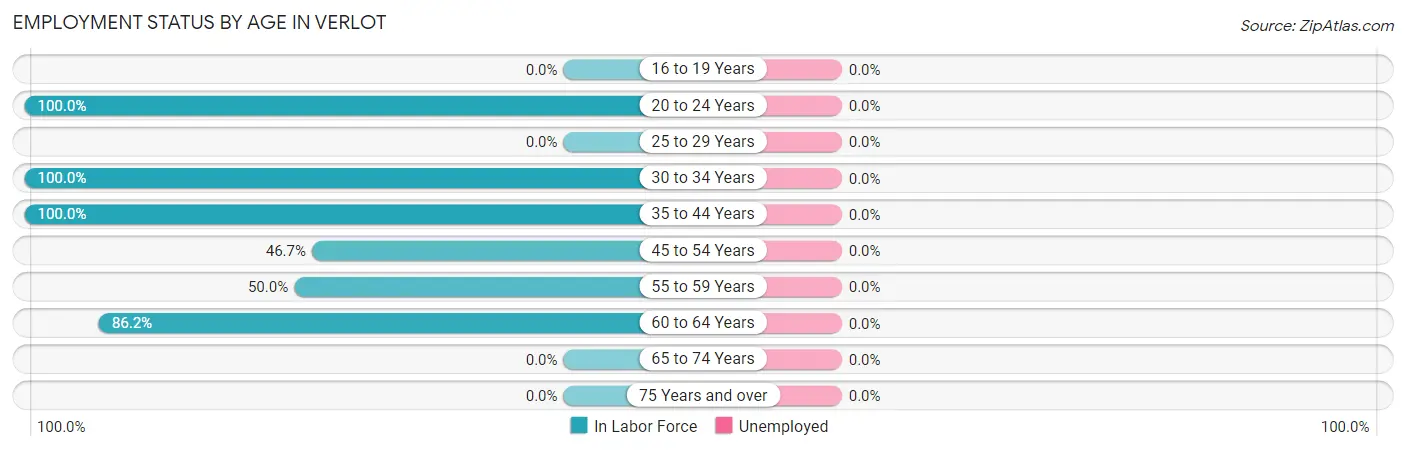
| Age Bracket | In Labor Force | Unemployed |
| 16 to 19 Years | 0 (0.0%) | 0 (0.0%) |
| 20 to 24 Years | 31 (100.0%) | 0 (0.0%) |
| 25 to 29 Years | 0 (0.0%) | 0 (0.0%) |
| 30 to 34 Years | 52 (100.0%) | 0 (0.0%) |
| 35 to 44 Years | 22 (100.0%) | 0 (0.0%) |
| 45 to 54 Years | 7 (46.7%) | 0 (0.0%) |
| 55 to 59 Years | 7 (50.0%) | 0 (0.0%) |
| 60 to 64 Years | 56 (86.2%) | 0 (0.0%) |
| 65 to 74 Years | 0 (0.0%) | 0 (0.0%) |
| 75 Years and over | 0 (0.0%) | 0 (0.0%) |
| Total | 175 (53.2%) | 0 (0.0%) |
Employment Status by Educational Attainment in Verlot
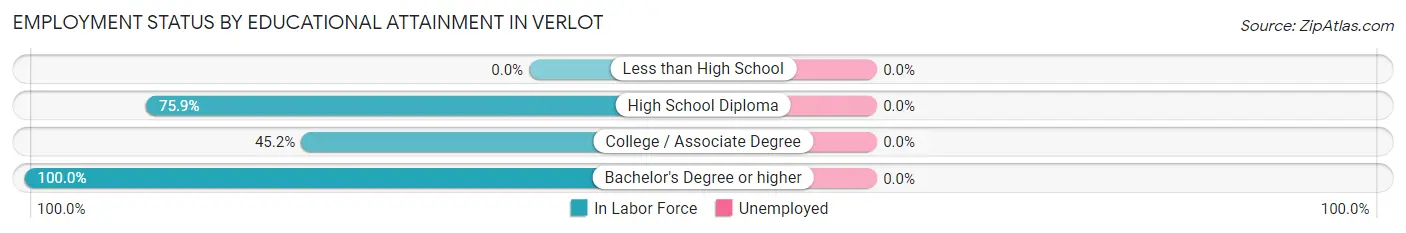
| Educational Attainment | In Labor Force | Unemployed |
| Less than High School | 0 (0.0%) | 0 (0.0%) |
| High School Diploma | 22 (75.9%) | 0 (0.0%) |
| College / Associate Degree | 14 (45.2%) | 0 (0.0%) |
| Bachelor's Degree or higher | 108 (100.0%) | 0 (0.0%) |
| Total | 144 (85.7%) | 0 (0.0%) |
Employment Occupations by Sex in Verlot
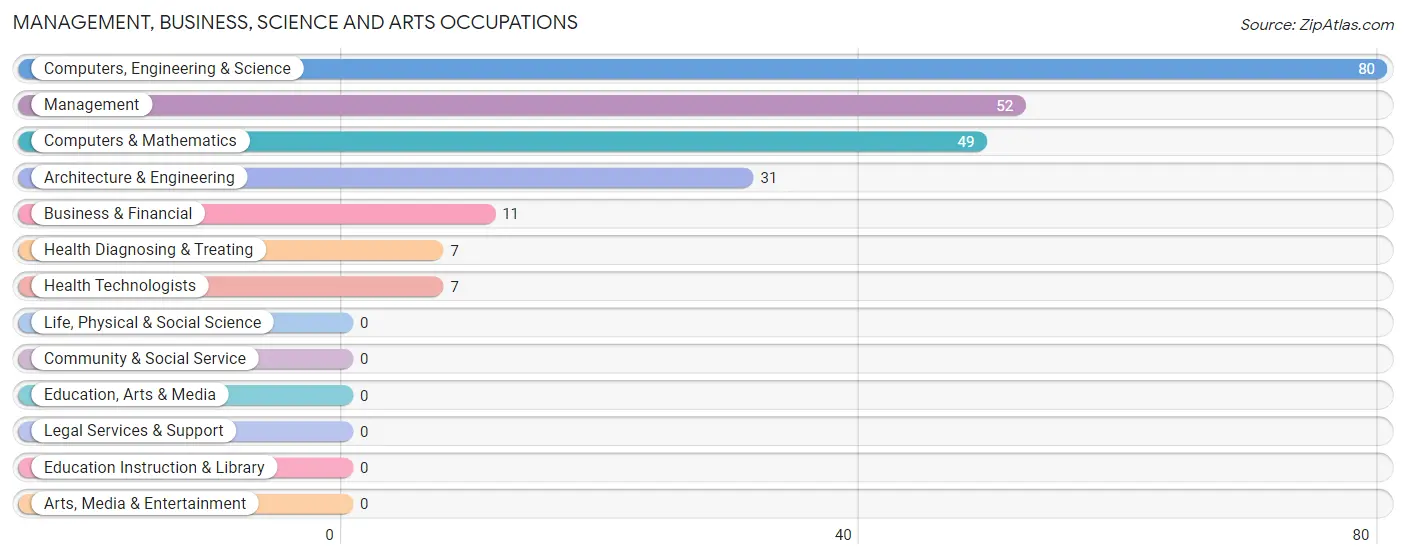
Management, Business, Science and Arts Occupations
The most common Management, Business, Science and Arts occupations in Verlot are Computers, Engineering & Science (80 | 45.7%), Management (52 | 29.7%), Computers & Mathematics (49 | 28.0%), Architecture & Engineering (31 | 17.7%), and Business & Financial (11 | 6.3%).
Management, Business, Science and Arts Occupations by Sex
Within the Management, Business, Science and Arts occupations in Verlot, the most male-oriented occupations are Computers, Engineering & Science (100.0%), Computers & Mathematics (100.0%), and Architecture & Engineering (100.0%), while the most female-oriented occupations are Management (100.0%), Business & Financial (100.0%), and Health Diagnosing & Treating (100.0%).
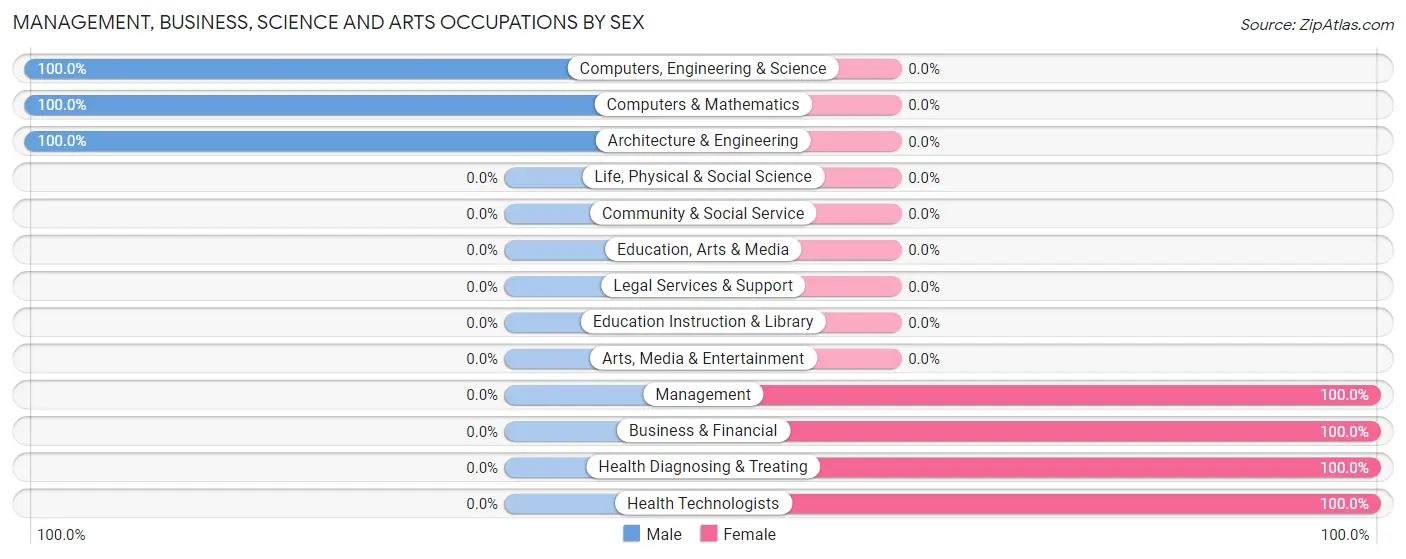
| Occupation | Male | Female |
| Management | 0 (0.0%) | 52 (100.0%) |
| Business & Financial | 0 (0.0%) | 11 (100.0%) |
| Computers, Engineering & Science | 80 (100.0%) | 0 (0.0%) |
| Computers & Mathematics | 49 (100.0%) | 0 (0.0%) |
| Architecture & Engineering | 31 (100.0%) | 0 (0.0%) |
| Life, Physical & Social Science | 0 (0.0%) | 0 (0.0%) |
| Community & Social Service | 0 (0.0%) | 0 (0.0%) |
| Education, Arts & Media | 0 (0.0%) | 0 (0.0%) |
| Legal Services & Support | 0 (0.0%) | 0 (0.0%) |
| Education Instruction & Library | 0 (0.0%) | 0 (0.0%) |
| Arts, Media & Entertainment | 0 (0.0%) | 0 (0.0%) |
| Health Diagnosing & Treating | 0 (0.0%) | 7 (100.0%) |
| Health Technologists | 0 (0.0%) | 7 (100.0%) |
| Total (Category) | 80 (53.3%) | 70 (46.7%) |
| Total (Overall) | 98 (56.0%) | 77 (44.0%) |
Services Occupations
Services Occupations by Sex
| Occupation | Male | Female |
| Healthcare Support | 0 (0.0%) | 0 (0.0%) |
| Security & Protection | 0 (0.0%) | 0 (0.0%) |
| Firefighting & Prevention | 0 (0.0%) | 0 (0.0%) |
| Law Enforcement | 0 (0.0%) | 0 (0.0%) |
| Food Preparation & Serving | 0 (0.0%) | 0 (0.0%) |
| Cleaning & Maintenance | 0 (0.0%) | 0 (0.0%) |
| Personal Care & Service | 0 (0.0%) | 0 (0.0%) |
| Total (Category) | 0 (0.0%) | 0 (0.0%) |
| Total (Overall) | 98 (56.0%) | 77 (44.0%) |
Sales and Office Occupations
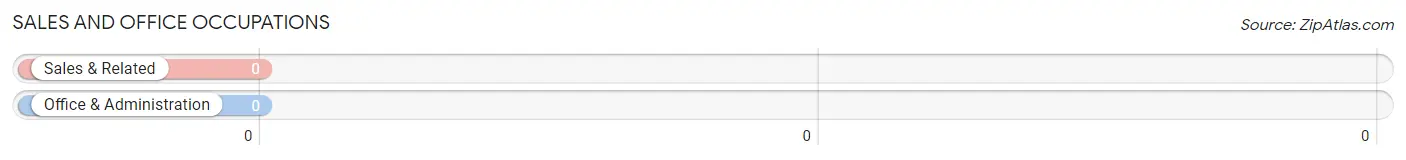
Sales and Office Occupations by Sex
| Occupation | Male | Female |
| Sales & Related | 0 (0.0%) | 0 (0.0%) |
| Office & Administration | 0 (0.0%) | 0 (0.0%) |
| Total (Category) | 0 (0.0%) | 0 (0.0%) |
| Total (Overall) | 98 (56.0%) | 77 (44.0%) |
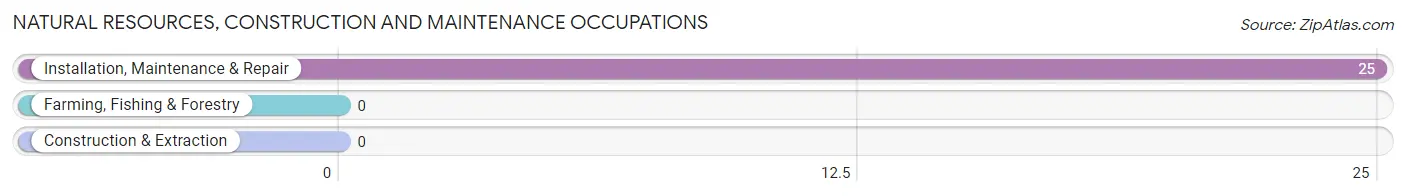
Natural Resources, Construction and Maintenance Occupations
The most common Natural Resources, Construction and Maintenance occupations in Verlot are , and Installation, Maintenance & Repair (25 | 14.3%).
Natural Resources, Construction and Maintenance Occupations by Sex
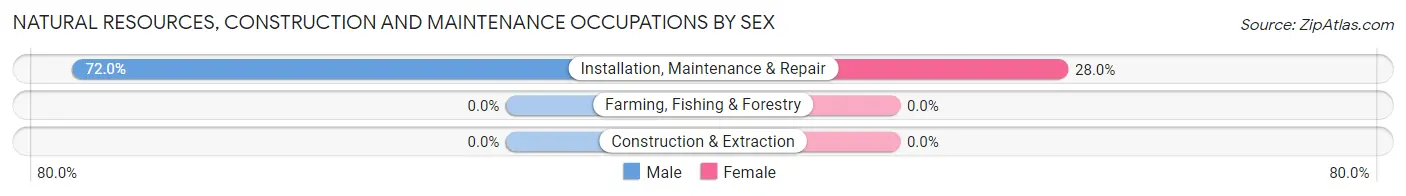
| Occupation | Male | Female |
| Farming, Fishing & Forestry | 0 (0.0%) | 0 (0.0%) |
| Construction & Extraction | 0 (0.0%) | 0 (0.0%) |
| Installation, Maintenance & Repair | 18 (72.0%) | 7 (28.0%) |
| Total (Category) | 18 (72.0%) | 7 (28.0%) |
| Total (Overall) | 98 (56.0%) | 77 (44.0%) |
Production, Transportation and Moving Occupations
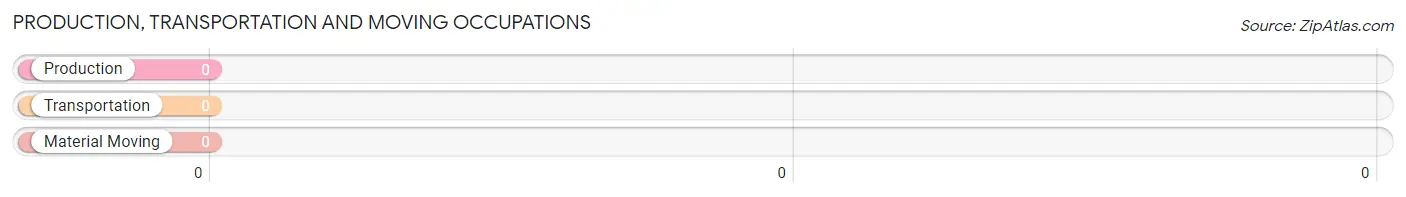
Production, Transportation and Moving Occupations by Sex
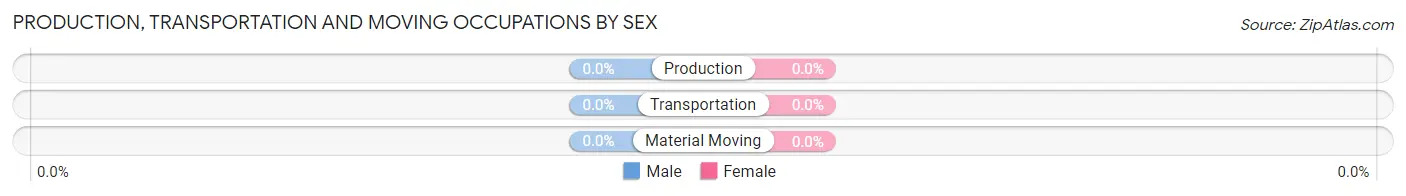
| Occupation | Male | Female |
| Production | 0 (0.0%) | 0 (0.0%) |
| Transportation | 0 (0.0%) | 0 (0.0%) |
| Material Moving | 0 (0.0%) | 0 (0.0%) |
| Total (Category) | 0 (0.0%) | 0 (0.0%) |
| Total (Overall) | 98 (56.0%) | 77 (44.0%) |
Employment Industries by Sex in Verlot
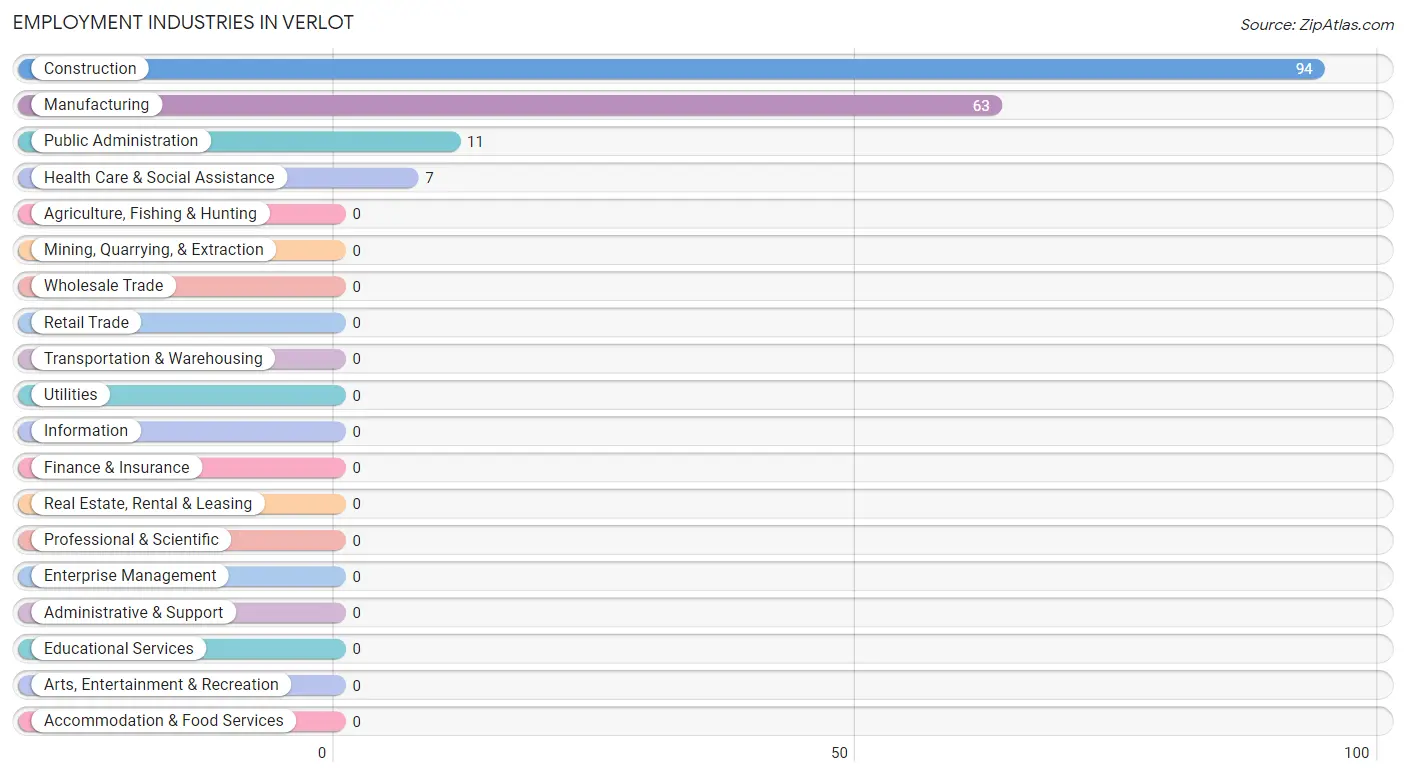
Employment Industries in Verlot
The major employment industries in Verlot include Construction (94 | 53.7%), Manufacturing (63 | 36.0%), Public Administration (11 | 6.3%), and Health Care & Social Assistance (7 | 4.0%).
Employment Industries by Sex in Verlot
The Verlot industries that see more men than women are Public Administration (100.0%), Manufacturing (88.9%), and Construction (33.0%), whereas the industries that tend to have a higher number of women are Health Care & Social Assistance (100.0%), Construction (67.0%), and Manufacturing (11.1%).
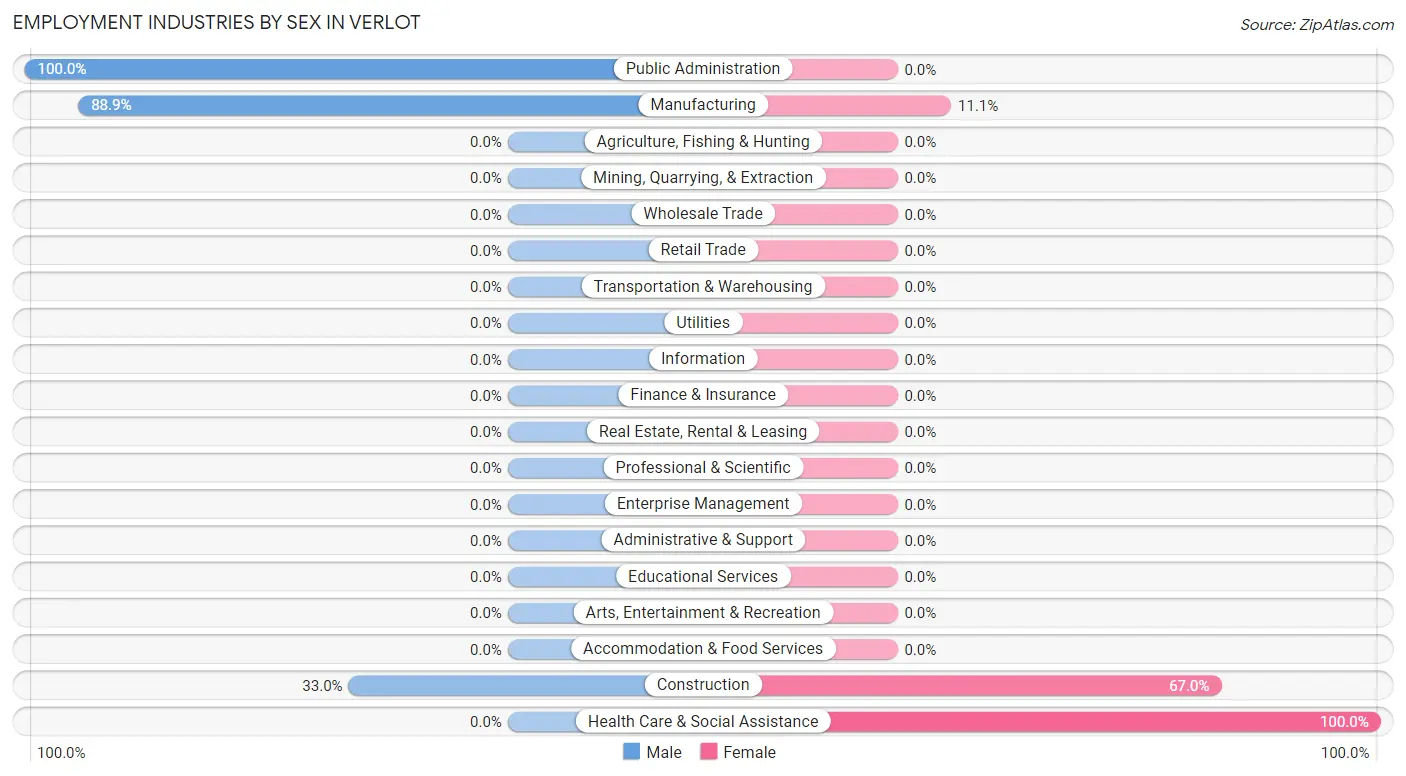
| Industry | Male | Female |
| Agriculture, Fishing & Hunting | 0 (0.0%) | 0 (0.0%) |
| Mining, Quarrying, & Extraction | 0 (0.0%) | 0 (0.0%) |
| Construction | 31 (33.0%) | 63 (67.0%) |
| Manufacturing | 56 (88.9%) | 7 (11.1%) |
| Wholesale Trade | 0 (0.0%) | 0 (0.0%) |
| Retail Trade | 0 (0.0%) | 0 (0.0%) |
| Transportation & Warehousing | 0 (0.0%) | 0 (0.0%) |
| Utilities | 0 (0.0%) | 0 (0.0%) |
| Information | 0 (0.0%) | 0 (0.0%) |
| Finance & Insurance | 0 (0.0%) | 0 (0.0%) |
| Real Estate, Rental & Leasing | 0 (0.0%) | 0 (0.0%) |
| Professional & Scientific | 0 (0.0%) | 0 (0.0%) |
| Enterprise Management | 0 (0.0%) | 0 (0.0%) |
| Administrative & Support | 0 (0.0%) | 0 (0.0%) |
| Educational Services | 0 (0.0%) | 0 (0.0%) |
| Health Care & Social Assistance | 0 (0.0%) | 7 (100.0%) |
| Arts, Entertainment & Recreation | 0 (0.0%) | 0 (0.0%) |
| Accommodation & Food Services | 0 (0.0%) | 0 (0.0%) |
| Public Administration | 11 (100.0%) | 0 (0.0%) |
| Total | 98 (56.0%) | 77 (44.0%) |
Education in Verlot
School Enrollment in Verlot
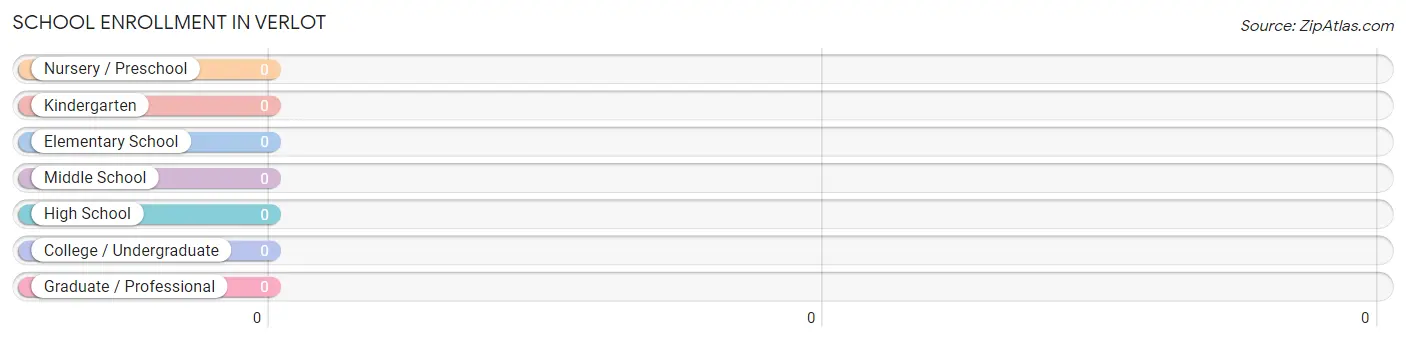
| School Level | # Students | % Students |
| Nursery / Preschool | 0 | 0.0% |
| Kindergarten | 0 | 0.0% |
| Elementary School | 0 | 0.0% |
| Middle School | 0 | 0.0% |
| High School | 0 | 0.0% |
| College / Undergraduate | 0 | 0.0% |
| Graduate / Professional | 0 | 0.0% |
| Total | 0 | 0.0% |
School Enrollment by Age by Funding Source in Verlot
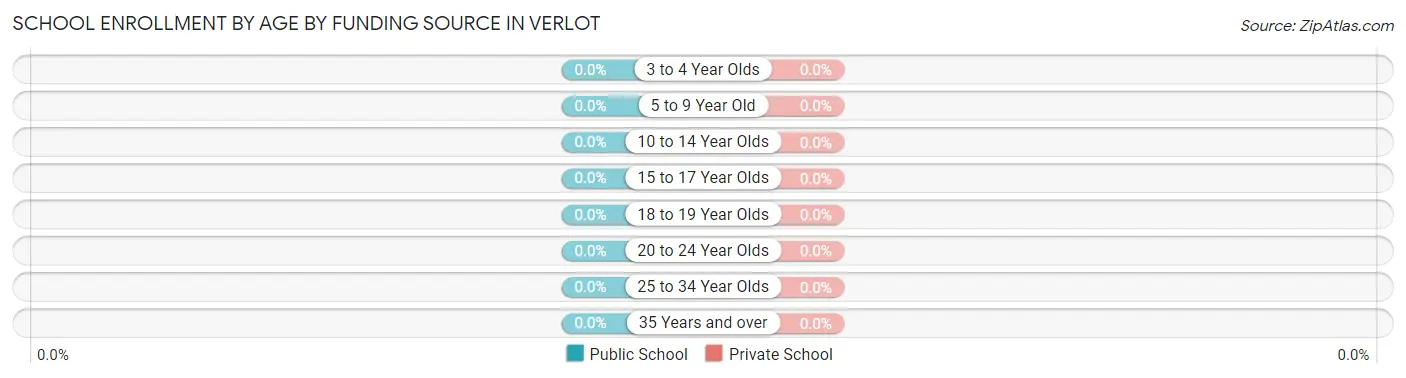
| Age Bracket | Public School | Private School |
| 3 to 4 Year Olds | 0 (0.0%) | 0 (0.0%) |
| 5 to 9 Year Old | 0 (0.0%) | 0 (0.0%) |
| 10 to 14 Year Olds | 0 (0.0%) | 0 (0.0%) |
| 15 to 17 Year Olds | 0 (0.0%) | 0 (0.0%) |
| 18 to 19 Year Olds | 0 (0.0%) | 0 (0.0%) |
| 20 to 24 Year Olds | 0 (0.0%) | 0 (0.0%) |
| 25 to 34 Year Olds | 0 (0.0%) | 0 (0.0%) |
| 35 Years and over | 0 (0.0%) | 0 (0.0%) |
| Total | 0 (0.0%) | 0 (0.0%) |
Educational Attainment by Field of Study in Verlot
Visual & performing arts (52 | 38.5%), social sciences (49 | 36.3%), education (22 | 16.3%), and arts & humanities (12 | 8.9%) are the most common fields of study among 135 individuals in Verlot who have obtained a bachelor's degree or higher.
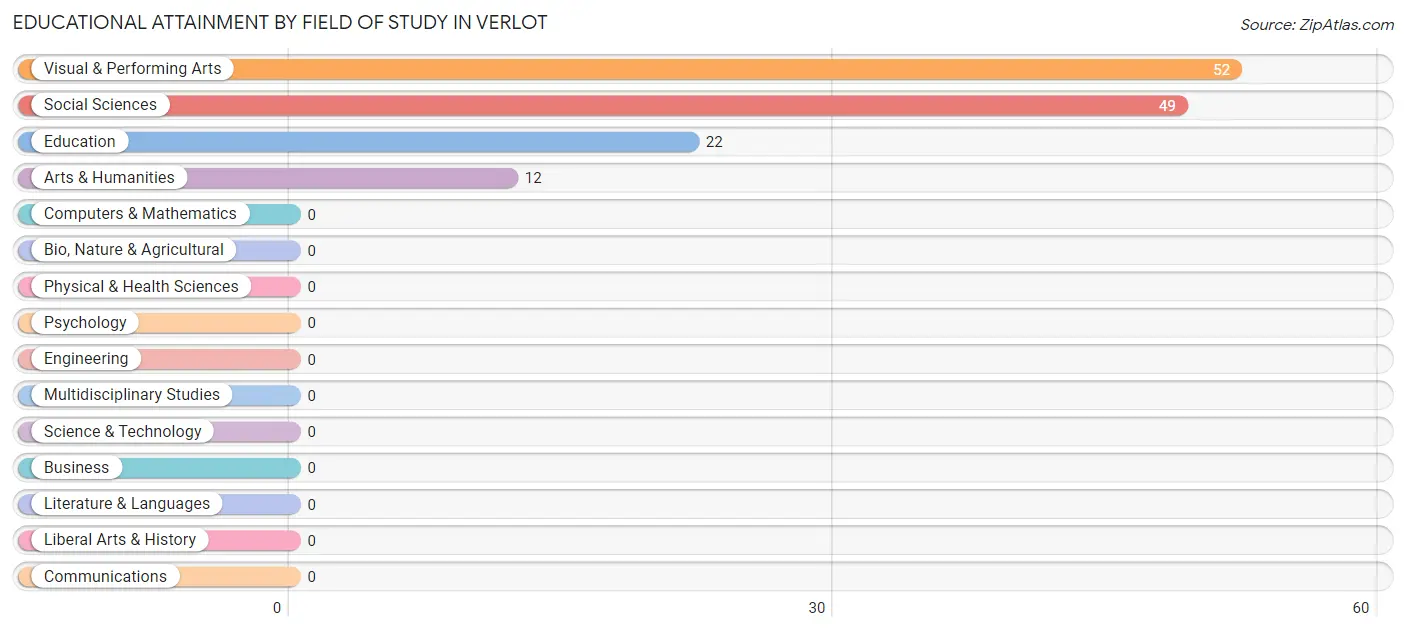
| Field of Study | # Graduates | % Graduates |
| Computers & Mathematics | 0 | 0.0% |
| Bio, Nature & Agricultural | 0 | 0.0% |
| Physical & Health Sciences | 0 | 0.0% |
| Psychology | 0 | 0.0% |
| Social Sciences | 49 | 36.3% |
| Engineering | 0 | 0.0% |
| Multidisciplinary Studies | 0 | 0.0% |
| Science & Technology | 0 | 0.0% |
| Business | 0 | 0.0% |
| Education | 22 | 16.3% |
| Literature & Languages | 0 | 0.0% |
| Liberal Arts & History | 0 | 0.0% |
| Visual & Performing Arts | 52 | 38.5% |
| Communications | 0 | 0.0% |
| Arts & Humanities | 12 | 8.9% |
| Total | 135 | 100.0% |
Transportation & Commute in Verlot
Vehicle Availability by Sex in Verlot
The most prevalent vehicle ownership categories in Verlot are males with 2 vehicles (91, accounting for 92.9%) and females with 2 vehicles (63, making up 118.2%).
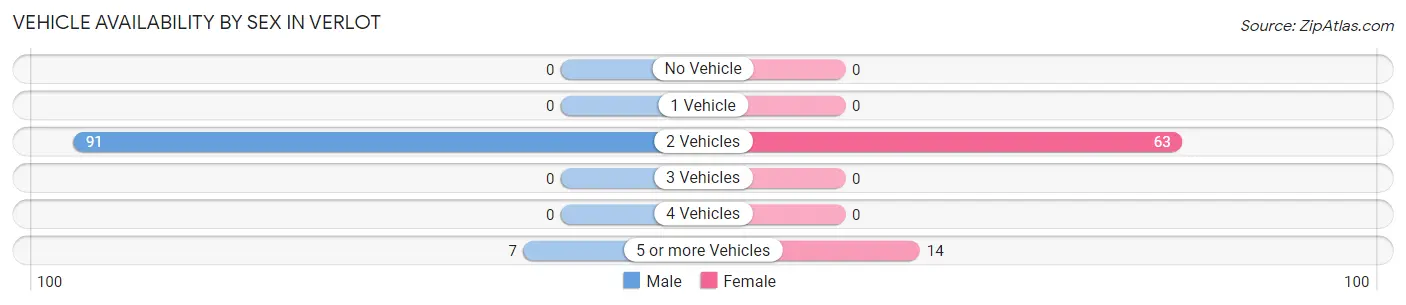
| Vehicles Available | Male | Female |
| No Vehicle | 0 (0.0%) | 0 (0.0%) |
| 1 Vehicle | 0 (0.0%) | 0 (0.0%) |
| 2 Vehicles | 91 (92.9%) | 63 (81.8%) |
| 3 Vehicles | 0 (0.0%) | 0 (0.0%) |
| 4 Vehicles | 0 (0.0%) | 0 (0.0%) |
| 5 or more Vehicles | 7 (7.1%) | 14 (18.2%) |
| Total | 98 (100.0%) | 77 (100.0%) |
Commute Time in Verlot
The most frequently occuring commute durations in Verlot are 30 to 34 minutes (80 commuters, 45.7%), 90 or more minutes (52 commuters, 29.7%), and 60 to 89 minutes (25 commuters, 14.3%).
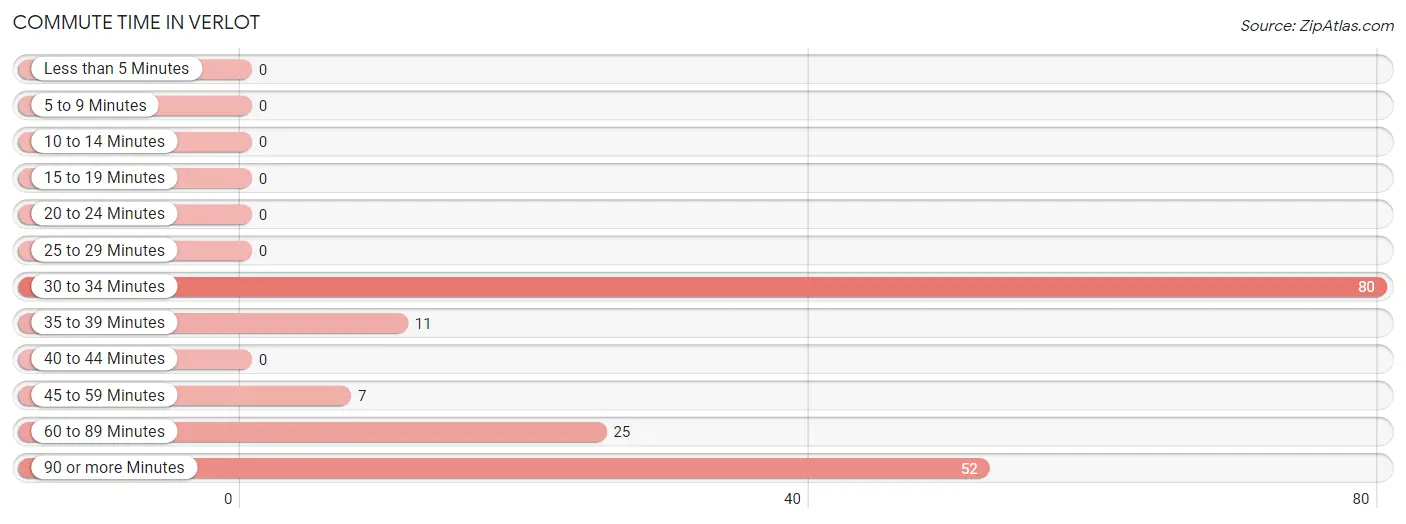
| Commute Time | # Commuters | % Commuters |
| Less than 5 Minutes | 0 | 0.0% |
| 5 to 9 Minutes | 0 | 0.0% |
| 10 to 14 Minutes | 0 | 0.0% |
| 15 to 19 Minutes | 0 | 0.0% |
| 20 to 24 Minutes | 0 | 0.0% |
| 25 to 29 Minutes | 0 | 0.0% |
| 30 to 34 Minutes | 80 | 45.7% |
| 35 to 39 Minutes | 11 | 6.3% |
| 40 to 44 Minutes | 0 | 0.0% |
| 45 to 59 Minutes | 7 | 4.0% |
| 60 to 89 Minutes | 25 | 14.3% |
| 90 or more Minutes | 52 | 29.7% |
Commute Time by Sex in Verlot
The most common commute times in Verlot are 30 to 34 minutes (80 commuters, 81.6%) for males and 90 or more minutes (52 commuters, 67.5%) for females.
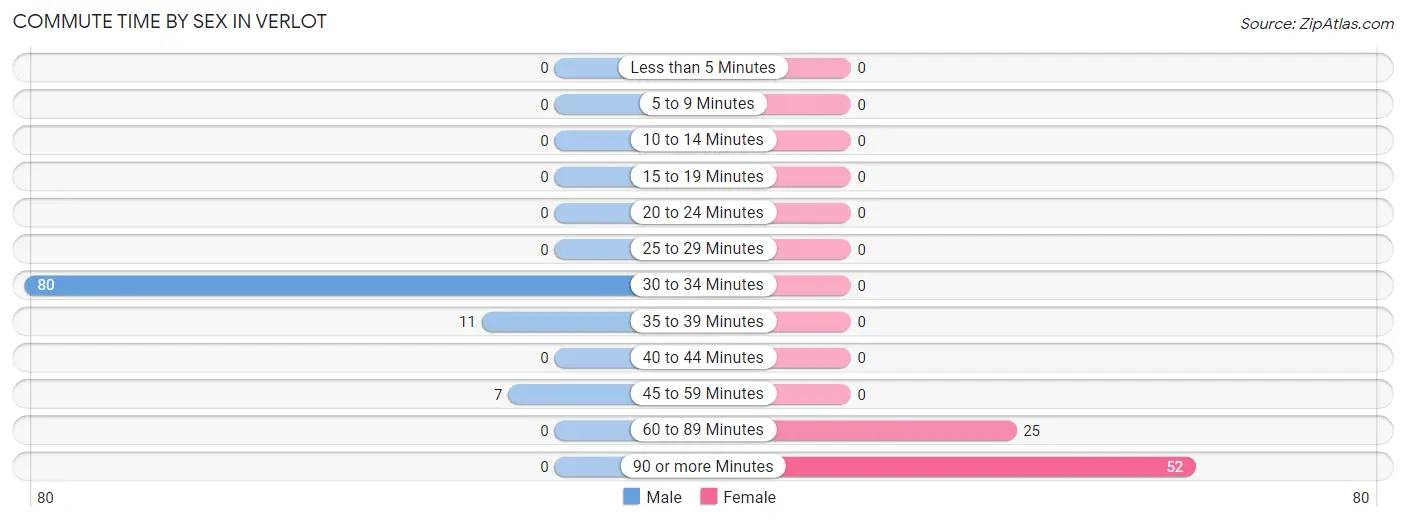
| Commute Time | Male | Female |
| Less than 5 Minutes | 0 (0.0%) | 0 (0.0%) |
| 5 to 9 Minutes | 0 (0.0%) | 0 (0.0%) |
| 10 to 14 Minutes | 0 (0.0%) | 0 (0.0%) |
| 15 to 19 Minutes | 0 (0.0%) | 0 (0.0%) |
| 20 to 24 Minutes | 0 (0.0%) | 0 (0.0%) |
| 25 to 29 Minutes | 0 (0.0%) | 0 (0.0%) |
| 30 to 34 Minutes | 80 (81.6%) | 0 (0.0%) |
| 35 to 39 Minutes | 11 (11.2%) | 0 (0.0%) |
| 40 to 44 Minutes | 0 (0.0%) | 0 (0.0%) |
| 45 to 59 Minutes | 7 (7.1%) | 0 (0.0%) |
| 60 to 89 Minutes | 0 (0.0%) | 25 (32.5%) |
| 90 or more Minutes | 0 (0.0%) | 52 (67.5%) |
Time of Departure to Work by Sex in Verlot
The most frequent times of departure to work in Verlot are 5:30 AM to 5:59 AM (49, 50.0%) for males and 7:00 AM to 7:29 AM (59, 76.6%) for females.
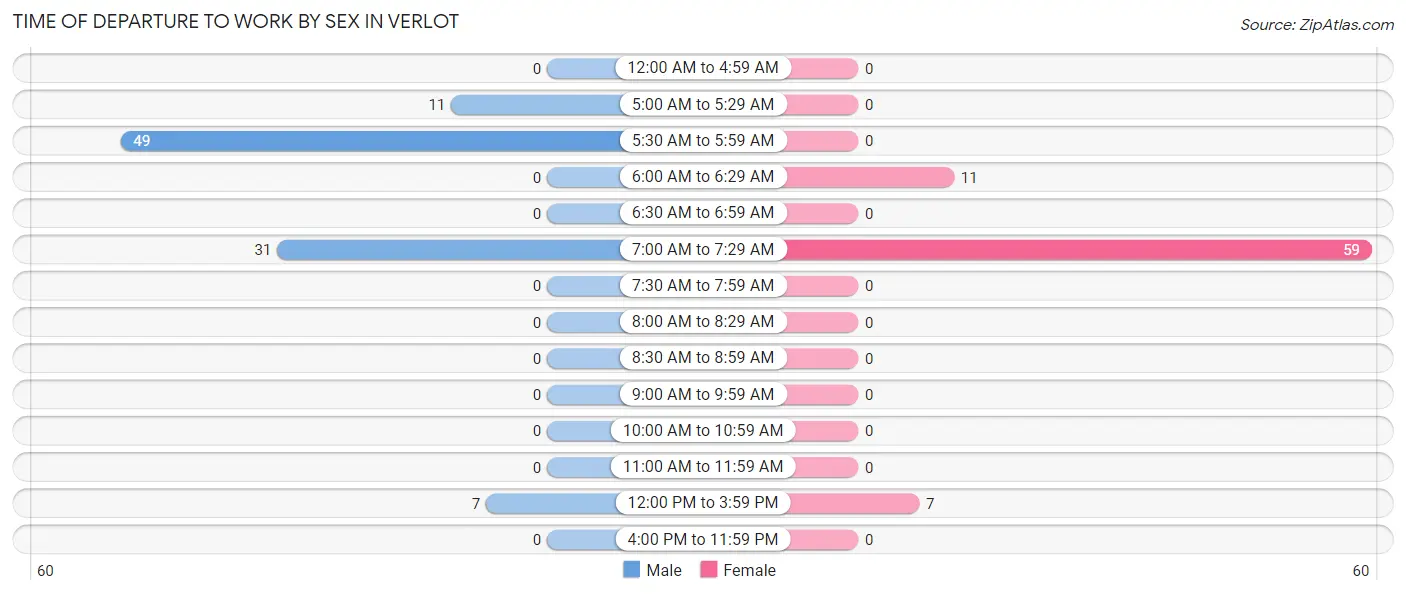
| Time of Departure | Male | Female |
| 12:00 AM to 4:59 AM | 0 (0.0%) | 0 (0.0%) |
| 5:00 AM to 5:29 AM | 11 (11.2%) | 0 (0.0%) |
| 5:30 AM to 5:59 AM | 49 (50.0%) | 0 (0.0%) |
| 6:00 AM to 6:29 AM | 0 (0.0%) | 11 (14.3%) |
| 6:30 AM to 6:59 AM | 0 (0.0%) | 0 (0.0%) |
| 7:00 AM to 7:29 AM | 31 (31.6%) | 59 (76.6%) |
| 7:30 AM to 7:59 AM | 0 (0.0%) | 0 (0.0%) |
| 8:00 AM to 8:29 AM | 0 (0.0%) | 0 (0.0%) |
| 8:30 AM to 8:59 AM | 0 (0.0%) | 0 (0.0%) |
| 9:00 AM to 9:59 AM | 0 (0.0%) | 0 (0.0%) |
| 10:00 AM to 10:59 AM | 0 (0.0%) | 0 (0.0%) |
| 11:00 AM to 11:59 AM | 0 (0.0%) | 0 (0.0%) |
| 12:00 PM to 3:59 PM | 7 (7.1%) | 7 (9.1%) |
| 4:00 PM to 11:59 PM | 0 (0.0%) | 0 (0.0%) |
| Total | 98 (100.0%) | 77 (100.0%) |
Housing Occupancy in Verlot
Occupancy by Ownership in Verlot
Of the total 177 dwellings in Verlot, owner-occupied units account for 177 (100.0%), while renter-occupied units make up 0 (0.0%).
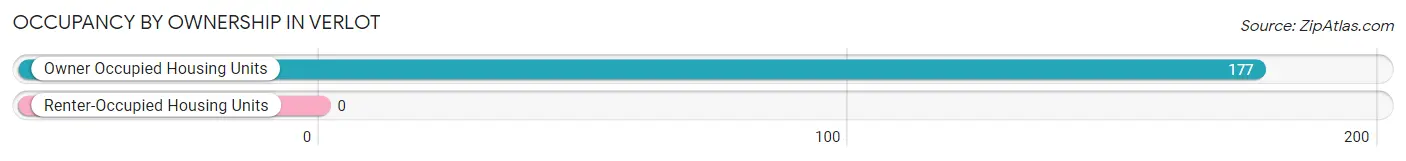
| Occupancy | # Housing Units | % Housing Units |
| Owner Occupied Housing Units | 177 | 100.0% |
| Renter-Occupied Housing Units | 0 | 0.0% |
| Total Occupied Housing Units | 177 | 100.0% |
Occupancy by Household Size in Verlot
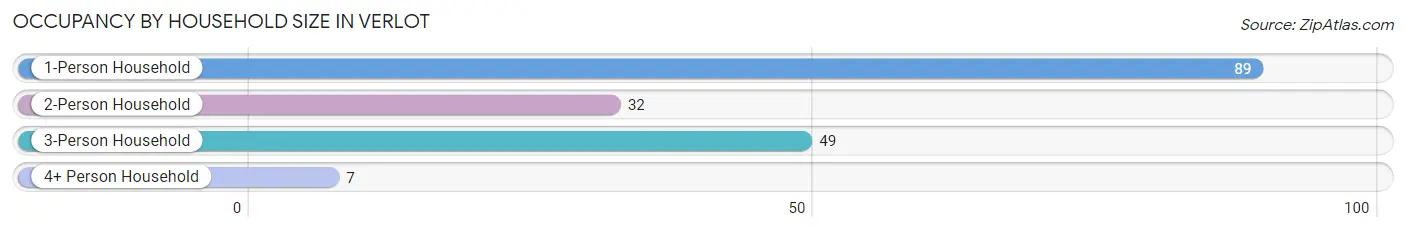
| Household Size | # Housing Units | % Housing Units |
| 1-Person Household | 89 | 50.3% |
| 2-Person Household | 32 | 18.1% |
| 3-Person Household | 49 | 27.7% |
| 4+ Person Household | 7 | 4.0% |
| Total Housing Units | 177 | 100.0% |
Occupancy by Ownership by Household Size in Verlot
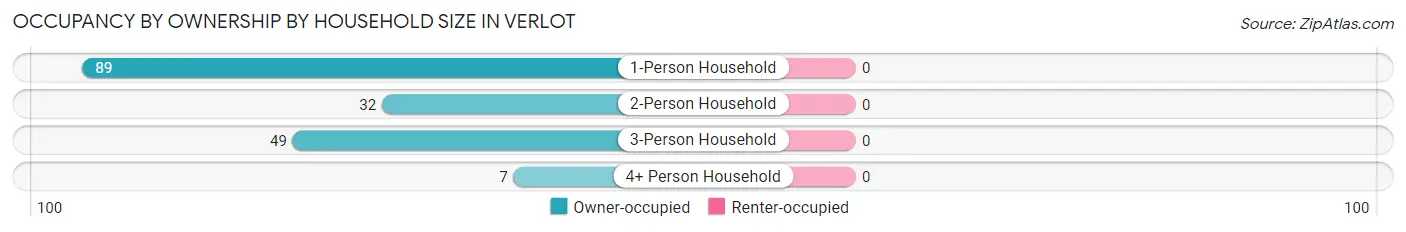
| Household Size | Owner-occupied | Renter-occupied |
| 1-Person Household | 89 (100.0%) | 0 (0.0%) |
| 2-Person Household | 32 (100.0%) | 0 (0.0%) |
| 3-Person Household | 49 (100.0%) | 0 (0.0%) |
| 4+ Person Household | 7 (100.0%) | 0 (0.0%) |
| Total Housing Units | 177 (100.0%) | 0 (0.0%) |
Occupancy by Educational Attainment in Verlot
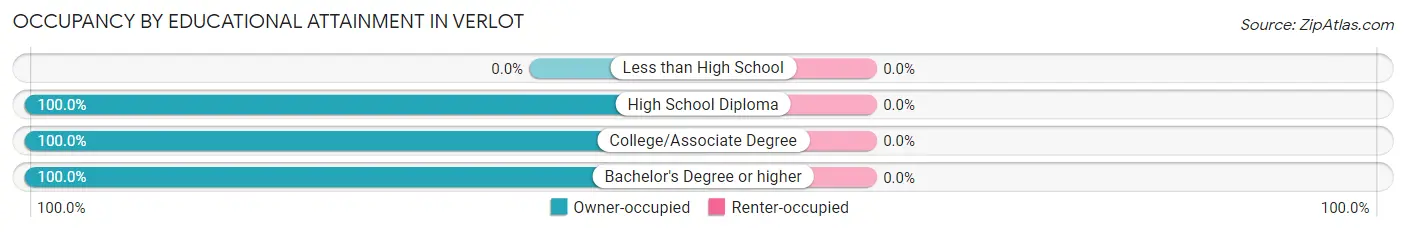
| Household Size | Owner-occupied | Renter-occupied |
| Less than High School | 0 (0.0%) | 0 (0.0%) |
| High School Diploma | 83 (100.0%) | 0 (0.0%) |
| College/Associate Degree | 26 (100.0%) | 0 (0.0%) |
| Bachelor's Degree or higher | 68 (100.0%) | 0 (0.0%) |
Occupancy by Age of Householder in Verlot
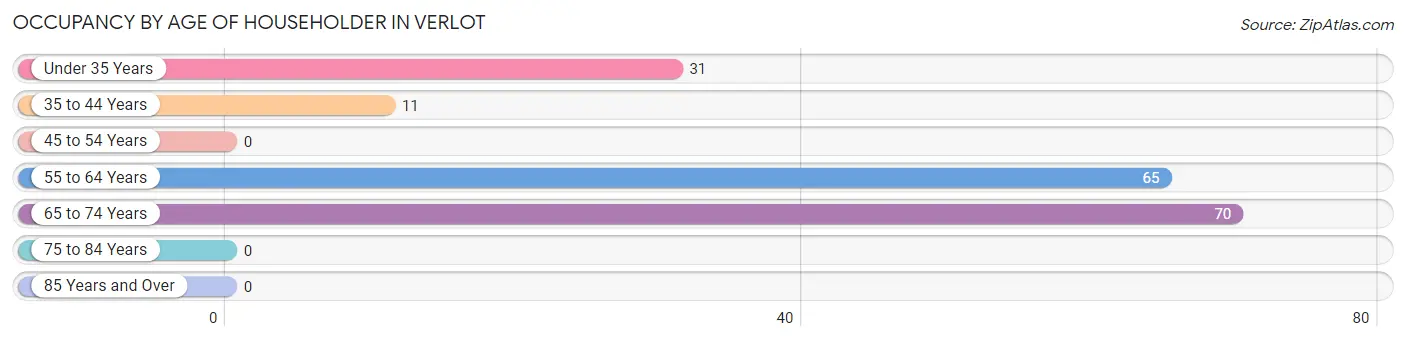
| Age Bracket | # Households | % Households |
| Under 35 Years | 31 | 17.5% |
| 35 to 44 Years | 11 | 6.2% |
| 45 to 54 Years | 0 | 0.0% |
| 55 to 64 Years | 65 | 36.7% |
| 65 to 74 Years | 70 | 39.6% |
| 75 to 84 Years | 0 | 0.0% |
| 85 Years and Over | 0 | 0.0% |
| Total | 177 | 100.0% |
Housing Finances in Verlot
Median Income by Occupancy in Verlot
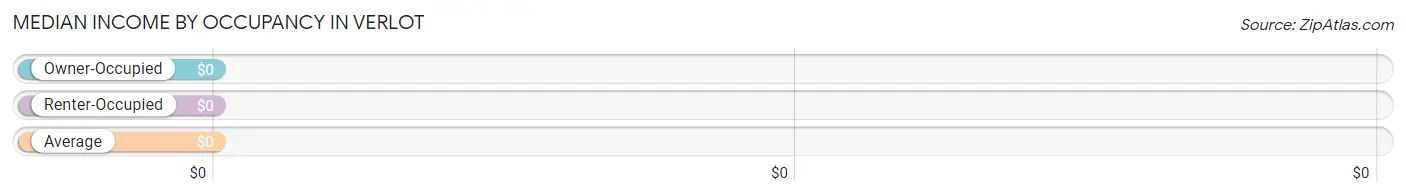
| Occupancy Type | # Households | Median Income |
| Owner-Occupied | 177 (100.0%) | $0 |
| Renter-Occupied | 0 (0.0%) | $0 |
| Average | 177 (100.0%) | $0 |
Occupancy by Householder Income Bracket in Verlot
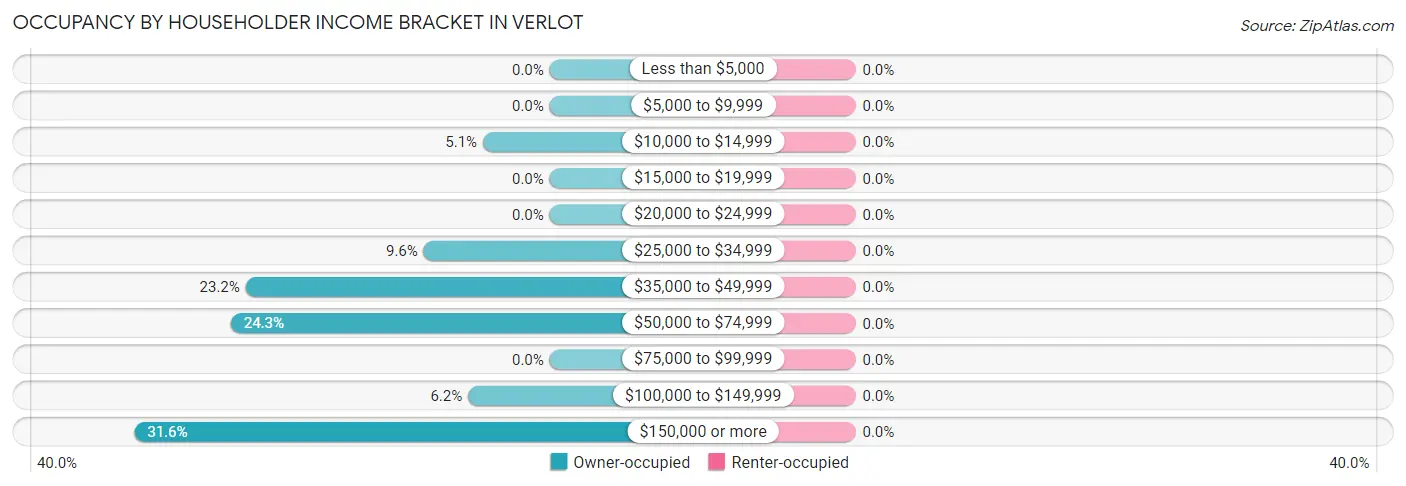
| Income Bracket | Owner-occupied | Renter-occupied |
| Less than $5,000 | 0 (0.0%) | 0 (0.0%) |
| $5,000 to $9,999 | 0 (0.0%) | 0 (0.0%) |
| $10,000 to $14,999 | 9 (5.1%) | 0 (0.0%) |
| $15,000 to $19,999 | 0 (0.0%) | 0 (0.0%) |
| $20,000 to $24,999 | 0 (0.0%) | 0 (0.0%) |
| $25,000 to $34,999 | 17 (9.6%) | 0 (0.0%) |
| $35,000 to $49,999 | 41 (23.2%) | 0 (0.0%) |
| $50,000 to $74,999 | 43 (24.3%) | 0 (0.0%) |
| $75,000 to $99,999 | 0 (0.0%) | 0 (0.0%) |
| $100,000 to $149,999 | 11 (6.2%) | 0 (0.0%) |
| $150,000 or more | 56 (31.6%) | 0 (0.0%) |
| Total | 177 (100.0%) | 0 (0.0%) |
Monthly Housing Cost Tiers in Verlot
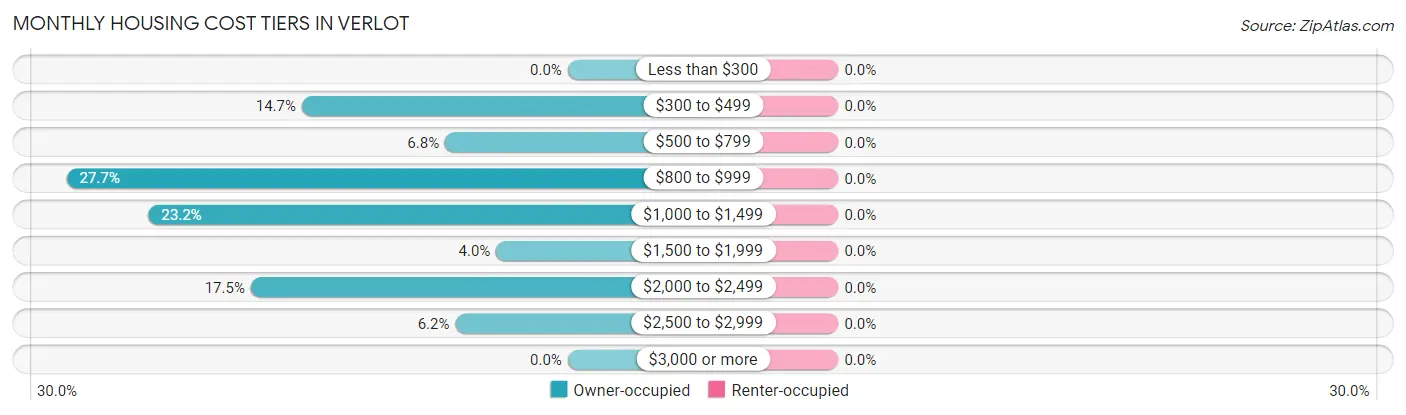
| Monthly Cost | Owner-occupied | Renter-occupied |
| Less than $300 | 0 (0.0%) | 0 (0.0%) |
| $300 to $499 | 26 (14.7%) | 0 (0.0%) |
| $500 to $799 | 12 (6.8%) | 0 (0.0%) |
| $800 to $999 | 49 (27.7%) | 0 (0.0%) |
| $1,000 to $1,499 | 41 (23.2%) | 0 (0.0%) |
| $1,500 to $1,999 | 7 (4.0%) | 0 (0.0%) |
| $2,000 to $2,499 | 31 (17.5%) | 0 (0.0%) |
| $2,500 to $2,999 | 11 (6.2%) | 0 (0.0%) |
| $3,000 or more | 0 (0.0%) | 0 (0.0%) |
| Total | 177 (100.0%) | 0 (0.0%) |
Physical Housing Characteristics in Verlot
Housing Structures in Verlot
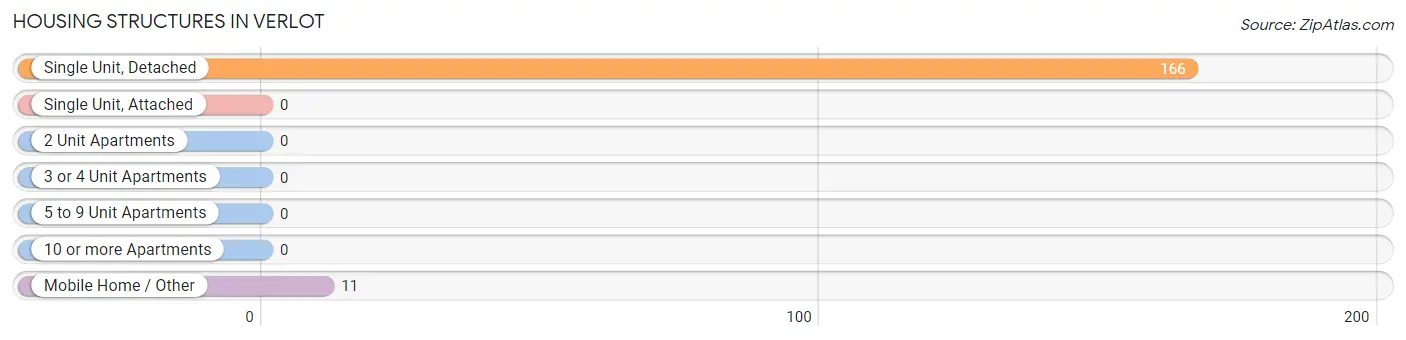
| Structure Type | # Housing Units | % Housing Units |
| Single Unit, Detached | 166 | 93.8% |
| Single Unit, Attached | 0 | 0.0% |
| 2 Unit Apartments | 0 | 0.0% |
| 3 or 4 Unit Apartments | 0 | 0.0% |
| 5 to 9 Unit Apartments | 0 | 0.0% |
| 10 or more Apartments | 0 | 0.0% |
| Mobile Home / Other | 11 | 6.2% |
| Total | 177 | 100.0% |
Housing Structures by Occupancy in Verlot
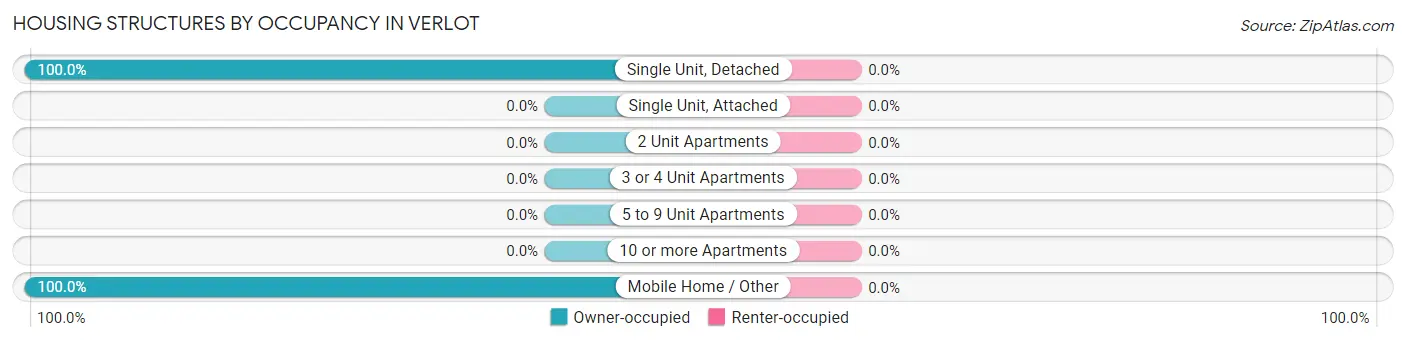
| Structure Type | Owner-occupied | Renter-occupied |
| Single Unit, Detached | 166 (100.0%) | 0 (0.0%) |
| Single Unit, Attached | 0 (0.0%) | 0 (0.0%) |
| 2 Unit Apartments | 0 (0.0%) | 0 (0.0%) |
| 3 or 4 Unit Apartments | 0 (0.0%) | 0 (0.0%) |
| 5 to 9 Unit Apartments | 0 (0.0%) | 0 (0.0%) |
| 10 or more Apartments | 0 (0.0%) | 0 (0.0%) |
| Mobile Home / Other | 11 (100.0%) | 0 (0.0%) |
| Total | 177 (100.0%) | 0 (0.0%) |
Housing Structures by Number of Rooms in Verlot
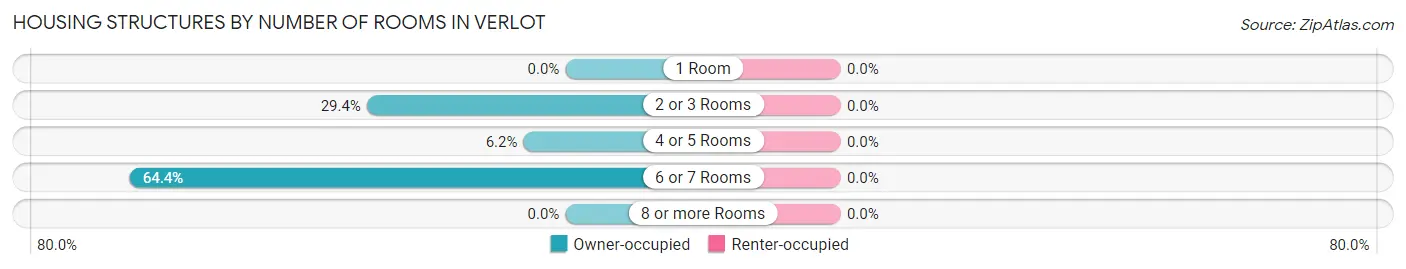
| Number of Rooms | Owner-occupied | Renter-occupied |
| 1 Room | 0 (0.0%) | 0 (0.0%) |
| 2 or 3 Rooms | 52 (29.4%) | 0 (0.0%) |
| 4 or 5 Rooms | 11 (6.2%) | 0 (0.0%) |
| 6 or 7 Rooms | 114 (64.4%) | 0 (0.0%) |
| 8 or more Rooms | 0 (0.0%) | 0 (0.0%) |
| Total | 177 (100.0%) | 0 (0.0%) |
Housing Structure by Heating Type in Verlot
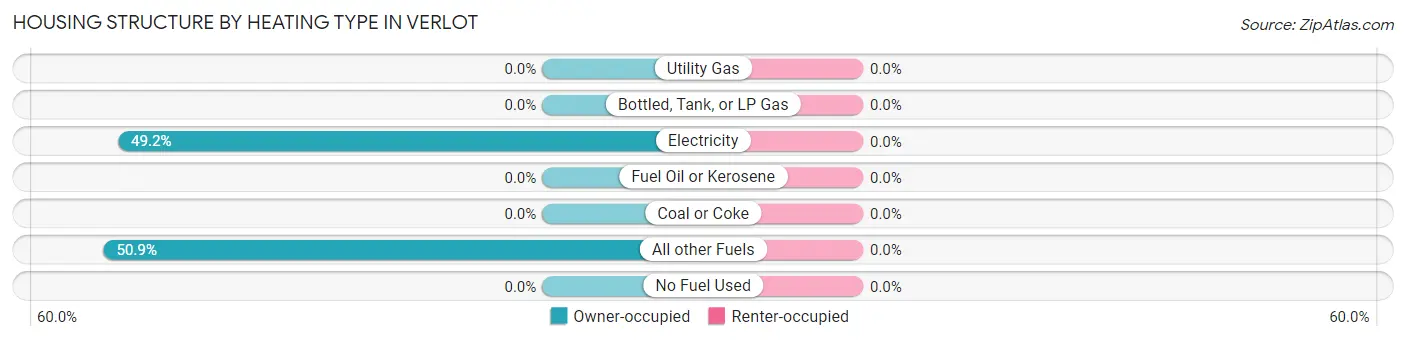
| Heating Type | Owner-occupied | Renter-occupied |
| Utility Gas | 0 (0.0%) | 0 (0.0%) |
| Bottled, Tank, or LP Gas | 0 (0.0%) | 0 (0.0%) |
| Electricity | 87 (49.1%) | 0 (0.0%) |
| Fuel Oil or Kerosene | 0 (0.0%) | 0 (0.0%) |
| Coal or Coke | 0 (0.0%) | 0 (0.0%) |
| All other Fuels | 90 (50.8%) | 0 (0.0%) |
| No Fuel Used | 0 (0.0%) | 0 (0.0%) |
| Total | 177 (100.0%) | 0 (0.0%) |
Household Vehicle Usage in Verlot
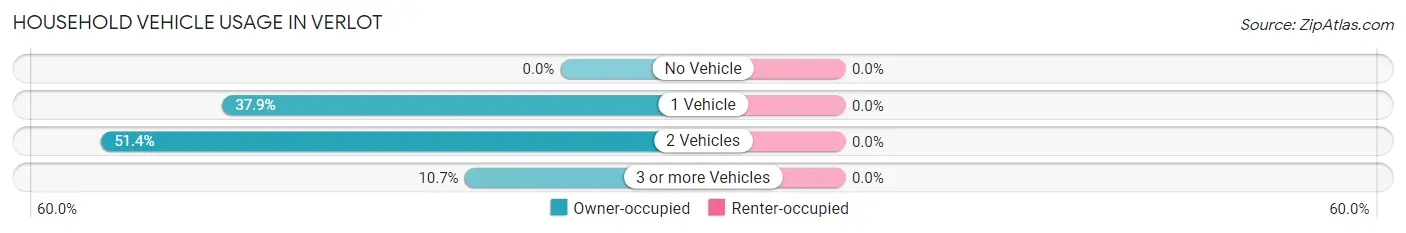
| Vehicles per Household | Owner-occupied | Renter-occupied |
| No Vehicle | 0 (0.0%) | 0 (0.0%) |
| 1 Vehicle | 67 (37.9%) | 0 (0.0%) |
| 2 Vehicles | 91 (51.4%) | 0 (0.0%) |
| 3 or more Vehicles | 19 (10.7%) | 0 (0.0%) |
| Total | 177 (100.0%) | 0 (0.0%) |
Real Estate & Mortgages in Verlot
Real Estate and Mortgage Overview in Verlot
| Characteristic | Without Mortgage | With Mortgage |
| Housing Units | 128 | 49 |
| Median Property Value | - | - |
| Median Household Income | - | - |
| Monthly Housing Costs | $953 | $0 |
| Real Estate Taxes | $3,634 | $0 |
Property Value by Mortgage Status in Verlot
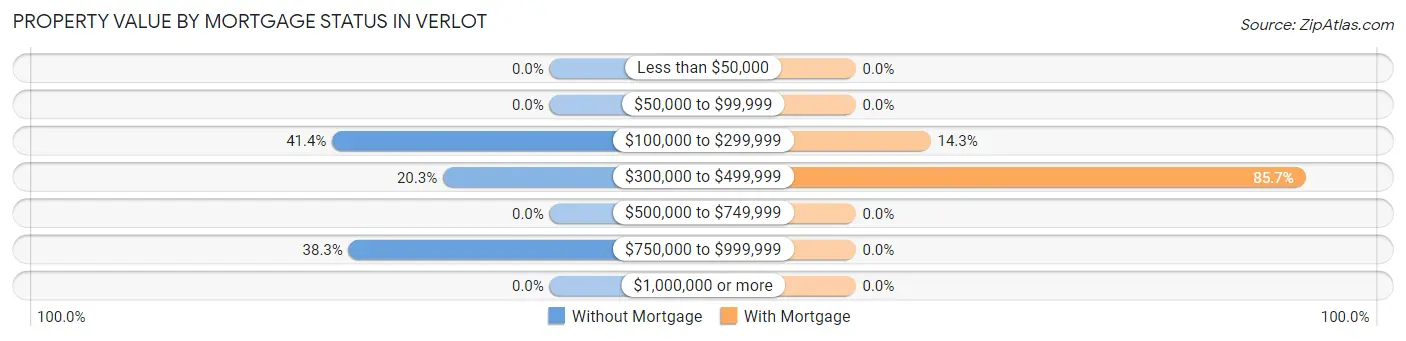
| Property Value | Without Mortgage | With Mortgage |
| Less than $50,000 | 0 (0.0%) | 0 (0.0%) |
| $50,000 to $99,999 | 0 (0.0%) | 0 (0.0%) |
| $100,000 to $299,999 | 53 (41.4%) | 7 (14.3%) |
| $300,000 to $499,999 | 26 (20.3%) | 42 (85.7%) |
| $500,000 to $749,999 | 0 (0.0%) | 0 (0.0%) |
| $750,000 to $999,999 | 49 (38.3%) | 0 (0.0%) |
| $1,000,000 or more | 0 (0.0%) | 0 (0.0%) |
| Total | 128 (100.0%) | 49 (100.0%) |
Household Income by Mortgage Status in Verlot
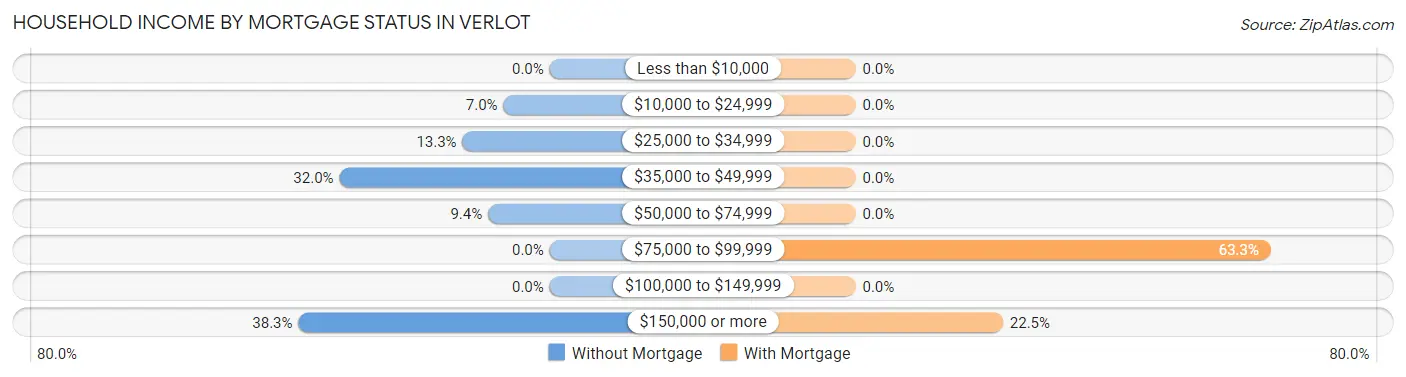
| Household Income | Without Mortgage | With Mortgage |
| Less than $10,000 | 0 (0.0%) | 0 (0.0%) |
| $10,000 to $24,999 | 9 (7.0%) | 0 (0.0%) |
| $25,000 to $34,999 | 17 (13.3%) | 0 (0.0%) |
| $35,000 to $49,999 | 41 (32.0%) | 0 (0.0%) |
| $50,000 to $74,999 | 12 (9.4%) | 0 (0.0%) |
| $75,000 to $99,999 | 0 (0.0%) | 31 (63.3%) |
| $100,000 to $149,999 | 0 (0.0%) | 0 (0.0%) |
| $150,000 or more | 49 (38.3%) | 11 (22.5%) |
| Total | 128 (100.0%) | 49 (100.0%) |
Property Value to Household Income Ratio in Verlot
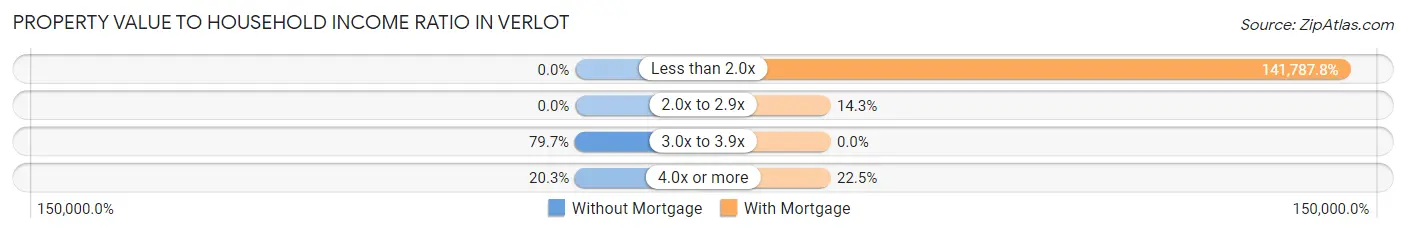
| Value-to-Income Ratio | Without Mortgage | With Mortgage |
| Less than 2.0x | 0 (0.0%) | 69,476 (141,787.8%) |
| 2.0x to 2.9x | 0 (0.0%) | 7 (14.3%) |
| 3.0x to 3.9x | 102 (79.7%) | 0 (0.0%) |
| 4.0x or more | 26 (20.3%) | 11 (22.5%) |
| Total | 128 (100.0%) | 49 (100.0%) |
Real Estate Taxes by Mortgage Status in Verlot
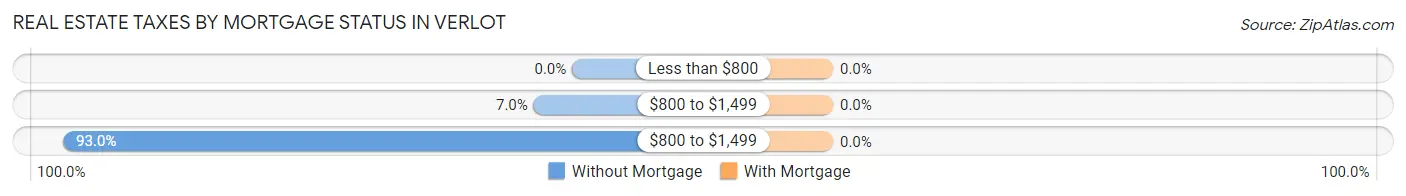
| Property Taxes | Without Mortgage | With Mortgage |
| Less than $800 | 0 (0.0%) | 0 (0.0%) |
| $800 to $1,499 | 9 (7.0%) | 0 (0.0%) |
| $800 to $1,499 | 119 (93.0%) | 0 (0.0%) |
| Total | 128 (100.0%) | 49 (100.0%) |
Health & Disability in Verlot
Health Insurance Coverage by Age in Verlot
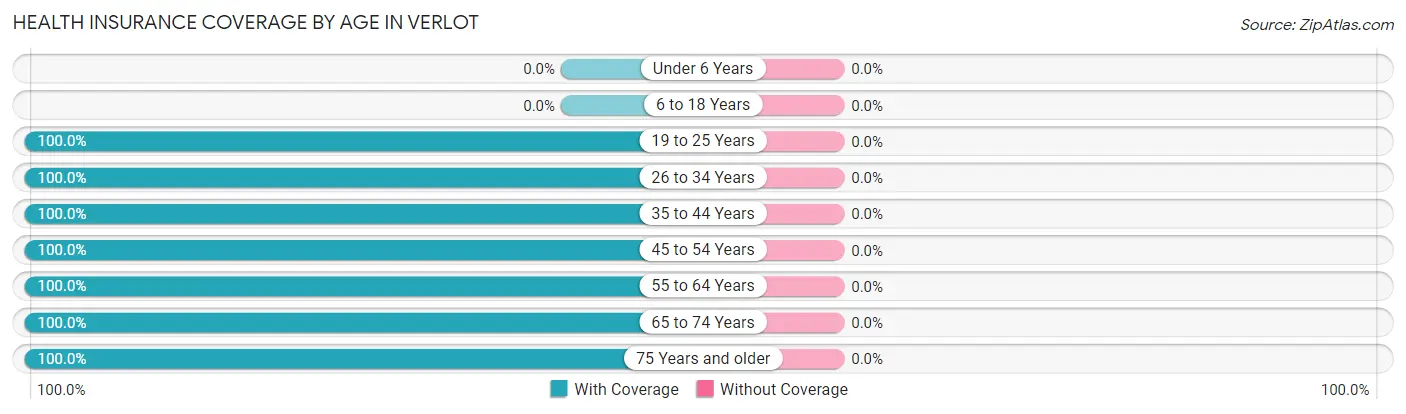
| Age Bracket | With Coverage | Without Coverage |
| Under 6 Years | 0 (0.0%) | 0 (0.0%) |
| 6 to 18 Years | 0 (0.0%) | 0 (0.0%) |
| 19 to 25 Years | 31 (100.0%) | 0 (0.0%) |
| 26 to 34 Years | 52 (100.0%) | 0 (0.0%) |
| 35 to 44 Years | 22 (100.0%) | 0 (0.0%) |
| 45 to 54 Years | 15 (100.0%) | 0 (0.0%) |
| 55 to 64 Years | 79 (100.0%) | 0 (0.0%) |
| 65 to 74 Years | 85 (100.0%) | 0 (0.0%) |
| 75 Years and older | 45 (100.0%) | 0 (0.0%) |
| Total | 329 (100.0%) | 0 (0.0%) |
Health Insurance Coverage by Citizenship Status in Verlot
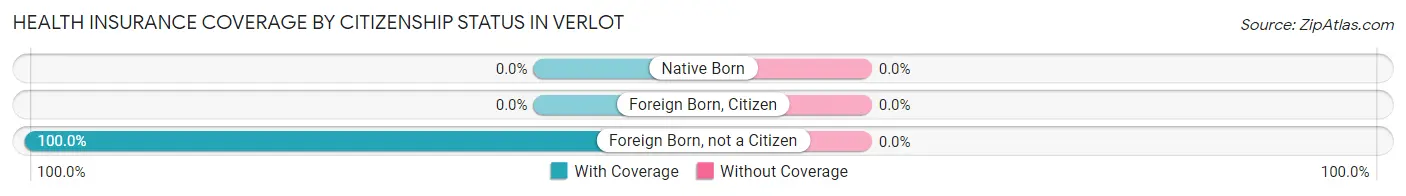
| Citizenship Status | With Coverage | Without Coverage |
| Native Born | 0 (0.0%) | 0 (0.0%) |
| Foreign Born, Citizen | 0 (0.0%) | 0 (0.0%) |
| Foreign Born, not a Citizen | 31 (100.0%) | 0 (0.0%) |
Health Insurance Coverage by Household Income in Verlot
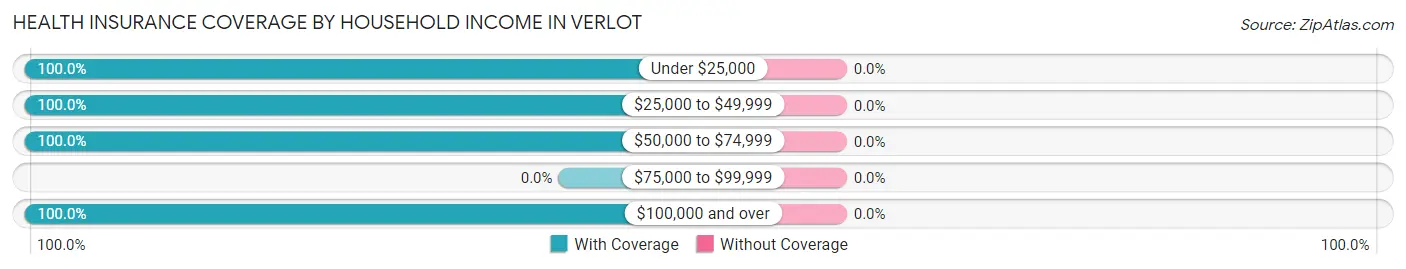
| Household Income | With Coverage | Without Coverage |
| Under $25,000 | 17 (100.0%) | 0 (0.0%) |
| $25,000 to $49,999 | 58 (100.0%) | 0 (0.0%) |
| $50,000 to $74,999 | 58 (100.0%) | 0 (0.0%) |
| $75,000 to $99,999 | 0 (0.0%) | 0 (0.0%) |
| $100,000 and over | 196 (100.0%) | 0 (0.0%) |
Public vs Private Health Insurance Coverage by Age in Verlot
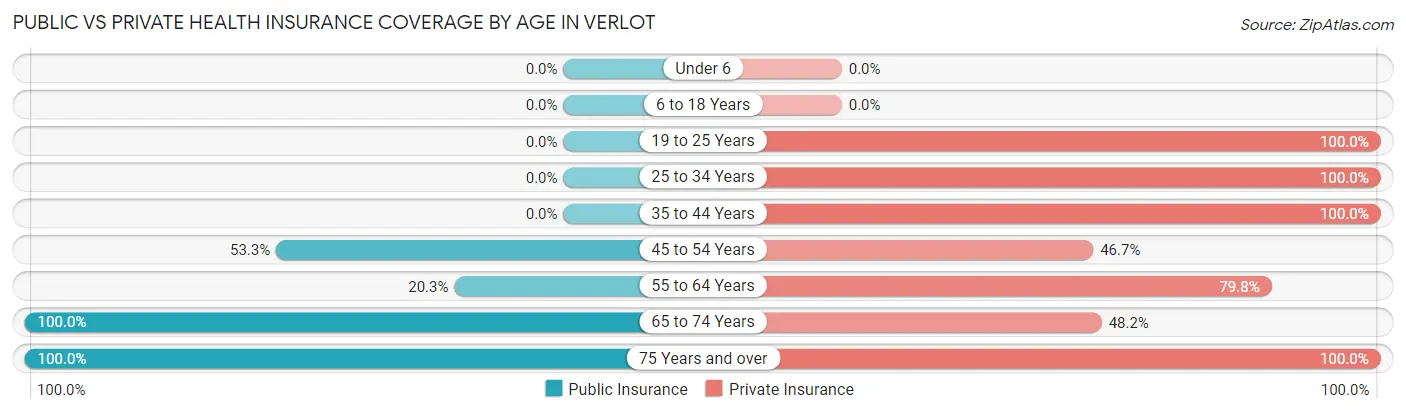
| Age Bracket | Public Insurance | Private Insurance |
| Under 6 | 0 (0.0%) | 0 (0.0%) |
| 6 to 18 Years | 0 (0.0%) | 0 (0.0%) |
| 19 to 25 Years | 0 (0.0%) | 31 (100.0%) |
| 25 to 34 Years | 0 (0.0%) | 52 (100.0%) |
| 35 to 44 Years | 0 (0.0%) | 22 (100.0%) |
| 45 to 54 Years | 8 (53.3%) | 7 (46.7%) |
| 55 to 64 Years | 16 (20.3%) | 63 (79.7%) |
| 65 to 74 Years | 85 (100.0%) | 41 (48.2%) |
| 75 Years and over | 45 (100.0%) | 45 (100.0%) |
| Total | 154 (46.8%) | 261 (79.3%) |
Disability Status by Sex by Age in Verlot
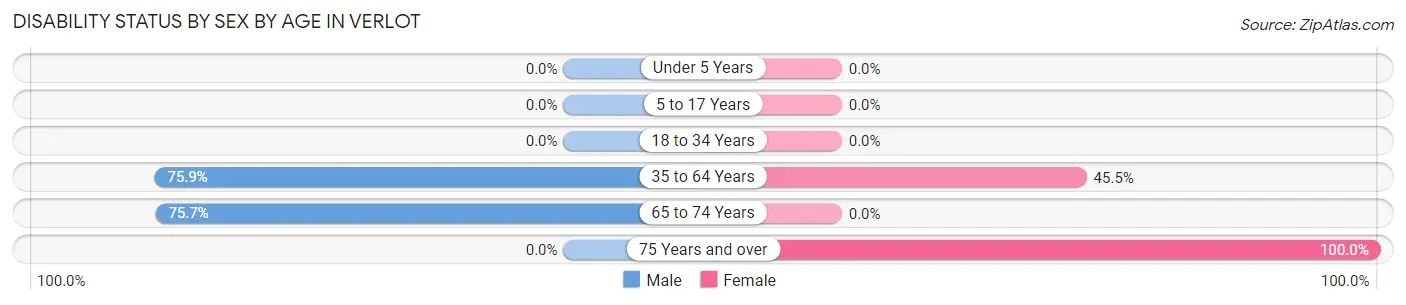
| Age Bracket | Male | Female |
| Under 5 Years | 0 (0.0%) | 0 (0.0%) |
| 5 to 17 Years | 0 (0.0%) | 0 (0.0%) |
| 18 to 34 Years | 0 (0.0%) | 0 (0.0%) |
| 35 to 64 Years | 63 (75.9%) | 15 (45.5%) |
| 65 to 74 Years | 53 (75.7%) | 0 (0.0%) |
| 75 Years and over | 0 (0.0%) | 45 (100.0%) |
Disability Class by Sex by Age in Verlot
Disability Class: Hearing Difficulty
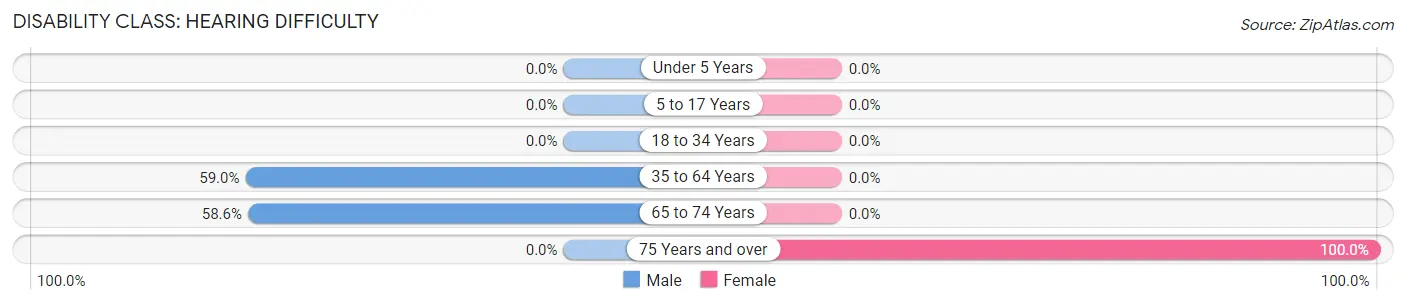
| Age Bracket | Male | Female |
| Under 5 Years | 0 (0.0%) | 0 (0.0%) |
| 5 to 17 Years | 0 (0.0%) | 0 (0.0%) |
| 18 to 34 Years | 0 (0.0%) | 0 (0.0%) |
| 35 to 64 Years | 49 (59.0%) | 0 (0.0%) |
| 65 to 74 Years | 41 (58.6%) | 0 (0.0%) |
| 75 Years and over | 0 (0.0%) | 45 (100.0%) |
Disability Class: Vision Difficulty
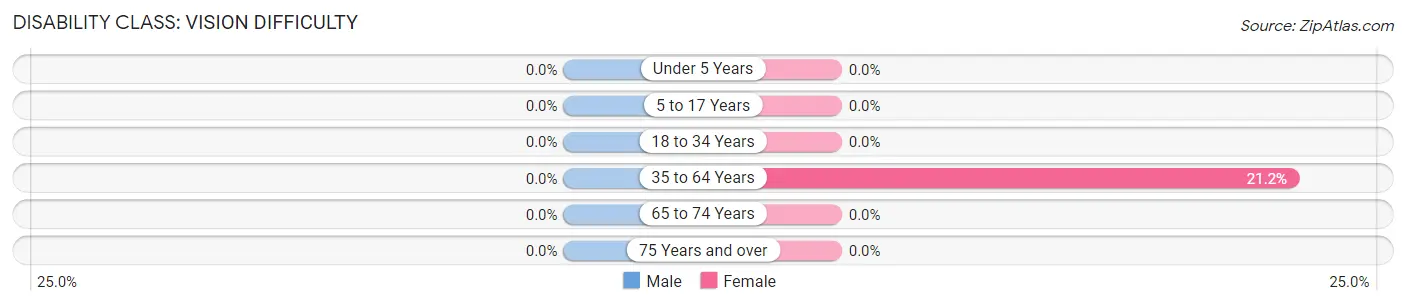
| Age Bracket | Male | Female |
| Under 5 Years | 0 (0.0%) | 0 (0.0%) |
| 5 to 17 Years | 0 (0.0%) | 0 (0.0%) |
| 18 to 34 Years | 0 (0.0%) | 0 (0.0%) |
| 35 to 64 Years | 0 (0.0%) | 7 (21.2%) |
| 65 to 74 Years | 0 (0.0%) | 0 (0.0%) |
| 75 Years and over | 0 (0.0%) | 0 (0.0%) |
Disability Class: Cognitive Difficulty
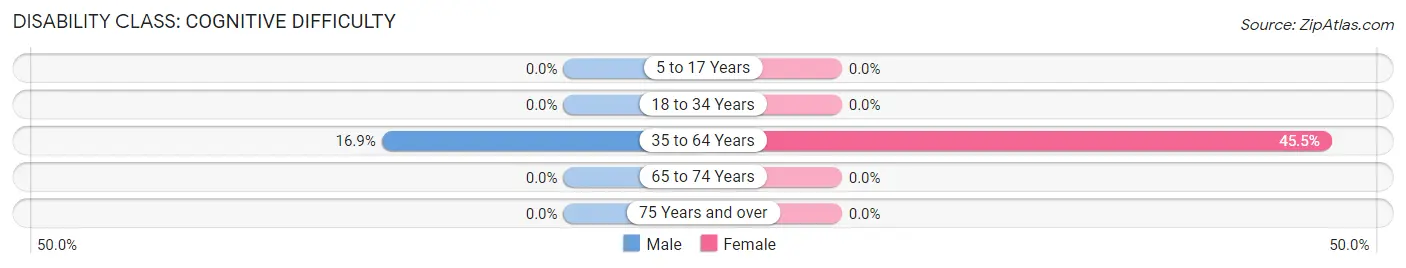
| Age Bracket | Male | Female |
| 5 to 17 Years | 0 (0.0%) | 0 (0.0%) |
| 18 to 34 Years | 0 (0.0%) | 0 (0.0%) |
| 35 to 64 Years | 14 (16.9%) | 15 (45.5%) |
| 65 to 74 Years | 0 (0.0%) | 0 (0.0%) |
| 75 Years and over | 0 (0.0%) | 0 (0.0%) |
Disability Class: Ambulatory Difficulty
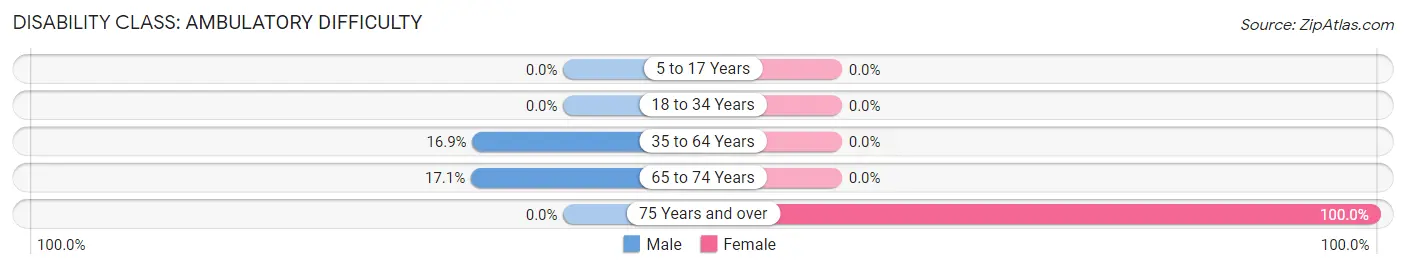
| Age Bracket | Male | Female |
| 5 to 17 Years | 0 (0.0%) | 0 (0.0%) |
| 18 to 34 Years | 0 (0.0%) | 0 (0.0%) |
| 35 to 64 Years | 14 (16.9%) | 0 (0.0%) |
| 65 to 74 Years | 12 (17.1%) | 0 (0.0%) |
| 75 Years and over | 0 (0.0%) | 45 (100.0%) |
Disability Class: Self-Care Difficulty
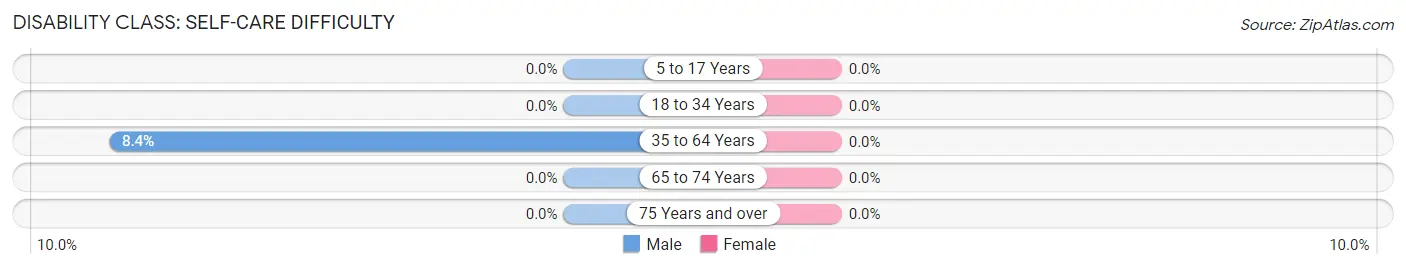
| Age Bracket | Male | Female |
| 5 to 17 Years | 0 (0.0%) | 0 (0.0%) |
| 18 to 34 Years | 0 (0.0%) | 0 (0.0%) |
| 35 to 64 Years | 7 (8.4%) | 0 (0.0%) |
| 65 to 74 Years | 0 (0.0%) | 0 (0.0%) |
| 75 Years and over | 0 (0.0%) | 0 (0.0%) |
Technology Access in Verlot
Computing Device Access in Verlot
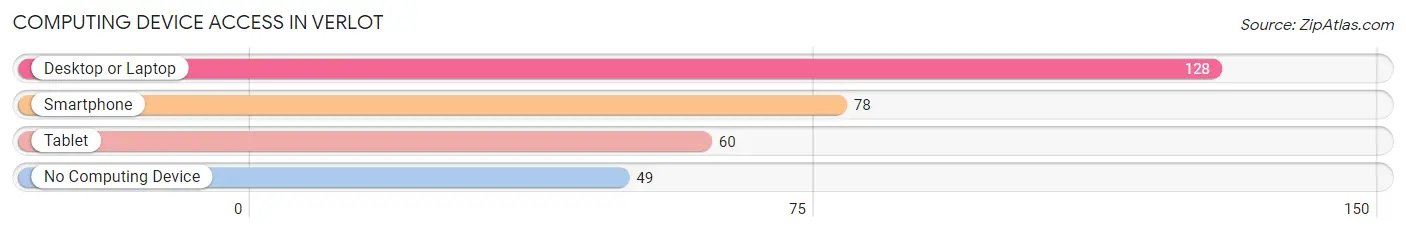
| Device Type | # Households | % Households |
| Desktop or Laptop | 128 | 72.3% |
| Smartphone | 78 | 44.1% |
| Tablet | 60 | 33.9% |
| No Computing Device | 49 | 27.7% |
| Total | 177 | 100.0% |
Internet Access in Verlot
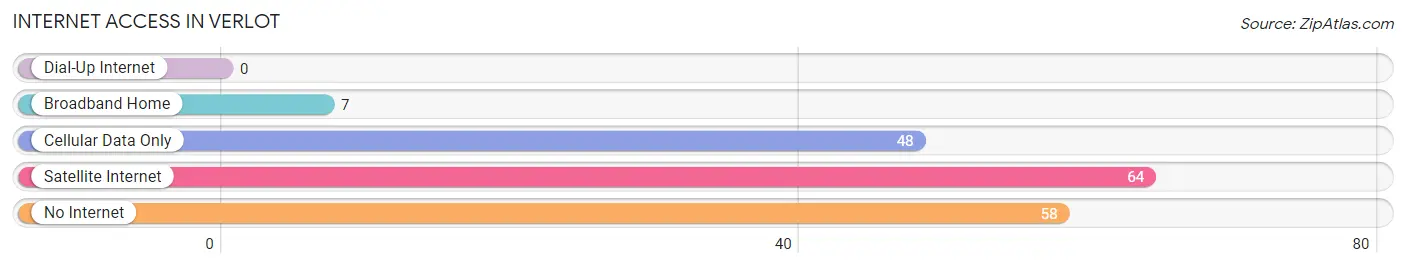
| Internet Type | # Households | % Households |
| Dial-Up Internet | 0 | 0.0% |
| Broadband Home | 7 | 4.0% |
| Cellular Data Only | 48 | 27.1% |
| Satellite Internet | 64 | 36.2% |
| No Internet | 58 | 32.8% |
| Total | 177 | 100.0% |
Verlot Summary
Verlot, Washington is a small unincorporated community located in the foothills of the Cascade Mountains in Snohomish County, Washington. It is situated along the South Fork of the Stillaguamish River, approximately 25 miles east of Everett and 40 miles northeast of Seattle. The population of Verlot was estimated to be around 200 people in 2020.
History
Verlot was first settled in the late 1800s by homesteaders who were drawn to the area by its abundant natural resources. The first settlers were mostly loggers and miners, who were attracted to the area for its timber and mineral resources. The town was officially established in 1906 and named after the French word for “valley”.
In the early 1900s, Verlot was a bustling logging and mining town. The town was home to several sawmills, a general store, a post office, a school, and a hotel. The town was also home to a number of saloons and gambling halls, which were popular with the loggers and miners.
In the 1920s, the logging industry began to decline in Verlot, and the town’s population began to dwindle. The Great Depression further exacerbated the decline, and by the 1940s, the town was nearly abandoned.
In the 1950s, the town began to experience a resurgence as a tourist destination. The town was home to several resorts, and the nearby Mount Pilchuck Ski Area was a popular destination for skiers and snowboarders.
Geography
Verlot is located in the foothills of the Cascade Mountains in Snohomish County, Washington. The town is situated along the South Fork of the Stillaguamish River, approximately 25 miles east of Everett and 40 miles northeast of Seattle.
The town is surrounded by lush forests and is home to several lakes, including Lake Cassidy, Lake Roesiger, and Lake Stevens. The nearby Mount Pilchuck State Park offers hiking, camping, and other outdoor activities.
Economy
Verlot’s economy is largely based on tourism and recreation. The town is home to several resorts, and the nearby Mount Pilchuck Ski Area is a popular destination for skiers and snowboarders. The town is also home to several restaurants, cafes, and shops.
The town is also home to several small businesses, including a sawmill, a general store, and a post office. The town is also home to a number of logging and mining operations.
Demographics
The population of Verlot was estimated to be around 200 people in 2020. The town is predominantly white, with a small minority population. The median household income in Verlot is $50,000, and the median home value is $250,000. The town has a low unemployment rate of 3.5%.
Common Questions
What is Per Capita Income in Verlot?
Per Capita income in Verlot is $65,440.
What is the Median Family Income in Verlot?
Median Family Income in Verlot is $250,001.
What is Income or Wage Gap in Verlot?
Income or Wage Gap in Verlot is 50.6%.
Women in Verlot earn 49.4 cents for every dollar earned by a man.
What is Inequality or Gini Index in Verlot?
Inequality or Gini Index in Verlot is 0.43.
What is the Total Population of Verlot?
Total Population of Verlot is 329.
What is the Total Male Population of Verlot?
Total Male Population of Verlot is 184.
What is the Total Female Population of Verlot?
Total Female Population of Verlot is 145.
What is the Ratio of Males per 100 Females in Verlot?
There are 126.90 Males per 100 Females in Verlot.
What is the Ratio of Females per 100 Males in Verlot?
There are 78.80 Females per 100 Males in Verlot.
What is the Median Population Age in Verlot?
Median Population Age in Verlot is 60.6 Years.
What is the Average Family Size in Verlot
Average Family Size in Verlot is 2.7 People.
What is the Average Household Size in Verlot
Average Household Size in Verlot is 1.9 People.
How Large is the Labor Force in Verlot?
There are 175 People in the Labor Forcein in Verlot.
What is the Percentage of People in the Labor Force in Verlot?
53.2% of People are in the Labor Force in Verlot.