Edmonds, WA Map & Demographics
Edmonds Map
Edmonds Overview
$68,793
PER CAPITA INCOME
$142,174
AVG FAMILY INCOME
$110,057
AVG HOUSEHOLD INCOME
33.1%
WAGE / INCOME GAP [ % ]
66.9¢/ $1
WAGE / INCOME GAP [ $ ]
$5,843
FAMILY INCOME DEFICIT
0.47
INEQUALITY / GINI INDEX
42,705
TOTAL POPULATION
20,183
MALE POPULATION
22,522
FEMALE POPULATION
89.61
MALES / 100 FEMALES
111.59
FEMALES / 100 MALES
45.8
MEDIAN AGE
2.8
AVG FAMILY SIZE
2.3
AVG HOUSEHOLD SIZE
23,315
LABOR FORCE [ PEOPLE ]
64.7%
PERCENT IN LABOR FORCE
4.1%
UNEMPLOYMENT RATE
Edmonds Area Codes
Income in Edmonds
Income Overview in Edmonds
Per Capita Income in Edmonds is $68,793, while median incomes of families and households are $142,174 and $110,057 respectively.
| Characteristic | Number | Measure |
| Per Capita Income | 42,705 | $68,793 |
| Median Family Income | 11,840 | $142,174 |
| Mean Family Income | 11,840 | $197,943 |
| Median Household Income | 18,269 | $110,057 |
| Mean Household Income | 18,269 | $158,885 |
| Income Deficit | 11,840 | $5,843 |
| Wage / Income Gap (%) | 42,705 | 33.07% |
| Wage / Income Gap ($) | 42,705 | 66.93¢ per $1 |
| Gini / Inequality Index | 42,705 | 0.47 |
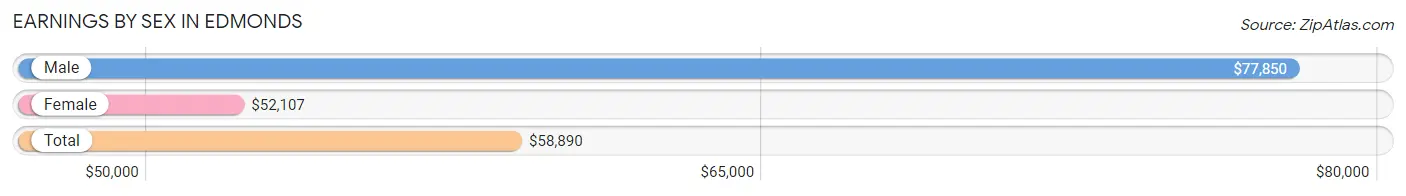
Earnings by Sex in Edmonds
Average Earnings in Edmonds are $58,890, $77,850 for men and $52,107 for women, a difference of 33.1%.
| Sex | Number | Average Earnings |
| Male | 12,229 (50.2%) | $77,850 |
| Female | 12,109 (49.7%) | $52,107 |
| Total | 24,338 (100.0%) | $58,890 |
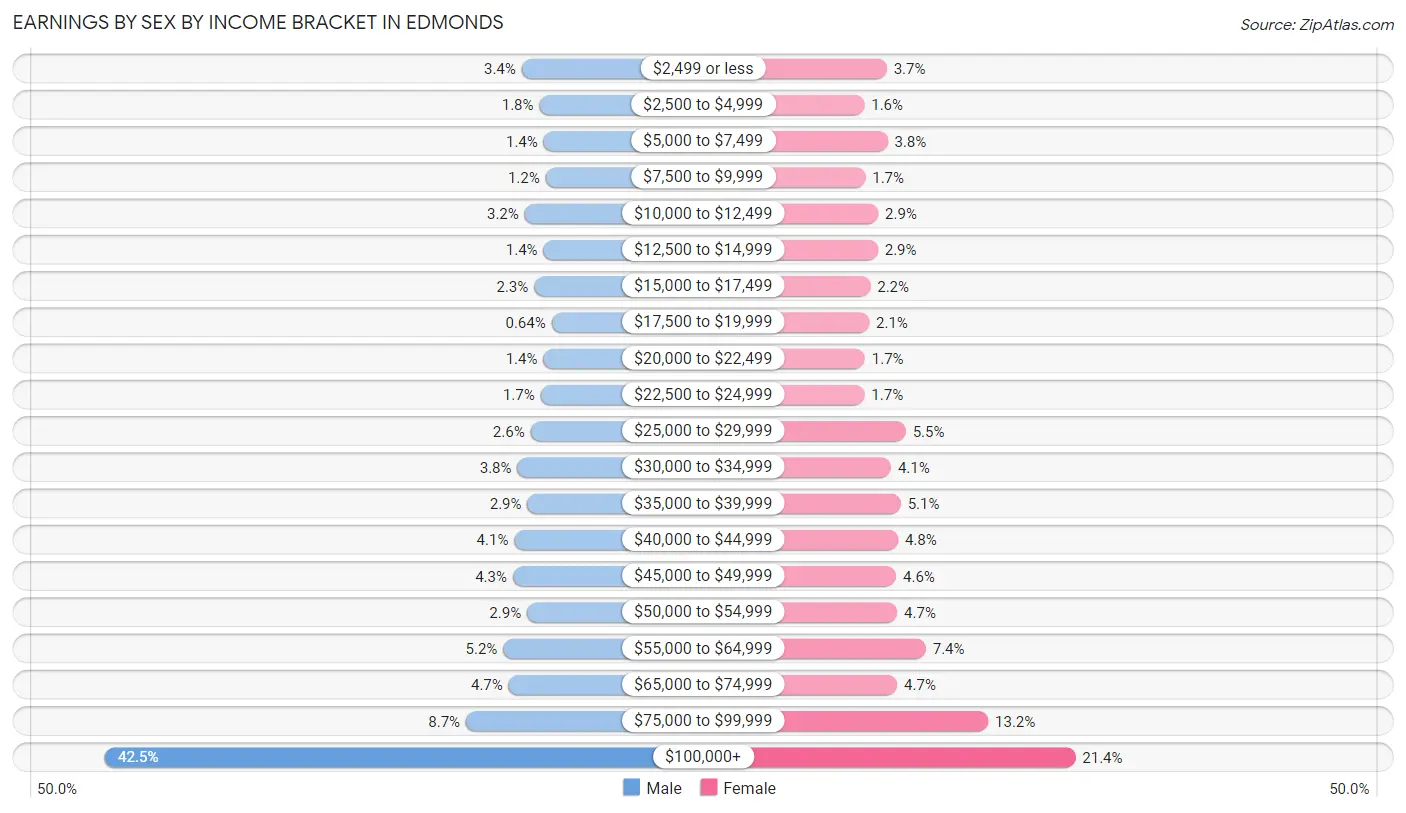
Earnings by Sex by Income Bracket in Edmonds
The most common earnings brackets in Edmonds are $100,000+ for men (5,193 | 42.5%) and $100,000+ for women (2,593 | 21.4%).
| Income | Male | Female |
| $2,499 or less | 421 (3.4%) | 453 (3.7%) |
| $2,500 to $4,999 | 218 (1.8%) | 198 (1.6%) |
| $5,000 to $7,499 | 169 (1.4%) | 461 (3.8%) |
| $7,500 to $9,999 | 147 (1.2%) | 210 (1.7%) |
| $10,000 to $12,499 | 386 (3.2%) | 356 (2.9%) |
| $12,500 to $14,999 | 171 (1.4%) | 351 (2.9%) |
| $15,000 to $17,499 | 278 (2.3%) | 267 (2.2%) |
| $17,500 to $19,999 | 78 (0.6%) | 253 (2.1%) |
| $20,000 to $22,499 | 172 (1.4%) | 205 (1.7%) |
| $22,500 to $24,999 | 204 (1.7%) | 200 (1.7%) |
| $25,000 to $29,999 | 319 (2.6%) | 669 (5.5%) |
| $30,000 to $34,999 | 470 (3.8%) | 501 (4.1%) |
| $35,000 to $39,999 | 355 (2.9%) | 611 (5.1%) |
| $40,000 to $44,999 | 505 (4.1%) | 580 (4.8%) |
| $45,000 to $49,999 | 522 (4.3%) | 560 (4.6%) |
| $50,000 to $54,999 | 360 (2.9%) | 571 (4.7%) |
| $55,000 to $64,999 | 632 (5.2%) | 896 (7.4%) |
| $65,000 to $74,999 | 570 (4.7%) | 571 (4.7%) |
| $75,000 to $99,999 | 1,059 (8.7%) | 1,603 (13.2%) |
| $100,000+ | 5,193 (42.5%) | 2,593 (21.4%) |
| Total | 12,229 (100.0%) | 12,109 (100.0%) |
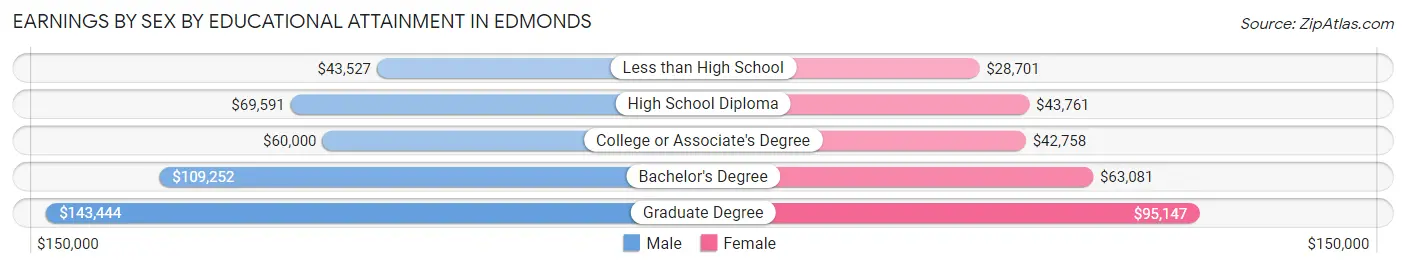
Earnings by Sex by Educational Attainment in Edmonds
Average earnings in Edmonds are $87,229 for men and $56,525 for women, a difference of 35.2%. Men with an educational attainment of graduate degree enjoy the highest average annual earnings of $143,444, while those with less than high school education earn the least with $43,527. Women with an educational attainment of graduate degree earn the most with the average annual earnings of $95,147, while those with less than high school education have the smallest earnings of $28,701.
| Educational Attainment | Male Income | Female Income |
| Less than High School | $43,527 | $28,701 |
| High School Diploma | $69,591 | $43,761 |
| College or Associate's Degree | $60,000 | $42,758 |
| Bachelor's Degree | $109,252 | $63,081 |
| Graduate Degree | $143,444 | $95,147 |
| Total | $87,229 | $56,525 |
Family Income in Edmonds
Family Income Brackets in Edmonds
According to the Edmonds family income data, there are 3,765 families falling into the $200,000+ income range, which is the most common income bracket and makes up 31.8% of all families. Conversely, the $10,000 to $14,999 income bracket is the least frequent group with only 36 families (0.3%) belonging to this category.
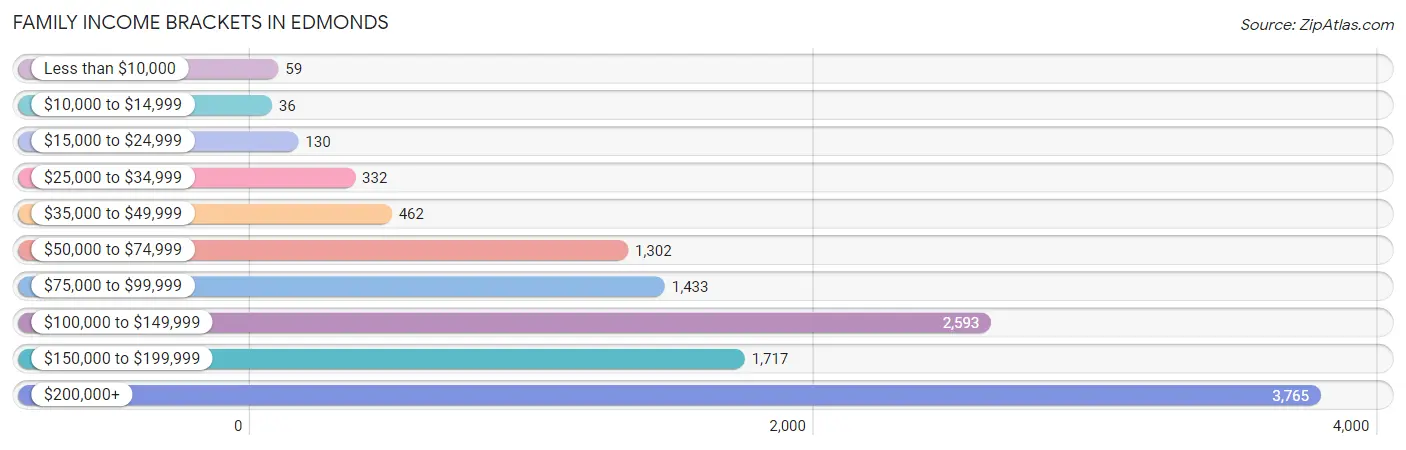
| Income Bracket | # Families | % Families |
| Less than $10,000 | 59 | 0.5% |
| $10,000 to $14,999 | 36 | 0.3% |
| $15,000 to $24,999 | 130 | 1.1% |
| $25,000 to $34,999 | 332 | 2.8% |
| $35,000 to $49,999 | 462 | 3.9% |
| $50,000 to $74,999 | 1,302 | 11.0% |
| $75,000 to $99,999 | 1,433 | 12.1% |
| $100,000 to $149,999 | 2,593 | 21.9% |
| $150,000 to $199,999 | 1,717 | 14.5% |
| $200,000+ | 3,765 | 31.8% |
Family Income by Famaliy Size in Edmonds
6-person families (81 | 0.7%) account for the highest median family income in Edmonds with $215,784 per family, while 2-person families (6,384 | 53.9%) have the highest median income of $62,246 per family member.
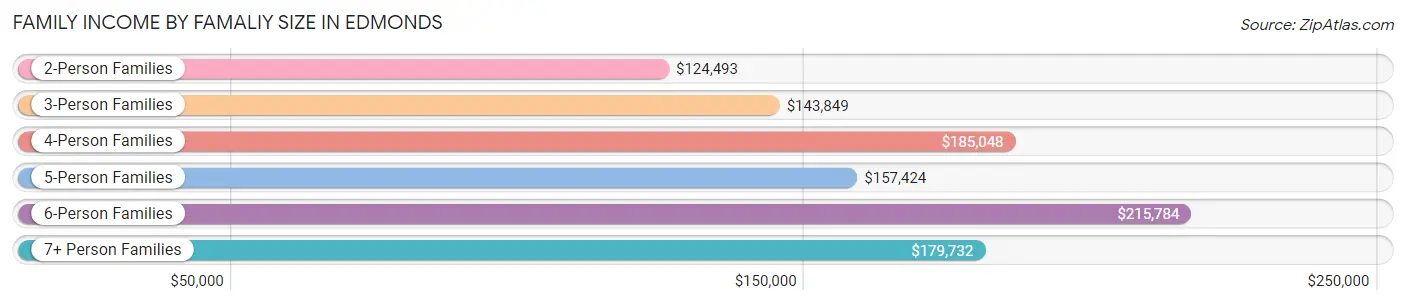
| Income Bracket | # Families | Median Income |
| 2-Person Families | 6,384 (53.9%) | $124,493 |
| 3-Person Families | 2,437 (20.6%) | $143,849 |
| 4-Person Families | 2,147 (18.1%) | $185,048 |
| 5-Person Families | 666 (5.6%) | $157,424 |
| 6-Person Families | 81 (0.7%) | $215,784 |
| 7+ Person Families | 125 (1.1%) | $179,732 |
| Total | 11,840 (100.0%) | $142,174 |
Family Income by Number of Earners in Edmonds
The median family income in Edmonds is $142,174, with families comprising 3+ earners (1,256) having the highest median family income of $216,059, while families with no earners (1,985) have the lowest median family income of $89,297, accounting for 10.6% and 16.8% of families, respectively.
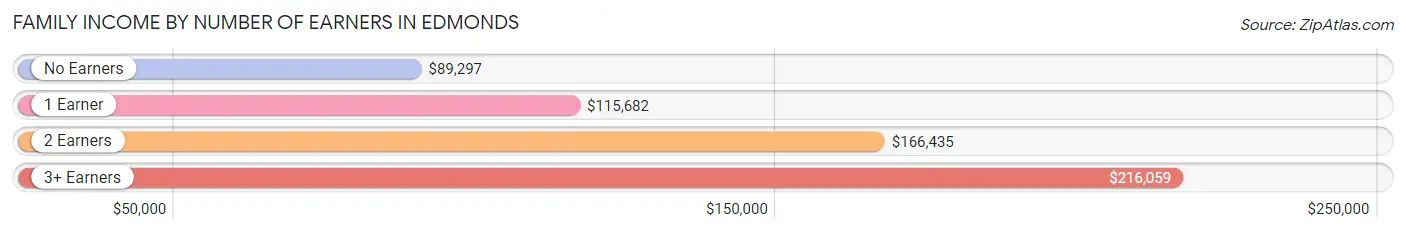
| Number of Earners | # Families | Median Income |
| No Earners | 1,985 (16.8%) | $89,297 |
| 1 Earner | 3,046 (25.7%) | $115,682 |
| 2 Earners | 5,553 (46.9%) | $166,435 |
| 3+ Earners | 1,256 (10.6%) | $216,059 |
| Total | 11,840 (100.0%) | $142,174 |
Household Income in Edmonds
Household Income Brackets in Edmonds
With 4,257 households falling in the category, the $200,000+ income range is the most frequent in Edmonds, accounting for 23.3% of all households. In contrast, only 164 households (0.9%) fall into the less than $10,000 income bracket, making it the least populous group.
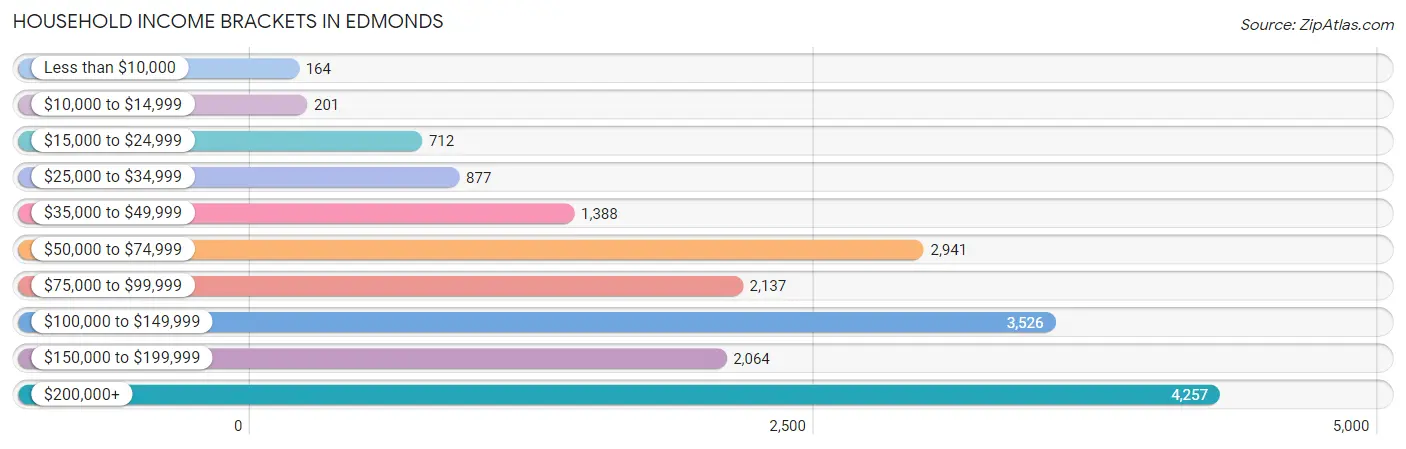
| Income Bracket | # Households | % Households |
| Less than $10,000 | 164 | 0.9% |
| $10,000 to $14,999 | 201 | 1.1% |
| $15,000 to $24,999 | 712 | 3.9% |
| $25,000 to $34,999 | 877 | 4.8% |
| $35,000 to $49,999 | 1,388 | 7.6% |
| $50,000 to $74,999 | 2,941 | 16.1% |
| $75,000 to $99,999 | 2,137 | 11.7% |
| $100,000 to $149,999 | 3,526 | 19.3% |
| $150,000 to $199,999 | 2,064 | 11.3% |
| $200,000+ | 4,257 | 23.3% |
Household Income by Householder Age in Edmonds
The median household income in Edmonds is $110,057, with the highest median household income of $147,823 found in the 45 to 64 years age bracket for the primary householder. A total of 6,854 households (37.5%) fall into this category. Meanwhile, the 65+ years age bracket for the primary householder has the lowest median household income of $70,190, with 5,966 households (32.7%) in this group.
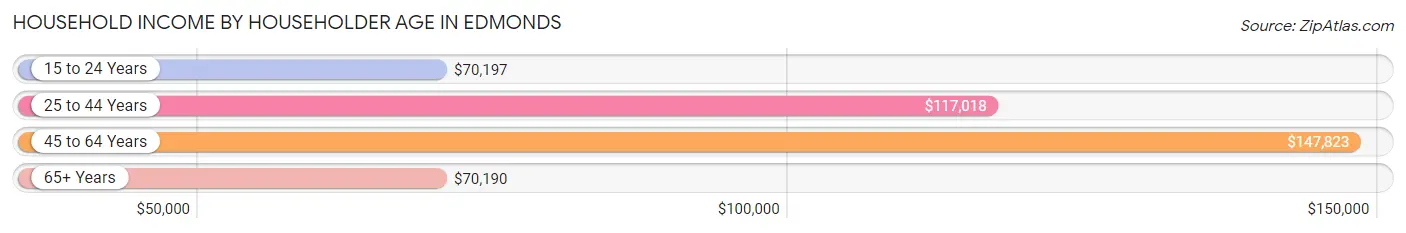
| Income Bracket | # Households | Median Income |
| 15 to 24 Years | 353 (1.9%) | $70,197 |
| 25 to 44 Years | 5,096 (27.9%) | $117,018 |
| 45 to 64 Years | 6,854 (37.5%) | $147,823 |
| 65+ Years | 5,966 (32.7%) | $70,190 |
| Total | 18,269 (100.0%) | $110,057 |
Poverty in Edmonds
Income Below Poverty by Sex and Age in Edmonds
With 3.4% poverty level for males and 4.9% for females among the residents of Edmonds, 6 to 11 year old males and 12 to 14 year old females are the most vulnerable to poverty, with 107 males (8.0%) and 98 females (16.9%) in their respective age groups living below the poverty level.
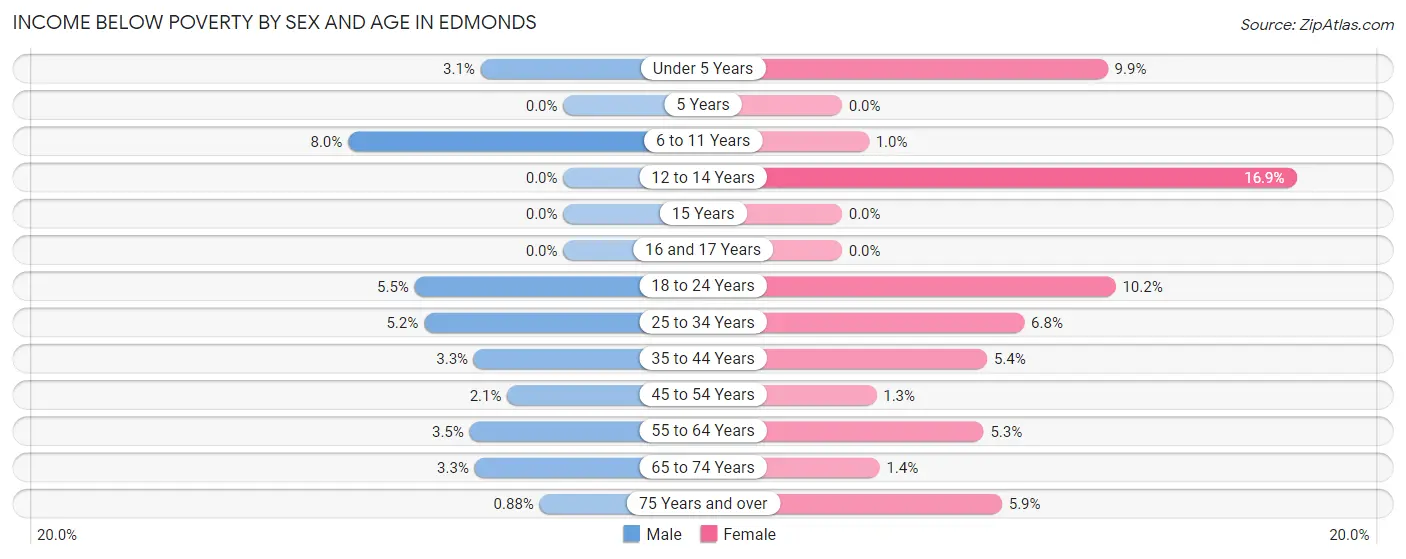
| Age Bracket | Male | Female |
| Under 5 Years | 28 (3.1%) | 112 (9.9%) |
| 5 Years | 0 (0.0%) | 0 (0.0%) |
| 6 to 11 Years | 107 (8.0%) | 13 (1.0%) |
| 12 to 14 Years | 0 (0.0%) | 98 (16.9%) |
| 15 Years | 0 (0.0%) | 0 (0.0%) |
| 16 and 17 Years | 0 (0.0%) | 0 (0.0%) |
| 18 to 24 Years | 63 (5.5%) | 137 (10.2%) |
| 25 to 34 Years | 142 (5.2%) | 174 (6.8%) |
| 35 to 44 Years | 92 (3.3%) | 158 (5.4%) |
| 45 to 54 Years | 59 (2.1%) | 40 (1.3%) |
| 55 to 64 Years | 98 (3.5%) | 170 (5.3%) |
| 65 to 74 Years | 81 (3.3%) | 41 (1.4%) |
| 75 Years and over | 14 (0.9%) | 152 (5.9%) |
| Total | 684 (3.4%) | 1,095 (4.9%) |
Income Above Poverty by Sex and Age in Edmonds
According to the poverty statistics in Edmonds, males aged 5 years and females aged 5 years are the age groups that are most secure financially, with 100.0% of males and 100.0% of females in these age groups living above the poverty line.
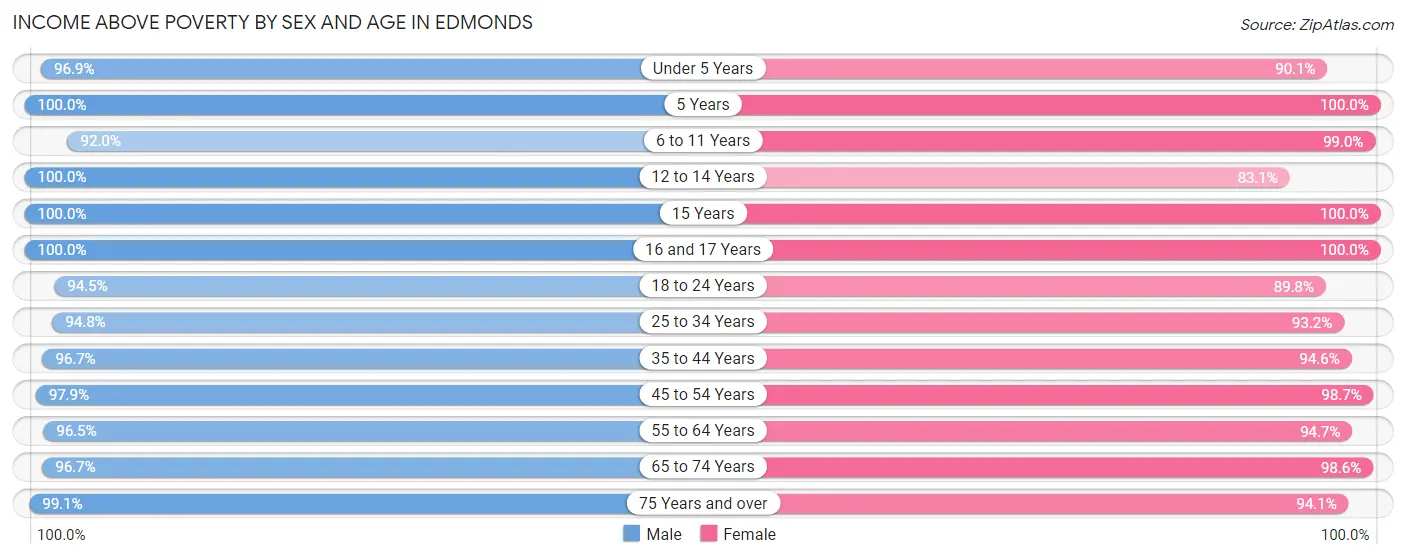
| Age Bracket | Male | Female |
| Under 5 Years | 885 (96.9%) | 1,023 (90.1%) |
| 5 Years | 257 (100.0%) | 107 (100.0%) |
| 6 to 11 Years | 1,232 (92.0%) | 1,281 (99.0%) |
| 12 to 14 Years | 531 (100.0%) | 483 (83.1%) |
| 15 Years | 242 (100.0%) | 208 (100.0%) |
| 16 and 17 Years | 461 (100.0%) | 288 (100.0%) |
| 18 to 24 Years | 1,078 (94.5%) | 1,211 (89.8%) |
| 25 to 34 Years | 2,606 (94.8%) | 2,395 (93.2%) |
| 35 to 44 Years | 2,682 (96.7%) | 2,776 (94.6%) |
| 45 to 54 Years | 2,780 (97.9%) | 3,085 (98.7%) |
| 55 to 64 Years | 2,717 (96.5%) | 3,061 (94.7%) |
| 65 to 74 Years | 2,378 (96.7%) | 2,878 (98.6%) |
| 75 Years and over | 1,581 (99.1%) | 2,405 (94.1%) |
| Total | 19,430 (96.6%) | 21,201 (95.1%) |
Income Below Poverty Among Married-Couple Families in Edmonds
The poverty statistics for married-couple families in Edmonds show that 1.6% or 160 of the total 9,910 families live below the poverty line. Families with 3 or 4 children have the highest poverty rate of 17.8%, comprising of 89 families. On the other hand, families with 1 or 2 children have the lowest poverty rate of 0.0%, which includes 0 families.
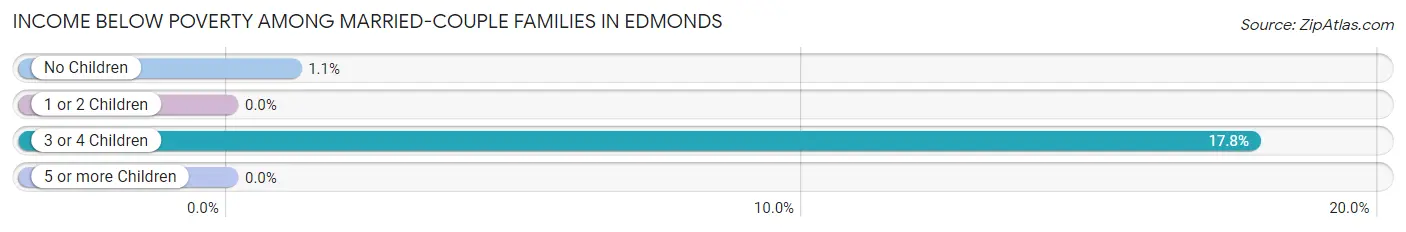
| Children | Above Poverty | Below Poverty |
| No Children | 6,382 (98.9%) | 71 (1.1%) |
| 1 or 2 Children | 2,878 (100.0%) | 0 (0.0%) |
| 3 or 4 Children | 411 (82.2%) | 89 (17.8%) |
| 5 or more Children | 79 (100.0%) | 0 (0.0%) |
| Total | 9,750 (98.4%) | 160 (1.6%) |
Income Below Poverty Among Single-Parent Households in Edmonds
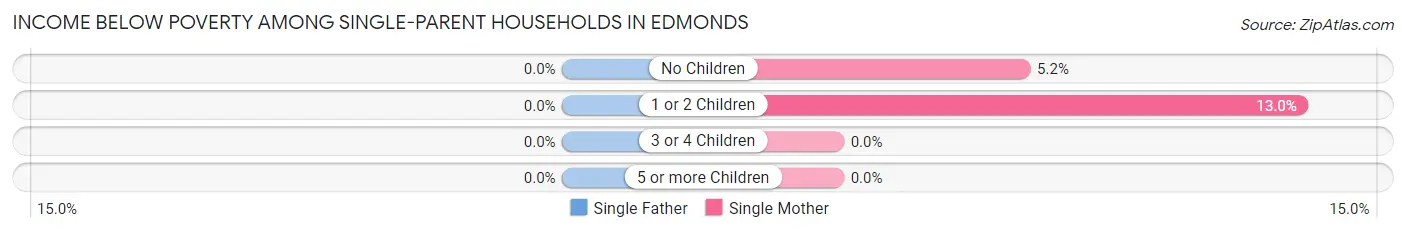
| Children | Single Father | Single Mother |
| No Children | 0 (0.0%) | 40 (5.2%) |
| 1 or 2 Children | 0 (0.0%) | 70 (13.0%) |
| 3 or 4 Children | 0 (0.0%) | 0 (0.0%) |
| 5 or more Children | 0 (0.0%) | 0 (0.0%) |
| Total | 0 (0.0%) | 110 (8.3%) |
Income Below Poverty Among Married-Couple vs Single-Parent Households in Edmonds
The poverty data for Edmonds shows that 160 of the married-couple family households (1.6%) and 110 of the single-parent households (5.7%) are living below the poverty level. Within the married-couple family households, those with 3 or 4 children have the highest poverty rate, with 89 households (17.8%) falling below the poverty line. Among the single-parent households, those with 1 or 2 children have the highest poverty rate, with 70 household (8.9%) living below poverty.
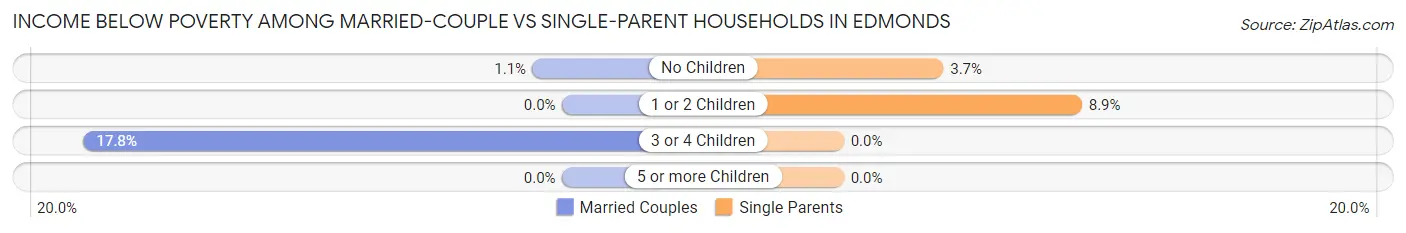
| Children | Married-Couple Families | Single-Parent Households |
| No Children | 71 (1.1%) | 40 (3.7%) |
| 1 or 2 Children | 0 (0.0%) | 70 (8.9%) |
| 3 or 4 Children | 89 (17.8%) | 0 (0.0%) |
| 5 or more Children | 0 (0.0%) | 0 (0.0%) |
| Total | 160 (1.6%) | 110 (5.7%) |
Race in Edmonds
The most populous races in Edmonds are White / Caucasian (32,907 | 77.1%), Asian (3,990 | 9.3%), and Two or more Races (3,289 | 7.7%).
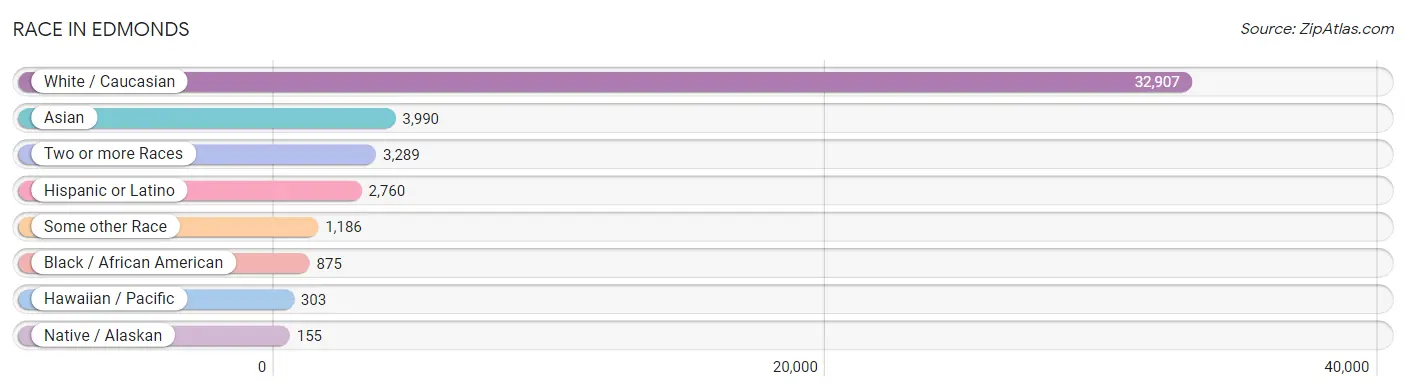
| Race | # Population | % Population |
| Asian | 3,990 | 9.3% |
| Black / African American | 875 | 2.1% |
| Hawaiian / Pacific | 303 | 0.7% |
| Hispanic or Latino | 2,760 | 6.5% |
| Native / Alaskan | 155 | 0.4% |
| White / Caucasian | 32,907 | 77.1% |
| Two or more Races | 3,289 | 7.7% |
| Some other Race | 1,186 | 2.8% |
| Total | 42,705 | 100.0% |
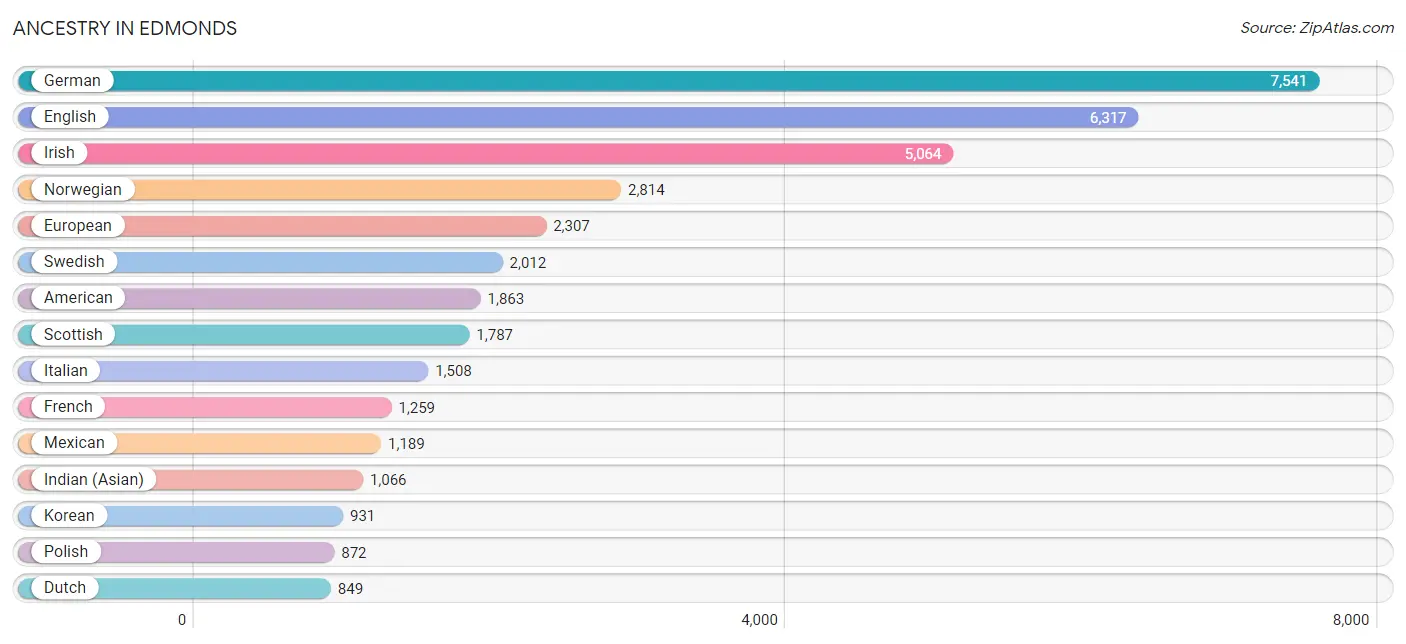
Ancestry in Edmonds
The most populous ancestries reported in Edmonds are German (7,541 | 17.7%), English (6,317 | 14.8%), Irish (5,064 | 11.9%), Norwegian (2,814 | 6.6%), and European (2,307 | 5.4%), together accounting for 56.3% of all Edmonds residents.
| Ancestry | # Population | % Population |
| African | 70 | 0.2% |
| Alaskan Athabascan | 26 | 0.1% |
| Albanian | 83 | 0.2% |
| Aleut | 38 | 0.1% |
| American | 1,863 | 4.4% |
| Apache | 27 | 0.1% |
| Arab | 147 | 0.3% |
| Argentinean | 100 | 0.2% |
| Armenian | 65 | 0.2% |
| Austrian | 247 | 0.6% |
| Belgian | 107 | 0.3% |
| Bhutanese | 775 | 1.8% |
| Blackfeet | 82 | 0.2% |
| Brazilian | 20 | 0.1% |
| British | 499 | 1.2% |
| Bulgarian | 56 | 0.1% |
| Burmese | 527 | 1.2% |
| Cajun | 18 | 0.0% |
| Cambodian | 413 | 1.0% |
| Canadian | 227 | 0.5% |
| Central American | 676 | 1.6% |
| Central American Indian | 65 | 0.2% |
| Cherokee | 174 | 0.4% |
| Cheyenne | 29 | 0.1% |
| Chilean | 31 | 0.1% |
| Chippewa | 40 | 0.1% |
| Choctaw | 27 | 0.1% |
| Colombian | 81 | 0.2% |
| Colville | 19 | 0.0% |
| Croatian | 157 | 0.4% |
| Cuban | 10 | 0.0% |
| Czech | 162 | 0.4% |
| Czechoslovakian | 22 | 0.1% |
| Danish | 374 | 0.9% |
| Delaware | 7 | 0.0% |
| Dominican | 25 | 0.1% |
| Dutch | 849 | 2.0% |
| Eastern European | 140 | 0.3% |
| Egyptian | 17 | 0.0% |
| English | 6,317 | 14.8% |
| Ethiopian | 327 | 0.8% |
| European | 2,307 | 5.4% |
| Filipino | 20 | 0.1% |
| Finnish | 428 | 1.0% |
| French | 1,259 | 2.9% |
| French Canadian | 137 | 0.3% |
| German | 7,541 | 17.7% |
| Ghanaian | 64 | 0.2% |
| Greek | 194 | 0.4% |
| Guamanian / Chamorro | 36 | 0.1% |
| Honduran | 135 | 0.3% |
| Hungarian | 201 | 0.5% |
| Icelander | 69 | 0.2% |
| Indian (Asian) | 1,066 | 2.5% |
| Inupiat | 10 | 0.0% |
| Iranian | 65 | 0.2% |
| Irish | 5,064 | 11.9% |
| Italian | 1,508 | 3.5% |
| Japanese | 52 | 0.1% |
| Kenyan | 36 | 0.1% |
| Korean | 931 | 2.2% |
| Laotian | 80 | 0.2% |
| Latvian | 12 | 0.0% |
| Lebanese | 17 | 0.0% |
| Lithuanian | 142 | 0.3% |
| Macedonian | 14 | 0.0% |
| Malaysian | 18 | 0.0% |
| Mexican | 1,189 | 2.8% |
| Mexican American Indian | 6 | 0.0% |
| Native Hawaiian | 308 | 0.7% |
| Navajo | 32 | 0.1% |
| Northern European | 288 | 0.7% |
| Norwegian | 2,814 | 6.6% |
| Osage | 42 | 0.1% |
| Pakistani | 59 | 0.1% |
| Palestinian | 104 | 0.2% |
| Peruvian | 100 | 0.2% |
| Polish | 872 | 2.0% |
| Portuguese | 143 | 0.3% |
| Puerto Rican | 335 | 0.8% |
| Romanian | 236 | 0.5% |
| Russian | 635 | 1.5% |
| Salvadoran | 541 | 1.3% |
| Samoan | 107 | 0.3% |
| Scandinavian | 526 | 1.2% |
| Scotch-Irish | 643 | 1.5% |
| Scottish | 1,787 | 4.2% |
| Serbian | 11 | 0.0% |
| Sioux | 11 | 0.0% |
| Slavic | 29 | 0.1% |
| Slovak | 28 | 0.1% |
| Somali | 9 | 0.0% |
| South African | 53 | 0.1% |
| South American | 312 | 0.7% |
| Spaniard | 44 | 0.1% |
| Spanish | 21 | 0.1% |
| Sri Lankan | 787 | 1.8% |
| Subsaharan African | 568 | 1.3% |
| Swedish | 2,012 | 4.7% |
| Swiss | 205 | 0.5% |
| Thai | 352 | 0.8% |
| Trinidadian and Tobagonian | 85 | 0.2% |
| Tsimshian | 6 | 0.0% |
| Turkish | 15 | 0.0% |
| Ugandan | 20 | 0.1% |
| Ukrainian | 227 | 0.5% |
| Welsh | 365 | 0.9% |
| Yugoslavian | 9 | 0.0% |
| Yup'ik | 32 | 0.1% | View All 109 Rows |
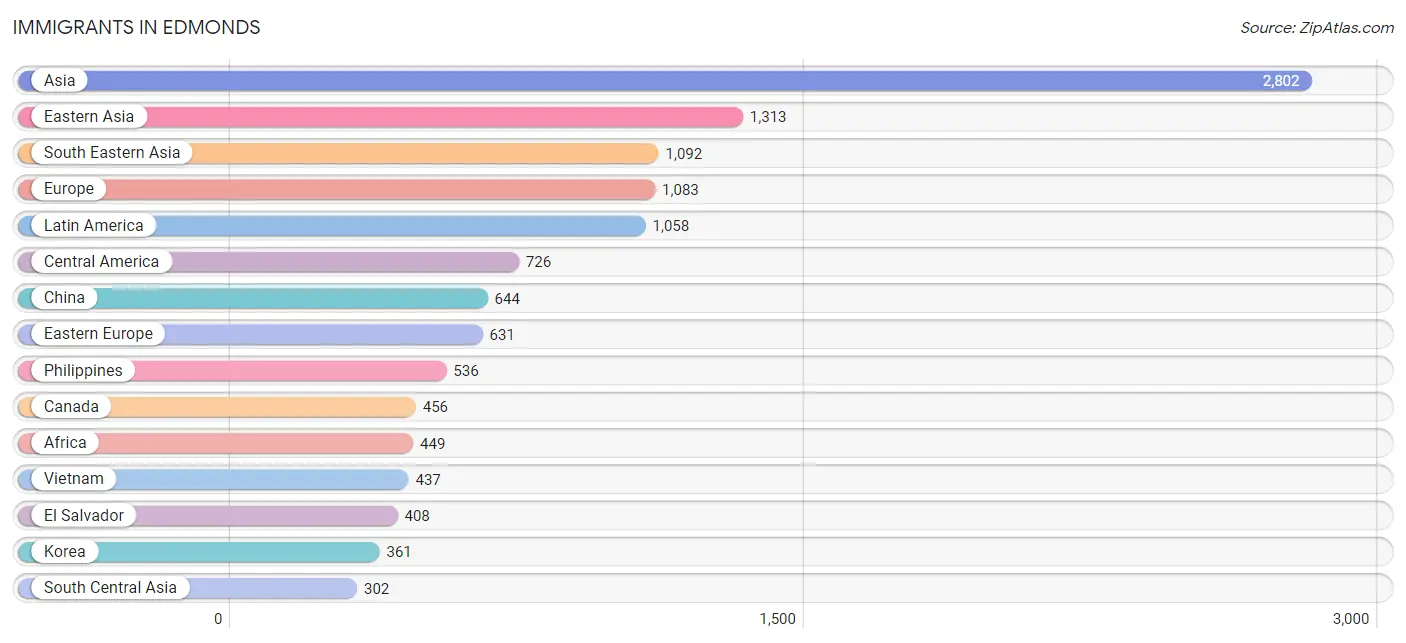
Immigrants in Edmonds
The most numerous immigrant groups reported in Edmonds came from Asia (2,802 | 6.6%), Eastern Asia (1,313 | 3.1%), South Eastern Asia (1,092 | 2.6%), Europe (1,083 | 2.5%), and Latin America (1,058 | 2.5%), together accounting for 17.2% of all Edmonds residents.
| Immigration Origin | # Population | % Population |
| Africa | 449 | 1.1% |
| Albania | 91 | 0.2% |
| Asia | 2,802 | 6.6% |
| Australia | 38 | 0.1% |
| Austria | 7 | 0.0% |
| Belarus | 38 | 0.1% |
| Belgium | 15 | 0.0% |
| Brazil | 20 | 0.1% |
| Bulgaria | 56 | 0.1% |
| Cambodia | 5 | 0.0% |
| Canada | 456 | 1.1% |
| Caribbean | 35 | 0.1% |
| Central America | 726 | 1.7% |
| Chile | 31 | 0.1% |
| China | 644 | 1.5% |
| Colombia | 39 | 0.1% |
| Cuba | 10 | 0.0% |
| Czechoslovakia | 12 | 0.0% |
| Dominican Republic | 25 | 0.1% |
| Eastern Africa | 260 | 0.6% |
| Eastern Asia | 1,313 | 3.1% |
| Eastern Europe | 631 | 1.5% |
| Egypt | 17 | 0.0% |
| El Salvador | 408 | 1.0% |
| England | 52 | 0.1% |
| Eritrea | 82 | 0.2% |
| Ethiopia | 113 | 0.3% |
| Europe | 1,083 | 2.5% |
| Fiji | 100 | 0.2% |
| Germany | 109 | 0.3% |
| Ghana | 80 | 0.2% |
| Honduras | 98 | 0.2% |
| Hong Kong | 81 | 0.2% |
| Hungary | 17 | 0.0% |
| India | 194 | 0.4% |
| Indonesia | 26 | 0.1% |
| Iran | 65 | 0.2% |
| Ireland | 31 | 0.1% |
| Japan | 139 | 0.3% |
| Kenya | 36 | 0.1% |
| Korea | 361 | 0.9% |
| Laos | 5 | 0.0% |
| Latin America | 1,058 | 2.5% |
| Lebanon | 17 | 0.0% |
| Lithuania | 36 | 0.1% |
| Mexico | 220 | 0.5% |
| Moldova | 13 | 0.0% |
| Nepal | 15 | 0.0% |
| Netherlands | 3 | 0.0% |
| Northern Africa | 17 | 0.0% |
| Northern Europe | 286 | 0.7% |
| Norway | 16 | 0.0% |
| Oceania | 221 | 0.5% |
| Pakistan | 14 | 0.0% |
| Peru | 100 | 0.2% |
| Philippines | 536 | 1.3% |
| Poland | 23 | 0.1% |
| Romania | 157 | 0.4% |
| Russia | 55 | 0.1% |
| Scotland | 38 | 0.1% |
| Somalia | 9 | 0.0% |
| South Africa | 72 | 0.2% |
| South America | 297 | 0.7% |
| South Central Asia | 302 | 0.7% |
| South Eastern Asia | 1,092 | 2.6% |
| Sri Lanka | 14 | 0.0% |
| Sweden | 38 | 0.1% |
| Switzerland | 32 | 0.1% |
| Syria | 29 | 0.1% |
| Taiwan | 86 | 0.2% |
| Thailand | 83 | 0.2% |
| Uganda | 20 | 0.1% |
| Ukraine | 88 | 0.2% |
| Uruguay | 107 | 0.3% |
| Vietnam | 437 | 1.0% |
| Western Africa | 100 | 0.2% |
| Western Asia | 68 | 0.2% |
| Western Europe | 166 | 0.4% | View All 78 Rows |
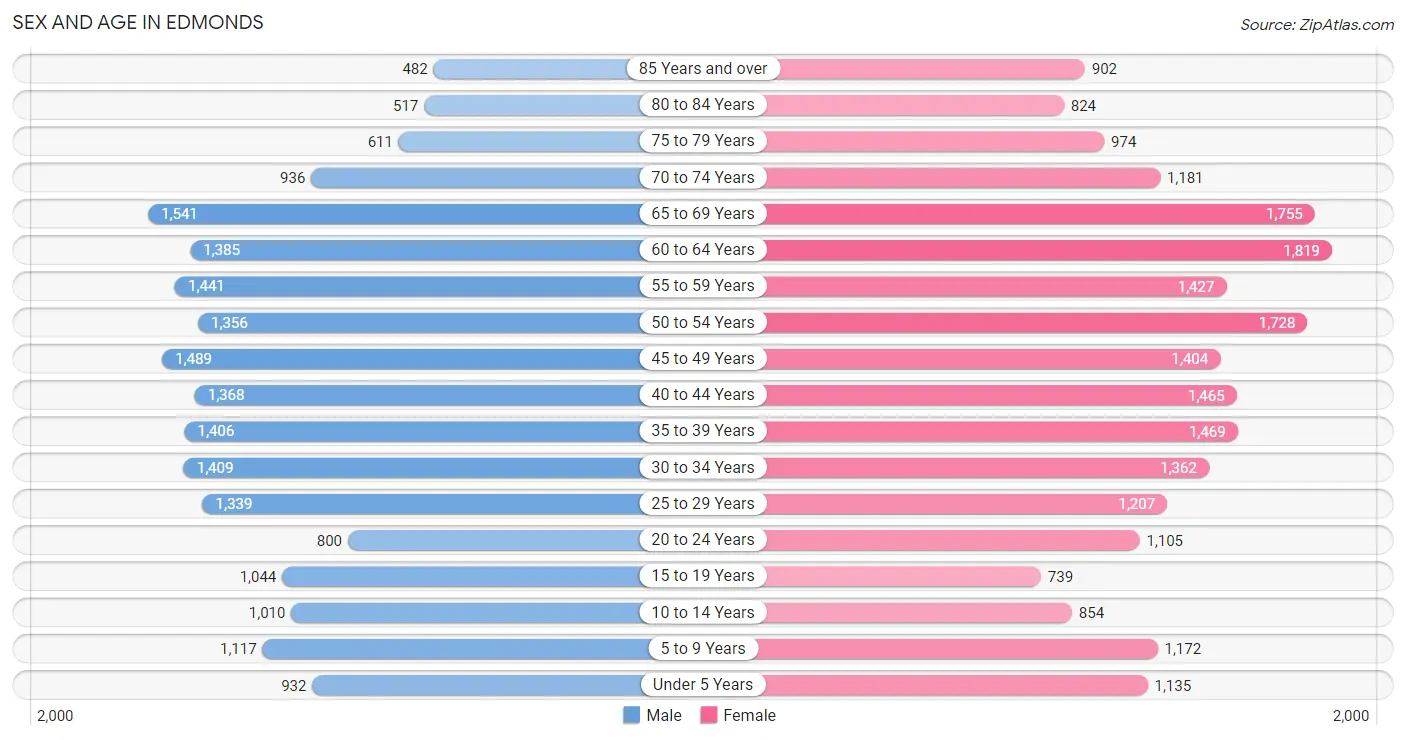
Sex and Age in Edmonds
Sex and Age in Edmonds
The most populous age groups in Edmonds are 65 to 69 Years (1,541 | 7.6%) for men and 60 to 64 Years (1,819 | 8.1%) for women.
| Age Bracket | Male | Female |
| Under 5 Years | 932 (4.6%) | 1,135 (5.0%) |
| 5 to 9 Years | 1,117 (5.5%) | 1,172 (5.2%) |
| 10 to 14 Years | 1,010 (5.0%) | 854 (3.8%) |
| 15 to 19 Years | 1,044 (5.2%) | 739 (3.3%) |
| 20 to 24 Years | 800 (4.0%) | 1,105 (4.9%) |
| 25 to 29 Years | 1,339 (6.6%) | 1,207 (5.4%) |
| 30 to 34 Years | 1,409 (7.0%) | 1,362 (6.0%) |
| 35 to 39 Years | 1,406 (7.0%) | 1,469 (6.5%) |
| 40 to 44 Years | 1,368 (6.8%) | 1,465 (6.5%) |
| 45 to 49 Years | 1,489 (7.4%) | 1,404 (6.2%) |
| 50 to 54 Years | 1,356 (6.7%) | 1,728 (7.7%) |
| 55 to 59 Years | 1,441 (7.1%) | 1,427 (6.3%) |
| 60 to 64 Years | 1,385 (6.9%) | 1,819 (8.1%) |
| 65 to 69 Years | 1,541 (7.6%) | 1,755 (7.8%) |
| 70 to 74 Years | 936 (4.6%) | 1,181 (5.2%) |
| 75 to 79 Years | 611 (3.0%) | 974 (4.3%) |
| 80 to 84 Years | 517 (2.6%) | 824 (3.7%) |
| 85 Years and over | 482 (2.4%) | 902 (4.0%) |
| Total | 20,183 (100.0%) | 22,522 (100.0%) |
Families and Households in Edmonds
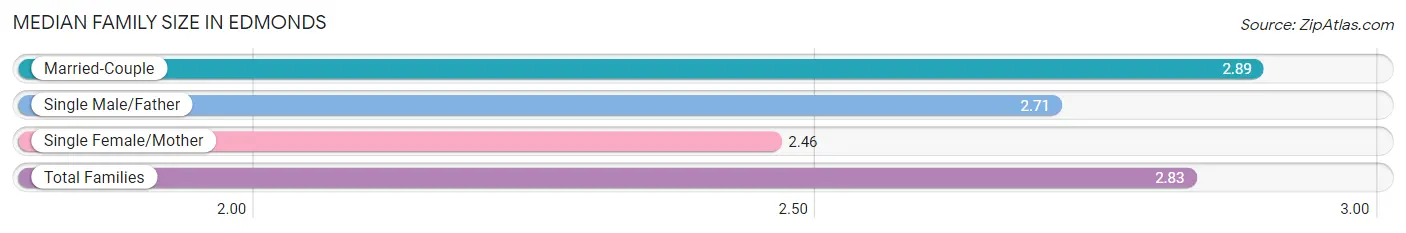
Median Family Size in Edmonds
The median family size in Edmonds is 2.83 persons per family, with married-couple families (9,910 | 83.7%) accounting for the largest median family size of 2.89 persons per family. On the other hand, single female/mother families (1,321 | 11.2%) represent the smallest median family size with 2.46 persons per family.
| Family Type | # Families | Family Size |
| Married-Couple | 9,910 (83.7%) | 2.89 |
| Single Male/Father | 609 (5.1%) | 2.71 |
| Single Female/Mother | 1,321 (11.2%) | 2.46 |
| Total Families | 11,840 (100.0%) | 2.83 |
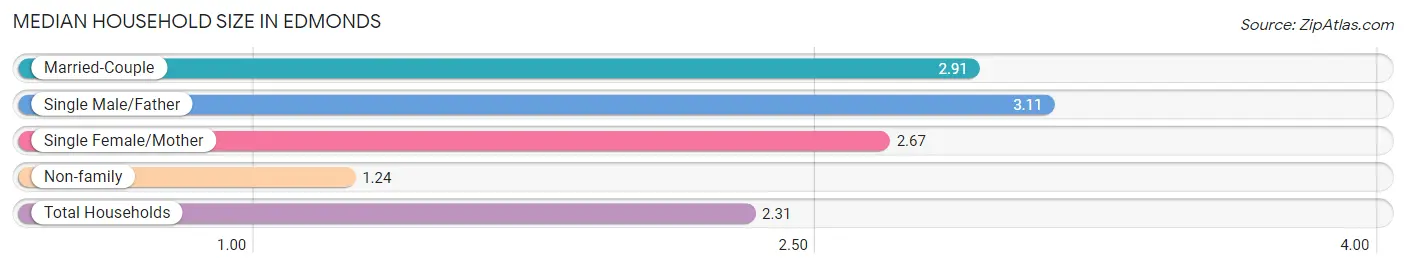
Median Household Size in Edmonds
The median household size in Edmonds is 2.31 persons per household, with single male/father households (609 | 3.3%) accounting for the largest median household size of 3.11 persons per household. non-family households (6,429 | 35.2%) represent the smallest median household size with 1.24 persons per household.
| Household Type | # Households | Household Size |
| Married-Couple | 9,910 (54.2%) | 2.91 |
| Single Male/Father | 609 (3.3%) | 3.11 |
| Single Female/Mother | 1,321 (7.2%) | 2.67 |
| Non-family | 6,429 (35.2%) | 1.24 |
| Total Households | 18,269 (100.0%) | 2.31 |
Household Size by Marriage Status in Edmonds
Out of a total of 18,269 households in Edmonds, 11,840 (64.8%) are family households, while 6,429 (35.2%) are nonfamily households. The most numerous type of family households are 2-person households, comprising 6,091, and the most common type of nonfamily households are 1-person households, comprising 5,147.
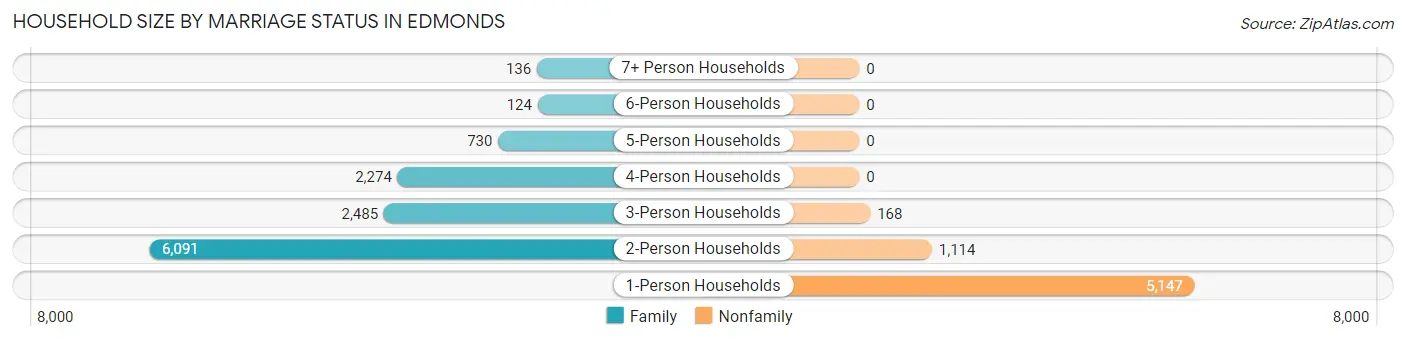
| Household Size | Family Households | Nonfamily Households |
| 1-Person Households | - | 5,147 (28.2%) |
| 2-Person Households | 6,091 (33.3%) | 1,114 (6.1%) |
| 3-Person Households | 2,485 (13.6%) | 168 (0.9%) |
| 4-Person Households | 2,274 (12.4%) | 0 (0.0%) |
| 5-Person Households | 730 (4.0%) | 0 (0.0%) |
| 6-Person Households | 124 (0.7%) | 0 (0.0%) |
| 7+ Person Households | 136 (0.7%) | 0 (0.0%) |
| Total | 11,840 (64.8%) | 6,429 (35.2%) |
Female Fertility in Edmonds
Fertility by Age in Edmonds
Average fertility rate in Edmonds is 66.0 births per 1,000 women. Women in the age bracket of 35 to 50 years have the highest fertility rate with 85.0 births per 1,000 women. Women in the age bracket of 35 to 50 years acount for 65.3% of all women with births.
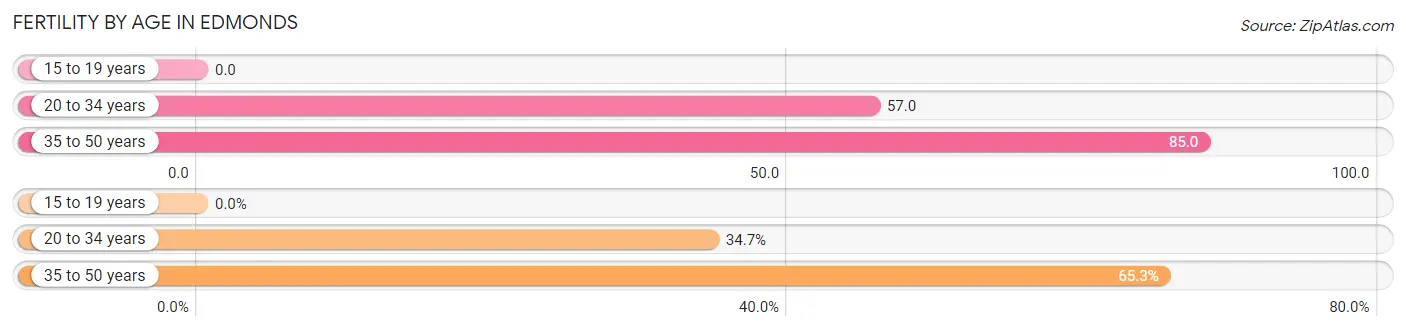
| Age Bracket | Women with Births | Births / 1,000 Women |
| 15 to 19 years | 0 (0.0%) | 0.0 |
| 20 to 34 years | 208 (34.7%) | 57.0 |
| 35 to 50 years | 392 (65.3%) | 85.0 |
| Total | 600 (100.0%) | 66.0 |
Fertility by Age by Marriage Status in Edmonds
71.7% of women with births (600) in Edmonds are married. The highest percentage of unmarried women with births falls into 35 to 50 years age bracket with 32.1% of them unmarried at the time of birth, while the lowest percentage of unmarried women with births belong to 20 to 34 years age bracket with 21.2% of them unmarried.
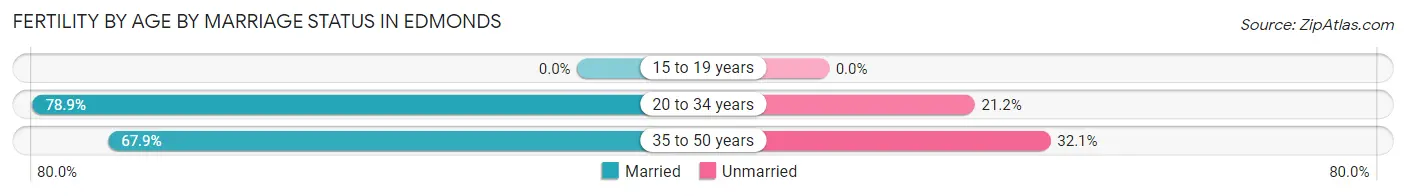
| Age Bracket | Married | Unmarried |
| 15 to 19 years | 0 (0.0%) | 0 (0.0%) |
| 20 to 34 years | 164 (78.8%) | 44 (21.1%) |
| 35 to 50 years | 266 (67.9%) | 126 (32.1%) |
| Total | 430 (71.7%) | 170 (28.3%) |
Fertility by Education in Edmonds
Average fertility rate in Edmonds is 66.0 births per 1,000 women. Women with the education attainment of less than high school have the highest fertility rate of 111.0 births per 1,000 women, while women with the education attainment of bachelor's degree have the lowest fertility at 43.0 births per 1,000 women. Women with the education attainment of college or associate's degree represent 29.2% of all women with births.
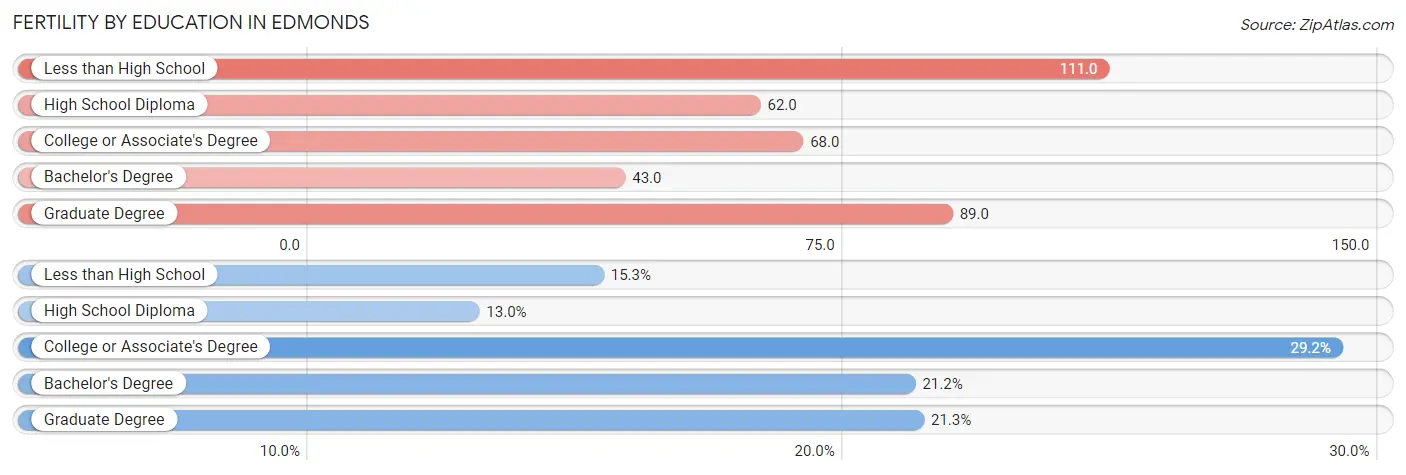
| Educational Attainment | Women with Births | Births / 1,000 Women |
| Less than High School | 92 (15.3%) | 111.0 |
| High School Diploma | 78 (13.0%) | 62.0 |
| College or Associate's Degree | 175 (29.2%) | 68.0 |
| Bachelor's Degree | 127 (21.2%) | 43.0 |
| Graduate Degree | 128 (21.3%) | 89.0 |
| Total | 600 (100.0%) | 66.0 |
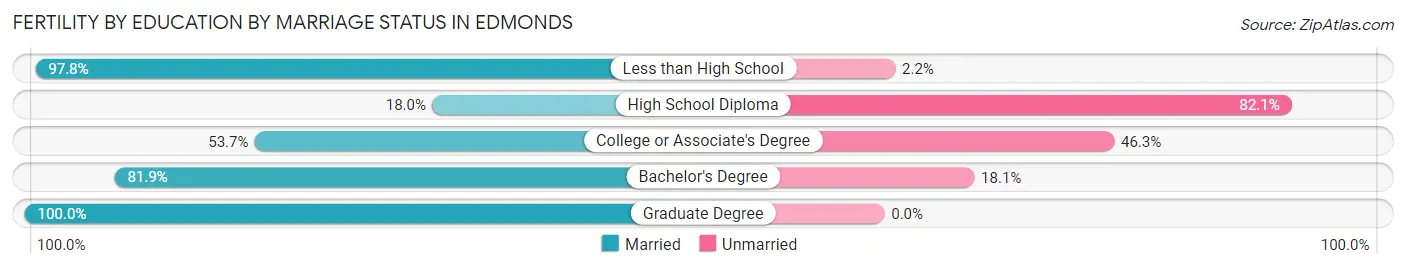
Fertility by Education by Marriage Status in Edmonds
28.3% of women with births in Edmonds are unmarried. Women with the educational attainment of graduate degree are most likely to be married with 100.0% of them married at childbirth, while women with the educational attainment of high school diploma are least likely to be married with 82.1% of them unmarried at childbirth.
| Educational Attainment | Married | Unmarried |
| Less than High School | 90 (97.8%) | 2 (2.2%) |
| High School Diploma | 14 (17.9%) | 64 (82.1%) |
| College or Associate's Degree | 94 (53.7%) | 81 (46.3%) |
| Bachelor's Degree | 104 (81.9%) | 23 (18.1%) |
| Graduate Degree | 128 (100.0%) | 0 (0.0%) |
| Total | 430 (71.7%) | 170 (28.3%) |
Employment Characteristics in Edmonds
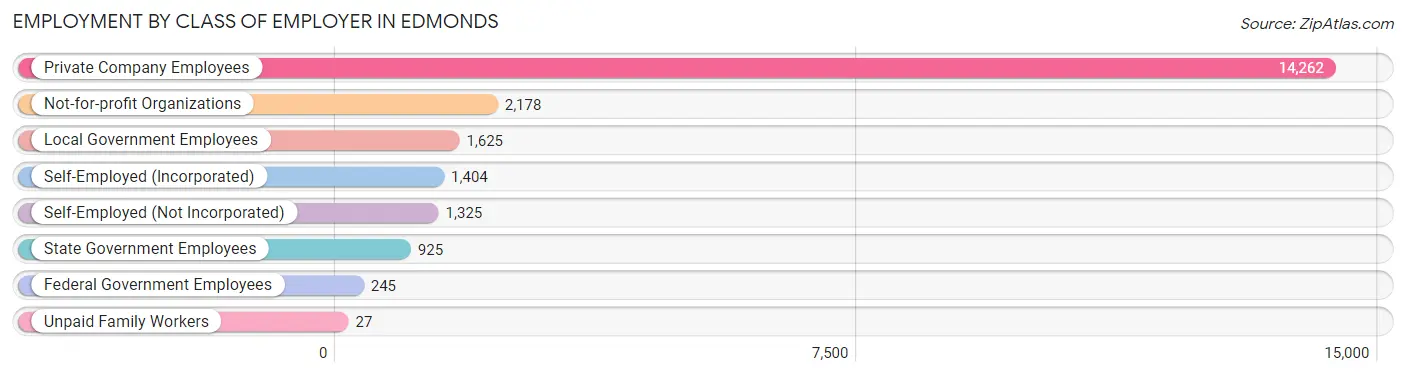
Employment by Class of Employer in Edmonds
Among the 21,991 employed individuals in Edmonds, private company employees (14,262 | 64.8%), not-for-profit organizations (2,178 | 9.9%), and local government employees (1,625 | 7.4%) make up the most common classes of employment.
| Employer Class | # Employees | % Employees |
| Private Company Employees | 14,262 | 64.8% |
| Self-Employed (Incorporated) | 1,404 | 6.4% |
| Self-Employed (Not Incorporated) | 1,325 | 6.0% |
| Not-for-profit Organizations | 2,178 | 9.9% |
| Local Government Employees | 1,625 | 7.4% |
| State Government Employees | 925 | 4.2% |
| Federal Government Employees | 245 | 1.1% |
| Unpaid Family Workers | 27 | 0.1% |
| Total | 21,991 | 100.0% |
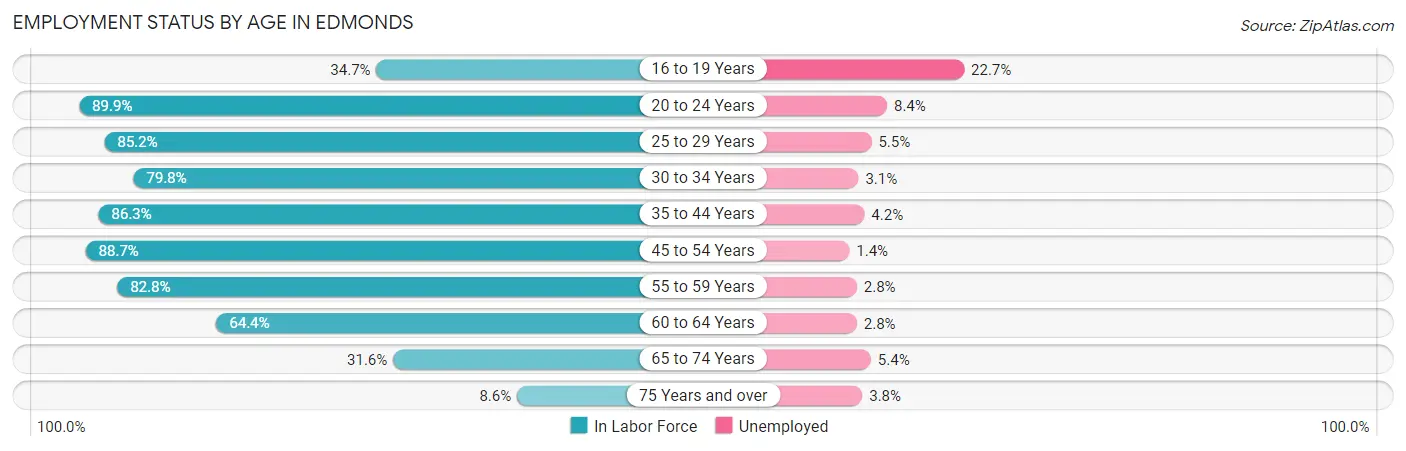
Employment Status by Age in Edmonds
According to the labor force statistics for Edmonds, out of the total population over 16 years of age (36,035), 64.7% or 23,315 individuals are in the labor force, with 4.1% or 956 of them unemployed. The age group with the highest labor force participation rate is 20 to 24 years, with 89.9% or 1,713 individuals in the labor force. Within the labor force, the 16 to 19 years age range has the highest percentage of unemployed individuals, with 22.7% or 105 of them being unemployed.
| Age Bracket | In Labor Force | Unemployed |
| 16 to 19 Years | 463 (34.7%) | 105 (22.7%) |
| 20 to 24 Years | 1,713 (89.9%) | 144 (8.4%) |
| 25 to 29 Years | 2,169 (85.2%) | 119 (5.5%) |
| 30 to 34 Years | 2,211 (79.8%) | 69 (3.1%) |
| 35 to 44 Years | 4,926 (86.3%) | 207 (4.2%) |
| 45 to 54 Years | 5,302 (88.7%) | 74 (1.4%) |
| 55 to 59 Years | 2,375 (82.8%) | 66 (2.8%) |
| 60 to 64 Years | 2,063 (64.4%) | 58 (2.8%) |
| 65 to 74 Years | 1,711 (31.6%) | 92 (5.4%) |
| 75 Years and over | 371 (8.6%) | 14 (3.8%) |
| Total | 23,315 (64.7%) | 956 (4.1%) |
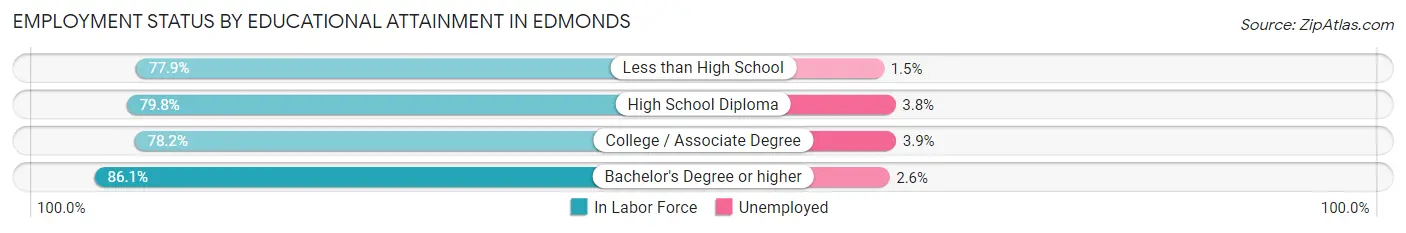
Employment Status by Educational Attainment in Edmonds
According to labor force statistics for Edmonds, 82.5% of individuals (19,036) out of the total population between 25 and 64 years of age (23,074) are in the labor force, with 3.1% or 590 of them being unemployed. The group with the highest labor force participation rate are those with the educational attainment of bachelor's degree or higher, with 86.1% or 10,336 individuals in the labor force. Within the labor force, individuals with college / associate degree education have the highest percentage of unemployment, with 3.9% or 196 of them being unemployed.
| Educational Attainment | In Labor Force | Unemployed |
| Less than High School | 647 (77.9%) | 12 (1.5%) |
| High School Diploma | 3,028 (79.8%) | 144 (3.8%) |
| College / Associate Degree | 5,038 (78.2%) | 251 (3.9%) |
| Bachelor's Degree or higher | 10,336 (86.1%) | 312 (2.6%) |
| Total | 19,036 (82.5%) | 715 (3.1%) |
Employment Occupations by Sex in Edmonds
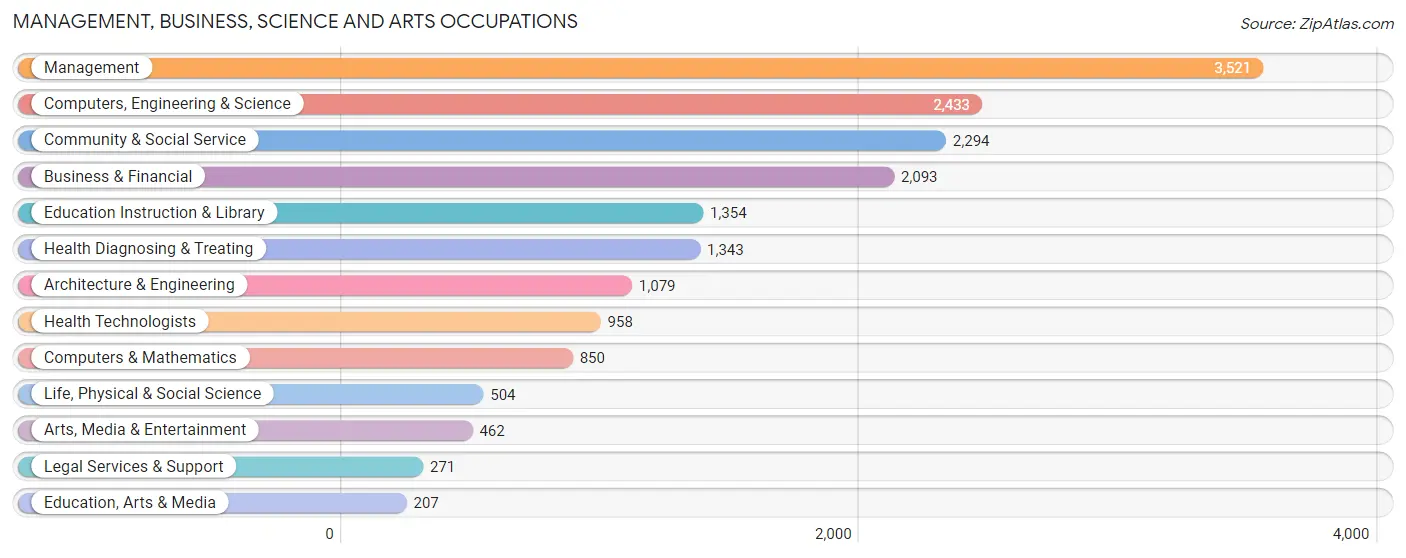
Management, Business, Science and Arts Occupations
The most common Management, Business, Science and Arts occupations in Edmonds are Management (3,521 | 15.8%), Computers, Engineering & Science (2,433 | 10.9%), Community & Social Service (2,294 | 10.3%), Business & Financial (2,093 | 9.4%), and Education Instruction & Library (1,354 | 6.1%).
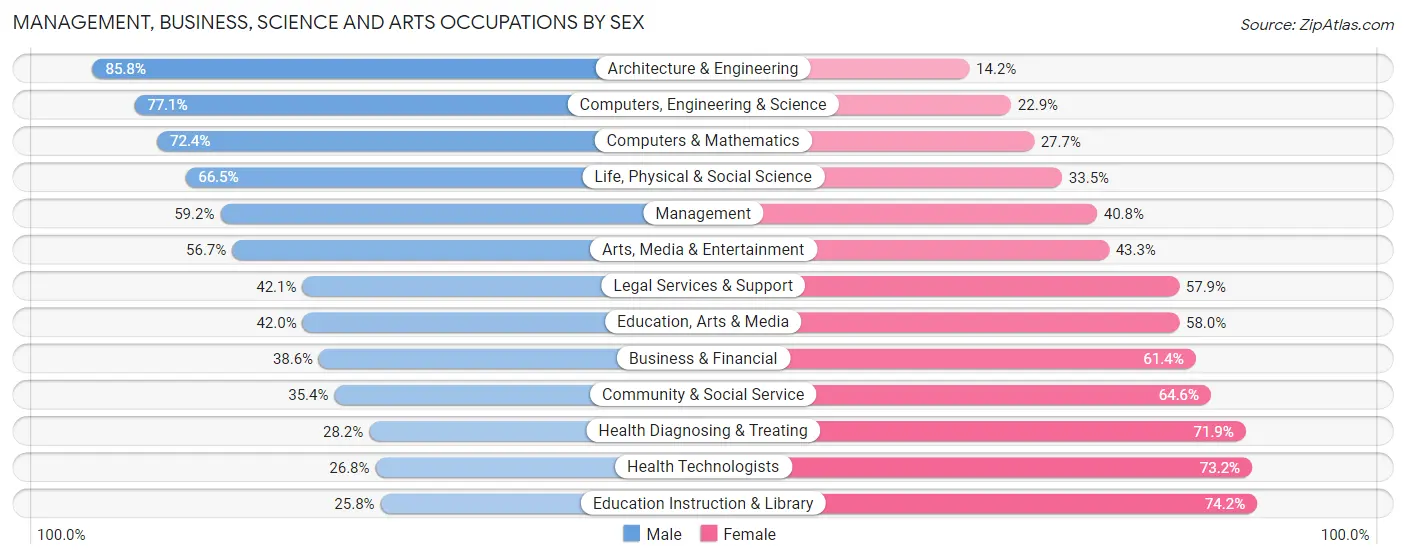
Management, Business, Science and Arts Occupations by Sex
Within the Management, Business, Science and Arts occupations in Edmonds, the most male-oriented occupations are Architecture & Engineering (85.8%), Computers, Engineering & Science (77.1%), and Computers & Mathematics (72.4%), while the most female-oriented occupations are Education Instruction & Library (74.2%), Health Technologists (73.2%), and Health Diagnosing & Treating (71.9%).
| Occupation | Male | Female |
| Management | 2,084 (59.2%) | 1,437 (40.8%) |
| Business & Financial | 808 (38.6%) | 1,285 (61.4%) |
| Computers, Engineering & Science | 1,876 (77.1%) | 557 (22.9%) |
| Computers & Mathematics | 615 (72.4%) | 235 (27.7%) |
| Architecture & Engineering | 926 (85.8%) | 153 (14.2%) |
| Life, Physical & Social Science | 335 (66.5%) | 169 (33.5%) |
| Community & Social Service | 812 (35.4%) | 1,482 (64.6%) |
| Education, Arts & Media | 87 (42.0%) | 120 (58.0%) |
| Legal Services & Support | 114 (42.1%) | 157 (57.9%) |
| Education Instruction & Library | 349 (25.8%) | 1,005 (74.2%) |
| Arts, Media & Entertainment | 262 (56.7%) | 200 (43.3%) |
| Health Diagnosing & Treating | 378 (28.1%) | 965 (71.9%) |
| Health Technologists | 257 (26.8%) | 701 (73.2%) |
| Total (Category) | 5,958 (51.0%) | 5,726 (49.0%) |
| Total (Overall) | 11,216 (50.2%) | 11,113 (49.8%) |
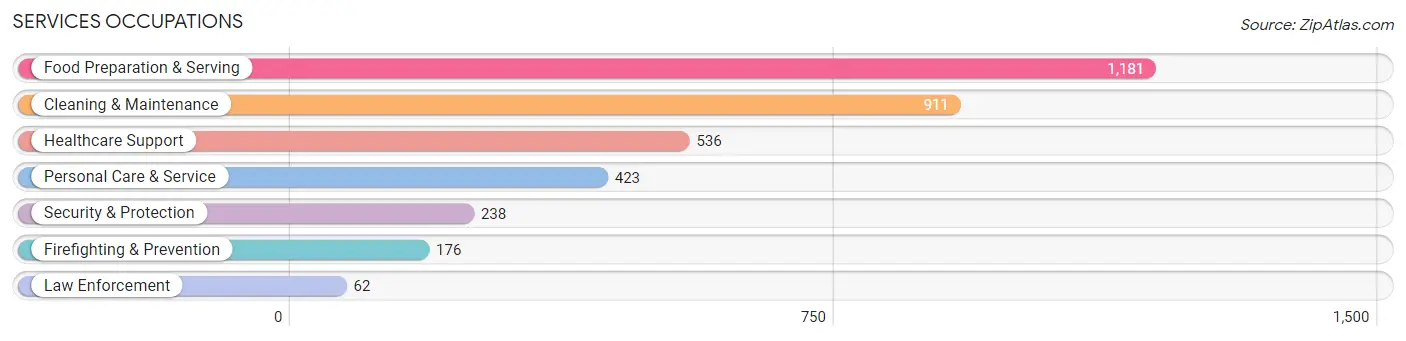
Services Occupations
The most common Services occupations in Edmonds are Food Preparation & Serving (1,181 | 5.3%), Cleaning & Maintenance (911 | 4.1%), Healthcare Support (536 | 2.4%), Personal Care & Service (423 | 1.9%), and Security & Protection (238 | 1.1%).
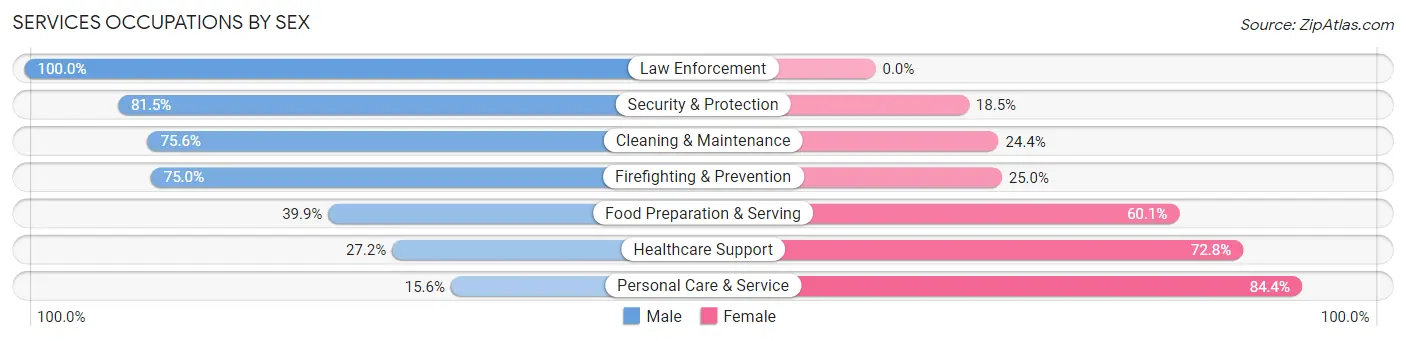
Services Occupations by Sex
Within the Services occupations in Edmonds, the most male-oriented occupations are Law Enforcement (100.0%), Security & Protection (81.5%), and Cleaning & Maintenance (75.6%), while the most female-oriented occupations are Personal Care & Service (84.4%), Healthcare Support (72.8%), and Food Preparation & Serving (60.1%).
| Occupation | Male | Female |
| Healthcare Support | 146 (27.2%) | 390 (72.8%) |
| Security & Protection | 194 (81.5%) | 44 (18.5%) |
| Firefighting & Prevention | 132 (75.0%) | 44 (25.0%) |
| Law Enforcement | 62 (100.0%) | 0 (0.0%) |
| Food Preparation & Serving | 471 (39.9%) | 710 (60.1%) |
| Cleaning & Maintenance | 689 (75.6%) | 222 (24.4%) |
| Personal Care & Service | 66 (15.6%) | 357 (84.4%) |
| Total (Category) | 1,566 (47.6%) | 1,723 (52.4%) |
| Total (Overall) | 11,216 (50.2%) | 11,113 (49.8%) |
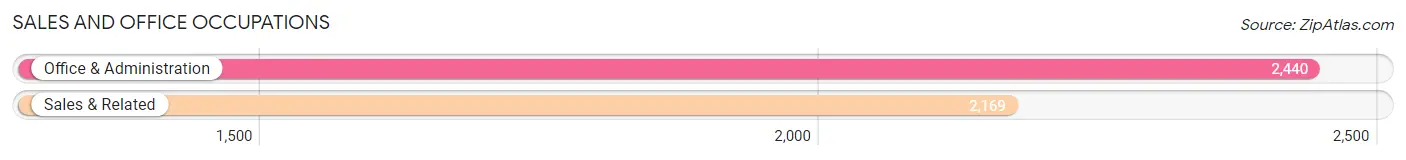
Sales and Office Occupations
The most common Sales and Office occupations in Edmonds are Office & Administration (2,440 | 10.9%), and Sales & Related (2,169 | 9.7%).
Sales and Office Occupations by Sex
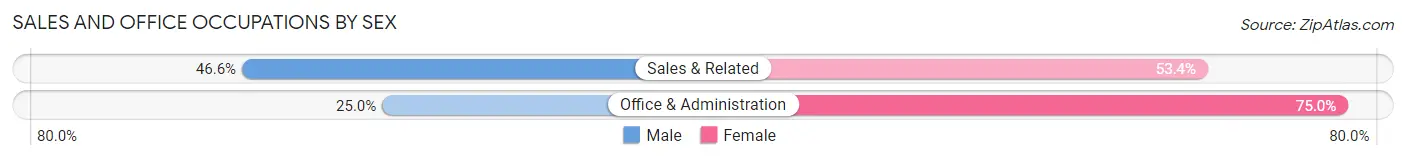
| Occupation | Male | Female |
| Sales & Related | 1,010 (46.6%) | 1,159 (53.4%) |
| Office & Administration | 610 (25.0%) | 1,830 (75.0%) |
| Total (Category) | 1,620 (35.1%) | 2,989 (64.8%) |
| Total (Overall) | 11,216 (50.2%) | 11,113 (49.8%) |
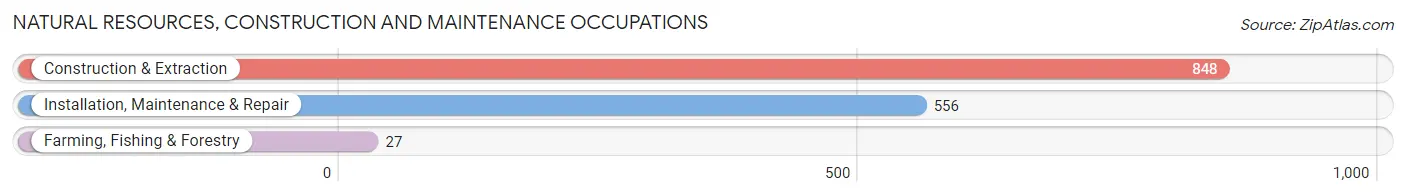
Natural Resources, Construction and Maintenance Occupations
The most common Natural Resources, Construction and Maintenance occupations in Edmonds are Construction & Extraction (848 | 3.8%), Installation, Maintenance & Repair (556 | 2.5%), and Farming, Fishing & Forestry (27 | 0.1%).
Natural Resources, Construction and Maintenance Occupations by Sex
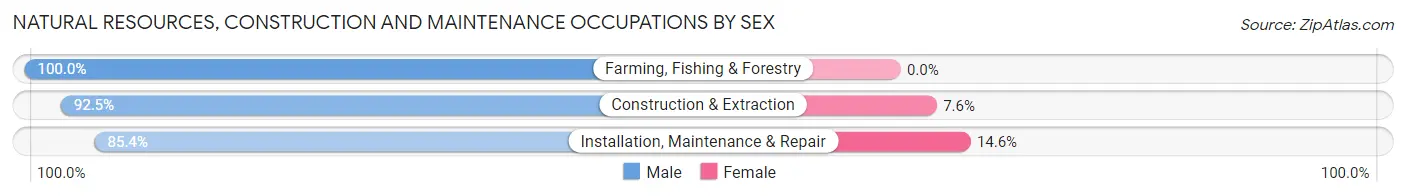
| Occupation | Male | Female |
| Farming, Fishing & Forestry | 27 (100.0%) | 0 (0.0%) |
| Construction & Extraction | 784 (92.4%) | 64 (7.5%) |
| Installation, Maintenance & Repair | 475 (85.4%) | 81 (14.6%) |
| Total (Category) | 1,286 (89.9%) | 145 (10.1%) |
| Total (Overall) | 11,216 (50.2%) | 11,113 (49.8%) |
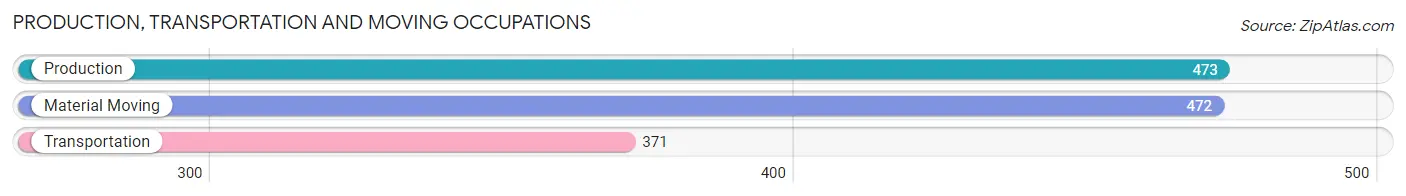
Production, Transportation and Moving Occupations
The most common Production, Transportation and Moving occupations in Edmonds are Production (473 | 2.1%), Material Moving (472 | 2.1%), and Transportation (371 | 1.7%).
Production, Transportation and Moving Occupations by Sex
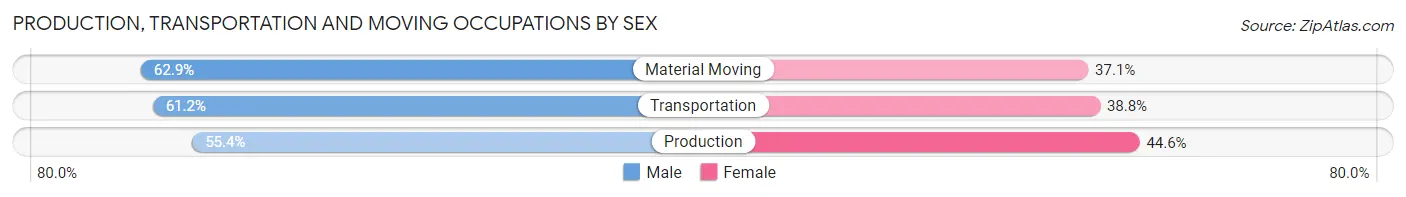
| Occupation | Male | Female |
| Production | 262 (55.4%) | 211 (44.6%) |
| Transportation | 227 (61.2%) | 144 (38.8%) |
| Material Moving | 297 (62.9%) | 175 (37.1%) |
| Total (Category) | 786 (59.7%) | 530 (40.3%) |
| Total (Overall) | 11,216 (50.2%) | 11,113 (49.8%) |
Employment Industries by Sex in Edmonds
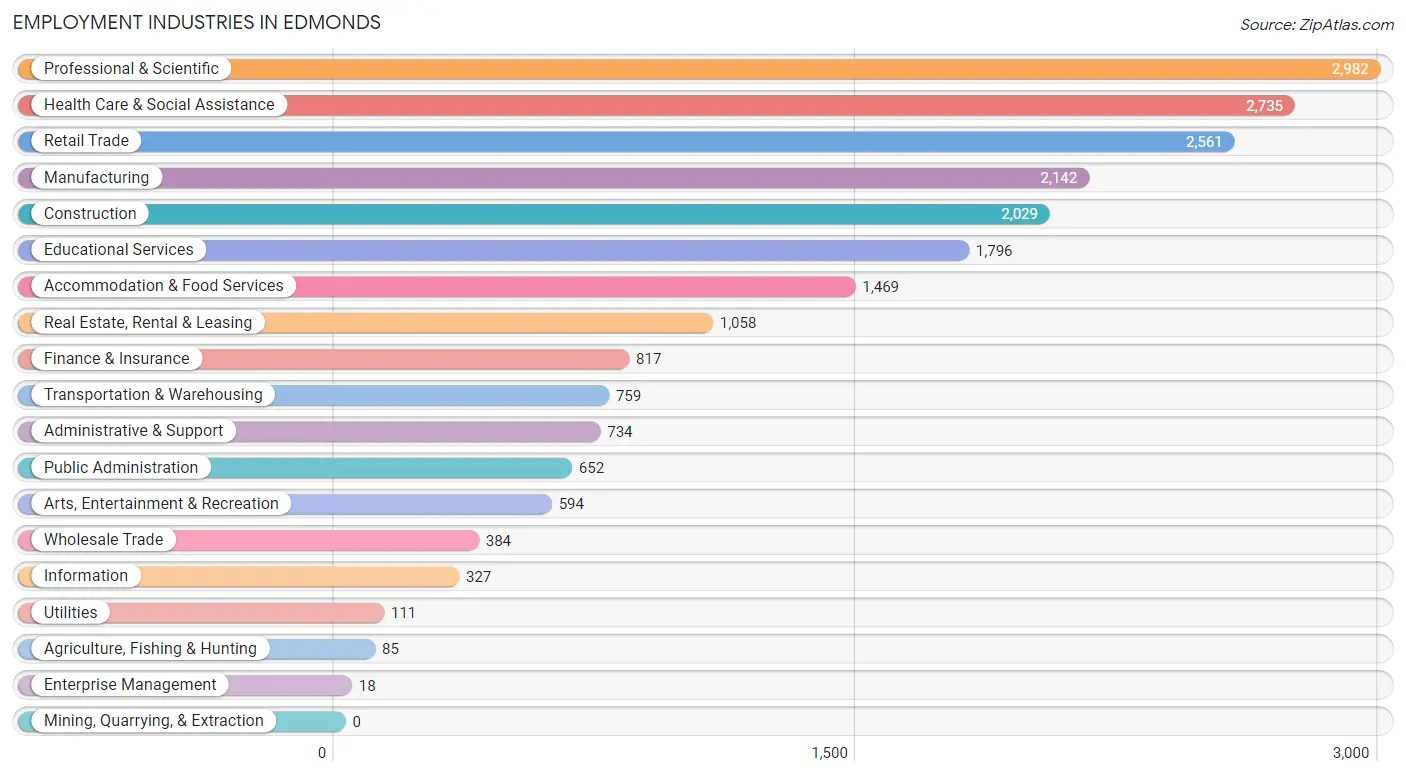
Employment Industries in Edmonds
The major employment industries in Edmonds include Professional & Scientific (2,982 | 13.4%), Health Care & Social Assistance (2,735 | 12.2%), Retail Trade (2,561 | 11.5%), Manufacturing (2,142 | 9.6%), and Construction (2,029 | 9.1%).
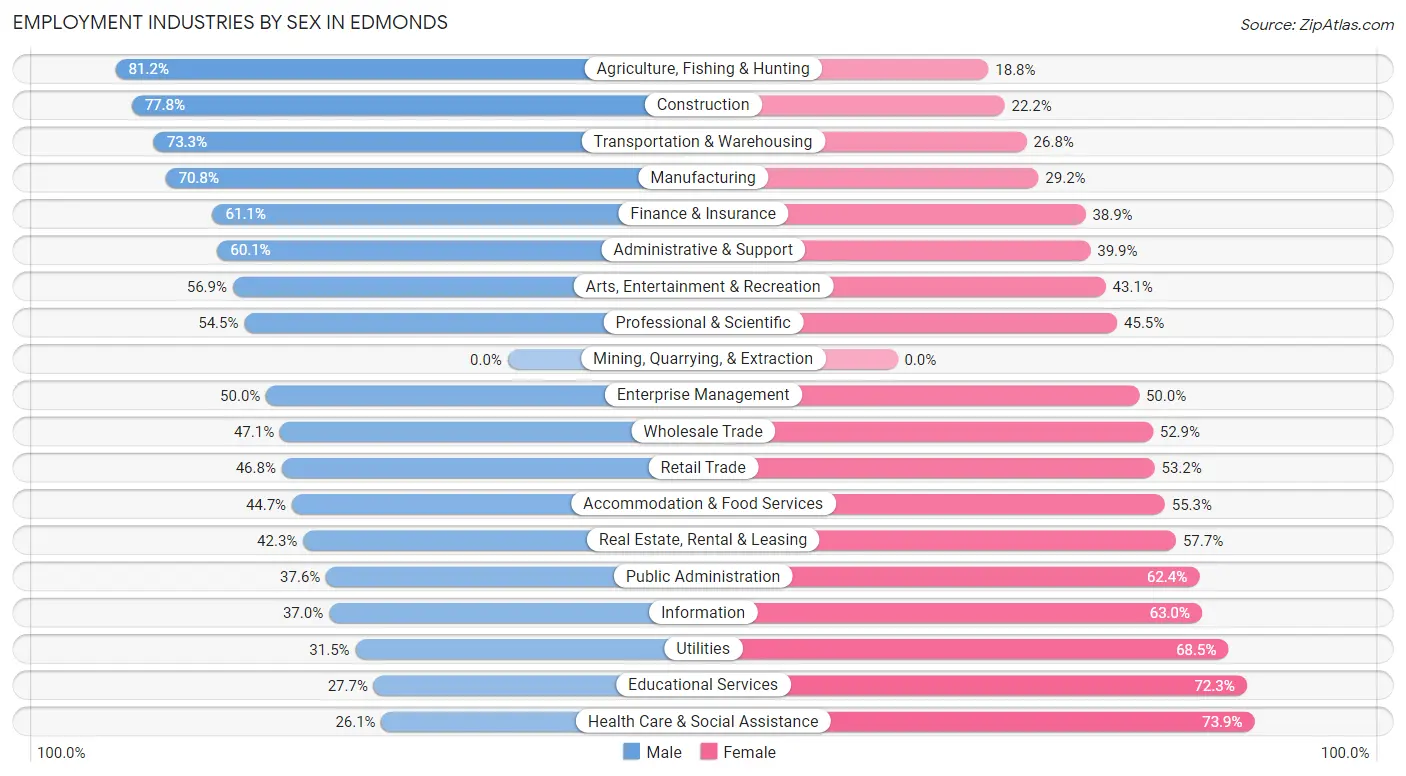
Employment Industries by Sex in Edmonds
The Edmonds industries that see more men than women are Agriculture, Fishing & Hunting (81.2%), Construction (77.8%), and Transportation & Warehousing (73.3%), whereas the industries that tend to have a higher number of women are Health Care & Social Assistance (73.9%), Educational Services (72.3%), and Utilities (68.5%).
| Industry | Male | Female |
| Agriculture, Fishing & Hunting | 69 (81.2%) | 16 (18.8%) |
| Mining, Quarrying, & Extraction | 0 (0.0%) | 0 (0.0%) |
| Construction | 1,579 (77.8%) | 450 (22.2%) |
| Manufacturing | 1,517 (70.8%) | 625 (29.2%) |
| Wholesale Trade | 181 (47.1%) | 203 (52.9%) |
| Retail Trade | 1,198 (46.8%) | 1,363 (53.2%) |
| Transportation & Warehousing | 556 (73.3%) | 203 (26.8%) |
| Utilities | 35 (31.5%) | 76 (68.5%) |
| Information | 121 (37.0%) | 206 (63.0%) |
| Finance & Insurance | 499 (61.1%) | 318 (38.9%) |
| Real Estate, Rental & Leasing | 448 (42.3%) | 610 (57.7%) |
| Professional & Scientific | 1,626 (54.5%) | 1,356 (45.5%) |
| Enterprise Management | 9 (50.0%) | 9 (50.0%) |
| Administrative & Support | 441 (60.1%) | 293 (39.9%) |
| Educational Services | 498 (27.7%) | 1,298 (72.3%) |
| Health Care & Social Assistance | 715 (26.1%) | 2,020 (73.9%) |
| Arts, Entertainment & Recreation | 338 (56.9%) | 256 (43.1%) |
| Accommodation & Food Services | 656 (44.7%) | 813 (55.3%) |
| Public Administration | 245 (37.6%) | 407 (62.4%) |
| Total | 11,216 (50.2%) | 11,113 (49.8%) |
Education in Edmonds
School Enrollment in Edmonds
The most common levels of schooling among the 8,053 students in Edmonds are elementary school (1,842 | 22.9%), high school (1,705 | 21.2%), and middle school (1,512 | 18.8%).
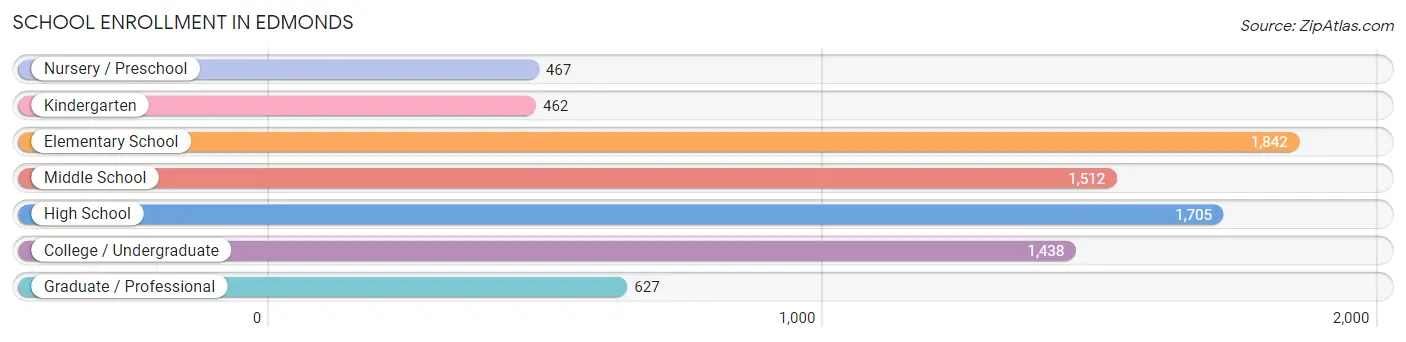
| School Level | # Students | % Students |
| Nursery / Preschool | 467 | 5.8% |
| Kindergarten | 462 | 5.7% |
| Elementary School | 1,842 | 22.9% |
| Middle School | 1,512 | 18.8% |
| High School | 1,705 | 21.2% |
| College / Undergraduate | 1,438 | 17.9% |
| Graduate / Professional | 627 | 7.8% |
| Total | 8,053 | 100.0% |
School Enrollment by Age by Funding Source in Edmonds
Out of a total of 8,053 students who are enrolled in schools in Edmonds, 1,530 (19.0%) attend a private institution, while the remaining 6,523 (81.0%) are enrolled in public schools. The age group of 3 to 4 year olds has the highest likelihood of being enrolled in private schools, with 303 (87.6% in the age bracket) enrolled. Conversely, the age group of 25 to 34 year olds has the lowest likelihood of being enrolled in a private school, with 394 (88.3% in the age bracket) attending a public institution.
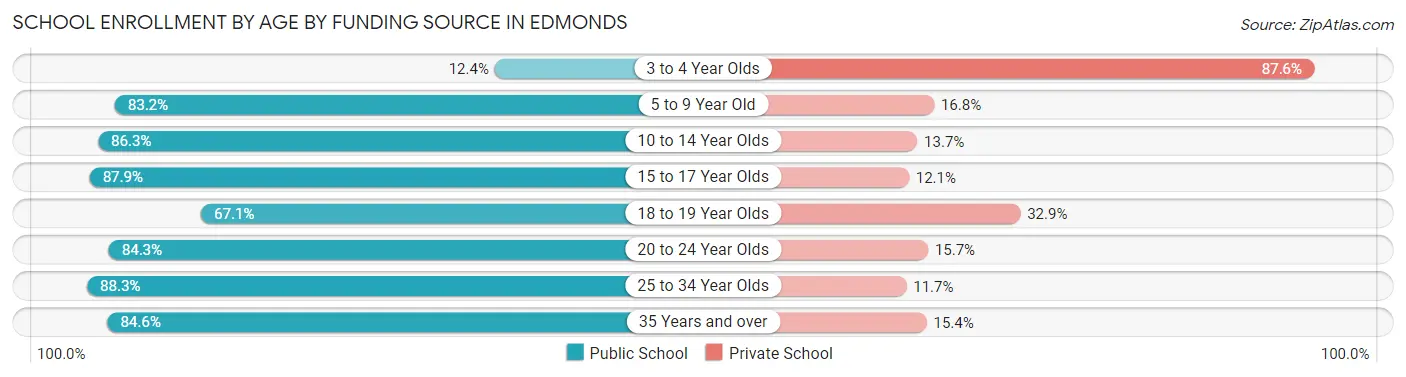
| Age Bracket | Public School | Private School |
| 3 to 4 Year Olds | 43 (12.4%) | 303 (87.6%) |
| 5 to 9 Year Old | 1,874 (83.2%) | 379 (16.8%) |
| 10 to 14 Year Olds | 1,601 (86.3%) | 254 (13.7%) |
| 15 to 17 Year Olds | 1,029 (87.9%) | 142 (12.1%) |
| 18 to 19 Year Olds | 357 (67.1%) | 175 (32.9%) |
| 20 to 24 Year Olds | 671 (84.3%) | 125 (15.7%) |
| 25 to 34 Year Olds | 394 (88.3%) | 52 (11.7%) |
| 35 Years and over | 553 (84.6%) | 101 (15.4%) |
| Total | 6,523 (81.0%) | 1,530 (19.0%) |
Educational Attainment by Field of Study in Edmonds
Business (2,948 | 16.2%), social sciences (2,018 | 11.1%), engineering (1,803 | 9.9%), education (1,625 | 8.9%), and literature & languages (1,368 | 7.5%) are the most common fields of study among 18,217 individuals in Edmonds who have obtained a bachelor's degree or higher.
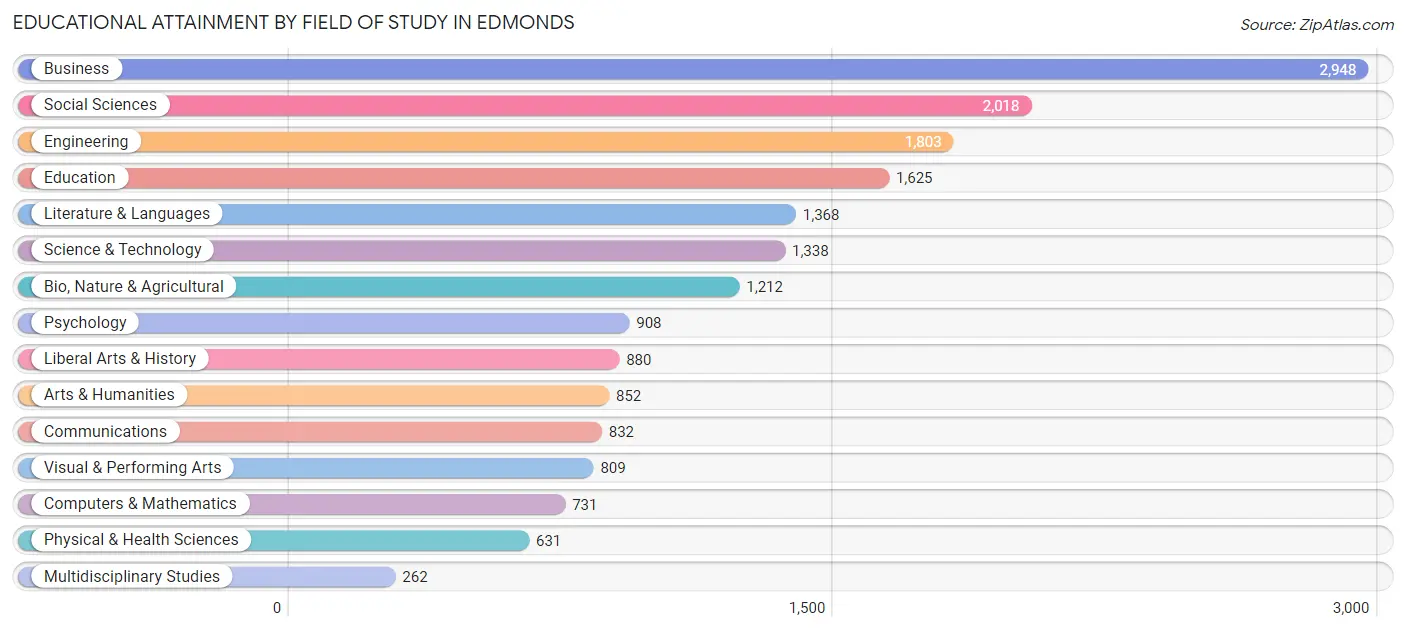
| Field of Study | # Graduates | % Graduates |
| Computers & Mathematics | 731 | 4.0% |
| Bio, Nature & Agricultural | 1,212 | 6.7% |
| Physical & Health Sciences | 631 | 3.5% |
| Psychology | 908 | 5.0% |
| Social Sciences | 2,018 | 11.1% |
| Engineering | 1,803 | 9.9% |
| Multidisciplinary Studies | 262 | 1.4% |
| Science & Technology | 1,338 | 7.3% |
| Business | 2,948 | 16.2% |
| Education | 1,625 | 8.9% |
| Literature & Languages | 1,368 | 7.5% |
| Liberal Arts & History | 880 | 4.8% |
| Visual & Performing Arts | 809 | 4.4% |
| Communications | 832 | 4.6% |
| Arts & Humanities | 852 | 4.7% |
| Total | 18,217 | 100.0% |
Transportation & Commute in Edmonds
Vehicle Availability by Sex in Edmonds
The most prevalent vehicle ownership categories in Edmonds are males with 2 vehicles (5,153, accounting for 46.7%) and females with 2 vehicles (4,100, making up 47.1%).
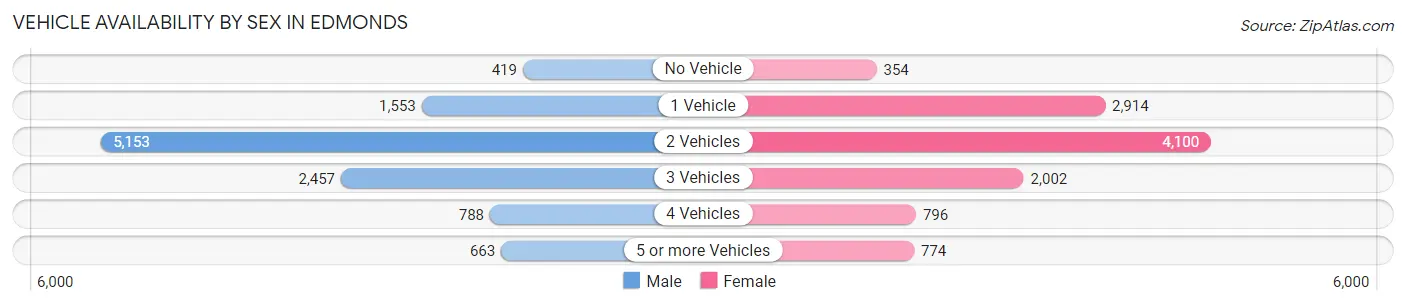
| Vehicles Available | Male | Female |
| No Vehicle | 419 (3.8%) | 354 (3.2%) |
| 1 Vehicle | 1,553 (14.1%) | 2,914 (26.6%) |
| 2 Vehicles | 5,153 (46.7%) | 4,100 (37.5%) |
| 3 Vehicles | 2,457 (22.3%) | 2,002 (18.3%) |
| 4 Vehicles | 788 (7.1%) | 796 (7.3%) |
| 5 or more Vehicles | 663 (6.0%) | 774 (7.1%) |
| Total | 11,033 (100.0%) | 10,940 (100.0%) |
Commute Time in Edmonds
The most frequently occuring commute durations in Edmonds are 30 to 34 minutes (2,483 commuters, 14.3%), 15 to 19 minutes (2,161 commuters, 12.5%), and 45 to 59 minutes (2,155 commuters, 12.4%).
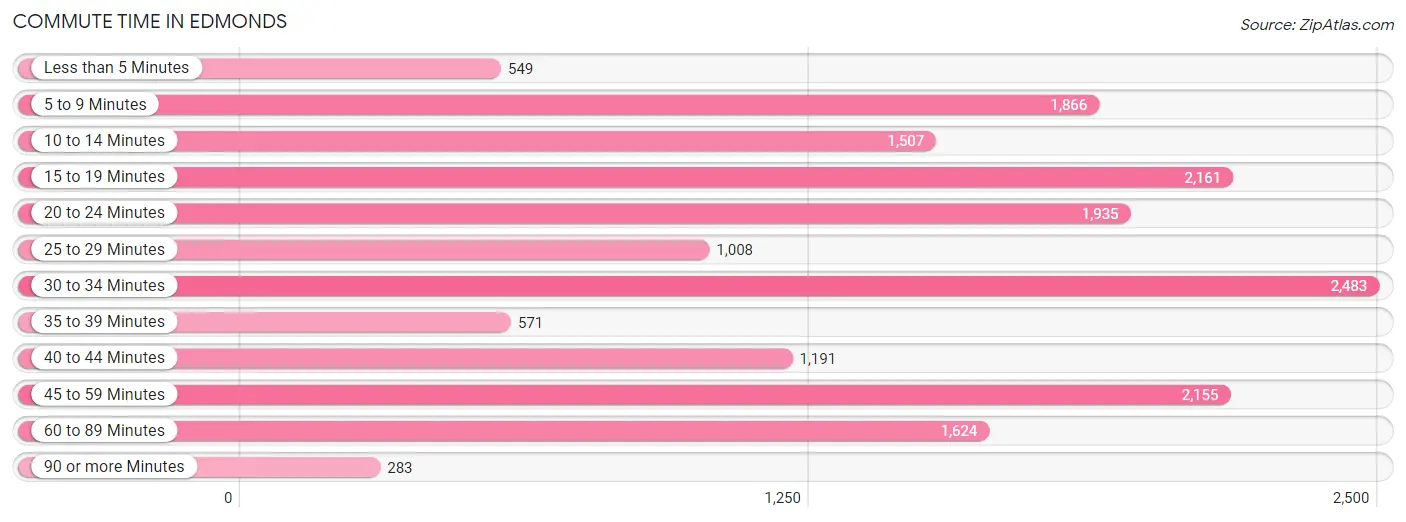
| Commute Time | # Commuters | % Commuters |
| Less than 5 Minutes | 549 | 3.2% |
| 5 to 9 Minutes | 1,866 | 10.8% |
| 10 to 14 Minutes | 1,507 | 8.7% |
| 15 to 19 Minutes | 2,161 | 12.5% |
| 20 to 24 Minutes | 1,935 | 11.2% |
| 25 to 29 Minutes | 1,008 | 5.8% |
| 30 to 34 Minutes | 2,483 | 14.3% |
| 35 to 39 Minutes | 571 | 3.3% |
| 40 to 44 Minutes | 1,191 | 6.9% |
| 45 to 59 Minutes | 2,155 | 12.4% |
| 60 to 89 Minutes | 1,624 | 9.4% |
| 90 or more Minutes | 283 | 1.6% |
Commute Time by Sex in Edmonds
The most common commute times in Edmonds are 45 to 59 minutes (1,407 commuters, 15.9%) for males and 15 to 19 minutes (1,410 commuters, 16.6%) for females.
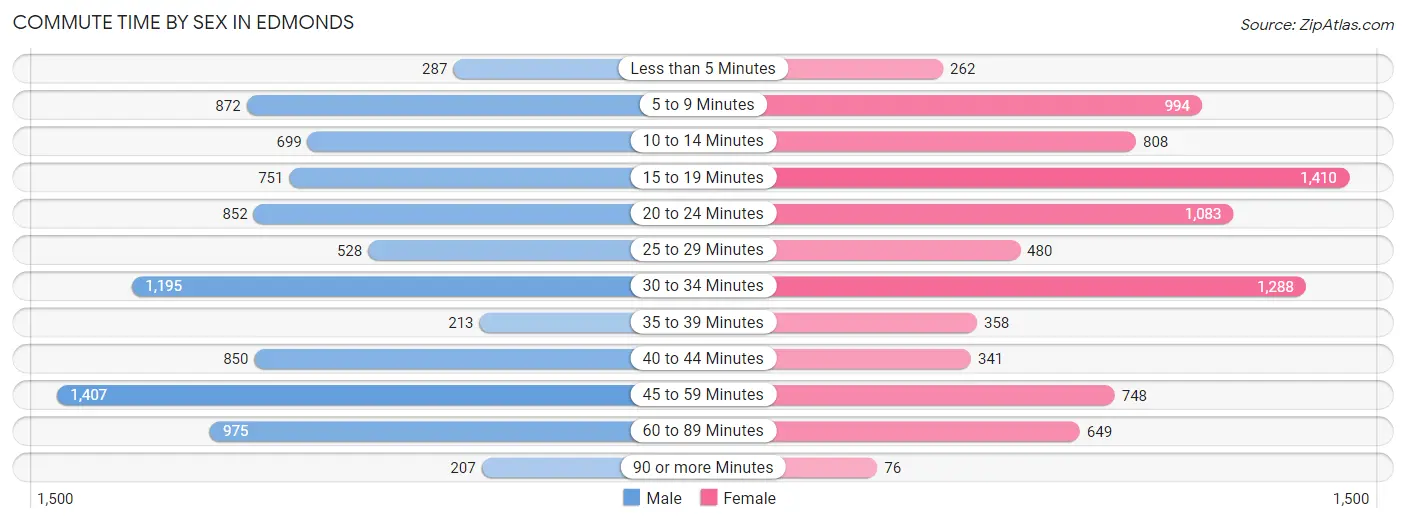
| Commute Time | Male | Female |
| Less than 5 Minutes | 287 (3.3%) | 262 (3.1%) |
| 5 to 9 Minutes | 872 (9.9%) | 994 (11.7%) |
| 10 to 14 Minutes | 699 (7.9%) | 808 (9.5%) |
| 15 to 19 Minutes | 751 (8.5%) | 1,410 (16.6%) |
| 20 to 24 Minutes | 852 (9.6%) | 1,083 (12.8%) |
| 25 to 29 Minutes | 528 (6.0%) | 480 (5.7%) |
| 30 to 34 Minutes | 1,195 (13.5%) | 1,288 (15.2%) |
| 35 to 39 Minutes | 213 (2.4%) | 358 (4.2%) |
| 40 to 44 Minutes | 850 (9.6%) | 341 (4.0%) |
| 45 to 59 Minutes | 1,407 (15.9%) | 748 (8.8%) |
| 60 to 89 Minutes | 975 (11.0%) | 649 (7.6%) |
| 90 or more Minutes | 207 (2.3%) | 76 (0.9%) |
Time of Departure to Work by Sex in Edmonds
The most frequent times of departure to work in Edmonds are 6:00 AM to 6:29 AM (1,171, 13.3%) for males and 6:30 AM to 6:59 AM (1,239, 14.6%) for females.
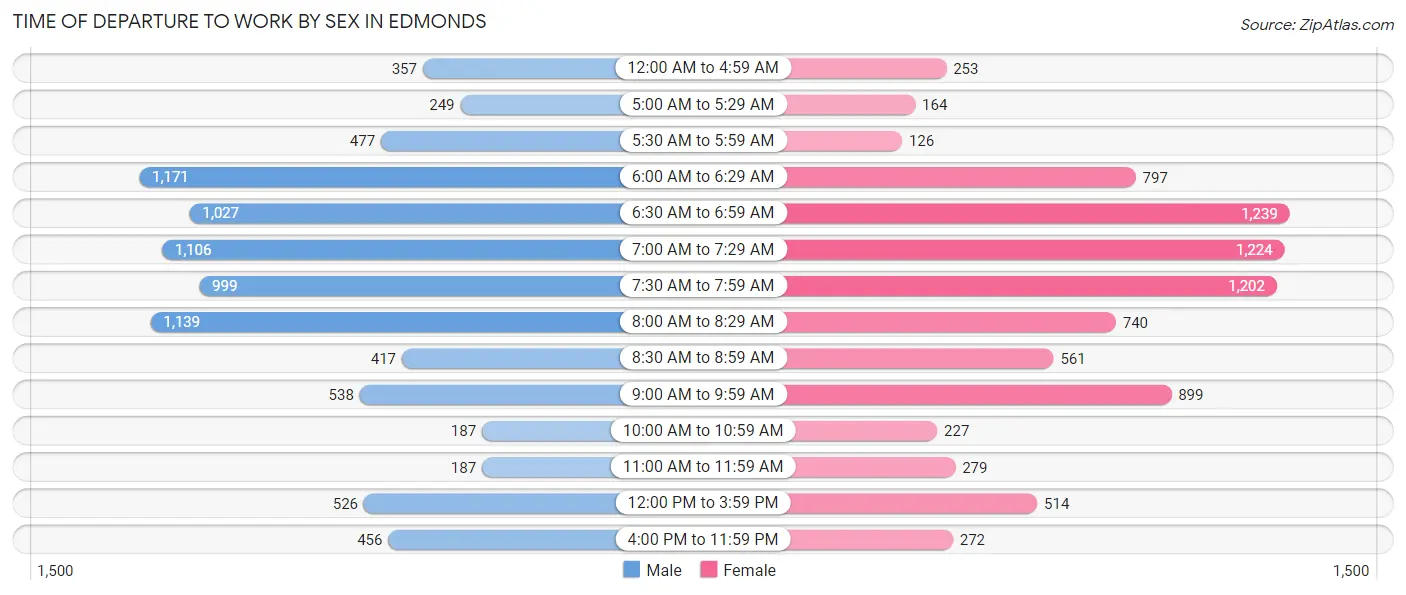
| Time of Departure | Male | Female |
| 12:00 AM to 4:59 AM | 357 (4.0%) | 253 (3.0%) |
| 5:00 AM to 5:29 AM | 249 (2.8%) | 164 (1.9%) |
| 5:30 AM to 5:59 AM | 477 (5.4%) | 126 (1.5%) |
| 6:00 AM to 6:29 AM | 1,171 (13.3%) | 797 (9.4%) |
| 6:30 AM to 6:59 AM | 1,027 (11.6%) | 1,239 (14.6%) |
| 7:00 AM to 7:29 AM | 1,106 (12.5%) | 1,224 (14.4%) |
| 7:30 AM to 7:59 AM | 999 (11.3%) | 1,202 (14.1%) |
| 8:00 AM to 8:29 AM | 1,139 (12.9%) | 740 (8.7%) |
| 8:30 AM to 8:59 AM | 417 (4.7%) | 561 (6.6%) |
| 9:00 AM to 9:59 AM | 538 (6.1%) | 899 (10.6%) |
| 10:00 AM to 10:59 AM | 187 (2.1%) | 227 (2.7%) |
| 11:00 AM to 11:59 AM | 187 (2.1%) | 279 (3.3%) |
| 12:00 PM to 3:59 PM | 526 (5.9%) | 514 (6.0%) |
| 4:00 PM to 11:59 PM | 456 (5.2%) | 272 (3.2%) |
| Total | 8,836 (100.0%) | 8,497 (100.0%) |
Housing Occupancy in Edmonds
Occupancy by Ownership in Edmonds
Of the total 18,269 dwellings in Edmonds, owner-occupied units account for 12,728 (69.7%), while renter-occupied units make up 5,541 (30.3%).
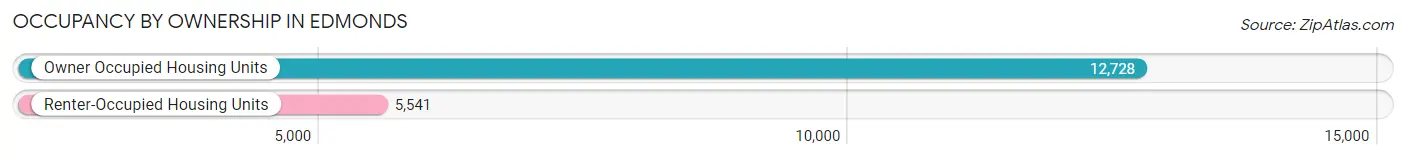
| Occupancy | # Housing Units | % Housing Units |
| Owner Occupied Housing Units | 12,728 | 69.7% |
| Renter-Occupied Housing Units | 5,541 | 30.3% |
| Total Occupied Housing Units | 18,269 | 100.0% |
Occupancy by Household Size in Edmonds
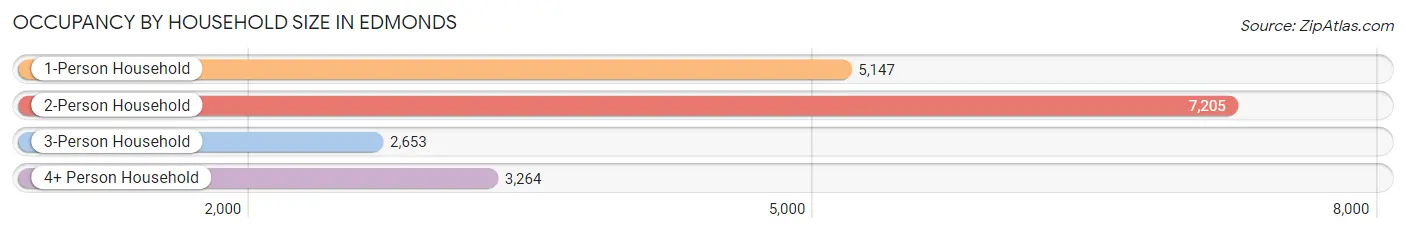
| Household Size | # Housing Units | % Housing Units |
| 1-Person Household | 5,147 | 28.2% |
| 2-Person Household | 7,205 | 39.4% |
| 3-Person Household | 2,653 | 14.5% |
| 4+ Person Household | 3,264 | 17.9% |
| Total Housing Units | 18,269 | 100.0% |
Occupancy by Ownership by Household Size in Edmonds
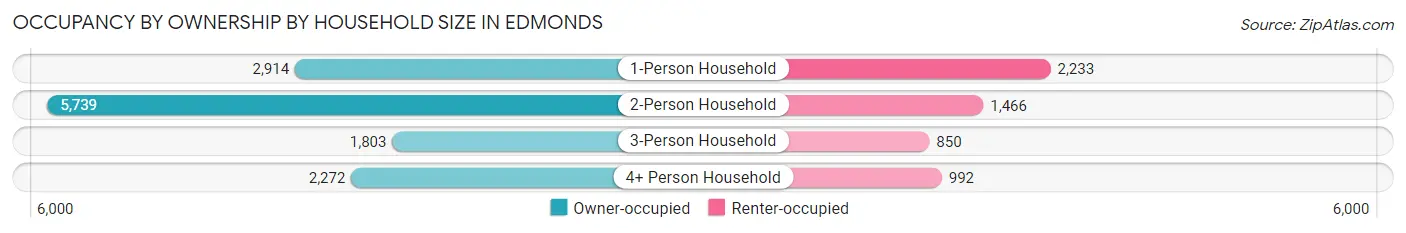
| Household Size | Owner-occupied | Renter-occupied |
| 1-Person Household | 2,914 (56.6%) | 2,233 (43.4%) |
| 2-Person Household | 5,739 (79.6%) | 1,466 (20.3%) |
| 3-Person Household | 1,803 (68.0%) | 850 (32.0%) |
| 4+ Person Household | 2,272 (69.6%) | 992 (30.4%) |
| Total Housing Units | 12,728 (69.7%) | 5,541 (30.3%) |
Occupancy by Educational Attainment in Edmonds
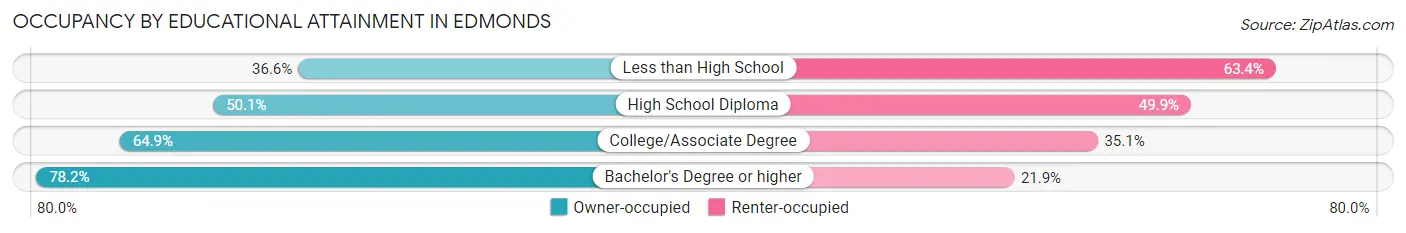
| Household Size | Owner-occupied | Renter-occupied |
| Less than High School | 115 (36.6%) | 199 (63.4%) |
| High School Diploma | 1,211 (50.1%) | 1,207 (49.9%) |
| College/Associate Degree | 3,624 (64.9%) | 1,960 (35.1%) |
| Bachelor's Degree or higher | 7,778 (78.1%) | 2,175 (21.8%) |
Occupancy by Age of Householder in Edmonds
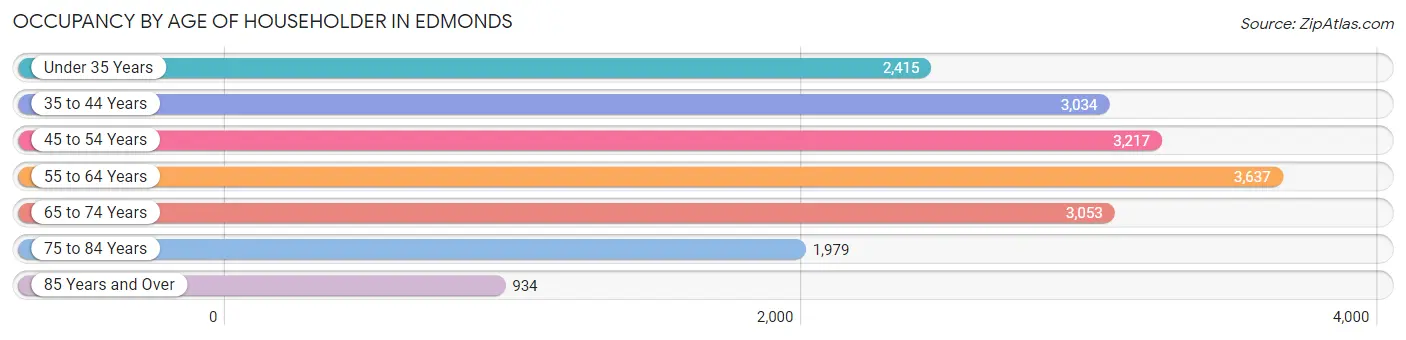
| Age Bracket | # Households | % Households |
| Under 35 Years | 2,415 | 13.2% |
| 35 to 44 Years | 3,034 | 16.6% |
| 45 to 54 Years | 3,217 | 17.6% |
| 55 to 64 Years | 3,637 | 19.9% |
| 65 to 74 Years | 3,053 | 16.7% |
| 75 to 84 Years | 1,979 | 10.8% |
| 85 Years and Over | 934 | 5.1% |
| Total | 18,269 | 100.0% |
Housing Finances in Edmonds
Median Income by Occupancy in Edmonds
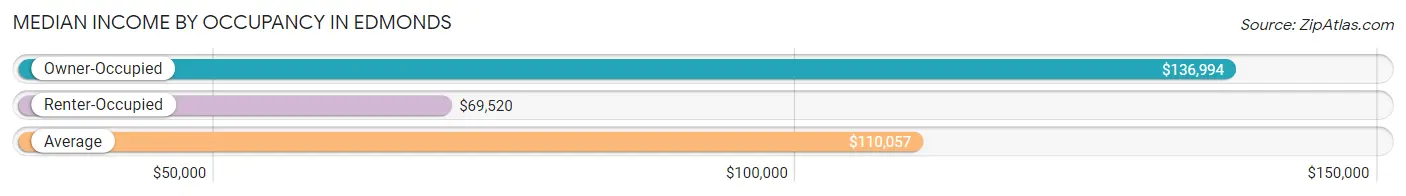
| Occupancy Type | # Households | Median Income |
| Owner-Occupied | 12,728 (69.7%) | $136,994 |
| Renter-Occupied | 5,541 (30.3%) | $69,520 |
| Average | 18,269 (100.0%) | $110,057 |
Occupancy by Householder Income Bracket in Edmonds
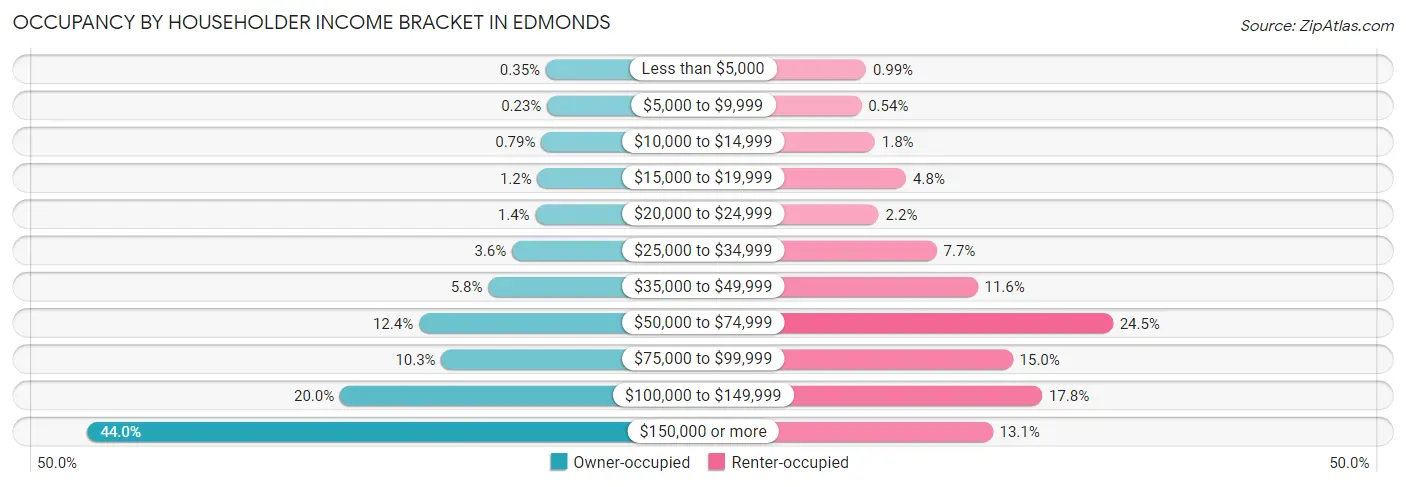
| Income Bracket | Owner-occupied | Renter-occupied |
| Less than $5,000 | 45 (0.4%) | 55 (1.0%) |
| $5,000 to $9,999 | 29 (0.2%) | 30 (0.5%) |
| $10,000 to $14,999 | 101 (0.8%) | 102 (1.8%) |
| $15,000 to $19,999 | 147 (1.1%) | 267 (4.8%) |
| $20,000 to $24,999 | 172 (1.3%) | 122 (2.2%) |
| $25,000 to $34,999 | 455 (3.6%) | 428 (7.7%) |
| $35,000 to $49,999 | 743 (5.8%) | 644 (11.6%) |
| $50,000 to $74,999 | 1,583 (12.4%) | 1,357 (24.5%) |
| $75,000 to $99,999 | 1,311 (10.3%) | 829 (15.0%) |
| $100,000 to $149,999 | 2,540 (20.0%) | 984 (17.8%) |
| $150,000 or more | 5,602 (44.0%) | 723 (13.1%) |
| Total | 12,728 (100.0%) | 5,541 (100.0%) |
Monthly Housing Cost Tiers in Edmonds
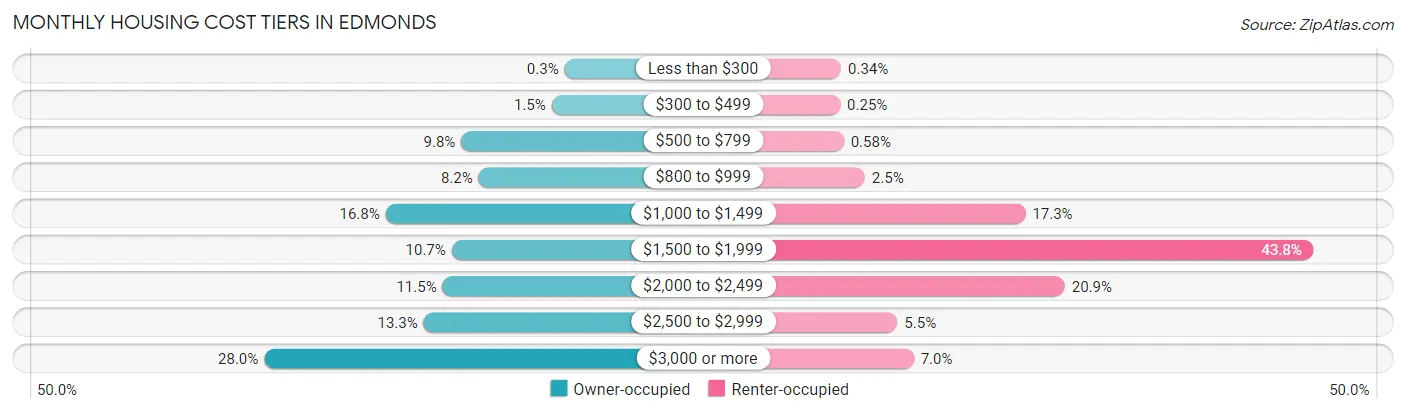
| Monthly Cost | Owner-occupied | Renter-occupied |
| Less than $300 | 38 (0.3%) | 19 (0.3%) |
| $300 to $499 | 188 (1.5%) | 14 (0.3%) |
| $500 to $799 | 1,249 (9.8%) | 32 (0.6%) |
| $800 to $999 | 1,045 (8.2%) | 140 (2.5%) |
| $1,000 to $1,499 | 2,135 (16.8%) | 959 (17.3%) |
| $1,500 to $1,999 | 1,360 (10.7%) | 2,429 (43.8%) |
| $2,000 to $2,499 | 1,467 (11.5%) | 1,160 (20.9%) |
| $2,500 to $2,999 | 1,689 (13.3%) | 306 (5.5%) |
| $3,000 or more | 3,557 (28.0%) | 389 (7.0%) |
| Total | 12,728 (100.0%) | 5,541 (100.0%) |
Physical Housing Characteristics in Edmonds
Housing Structures in Edmonds
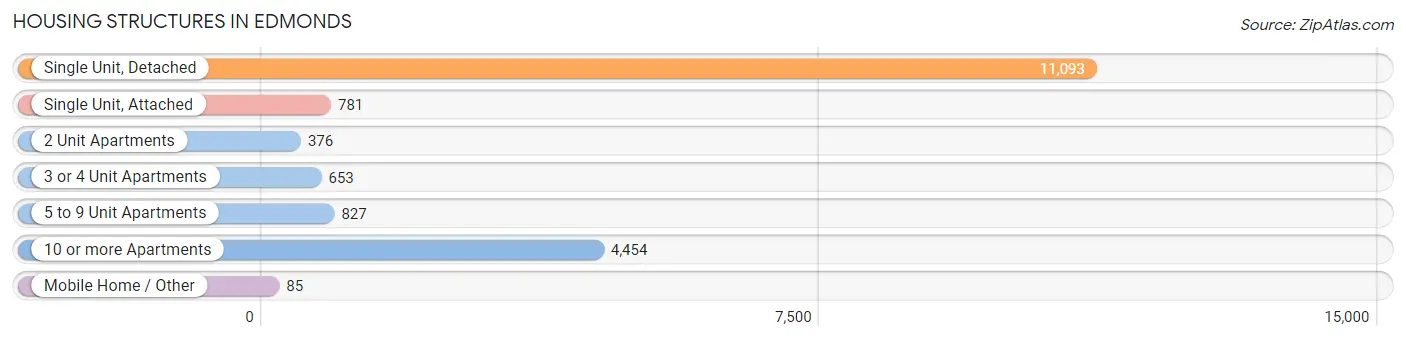
| Structure Type | # Housing Units | % Housing Units |
| Single Unit, Detached | 11,093 | 60.7% |
| Single Unit, Attached | 781 | 4.3% |
| 2 Unit Apartments | 376 | 2.1% |
| 3 or 4 Unit Apartments | 653 | 3.6% |
| 5 to 9 Unit Apartments | 827 | 4.5% |
| 10 or more Apartments | 4,454 | 24.4% |
| Mobile Home / Other | 85 | 0.5% |
| Total | 18,269 | 100.0% |
Housing Structures by Occupancy in Edmonds
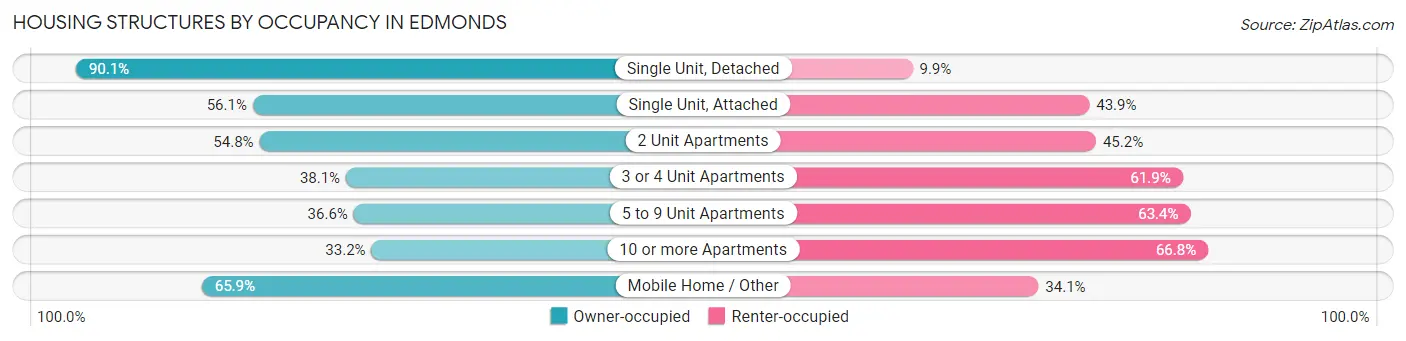
| Structure Type | Owner-occupied | Renter-occupied |
| Single Unit, Detached | 9,996 (90.1%) | 1,097 (9.9%) |
| Single Unit, Attached | 438 (56.1%) | 343 (43.9%) |
| 2 Unit Apartments | 206 (54.8%) | 170 (45.2%) |
| 3 or 4 Unit Apartments | 249 (38.1%) | 404 (61.9%) |
| 5 to 9 Unit Apartments | 303 (36.6%) | 524 (63.4%) |
| 10 or more Apartments | 1,480 (33.2%) | 2,974 (66.8%) |
| Mobile Home / Other | 56 (65.9%) | 29 (34.1%) |
| Total | 12,728 (69.7%) | 5,541 (30.3%) |
Housing Structures by Number of Rooms in Edmonds
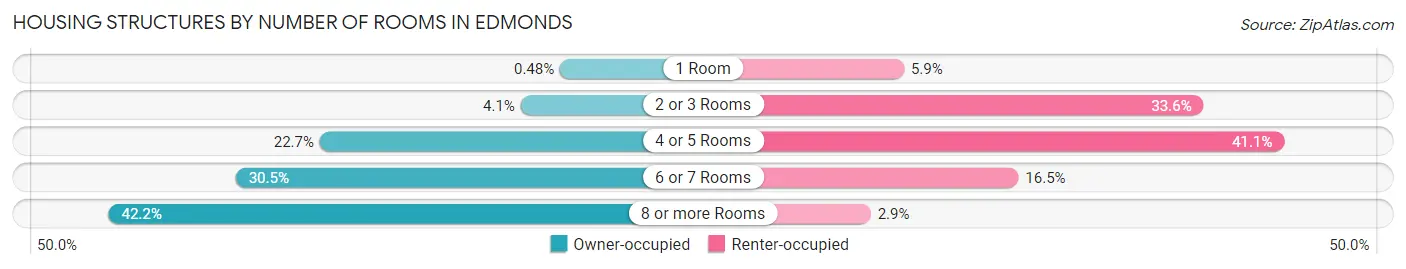
| Number of Rooms | Owner-occupied | Renter-occupied |
| 1 Room | 61 (0.5%) | 328 (5.9%) |
| 2 or 3 Rooms | 525 (4.1%) | 1,863 (33.6%) |
| 4 or 5 Rooms | 2,889 (22.7%) | 2,277 (41.1%) |
| 6 or 7 Rooms | 3,878 (30.5%) | 915 (16.5%) |
| 8 or more Rooms | 5,375 (42.2%) | 158 (2.9%) |
| Total | 12,728 (100.0%) | 5,541 (100.0%) |
Housing Structure by Heating Type in Edmonds
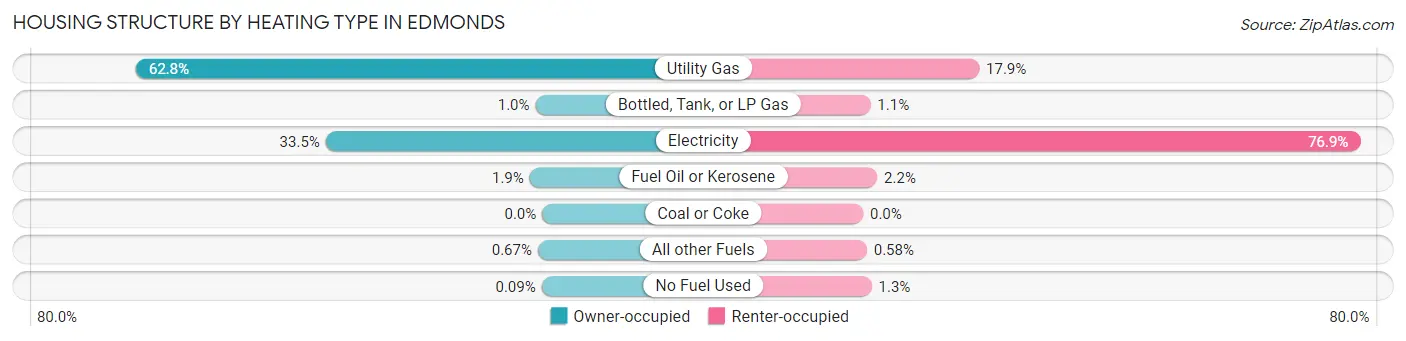
| Heating Type | Owner-occupied | Renter-occupied |
| Utility Gas | 7,994 (62.8%) | 994 (17.9%) |
| Bottled, Tank, or LP Gas | 133 (1.0%) | 63 (1.1%) |
| Electricity | 4,259 (33.5%) | 4,258 (76.8%) |
| Fuel Oil or Kerosene | 246 (1.9%) | 121 (2.2%) |
| Coal or Coke | 0 (0.0%) | 0 (0.0%) |
| All other Fuels | 85 (0.7%) | 32 (0.6%) |
| No Fuel Used | 11 (0.1%) | 73 (1.3%) |
| Total | 12,728 (100.0%) | 5,541 (100.0%) |
Household Vehicle Usage in Edmonds
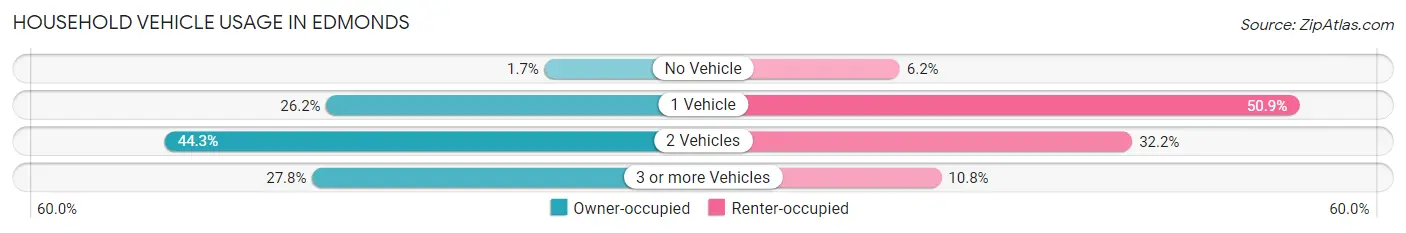
| Vehicles per Household | Owner-occupied | Renter-occupied |
| No Vehicle | 222 (1.7%) | 341 (6.1%) |
| 1 Vehicle | 3,334 (26.2%) | 2,818 (50.9%) |
| 2 Vehicles | 5,637 (44.3%) | 1,783 (32.2%) |
| 3 or more Vehicles | 3,535 (27.8%) | 599 (10.8%) |
| Total | 12,728 (100.0%) | 5,541 (100.0%) |
Real Estate & Mortgages in Edmonds
Real Estate and Mortgage Overview in Edmonds
| Characteristic | Without Mortgage | With Mortgage |
| Housing Units | 4,643 | 8,085 |
| Median Property Value | $739,100 | $773,900 |
| Median Household Income | $90,600 | $4,408 |
| Monthly Housing Costs | $980 | $3,470 |
| Real Estate Taxes | $6,008 | $16 |
Property Value by Mortgage Status in Edmonds
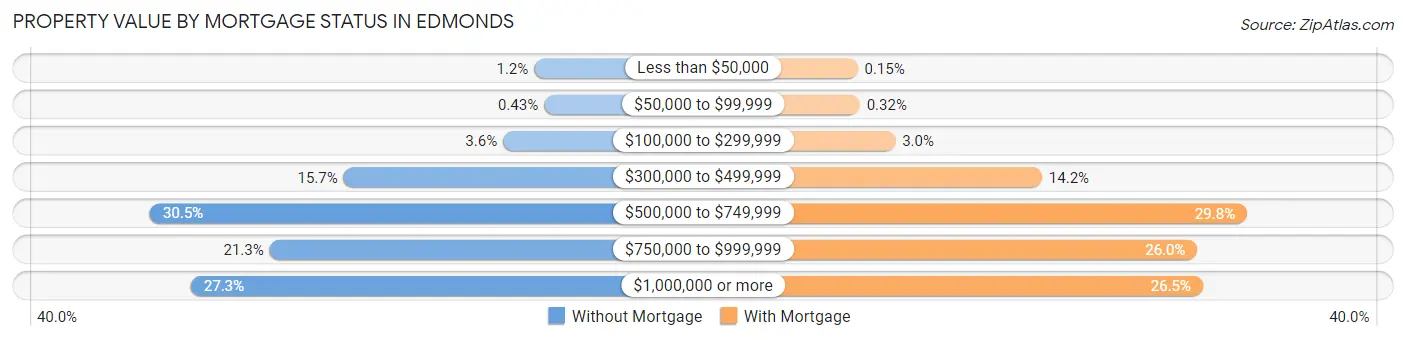
| Property Value | Without Mortgage | With Mortgage |
| Less than $50,000 | 55 (1.2%) | 12 (0.2%) |
| $50,000 to $99,999 | 20 (0.4%) | 26 (0.3%) |
| $100,000 to $299,999 | 165 (3.5%) | 244 (3.0%) |
| $300,000 to $499,999 | 729 (15.7%) | 1,148 (14.2%) |
| $500,000 to $749,999 | 1,414 (30.4%) | 2,411 (29.8%) |
| $750,000 to $999,999 | 991 (21.3%) | 2,105 (26.0%) |
| $1,000,000 or more | 1,269 (27.3%) | 2,139 (26.5%) |
| Total | 4,643 (100.0%) | 8,085 (100.0%) |
Household Income by Mortgage Status in Edmonds
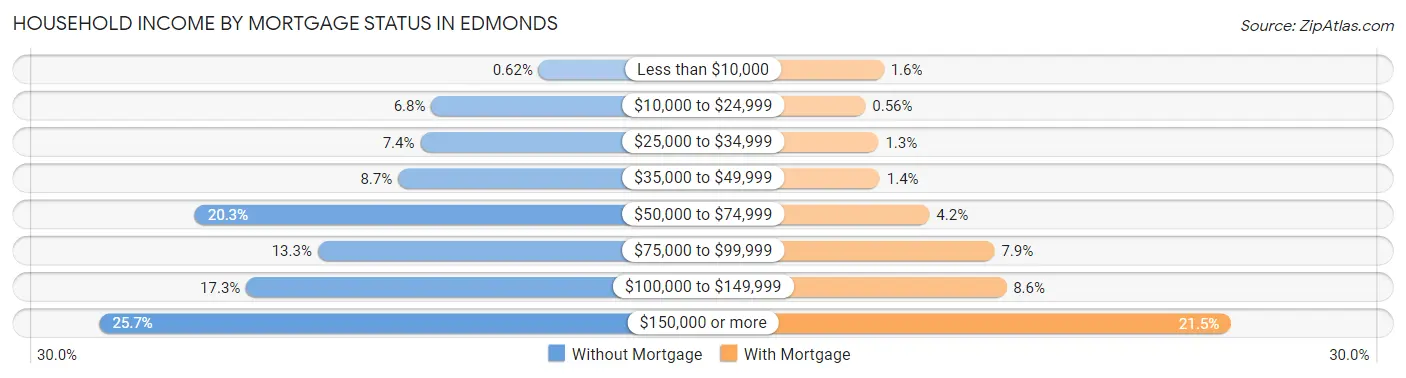
| Household Income | Without Mortgage | With Mortgage |
| Less than $10,000 | 29 (0.6%) | 130 (1.6%) |
| $10,000 to $24,999 | 314 (6.8%) | 45 (0.6%) |
| $25,000 to $34,999 | 343 (7.4%) | 106 (1.3%) |
| $35,000 to $49,999 | 402 (8.7%) | 112 (1.4%) |
| $50,000 to $74,999 | 941 (20.3%) | 341 (4.2%) |
| $75,000 to $99,999 | 615 (13.3%) | 642 (7.9%) |
| $100,000 to $149,999 | 805 (17.3%) | 696 (8.6%) |
| $150,000 or more | 1,194 (25.7%) | 1,735 (21.5%) |
| Total | 4,643 (100.0%) | 8,085 (100.0%) |
Property Value to Household Income Ratio in Edmonds
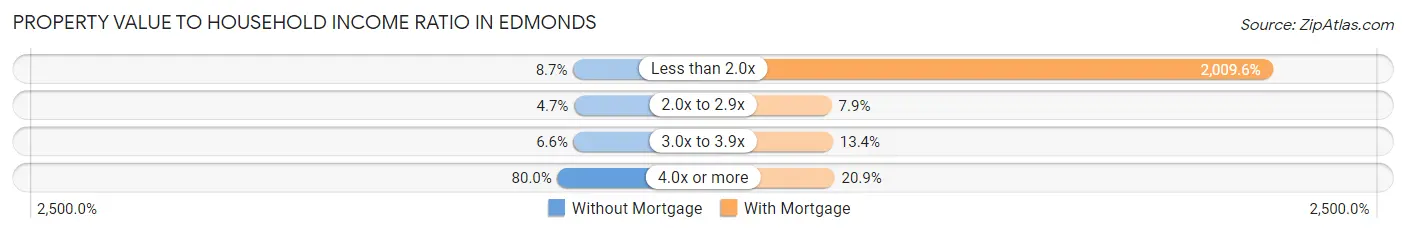
| Value-to-Income Ratio | Without Mortgage | With Mortgage |
| Less than 2.0x | 405 (8.7%) | 162,476 (2,009.6%) |
| 2.0x to 2.9x | 220 (4.7%) | 639 (7.9%) |
| 3.0x to 3.9x | 306 (6.6%) | 1,087 (13.4%) |
| 4.0x or more | 3,712 (79.9%) | 1,692 (20.9%) |
| Total | 4,643 (100.0%) | 8,085 (100.0%) |
Real Estate Taxes by Mortgage Status in Edmonds
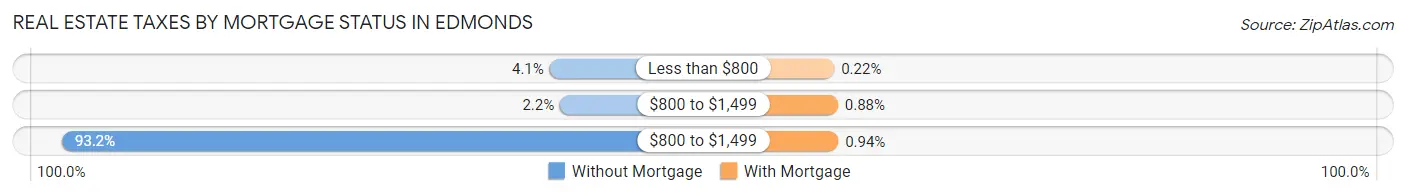
| Property Taxes | Without Mortgage | With Mortgage |
| Less than $800 | 191 (4.1%) | 18 (0.2%) |
| $800 to $1,499 | 102 (2.2%) | 71 (0.9%) |
| $800 to $1,499 | 4,327 (93.2%) | 76 (0.9%) |
| Total | 4,643 (100.0%) | 8,085 (100.0%) |
Health & Disability in Edmonds
Health Insurance Coverage by Age in Edmonds
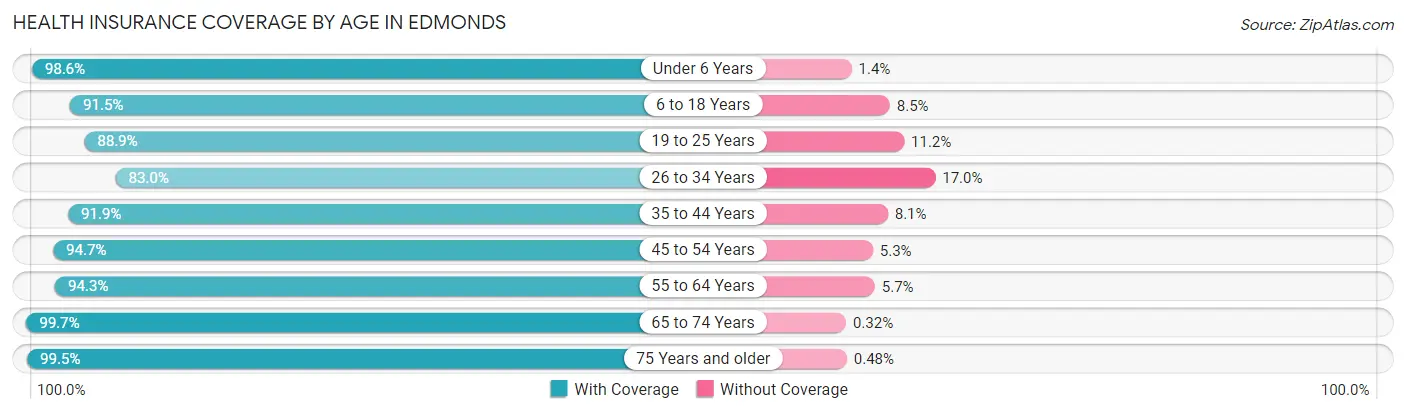
| Age Bracket | With Coverage | Without Coverage |
| Under 6 Years | 2,398 (98.6%) | 33 (1.4%) |
| 6 to 18 Years | 4,896 (91.5%) | 455 (8.5%) |
| 19 to 25 Years | 2,304 (88.8%) | 289 (11.2%) |
| 26 to 34 Years | 4,002 (83.0%) | 818 (17.0%) |
| 35 to 44 Years | 5,245 (91.9%) | 463 (8.1%) |
| 45 to 54 Years | 5,646 (94.7%) | 318 (5.3%) |
| 55 to 64 Years | 5,702 (94.3%) | 344 (5.7%) |
| 65 to 74 Years | 5,361 (99.7%) | 17 (0.3%) |
| 75 Years and older | 4,132 (99.5%) | 20 (0.5%) |
| Total | 39,686 (93.5%) | 2,757 (6.5%) |
Health Insurance Coverage by Citizenship Status in Edmonds
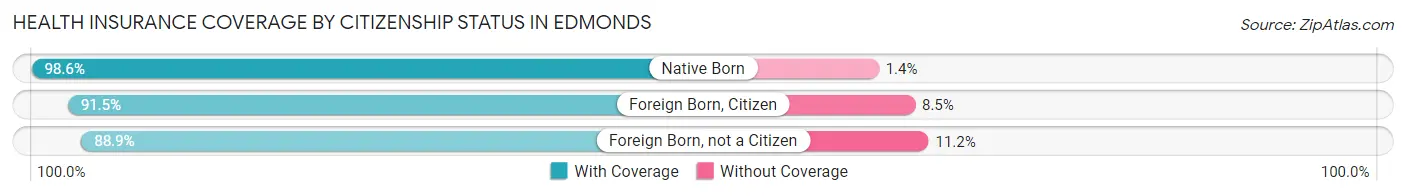
| Citizenship Status | With Coverage | Without Coverage |
| Native Born | 2,398 (98.6%) | 33 (1.4%) |
| Foreign Born, Citizen | 4,896 (91.5%) | 455 (8.5%) |
| Foreign Born, not a Citizen | 2,304 (88.8%) | 289 (11.2%) |
Health Insurance Coverage by Household Income in Edmonds
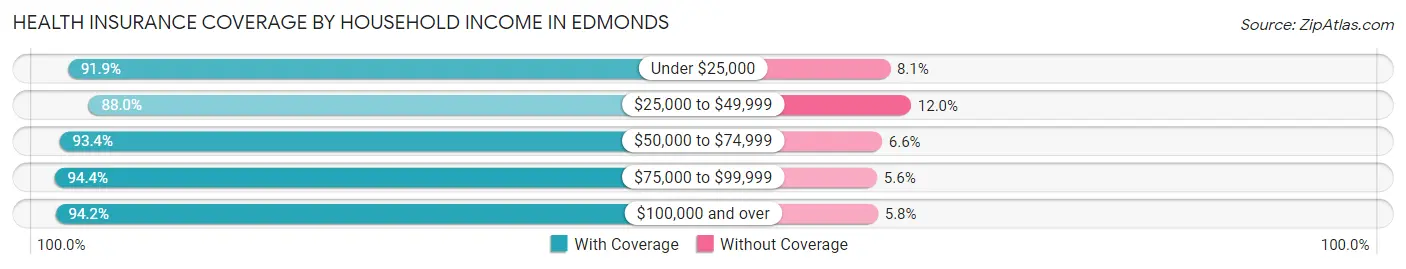
| Household Income | With Coverage | Without Coverage |
| Under $25,000 | 1,194 (91.9%) | 105 (8.1%) |
| $25,000 to $49,999 | 3,360 (88.0%) | 458 (12.0%) |
| $50,000 to $74,999 | 4,945 (93.4%) | 348 (6.6%) |
| $75,000 to $99,999 | 4,032 (94.4%) | 241 (5.6%) |
| $100,000 and over | 25,937 (94.2%) | 1,601 (5.8%) |
Public vs Private Health Insurance Coverage by Age in Edmonds
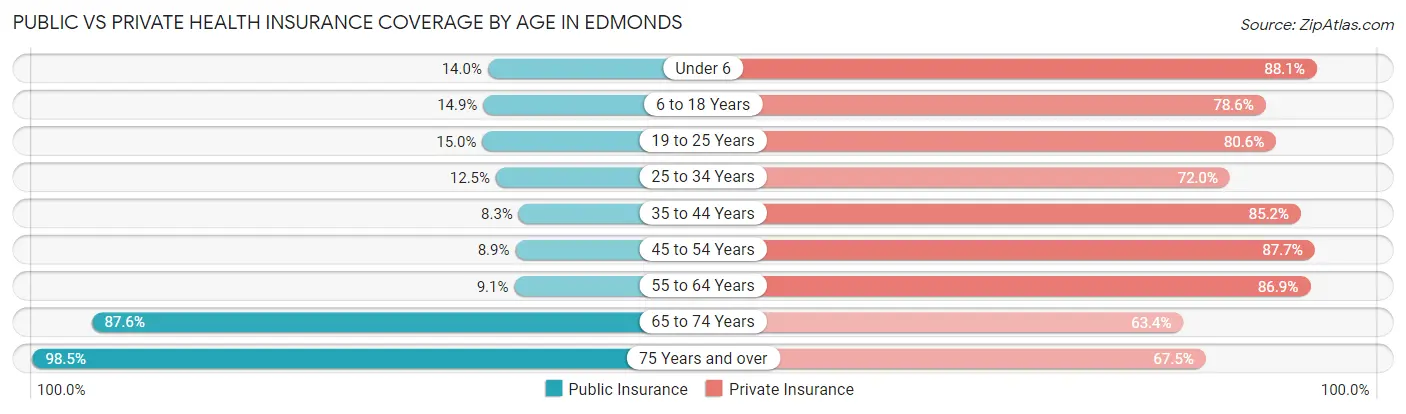
| Age Bracket | Public Insurance | Private Insurance |
| Under 6 | 341 (14.0%) | 2,142 (88.1%) |
| 6 to 18 Years | 796 (14.9%) | 4,208 (78.6%) |
| 19 to 25 Years | 390 (15.0%) | 2,090 (80.6%) |
| 25 to 34 Years | 604 (12.5%) | 3,471 (72.0%) |
| 35 to 44 Years | 473 (8.3%) | 4,863 (85.2%) |
| 45 to 54 Years | 532 (8.9%) | 5,232 (87.7%) |
| 55 to 64 Years | 551 (9.1%) | 5,254 (86.9%) |
| 65 to 74 Years | 4,710 (87.6%) | 3,409 (63.4%) |
| 75 Years and over | 4,091 (98.5%) | 2,804 (67.5%) |
| Total | 12,488 (29.4%) | 33,473 (78.9%) |
Disability Status by Sex by Age in Edmonds
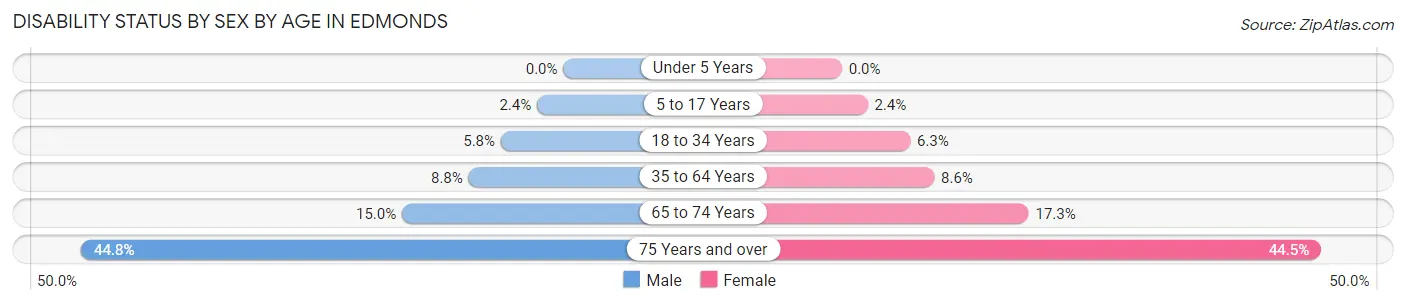
| Age Bracket | Male | Female |
| Under 5 Years | 0 (0.0%) | 0 (0.0%) |
| 5 to 17 Years | 69 (2.4%) | 60 (2.4%) |
| 18 to 34 Years | 224 (5.8%) | 248 (6.3%) |
| 35 to 64 Years | 741 (8.8%) | 796 (8.6%) |
| 65 to 74 Years | 368 (15.0%) | 506 (17.3%) |
| 75 Years and over | 714 (44.8%) | 1,137 (44.5%) |
Disability Class by Sex by Age in Edmonds
Disability Class: Hearing Difficulty
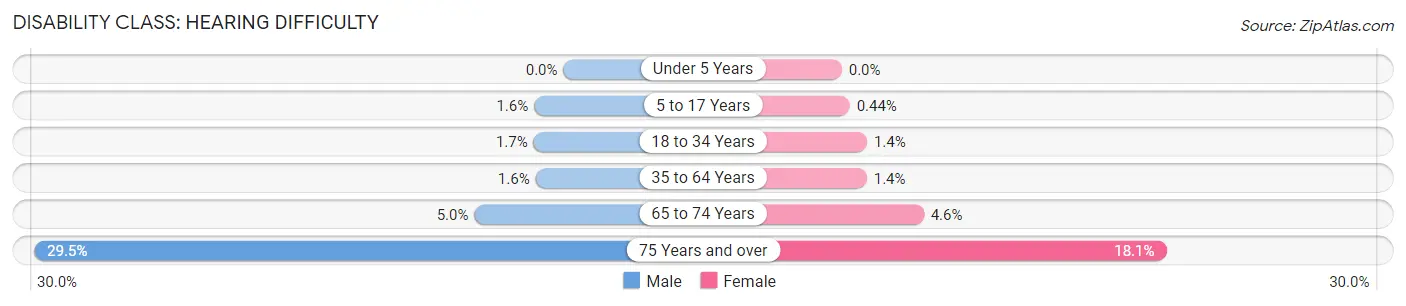
| Age Bracket | Male | Female |
| Under 5 Years | 0 (0.0%) | 0 (0.0%) |
| 5 to 17 Years | 46 (1.6%) | 11 (0.4%) |
| 18 to 34 Years | 64 (1.7%) | 55 (1.4%) |
| 35 to 64 Years | 131 (1.5%) | 129 (1.4%) |
| 65 to 74 Years | 122 (5.0%) | 133 (4.6%) |
| 75 Years and over | 470 (29.5%) | 462 (18.1%) |
Disability Class: Vision Difficulty
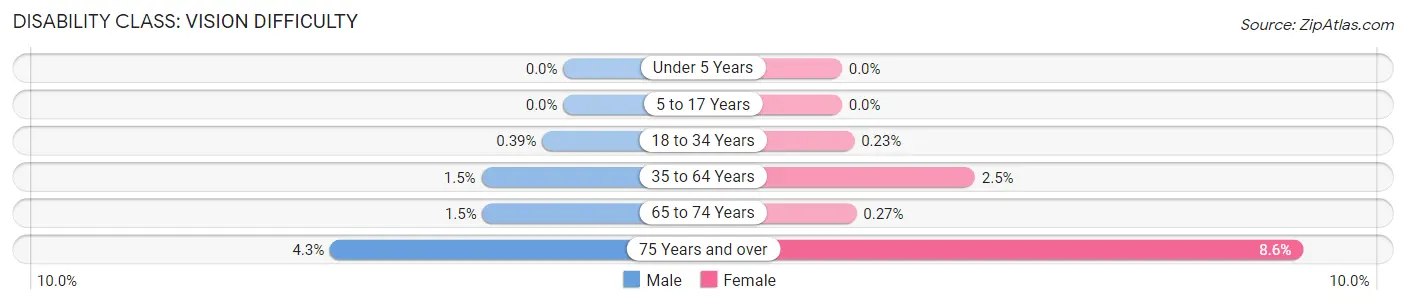
| Age Bracket | Male | Female |
| Under 5 Years | 0 (0.0%) | 0 (0.0%) |
| 5 to 17 Years | 0 (0.0%) | 0 (0.0%) |
| 18 to 34 Years | 15 (0.4%) | 9 (0.2%) |
| 35 to 64 Years | 128 (1.5%) | 229 (2.5%) |
| 65 to 74 Years | 37 (1.5%) | 8 (0.3%) |
| 75 Years and over | 69 (4.3%) | 219 (8.6%) |
Disability Class: Cognitive Difficulty
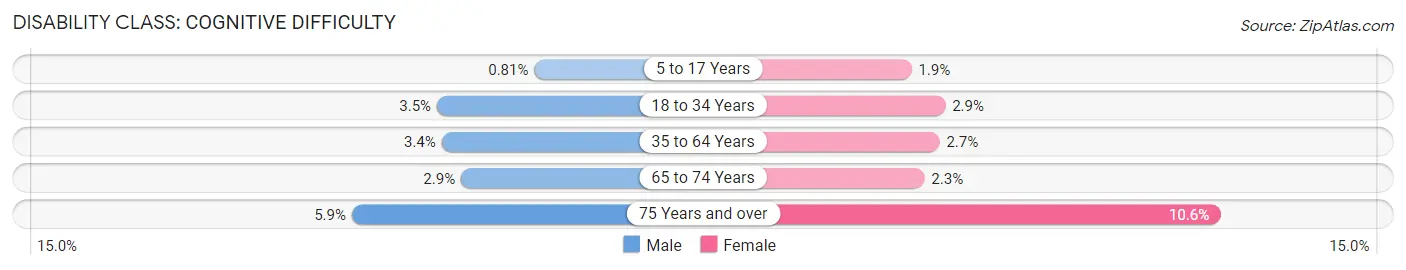
| Age Bracket | Male | Female |
| 5 to 17 Years | 23 (0.8%) | 49 (1.9%) |
| 18 to 34 Years | 136 (3.5%) | 113 (2.9%) |
| 35 to 64 Years | 286 (3.4%) | 253 (2.7%) |
| 65 to 74 Years | 70 (2.9%) | 67 (2.3%) |
| 75 Years and over | 94 (5.9%) | 270 (10.6%) |
Disability Class: Ambulatory Difficulty
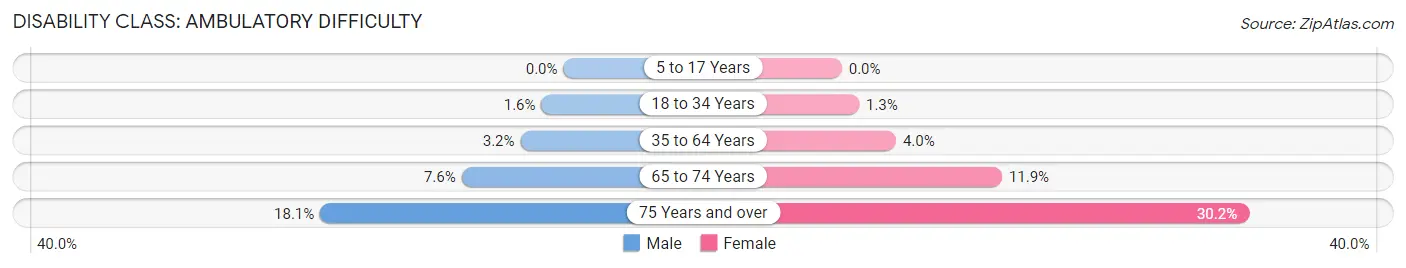
| Age Bracket | Male | Female |
| 5 to 17 Years | 0 (0.0%) | 0 (0.0%) |
| 18 to 34 Years | 63 (1.6%) | 50 (1.3%) |
| 35 to 64 Years | 269 (3.2%) | 373 (4.0%) |
| 65 to 74 Years | 186 (7.6%) | 347 (11.9%) |
| 75 Years and over | 288 (18.1%) | 773 (30.2%) |
Disability Class: Self-Care Difficulty
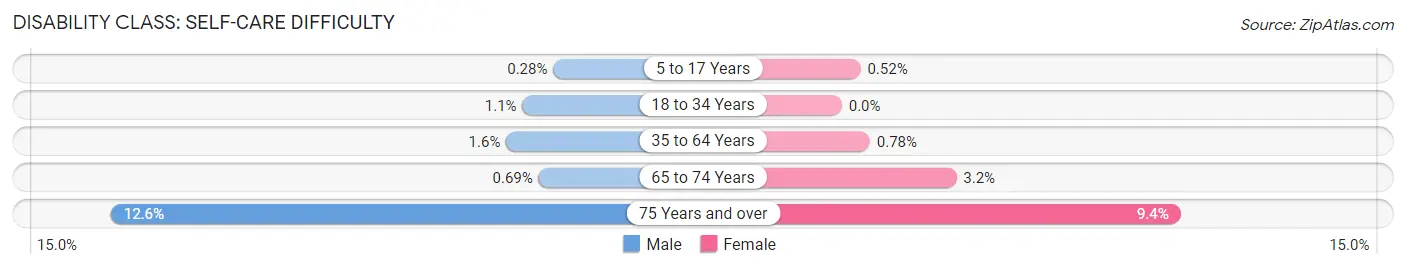
| Age Bracket | Male | Female |
| 5 to 17 Years | 8 (0.3%) | 13 (0.5%) |
| 18 to 34 Years | 44 (1.1%) | 0 (0.0%) |
| 35 to 64 Years | 134 (1.6%) | 72 (0.8%) |
| 65 to 74 Years | 17 (0.7%) | 93 (3.2%) |
| 75 Years and over | 201 (12.6%) | 241 (9.4%) |
Technology Access in Edmonds
Computing Device Access in Edmonds
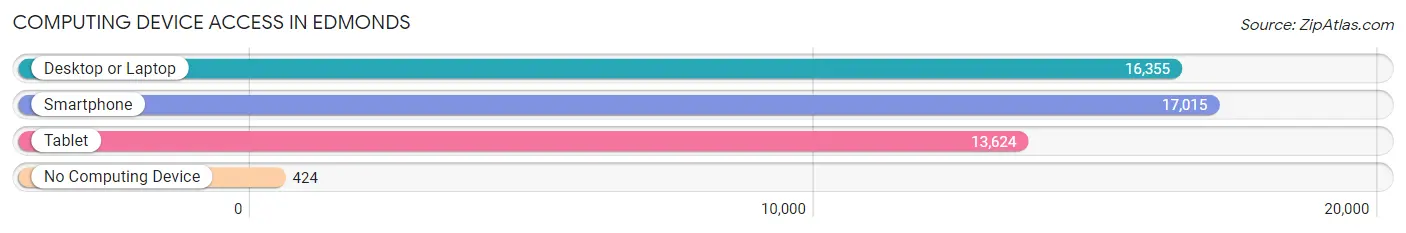
| Device Type | # Households | % Households |
| Desktop or Laptop | 16,355 | 89.5% |
| Smartphone | 17,015 | 93.1% |
| Tablet | 13,624 | 74.6% |
| No Computing Device | 424 | 2.3% |
| Total | 18,269 | 100.0% |
Internet Access in Edmonds
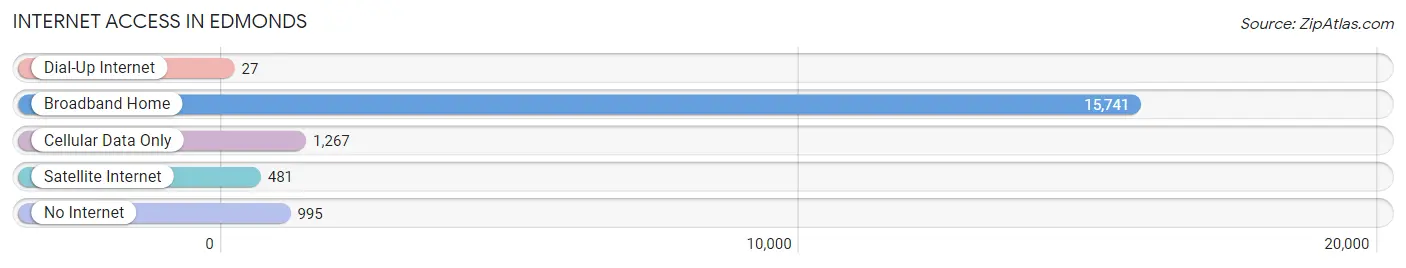
| Internet Type | # Households | % Households |
| Dial-Up Internet | 27 | 0.2% |
| Broadband Home | 15,741 | 86.2% |
| Cellular Data Only | 1,267 | 6.9% |
| Satellite Internet | 481 | 2.6% |
| No Internet | 995 | 5.4% |
| Total | 18,269 | 100.0% |
Edmonds Summary
Edmonds, Washington is a city located in Snohomish County, Washington, United States. It is located along the Puget Sound, about 20 miles north of Seattle. As of the 2010 census, the city had a population of 39,709.
History
Edmonds was first settled in 1876 by Charles and Mary Edmonds, who homesteaded 160 acres of land. The town was officially incorporated in 1890 and was named after the Edmonds family. The town grew slowly until the arrival of the Great Northern Railway in 1903, which spurred development and growth. The city was a popular tourist destination in the early 20th century, with many visitors coming to enjoy the beaches and the views of Puget Sound.
Geography
Edmonds is located at 47°48'N 122°19'W (47.8, -122.3). According to the United States Census Bureau, the city has a total area of 10.2 square miles, of which, 9.9 square miles is land and 0.3 square miles is water.
The city is located on the shores of Puget Sound, and is bordered by the cities of Lynnwood to the north, Mountlake Terrace to the east, Woodway to the south, and the unincorporated community of Esperance to the west.
Economy
Edmonds is a major economic center in the region, with a variety of businesses and industries. The city is home to several large employers, including Boeing, Microsoft, and the University of Washington. The city also has a thriving retail sector, with many shops and restaurants located in the downtown area.
The city is also home to a number of small businesses, including art galleries, antique stores, and specialty shops. The city is also home to a number of professional services, such as law firms, accounting firms, and medical offices.
Demographics
As of the 2010 census, there were 39,709 people, 16,945 households, and 10,845 families residing in the city. The population density was 3,971.3 people per square mile. The racial makeup of the city was 79.2% White, 5.3% African American, 0.7% Native American, 8.2% Asian, 0.2% Pacific Islander, 2.7% from other races, and 3.8% from two or more races. Hispanic or Latino of any race were 8.2% of the population.
The median income for a household in the city was $60,945, and the median income for a family was $76,845. The per capita income for the city was $33,945. About 5.2% of families and 8.2% of the population were below the poverty line, including 10.2% of those under age 18 and 5.2% of those age 65 or over.
Conclusion
Edmonds, Washington is a vibrant city located along the Puget Sound. It has a rich history, and is home to a variety of businesses and industries. The city has a diverse population, with a median income that is higher than the national average. Edmonds is a great place to live, work, and play, and is sure to continue to grow and thrive in the years to come.
Common Questions
What is Per Capita Income in Edmonds?
Per Capita income in Edmonds is $68,793.
What is the Median Family Income in Edmonds?
Median Family Income in Edmonds is $142,174.
What is the Median Household income in Edmonds?
Median Household Income in Edmonds is $110,057.
What is Income or Wage Gap in Edmonds?
Income or Wage Gap in Edmonds is 33.1%.
Women in Edmonds earn 66.9 cents for every dollar earned by a man.
What is Family Income Deficit in Edmonds?
Family Income Deficit in Edmonds is $5,843.
Families that are below poverty line in Edmonds earn $5,843 less on average than the poverty threshold level.
What is Inequality or Gini Index in Edmonds?
Inequality or Gini Index in Edmonds is 0.47.
What is the Total Population of Edmonds?
Total Population of Edmonds is 42,705.
What is the Total Male Population of Edmonds?
Total Male Population of Edmonds is 20,183.
What is the Total Female Population of Edmonds?
Total Female Population of Edmonds is 22,522.
What is the Ratio of Males per 100 Females in Edmonds?
There are 89.61 Males per 100 Females in Edmonds.
What is the Ratio of Females per 100 Males in Edmonds?
There are 111.59 Females per 100 Males in Edmonds.
What is the Median Population Age in Edmonds?
Median Population Age in Edmonds is 45.8 Years.
What is the Average Family Size in Edmonds
Average Family Size in Edmonds is 2.8 People.
What is the Average Household Size in Edmonds
Average Household Size in Edmonds is 2.3 People.
How Large is the Labor Force in Edmonds?
There are 23,315 People in the Labor Forcein in Edmonds.
What is the Percentage of People in the Labor Force in Edmonds?
64.7% of People are in the Labor Force in Edmonds.
What is the Unemployment Rate in Edmonds?
Unemployment Rate in Edmonds is 4.1%.