Newcastle, WA Map & Demographics
Newcastle Map
Newcastle Overview
$87,898
PER CAPITA INCOME
$200,962
AVG FAMILY INCOME
$151,007
AVG HOUSEHOLD INCOME
47.7%
WAGE / INCOME GAP [ % ]
52.3¢/ $1
WAGE / INCOME GAP [ $ ]
0.51
INEQUALITY / GINI INDEX
12,931
TOTAL POPULATION
6,468
MALE POPULATION
6,463
FEMALE POPULATION
100.08
MALES / 100 FEMALES
99.92
FEMALES / 100 MALES
37.3
MEDIAN AGE
2.8
AVG FAMILY SIZE
2.4
AVG HOUSEHOLD SIZE
6,977
LABOR FORCE [ PEOPLE ]
65.7%
PERCENT IN LABOR FORCE
4.9%
UNEMPLOYMENT RATE
Newcastle Area Codes
Income in Newcastle
Income Overview in Newcastle
Per Capita Income in Newcastle is $87,898, while median incomes of families and households are $200,962 and $151,007 respectively.
| Characteristic | Number | Measure |
| Per Capita Income | 12,931 | $87,898 |
| Median Family Income | 3,570 | $200,962 |
| Mean Family Income | 3,570 | $275,637 |
| Median Household Income | 5,338 | $151,007 |
| Mean Household Income | 5,338 | $229,812 |
| Income Deficit | 3,570 | $0 |
| Wage / Income Gap (%) | 12,931 | 47.68% |
| Wage / Income Gap ($) | 12,931 | 52.32¢ per $1 |
| Gini / Inequality Index | 12,931 | 0.51 |
Earnings by Sex in Newcastle
Average Earnings in Newcastle are $86,724, $118,929 for men and $62,222 for women, a difference of 47.7%.
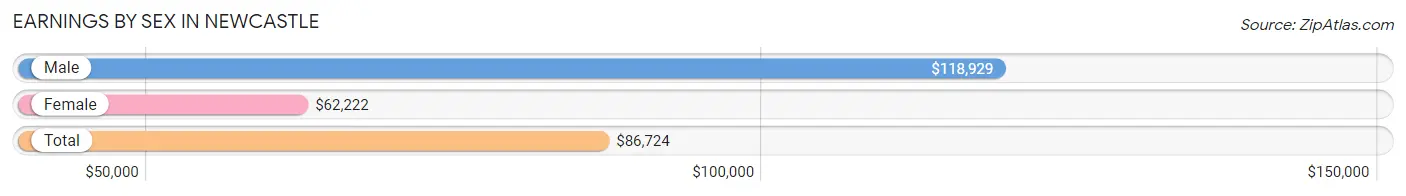
| Sex | Number | Average Earnings |
| Male | 3,890 (53.8%) | $118,929 |
| Female | 3,344 (46.2%) | $62,222 |
| Total | 7,234 (100.0%) | $86,724 |
Earnings by Sex by Income Bracket in Newcastle
The most common earnings brackets in Newcastle are $100,000+ for men (2,294 | 59.0%) and $100,000+ for women (890 | 26.6%).
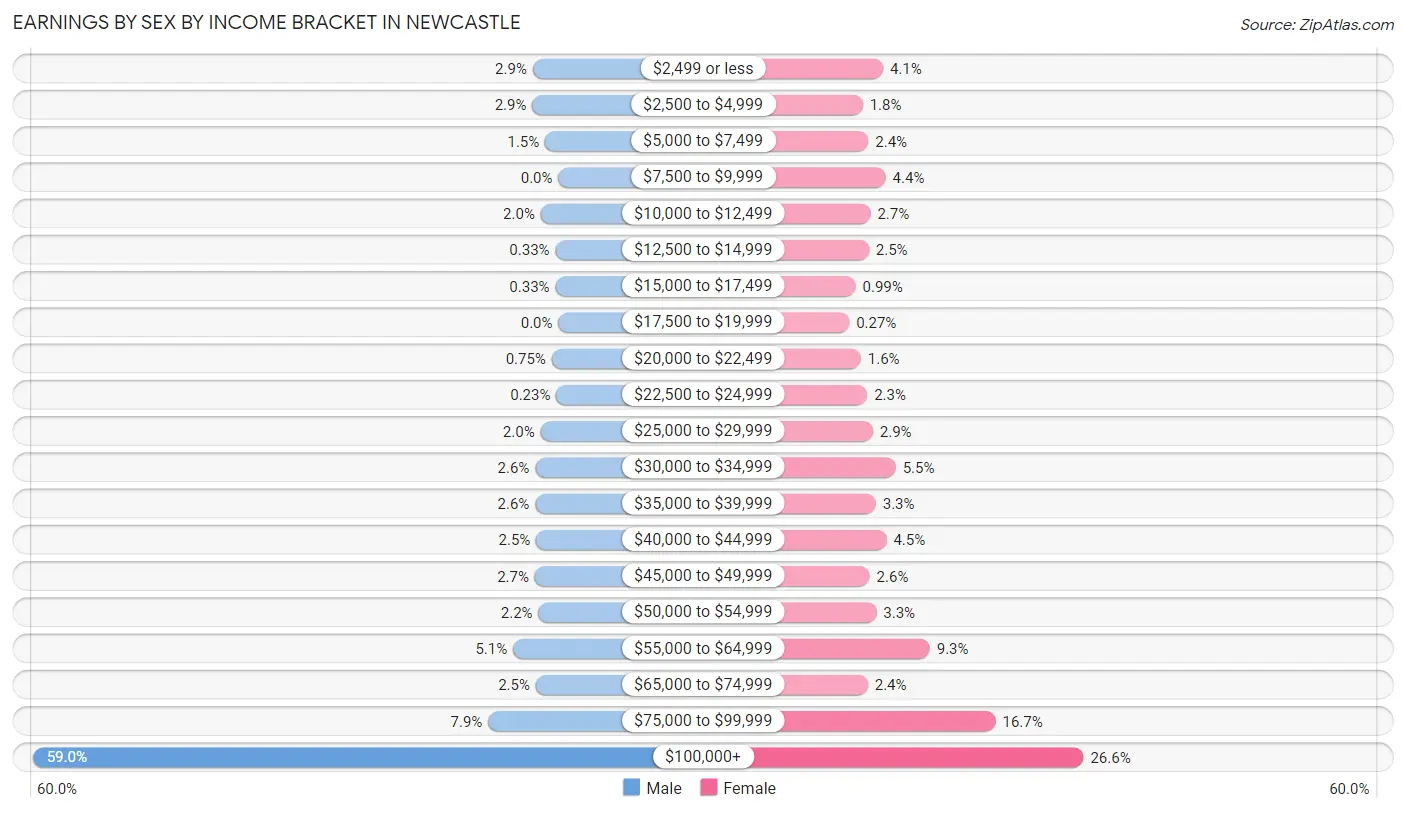
| Income | Male | Female |
| $2,499 or less | 112 (2.9%) | 136 (4.1%) |
| $2,500 to $4,999 | 114 (2.9%) | 60 (1.8%) |
| $5,000 to $7,499 | 58 (1.5%) | 81 (2.4%) |
| $7,500 to $9,999 | 0 (0.0%) | 146 (4.4%) |
| $10,000 to $12,499 | 77 (2.0%) | 89 (2.7%) |
| $12,500 to $14,999 | 13 (0.3%) | 83 (2.5%) |
| $15,000 to $17,499 | 13 (0.3%) | 33 (1.0%) |
| $17,500 to $19,999 | 0 (0.0%) | 9 (0.3%) |
| $20,000 to $22,499 | 29 (0.7%) | 53 (1.6%) |
| $22,500 to $24,999 | 9 (0.2%) | 77 (2.3%) |
| $25,000 to $29,999 | 78 (2.0%) | 98 (2.9%) |
| $30,000 to $34,999 | 101 (2.6%) | 184 (5.5%) |
| $35,000 to $39,999 | 101 (2.6%) | 109 (3.3%) |
| $40,000 to $44,999 | 97 (2.5%) | 149 (4.5%) |
| $45,000 to $49,999 | 103 (2.6%) | 86 (2.6%) |
| $50,000 to $54,999 | 87 (2.2%) | 111 (3.3%) |
| $55,000 to $64,999 | 198 (5.1%) | 312 (9.3%) |
| $65,000 to $74,999 | 99 (2.5%) | 79 (2.4%) |
| $75,000 to $99,999 | 307 (7.9%) | 559 (16.7%) |
| $100,000+ | 2,294 (59.0%) | 890 (26.6%) |
| Total | 3,890 (100.0%) | 3,344 (100.0%) |
Earnings by Sex by Educational Attainment in Newcastle
Average earnings in Newcastle are $125,000 for men and $64,991 for women, a difference of 48.0%. Men with an educational attainment of graduate degree enjoy the highest average annual earnings of $171,667, while those with high school diploma education earn the least with $60,781. Women with an educational attainment of bachelor's degree earn the most with the average annual earnings of $81,333, while those with college or associate's degree education have the smallest earnings of $45,972.
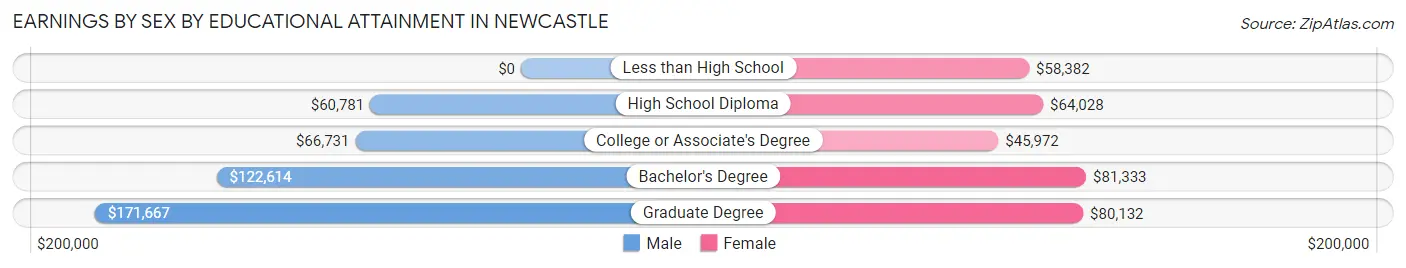
| Educational Attainment | Male Income | Female Income |
| Less than High School | - | - |
| High School Diploma | $60,781 | $64,028 |
| College or Associate's Degree | $66,731 | $45,972 |
| Bachelor's Degree | $122,614 | $81,333 |
| Graduate Degree | $171,667 | $80,132 |
| Total | $125,000 | $64,991 |
Family Income in Newcastle
Family Income Brackets in Newcastle
According to the Newcastle family income data, there are 1,796 families falling into the $200,000+ income range, which is the most common income bracket and makes up 50.3% of all families.
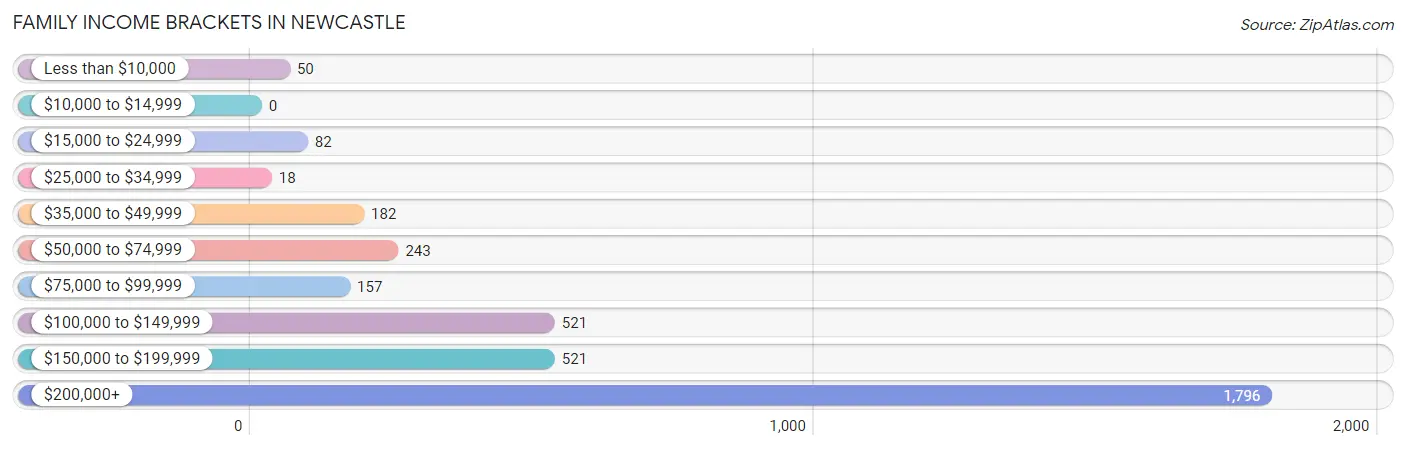
| Income Bracket | # Families | % Families |
| Less than $10,000 | 50 | 1.4% |
| $10,000 to $14,999 | 0 | 0.0% |
| $15,000 to $24,999 | 82 | 2.3% |
| $25,000 to $34,999 | 18 | 0.5% |
| $35,000 to $49,999 | 182 | 5.1% |
| $50,000 to $74,999 | 243 | 6.8% |
| $75,000 to $99,999 | 157 | 4.4% |
| $100,000 to $149,999 | 521 | 14.6% |
| $150,000 to $199,999 | 521 | 14.6% |
| $200,000+ | 1,796 | 50.3% |
Family Income by Famaliy Size in Newcastle
4-person families (715 | 20.0%) account for the highest median family income in Newcastle with $250,001 per family, while 2-person families (1,577 | 44.2%) have the highest median income of $96,562 per family member.
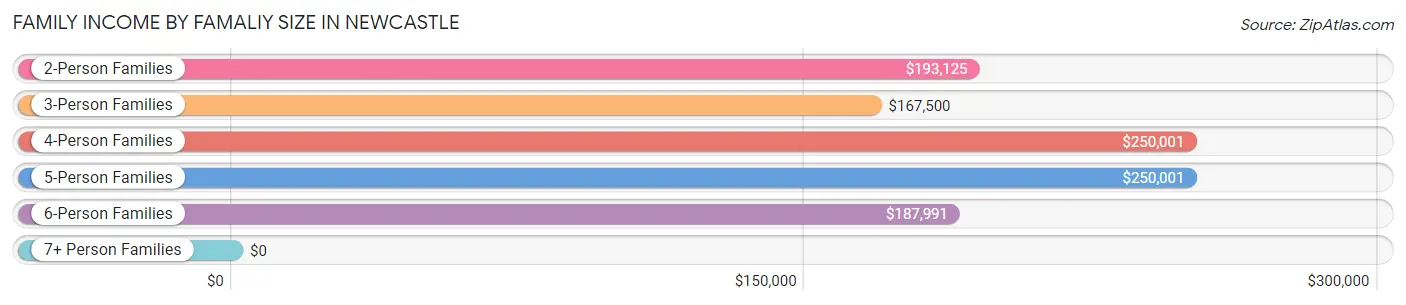
| Income Bracket | # Families | Median Income |
| 2-Person Families | 1,577 (44.2%) | $193,125 |
| 3-Person Families | 1,112 (31.1%) | $167,500 |
| 4-Person Families | 715 (20.0%) | $250,001 |
| 5-Person Families | 105 (2.9%) | $250,001 |
| 6-Person Families | 61 (1.7%) | $187,991 |
| 7+ Person Families | 0 (0.0%) | $0 |
| Total | 3,570 (100.0%) | $200,962 |
Family Income by Number of Earners in Newcastle
The median family income in Newcastle is $200,962, with families comprising 3+ earners (225) having the highest median family income of $250,001, while families with no earners (441) have the lowest median family income of $156,193, accounting for 6.3% and 12.3% of families, respectively.
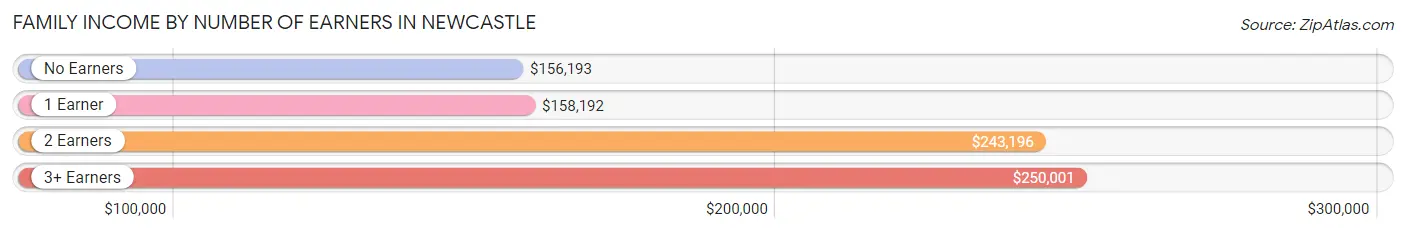
| Number of Earners | # Families | Median Income |
| No Earners | 441 (12.3%) | $156,193 |
| 1 Earner | 1,271 (35.6%) | $158,192 |
| 2 Earners | 1,633 (45.7%) | $243,196 |
| 3+ Earners | 225 (6.3%) | $250,001 |
| Total | 3,570 (100.0%) | $200,962 |
Household Income in Newcastle
Household Income Brackets in Newcastle
With 2,114 households falling in the category, the $200,000+ income range is the most frequent in Newcastle, accounting for 39.6% of all households. In contrast, only 101 households (1.9%) fall into the $10,000 to $14,999 income bracket, making it the least populous group.
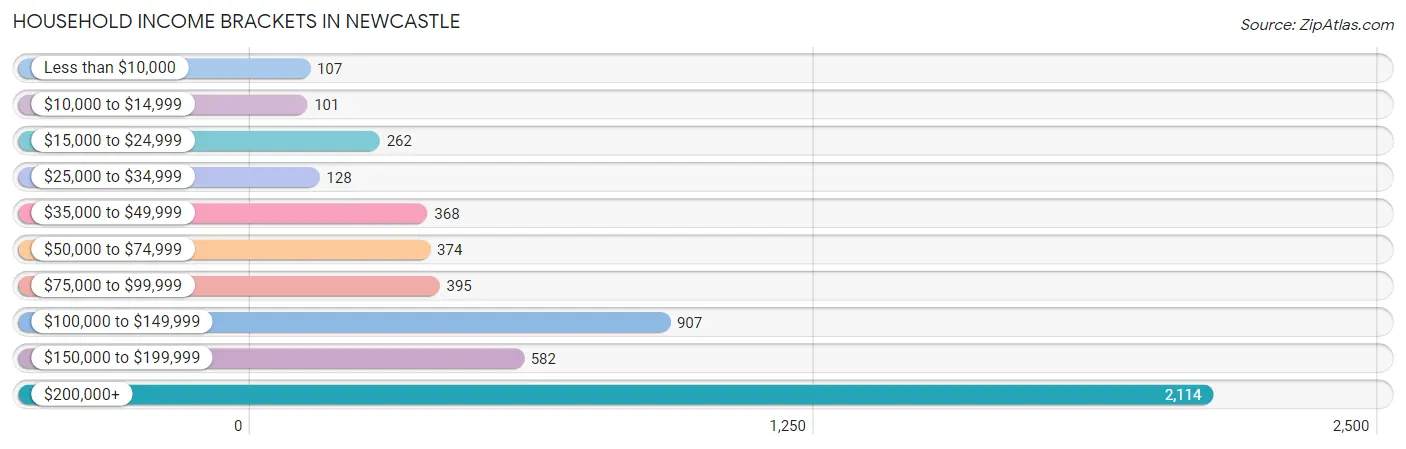
| Income Bracket | # Households | % Households |
| Less than $10,000 | 107 | 2.0% |
| $10,000 to $14,999 | 101 | 1.9% |
| $15,000 to $24,999 | 262 | 4.9% |
| $25,000 to $34,999 | 128 | 2.4% |
| $35,000 to $49,999 | 368 | 6.9% |
| $50,000 to $74,999 | 374 | 7.0% |
| $75,000 to $99,999 | 395 | 7.4% |
| $100,000 to $149,999 | 907 | 17.0% |
| $150,000 to $199,999 | 582 | 10.9% |
| $200,000+ | 2,114 | 39.6% |
Household Income by Householder Age in Newcastle
The median household income in Newcastle is $151,007, with the highest median household income of $183,906 found in the 45 to 64 years age bracket for the primary householder. A total of 1,761 households (33.0%) fall into this category. Meanwhile, the 15 to 24 years age bracket for the primary householder has the lowest median household income of $0, with 228 households (4.3%) in this group.
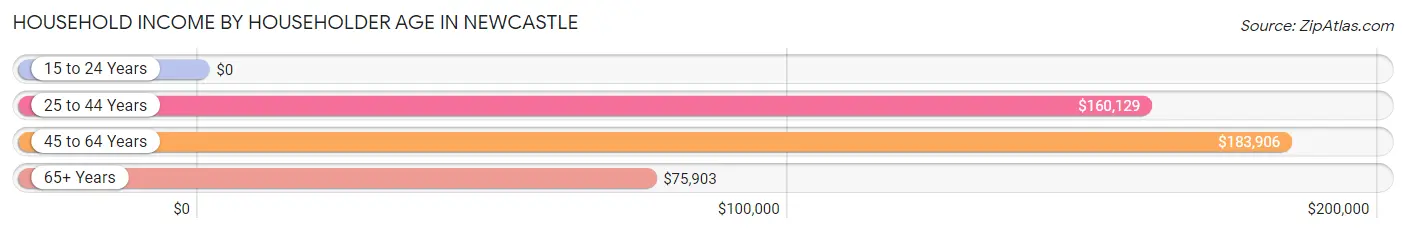
| Income Bracket | # Households | Median Income |
| 15 to 24 Years | 228 (4.3%) | $0 |
| 25 to 44 Years | 2,207 (41.3%) | $160,129 |
| 45 to 64 Years | 1,761 (33.0%) | $183,906 |
| 65+ Years | 1,142 (21.4%) | $75,903 |
| Total | 5,338 (100.0%) | $151,007 |
Poverty in Newcastle
Income Below Poverty by Sex and Age in Newcastle
With 2.1% poverty level for males and 4.6% for females among the residents of Newcastle, 18 to 24 year old males and 75 year old and over females are the most vulnerable to poverty, with 71 males (18.2%) and 111 females (19.0%) in their respective age groups living below the poverty level.
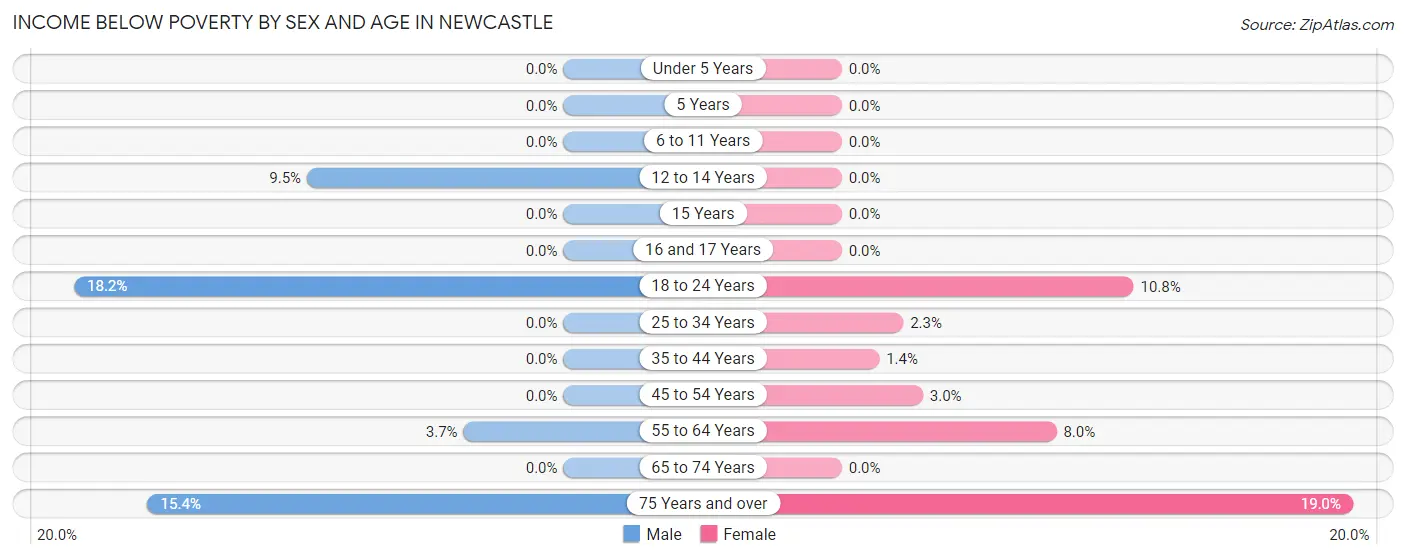
| Age Bracket | Male | Female |
| Under 5 Years | 0 (0.0%) | 0 (0.0%) |
| 5 Years | 0 (0.0%) | 0 (0.0%) |
| 6 to 11 Years | 0 (0.0%) | 0 (0.0%) |
| 12 to 14 Years | 14 (9.5%) | 0 (0.0%) |
| 15 Years | 0 (0.0%) | 0 (0.0%) |
| 16 and 17 Years | 0 (0.0%) | 0 (0.0%) |
| 18 to 24 Years | 71 (18.2%) | 47 (10.8%) |
| 25 to 34 Years | 0 (0.0%) | 27 (2.3%) |
| 35 to 44 Years | 0 (0.0%) | 13 (1.4%) |
| 45 to 54 Years | 0 (0.0%) | 29 (3.0%) |
| 55 to 64 Years | 28 (3.7%) | 66 (8.0%) |
| 65 to 74 Years | 0 (0.0%) | 0 (0.0%) |
| 75 Years and over | 25 (15.4%) | 111 (19.0%) |
| Total | 138 (2.1%) | 293 (4.6%) |
Income Above Poverty by Sex and Age in Newcastle
According to the poverty statistics in Newcastle, males aged under 5 years and females aged under 5 years are the age groups that are most secure financially, with 100.0% of males and 100.0% of females in these age groups living above the poverty line.
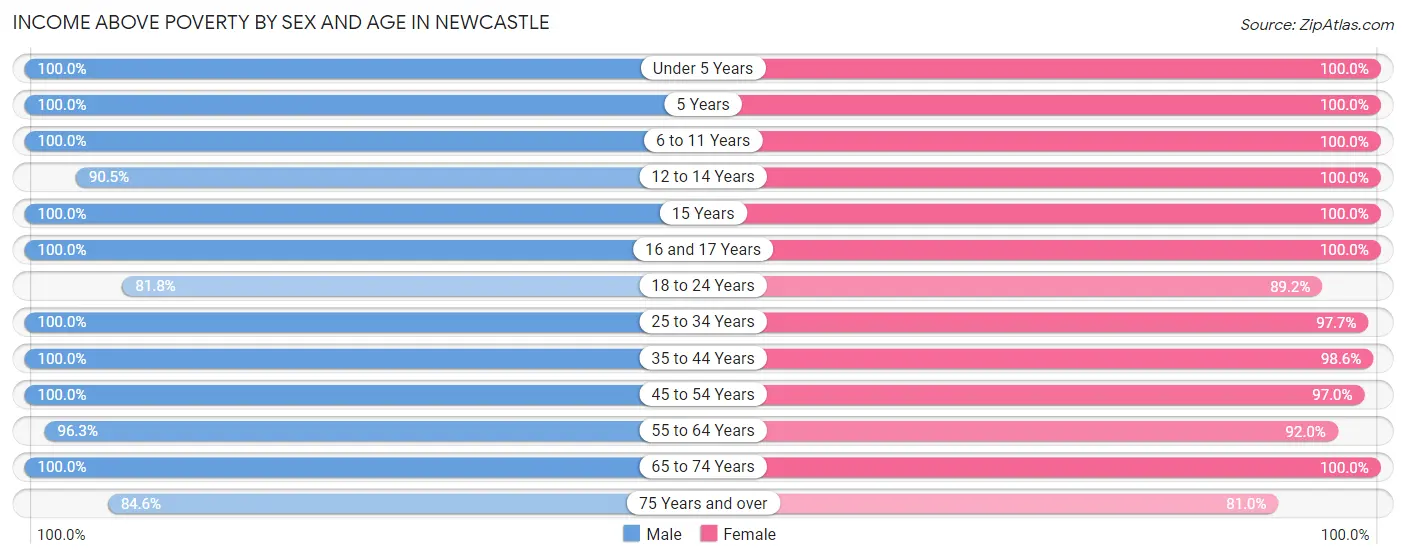
| Age Bracket | Male | Female |
| Under 5 Years | 421 (100.0%) | 416 (100.0%) |
| 5 Years | 69 (100.0%) | 9 (100.0%) |
| 6 to 11 Years | 457 (100.0%) | 371 (100.0%) |
| 12 to 14 Years | 133 (90.5%) | 195 (100.0%) |
| 15 Years | 49 (100.0%) | 57 (100.0%) |
| 16 and 17 Years | 285 (100.0%) | 112 (100.0%) |
| 18 to 24 Years | 320 (81.8%) | 387 (89.2%) |
| 25 to 34 Years | 1,181 (100.0%) | 1,156 (97.7%) |
| 35 to 44 Years | 1,065 (100.0%) | 923 (98.6%) |
| 45 to 54 Years | 729 (100.0%) | 936 (97.0%) |
| 55 to 64 Years | 727 (96.3%) | 762 (92.0%) |
| 65 to 74 Years | 693 (100.0%) | 307 (100.0%) |
| 75 Years and over | 137 (84.6%) | 474 (81.0%) |
| Total | 6,266 (97.9%) | 6,105 (95.4%) |
Income Below Poverty Among Married-Couple Families in Newcastle
The poverty statistics for married-couple families in Newcastle show that 1.3% or 38 of the total 2,926 families live below the poverty line. Families with no children have the highest poverty rate of 1.6%, comprising of 25 families. On the other hand, families with 3 or 4 children have the lowest poverty rate of 0.0%, which includes 0 families.
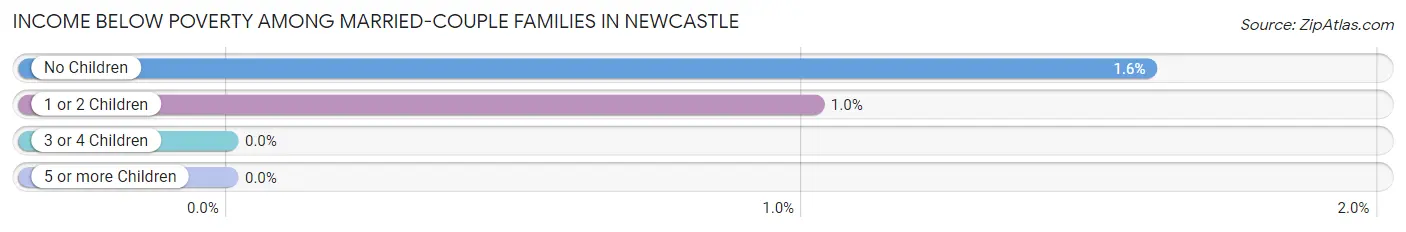
| Children | Above Poverty | Below Poverty |
| No Children | 1,533 (98.4%) | 25 (1.6%) |
| 1 or 2 Children | 1,261 (99.0%) | 13 (1.0%) |
| 3 or 4 Children | 94 (100.0%) | 0 (0.0%) |
| 5 or more Children | 0 (0.0%) | 0 (0.0%) |
| Total | 2,888 (98.7%) | 38 (1.3%) |
Income Below Poverty Among Single-Parent Households in Newcastle
According to the poverty data in Newcastle, 7.5% or 20 single-father households and 6.9% or 26 single-mother households are living below the poverty line. Among single-father households, those with no children have the highest poverty rate, with 20 households (8.4%) experiencing poverty. Likewise, among single-mother households, those with no children have the highest poverty rate, with 26 households (25.7%) falling below the poverty line.
| Children | Single Father | Single Mother |
| No Children | 20 (8.4%) | 26 (25.7%) |
| 1 or 2 Children | 0 (0.0%) | 0 (0.0%) |
| 3 or 4 Children | 0 (0.0%) | 0 (0.0%) |
| 5 or more Children | 0 (0.0%) | 0 (0.0%) |
| Total | 20 (7.5%) | 26 (6.9%) |
Income Below Poverty Among Married-Couple vs Single-Parent Households in Newcastle
The poverty data for Newcastle shows that 38 of the married-couple family households (1.3%) and 46 of the single-parent households (7.1%) are living below the poverty level. Within the married-couple family households, those with no children have the highest poverty rate, with 25 households (1.6%) falling below the poverty line. Among the single-parent households, those with no children have the highest poverty rate, with 46 household (13.5%) living below poverty.
| Children | Married-Couple Families | Single-Parent Households |
| No Children | 25 (1.6%) | 46 (13.5%) |
| 1 or 2 Children | 13 (1.0%) | 0 (0.0%) |
| 3 or 4 Children | 0 (0.0%) | 0 (0.0%) |
| 5 or more Children | 0 (0.0%) | 0 (0.0%) |
| Total | 38 (1.3%) | 46 (7.1%) |
Race in Newcastle
The most populous races in Newcastle are White / Caucasian (6,015 | 46.5%), Asian (4,781 | 37.0%), and Two or more Races (1,380 | 10.7%).
| Race | # Population | % Population |
| Asian | 4,781 | 37.0% |
| Black / African American | 292 | 2.3% |
| Hawaiian / Pacific | 0 | 0.0% |
| Hispanic or Latino | 800 | 6.2% |
| Native / Alaskan | 0 | 0.0% |
| White / Caucasian | 6,015 | 46.5% |
| Two or more Races | 1,380 | 10.7% |
| Some other Race | 463 | 3.6% |
| Total | 12,931 | 100.0% |
Ancestry in Newcastle
The most populous ancestries reported in Newcastle are Indian (Asian) (1,947 | 15.1%), German (1,354 | 10.5%), English (1,228 | 9.5%), Thai (1,081 | 8.4%), and Korean (780 | 6.0%), together accounting for 49.4% of all Newcastle residents.
| Ancestry | # Population | % Population |
| African | 55 | 0.4% |
| American | 336 | 2.6% |
| Arab | 40 | 0.3% |
| Argentinean | 28 | 0.2% |
| Australian | 64 | 0.5% |
| Austrian | 66 | 0.5% |
| Belgian | 13 | 0.1% |
| Bhutanese | 536 | 4.2% |
| British | 117 | 0.9% |
| Bulgarian | 8 | 0.1% |
| Burmese | 567 | 4.4% |
| Cambodian | 63 | 0.5% |
| Canadian | 25 | 0.2% |
| Central American | 108 | 0.8% |
| Central American Indian | 35 | 0.3% |
| Cherokee | 12 | 0.1% |
| Colombian | 43 | 0.3% |
| Cuban | 8 | 0.1% |
| Czech | 60 | 0.5% |
| Danish | 17 | 0.1% |
| Dutch | 69 | 0.5% |
| Eastern European | 25 | 0.2% |
| Ecuadorian | 17 | 0.1% |
| Egyptian | 10 | 0.1% |
| English | 1,228 | 9.5% |
| European | 375 | 2.9% |
| Filipino | 103 | 0.8% |
| Finnish | 125 | 1.0% |
| French | 46 | 0.4% |
| French Canadian | 20 | 0.2% |
| German | 1,354 | 10.5% |
| Greek | 63 | 0.5% |
| Haitian | 38 | 0.3% |
| Hungarian | 73 | 0.6% |
| Indian (Asian) | 1,947 | 15.1% |
| Iranian | 35 | 0.3% |
| Irish | 625 | 4.8% |
| Italian | 358 | 2.8% |
| Jamaican | 24 | 0.2% |
| Japanese | 54 | 0.4% |
| Korean | 780 | 6.0% |
| Laotian | 17 | 0.1% |
| Lebanese | 30 | 0.2% |
| Lithuanian | 12 | 0.1% |
| Malaysian | 21 | 0.2% |
| Mexican | 475 | 3.7% |
| Northern European | 80 | 0.6% |
| Norwegian | 374 | 2.9% |
| Pakistani | 61 | 0.5% |
| Polish | 164 | 1.3% |
| Portuguese | 56 | 0.4% |
| Puerto Rican | 57 | 0.4% |
| Romanian | 112 | 0.9% |
| Russian | 74 | 0.6% |
| Salvadoran | 108 | 0.8% |
| Scandinavian | 178 | 1.4% |
| Scotch-Irish | 53 | 0.4% |
| Scottish | 236 | 1.8% |
| Slavic | 7 | 0.1% |
| Slovak | 8 | 0.1% |
| Slovene | 14 | 0.1% |
| South American | 88 | 0.7% |
| Spaniard | 19 | 0.2% |
| Spanish | 35 | 0.3% |
| Sri Lankan | 463 | 3.6% |
| Subsaharan African | 55 | 0.4% |
| Swedish | 277 | 2.1% |
| Swiss | 21 | 0.2% |
| Thai | 1,081 | 8.4% |
| Turkish | 90 | 0.7% |
| Ukrainian | 52 | 0.4% |
| Welsh | 46 | 0.4% |
| West Indian | 17 | 0.1% | View All 73 Rows |
Immigrants in Newcastle
The most numerous immigrant groups reported in Newcastle came from Asia (2,828 | 21.9%), Eastern Asia (1,526 | 11.8%), China (1,033 | 8.0%), South Central Asia (801 | 6.2%), and India (673 | 5.2%), together accounting for 53.0% of all Newcastle residents.
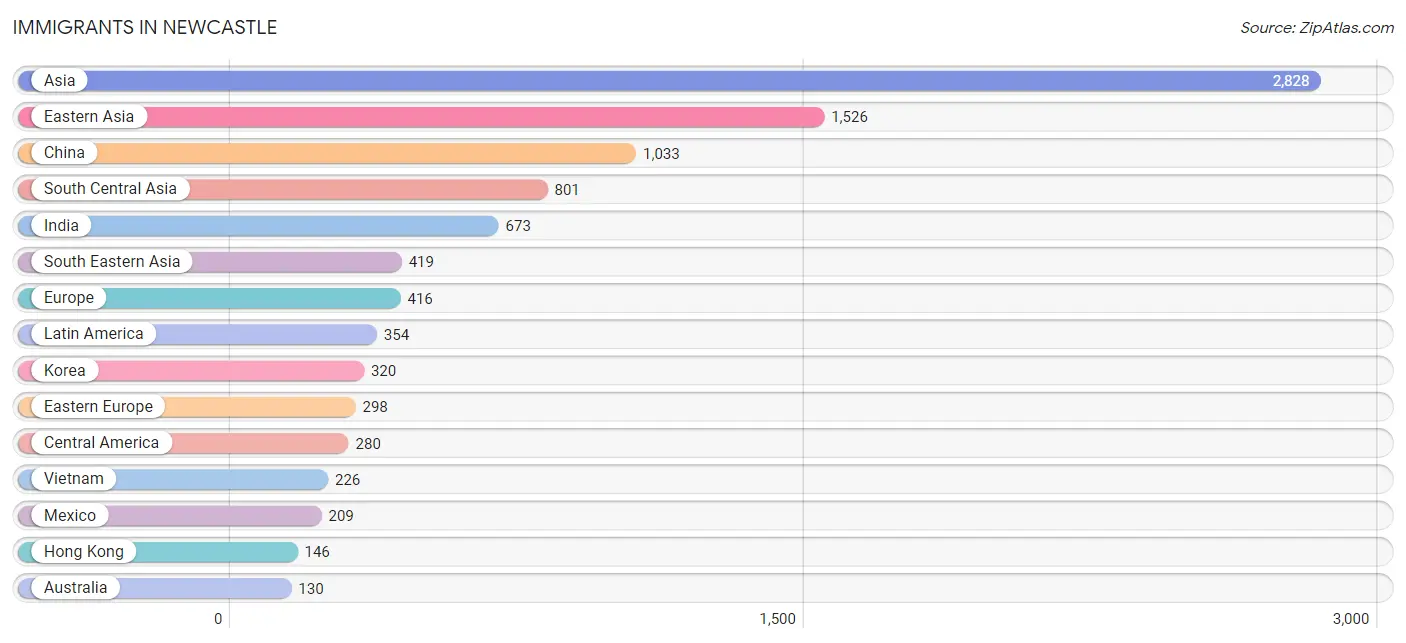
| Immigration Origin | # Population | % Population |
| Africa | 61 | 0.5% |
| Asia | 2,828 | 21.9% |
| Australia | 130 | 1.0% |
| Brazil | 36 | 0.3% |
| Bulgaria | 8 | 0.1% |
| Cambodia | 11 | 0.1% |
| Canada | 99 | 0.8% |
| Caribbean | 21 | 0.2% |
| Central America | 280 | 2.2% |
| China | 1,033 | 8.0% |
| Eastern Africa | 27 | 0.2% |
| Eastern Asia | 1,526 | 11.8% |
| Eastern Europe | 298 | 2.3% |
| Ecuador | 17 | 0.1% |
| El Salvador | 71 | 0.5% |
| England | 71 | 0.5% |
| Ethiopia | 19 | 0.2% |
| Europe | 416 | 3.2% |
| Germany | 9 | 0.1% |
| Haiti | 14 | 0.1% |
| Hong Kong | 146 | 1.1% |
| India | 673 | 5.2% |
| Indonesia | 7 | 0.1% |
| Iran | 45 | 0.4% |
| Israel | 8 | 0.1% |
| Jamaica | 7 | 0.1% |
| Japan | 110 | 0.9% |
| Korea | 320 | 2.5% |
| Latin America | 354 | 2.7% |
| Malaysia | 28 | 0.2% |
| Mexico | 209 | 1.6% |
| Nepal | 51 | 0.4% |
| Northern Europe | 101 | 0.8% |
| Oceania | 130 | 1.0% |
| Pakistan | 32 | 0.3% |
| Philippines | 120 | 0.9% |
| Poland | 14 | 0.1% |
| Romania | 92 | 0.7% |
| Russia | 40 | 0.3% |
| South Africa | 34 | 0.3% |
| South America | 53 | 0.4% |
| South Central Asia | 801 | 6.2% |
| South Eastern Asia | 419 | 3.2% |
| Sweden | 30 | 0.2% |
| Switzerland | 8 | 0.1% |
| Taiwan | 129 | 1.0% |
| Thailand | 27 | 0.2% |
| Turkey | 68 | 0.5% |
| Ukraine | 122 | 0.9% |
| Vietnam | 226 | 1.8% |
| Western Asia | 82 | 0.6% |
| Western Europe | 17 | 0.1% |
| Zimbabwe | 8 | 0.1% | View All 53 Rows |
Sex and Age in Newcastle
Sex and Age in Newcastle
The most populous age groups in Newcastle are 25 to 29 Years (629 | 9.7%) for men and 30 to 34 Years (700 | 10.8%) for women.
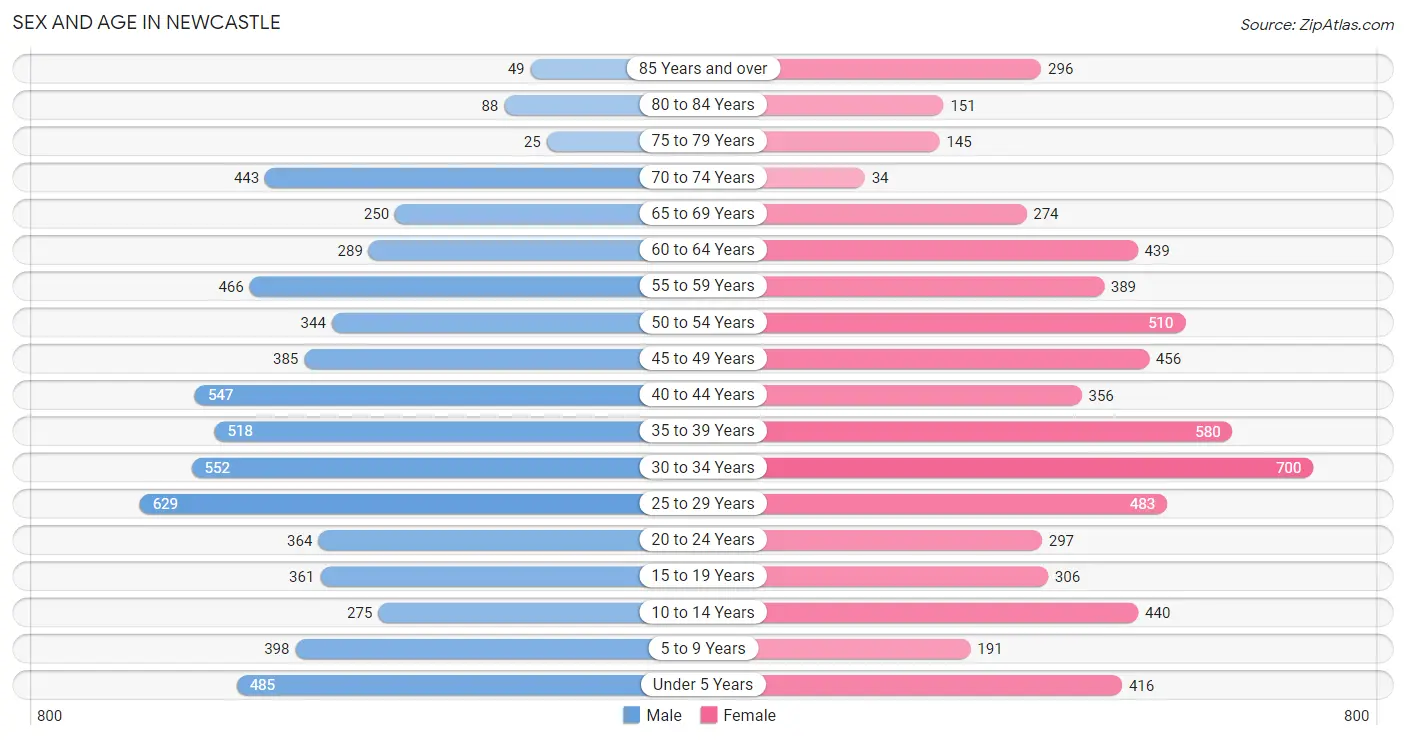
| Age Bracket | Male | Female |
| Under 5 Years | 485 (7.5%) | 416 (6.4%) |
| 5 to 9 Years | 398 (6.1%) | 191 (3.0%) |
| 10 to 14 Years | 275 (4.3%) | 440 (6.8%) |
| 15 to 19 Years | 361 (5.6%) | 306 (4.7%) |
| 20 to 24 Years | 364 (5.6%) | 297 (4.6%) |
| 25 to 29 Years | 629 (9.7%) | 483 (7.5%) |
| 30 to 34 Years | 552 (8.5%) | 700 (10.8%) |
| 35 to 39 Years | 518 (8.0%) | 580 (9.0%) |
| 40 to 44 Years | 547 (8.5%) | 356 (5.5%) |
| 45 to 49 Years | 385 (5.9%) | 456 (7.1%) |
| 50 to 54 Years | 344 (5.3%) | 510 (7.9%) |
| 55 to 59 Years | 466 (7.2%) | 389 (6.0%) |
| 60 to 64 Years | 289 (4.5%) | 439 (6.8%) |
| 65 to 69 Years | 250 (3.9%) | 274 (4.2%) |
| 70 to 74 Years | 443 (6.9%) | 34 (0.5%) |
| 75 to 79 Years | 25 (0.4%) | 145 (2.2%) |
| 80 to 84 Years | 88 (1.4%) | 151 (2.3%) |
| 85 Years and over | 49 (0.8%) | 296 (4.6%) |
| Total | 6,468 (100.0%) | 6,463 (100.0%) |
Families and Households in Newcastle
Median Family Size in Newcastle
The median family size in Newcastle is 2.84 persons per family, with single female/mother families (379 | 10.6%) accounting for the largest median family size of 2.95 persons per family. On the other hand, single male/father families (265 | 7.4%) represent the smallest median family size with 1.68 persons per family.
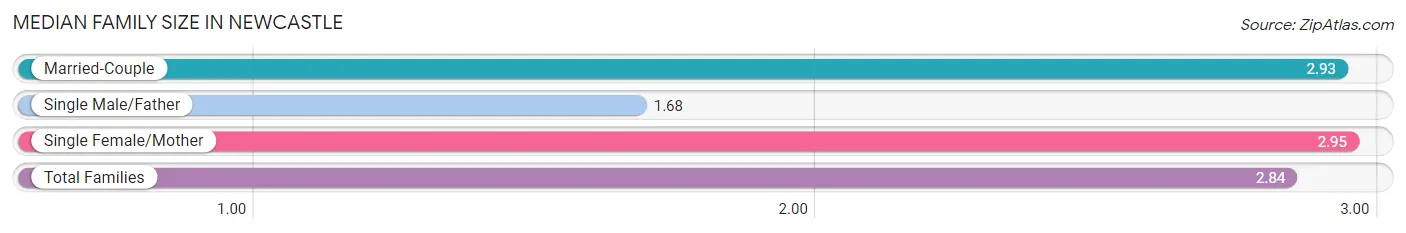
| Family Type | # Families | Family Size |
| Married-Couple | 2,926 (82.0%) | 2.93 |
| Single Male/Father | 265 (7.4%) | 1.68 |
| Single Female/Mother | 379 (10.6%) | 2.95 |
| Total Families | 3,570 (100.0%) | 2.84 |
Median Household Size in Newcastle
The median household size in Newcastle is 2.42 persons per household, with single female/mother households (379 | 7.1%) accounting for the largest median household size of 3.18 persons per household. non-family households (1,768 | 33.1%) represent the smallest median household size with 1.46 persons per household.
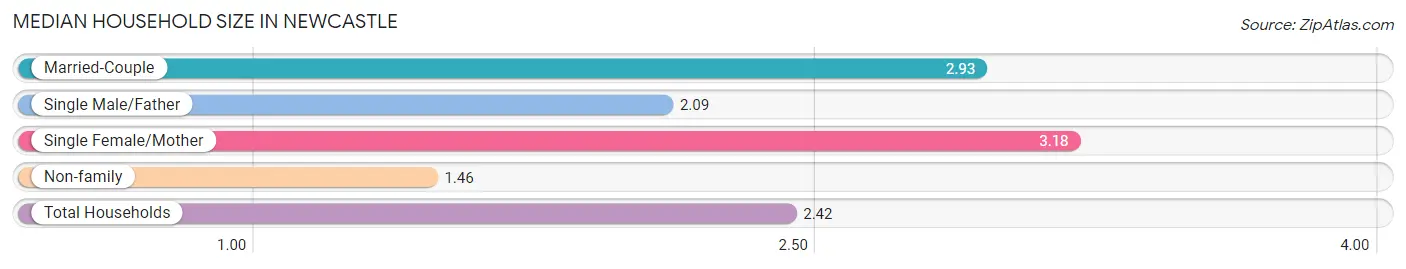
| Household Type | # Households | Household Size |
| Married-Couple | 2,926 (54.8%) | 2.93 |
| Single Male/Father | 265 (5.0%) | 2.09 |
| Single Female/Mother | 379 (7.1%) | 3.18 |
| Non-family | 1,768 (33.1%) | 1.46 |
| Total Households | 5,338 (100.0%) | 2.42 |
Household Size by Marriage Status in Newcastle
Out of a total of 5,338 households in Newcastle, 3,570 (66.9%) are family households, while 1,768 (33.1%) are nonfamily households. The most numerous type of family households are 2-person households, comprising 1,357, and the most common type of nonfamily households are 1-person households, comprising 1,262.
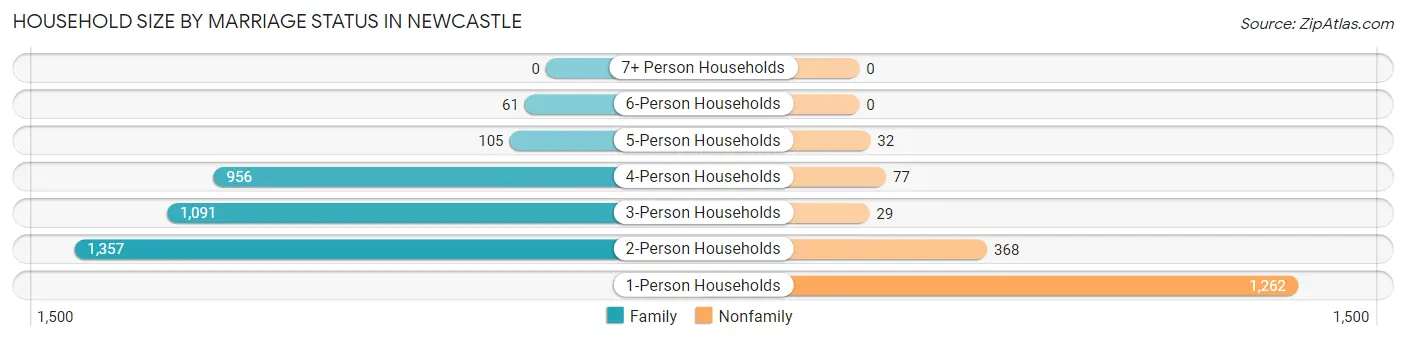
| Household Size | Family Households | Nonfamily Households |
| 1-Person Households | - | 1,262 (23.6%) |
| 2-Person Households | 1,357 (25.4%) | 368 (6.9%) |
| 3-Person Households | 1,091 (20.4%) | 29 (0.5%) |
| 4-Person Households | 956 (17.9%) | 77 (1.4%) |
| 5-Person Households | 105 (2.0%) | 32 (0.6%) |
| 6-Person Households | 61 (1.1%) | 0 (0.0%) |
| 7+ Person Households | 0 (0.0%) | 0 (0.0%) |
| Total | 3,570 (66.9%) | 1,768 (33.1%) |
Female Fertility in Newcastle
Fertility by Age in Newcastle
Average fertility rate in Newcastle is 57.0 births per 1,000 women. Women in the age bracket of 20 to 34 years have the highest fertility rate with 80.0 births per 1,000 women. Women in the age bracket of 20 to 34 years acount for 63.3% of all women with births.
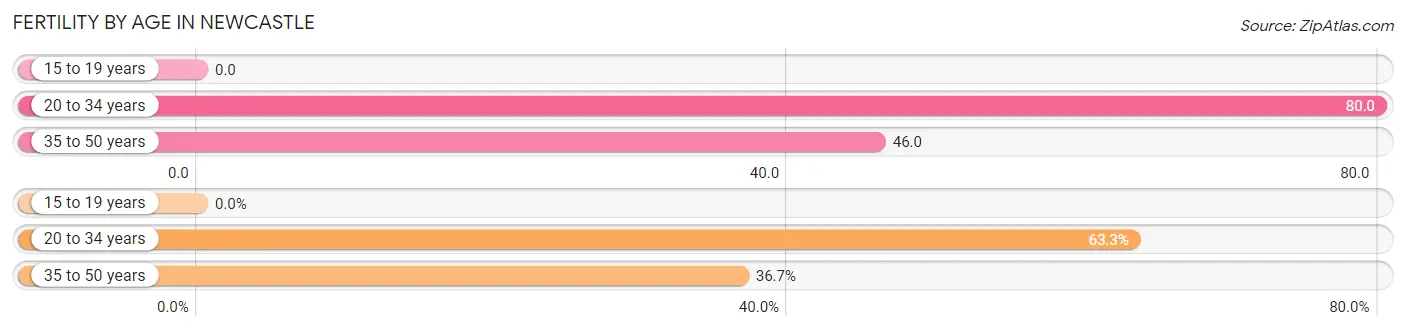
| Age Bracket | Women with Births | Births / 1,000 Women |
| 15 to 19 years | 0 (0.0%) | 0.0 |
| 20 to 34 years | 119 (63.3%) | 80.0 |
| 35 to 50 years | 69 (36.7%) | 46.0 |
| Total | 188 (100.0%) | 57.0 |
Fertility by Age by Marriage Status in Newcastle
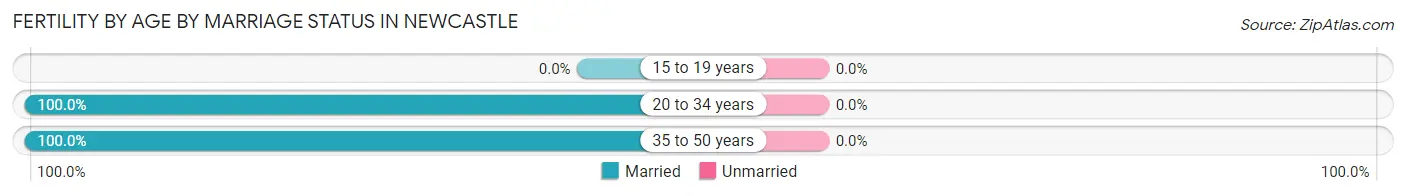
| Age Bracket | Married | Unmarried |
| 15 to 19 years | 0 (0.0%) | 0 (0.0%) |
| 20 to 34 years | 119 (100.0%) | 0 (0.0%) |
| 35 to 50 years | 69 (100.0%) | 0 (0.0%) |
| Total | 188 (100.0%) | 0 (0.0%) |
Fertility by Education in Newcastle
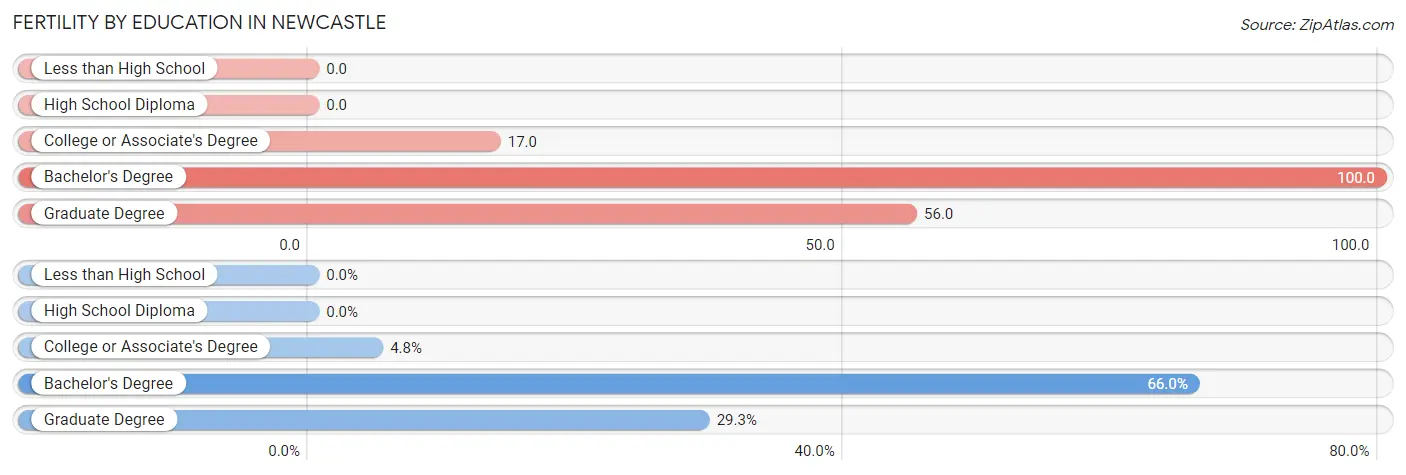
| Educational Attainment | Women with Births | Births / 1,000 Women |
| Less than High School | 0 (0.0%) | 0.0 |
| High School Diploma | 0 (0.0%) | 0.0 |
| College or Associate's Degree | 9 (4.8%) | 17.0 |
| Bachelor's Degree | 124 (66.0%) | 100.0 |
| Graduate Degree | 55 (29.3%) | 56.0 |
| Total | 188 (100.0%) | 57.0 |
Fertility by Education by Marriage Status in Newcastle
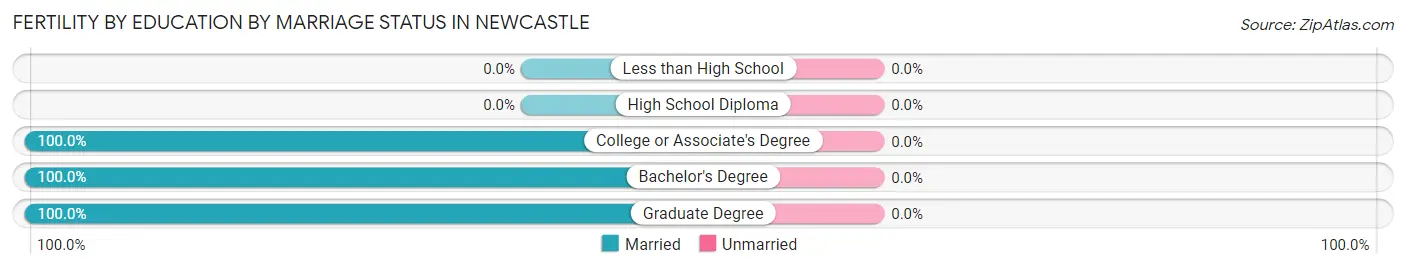
| Educational Attainment | Married | Unmarried |
| Less than High School | 0 (0.0%) | 0 (0.0%) |
| High School Diploma | 0 (0.0%) | 0 (0.0%) |
| College or Associate's Degree | 9 (100.0%) | 0 (0.0%) |
| Bachelor's Degree | 124 (100.0%) | 0 (0.0%) |
| Graduate Degree | 55 (100.0%) | 0 (0.0%) |
| Total | 188 (100.0%) | 0 (0.0%) |
Employment Characteristics in Newcastle
Employment by Class of Employer in Newcastle
Among the 6,582 employed individuals in Newcastle, private company employees (4,961 | 75.4%), not-for-profit organizations (467 | 7.1%), and self-employed (incorporated) (386 | 5.9%) make up the most common classes of employment.
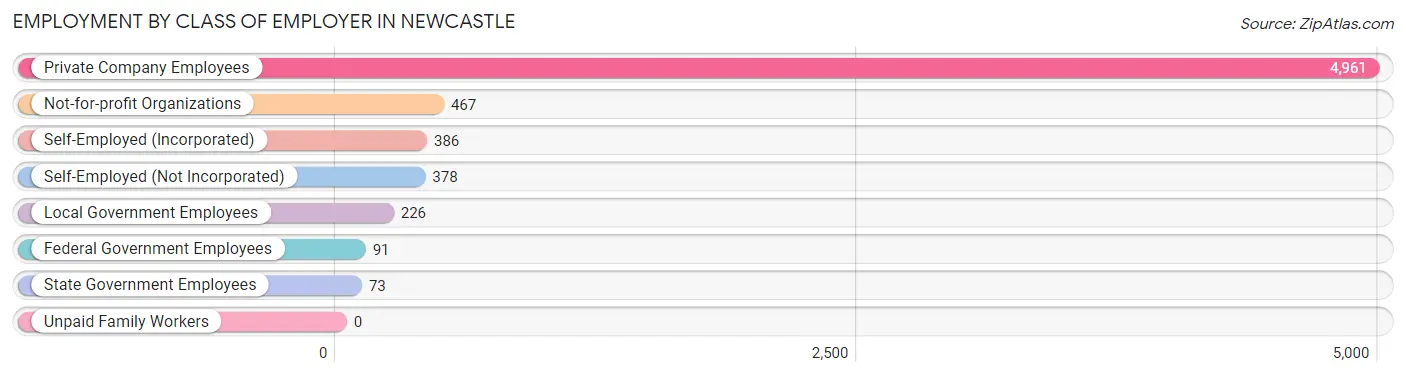
| Employer Class | # Employees | % Employees |
| Private Company Employees | 4,961 | 75.4% |
| Self-Employed (Incorporated) | 386 | 5.9% |
| Self-Employed (Not Incorporated) | 378 | 5.7% |
| Not-for-profit Organizations | 467 | 7.1% |
| Local Government Employees | 226 | 3.4% |
| State Government Employees | 73 | 1.1% |
| Federal Government Employees | 91 | 1.4% |
| Unpaid Family Workers | 0 | 0.0% |
| Total | 6,582 | 100.0% |
Employment Status by Age in Newcastle
According to the labor force statistics for Newcastle, out of the total population over 16 years of age (10,620), 65.7% or 6,977 individuals are in the labor force, with 4.9% or 342 of them unemployed. The age group with the highest labor force participation rate is 25 to 29 years, with 89.2% or 992 individuals in the labor force. Within the labor force, the 25 to 29 years age range has the highest percentage of unemployed individuals, with 14.2% or 141 of them being unemployed.
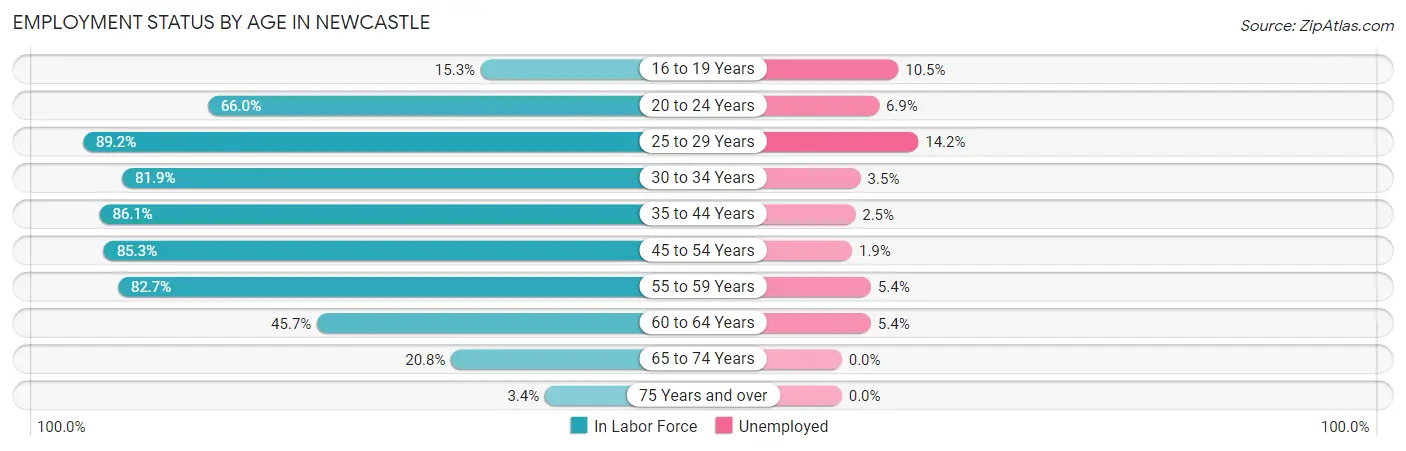
| Age Bracket | In Labor Force | Unemployed |
| 16 to 19 Years | 86 (15.3%) | 9 (10.5%) |
| 20 to 24 Years | 436 (66.0%) | 30 (6.9%) |
| 25 to 29 Years | 992 (89.2%) | 141 (14.2%) |
| 30 to 34 Years | 1,025 (81.9%) | 36 (3.5%) |
| 35 to 44 Years | 1,723 (86.1%) | 43 (2.5%) |
| 45 to 54 Years | 1,446 (85.3%) | 27 (1.9%) |
| 55 to 59 Years | 707 (82.7%) | 38 (5.4%) |
| 60 to 64 Years | 333 (45.7%) | 18 (5.4%) |
| 65 to 74 Years | 208 (20.8%) | 0 (0.0%) |
| 75 Years and over | 26 (3.4%) | 0 (0.0%) |
| Total | 6,977 (65.7%) | 342 (4.9%) |
Employment Status by Educational Attainment in Newcastle
According to labor force statistics for Newcastle, 81.5% of individuals (6,229) out of the total population between 25 and 64 years of age (7,643) are in the labor force, with 4.8% or 299 of them being unemployed. The group with the highest labor force participation rate are those with the educational attainment of less than high school, with 85.0% or 85 individuals in the labor force. Within the labor force, individuals with high school diploma education have the highest percentage of unemployment, with 11.1% or 44 of them being unemployed.
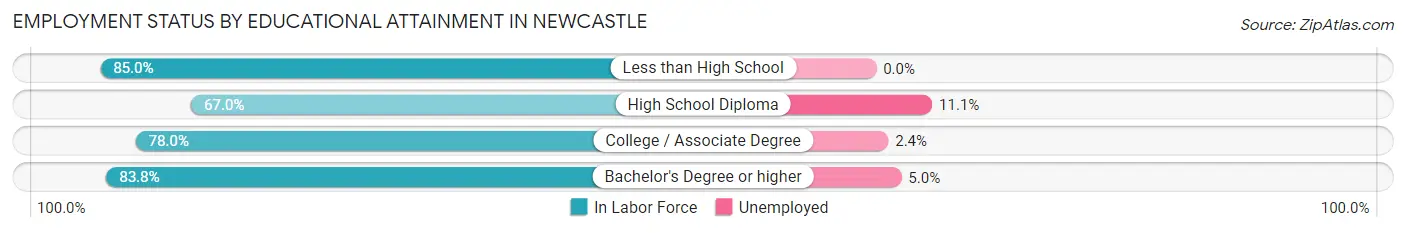
| Educational Attainment | In Labor Force | Unemployed |
| Less than High School | 85 (85.0%) | 0 (0.0%) |
| High School Diploma | 398 (67.0%) | 66 (11.1%) |
| College / Associate Degree | 1,046 (78.0%) | 32 (2.4%) |
| Bachelor's Degree or higher | 4,700 (83.8%) | 280 (5.0%) |
| Total | 6,229 (81.5%) | 367 (4.8%) |
Employment Occupations by Sex in Newcastle
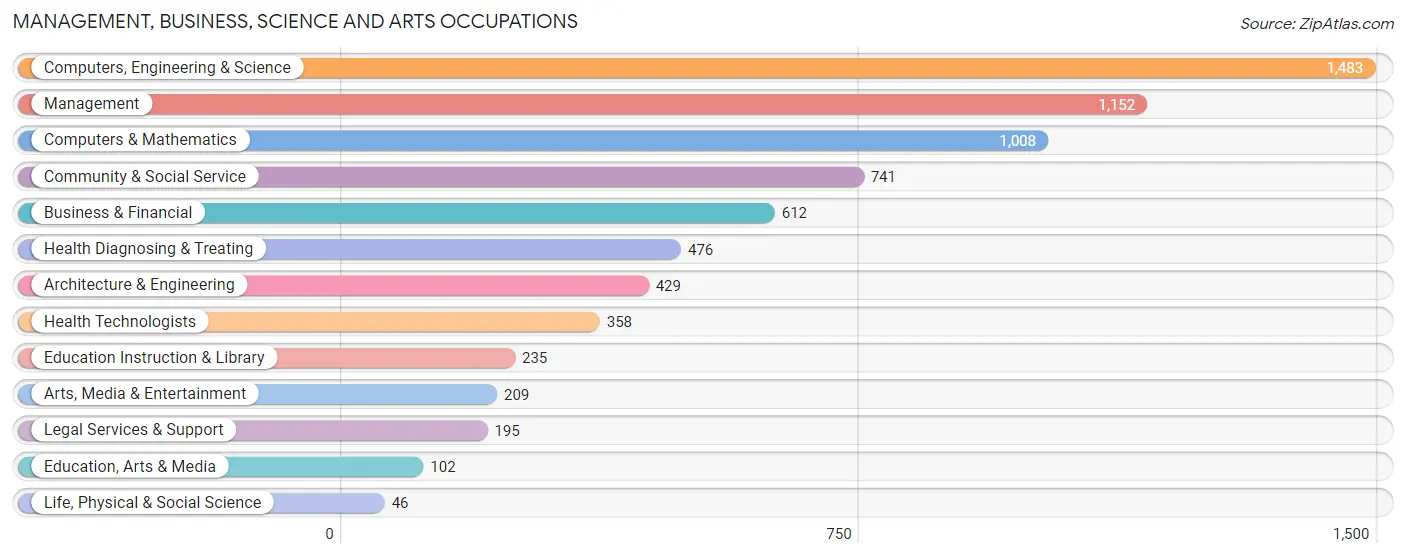
Management, Business, Science and Arts Occupations
The most common Management, Business, Science and Arts occupations in Newcastle are Computers, Engineering & Science (1,483 | 22.4%), Management (1,152 | 17.4%), Computers & Mathematics (1,008 | 15.2%), Community & Social Service (741 | 11.2%), and Business & Financial (612 | 9.2%).
Management, Business, Science and Arts Occupations by Sex
Within the Management, Business, Science and Arts occupations in Newcastle, the most male-oriented occupations are Computers & Mathematics (82.8%), Life, Physical & Social Science (82.6%), and Computers, Engineering & Science (80.5%), while the most female-oriented occupations are Education, Arts & Media (92.2%), Health Technologists (69.6%), and Health Diagnosing & Treating (68.3%).
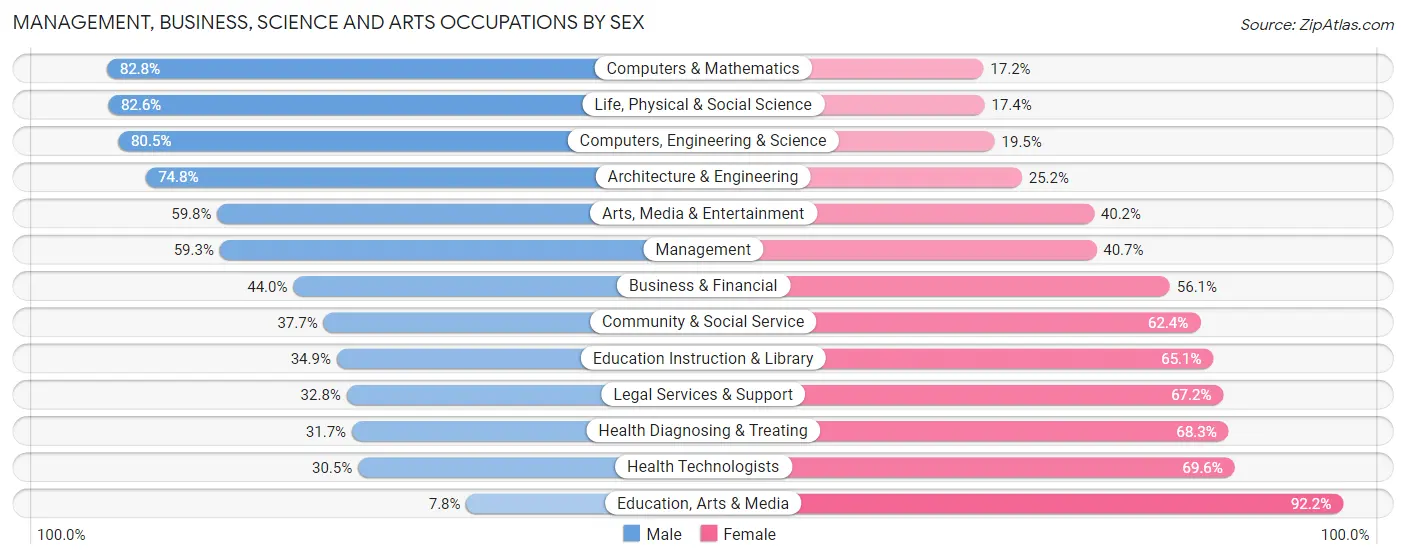
| Occupation | Male | Female |
| Management | 683 (59.3%) | 469 (40.7%) |
| Business & Financial | 269 (44.0%) | 343 (56.0%) |
| Computers, Engineering & Science | 1,194 (80.5%) | 289 (19.5%) |
| Computers & Mathematics | 835 (82.8%) | 173 (17.2%) |
| Architecture & Engineering | 321 (74.8%) | 108 (25.2%) |
| Life, Physical & Social Science | 38 (82.6%) | 8 (17.4%) |
| Community & Social Service | 279 (37.7%) | 462 (62.4%) |
| Education, Arts & Media | 8 (7.8%) | 94 (92.2%) |
| Legal Services & Support | 64 (32.8%) | 131 (67.2%) |
| Education Instruction & Library | 82 (34.9%) | 153 (65.1%) |
| Arts, Media & Entertainment | 125 (59.8%) | 84 (40.2%) |
| Health Diagnosing & Treating | 151 (31.7%) | 325 (68.3%) |
| Health Technologists | 109 (30.4%) | 249 (69.6%) |
| Total (Category) | 2,576 (57.7%) | 1,888 (42.3%) |
| Total (Overall) | 3,675 (55.4%) | 2,956 (44.6%) |
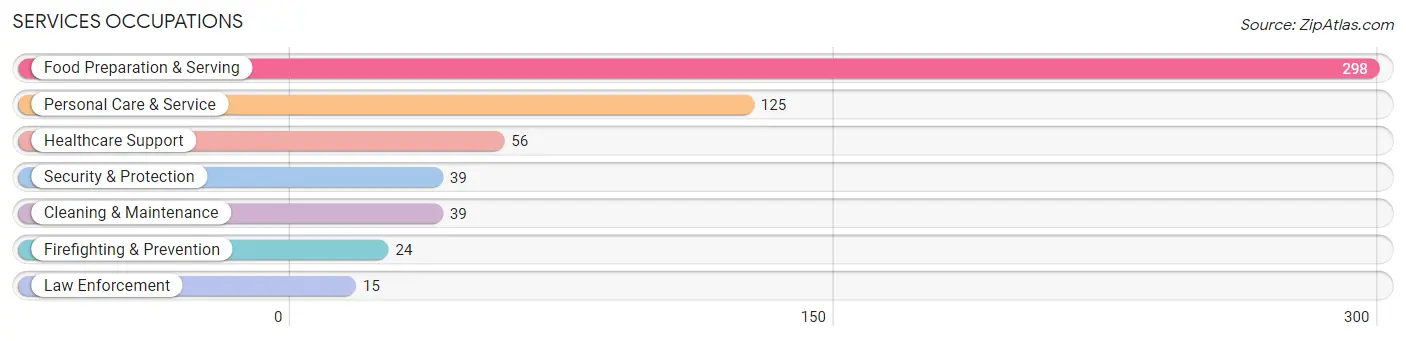
Services Occupations
The most common Services occupations in Newcastle are Food Preparation & Serving (298 | 4.5%), Personal Care & Service (125 | 1.9%), Healthcare Support (56 | 0.8%), Security & Protection (39 | 0.6%), and Cleaning & Maintenance (39 | 0.6%).
Services Occupations by Sex
Within the Services occupations in Newcastle, the most male-oriented occupations are Cleaning & Maintenance (100.0%), Food Preparation & Serving (67.4%), and Firefighting & Prevention (33.3%), while the most female-oriented occupations are Healthcare Support (100.0%), Law Enforcement (100.0%), and Personal Care & Service (100.0%).
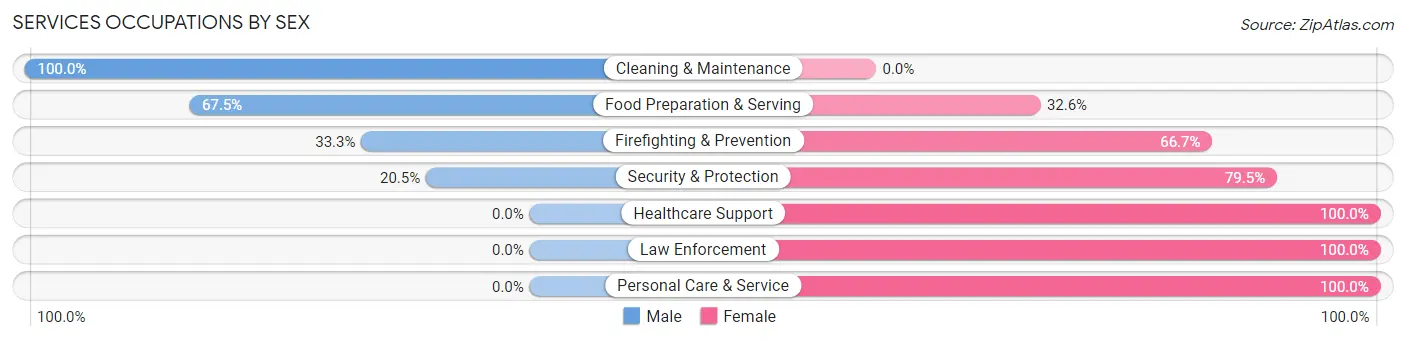
| Occupation | Male | Female |
| Healthcare Support | 0 (0.0%) | 56 (100.0%) |
| Security & Protection | 8 (20.5%) | 31 (79.5%) |
| Firefighting & Prevention | 8 (33.3%) | 16 (66.7%) |
| Law Enforcement | 0 (0.0%) | 15 (100.0%) |
| Food Preparation & Serving | 201 (67.4%) | 97 (32.6%) |
| Cleaning & Maintenance | 39 (100.0%) | 0 (0.0%) |
| Personal Care & Service | 0 (0.0%) | 125 (100.0%) |
| Total (Category) | 248 (44.5%) | 309 (55.5%) |
| Total (Overall) | 3,675 (55.4%) | 2,956 (44.6%) |
Sales and Office Occupations
The most common Sales and Office occupations in Newcastle are Sales & Related (562 | 8.5%), and Office & Administration (526 | 7.9%).
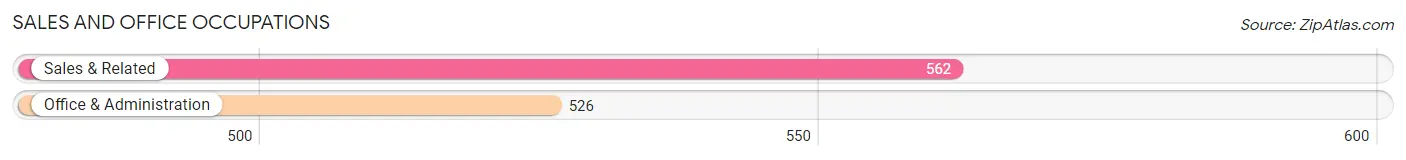
Sales and Office Occupations by Sex
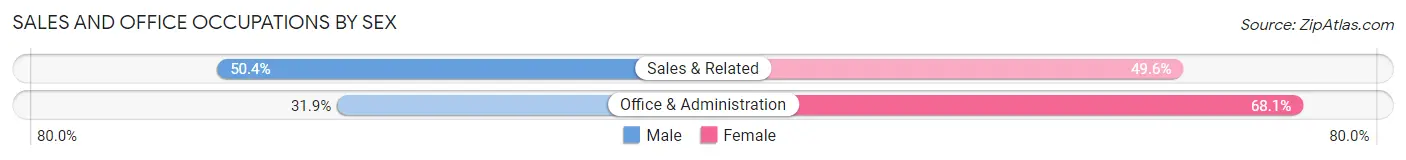
| Occupation | Male | Female |
| Sales & Related | 283 (50.4%) | 279 (49.6%) |
| Office & Administration | 168 (31.9%) | 358 (68.1%) |
| Total (Category) | 451 (41.4%) | 637 (58.6%) |
| Total (Overall) | 3,675 (55.4%) | 2,956 (44.6%) |
Natural Resources, Construction and Maintenance Occupations
The most common Natural Resources, Construction and Maintenance occupations in Newcastle are , and Construction & Extraction (144 | 2.2%).
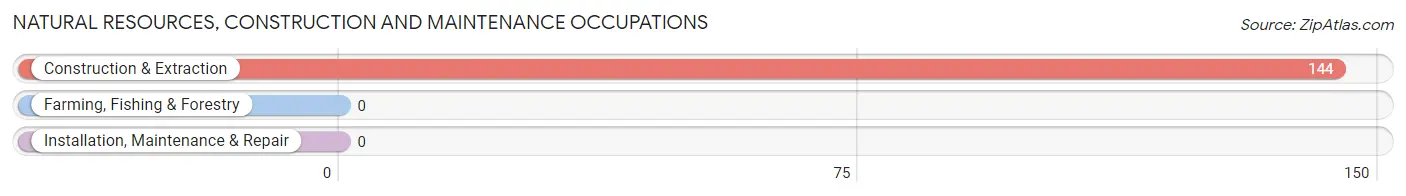
Natural Resources, Construction and Maintenance Occupations by Sex
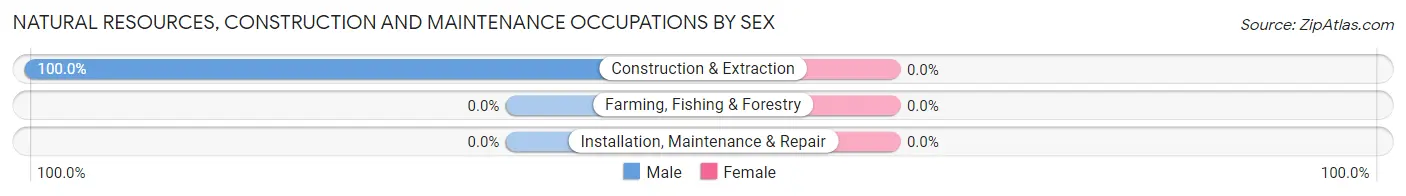
| Occupation | Male | Female |
| Farming, Fishing & Forestry | 0 (0.0%) | 0 (0.0%) |
| Construction & Extraction | 144 (100.0%) | 0 (0.0%) |
| Installation, Maintenance & Repair | 0 (0.0%) | 0 (0.0%) |
| Total (Category) | 144 (100.0%) | 0 (0.0%) |
| Total (Overall) | 3,675 (55.4%) | 2,956 (44.6%) |
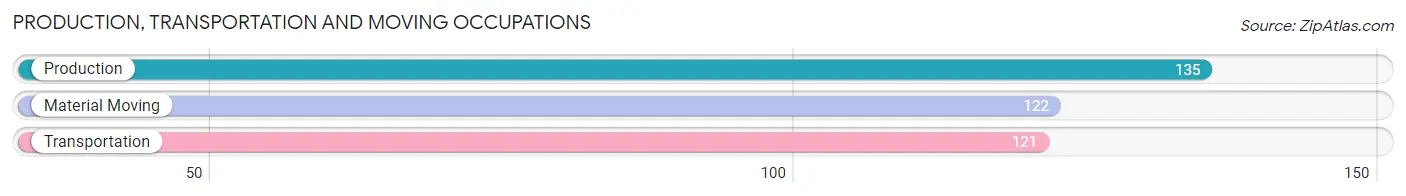
Production, Transportation and Moving Occupations
The most common Production, Transportation and Moving occupations in Newcastle are Production (135 | 2.0%), Material Moving (122 | 1.8%), and Transportation (121 | 1.8%).
Production, Transportation and Moving Occupations by Sex
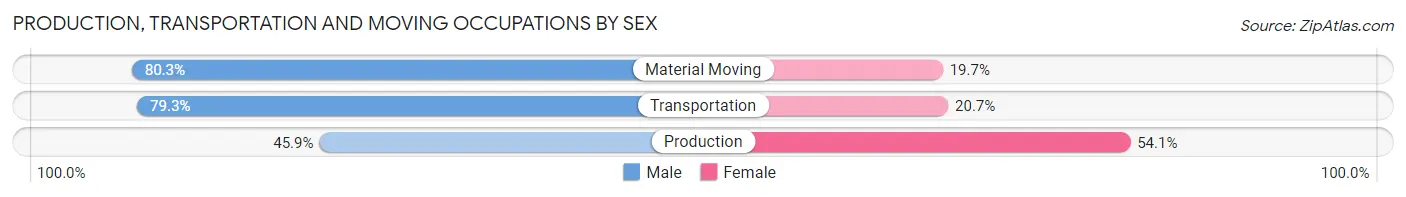
| Occupation | Male | Female |
| Production | 62 (45.9%) | 73 (54.1%) |
| Transportation | 96 (79.3%) | 25 (20.7%) |
| Material Moving | 98 (80.3%) | 24 (19.7%) |
| Total (Category) | 256 (67.7%) | 122 (32.3%) |
| Total (Overall) | 3,675 (55.4%) | 2,956 (44.6%) |
Employment Industries by Sex in Newcastle
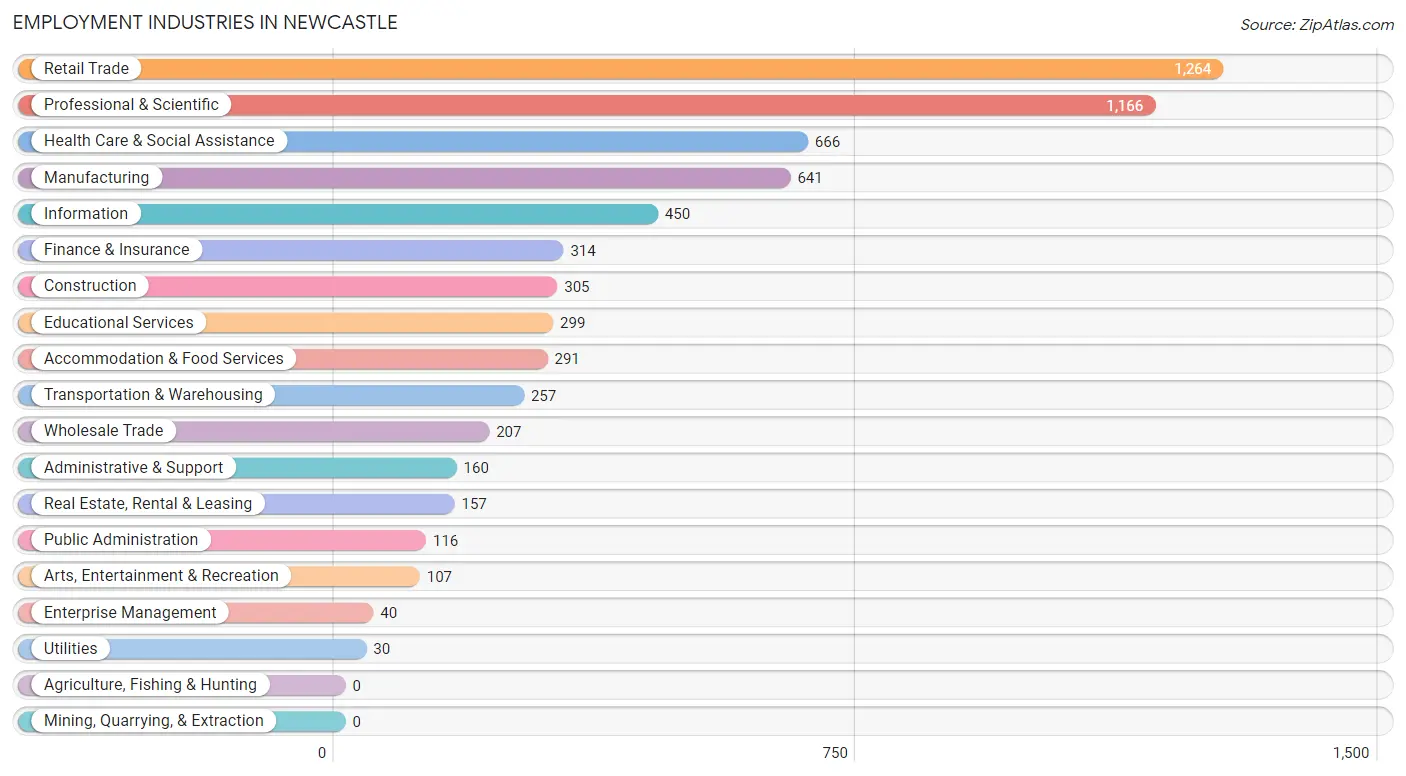
Employment Industries in Newcastle
The major employment industries in Newcastle include Retail Trade (1,264 | 19.1%), Professional & Scientific (1,166 | 17.6%), Health Care & Social Assistance (666 | 10.0%), Manufacturing (641 | 9.7%), and Information (450 | 6.8%).
Employment Industries by Sex in Newcastle
The Newcastle industries that see more men than women are Construction (84.9%), Information (82.9%), and Administrative & Support (80.0%), whereas the industries that tend to have a higher number of women are Educational Services (79.6%), Health Care & Social Assistance (77.0%), and Utilities (73.3%).
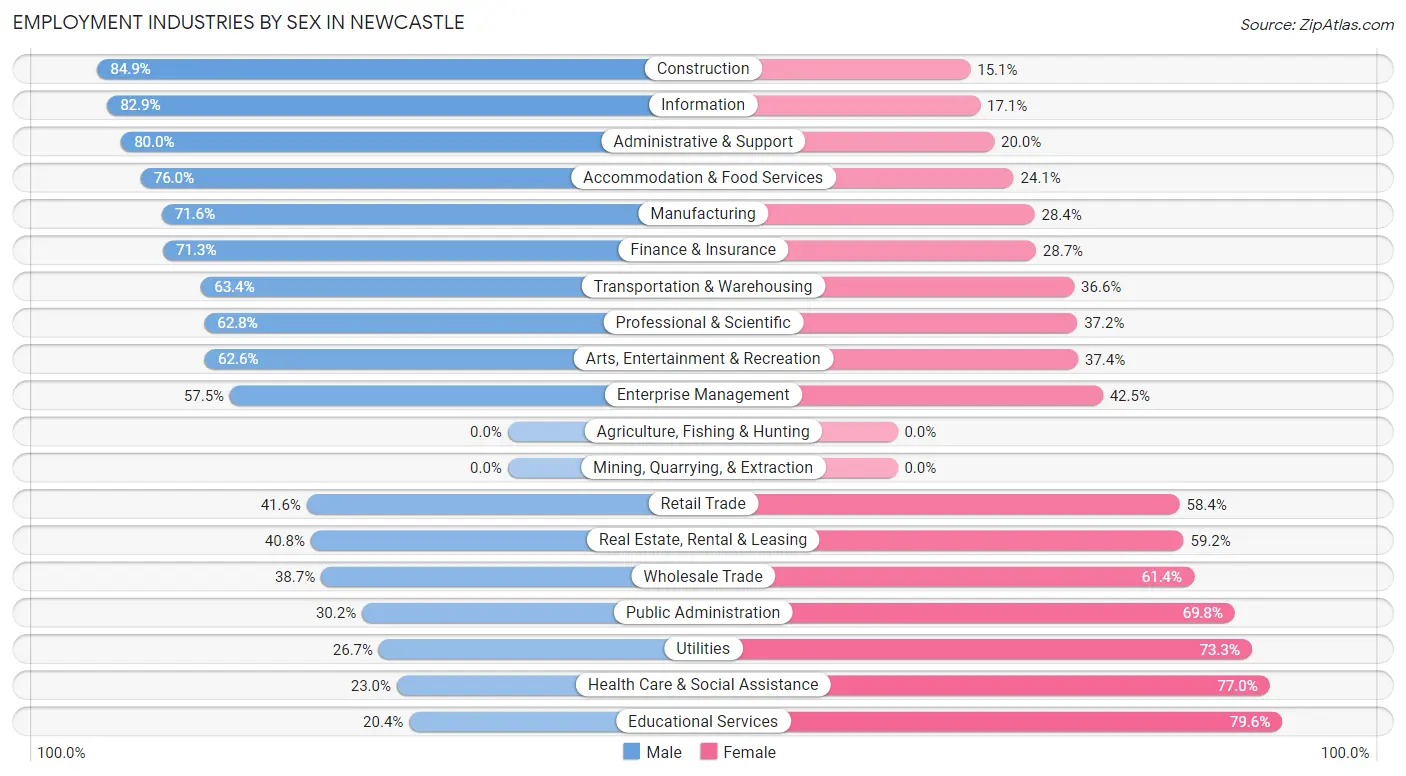
| Industry | Male | Female |
| Agriculture, Fishing & Hunting | 0 (0.0%) | 0 (0.0%) |
| Mining, Quarrying, & Extraction | 0 (0.0%) | 0 (0.0%) |
| Construction | 259 (84.9%) | 46 (15.1%) |
| Manufacturing | 459 (71.6%) | 182 (28.4%) |
| Wholesale Trade | 80 (38.7%) | 127 (61.4%) |
| Retail Trade | 526 (41.6%) | 738 (58.4%) |
| Transportation & Warehousing | 163 (63.4%) | 94 (36.6%) |
| Utilities | 8 (26.7%) | 22 (73.3%) |
| Information | 373 (82.9%) | 77 (17.1%) |
| Finance & Insurance | 224 (71.3%) | 90 (28.7%) |
| Real Estate, Rental & Leasing | 64 (40.8%) | 93 (59.2%) |
| Professional & Scientific | 732 (62.8%) | 434 (37.2%) |
| Enterprise Management | 23 (57.5%) | 17 (42.5%) |
| Administrative & Support | 128 (80.0%) | 32 (20.0%) |
| Educational Services | 61 (20.4%) | 238 (79.6%) |
| Health Care & Social Assistance | 153 (23.0%) | 513 (77.0%) |
| Arts, Entertainment & Recreation | 67 (62.6%) | 40 (37.4%) |
| Accommodation & Food Services | 221 (75.9%) | 70 (24.0%) |
| Public Administration | 35 (30.2%) | 81 (69.8%) |
| Total | 3,675 (55.4%) | 2,956 (44.6%) |
Education in Newcastle
School Enrollment in Newcastle
The most common levels of schooling among the 2,598 students in Newcastle are high school (608 | 23.4%), middle school (557 | 21.4%), and elementary school (528 | 20.3%).
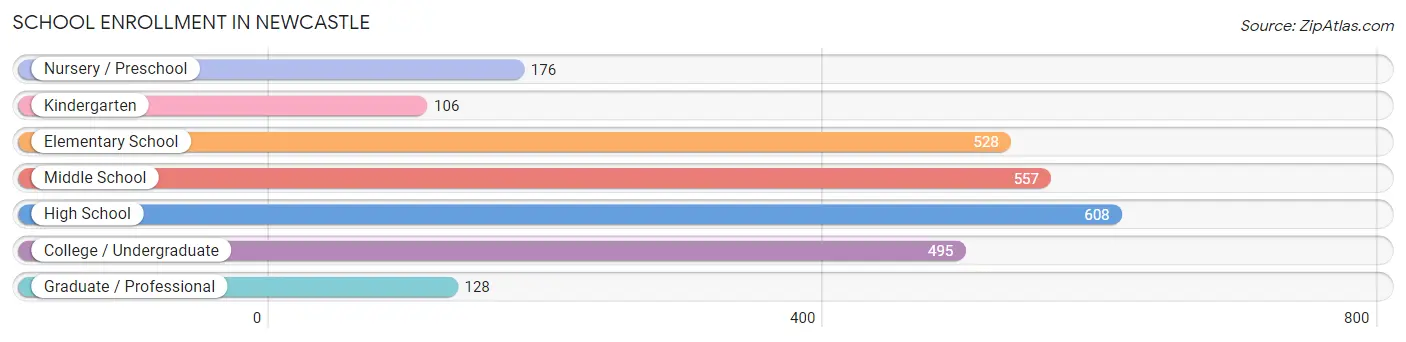
| School Level | # Students | % Students |
| Nursery / Preschool | 176 | 6.8% |
| Kindergarten | 106 | 4.1% |
| Elementary School | 528 | 20.3% |
| Middle School | 557 | 21.4% |
| High School | 608 | 23.4% |
| College / Undergraduate | 495 | 19.1% |
| Graduate / Professional | 128 | 4.9% |
| Total | 2,598 | 100.0% |
School Enrollment by Age by Funding Source in Newcastle
Out of a total of 2,598 students who are enrolled in schools in Newcastle, 582 (22.4%) attend a private institution, while the remaining 2,016 (77.6%) are enrolled in public schools. The age group of 3 to 4 year olds has the highest likelihood of being enrolled in private schools, with 151 (100.0% in the age bracket) enrolled. Conversely, the age group of 15 to 17 year olds has the lowest likelihood of being enrolled in a private school, with 493 (100.0% in the age bracket) attending a public institution.
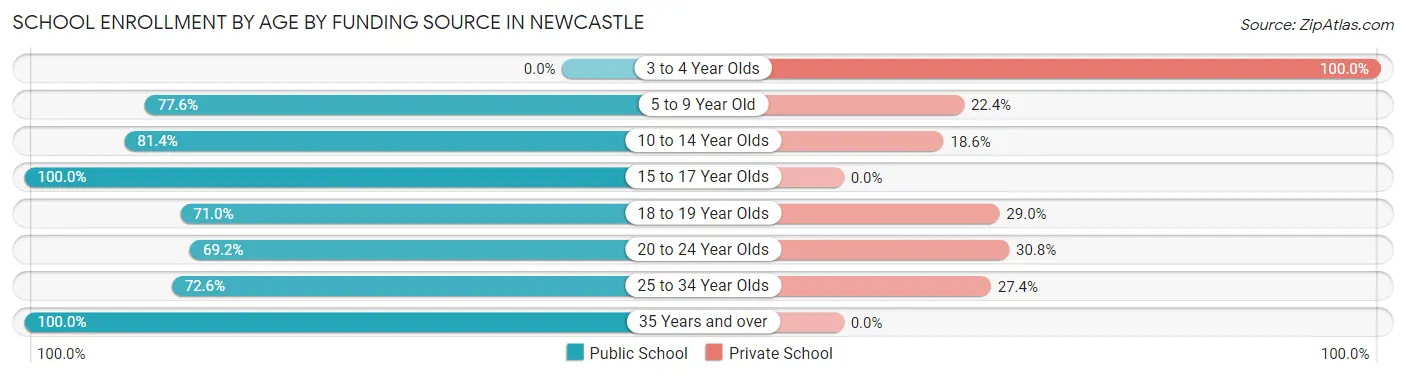
| Age Bracket | Public School | Private School |
| 3 to 4 Year Olds | 0 (0.0%) | 151 (100.0%) |
| 5 to 9 Year Old | 447 (77.6%) | 129 (22.4%) |
| 10 to 14 Year Olds | 582 (81.4%) | 133 (18.6%) |
| 15 to 17 Year Olds | 493 (100.0%) | 0 (0.0%) |
| 18 to 19 Year Olds | 93 (71.0%) | 38 (29.0%) |
| 20 to 24 Year Olds | 211 (69.2%) | 94 (30.8%) |
| 25 to 34 Year Olds | 98 (72.6%) | 37 (27.4%) |
| 35 Years and over | 92 (100.0%) | 0 (0.0%) |
| Total | 2,016 (77.6%) | 582 (22.4%) |
Educational Attainment by Field of Study in Newcastle
Business (1,401 | 19.4%), engineering (1,329 | 18.4%), social sciences (668 | 9.2%), computers & mathematics (663 | 9.2%), and science & technology (557 | 7.7%) are the most common fields of study among 7,232 individuals in Newcastle who have obtained a bachelor's degree or higher.
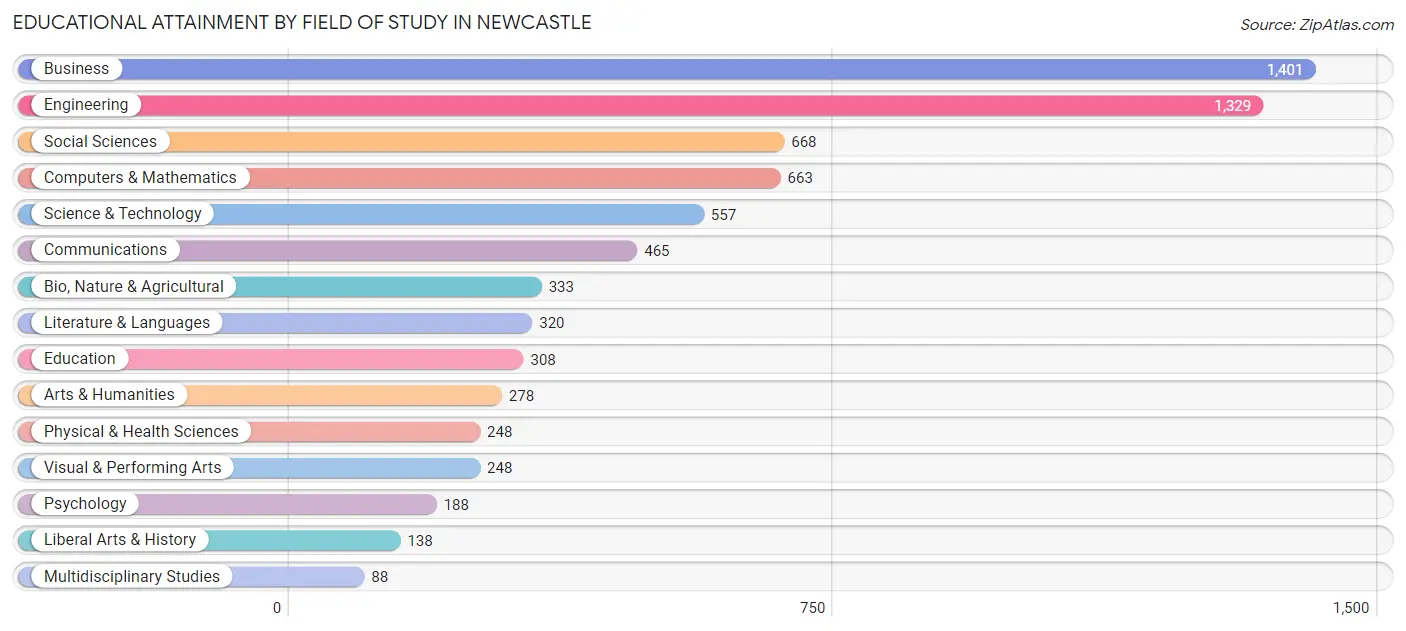
| Field of Study | # Graduates | % Graduates |
| Computers & Mathematics | 663 | 9.2% |
| Bio, Nature & Agricultural | 333 | 4.6% |
| Physical & Health Sciences | 248 | 3.4% |
| Psychology | 188 | 2.6% |
| Social Sciences | 668 | 9.2% |
| Engineering | 1,329 | 18.4% |
| Multidisciplinary Studies | 88 | 1.2% |
| Science & Technology | 557 | 7.7% |
| Business | 1,401 | 19.4% |
| Education | 308 | 4.3% |
| Literature & Languages | 320 | 4.4% |
| Liberal Arts & History | 138 | 1.9% |
| Visual & Performing Arts | 248 | 3.4% |
| Communications | 465 | 6.4% |
| Arts & Humanities | 278 | 3.8% |
| Total | 7,232 | 100.0% |
Transportation & Commute in Newcastle
Vehicle Availability by Sex in Newcastle
The most prevalent vehicle ownership categories in Newcastle are males with 2 vehicles (1,813, accounting for 49.6%) and females with 2 vehicles (1,270, making up 61.9%).
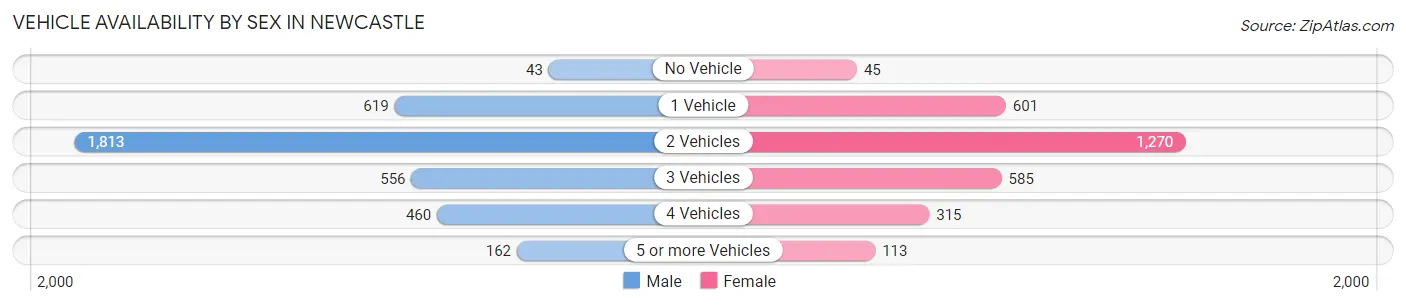
| Vehicles Available | Male | Female |
| No Vehicle | 43 (1.2%) | 45 (1.5%) |
| 1 Vehicle | 619 (16.9%) | 601 (20.5%) |
| 2 Vehicles | 1,813 (49.6%) | 1,270 (43.4%) |
| 3 Vehicles | 556 (15.2%) | 585 (20.0%) |
| 4 Vehicles | 460 (12.6%) | 315 (10.7%) |
| 5 or more Vehicles | 162 (4.4%) | 113 (3.9%) |
| Total | 3,653 (100.0%) | 2,929 (100.0%) |
Commute Time in Newcastle
The most frequently occuring commute durations in Newcastle are 20 to 24 minutes (1,155 commuters, 23.0%), 30 to 34 minutes (1,057 commuters, 21.1%), and 45 to 59 minutes (543 commuters, 10.8%).
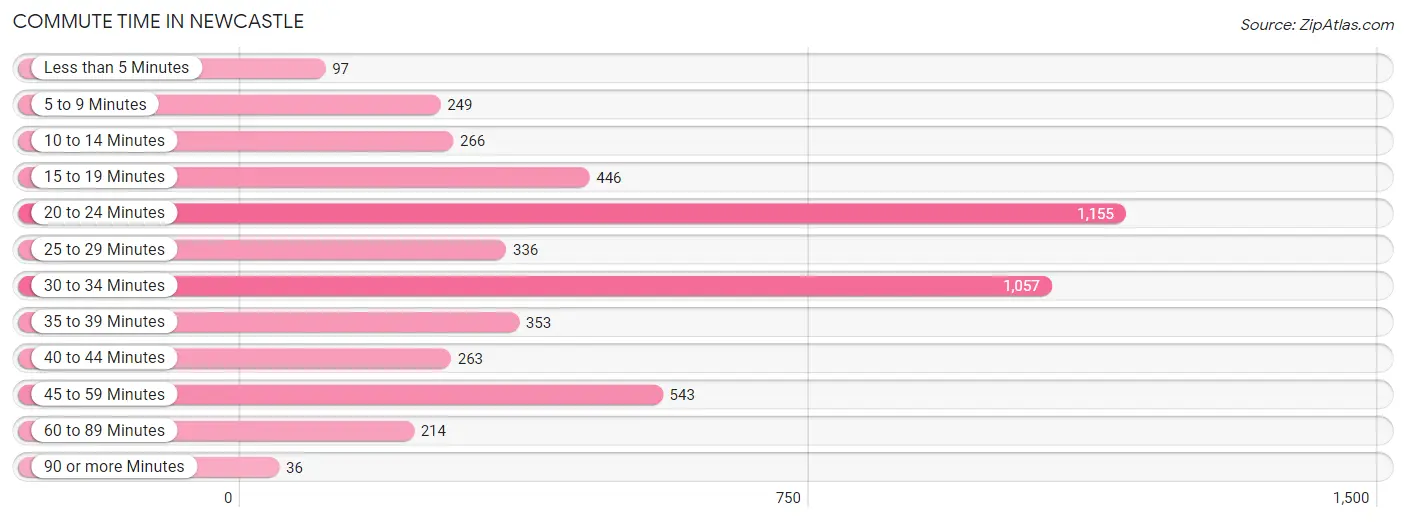
| Commute Time | # Commuters | % Commuters |
| Less than 5 Minutes | 97 | 1.9% |
| 5 to 9 Minutes | 249 | 5.0% |
| 10 to 14 Minutes | 266 | 5.3% |
| 15 to 19 Minutes | 446 | 8.9% |
| 20 to 24 Minutes | 1,155 | 23.0% |
| 25 to 29 Minutes | 336 | 6.7% |
| 30 to 34 Minutes | 1,057 | 21.1% |
| 35 to 39 Minutes | 353 | 7.0% |
| 40 to 44 Minutes | 263 | 5.2% |
| 45 to 59 Minutes | 543 | 10.8% |
| 60 to 89 Minutes | 214 | 4.3% |
| 90 or more Minutes | 36 | 0.7% |
Commute Time by Sex in Newcastle
The most common commute times in Newcastle are 20 to 24 minutes (610 commuters, 22.7%) for males and 20 to 24 minutes (545 commuters, 23.4%) for females.
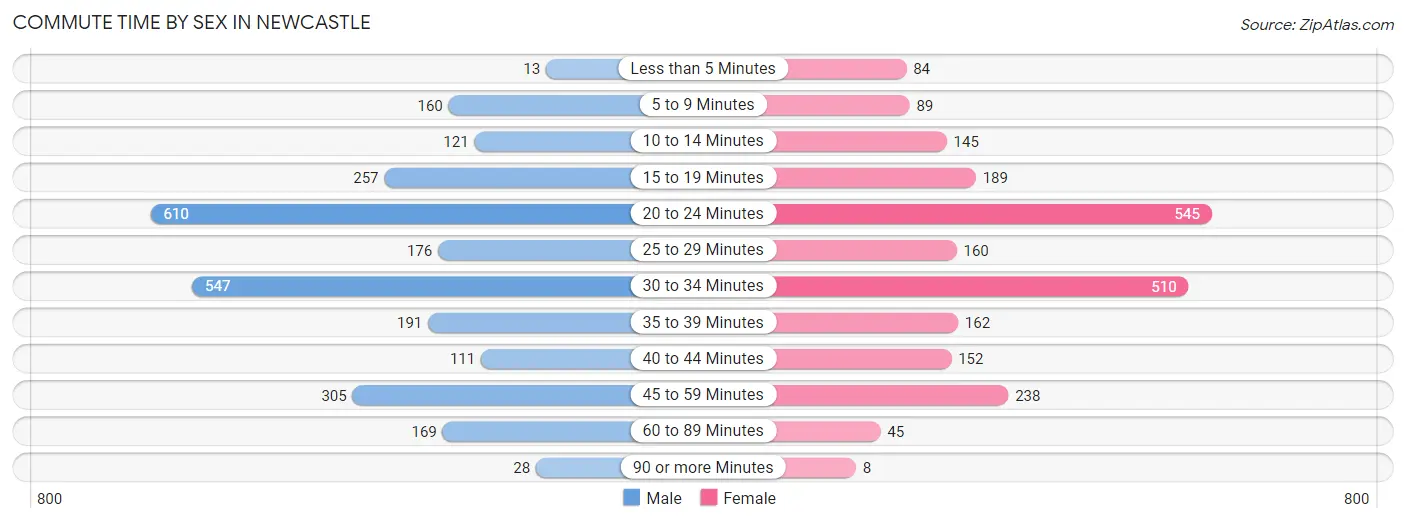
| Commute Time | Male | Female |
| Less than 5 Minutes | 13 (0.5%) | 84 (3.6%) |
| 5 to 9 Minutes | 160 (5.9%) | 89 (3.8%) |
| 10 to 14 Minutes | 121 (4.5%) | 145 (6.2%) |
| 15 to 19 Minutes | 257 (9.6%) | 189 (8.1%) |
| 20 to 24 Minutes | 610 (22.7%) | 545 (23.4%) |
| 25 to 29 Minutes | 176 (6.6%) | 160 (6.9%) |
| 30 to 34 Minutes | 547 (20.3%) | 510 (21.9%) |
| 35 to 39 Minutes | 191 (7.1%) | 162 (7.0%) |
| 40 to 44 Minutes | 111 (4.1%) | 152 (6.5%) |
| 45 to 59 Minutes | 305 (11.4%) | 238 (10.2%) |
| 60 to 89 Minutes | 169 (6.3%) | 45 (1.9%) |
| 90 or more Minutes | 28 (1.0%) | 8 (0.3%) |
Time of Departure to Work by Sex in Newcastle
The most frequent times of departure to work in Newcastle are 7:00 AM to 7:29 AM (398, 14.8%) for males and 7:30 AM to 7:59 AM (374, 16.1%) for females.
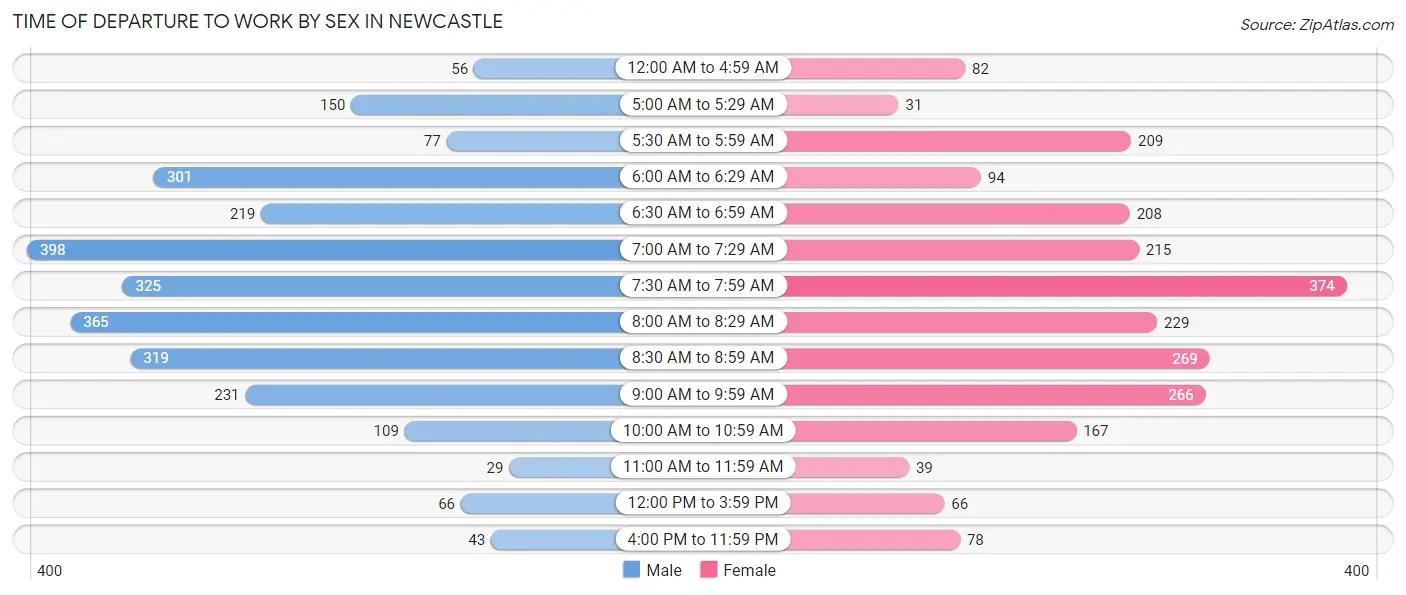
| Time of Departure | Male | Female |
| 12:00 AM to 4:59 AM | 56 (2.1%) | 82 (3.5%) |
| 5:00 AM to 5:29 AM | 150 (5.6%) | 31 (1.3%) |
| 5:30 AM to 5:59 AM | 77 (2.9%) | 209 (9.0%) |
| 6:00 AM to 6:29 AM | 301 (11.2%) | 94 (4.0%) |
| 6:30 AM to 6:59 AM | 219 (8.2%) | 208 (8.9%) |
| 7:00 AM to 7:29 AM | 398 (14.8%) | 215 (9.2%) |
| 7:30 AM to 7:59 AM | 325 (12.1%) | 374 (16.1%) |
| 8:00 AM to 8:29 AM | 365 (13.6%) | 229 (9.8%) |
| 8:30 AM to 8:59 AM | 319 (11.9%) | 269 (11.6%) |
| 9:00 AM to 9:59 AM | 231 (8.6%) | 266 (11.4%) |
| 10:00 AM to 10:59 AM | 109 (4.1%) | 167 (7.2%) |
| 11:00 AM to 11:59 AM | 29 (1.1%) | 39 (1.7%) |
| 12:00 PM to 3:59 PM | 66 (2.5%) | 66 (2.8%) |
| 4:00 PM to 11:59 PM | 43 (1.6%) | 78 (3.4%) |
| Total | 2,688 (100.0%) | 2,327 (100.0%) |
Housing Occupancy in Newcastle
Occupancy by Ownership in Newcastle
Of the total 5,338 dwellings in Newcastle, owner-occupied units account for 3,475 (65.1%), while renter-occupied units make up 1,863 (34.9%).
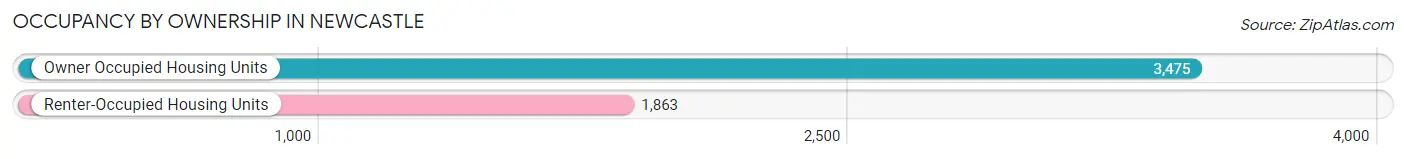
| Occupancy | # Housing Units | % Housing Units |
| Owner Occupied Housing Units | 3,475 | 65.1% |
| Renter-Occupied Housing Units | 1,863 | 34.9% |
| Total Occupied Housing Units | 5,338 | 100.0% |
Occupancy by Household Size in Newcastle
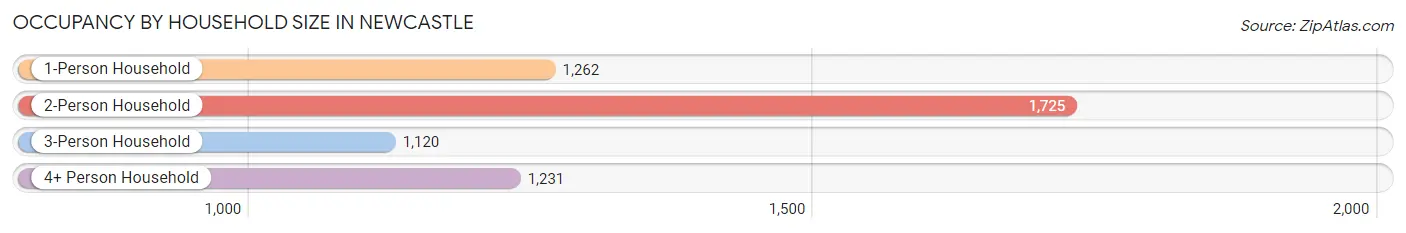
| Household Size | # Housing Units | % Housing Units |
| 1-Person Household | 1,262 | 23.6% |
| 2-Person Household | 1,725 | 32.3% |
| 3-Person Household | 1,120 | 21.0% |
| 4+ Person Household | 1,231 | 23.1% |
| Total Housing Units | 5,338 | 100.0% |
Occupancy by Ownership by Household Size in Newcastle
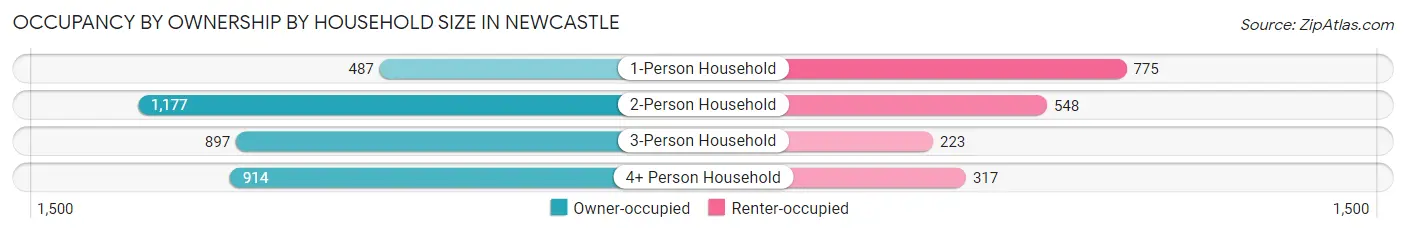
| Household Size | Owner-occupied | Renter-occupied |
| 1-Person Household | 487 (38.6%) | 775 (61.4%) |
| 2-Person Household | 1,177 (68.2%) | 548 (31.8%) |
| 3-Person Household | 897 (80.1%) | 223 (19.9%) |
| 4+ Person Household | 914 (74.3%) | 317 (25.8%) |
| Total Housing Units | 3,475 (65.1%) | 1,863 (34.9%) |
Occupancy by Educational Attainment in Newcastle
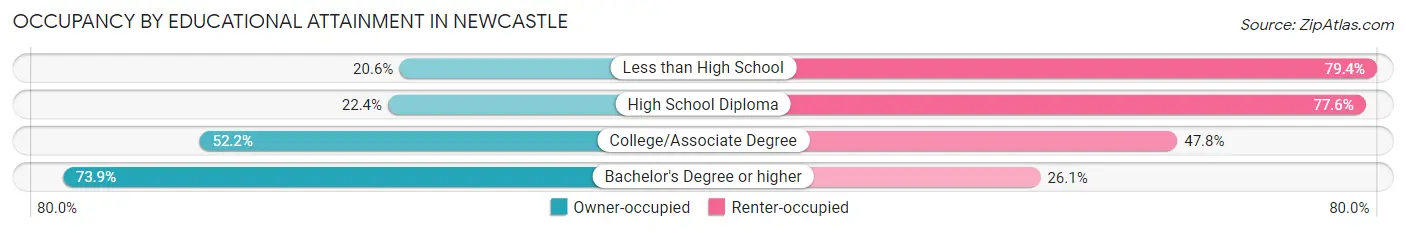
| Household Size | Owner-occupied | Renter-occupied |
| Less than High School | 28 (20.6%) | 108 (79.4%) |
| High School Diploma | 81 (22.4%) | 281 (77.6%) |
| College/Associate Degree | 512 (52.2%) | 468 (47.8%) |
| Bachelor's Degree or higher | 2,854 (73.9%) | 1,006 (26.1%) |
Occupancy by Age of Householder in Newcastle
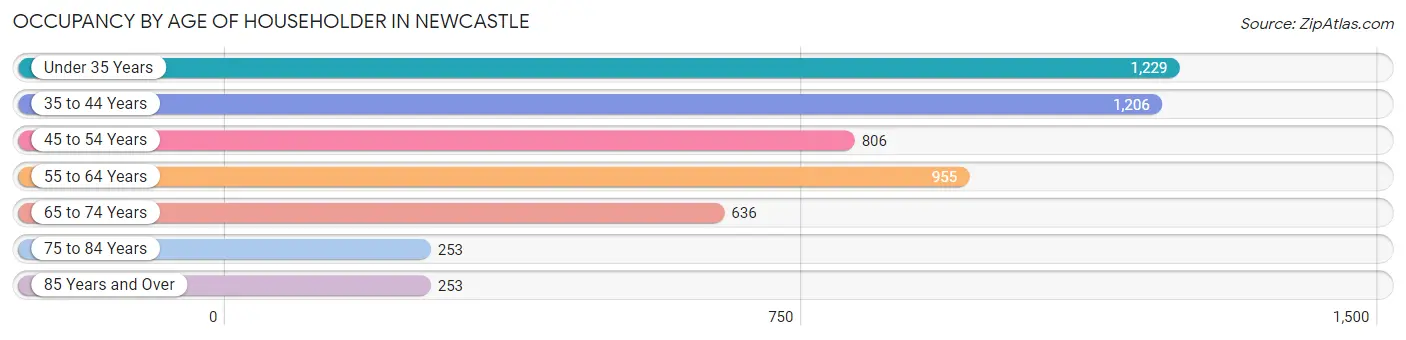
| Age Bracket | # Households | % Households |
| Under 35 Years | 1,229 | 23.0% |
| 35 to 44 Years | 1,206 | 22.6% |
| 45 to 54 Years | 806 | 15.1% |
| 55 to 64 Years | 955 | 17.9% |
| 65 to 74 Years | 636 | 11.9% |
| 75 to 84 Years | 253 | 4.7% |
| 85 Years and Over | 253 | 4.7% |
| Total | 5,338 | 100.0% |
Housing Finances in Newcastle
Median Income by Occupancy in Newcastle
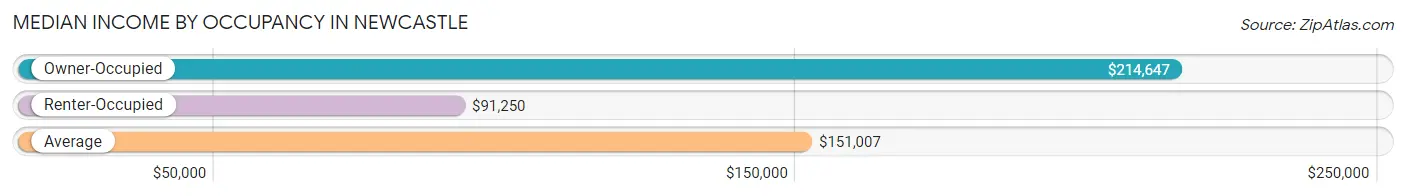
| Occupancy Type | # Households | Median Income |
| Owner-Occupied | 3,475 (65.1%) | $214,647 |
| Renter-Occupied | 1,863 (34.9%) | $91,250 |
| Average | 5,338 (100.0%) | $151,007 |
Occupancy by Householder Income Bracket in Newcastle
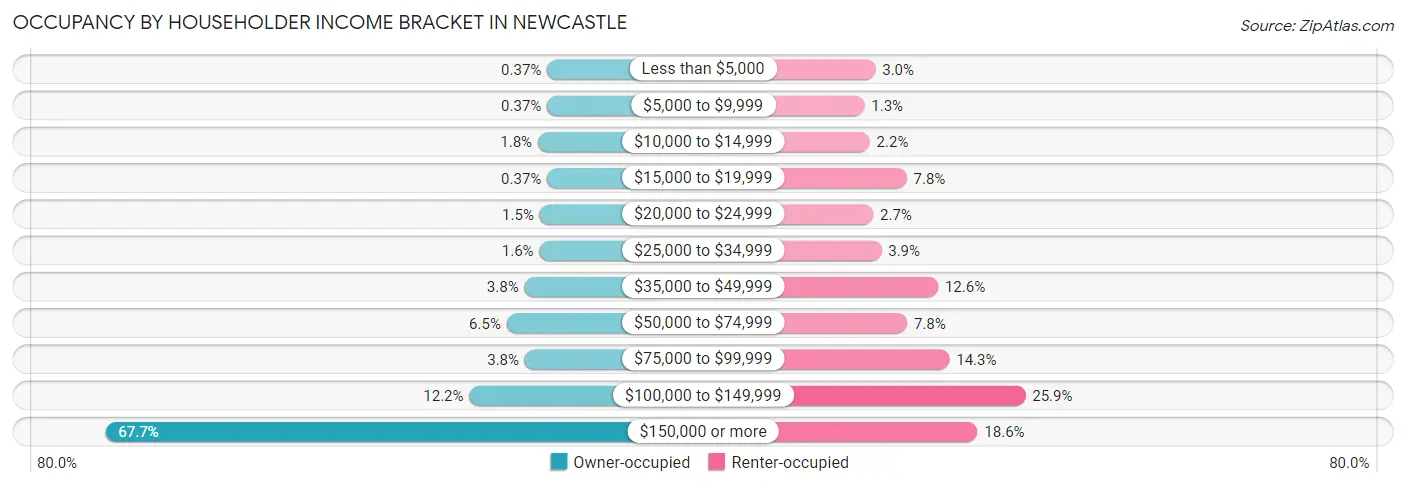
| Income Bracket | Owner-occupied | Renter-occupied |
| Less than $5,000 | 13 (0.4%) | 56 (3.0%) |
| $5,000 to $9,999 | 13 (0.4%) | 25 (1.3%) |
| $10,000 to $14,999 | 62 (1.8%) | 40 (2.1%) |
| $15,000 to $19,999 | 13 (0.4%) | 145 (7.8%) |
| $20,000 to $24,999 | 52 (1.5%) | 50 (2.7%) |
| $25,000 to $34,999 | 54 (1.5%) | 73 (3.9%) |
| $35,000 to $49,999 | 133 (3.8%) | 234 (12.6%) |
| $50,000 to $74,999 | 227 (6.5%) | 146 (7.8%) |
| $75,000 to $99,999 | 131 (3.8%) | 266 (14.3%) |
| $100,000 to $149,999 | 425 (12.2%) | 482 (25.9%) |
| $150,000 or more | 2,352 (67.7%) | 346 (18.6%) |
| Total | 3,475 (100.0%) | 1,863 (100.0%) |
Monthly Housing Cost Tiers in Newcastle
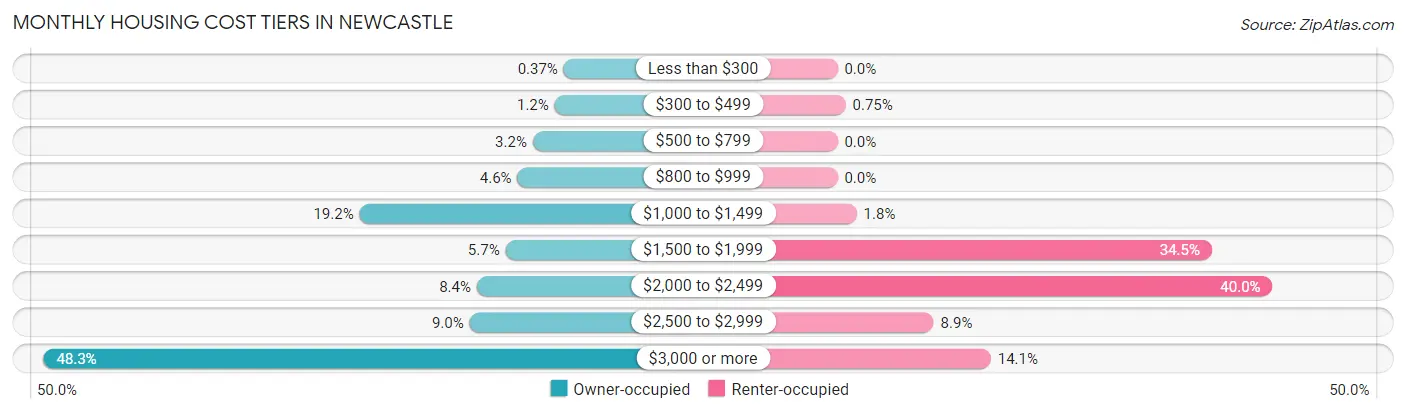
| Monthly Cost | Owner-occupied | Renter-occupied |
| Less than $300 | 13 (0.4%) | 0 (0.0%) |
| $300 to $499 | 42 (1.2%) | 14 (0.7%) |
| $500 to $799 | 112 (3.2%) | 0 (0.0%) |
| $800 to $999 | 161 (4.6%) | 0 (0.0%) |
| $1,000 to $1,499 | 666 (19.2%) | 33 (1.8%) |
| $1,500 to $1,999 | 199 (5.7%) | 642 (34.5%) |
| $2,000 to $2,499 | 291 (8.4%) | 746 (40.0%) |
| $2,500 to $2,999 | 314 (9.0%) | 165 (8.9%) |
| $3,000 or more | 1,677 (48.3%) | 263 (14.1%) |
| Total | 3,475 (100.0%) | 1,863 (100.0%) |
Physical Housing Characteristics in Newcastle
Housing Structures in Newcastle
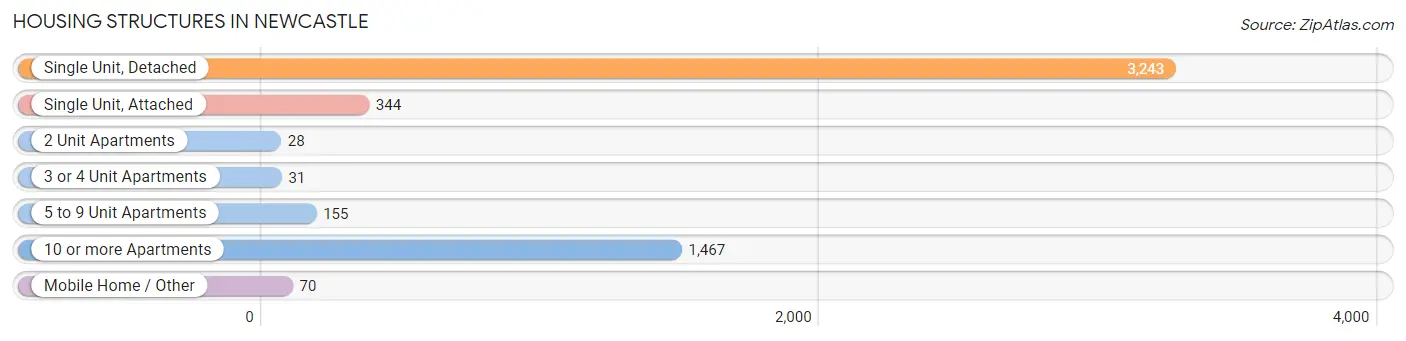
| Structure Type | # Housing Units | % Housing Units |
| Single Unit, Detached | 3,243 | 60.8% |
| Single Unit, Attached | 344 | 6.4% |
| 2 Unit Apartments | 28 | 0.5% |
| 3 or 4 Unit Apartments | 31 | 0.6% |
| 5 to 9 Unit Apartments | 155 | 2.9% |
| 10 or more Apartments | 1,467 | 27.5% |
| Mobile Home / Other | 70 | 1.3% |
| Total | 5,338 | 100.0% |
Housing Structures by Occupancy in Newcastle
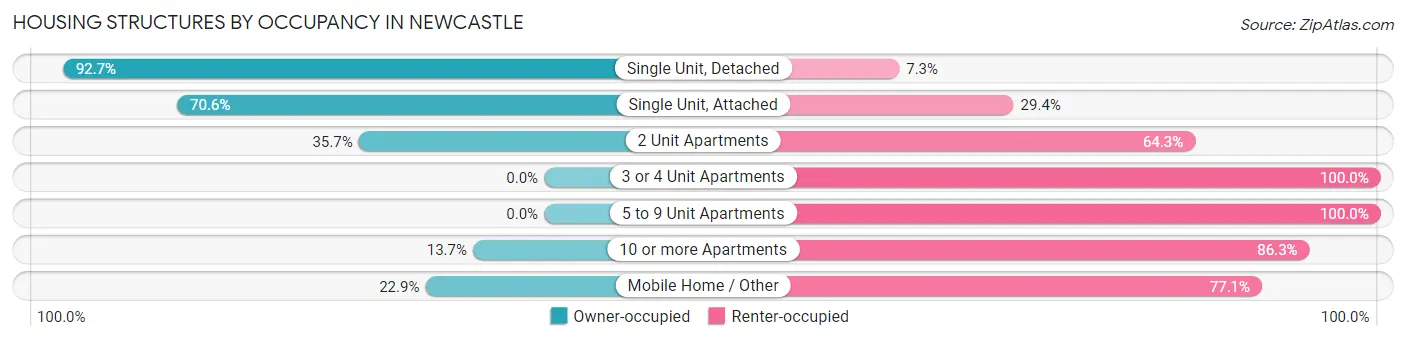
| Structure Type | Owner-occupied | Renter-occupied |
| Single Unit, Detached | 3,005 (92.7%) | 238 (7.3%) |
| Single Unit, Attached | 243 (70.6%) | 101 (29.4%) |
| 2 Unit Apartments | 10 (35.7%) | 18 (64.3%) |
| 3 or 4 Unit Apartments | 0 (0.0%) | 31 (100.0%) |
| 5 to 9 Unit Apartments | 0 (0.0%) | 155 (100.0%) |
| 10 or more Apartments | 201 (13.7%) | 1,266 (86.3%) |
| Mobile Home / Other | 16 (22.9%) | 54 (77.1%) |
| Total | 3,475 (65.1%) | 1,863 (34.9%) |
Housing Structures by Number of Rooms in Newcastle
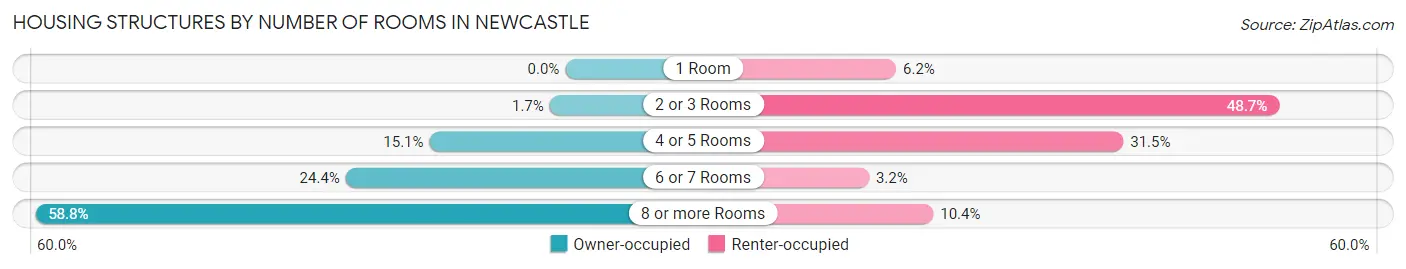
| Number of Rooms | Owner-occupied | Renter-occupied |
| 1 Room | 0 (0.0%) | 116 (6.2%) |
| 2 or 3 Rooms | 60 (1.7%) | 908 (48.7%) |
| 4 or 5 Rooms | 524 (15.1%) | 586 (31.5%) |
| 6 or 7 Rooms | 847 (24.4%) | 60 (3.2%) |
| 8 or more Rooms | 2,044 (58.8%) | 193 (10.4%) |
| Total | 3,475 (100.0%) | 1,863 (100.0%) |
Housing Structure by Heating Type in Newcastle
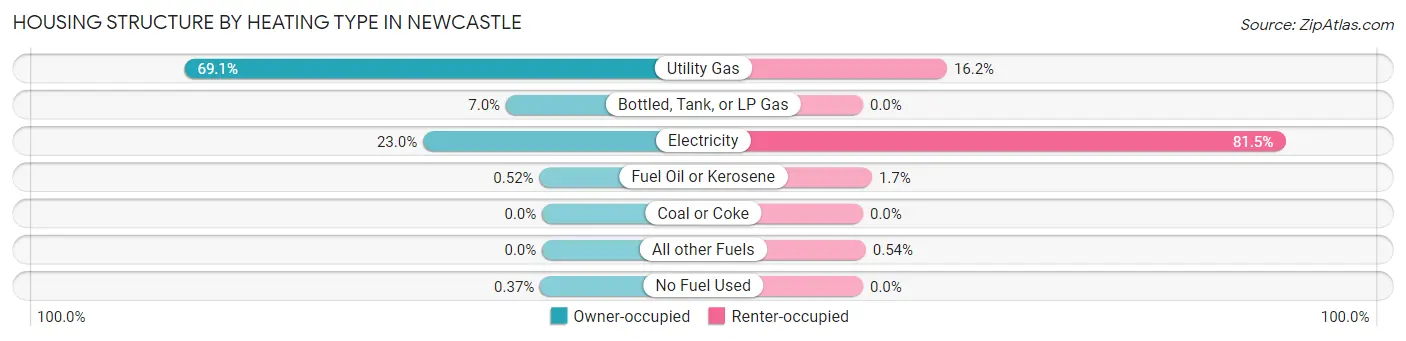
| Heating Type | Owner-occupied | Renter-occupied |
| Utility Gas | 2,401 (69.1%) | 302 (16.2%) |
| Bottled, Tank, or LP Gas | 243 (7.0%) | 0 (0.0%) |
| Electricity | 800 (23.0%) | 1,519 (81.5%) |
| Fuel Oil or Kerosene | 18 (0.5%) | 32 (1.7%) |
| Coal or Coke | 0 (0.0%) | 0 (0.0%) |
| All other Fuels | 0 (0.0%) | 10 (0.5%) |
| No Fuel Used | 13 (0.4%) | 0 (0.0%) |
| Total | 3,475 (100.0%) | 1,863 (100.0%) |
Household Vehicle Usage in Newcastle
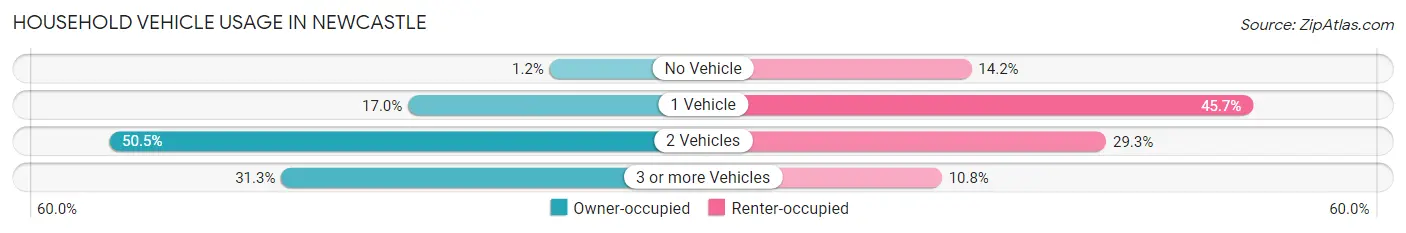
| Vehicles per Household | Owner-occupied | Renter-occupied |
| No Vehicle | 41 (1.2%) | 264 (14.2%) |
| 1 Vehicle | 592 (17.0%) | 852 (45.7%) |
| 2 Vehicles | 1,756 (50.5%) | 545 (29.2%) |
| 3 or more Vehicles | 1,086 (31.2%) | 202 (10.8%) |
| Total | 3,475 (100.0%) | 1,863 (100.0%) |
Real Estate & Mortgages in Newcastle
Real Estate and Mortgage Overview in Newcastle
| Characteristic | Without Mortgage | With Mortgage |
| Housing Units | 1,237 | 2,238 |
| Median Property Value | $968,100 | $1,060,100 |
| Median Household Income | $194,196 | $1,670 |
| Monthly Housing Costs | $1,147 | $1,677 |
| Real Estate Taxes | $8,926 | $17 |
Property Value by Mortgage Status in Newcastle
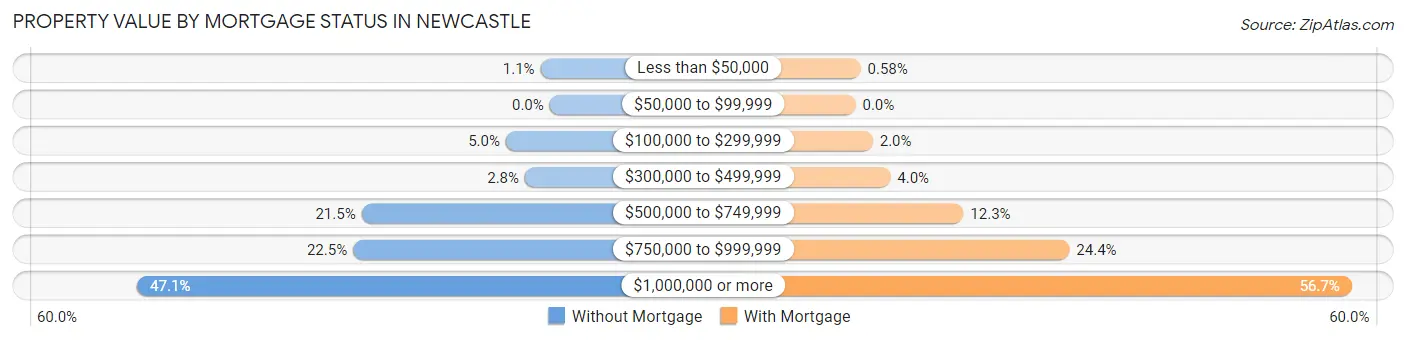
| Property Value | Without Mortgage | With Mortgage |
| Less than $50,000 | 13 (1.1%) | 13 (0.6%) |
| $50,000 to $99,999 | 0 (0.0%) | 0 (0.0%) |
| $100,000 to $299,999 | 62 (5.0%) | 44 (2.0%) |
| $300,000 to $499,999 | 35 (2.8%) | 89 (4.0%) |
| $500,000 to $749,999 | 266 (21.5%) | 276 (12.3%) |
| $750,000 to $999,999 | 278 (22.5%) | 547 (24.4%) |
| $1,000,000 or more | 583 (47.1%) | 1,269 (56.7%) |
| Total | 1,237 (100.0%) | 2,238 (100.0%) |
Household Income by Mortgage Status in Newcastle
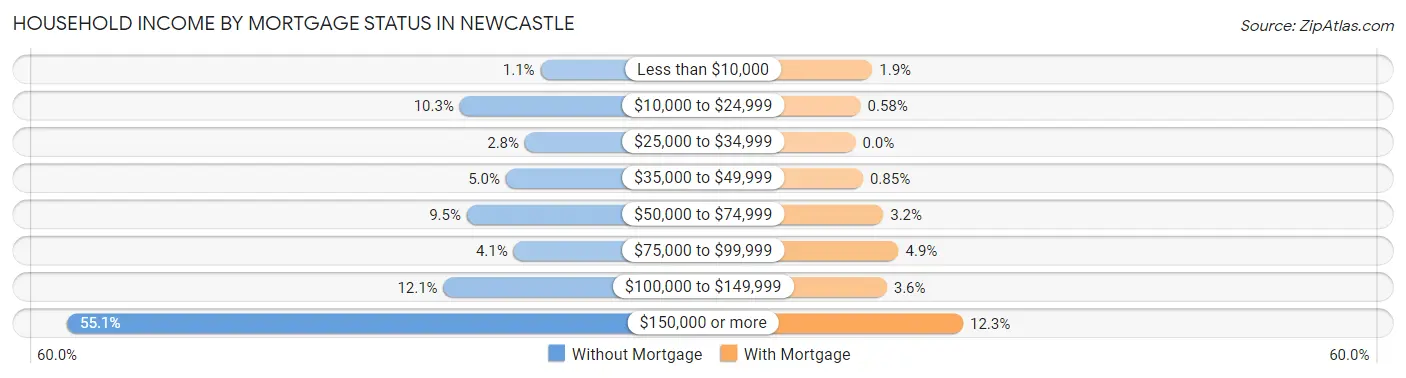
| Household Income | Without Mortgage | With Mortgage |
| Less than $10,000 | 13 (1.1%) | 43 (1.9%) |
| $10,000 to $24,999 | 127 (10.3%) | 13 (0.6%) |
| $25,000 to $34,999 | 35 (2.8%) | 0 (0.0%) |
| $35,000 to $49,999 | 62 (5.0%) | 19 (0.9%) |
| $50,000 to $74,999 | 117 (9.5%) | 71 (3.2%) |
| $75,000 to $99,999 | 51 (4.1%) | 110 (4.9%) |
| $100,000 to $149,999 | 150 (12.1%) | 80 (3.6%) |
| $150,000 or more | 682 (55.1%) | 275 (12.3%) |
| Total | 1,237 (100.0%) | 2,238 (100.0%) |
Property Value to Household Income Ratio in Newcastle
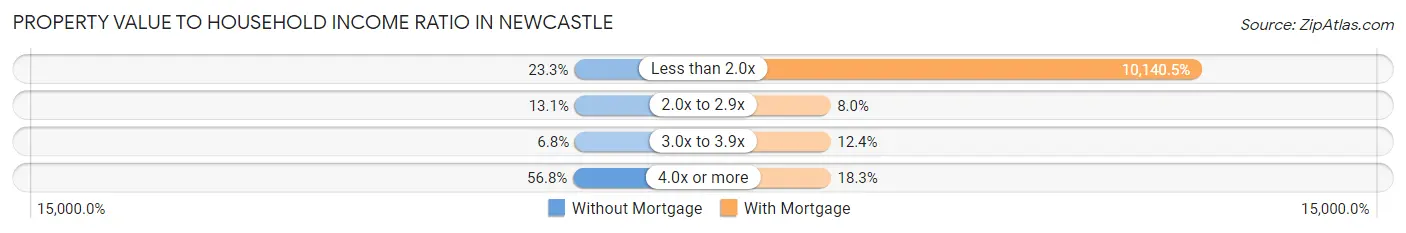
| Value-to-Income Ratio | Without Mortgage | With Mortgage |
| Less than 2.0x | 288 (23.3%) | 226,944 (10,140.5%) |
| 2.0x to 2.9x | 162 (13.1%) | 179 (8.0%) |
| 3.0x to 3.9x | 84 (6.8%) | 278 (12.4%) |
| 4.0x or more | 703 (56.8%) | 410 (18.3%) |
| Total | 1,237 (100.0%) | 2,238 (100.0%) |
Real Estate Taxes by Mortgage Status in Newcastle
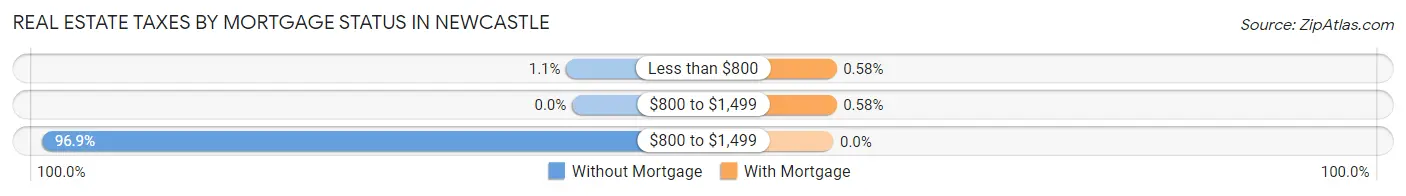
| Property Taxes | Without Mortgage | With Mortgage |
| Less than $800 | 13 (1.1%) | 13 (0.6%) |
| $800 to $1,499 | 0 (0.0%) | 13 (0.6%) |
| $800 to $1,499 | 1,198 (96.9%) | 0 (0.0%) |
| Total | 1,237 (100.0%) | 2,238 (100.0%) |
Health & Disability in Newcastle
Health Insurance Coverage by Age in Newcastle
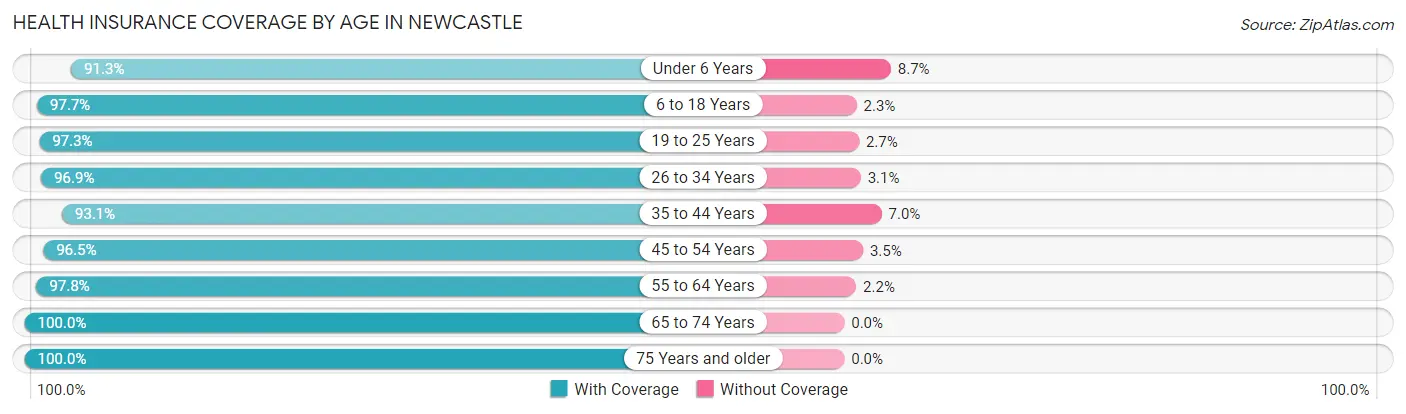
| Age Bracket | With Coverage | Without Coverage |
| Under 6 Years | 894 (91.3%) | 85 (8.7%) |
| 6 to 18 Years | 1,742 (97.7%) | 41 (2.3%) |
| 19 to 25 Years | 1,068 (97.3%) | 30 (2.7%) |
| 26 to 34 Years | 1,964 (96.9%) | 62 (3.1%) |
| 35 to 44 Years | 1,862 (93.0%) | 139 (7.0%) |
| 45 to 54 Years | 1,635 (96.5%) | 59 (3.5%) |
| 55 to 64 Years | 1,548 (97.8%) | 35 (2.2%) |
| 65 to 74 Years | 1,000 (100.0%) | 0 (0.0%) |
| 75 Years and older | 747 (100.0%) | 0 (0.0%) |
| Total | 12,460 (96.5%) | 451 (3.5%) |
Health Insurance Coverage by Citizenship Status in Newcastle
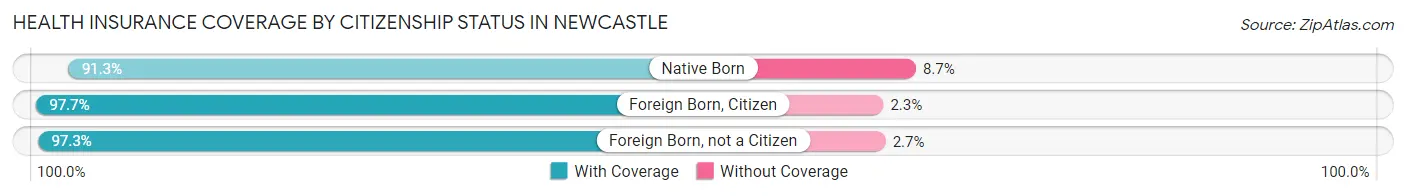
| Citizenship Status | With Coverage | Without Coverage |
| Native Born | 894 (91.3%) | 85 (8.7%) |
| Foreign Born, Citizen | 1,742 (97.7%) | 41 (2.3%) |
| Foreign Born, not a Citizen | 1,068 (97.3%) | 30 (2.7%) |
Health Insurance Coverage by Household Income in Newcastle
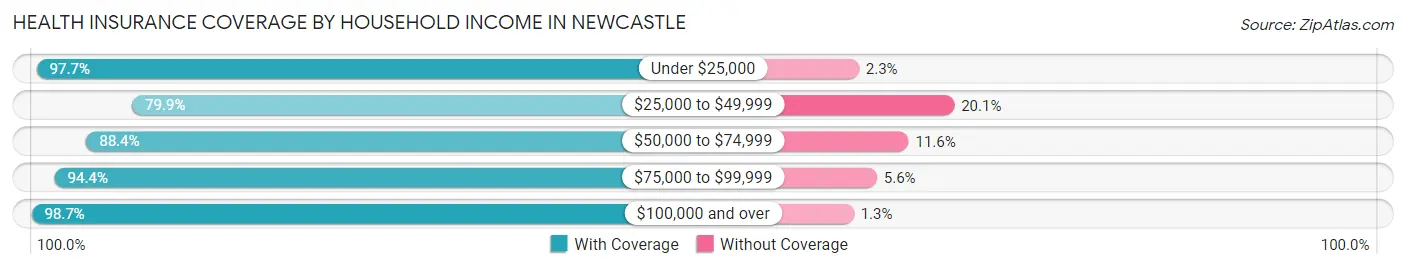
| Household Income | With Coverage | Without Coverage |
| Under $25,000 | 605 (97.7%) | 14 (2.3%) |
| $25,000 to $49,999 | 722 (79.9%) | 182 (20.1%) |
| $50,000 to $74,999 | 642 (88.4%) | 84 (11.6%) |
| $75,000 to $99,999 | 721 (94.4%) | 43 (5.6%) |
| $100,000 and over | 9,759 (98.7%) | 128 (1.3%) |
Public vs Private Health Insurance Coverage by Age in Newcastle
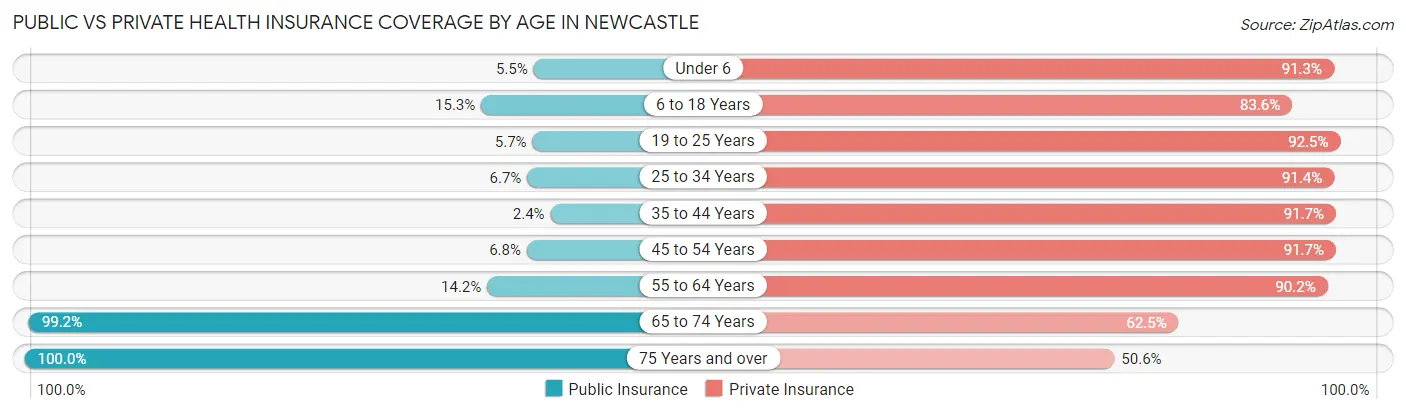
| Age Bracket | Public Insurance | Private Insurance |
| Under 6 | 54 (5.5%) | 894 (91.3%) |
| 6 to 18 Years | 272 (15.3%) | 1,490 (83.6%) |
| 19 to 25 Years | 63 (5.7%) | 1,016 (92.5%) |
| 25 to 34 Years | 136 (6.7%) | 1,851 (91.4%) |
| 35 to 44 Years | 48 (2.4%) | 1,835 (91.7%) |
| 45 to 54 Years | 115 (6.8%) | 1,553 (91.7%) |
| 55 to 64 Years | 224 (14.1%) | 1,427 (90.1%) |
| 65 to 74 Years | 992 (99.2%) | 625 (62.5%) |
| 75 Years and over | 747 (100.0%) | 378 (50.6%) |
| Total | 2,651 (20.5%) | 11,069 (85.7%) |
Disability Status by Sex by Age in Newcastle
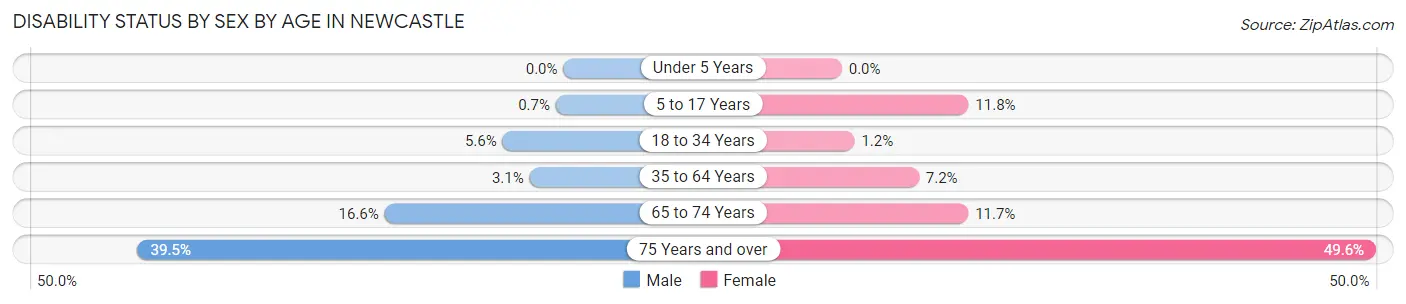
| Age Bracket | Male | Female |
| Under 5 Years | 0 (0.0%) | 0 (0.0%) |
| 5 to 17 Years | 7 (0.7%) | 94 (11.7%) |
| 18 to 34 Years | 88 (5.6%) | 19 (1.2%) |
| 35 to 64 Years | 80 (3.1%) | 195 (7.1%) |
| 65 to 74 Years | 115 (16.6%) | 36 (11.7%) |
| 75 Years and over | 64 (39.5%) | 290 (49.6%) |
Disability Class by Sex by Age in Newcastle
Disability Class: Hearing Difficulty
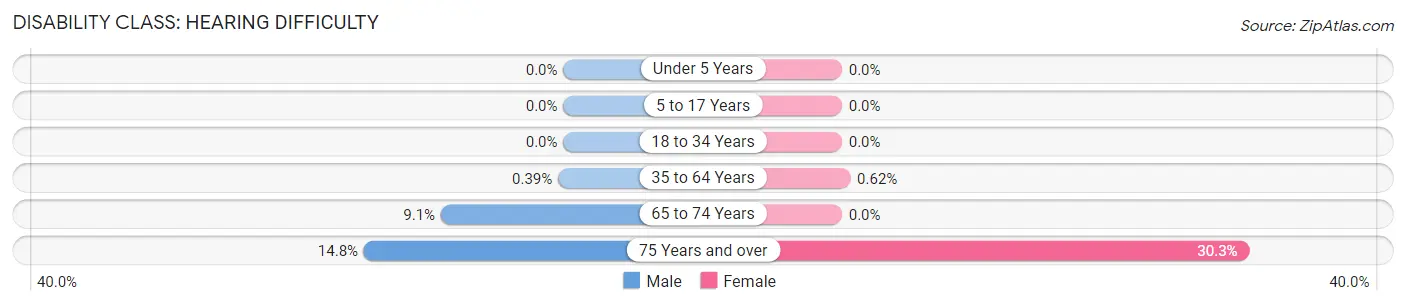
| Age Bracket | Male | Female |
| Under 5 Years | 0 (0.0%) | 0 (0.0%) |
| 5 to 17 Years | 0 (0.0%) | 0 (0.0%) |
| 18 to 34 Years | 0 (0.0%) | 0 (0.0%) |
| 35 to 64 Years | 10 (0.4%) | 17 (0.6%) |
| 65 to 74 Years | 63 (9.1%) | 0 (0.0%) |
| 75 Years and over | 24 (14.8%) | 177 (30.3%) |
Disability Class: Vision Difficulty
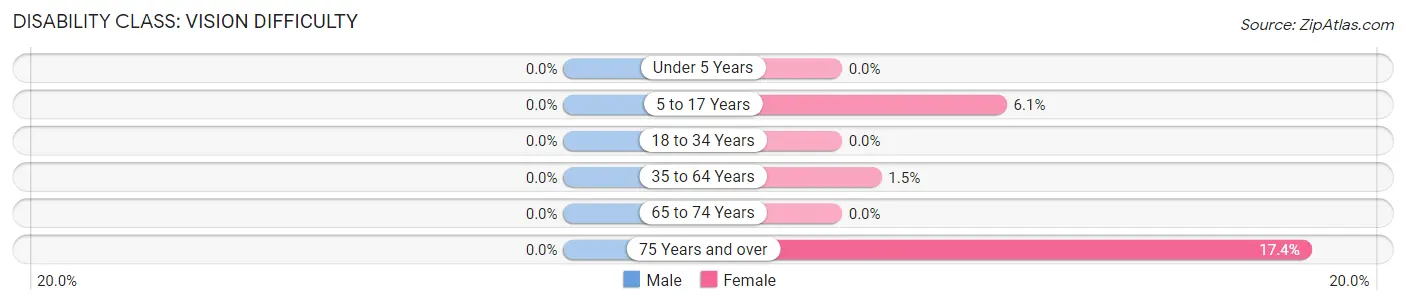
| Age Bracket | Male | Female |
| Under 5 Years | 0 (0.0%) | 0 (0.0%) |
| 5 to 17 Years | 0 (0.0%) | 49 (6.1%) |
| 18 to 34 Years | 0 (0.0%) | 0 (0.0%) |
| 35 to 64 Years | 0 (0.0%) | 40 (1.5%) |
| 65 to 74 Years | 0 (0.0%) | 0 (0.0%) |
| 75 Years and over | 0 (0.0%) | 102 (17.4%) |
Disability Class: Cognitive Difficulty
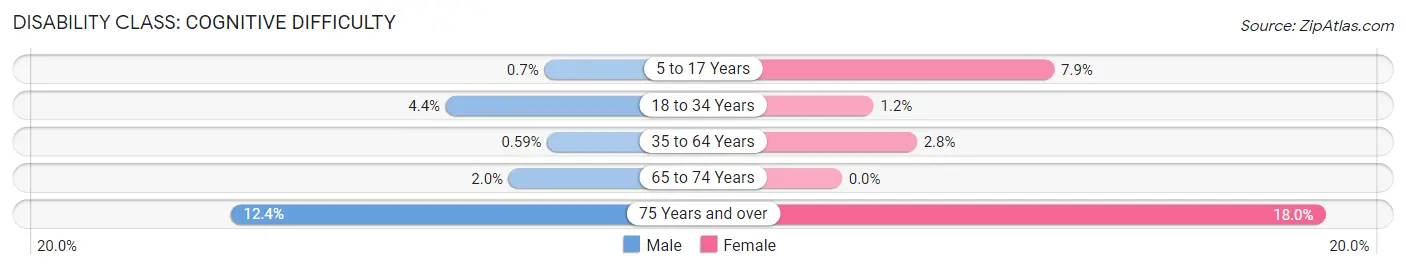
| Age Bracket | Male | Female |
| 5 to 17 Years | 7 (0.7%) | 63 (7.9%) |
| 18 to 34 Years | 68 (4.4%) | 19 (1.2%) |
| 35 to 64 Years | 15 (0.6%) | 76 (2.8%) |
| 65 to 74 Years | 14 (2.0%) | 0 (0.0%) |
| 75 Years and over | 20 (12.3%) | 105 (17.9%) |
Disability Class: Ambulatory Difficulty
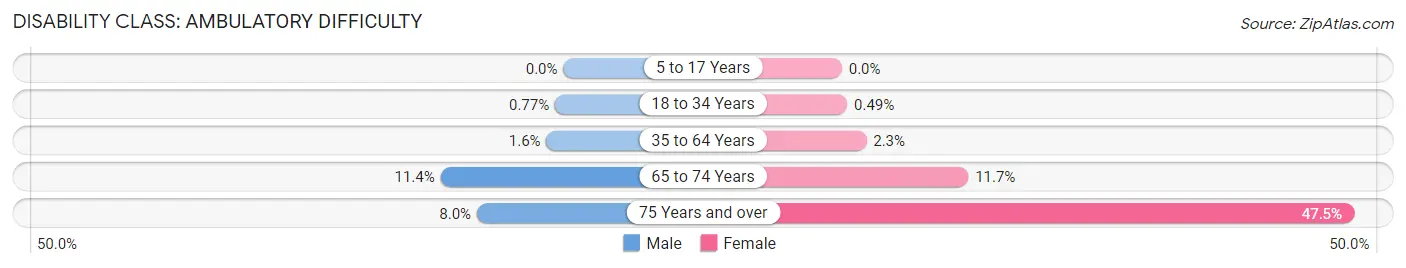
| Age Bracket | Male | Female |
| 5 to 17 Years | 0 (0.0%) | 0 (0.0%) |
| 18 to 34 Years | 12 (0.8%) | 8 (0.5%) |
| 35 to 64 Years | 40 (1.6%) | 62 (2.3%) |
| 65 to 74 Years | 79 (11.4%) | 36 (11.7%) |
| 75 Years and over | 13 (8.0%) | 278 (47.5%) |
Disability Class: Self-Care Difficulty
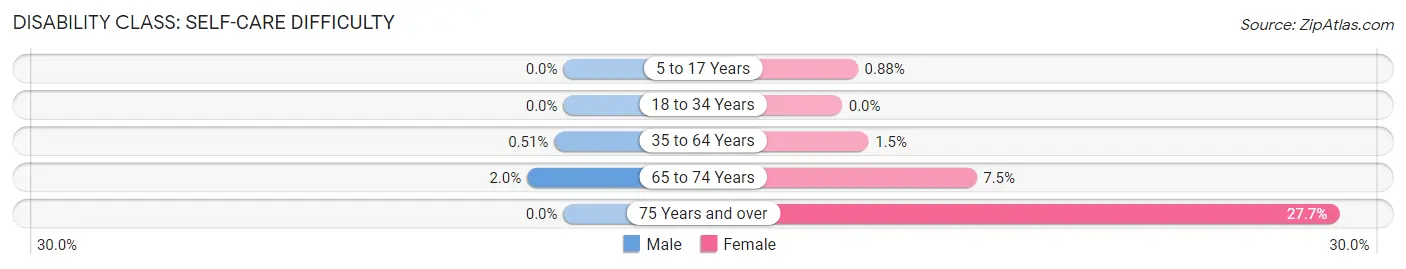
| Age Bracket | Male | Female |
| 5 to 17 Years | 0 (0.0%) | 7 (0.9%) |
| 18 to 34 Years | 0 (0.0%) | 0 (0.0%) |
| 35 to 64 Years | 13 (0.5%) | 40 (1.5%) |
| 65 to 74 Years | 14 (2.0%) | 23 (7.5%) |
| 75 Years and over | 0 (0.0%) | 162 (27.7%) |
Technology Access in Newcastle
Computing Device Access in Newcastle
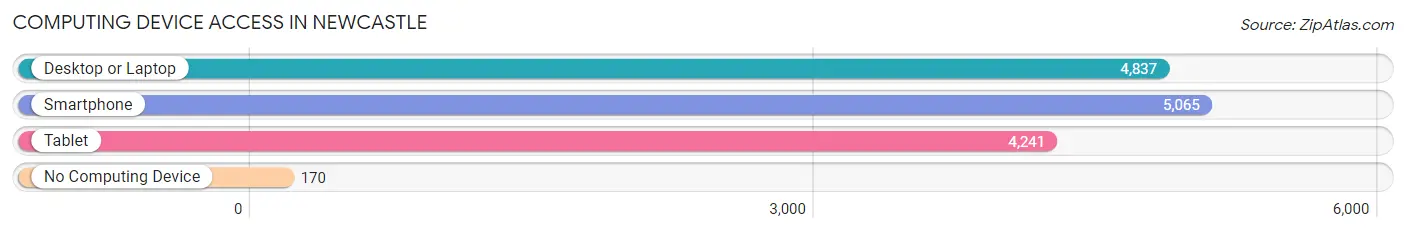
| Device Type | # Households | % Households |
| Desktop or Laptop | 4,837 | 90.6% |
| Smartphone | 5,065 | 94.9% |
| Tablet | 4,241 | 79.4% |
| No Computing Device | 170 | 3.2% |
| Total | 5,338 | 100.0% |
Internet Access in Newcastle
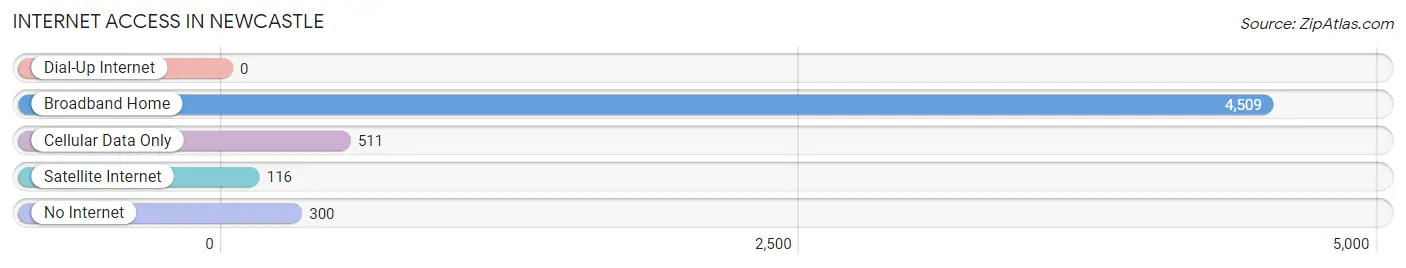
| Internet Type | # Households | % Households |
| Dial-Up Internet | 0 | 0.0% |
| Broadband Home | 4,509 | 84.5% |
| Cellular Data Only | 511 | 9.6% |
| Satellite Internet | 116 | 2.2% |
| No Internet | 300 | 5.6% |
| Total | 5,338 | 100.0% |
Newcastle Summary
Newcastle is a city located in King County, Washington, United States. It is situated on the east side of Lake Washington, about 20 miles east of Seattle. The population was 10,380 at the 2010 census. Newcastle is bordered by the cities of Bellevue and Renton.
History
The area now known as Newcastle was originally inhabited by the Duwamish and Snoqualmie Native American tribes. The first European settlers arrived in the area in the late 1800s, and the area was officially incorporated as a city in 1994.
The city was named after Newcastle-upon-Tyne in England, and was originally a coal mining town. The coal mines were closed in the 1960s, and the city has since become a residential suburb of Seattle.
Geography
Newcastle is located at 47°30'N 122°10'W (47.500, -122.167). According to the United States Census Bureau, the city has a total area of 4.7 square miles, of which 4.6 square miles is land and 0.1 square miles is water.
The city is located on the east side of Lake Washington, and is bordered by the cities of Bellevue and Renton. The city is situated in the foothills of the Cascade Mountains, and is surrounded by forests and parks.
Economy
The economy of Newcastle is largely based on the service industry. The city is home to several large companies, including Microsoft, Boeing, and Nintendo of America. The city also has a thriving retail sector, with several shopping centers and malls.
Demographics
As of the 2010 census, there were 10,380 people, 4,093 households, and 2,845 families residing in the city. The population density was 2,231.2 people per square mile. The racial makeup of the city was 73.2% White, 8.2% Asian, 6.3% African American, 0.5% Native American, 0.1% Pacific Islander, and 11.7% from other races. Hispanic or Latino of any race were 8.7% of the population.
The median income for a household in the city was $87,945, and the median income for a family was $102,945. The per capita income for the city was $45,945. About 4.2% of families and 5.7% of the population were below the poverty line, including 6.3% of those under age 18 and 4.2% of those age 65 or over.
Conclusion
Newcastle is a city located in King County, Washington, United States. It is situated on the east side of Lake Washington, about 20 miles east of Seattle. The city was originally a coal mining town, but has since become a residential suburb of Seattle. The economy of Newcastle is largely based on the service industry, and the city is home to several large companies. The population of the city was 10,380 at the 2010 census, and the median income for a household was $87,945. Newcastle is surrounded by forests and parks, and is a popular destination for outdoor recreation.
Common Questions
What is Per Capita Income in Newcastle?
Per Capita income in Newcastle is $87,898.
What is the Median Family Income in Newcastle?
Median Family Income in Newcastle is $200,962.
What is the Median Household income in Newcastle?
Median Household Income in Newcastle is $151,007.
What is Income or Wage Gap in Newcastle?
Income or Wage Gap in Newcastle is 47.7%.
Women in Newcastle earn 52.3 cents for every dollar earned by a man.
What is Inequality or Gini Index in Newcastle?
Inequality or Gini Index in Newcastle is 0.51.
What is the Total Population of Newcastle?
Total Population of Newcastle is 12,931.
What is the Total Male Population of Newcastle?
Total Male Population of Newcastle is 6,468.
What is the Total Female Population of Newcastle?
Total Female Population of Newcastle is 6,463.
What is the Ratio of Males per 100 Females in Newcastle?
There are 100.08 Males per 100 Females in Newcastle.
What is the Ratio of Females per 100 Males in Newcastle?
There are 99.92 Females per 100 Males in Newcastle.
What is the Median Population Age in Newcastle?
Median Population Age in Newcastle is 37.3 Years.
What is the Average Family Size in Newcastle
Average Family Size in Newcastle is 2.8 People.
What is the Average Household Size in Newcastle
Average Household Size in Newcastle is 2.4 People.
How Large is the Labor Force in Newcastle?
There are 6,977 People in the Labor Forcein in Newcastle.
What is the Percentage of People in the Labor Force in Newcastle?
65.7% of People are in the Labor Force in Newcastle.
What is the Unemployment Rate in Newcastle?
Unemployment Rate in Newcastle is 4.9%.