May Creek, WA Map & Demographics
May Creek Map
May Creek Overview
$31,803
PER CAPITA INCOME
$66,375
AVG FAMILY INCOME
$60,375
AVG HOUSEHOLD INCOME
0.37
INEQUALITY / GINI INDEX
873
TOTAL POPULATION
355
MALE POPULATION
518
FEMALE POPULATION
68.53
MALES / 100 FEMALES
145.92
FEMALES / 100 MALES
50.5
MEDIAN AGE
3.1
AVG FAMILY SIZE
2.4
AVG HOUSEHOLD SIZE
496
LABOR FORCE [ PEOPLE ]
60.8%
PERCENT IN LABOR FORCE
7.1%
UNEMPLOYMENT RATE
Income in May Creek
Income Overview in May Creek
Per Capita Income in May Creek is $31,803, while median incomes of families and households are $66,375 and $60,375 respectively.
| Characteristic | Number | Measure |
| Per Capita Income | 873 | $31,803 |
| Median Family Income | 205 | $66,375 |
| Mean Family Income | 205 | $77,447 |
| Median Household Income | 364 | $60,375 |
| Mean Household Income | 364 | $71,915 |
| Income Deficit | 205 | $0 |
| Wage / Income Gap (%) | 873 | 0.00% |
| Wage / Income Gap ($) | 873 | 100.00¢ per $1 |
| Gini / Inequality Index | 873 | 0.37 |
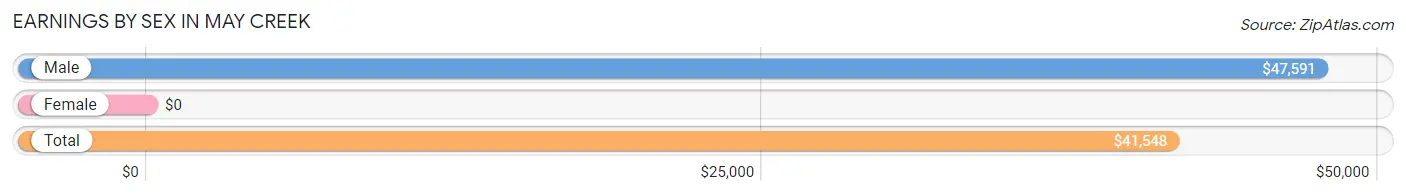
Earnings by Sex in May Creek
| Sex | Number | Average Earnings |
| Male | 271 (53.1%) | $47,591 |
| Female | 239 (46.9%) | $0 |
| Total | 510 (100.0%) | $41,548 |
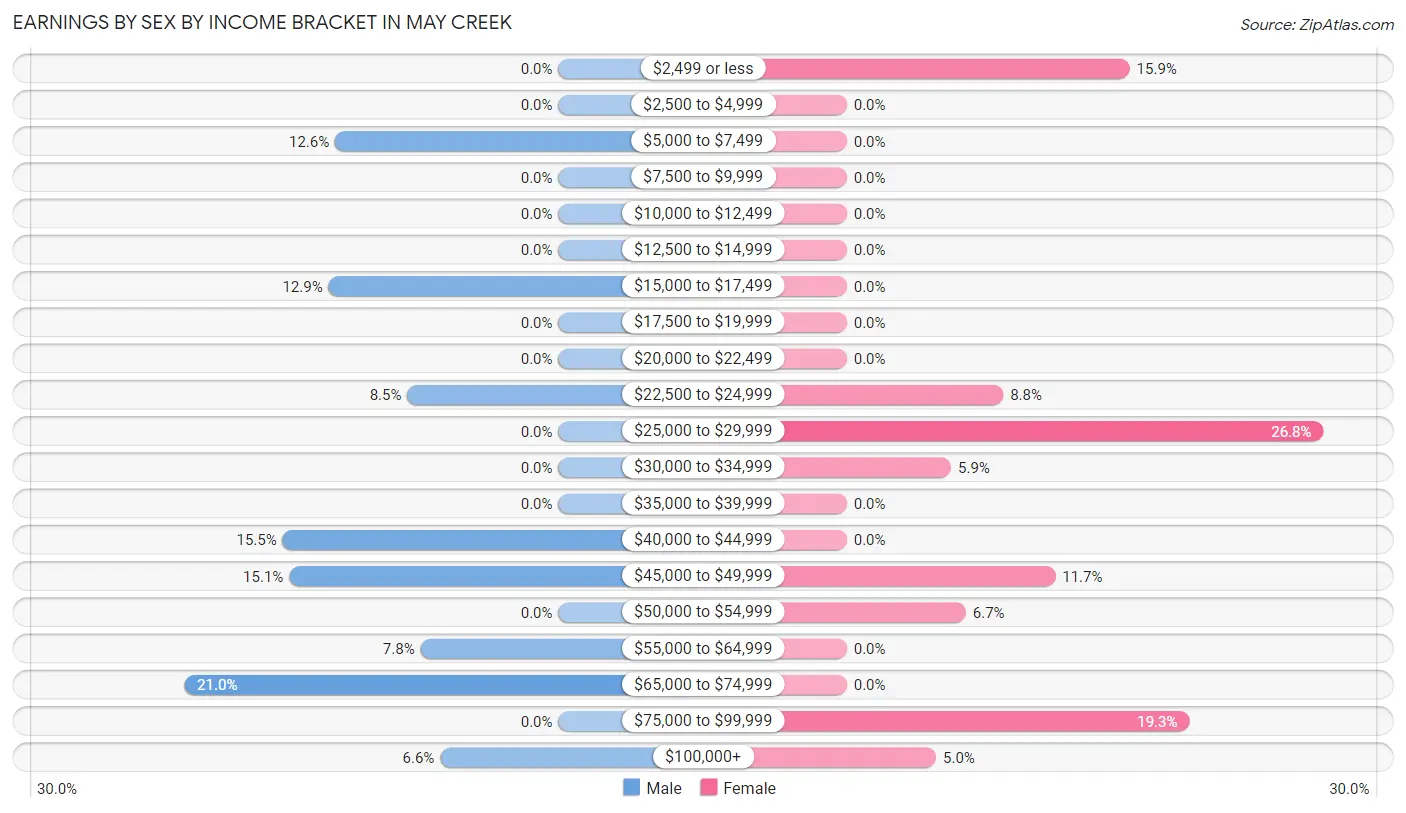
Earnings by Sex by Income Bracket in May Creek
The most common earnings brackets in May Creek are $65,000 to $74,999 for men (57 | 21.0%) and $25,000 to $29,999 for women (64 | 26.8%).
| Income | Male | Female |
| $2,499 or less | 0 (0.0%) | 38 (15.9%) |
| $2,500 to $4,999 | 0 (0.0%) | 0 (0.0%) |
| $5,000 to $7,499 | 34 (12.6%) | 0 (0.0%) |
| $7,500 to $9,999 | 0 (0.0%) | 0 (0.0%) |
| $10,000 to $12,499 | 0 (0.0%) | 0 (0.0%) |
| $12,500 to $14,999 | 0 (0.0%) | 0 (0.0%) |
| $15,000 to $17,499 | 35 (12.9%) | 0 (0.0%) |
| $17,500 to $19,999 | 0 (0.0%) | 0 (0.0%) |
| $20,000 to $22,499 | 0 (0.0%) | 0 (0.0%) |
| $22,500 to $24,999 | 23 (8.5%) | 21 (8.8%) |
| $25,000 to $29,999 | 0 (0.0%) | 64 (26.8%) |
| $30,000 to $34,999 | 0 (0.0%) | 14 (5.9%) |
| $35,000 to $39,999 | 0 (0.0%) | 0 (0.0%) |
| $40,000 to $44,999 | 42 (15.5%) | 0 (0.0%) |
| $45,000 to $49,999 | 41 (15.1%) | 28 (11.7%) |
| $50,000 to $54,999 | 0 (0.0%) | 16 (6.7%) |
| $55,000 to $64,999 | 21 (7.7%) | 0 (0.0%) |
| $65,000 to $74,999 | 57 (21.0%) | 0 (0.0%) |
| $75,000 to $99,999 | 0 (0.0%) | 46 (19.3%) |
| $100,000+ | 18 (6.6%) | 12 (5.0%) |
| Total | 271 (100.0%) | 239 (100.0%) |
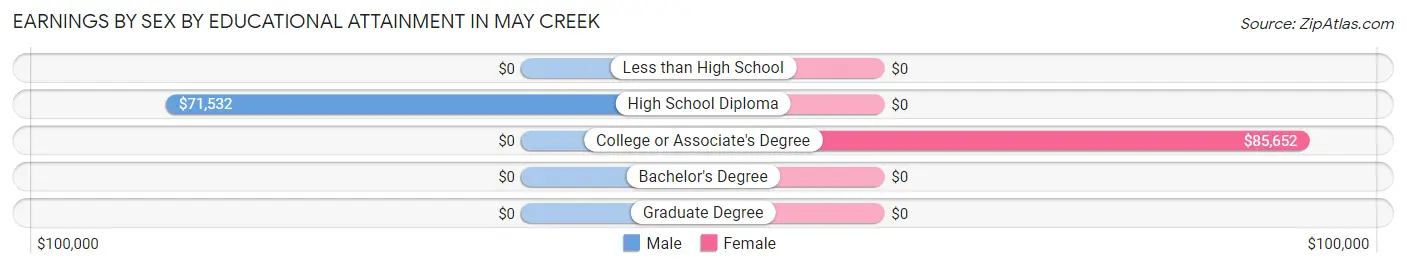
Earnings by Sex by Educational Attainment in May Creek
| Educational Attainment | Male Income | Female Income |
| Less than High School | - | - |
| High School Diploma | $71,532 | $0 |
| College or Associate's Degree | - | - |
| Bachelor's Degree | - | - |
| Graduate Degree | - | - |
| Total | $48,628 | $0 |
Family Income in May Creek
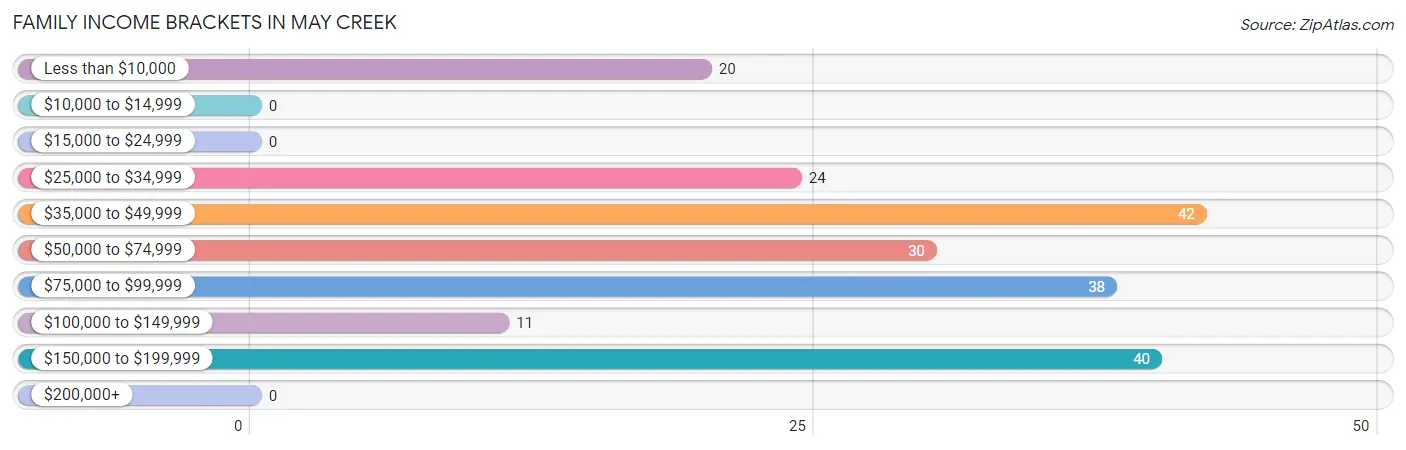
Family Income Brackets in May Creek
According to the May Creek family income data, there are 42 families falling into the $35,000 to $49,999 income range, which is the most common income bracket and makes up 20.5% of all families.
| Income Bracket | # Families | % Families |
| Less than $10,000 | 20 | 9.8% |
| $10,000 to $14,999 | 0 | 0.0% |
| $15,000 to $24,999 | 0 | 0.0% |
| $25,000 to $34,999 | 24 | 11.7% |
| $35,000 to $49,999 | 42 | 20.5% |
| $50,000 to $74,999 | 30 | 14.6% |
| $75,000 to $99,999 | 38 | 18.5% |
| $100,000 to $149,999 | 11 | 5.4% |
| $150,000 to $199,999 | 40 | 19.5% |
| $200,000+ | 0 | 0.0% |
Family Income by Famaliy Size in May Creek
| Income Bracket | # Families | Median Income |
| 2-Person Families | 112 (54.6%) | $0 |
| 3-Person Families | 0 (0.0%) | $0 |
| 4-Person Families | 73 (35.6%) | $0 |
| 5-Person Families | 20 (9.8%) | $0 |
| 6-Person Families | 0 (0.0%) | $0 |
| 7+ Person Families | 0 (0.0%) | $0 |
| Total | 205 (100.0%) | $66,375 |
Family Income by Number of Earners in May Creek
| Number of Earners | # Families | Median Income |
| No Earners | 24 (11.7%) | $0 |
| 1 Earner | 108 (52.7%) | $0 |
| 2 Earners | 44 (21.5%) | $0 |
| 3+ Earners | 29 (14.1%) | $0 |
| Total | 205 (100.0%) | $66,375 |
Household Income in May Creek
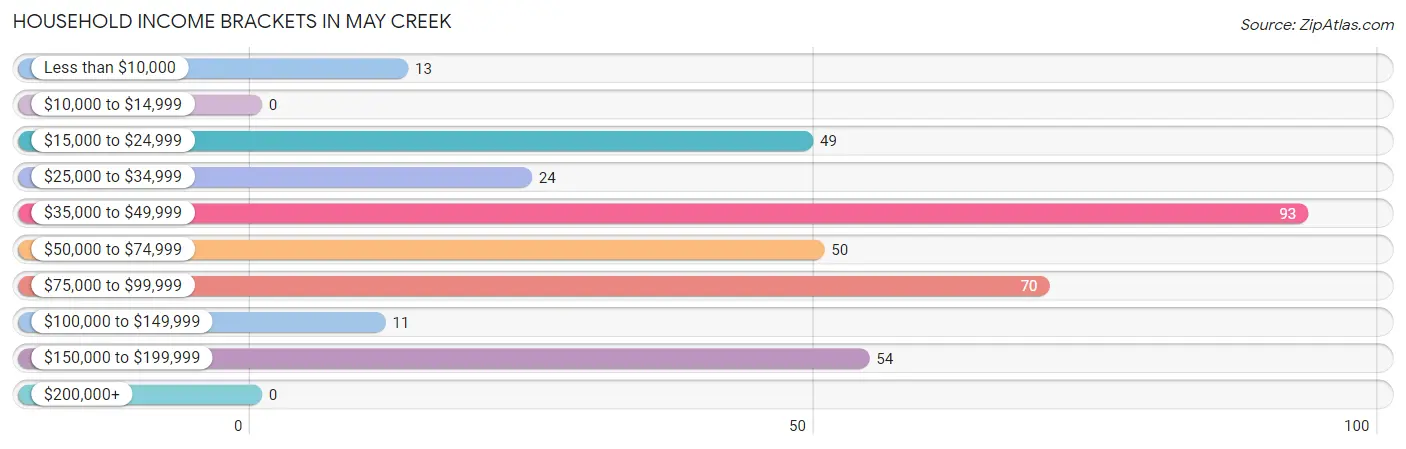
Household Income Brackets in May Creek
With 93 households falling in the category, the $35,000 to $49,999 income range is the most frequent in May Creek, accounting for 25.6% of all households.
| Income Bracket | # Households | % Households |
| Less than $10,000 | 13 | 3.6% |
| $10,000 to $14,999 | 0 | 0.0% |
| $15,000 to $24,999 | 49 | 13.5% |
| $25,000 to $34,999 | 24 | 6.6% |
| $35,000 to $49,999 | 93 | 25.5% |
| $50,000 to $74,999 | 50 | 13.7% |
| $75,000 to $99,999 | 70 | 19.2% |
| $100,000 to $149,999 | 11 | 3.0% |
| $150,000 to $199,999 | 54 | 14.8% |
| $200,000+ | 0 | 0.0% |
Household Income by Householder Age in May Creek
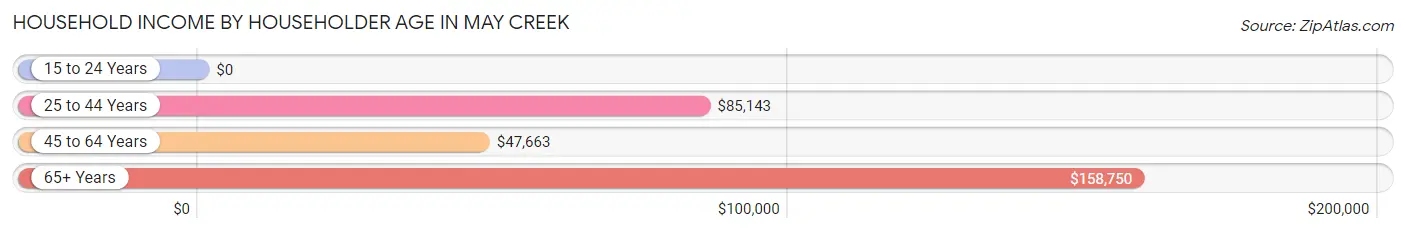
The median household income in May Creek is $60,375, with the highest median household income of $158,750 found in the 65+ years age bracket for the primary householder. A total of 39 households (10.7%) fall into this category. Meanwhile, the 15 to 24 years age bracket for the primary householder has the lowest median household income of $0, with 28 households (7.7%) in this group.
| Income Bracket | # Households | Median Income |
| 15 to 24 Years | 28 (7.7%) | $0 |
| 25 to 44 Years | 66 (18.1%) | $85,143 |
| 45 to 64 Years | 231 (63.5%) | $47,663 |
| 65+ Years | 39 (10.7%) | $158,750 |
| Total | 364 (100.0%) | $60,375 |
Poverty in May Creek
Income Below Poverty by Sex and Age in May Creek
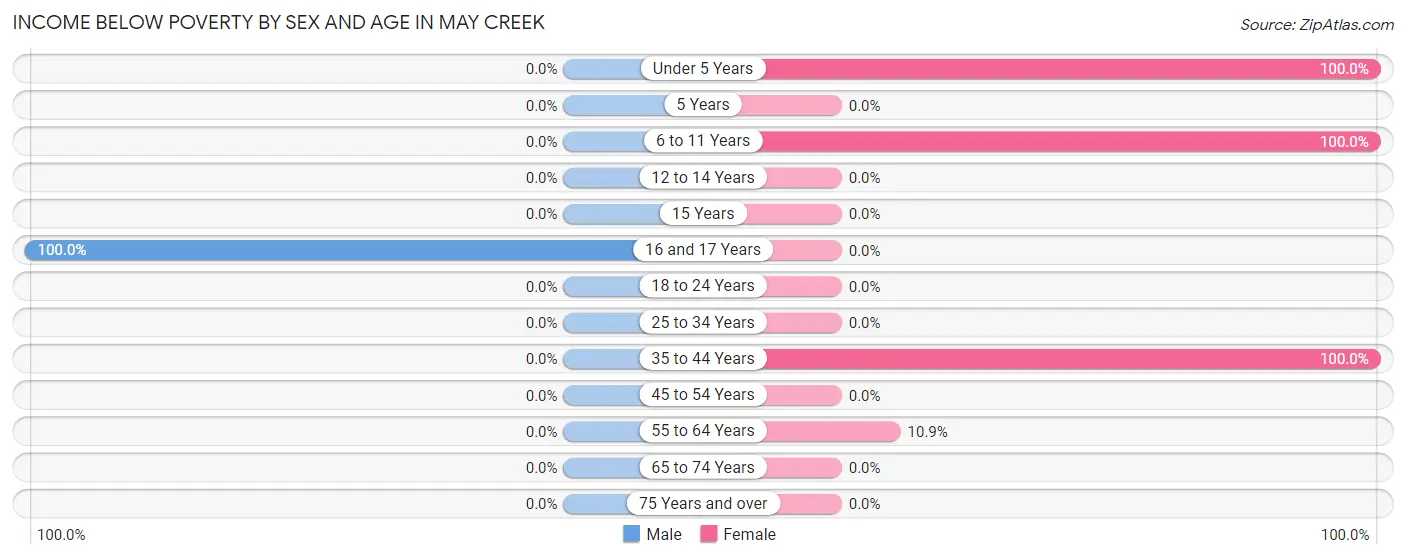
With 5.9% poverty level for males and 17.4% for females among the residents of May Creek, 16 and 17 year old males and under 5 year old females are the most vulnerable to poverty, with 21 males (100.0%) and 37 females (100.0%) in their respective age groups living below the poverty level.
| Age Bracket | Male | Female |
| Under 5 Years | 0 (0.0%) | 37 (100.0%) |
| 5 Years | 0 (0.0%) | 0 (0.0%) |
| 6 to 11 Years | 0 (0.0%) | 20 (100.0%) |
| 12 to 14 Years | 0 (0.0%) | 0 (0.0%) |
| 15 Years | 0 (0.0%) | 0 (0.0%) |
| 16 and 17 Years | 21 (100.0%) | 0 (0.0%) |
| 18 to 24 Years | 0 (0.0%) | 0 (0.0%) |
| 25 to 34 Years | 0 (0.0%) | 0 (0.0%) |
| 35 to 44 Years | 0 (0.0%) | 20 (100.0%) |
| 45 to 54 Years | 0 (0.0%) | 0 (0.0%) |
| 55 to 64 Years | 0 (0.0%) | 13 (10.9%) |
| 65 to 74 Years | 0 (0.0%) | 0 (0.0%) |
| 75 Years and over | 0 (0.0%) | 0 (0.0%) |
| Total | 21 (5.9%) | 90 (17.4%) |
Income Above Poverty by Sex and Age in May Creek
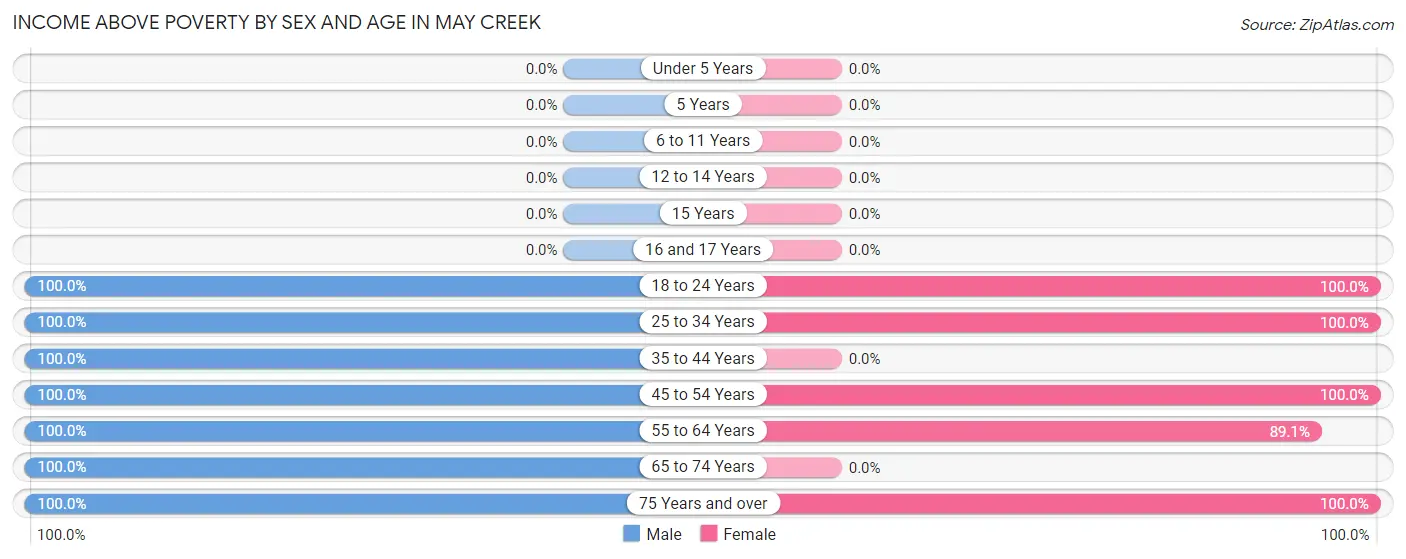
According to the poverty statistics in May Creek, males aged 18 to 24 years and females aged 18 to 24 years are the age groups that are most secure financially, with 100.0% of males and 100.0% of females in these age groups living above the poverty line.
| Age Bracket | Male | Female |
| Under 5 Years | 0 (0.0%) | 0 (0.0%) |
| 5 Years | 0 (0.0%) | 0 (0.0%) |
| 6 to 11 Years | 0 (0.0%) | 0 (0.0%) |
| 12 to 14 Years | 0 (0.0%) | 0 (0.0%) |
| 15 Years | 0 (0.0%) | 0 (0.0%) |
| 16 and 17 Years | 0 (0.0%) | 0 (0.0%) |
| 18 to 24 Years | 34 (100.0%) | 63 (100.0%) |
| 25 to 34 Years | 56 (100.0%) | 100 (100.0%) |
| 35 to 44 Years | 11 (100.0%) | 0 (0.0%) |
| 45 to 54 Years | 121 (100.0%) | 134 (100.0%) |
| 55 to 64 Years | 73 (100.0%) | 106 (89.1%) |
| 65 to 74 Years | 25 (100.0%) | 0 (0.0%) |
| 75 Years and over | 14 (100.0%) | 25 (100.0%) |
| Total | 334 (94.1%) | 428 (82.6%) |
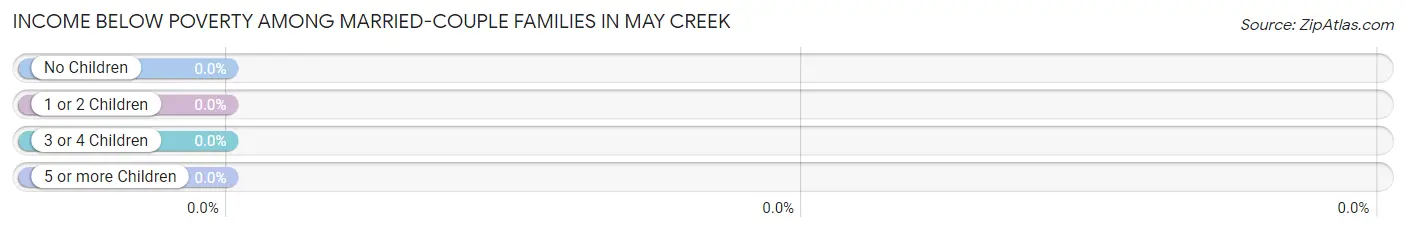
Income Below Poverty Among Married-Couple Families in May Creek
| Children | Above Poverty | Below Poverty |
| No Children | 174 (100.0%) | 0 (0.0%) |
| 1 or 2 Children | 0 (0.0%) | 0 (0.0%) |
| 3 or 4 Children | 0 (0.0%) | 0 (0.0%) |
| 5 or more Children | 0 (0.0%) | 0 (0.0%) |
| Total | 174 (100.0%) | 0 (0.0%) |
Income Below Poverty Among Single-Parent Households in May Creek
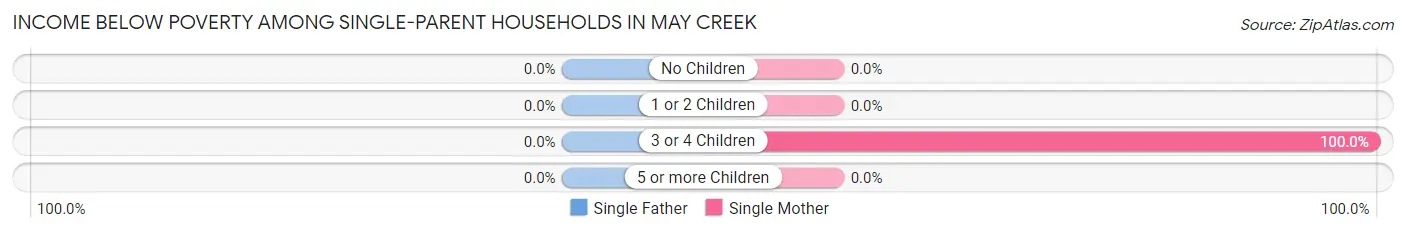
| Children | Single Father | Single Mother |
| No Children | 0 (0.0%) | 0 (0.0%) |
| 1 or 2 Children | 0 (0.0%) | 0 (0.0%) |
| 3 or 4 Children | 0 (0.0%) | 20 (100.0%) |
| 5 or more Children | 0 (0.0%) | 0 (0.0%) |
| Total | 0 (0.0%) | 20 (64.5%) |
Income Below Poverty Among Married-Couple vs Single-Parent Households in May Creek
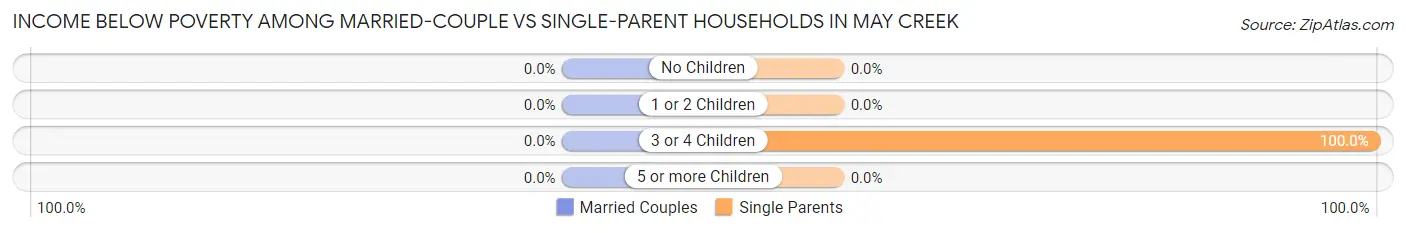
| Children | Married-Couple Families | Single-Parent Households |
| No Children | 0 (0.0%) | 0 (0.0%) |
| 1 or 2 Children | 0 (0.0%) | 0 (0.0%) |
| 3 or 4 Children | 0 (0.0%) | 20 (100.0%) |
| 5 or more Children | 0 (0.0%) | 0 (0.0%) |
| Total | 0 (0.0%) | 20 (64.5%) |
Race in May Creek
The most populous races in May Creek are White / Caucasian (812 | 93.0%), Hispanic or Latino (45 | 5.1%), and Asian (29 | 3.3%).
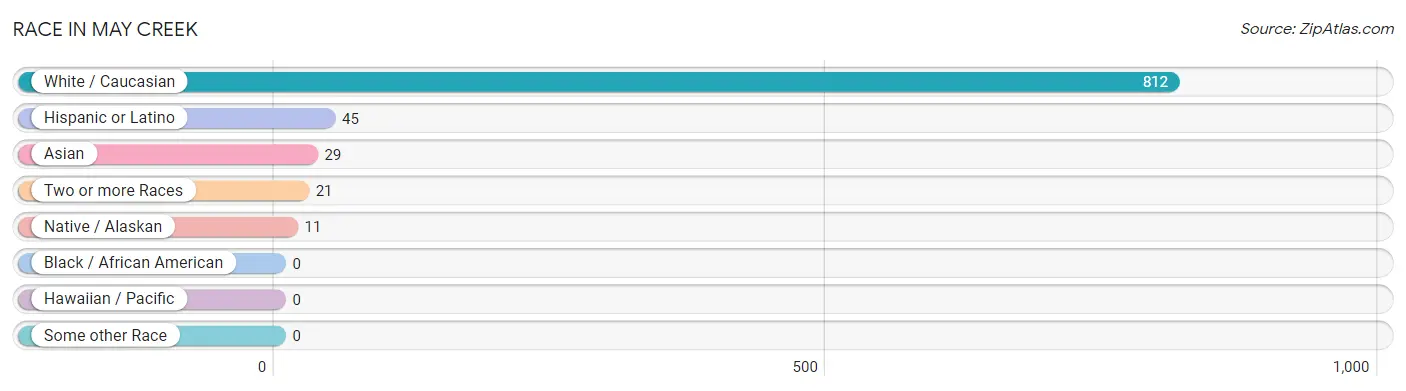
| Race | # Population | % Population |
| Asian | 29 | 3.3% |
| Black / African American | 0 | 0.0% |
| Hawaiian / Pacific | 0 | 0.0% |
| Hispanic or Latino | 45 | 5.1% |
| Native / Alaskan | 11 | 1.3% |
| White / Caucasian | 812 | 93.0% |
| Two or more Races | 21 | 2.4% |
| Some other Race | 0 | 0.0% |
| Total | 873 | 100.0% |
Ancestry in May Creek
The most populous ancestries reported in May Creek are German (276 | 31.6%), American (157 | 18.0%), Irish (119 | 13.6%), Italian (78 | 8.9%), and European (60 | 6.9%), together accounting for 79.0% of all May Creek residents.
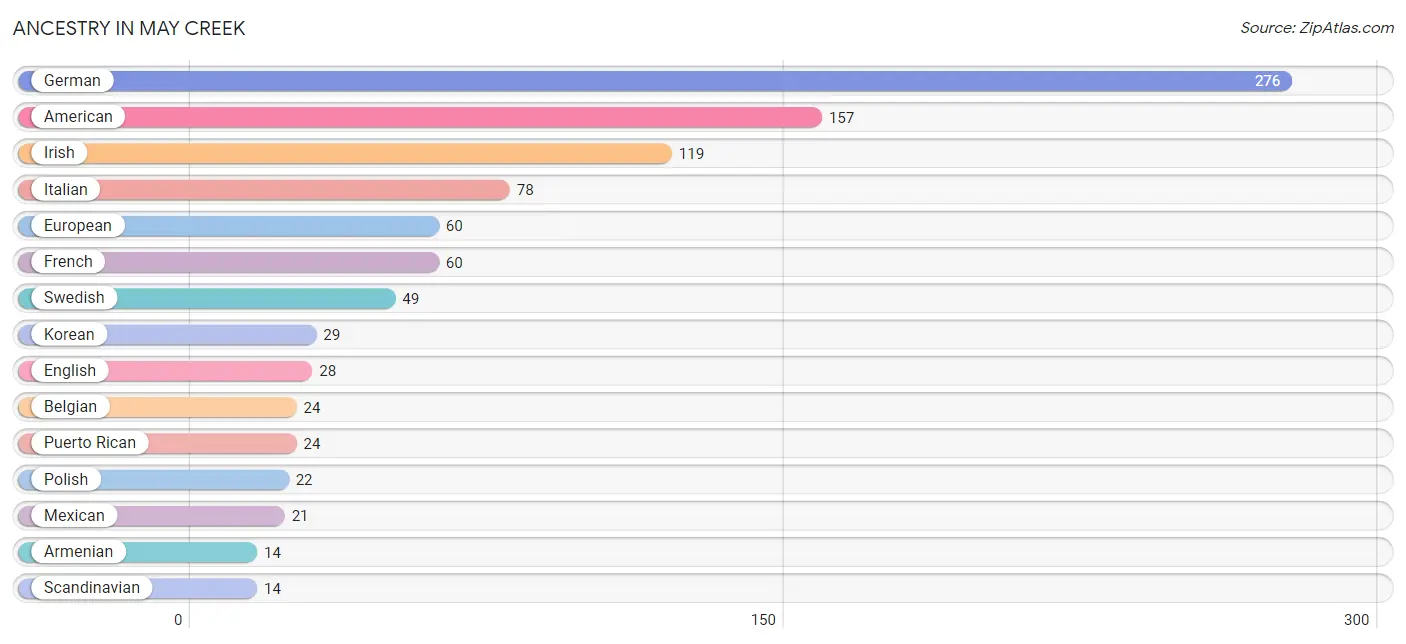
| Ancestry | # Population | % Population |
| Aleut | 11 | 1.3% |
| American | 157 | 18.0% |
| Armenian | 14 | 1.6% |
| Belgian | 24 | 2.8% |
| English | 28 | 3.2% |
| European | 60 | 6.9% |
| French | 60 | 6.9% |
| German | 276 | 31.6% |
| Irish | 119 | 13.6% |
| Italian | 78 | 8.9% |
| Korean | 29 | 3.3% |
| Mexican | 21 | 2.4% |
| Polish | 22 | 2.5% |
| Puerto Rican | 24 | 2.8% |
| Scandinavian | 14 | 1.6% |
| Swedish | 49 | 5.6% | View All 16 Rows |
Immigrants in May Creek
The most numerous immigrant groups reported in May Creek came from Asia (29 | 3.3%), Philippines (29 | 3.3%), South Eastern Asia (29 | 3.3%), Europe (22 | 2.5%), and Western Europe (22 | 2.5%), together accounting for 15.0% of all May Creek residents.
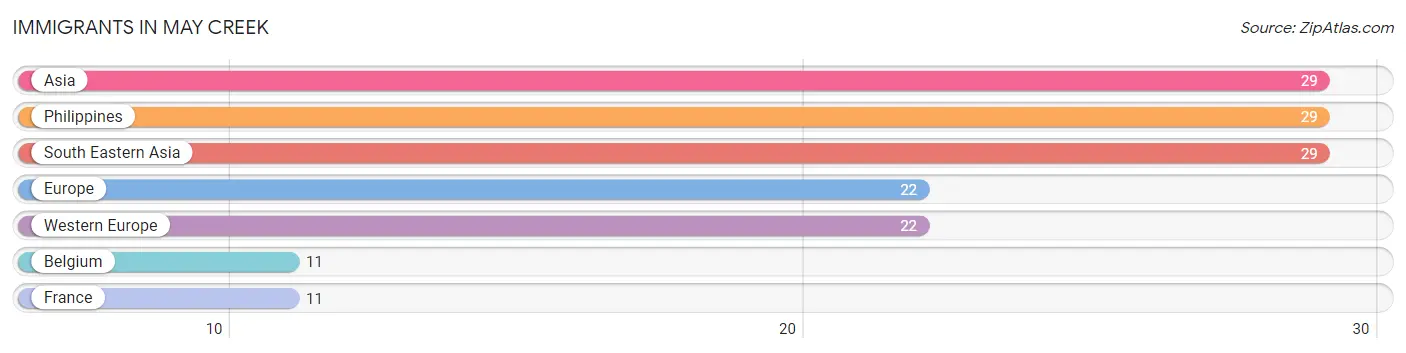
| Immigration Origin | # Population | % Population |
| Asia | 29 | 3.3% |
| Belgium | 11 | 1.3% |
| Europe | 22 | 2.5% |
| France | 11 | 1.3% |
| Philippines | 29 | 3.3% |
| South Eastern Asia | 29 | 3.3% |
| Western Europe | 22 | 2.5% | View All 7 Rows |
Sex and Age in May Creek
Sex and Age in May Creek
The most populous age groups in May Creek are 50 to 54 Years (121 | 34.1%) for men and 50 to 54 Years (95 | 18.3%) for women.
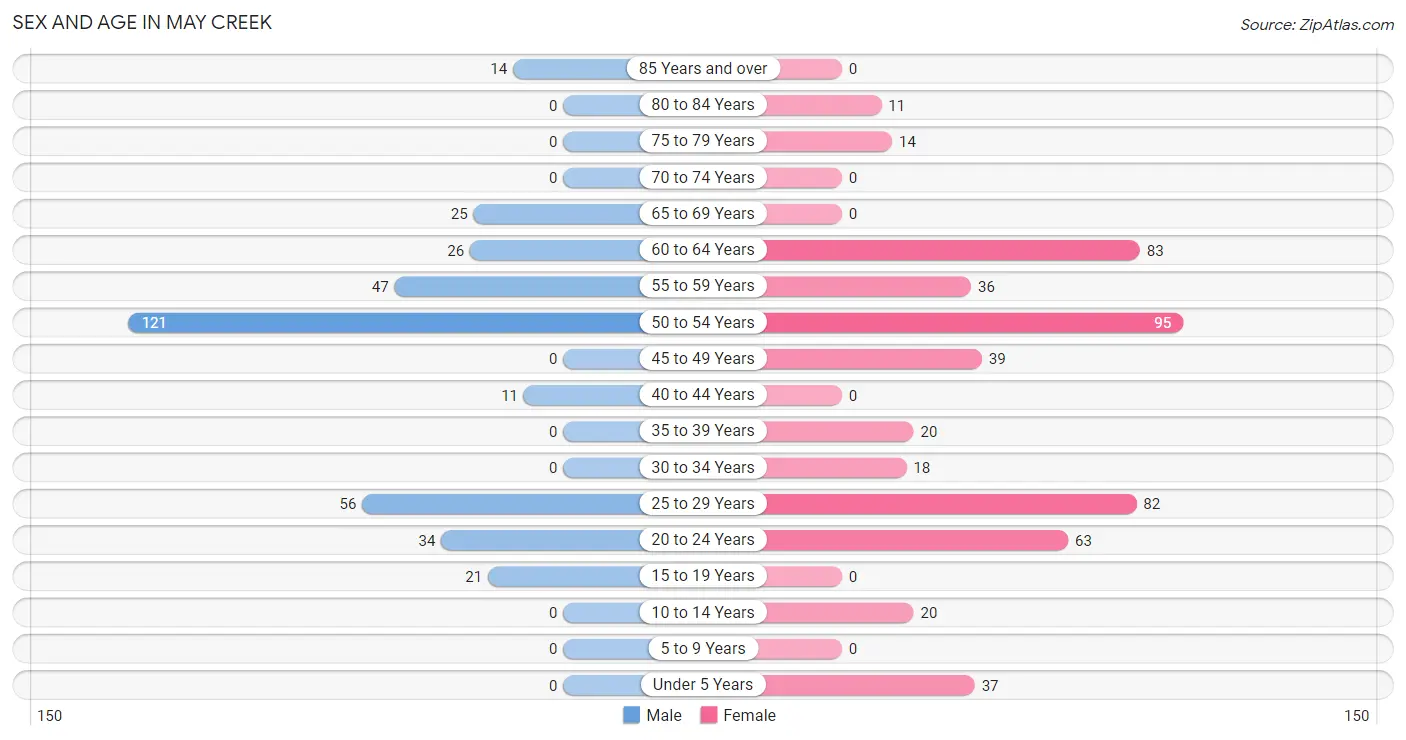
| Age Bracket | Male | Female |
| Under 5 Years | 0 (0.0%) | 37 (7.1%) |
| 5 to 9 Years | 0 (0.0%) | 0 (0.0%) |
| 10 to 14 Years | 0 (0.0%) | 20 (3.9%) |
| 15 to 19 Years | 21 (5.9%) | 0 (0.0%) |
| 20 to 24 Years | 34 (9.6%) | 63 (12.2%) |
| 25 to 29 Years | 56 (15.8%) | 82 (15.8%) |
| 30 to 34 Years | 0 (0.0%) | 18 (3.5%) |
| 35 to 39 Years | 0 (0.0%) | 20 (3.9%) |
| 40 to 44 Years | 11 (3.1%) | 0 (0.0%) |
| 45 to 49 Years | 0 (0.0%) | 39 (7.5%) |
| 50 to 54 Years | 121 (34.1%) | 95 (18.3%) |
| 55 to 59 Years | 47 (13.2%) | 36 (7.0%) |
| 60 to 64 Years | 26 (7.3%) | 83 (16.0%) |
| 65 to 69 Years | 25 (7.0%) | 0 (0.0%) |
| 70 to 74 Years | 0 (0.0%) | 0 (0.0%) |
| 75 to 79 Years | 0 (0.0%) | 14 (2.7%) |
| 80 to 84 Years | 0 (0.0%) | 11 (2.1%) |
| 85 Years and over | 14 (3.9%) | 0 (0.0%) |
| Total | 355 (100.0%) | 518 (100.0%) |
Families and Households in May Creek
Median Family Size in May Creek
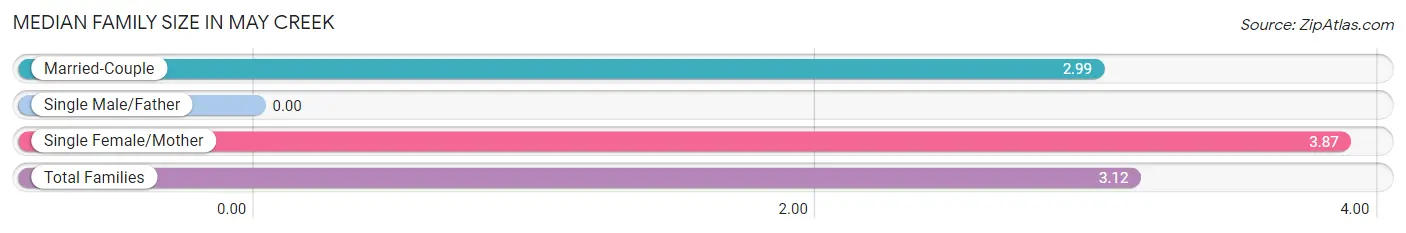
| Family Type | # Families | Family Size |
| Married-Couple | 174 (84.9%) | 2.99 |
| Single Male/Father | 0 (0.0%) | - |
| Single Female/Mother | 31 (15.1%) | 3.87 |
| Total Families | 205 (100.0%) | 3.12 |
Median Household Size in May Creek
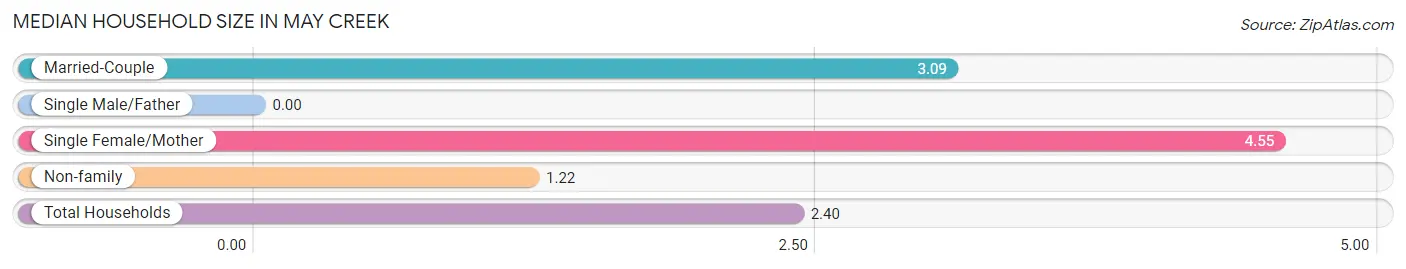
| Household Type | # Households | Household Size |
| Married-Couple | 174 (47.8%) | 3.09 |
| Single Male/Father | 0 (0.0%) | - |
| Single Female/Mother | 31 (8.5%) | 4.55 |
| Non-family | 159 (43.7%) | 1.22 |
| Total Households | 364 (100.0%) | 2.40 |
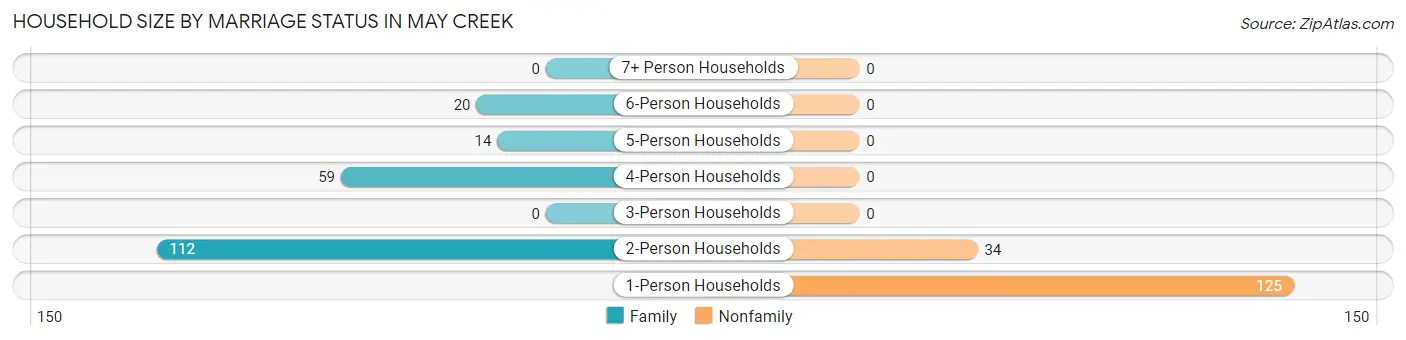
Household Size by Marriage Status in May Creek
Out of a total of 364 households in May Creek, 205 (56.3%) are family households, while 159 (43.7%) are nonfamily households. The most numerous type of family households are 2-person households, comprising 112, and the most common type of nonfamily households are 1-person households, comprising 125.
| Household Size | Family Households | Nonfamily Households |
| 1-Person Households | - | 125 (34.3%) |
| 2-Person Households | 112 (30.8%) | 34 (9.3%) |
| 3-Person Households | 0 (0.0%) | 0 (0.0%) |
| 4-Person Households | 59 (16.2%) | 0 (0.0%) |
| 5-Person Households | 14 (3.8%) | 0 (0.0%) |
| 6-Person Households | 20 (5.5%) | 0 (0.0%) |
| 7+ Person Households | 0 (0.0%) | 0 (0.0%) |
| Total | 205 (56.3%) | 159 (43.7%) |
Female Fertility in May Creek
Fertility by Age in May Creek
| Age Bracket | Women with Births | Births / 1,000 Women |
| 15 to 19 years | 0 (0.0%) | 0.0 |
| 20 to 34 years | 0 (0.0%) | 0.0 |
| 35 to 50 years | 0 (0.0%) | 0.0 |
| Total | 0 (0.0%) | 0.0 |
Fertility by Age by Marriage Status in May Creek
| Age Bracket | Married | Unmarried |
| 15 to 19 years | 0 (0.0%) | 0 (0.0%) |
| 20 to 34 years | 0 (0.0%) | 0 (0.0%) |
| 35 to 50 years | 0 (0.0%) | 0 (0.0%) |
| Total | 0 (0.0%) | 0 (0.0%) |
Fertility by Education in May Creek
| Educational Attainment | Women with Births | Births / 1,000 Women |
| Less than High School | 0 (0.0%) | 0.0 |
| High School Diploma | 0 (0.0%) | 0.0 |
| College or Associate's Degree | 0 (0.0%) | 0.0 |
| Bachelor's Degree | 0 (0.0%) | 0.0 |
| Graduate Degree | 0 (0.0%) | 0.0 |
| Total | 0 (0.0%) | 0.0 |
Fertility by Education by Marriage Status in May Creek
| Educational Attainment | Married | Unmarried |
| Less than High School | 0 (0.0%) | 0 (0.0%) |
| High School Diploma | 0 (0.0%) | 0 (0.0%) |
| College or Associate's Degree | 0 (0.0%) | 0 (0.0%) |
| Bachelor's Degree | 0 (0.0%) | 0 (0.0%) |
| Graduate Degree | 0 (0.0%) | 0 (0.0%) |
| Total | 0 (0.0%) | 0 (0.0%) |
Employment Characteristics in May Creek
Employment by Class of Employer in May Creek
Among the 461 employed individuals in May Creek, private company employees (420 | 91.1%), local government employees (29 | 6.3%), and self-employed (incorporated) (12 | 2.6%) make up the most common classes of employment.
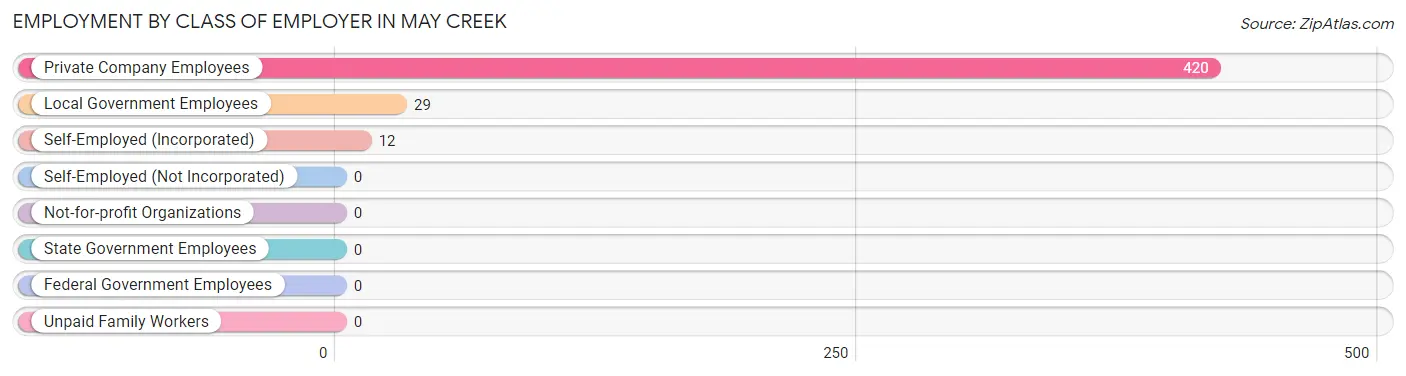
| Employer Class | # Employees | % Employees |
| Private Company Employees | 420 | 91.1% |
| Self-Employed (Incorporated) | 12 | 2.6% |
| Self-Employed (Not Incorporated) | 0 | 0.0% |
| Not-for-profit Organizations | 0 | 0.0% |
| Local Government Employees | 29 | 6.3% |
| State Government Employees | 0 | 0.0% |
| Federal Government Employees | 0 | 0.0% |
| Unpaid Family Workers | 0 | 0.0% |
| Total | 461 | 100.0% |
Employment Status by Age in May Creek
According to the labor force statistics for May Creek, out of the total population over 16 years of age (816), 60.8% or 496 individuals are in the labor force, with 7.1% or 35 of them unemployed. The age group with the highest labor force participation rate is 20 to 24 years, with 100.0% or 97 individuals in the labor force. Within the labor force, the 60 to 64 years age range has the highest percentage of unemployed individuals, with 48.0% or 24 of them being unemployed.
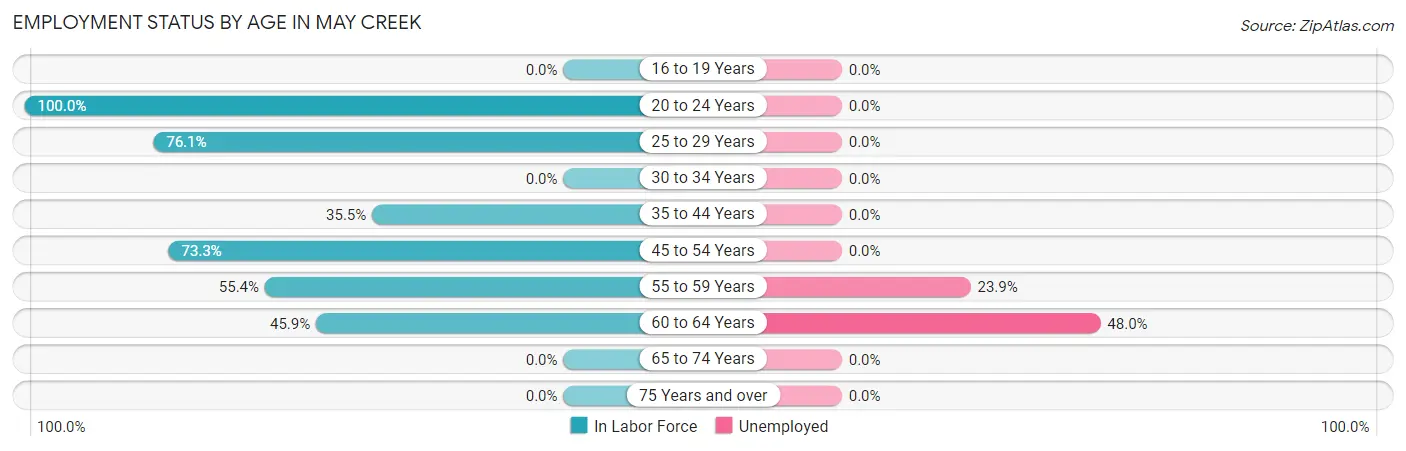
| Age Bracket | In Labor Force | Unemployed |
| 16 to 19 Years | 0 (0.0%) | 0 (0.0%) |
| 20 to 24 Years | 97 (100.0%) | 0 (0.0%) |
| 25 to 29 Years | 105 (76.1%) | 0 (0.0%) |
| 30 to 34 Years | 0 (0.0%) | 0 (0.0%) |
| 35 to 44 Years | 11 (35.5%) | 0 (0.0%) |
| 45 to 54 Years | 187 (73.3%) | 0 (0.0%) |
| 55 to 59 Years | 46 (55.4%) | 11 (23.9%) |
| 60 to 64 Years | 50 (45.9%) | 24 (48.0%) |
| 65 to 74 Years | 0 (0.0%) | 0 (0.0%) |
| 75 Years and over | 0 (0.0%) | 0 (0.0%) |
| Total | 496 (60.8%) | 35 (7.1%) |
Employment Status by Educational Attainment in May Creek
According to labor force statistics for May Creek, 62.9% of individuals (399) out of the total population between 25 and 64 years of age (634) are in the labor force, with 8.8% or 35 of them being unemployed. The group with the highest labor force participation rate are those with the educational attainment of bachelor's degree or higher, with 100.0% or 29 individuals in the labor force. Within the labor force, individuals with high school diploma education have the highest percentage of unemployment, with 19.8% or 24 of them being unemployed.
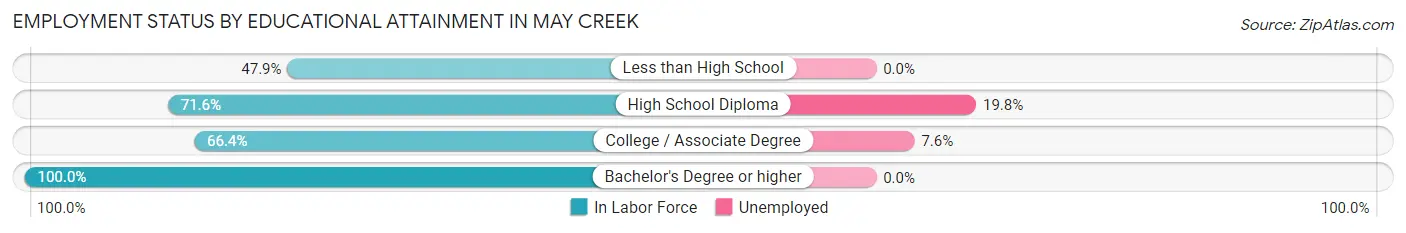
| Educational Attainment | In Labor Force | Unemployed |
| Less than High School | 105 (47.9%) | 0 (0.0%) |
| High School Diploma | 121 (71.6%) | 33 (19.8%) |
| College / Associate Degree | 144 (66.4%) | 16 (7.6%) |
| Bachelor's Degree or higher | 29 (100.0%) | 0 (0.0%) |
| Total | 399 (62.9%) | 56 (8.8%) |
Employment Occupations by Sex in May Creek
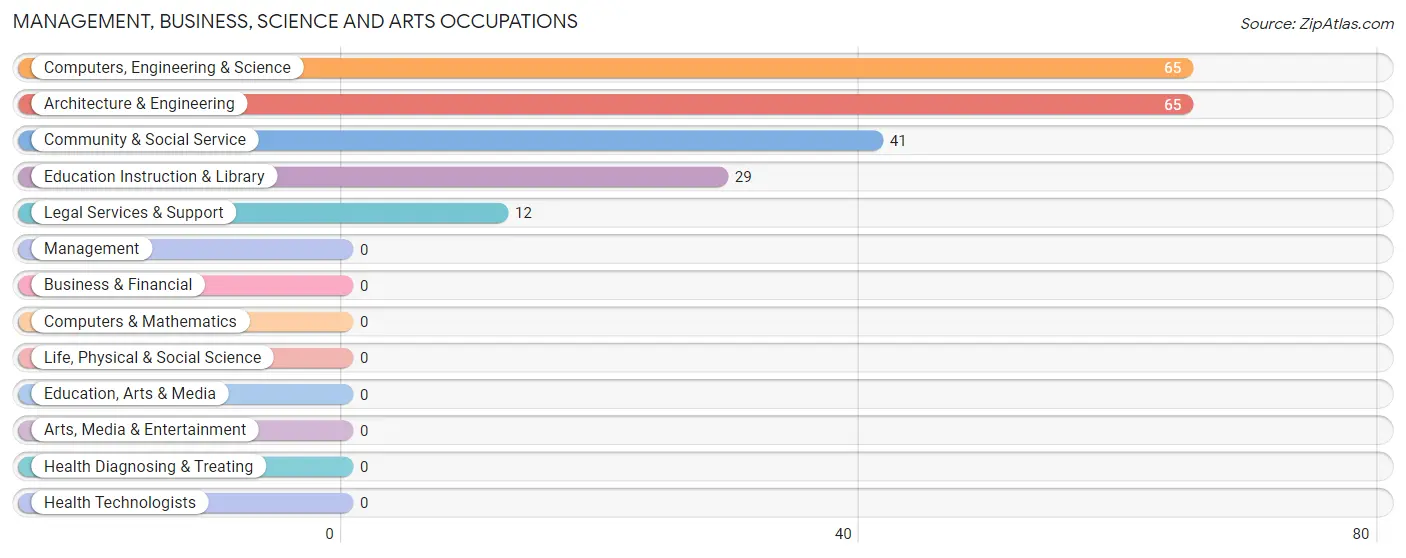
Management, Business, Science and Arts Occupations
The most common Management, Business, Science and Arts occupations in May Creek are Computers, Engineering & Science (65 | 14.1%), Architecture & Engineering (65 | 14.1%), Community & Social Service (41 | 8.9%), Education Instruction & Library (29 | 6.3%), and Legal Services & Support (12 | 2.6%).
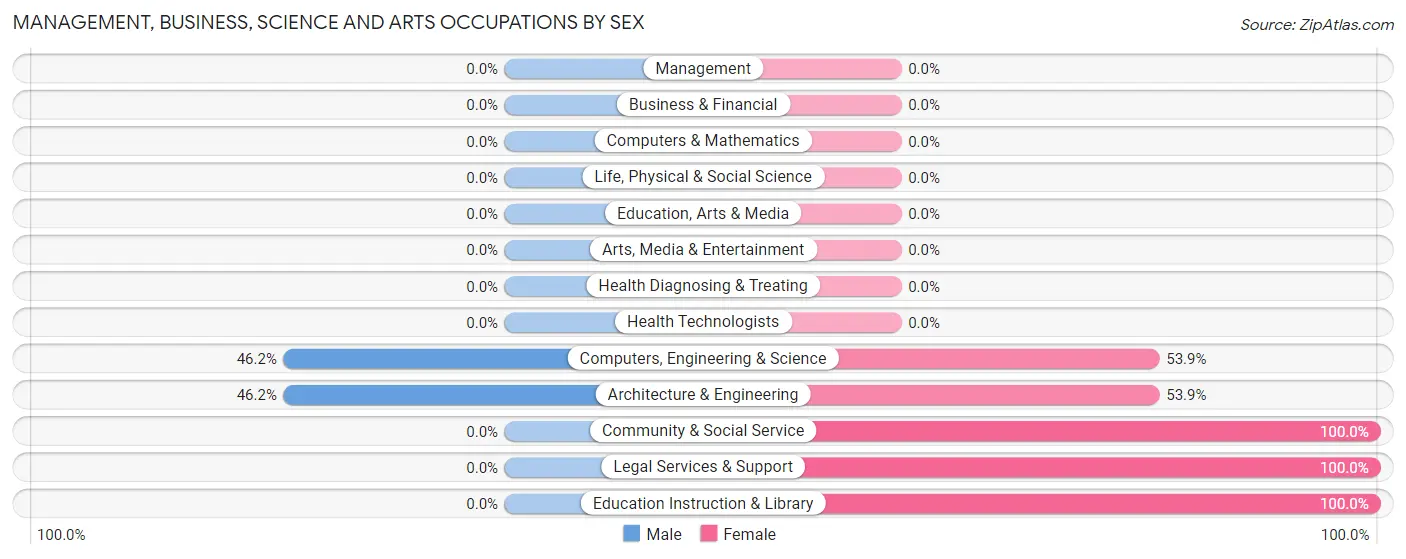
Management, Business, Science and Arts Occupations by Sex
Within the Management, Business, Science and Arts occupations in May Creek, the most male-oriented occupations are Computers, Engineering & Science (46.2%), and Architecture & Engineering (46.2%), while the most female-oriented occupations are Community & Social Service (100.0%), Legal Services & Support (100.0%), and Education Instruction & Library (100.0%).
| Occupation | Male | Female |
| Management | 0 (0.0%) | 0 (0.0%) |
| Business & Financial | 0 (0.0%) | 0 (0.0%) |
| Computers, Engineering & Science | 30 (46.2%) | 35 (53.8%) |
| Computers & Mathematics | 0 (0.0%) | 0 (0.0%) |
| Architecture & Engineering | 30 (46.2%) | 35 (53.8%) |
| Life, Physical & Social Science | 0 (0.0%) | 0 (0.0%) |
| Community & Social Service | 0 (0.0%) | 41 (100.0%) |
| Education, Arts & Media | 0 (0.0%) | 0 (0.0%) |
| Legal Services & Support | 0 (0.0%) | 12 (100.0%) |
| Education Instruction & Library | 0 (0.0%) | 29 (100.0%) |
| Arts, Media & Entertainment | 0 (0.0%) | 0 (0.0%) |
| Health Diagnosing & Treating | 0 (0.0%) | 0 (0.0%) |
| Health Technologists | 0 (0.0%) | 0 (0.0%) |
| Total (Category) | 30 (28.3%) | 76 (71.7%) |
| Total (Overall) | 271 (58.8%) | 190 (41.2%) |
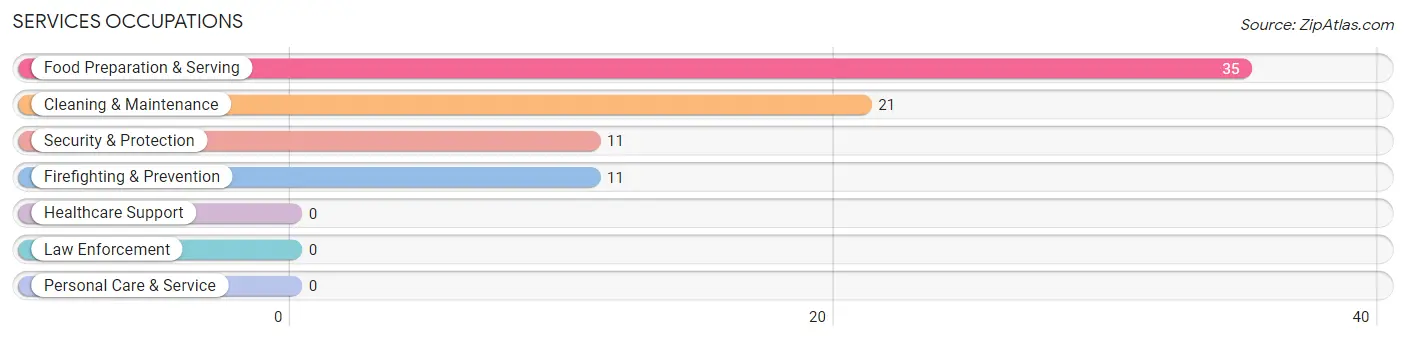
Services Occupations
The most common Services occupations in May Creek are Food Preparation & Serving (35 | 7.6%), Cleaning & Maintenance (21 | 4.6%), Security & Protection (11 | 2.4%), and Firefighting & Prevention (11 | 2.4%).
Services Occupations by Sex
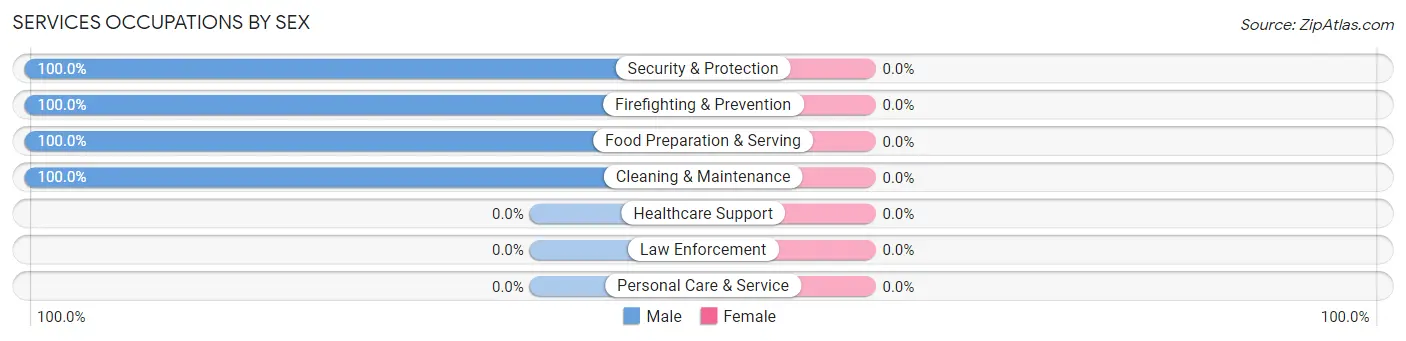
| Occupation | Male | Female |
| Healthcare Support | 0 (0.0%) | 0 (0.0%) |
| Security & Protection | 11 (100.0%) | 0 (0.0%) |
| Firefighting & Prevention | 11 (100.0%) | 0 (0.0%) |
| Law Enforcement | 0 (0.0%) | 0 (0.0%) |
| Food Preparation & Serving | 35 (100.0%) | 0 (0.0%) |
| Cleaning & Maintenance | 21 (100.0%) | 0 (0.0%) |
| Personal Care & Service | 0 (0.0%) | 0 (0.0%) |
| Total (Category) | 67 (100.0%) | 0 (0.0%) |
| Total (Overall) | 271 (58.8%) | 190 (41.2%) |
Sales and Office Occupations
The most common Sales and Office occupations in May Creek are Sales & Related (114 | 24.7%), and Office & Administration (42 | 9.1%).

Sales and Office Occupations by Sex

| Occupation | Male | Female |
| Sales & Related | 42 (36.8%) | 72 (63.2%) |
| Office & Administration | 0 (0.0%) | 42 (100.0%) |
| Total (Category) | 42 (26.9%) | 114 (73.1%) |
| Total (Overall) | 271 (58.8%) | 190 (41.2%) |
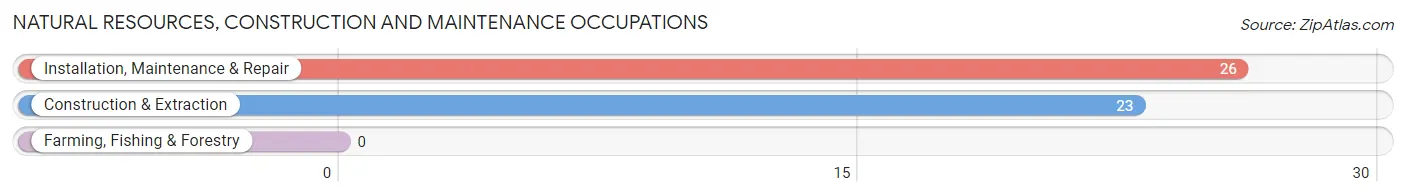
Natural Resources, Construction and Maintenance Occupations
The most common Natural Resources, Construction and Maintenance occupations in May Creek are Installation, Maintenance & Repair (26 | 5.6%), and Construction & Extraction (23 | 5.0%).
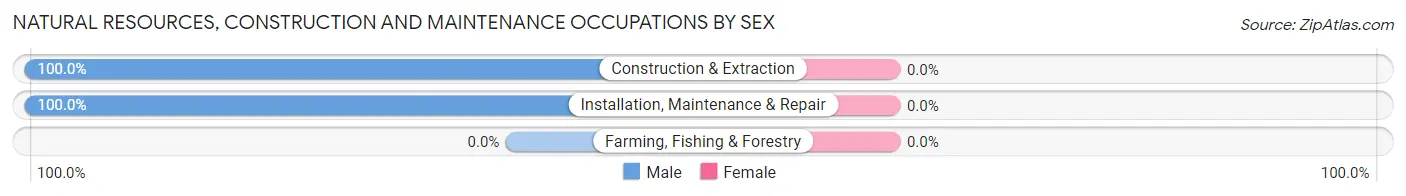
Natural Resources, Construction and Maintenance Occupations by Sex
| Occupation | Male | Female |
| Farming, Fishing & Forestry | 0 (0.0%) | 0 (0.0%) |
| Construction & Extraction | 23 (100.0%) | 0 (0.0%) |
| Installation, Maintenance & Repair | 26 (100.0%) | 0 (0.0%) |
| Total (Category) | 49 (100.0%) | 0 (0.0%) |
| Total (Overall) | 271 (58.8%) | 190 (41.2%) |
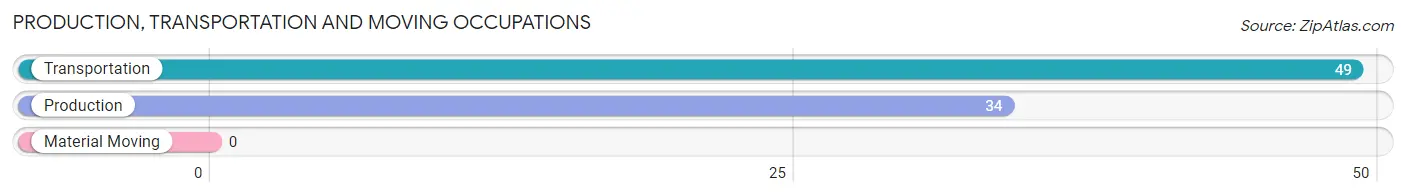
Production, Transportation and Moving Occupations
The most common Production, Transportation and Moving occupations in May Creek are Transportation (49 | 10.6%), and Production (34 | 7.4%).
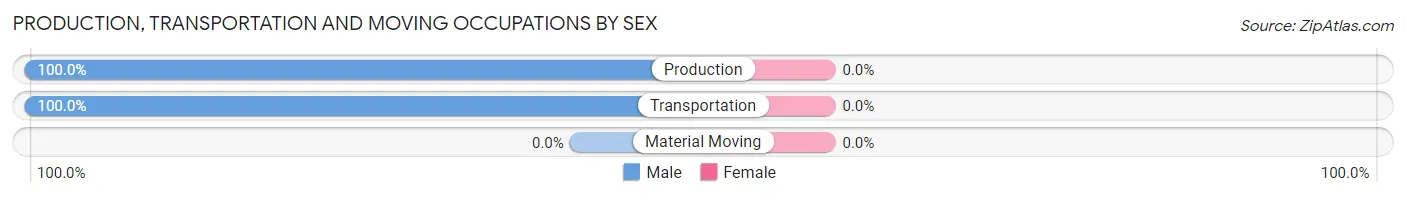
Production, Transportation and Moving Occupations by Sex
| Occupation | Male | Female |
| Production | 34 (100.0%) | 0 (0.0%) |
| Transportation | 49 (100.0%) | 0 (0.0%) |
| Material Moving | 0 (0.0%) | 0 (0.0%) |
| Total (Category) | 83 (100.0%) | 0 (0.0%) |
| Total (Overall) | 271 (58.8%) | 190 (41.2%) |
Employment Industries by Sex in May Creek
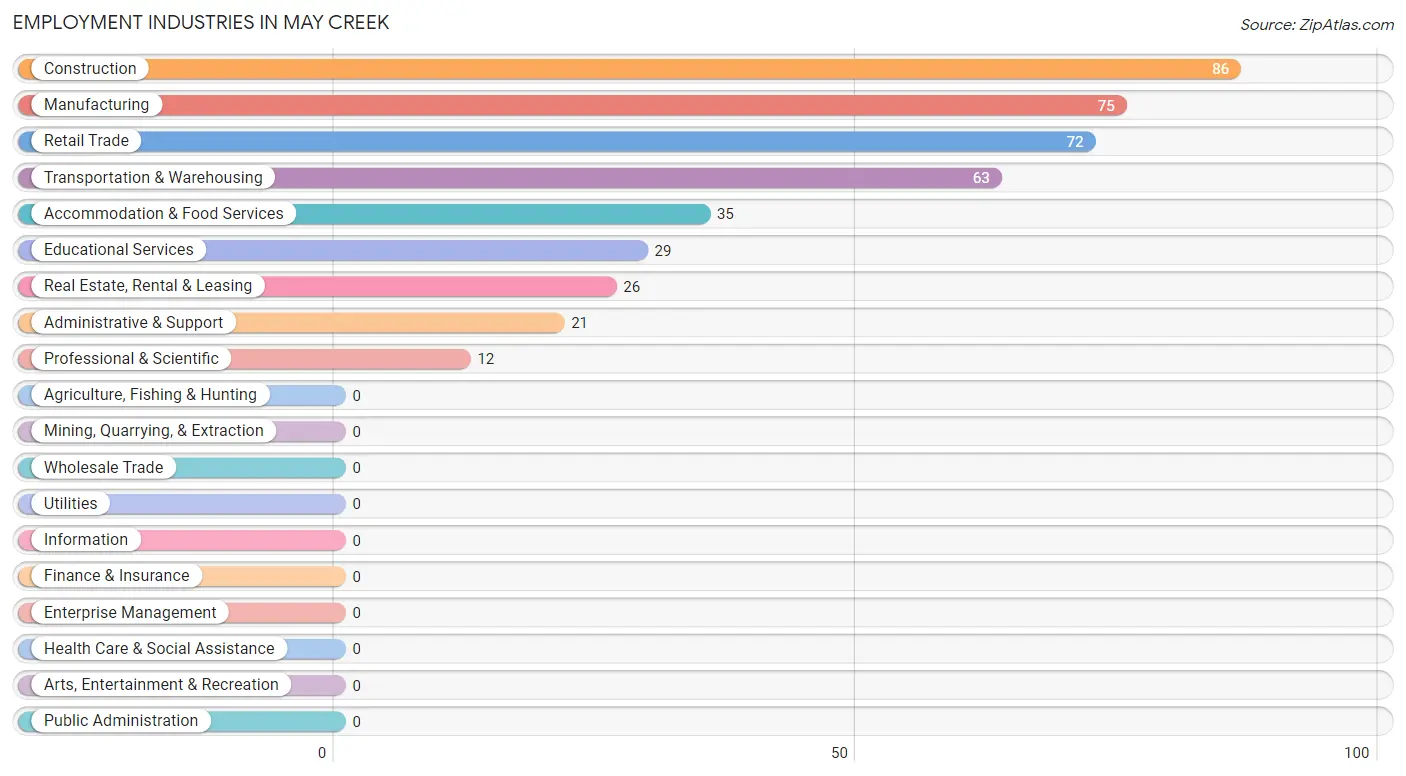
Employment Industries in May Creek
The major employment industries in May Creek include Construction (86 | 18.7%), Manufacturing (75 | 16.3%), Retail Trade (72 | 15.6%), Transportation & Warehousing (63 | 13.7%), and Accommodation & Food Services (35 | 7.6%).
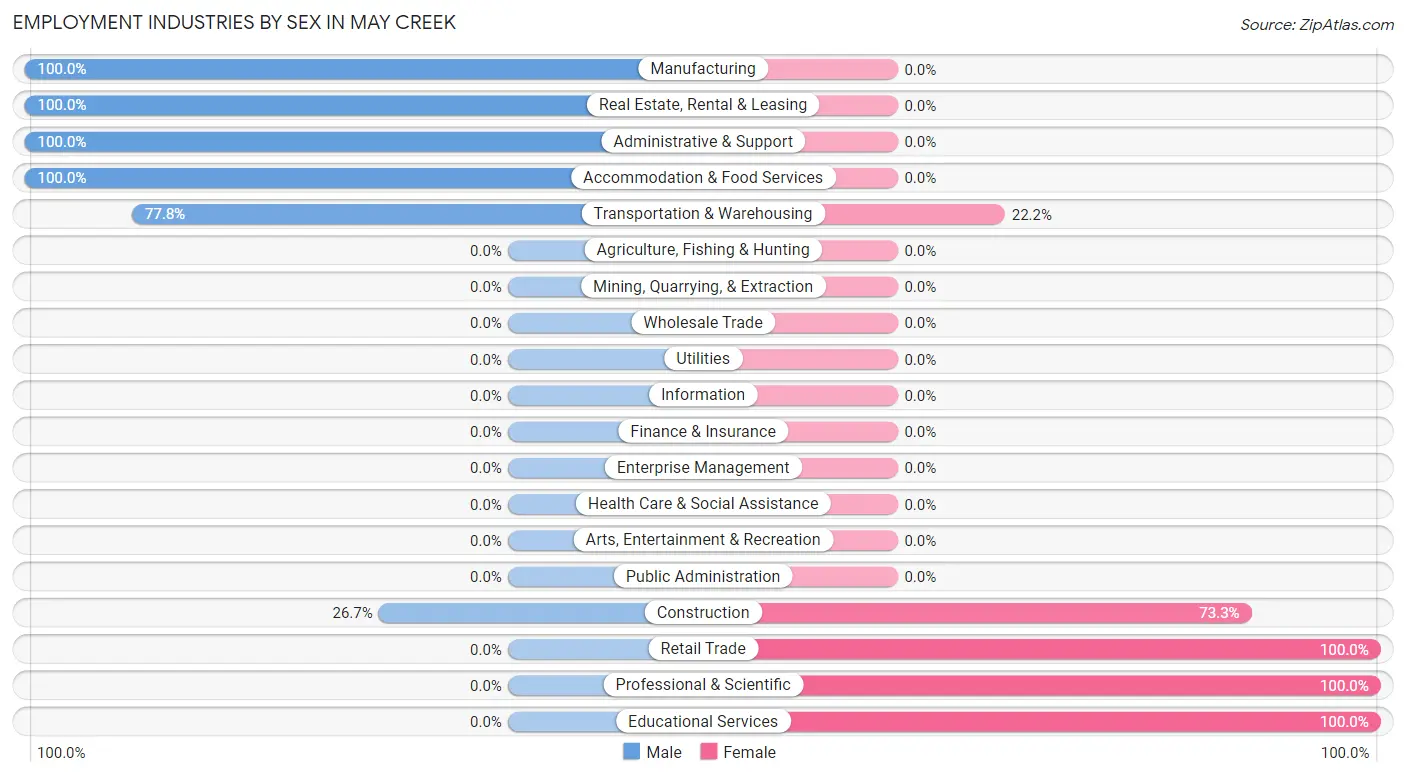
Employment Industries by Sex in May Creek
The May Creek industries that see more men than women are Manufacturing (100.0%), Real Estate, Rental & Leasing (100.0%), and Administrative & Support (100.0%), whereas the industries that tend to have a higher number of women are Retail Trade (100.0%), Professional & Scientific (100.0%), and Educational Services (100.0%).
| Industry | Male | Female |
| Agriculture, Fishing & Hunting | 0 (0.0%) | 0 (0.0%) |
| Mining, Quarrying, & Extraction | 0 (0.0%) | 0 (0.0%) |
| Construction | 23 (26.7%) | 63 (73.3%) |
| Manufacturing | 75 (100.0%) | 0 (0.0%) |
| Wholesale Trade | 0 (0.0%) | 0 (0.0%) |
| Retail Trade | 0 (0.0%) | 72 (100.0%) |
| Transportation & Warehousing | 49 (77.8%) | 14 (22.2%) |
| Utilities | 0 (0.0%) | 0 (0.0%) |
| Information | 0 (0.0%) | 0 (0.0%) |
| Finance & Insurance | 0 (0.0%) | 0 (0.0%) |
| Real Estate, Rental & Leasing | 26 (100.0%) | 0 (0.0%) |
| Professional & Scientific | 0 (0.0%) | 12 (100.0%) |
| Enterprise Management | 0 (0.0%) | 0 (0.0%) |
| Administrative & Support | 21 (100.0%) | 0 (0.0%) |
| Educational Services | 0 (0.0%) | 29 (100.0%) |
| Health Care & Social Assistance | 0 (0.0%) | 0 (0.0%) |
| Arts, Entertainment & Recreation | 0 (0.0%) | 0 (0.0%) |
| Accommodation & Food Services | 35 (100.0%) | 0 (0.0%) |
| Public Administration | 0 (0.0%) | 0 (0.0%) |
| Total | 271 (58.8%) | 190 (41.2%) |
Education in May Creek
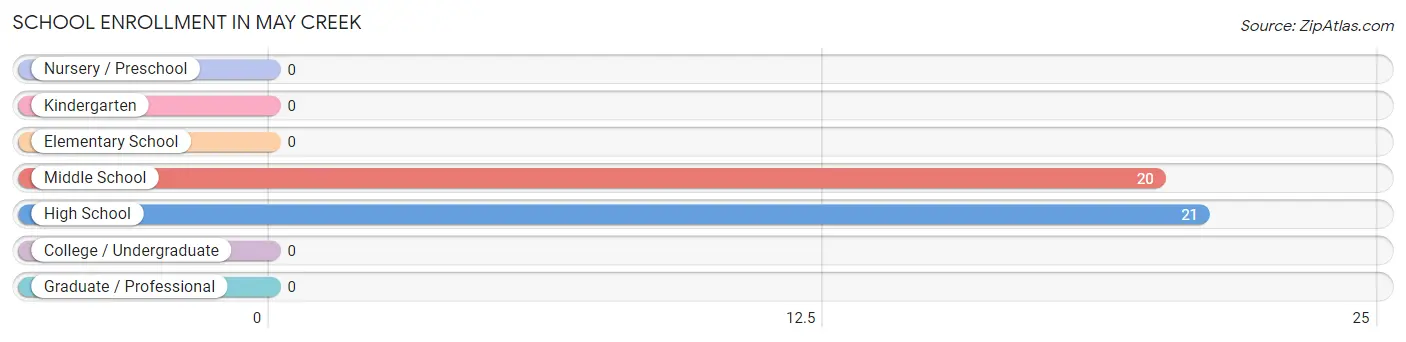
School Enrollment in May Creek
The most common levels of schooling among the 41 students in May Creek are high school (21 | 51.2%), and middle school (20 | 48.8%).
| School Level | # Students | % Students |
| Nursery / Preschool | 0 | 0.0% |
| Kindergarten | 0 | 0.0% |
| Elementary School | 0 | 0.0% |
| Middle School | 20 | 48.8% |
| High School | 21 | 51.2% |
| College / Undergraduate | 0 | 0.0% |
| Graduate / Professional | 0 | 0.0% |
| Total | 41 | 100.0% |
School Enrollment by Age by Funding Source in May Creek
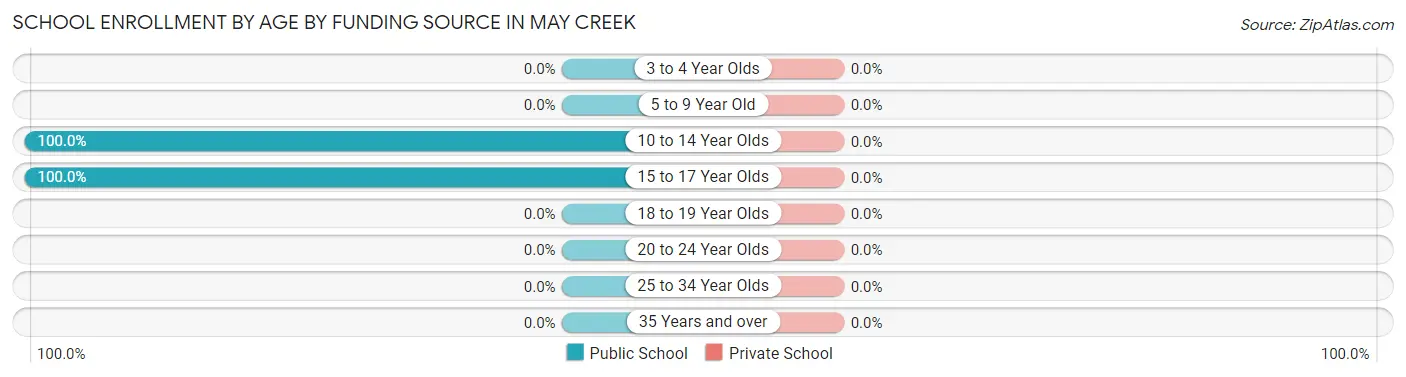
| Age Bracket | Public School | Private School |
| 3 to 4 Year Olds | 0 (0.0%) | 0 (0.0%) |
| 5 to 9 Year Old | 0 (0.0%) | 0 (0.0%) |
| 10 to 14 Year Olds | 20 (100.0%) | 0 (0.0%) |
| 15 to 17 Year Olds | 21 (100.0%) | 0 (0.0%) |
| 18 to 19 Year Olds | 0 (0.0%) | 0 (0.0%) |
| 20 to 24 Year Olds | 0 (0.0%) | 0 (0.0%) |
| 25 to 34 Year Olds | 0 (0.0%) | 0 (0.0%) |
| 35 Years and over | 0 (0.0%) | 0 (0.0%) |
| Total | 41 (100.0%) | 0 (0.0%) |
Educational Attainment by Field of Study in May Creek
Visual & performing arts (29 | 56.9%), bio, nature & agricultural (11 | 21.6%), and science & technology (11 | 21.6%) are the most common fields of study among 51 individuals in May Creek who have obtained a bachelor's degree or higher.
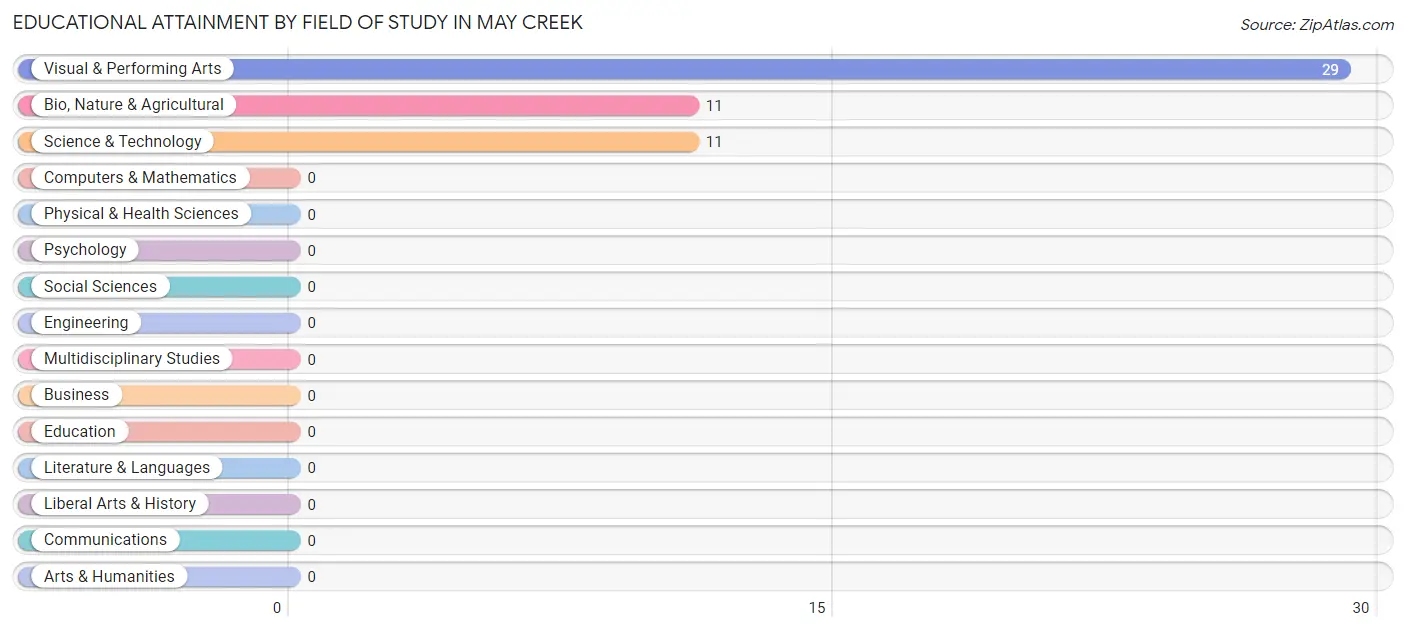
| Field of Study | # Graduates | % Graduates |
| Computers & Mathematics | 0 | 0.0% |
| Bio, Nature & Agricultural | 11 | 21.6% |
| Physical & Health Sciences | 0 | 0.0% |
| Psychology | 0 | 0.0% |
| Social Sciences | 0 | 0.0% |
| Engineering | 0 | 0.0% |
| Multidisciplinary Studies | 0 | 0.0% |
| Science & Technology | 11 | 21.6% |
| Business | 0 | 0.0% |
| Education | 0 | 0.0% |
| Literature & Languages | 0 | 0.0% |
| Liberal Arts & History | 0 | 0.0% |
| Visual & Performing Arts | 29 | 56.9% |
| Communications | 0 | 0.0% |
| Arts & Humanities | 0 | 0.0% |
| Total | 51 | 100.0% |
Transportation & Commute in May Creek
Vehicle Availability by Sex in May Creek
The most prevalent vehicle ownership categories in May Creek are males with 3 vehicles (148, accounting for 54.6%) and females with 3 vehicles (80, making up 77.9%).
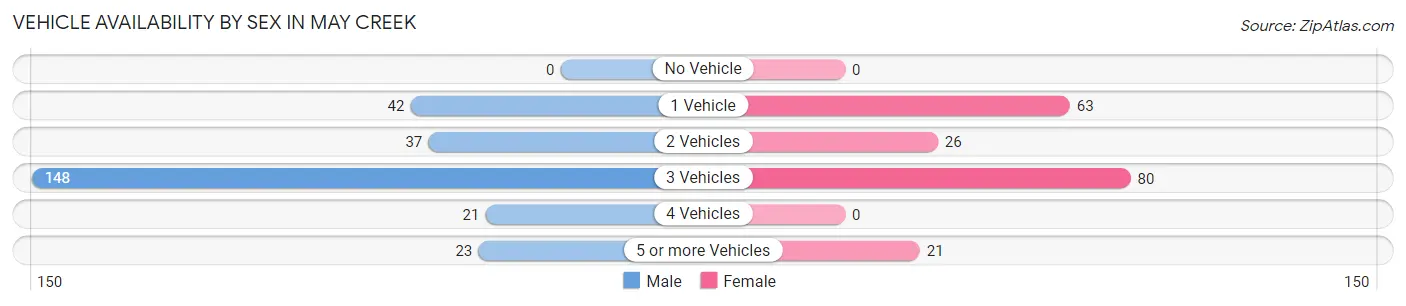
| Vehicles Available | Male | Female |
| No Vehicle | 0 (0.0%) | 0 (0.0%) |
| 1 Vehicle | 42 (15.5%) | 63 (33.2%) |
| 2 Vehicles | 37 (13.7%) | 26 (13.7%) |
| 3 Vehicles | 148 (54.6%) | 80 (42.1%) |
| 4 Vehicles | 21 (7.7%) | 0 (0.0%) |
| 5 or more Vehicles | 23 (8.5%) | 21 (11.1%) |
| Total | 271 (100.0%) | 190 (100.0%) |
Commute Time in May Creek
The most frequently occuring commute durations in May Creek are 60 to 89 minutes (91 commuters, 21.8%), 30 to 34 minutes (70 commuters, 16.8%), and 90 or more minutes (56 commuters, 13.4%).
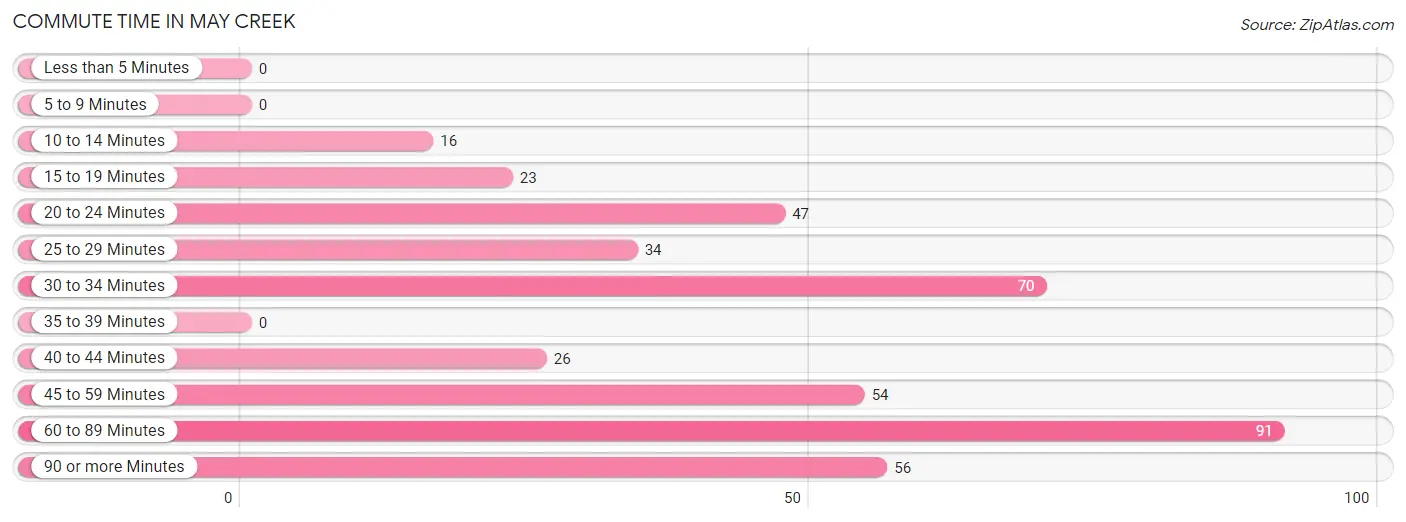
| Commute Time | # Commuters | % Commuters |
| Less than 5 Minutes | 0 | 0.0% |
| 5 to 9 Minutes | 0 | 0.0% |
| 10 to 14 Minutes | 16 | 3.8% |
| 15 to 19 Minutes | 23 | 5.5% |
| 20 to 24 Minutes | 47 | 11.3% |
| 25 to 29 Minutes | 34 | 8.2% |
| 30 to 34 Minutes | 70 | 16.8% |
| 35 to 39 Minutes | 0 | 0.0% |
| 40 to 44 Minutes | 26 | 6.2% |
| 45 to 59 Minutes | 54 | 13.0% |
| 60 to 89 Minutes | 91 | 21.8% |
| 90 or more Minutes | 56 | 13.4% |
Commute Time by Sex in May Creek
The most common commute times in May Creek are 45 to 59 minutes (42 commuters, 17.4%) for males and 60 to 89 minutes (49 commuters, 27.8%) for females.
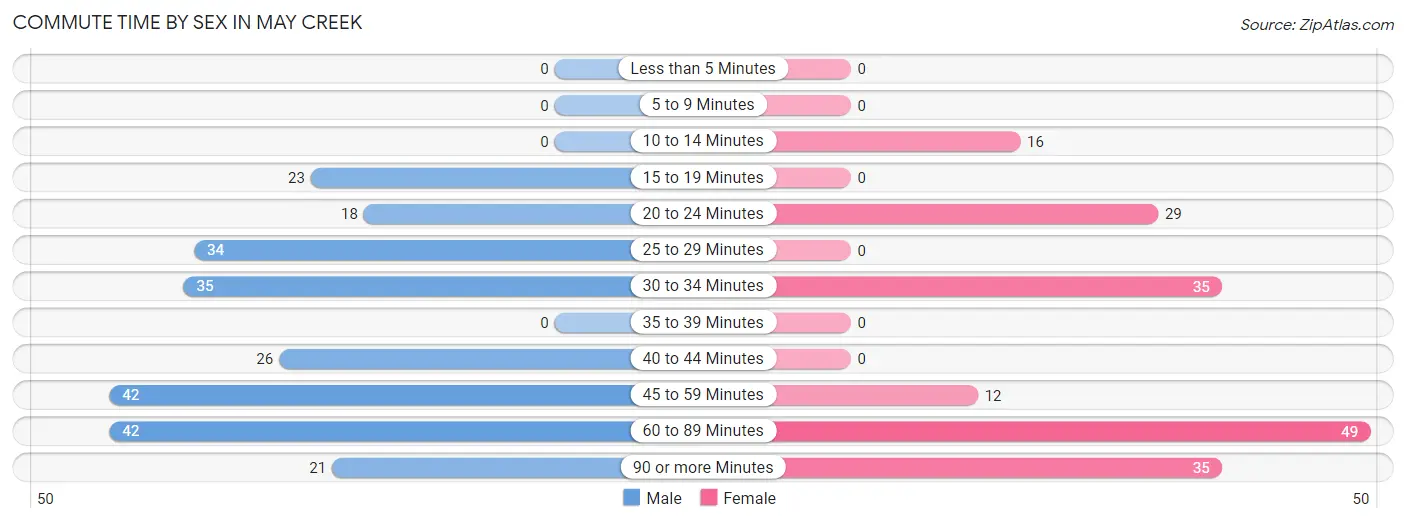
| Commute Time | Male | Female |
| Less than 5 Minutes | 0 (0.0%) | 0 (0.0%) |
| 5 to 9 Minutes | 0 (0.0%) | 0 (0.0%) |
| 10 to 14 Minutes | 0 (0.0%) | 16 (9.1%) |
| 15 to 19 Minutes | 23 (9.5%) | 0 (0.0%) |
| 20 to 24 Minutes | 18 (7.5%) | 29 (16.5%) |
| 25 to 29 Minutes | 34 (14.1%) | 0 (0.0%) |
| 30 to 34 Minutes | 35 (14.5%) | 35 (19.9%) |
| 35 to 39 Minutes | 0 (0.0%) | 0 (0.0%) |
| 40 to 44 Minutes | 26 (10.8%) | 0 (0.0%) |
| 45 to 59 Minutes | 42 (17.4%) | 12 (6.8%) |
| 60 to 89 Minutes | 42 (17.4%) | 49 (27.8%) |
| 90 or more Minutes | 21 (8.7%) | 35 (19.9%) |
Time of Departure to Work by Sex in May Creek
The most frequent times of departure to work in May Creek are 5:30 AM to 5:59 AM (120, 49.8%) for males and 5:00 AM to 5:29 AM (56, 31.8%) for females.
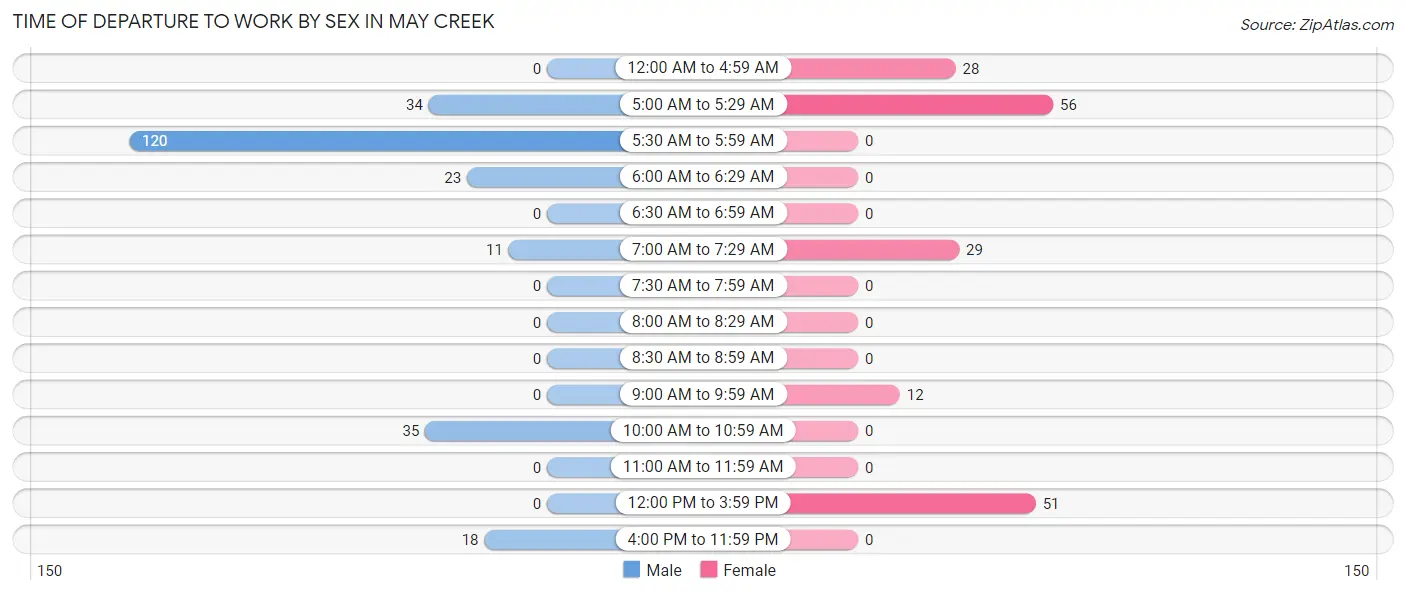
| Time of Departure | Male | Female |
| 12:00 AM to 4:59 AM | 0 (0.0%) | 28 (15.9%) |
| 5:00 AM to 5:29 AM | 34 (14.1%) | 56 (31.8%) |
| 5:30 AM to 5:59 AM | 120 (49.8%) | 0 (0.0%) |
| 6:00 AM to 6:29 AM | 23 (9.5%) | 0 (0.0%) |
| 6:30 AM to 6:59 AM | 0 (0.0%) | 0 (0.0%) |
| 7:00 AM to 7:29 AM | 11 (4.6%) | 29 (16.5%) |
| 7:30 AM to 7:59 AM | 0 (0.0%) | 0 (0.0%) |
| 8:00 AM to 8:29 AM | 0 (0.0%) | 0 (0.0%) |
| 8:30 AM to 8:59 AM | 0 (0.0%) | 0 (0.0%) |
| 9:00 AM to 9:59 AM | 0 (0.0%) | 12 (6.8%) |
| 10:00 AM to 10:59 AM | 35 (14.5%) | 0 (0.0%) |
| 11:00 AM to 11:59 AM | 0 (0.0%) | 0 (0.0%) |
| 12:00 PM to 3:59 PM | 0 (0.0%) | 51 (29.0%) |
| 4:00 PM to 11:59 PM | 18 (7.5%) | 0 (0.0%) |
| Total | 241 (100.0%) | 176 (100.0%) |
Housing Occupancy in May Creek
Occupancy by Ownership in May Creek
Of the total 364 dwellings in May Creek, owner-occupied units account for 309 (84.9%), while renter-occupied units make up 55 (15.1%).
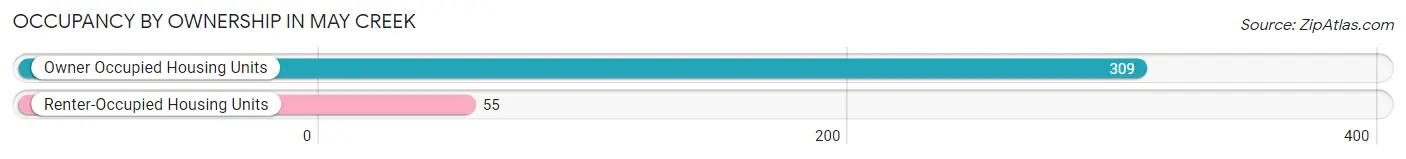
| Occupancy | # Housing Units | % Housing Units |
| Owner Occupied Housing Units | 309 | 84.9% |
| Renter-Occupied Housing Units | 55 | 15.1% |
| Total Occupied Housing Units | 364 | 100.0% |
Occupancy by Household Size in May Creek
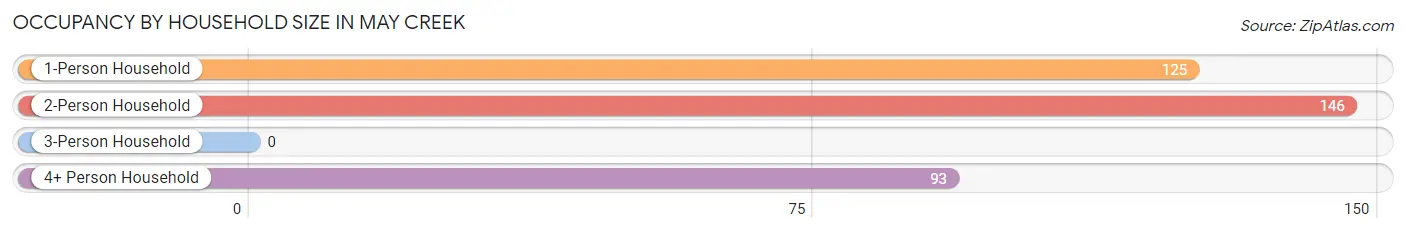
| Household Size | # Housing Units | % Housing Units |
| 1-Person Household | 125 | 34.3% |
| 2-Person Household | 146 | 40.1% |
| 3-Person Household | 0 | 0.0% |
| 4+ Person Household | 93 | 25.6% |
| Total Housing Units | 364 | 100.0% |
Occupancy by Ownership by Household Size in May Creek
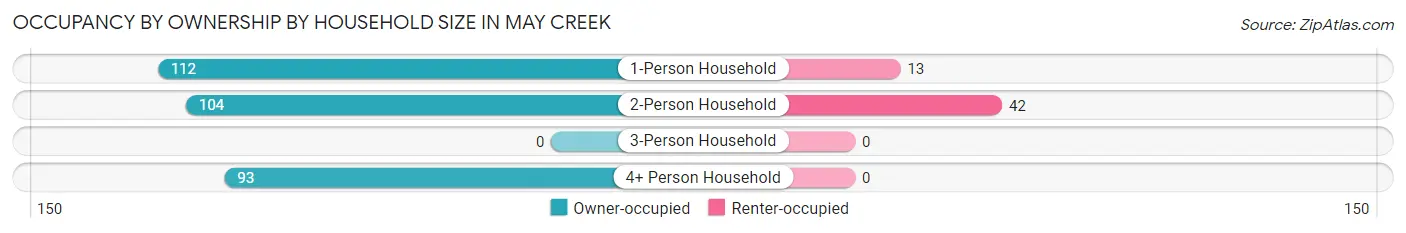
| Household Size | Owner-occupied | Renter-occupied |
| 1-Person Household | 112 (89.6%) | 13 (10.4%) |
| 2-Person Household | 104 (71.2%) | 42 (28.8%) |
| 3-Person Household | 0 (0.0%) | 0 (0.0%) |
| 4+ Person Household | 93 (100.0%) | 0 (0.0%) |
| Total Housing Units | 309 (84.9%) | 55 (15.1%) |
Occupancy by Educational Attainment in May Creek
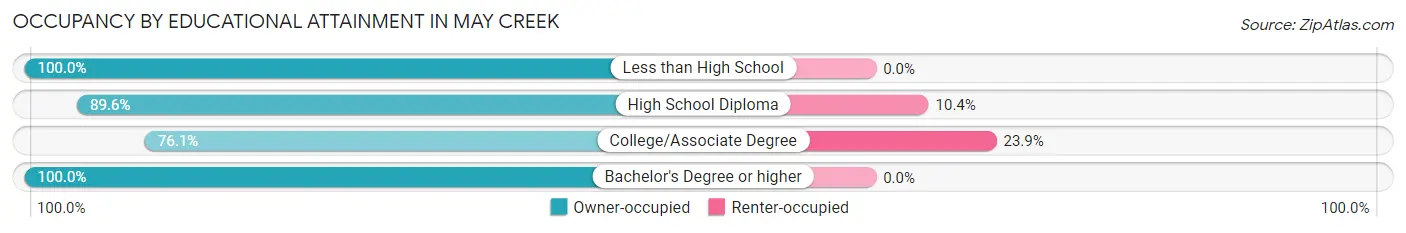
| Household Size | Owner-occupied | Renter-occupied |
| Less than High School | 23 (100.0%) | 0 (0.0%) |
| High School Diploma | 112 (89.6%) | 13 (10.4%) |
| College/Associate Degree | 134 (76.1%) | 42 (23.9%) |
| Bachelor's Degree or higher | 40 (100.0%) | 0 (0.0%) |
Occupancy by Age of Householder in May Creek
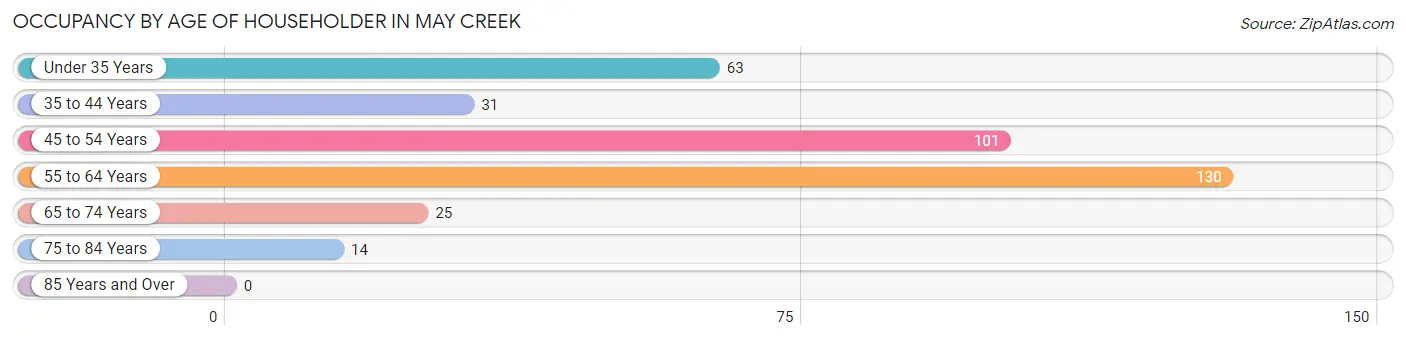
| Age Bracket | # Households | % Households |
| Under 35 Years | 63 | 17.3% |
| 35 to 44 Years | 31 | 8.5% |
| 45 to 54 Years | 101 | 27.8% |
| 55 to 64 Years | 130 | 35.7% |
| 65 to 74 Years | 25 | 6.9% |
| 75 to 84 Years | 14 | 3.8% |
| 85 Years and Over | 0 | 0.0% |
| Total | 364 | 100.0% |
Housing Finances in May Creek
Median Income by Occupancy in May Creek
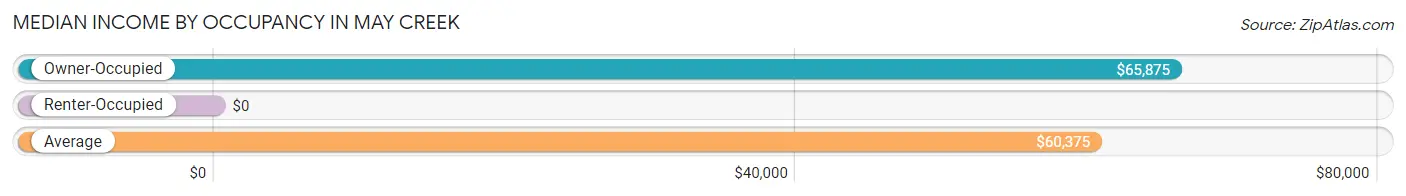
| Occupancy Type | # Households | Median Income |
| Owner-Occupied | 309 (84.9%) | $65,875 |
| Renter-Occupied | 55 (15.1%) | $0 |
| Average | 364 (100.0%) | $60,375 |
Occupancy by Householder Income Bracket in May Creek
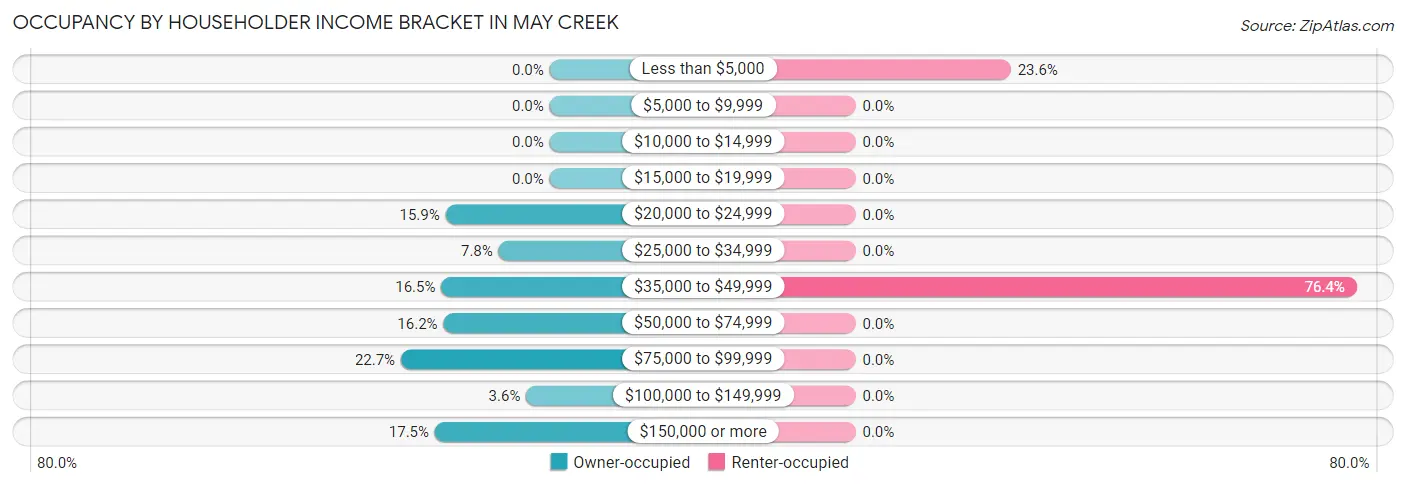
| Income Bracket | Owner-occupied | Renter-occupied |
| Less than $5,000 | 0 (0.0%) | 13 (23.6%) |
| $5,000 to $9,999 | 0 (0.0%) | 0 (0.0%) |
| $10,000 to $14,999 | 0 (0.0%) | 0 (0.0%) |
| $15,000 to $19,999 | 0 (0.0%) | 0 (0.0%) |
| $20,000 to $24,999 | 49 (15.9%) | 0 (0.0%) |
| $25,000 to $34,999 | 24 (7.8%) | 0 (0.0%) |
| $35,000 to $49,999 | 51 (16.5%) | 42 (76.4%) |
| $50,000 to $74,999 | 50 (16.2%) | 0 (0.0%) |
| $75,000 to $99,999 | 70 (22.7%) | 0 (0.0%) |
| $100,000 to $149,999 | 11 (3.6%) | 0 (0.0%) |
| $150,000 or more | 54 (17.5%) | 0 (0.0%) |
| Total | 309 (100.0%) | 55 (100.0%) |
Monthly Housing Cost Tiers in May Creek
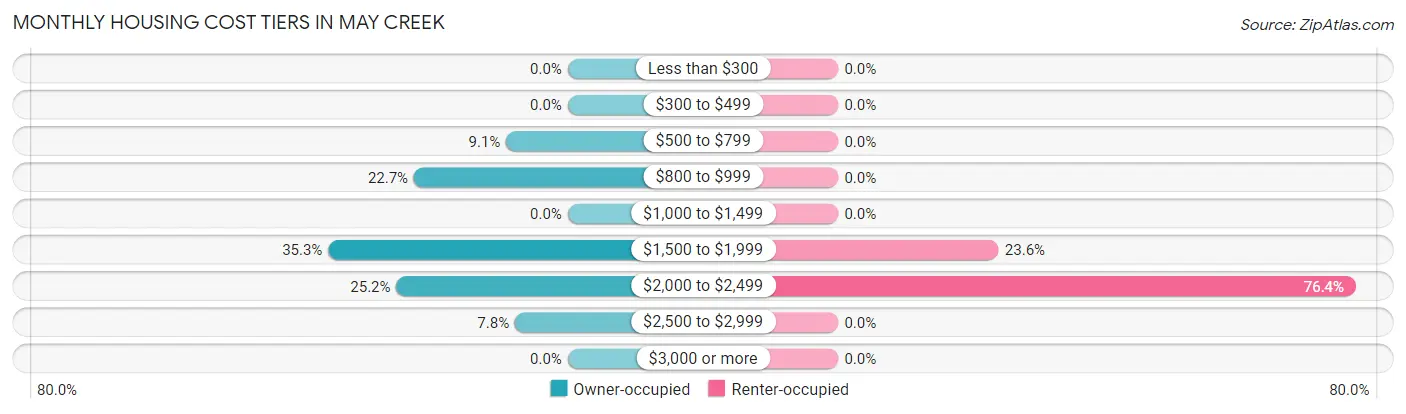
| Monthly Cost | Owner-occupied | Renter-occupied |
| Less than $300 | 0 (0.0%) | 0 (0.0%) |
| $300 to $499 | 0 (0.0%) | 0 (0.0%) |
| $500 to $799 | 28 (9.1%) | 0 (0.0%) |
| $800 to $999 | 70 (22.7%) | 0 (0.0%) |
| $1,000 to $1,499 | 0 (0.0%) | 0 (0.0%) |
| $1,500 to $1,999 | 109 (35.3%) | 13 (23.6%) |
| $2,000 to $2,499 | 78 (25.2%) | 42 (76.4%) |
| $2,500 to $2,999 | 24 (7.8%) | 0 (0.0%) |
| $3,000 or more | 0 (0.0%) | 0 (0.0%) |
| Total | 309 (100.0%) | 55 (100.0%) |
Physical Housing Characteristics in May Creek
Housing Structures in May Creek
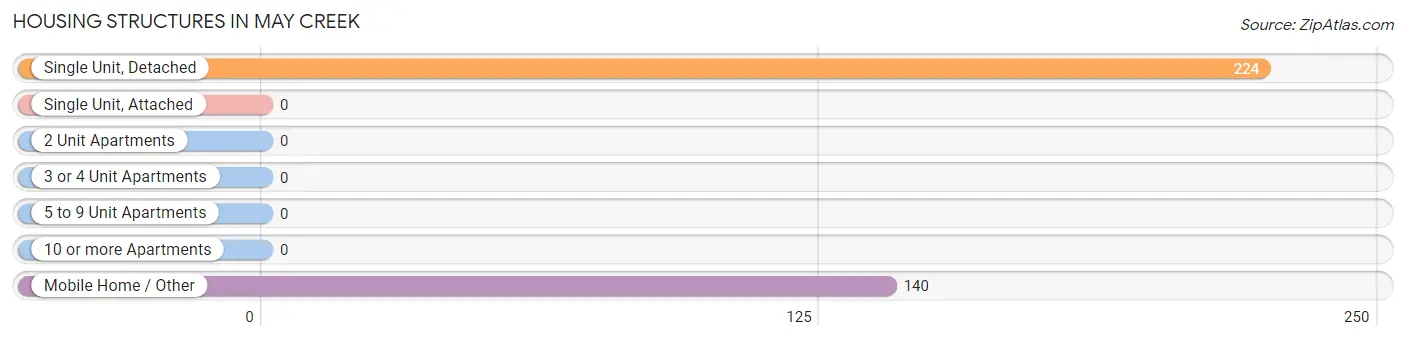
| Structure Type | # Housing Units | % Housing Units |
| Single Unit, Detached | 224 | 61.5% |
| Single Unit, Attached | 0 | 0.0% |
| 2 Unit Apartments | 0 | 0.0% |
| 3 or 4 Unit Apartments | 0 | 0.0% |
| 5 to 9 Unit Apartments | 0 | 0.0% |
| 10 or more Apartments | 0 | 0.0% |
| Mobile Home / Other | 140 | 38.5% |
| Total | 364 | 100.0% |
Housing Structures by Occupancy in May Creek
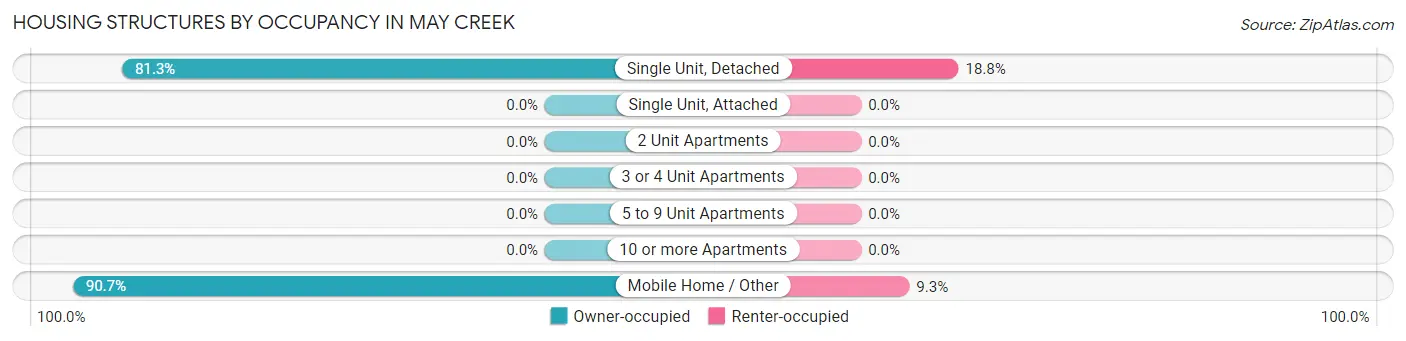
| Structure Type | Owner-occupied | Renter-occupied |
| Single Unit, Detached | 182 (81.2%) | 42 (18.8%) |
| Single Unit, Attached | 0 (0.0%) | 0 (0.0%) |
| 2 Unit Apartments | 0 (0.0%) | 0 (0.0%) |
| 3 or 4 Unit Apartments | 0 (0.0%) | 0 (0.0%) |
| 5 to 9 Unit Apartments | 0 (0.0%) | 0 (0.0%) |
| 10 or more Apartments | 0 (0.0%) | 0 (0.0%) |
| Mobile Home / Other | 127 (90.7%) | 13 (9.3%) |
| Total | 309 (84.9%) | 55 (15.1%) |
Housing Structures by Number of Rooms in May Creek
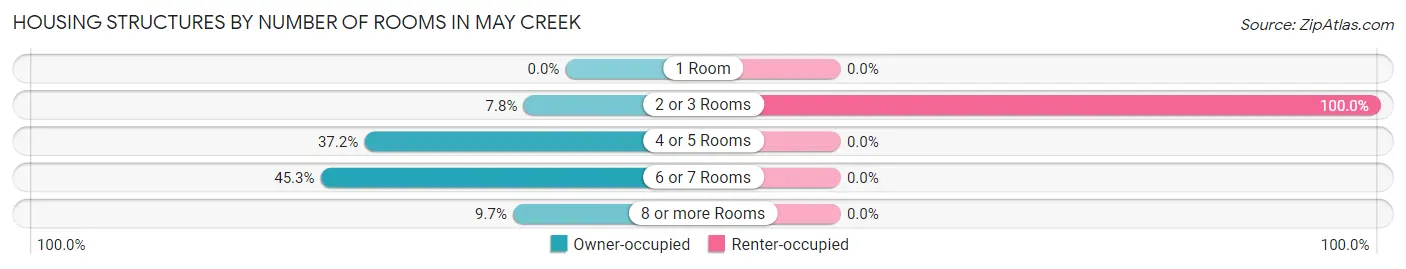
| Number of Rooms | Owner-occupied | Renter-occupied |
| 1 Room | 0 (0.0%) | 0 (0.0%) |
| 2 or 3 Rooms | 24 (7.8%) | 55 (100.0%) |
| 4 or 5 Rooms | 115 (37.2%) | 0 (0.0%) |
| 6 or 7 Rooms | 140 (45.3%) | 0 (0.0%) |
| 8 or more Rooms | 30 (9.7%) | 0 (0.0%) |
| Total | 309 (100.0%) | 55 (100.0%) |
Housing Structure by Heating Type in May Creek
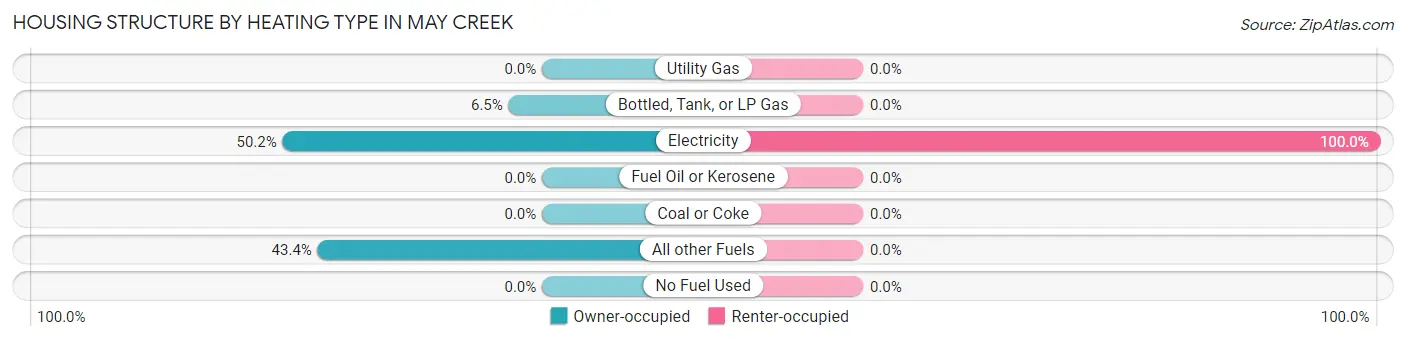
| Heating Type | Owner-occupied | Renter-occupied |
| Utility Gas | 0 (0.0%) | 0 (0.0%) |
| Bottled, Tank, or LP Gas | 20 (6.5%) | 0 (0.0%) |
| Electricity | 155 (50.2%) | 55 (100.0%) |
| Fuel Oil or Kerosene | 0 (0.0%) | 0 (0.0%) |
| Coal or Coke | 0 (0.0%) | 0 (0.0%) |
| All other Fuels | 134 (43.4%) | 0 (0.0%) |
| No Fuel Used | 0 (0.0%) | 0 (0.0%) |
| Total | 309 (100.0%) | 55 (100.0%) |
Household Vehicle Usage in May Creek
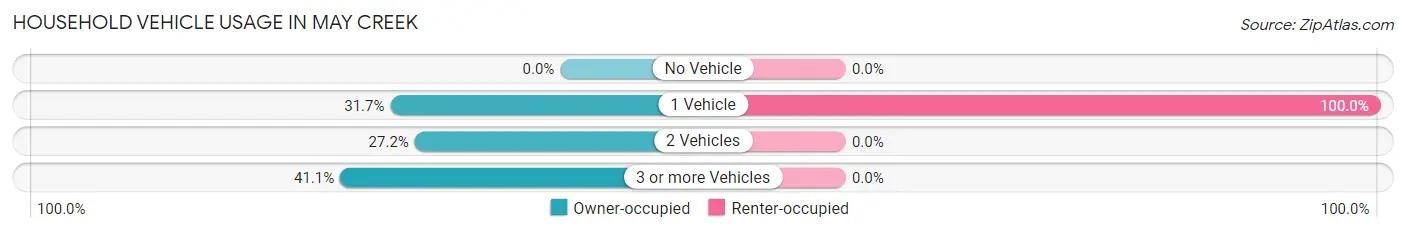
| Vehicles per Household | Owner-occupied | Renter-occupied |
| No Vehicle | 0 (0.0%) | 0 (0.0%) |
| 1 Vehicle | 98 (31.7%) | 55 (100.0%) |
| 2 Vehicles | 84 (27.2%) | 0 (0.0%) |
| 3 or more Vehicles | 127 (41.1%) | 0 (0.0%) |
| Total | 309 (100.0%) | 55 (100.0%) |
Real Estate & Mortgages in May Creek
Real Estate and Mortgage Overview in May Creek
| Characteristic | Without Mortgage | With Mortgage |
| Housing Units | 39 | 270 |
| Median Property Value | - | - |
| Median Household Income | - | - |
| Monthly Housing Costs | - | - |
| Real Estate Taxes | - | - |
Property Value by Mortgage Status in May Creek
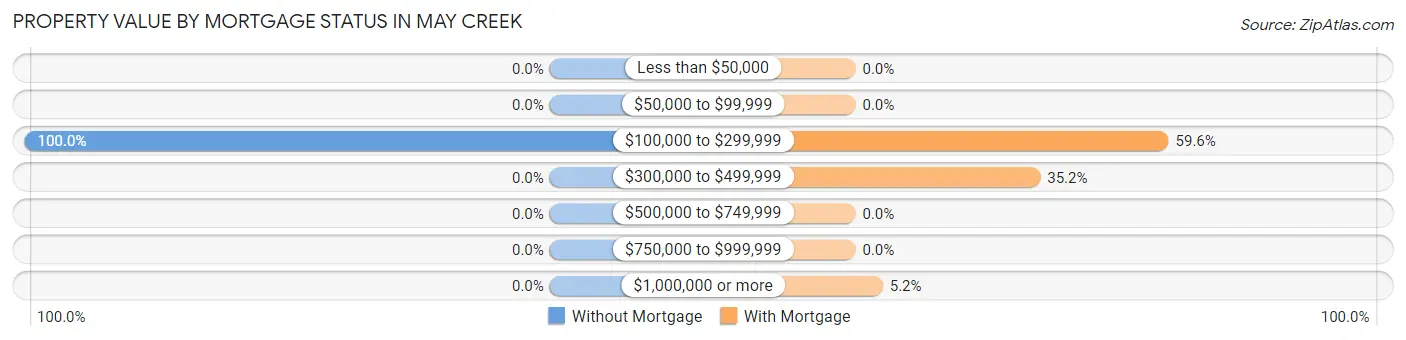
| Property Value | Without Mortgage | With Mortgage |
| Less than $50,000 | 0 (0.0%) | 0 (0.0%) |
| $50,000 to $99,999 | 0 (0.0%) | 0 (0.0%) |
| $100,000 to $299,999 | 39 (100.0%) | 161 (59.6%) |
| $300,000 to $499,999 | 0 (0.0%) | 95 (35.2%) |
| $500,000 to $749,999 | 0 (0.0%) | 0 (0.0%) |
| $750,000 to $999,999 | 0 (0.0%) | 0 (0.0%) |
| $1,000,000 or more | 0 (0.0%) | 14 (5.2%) |
| Total | 39 (100.0%) | 270 (100.0%) |
Household Income by Mortgage Status in May Creek
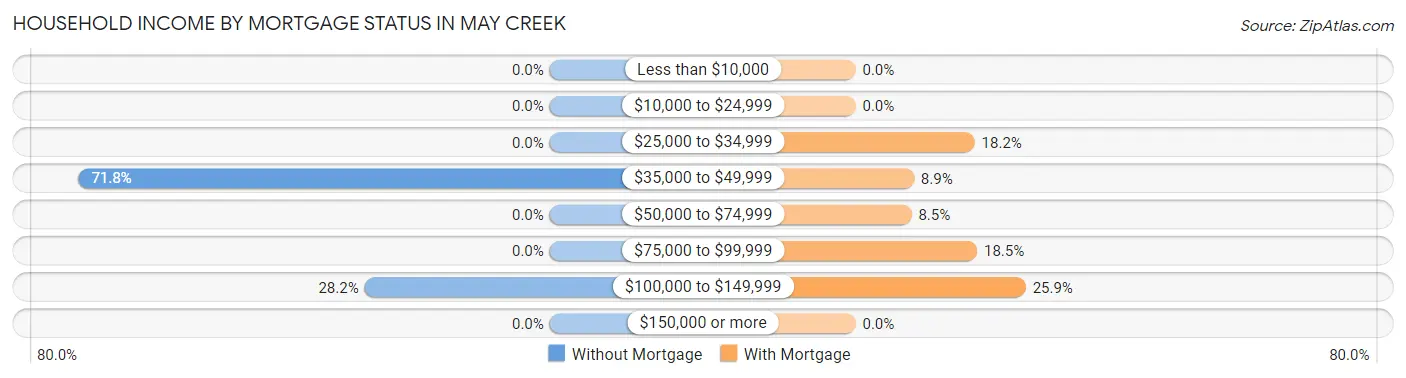
| Household Income | Without Mortgage | With Mortgage |
| Less than $10,000 | 0 (0.0%) | 0 (0.0%) |
| $10,000 to $24,999 | 0 (0.0%) | 0 (0.0%) |
| $25,000 to $34,999 | 0 (0.0%) | 49 (18.1%) |
| $35,000 to $49,999 | 28 (71.8%) | 24 (8.9%) |
| $50,000 to $74,999 | 0 (0.0%) | 23 (8.5%) |
| $75,000 to $99,999 | 0 (0.0%) | 50 (18.5%) |
| $100,000 to $149,999 | 11 (28.2%) | 70 (25.9%) |
| $150,000 or more | 0 (0.0%) | 0 (0.0%) |
| Total | 39 (100.0%) | 270 (100.0%) |
Property Value to Household Income Ratio in May Creek
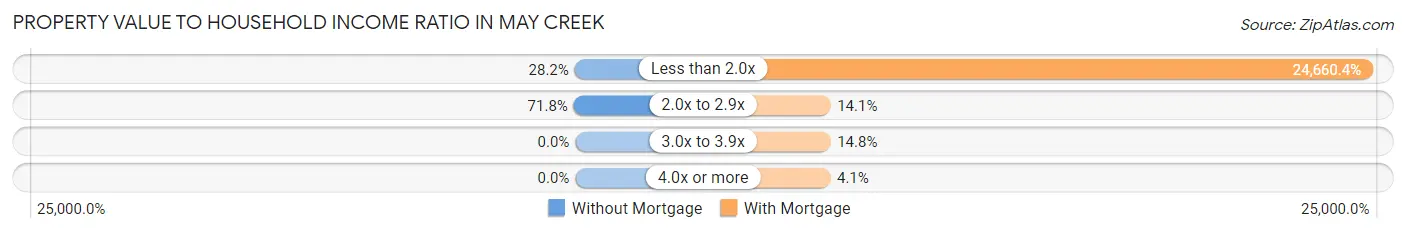
| Value-to-Income Ratio | Without Mortgage | With Mortgage |
| Less than 2.0x | 11 (28.2%) | 66,583 (24,660.4%) |
| 2.0x to 2.9x | 28 (71.8%) | 38 (14.1%) |
| 3.0x to 3.9x | 0 (0.0%) | 40 (14.8%) |
| 4.0x or more | 0 (0.0%) | 11 (4.1%) |
| Total | 39 (100.0%) | 270 (100.0%) |
Real Estate Taxes by Mortgage Status in May Creek
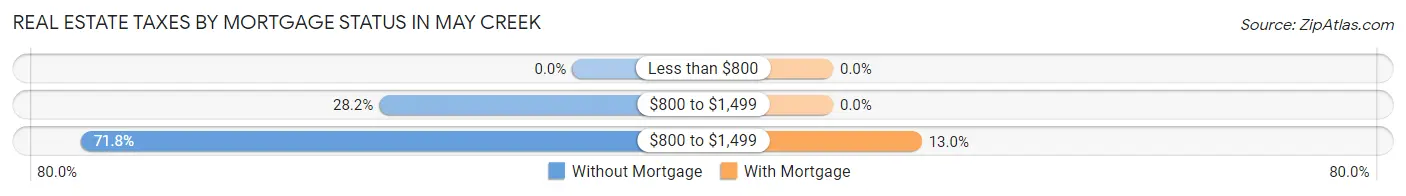
| Property Taxes | Without Mortgage | With Mortgage |
| Less than $800 | 0 (0.0%) | 0 (0.0%) |
| $800 to $1,499 | 11 (28.2%) | 0 (0.0%) |
| $800 to $1,499 | 28 (71.8%) | 35 (13.0%) |
| Total | 39 (100.0%) | 270 (100.0%) |
Health & Disability in May Creek
Health Insurance Coverage by Age in May Creek
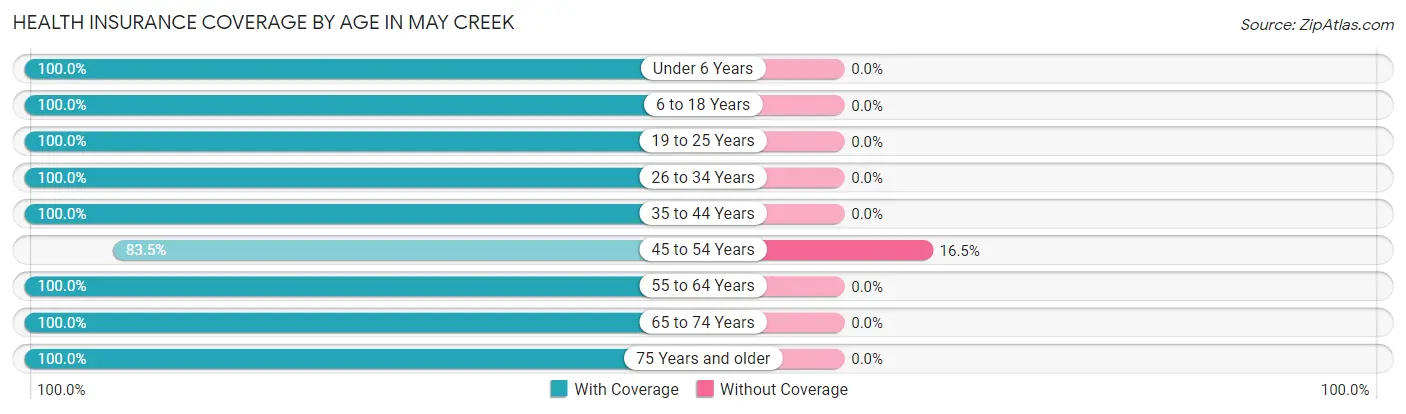
| Age Bracket | With Coverage | Without Coverage |
| Under 6 Years | 37 (100.0%) | 0 (0.0%) |
| 6 to 18 Years | 41 (100.0%) | 0 (0.0%) |
| 19 to 25 Years | 130 (100.0%) | 0 (0.0%) |
| 26 to 34 Years | 123 (100.0%) | 0 (0.0%) |
| 35 to 44 Years | 31 (100.0%) | 0 (0.0%) |
| 45 to 54 Years | 213 (83.5%) | 42 (16.5%) |
| 55 to 64 Years | 192 (100.0%) | 0 (0.0%) |
| 65 to 74 Years | 25 (100.0%) | 0 (0.0%) |
| 75 Years and older | 39 (100.0%) | 0 (0.0%) |
| Total | 831 (95.2%) | 42 (4.8%) |
Health Insurance Coverage by Citizenship Status in May Creek

| Citizenship Status | With Coverage | Without Coverage |
| Native Born | 37 (100.0%) | 0 (0.0%) |
| Foreign Born, Citizen | 41 (100.0%) | 0 (0.0%) |
| Foreign Born, not a Citizen | 130 (100.0%) | 0 (0.0%) |
Health Insurance Coverage by Household Income in May Creek
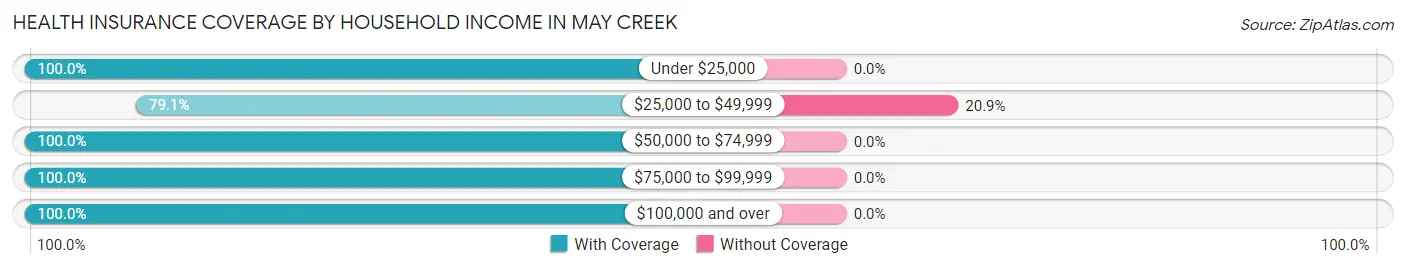
| Household Income | With Coverage | Without Coverage |
| Under $25,000 | 62 (100.0%) | 0 (0.0%) |
| $25,000 to $49,999 | 159 (79.1%) | 42 (20.9%) |
| $50,000 to $74,999 | 246 (100.0%) | 0 (0.0%) |
| $75,000 to $99,999 | 110 (100.0%) | 0 (0.0%) |
| $100,000 and over | 254 (100.0%) | 0 (0.0%) |
Public vs Private Health Insurance Coverage by Age in May Creek
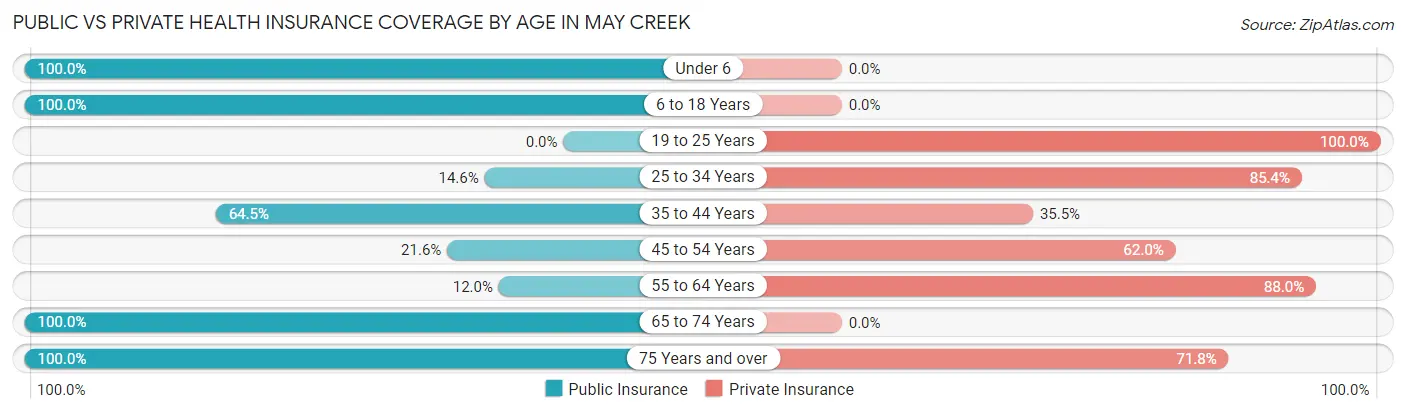
| Age Bracket | Public Insurance | Private Insurance |
| Under 6 | 37 (100.0%) | 0 (0.0%) |
| 6 to 18 Years | 41 (100.0%) | 0 (0.0%) |
| 19 to 25 Years | 0 (0.0%) | 130 (100.0%) |
| 25 to 34 Years | 18 (14.6%) | 105 (85.4%) |
| 35 to 44 Years | 20 (64.5%) | 11 (35.5%) |
| 45 to 54 Years | 55 (21.6%) | 158 (62.0%) |
| 55 to 64 Years | 23 (12.0%) | 169 (88.0%) |
| 65 to 74 Years | 25 (100.0%) | 0 (0.0%) |
| 75 Years and over | 39 (100.0%) | 28 (71.8%) |
| Total | 258 (29.5%) | 601 (68.8%) |
Disability Status by Sex by Age in May Creek
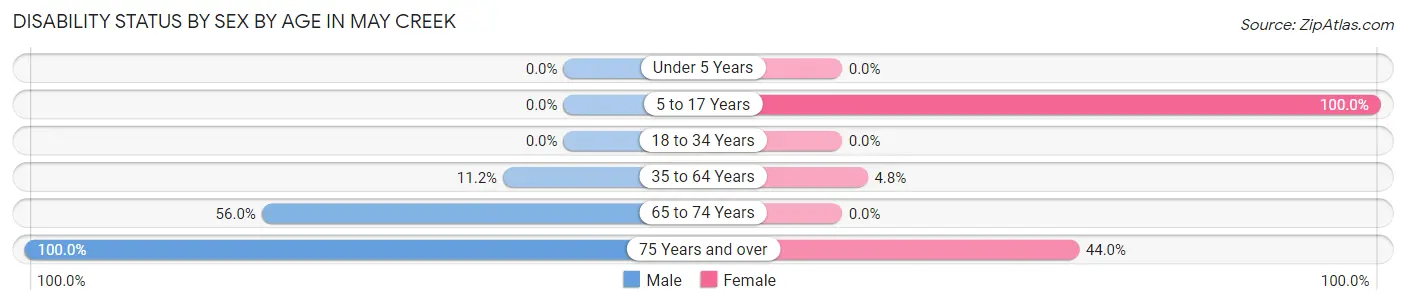
| Age Bracket | Male | Female |
| Under 5 Years | 0 (0.0%) | 0 (0.0%) |
| 5 to 17 Years | 0 (0.0%) | 20 (100.0%) |
| 18 to 34 Years | 0 (0.0%) | 0 (0.0%) |
| 35 to 64 Years | 23 (11.2%) | 13 (4.8%) |
| 65 to 74 Years | 14 (56.0%) | 0 (0.0%) |
| 75 Years and over | 14 (100.0%) | 11 (44.0%) |
Disability Class by Sex by Age in May Creek
Disability Class: Hearing Difficulty
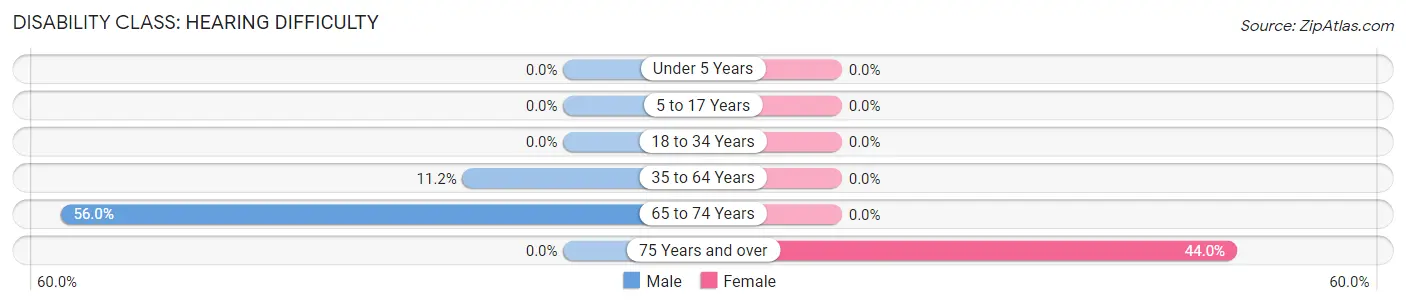
| Age Bracket | Male | Female |
| Under 5 Years | 0 (0.0%) | 0 (0.0%) |
| 5 to 17 Years | 0 (0.0%) | 0 (0.0%) |
| 18 to 34 Years | 0 (0.0%) | 0 (0.0%) |
| 35 to 64 Years | 23 (11.2%) | 0 (0.0%) |
| 65 to 74 Years | 14 (56.0%) | 0 (0.0%) |
| 75 Years and over | 0 (0.0%) | 11 (44.0%) |
Disability Class: Vision Difficulty
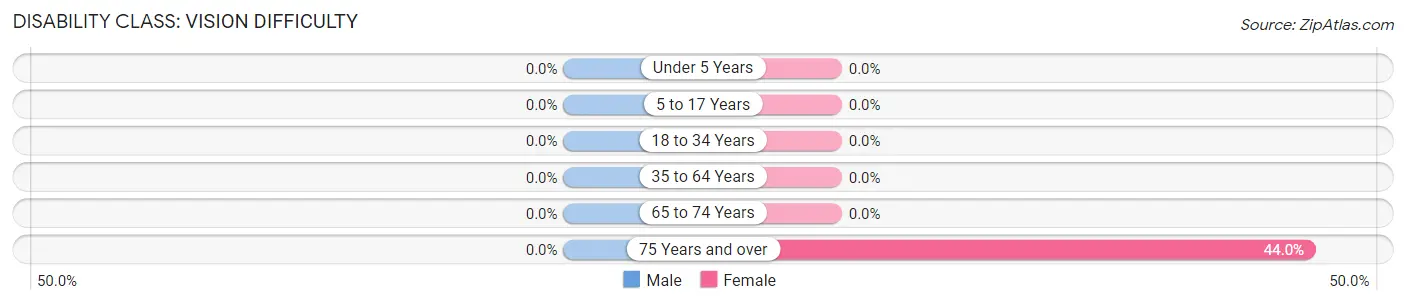
| Age Bracket | Male | Female |
| Under 5 Years | 0 (0.0%) | 0 (0.0%) |
| 5 to 17 Years | 0 (0.0%) | 0 (0.0%) |
| 18 to 34 Years | 0 (0.0%) | 0 (0.0%) |
| 35 to 64 Years | 0 (0.0%) | 0 (0.0%) |
| 65 to 74 Years | 0 (0.0%) | 0 (0.0%) |
| 75 Years and over | 0 (0.0%) | 11 (44.0%) |
Disability Class: Cognitive Difficulty
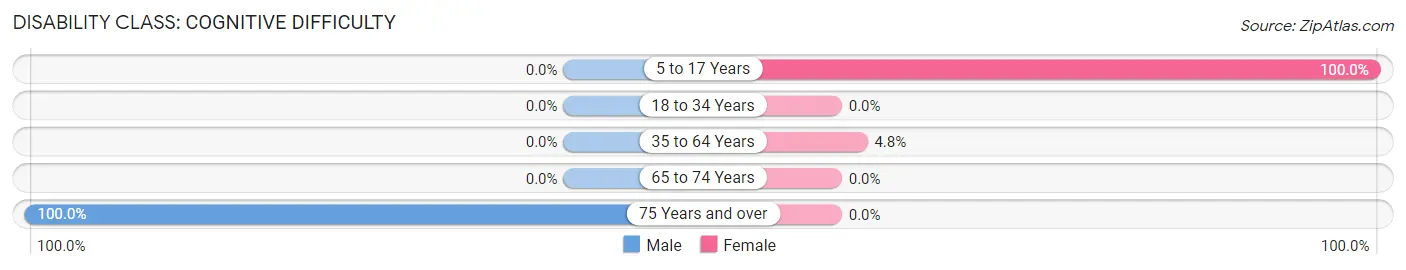
| Age Bracket | Male | Female |
| 5 to 17 Years | 0 (0.0%) | 20 (100.0%) |
| 18 to 34 Years | 0 (0.0%) | 0 (0.0%) |
| 35 to 64 Years | 0 (0.0%) | 13 (4.8%) |
| 65 to 74 Years | 0 (0.0%) | 0 (0.0%) |
| 75 Years and over | 14 (100.0%) | 0 (0.0%) |
Disability Class: Ambulatory Difficulty

| Age Bracket | Male | Female |
| 5 to 17 Years | 0 (0.0%) | 0 (0.0%) |
| 18 to 34 Years | 0 (0.0%) | 0 (0.0%) |
| 35 to 64 Years | 0 (0.0%) | 0 (0.0%) |
| 65 to 74 Years | 0 (0.0%) | 0 (0.0%) |
| 75 Years and over | 14 (100.0%) | 11 (44.0%) |
Disability Class: Self-Care Difficulty

| Age Bracket | Male | Female |
| 5 to 17 Years | 0 (0.0%) | 0 (0.0%) |
| 18 to 34 Years | 0 (0.0%) | 0 (0.0%) |
| 35 to 64 Years | 0 (0.0%) | 0 (0.0%) |
| 65 to 74 Years | 0 (0.0%) | 0 (0.0%) |
| 75 Years and over | 14 (100.0%) | 11 (44.0%) |
Technology Access in May Creek
Computing Device Access in May Creek
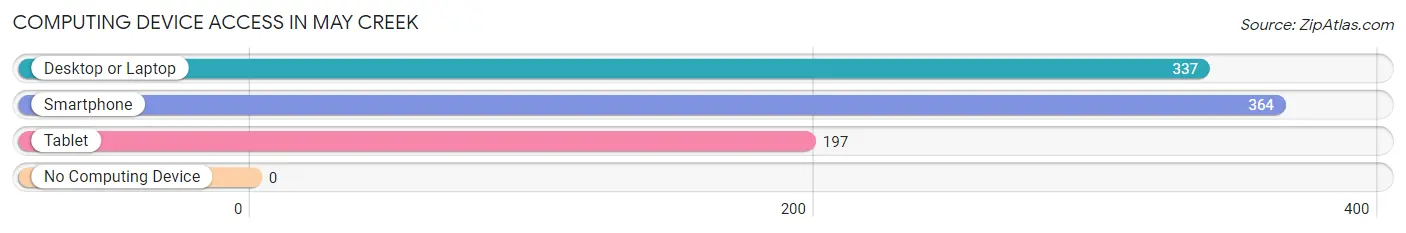
| Device Type | # Households | % Households |
| Desktop or Laptop | 337 | 92.6% |
| Smartphone | 364 | 100.0% |
| Tablet | 197 | 54.1% |
| No Computing Device | 0 | 0.0% |
| Total | 364 | 100.0% |
Internet Access in May Creek
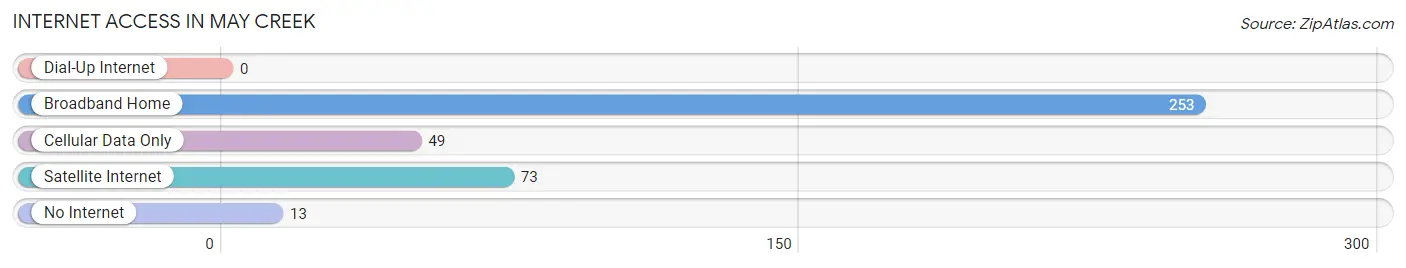
| Internet Type | # Households | % Households |
| Dial-Up Internet | 0 | 0.0% |
| Broadband Home | 253 | 69.5% |
| Cellular Data Only | 49 | 13.5% |
| Satellite Internet | 73 | 20.1% |
| No Internet | 13 | 3.6% |
| Total | 364 | 100.0% |
May Creek Summary
May Creek is a small unincorporated community located in King County, Washington, United States. It is situated in the foothills of the Cascade Mountains, approximately 25 miles east of Seattle. The community is located along the May Creek Valley, a tributary of the Snoqualmie River.
History
The May Creek area was first settled in the late 1800s by homesteaders who were attracted to the area by its abundant natural resources. The first settlers were primarily of Scandinavian descent, and the area was known as “Little Norway”. The community was officially established in 1891, when the first post office was opened.
The May Creek Valley was an important logging area in the early 1900s, and the community was home to several sawmills and logging camps. The area was also home to several coal mines, which provided employment for many of the local residents.
In the 1950s, the area began to experience rapid growth as Seattle’s population expanded. The May Creek Valley was developed for residential and commercial use, and the community grew to include several small businesses, churches, and schools.
Geography
May Creek is located in the foothills of the Cascade Mountains, approximately 25 miles east of Seattle. The community is situated in the May Creek Valley, a tributary of the Snoqualmie River. The valley is surrounded by steep hills and mountains, and is home to several small creeks and streams.
The climate in May Creek is mild and temperate, with warm summers and cool winters. The average annual temperature is around 50 degrees Fahrenheit, and the average annual precipitation is around 40 inches.
Economy
The economy of May Creek is largely based on the timber industry. The area is home to several sawmills and logging camps, and the local economy is heavily dependent on the timber industry.
In addition to the timber industry, May Creek is home to several small businesses, including restaurants, retail stores, and service providers. The community is also home to several churches and schools.
Demographics
As of the 2010 census, the population of May Creek was 1,845. The racial makeup of the community was 94.3% White, 0.7% African American, 0.7% Native American, 0.7% Asian, 0.2% Pacific Islander, and 2.6% from other races.
The median household income in May Creek was $50,938, and the median family income was $58,938. The per capita income was $25,938. The unemployment rate was 5.2%.
Conclusion
May Creek is a small unincorporated community located in King County, Washington, United States. It is situated in the foothills of the Cascade Mountains, approximately 25 miles east of Seattle. The community is located along the May Creek Valley, a tributary of the Snoqualmie River. The economy of May Creek is largely based on the timber industry, and the community is home to several small businesses, churches, and schools. As of the 2010 census, the population of May Creek was 1,845. The median household income in May Creek was $50,938, and the median family income was $58,938. The per capita income was $25,938. The unemployment rate was 5.2%.
Common Questions
What is Per Capita Income in May Creek?
Per Capita income in May Creek is $31,803.
What is the Median Family Income in May Creek?
Median Family Income in May Creek is $66,375.
What is the Median Household income in May Creek?
Median Household Income in May Creek is $60,375.
What is Inequality or Gini Index in May Creek?
Inequality or Gini Index in May Creek is 0.37.
What is the Total Population of May Creek?
Total Population of May Creek is 873.
What is the Total Male Population of May Creek?
Total Male Population of May Creek is 355.
What is the Total Female Population of May Creek?
Total Female Population of May Creek is 518.
What is the Ratio of Males per 100 Females in May Creek?
There are 68.53 Males per 100 Females in May Creek.
What is the Ratio of Females per 100 Males in May Creek?
There are 145.92 Females per 100 Males in May Creek.
What is the Median Population Age in May Creek?
Median Population Age in May Creek is 50.5 Years.
What is the Average Family Size in May Creek
Average Family Size in May Creek is 3.1 People.
What is the Average Household Size in May Creek
Average Household Size in May Creek is 2.4 People.
How Large is the Labor Force in May Creek?
There are 496 People in the Labor Forcein in May Creek.
What is the Percentage of People in the Labor Force in May Creek?
60.8% of People are in the Labor Force in May Creek.
What is the Unemployment Rate in May Creek?
Unemployment Rate in May Creek is 7.1%.