Cavalero, WA Map & Demographics
Cavalero Map
Cavalero Overview
$48,181
PER CAPITA INCOME
$138,851
AVG FAMILY INCOME
$138,693
AVG HOUSEHOLD INCOME
31.2%
WAGE / INCOME GAP [ % ]
68.8¢/ $1
WAGE / INCOME GAP [ $ ]
0.23
INEQUALITY / GINI INDEX
1,457
TOTAL POPULATION
877
MALE POPULATION
580
FEMALE POPULATION
151.21
MALES / 100 FEMALES
66.13
FEMALES / 100 MALES
34.3
MEDIAN AGE
3.5
AVG FAMILY SIZE
3.3
AVG HOUSEHOLD SIZE
771
LABOR FORCE [ PEOPLE ]
76.0%
PERCENT IN LABOR FORCE
Income in Cavalero
Income Overview in Cavalero
Per Capita Income in Cavalero is $48,181, while median incomes of families and households are $138,851 and $138,693 respectively.
| Characteristic | Number | Measure |
| Per Capita Income | 1,457 | $48,181 |
| Median Family Income | 402 | $138,851 |
| Mean Family Income | 402 | $162,674 |
| Median Household Income | 445 | $138,693 |
| Mean Household Income | 445 | $157,013 |
| Income Deficit | 402 | $0 |
| Wage / Income Gap (%) | 1,457 | 31.15% |
| Wage / Income Gap ($) | 1,457 | 68.85¢ per $1 |
| Gini / Inequality Index | 1,457 | 0.23 |
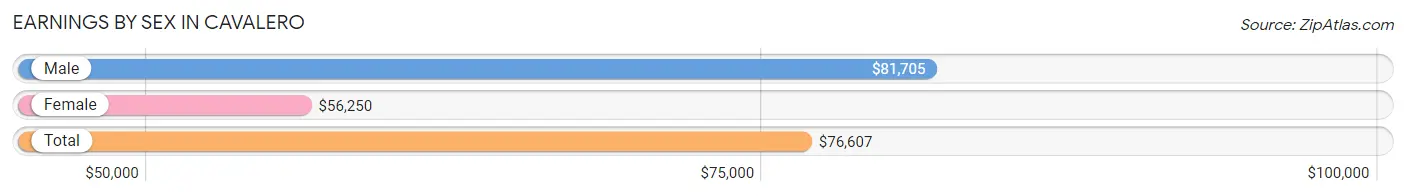
Earnings by Sex in Cavalero
Average Earnings in Cavalero are $76,607, $81,705 for men and $56,250 for women, a difference of 31.1%.
| Sex | Number | Average Earnings |
| Male | 509 (62.9%) | $81,705 |
| Female | 300 (37.1%) | $56,250 |
| Total | 809 (100.0%) | $76,607 |
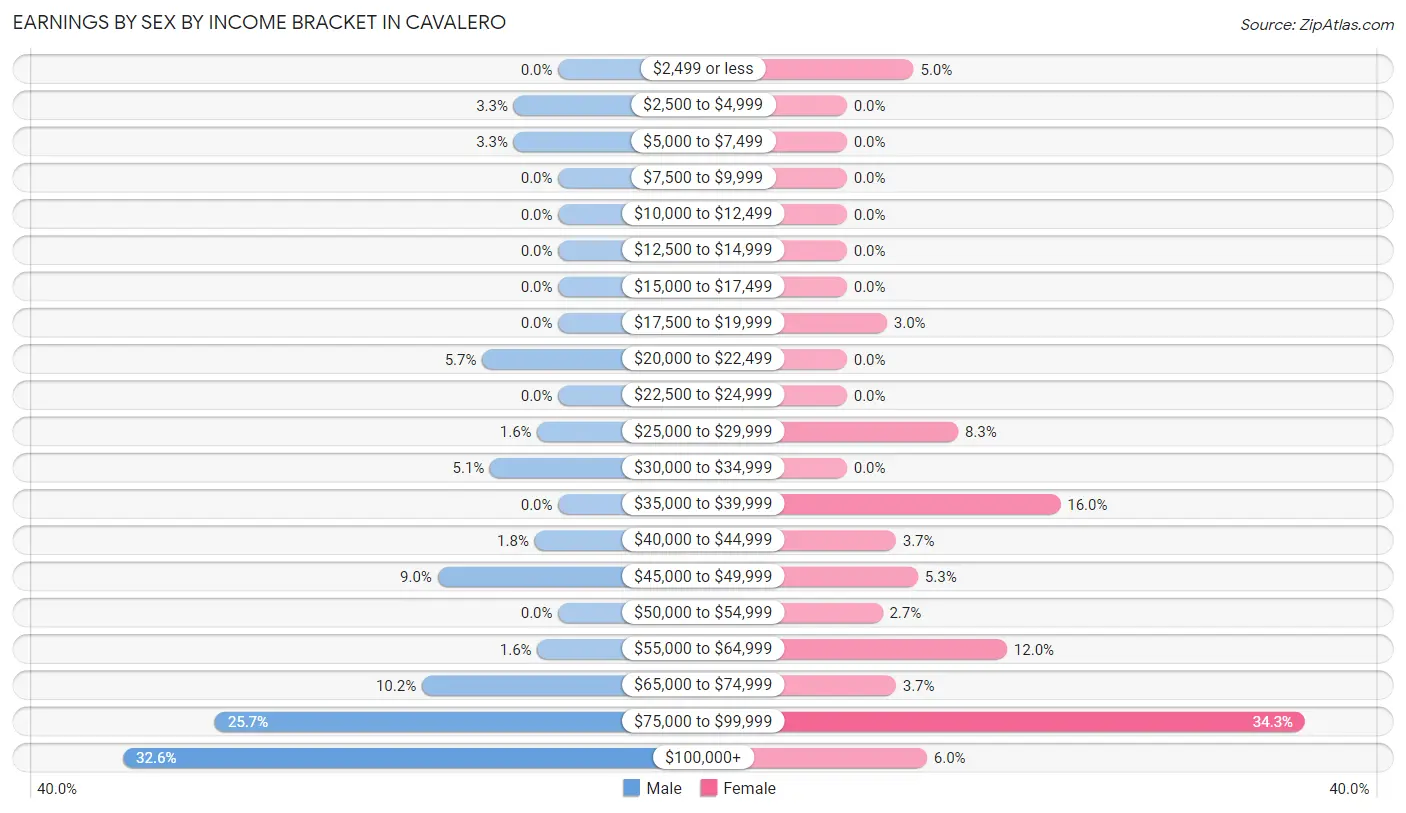
Earnings by Sex by Income Bracket in Cavalero
The most common earnings brackets in Cavalero are $100,000+ for men (166 | 32.6%) and $75,000 to $99,999 for women (103 | 34.3%).
| Income | Male | Female |
| $2,499 or less | 0 (0.0%) | 15 (5.0%) |
| $2,500 to $4,999 | 17 (3.3%) | 0 (0.0%) |
| $5,000 to $7,499 | 17 (3.3%) | 0 (0.0%) |
| $7,500 to $9,999 | 0 (0.0%) | 0 (0.0%) |
| $10,000 to $12,499 | 0 (0.0%) | 0 (0.0%) |
| $12,500 to $14,999 | 0 (0.0%) | 0 (0.0%) |
| $15,000 to $17,499 | 0 (0.0%) | 0 (0.0%) |
| $17,500 to $19,999 | 0 (0.0%) | 9 (3.0%) |
| $20,000 to $22,499 | 29 (5.7%) | 0 (0.0%) |
| $22,500 to $24,999 | 0 (0.0%) | 0 (0.0%) |
| $25,000 to $29,999 | 8 (1.6%) | 25 (8.3%) |
| $30,000 to $34,999 | 26 (5.1%) | 0 (0.0%) |
| $35,000 to $39,999 | 0 (0.0%) | 48 (16.0%) |
| $40,000 to $44,999 | 9 (1.8%) | 11 (3.7%) |
| $45,000 to $49,999 | 46 (9.0%) | 16 (5.3%) |
| $50,000 to $54,999 | 0 (0.0%) | 8 (2.7%) |
| $55,000 to $64,999 | 8 (1.6%) | 36 (12.0%) |
| $65,000 to $74,999 | 52 (10.2%) | 11 (3.7%) |
| $75,000 to $99,999 | 131 (25.7%) | 103 (34.3%) |
| $100,000+ | 166 (32.6%) | 18 (6.0%) |
| Total | 509 (100.0%) | 300 (100.0%) |
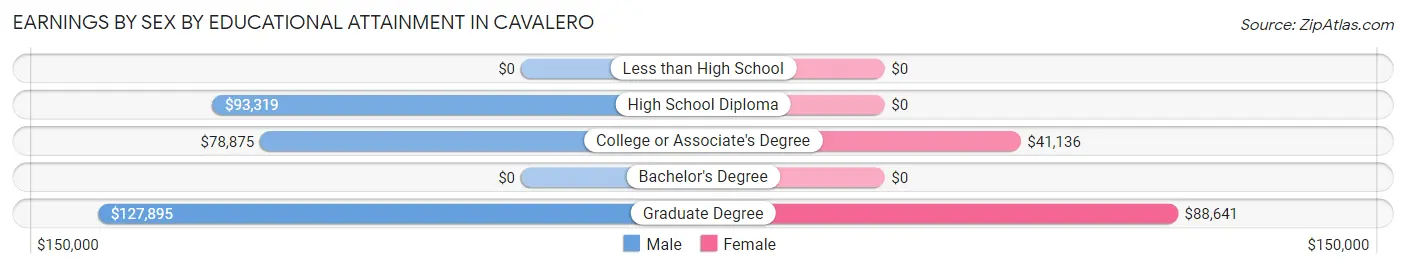
Earnings by Sex by Educational Attainment in Cavalero
Average earnings in Cavalero are $86,250 for men and $57,083 for women, a difference of 33.8%. Men with an educational attainment of graduate degree enjoy the highest average annual earnings of $127,895, while those with college or associate's degree education earn the least with $78,875. Women with an educational attainment of graduate degree earn the most with the average annual earnings of $88,641, while those with college or associate's degree education have the smallest earnings of $41,136.
| Educational Attainment | Male Income | Female Income |
| Less than High School | - | - |
| High School Diploma | $93,319 | $0 |
| College or Associate's Degree | $78,875 | $41,136 |
| Bachelor's Degree | - | - |
| Graduate Degree | $127,895 | $88,641 |
| Total | $86,250 | $57,083 |
Family Income in Cavalero
Family Income Brackets in Cavalero
According to the Cavalero family income data, there are 195 families falling into the $100,000 to $149,999 income range, which is the most common income bracket and makes up 48.5% of all families.
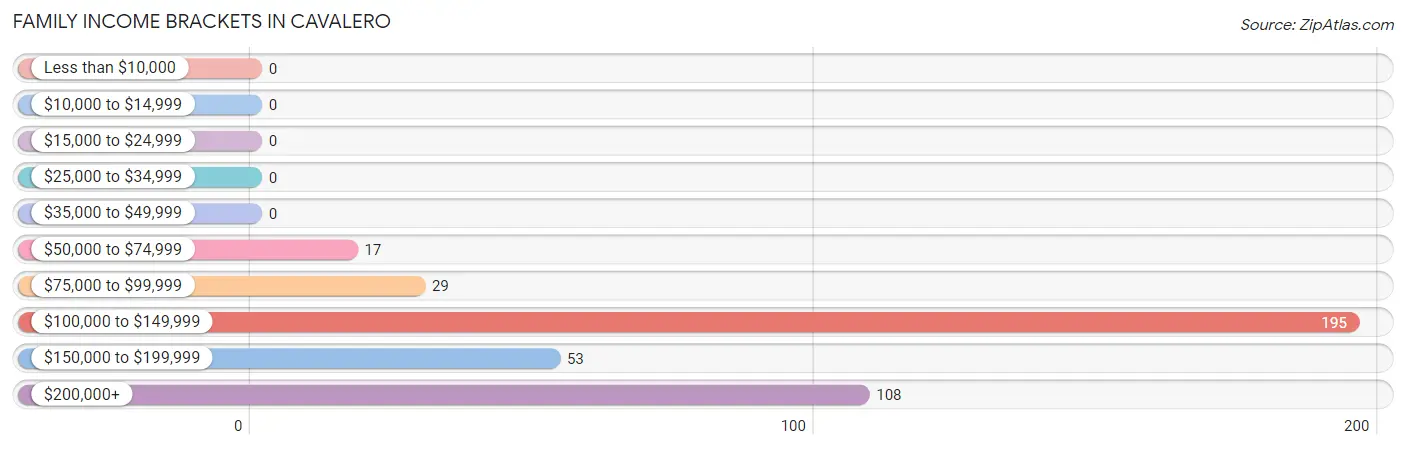
| Income Bracket | # Families | % Families |
| Less than $10,000 | 0 | 0.0% |
| $10,000 to $14,999 | 0 | 0.0% |
| $15,000 to $24,999 | 0 | 0.0% |
| $25,000 to $34,999 | 0 | 0.0% |
| $35,000 to $49,999 | 0 | 0.0% |
| $50,000 to $74,999 | 17 | 4.2% |
| $75,000 to $99,999 | 29 | 7.2% |
| $100,000 to $149,999 | 195 | 48.5% |
| $150,000 to $199,999 | 53 | 13.2% |
| $200,000+ | 108 | 26.9% |
Family Income by Famaliy Size in Cavalero
2-person families (144 | 35.8%) account for the highest median family income in Cavalero with $220,612 per family, while 2-person families (144 | 35.8%) have the highest median income of $110,306 per family member.
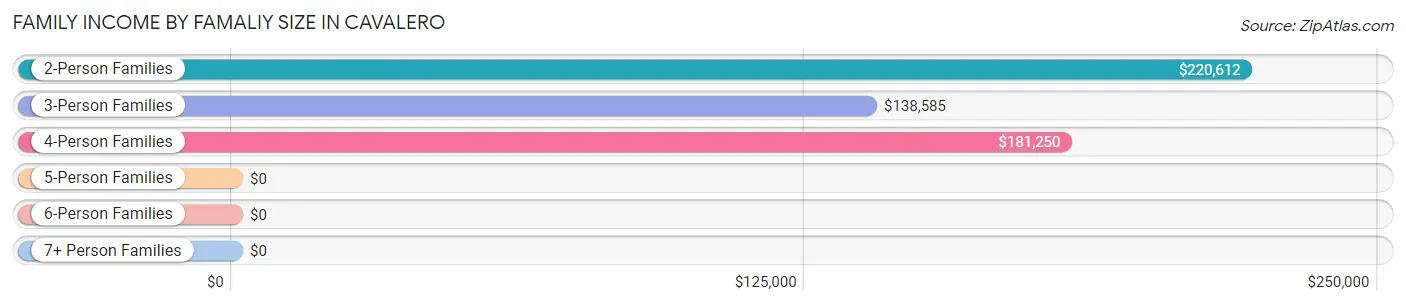
| Income Bracket | # Families | Median Income |
| 2-Person Families | 144 (35.8%) | $220,612 |
| 3-Person Families | 93 (23.1%) | $138,585 |
| 4-Person Families | 70 (17.4%) | $181,250 |
| 5-Person Families | 35 (8.7%) | $0 |
| 6-Person Families | 38 (9.5%) | $0 |
| 7+ Person Families | 22 (5.5%) | $0 |
| Total | 402 (100.0%) | $138,851 |
Family Income by Number of Earners in Cavalero
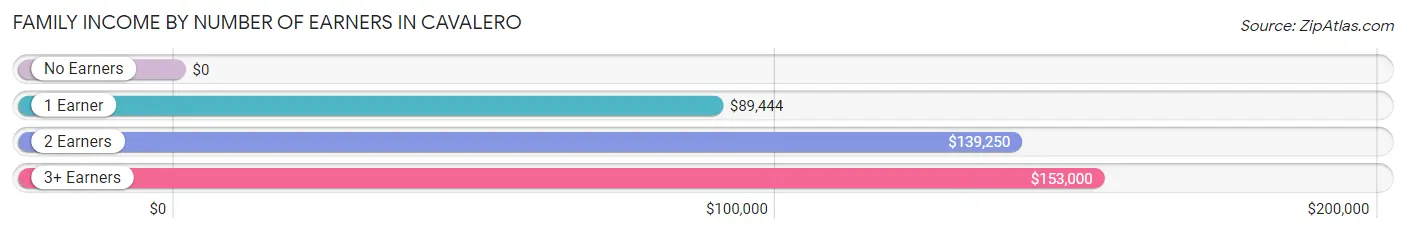
| Number of Earners | # Families | Median Income |
| No Earners | 17 (4.2%) | $0 |
| 1 Earner | 46 (11.4%) | $89,444 |
| 2 Earners | 291 (72.4%) | $139,250 |
| 3+ Earners | 48 (11.9%) | $153,000 |
| Total | 402 (100.0%) | $138,851 |
Household Income in Cavalero
Household Income Brackets in Cavalero
With 220 households falling in the category, the $100,000 to $149,999 income range is the most frequent in Cavalero, accounting for 49.4% of all households.
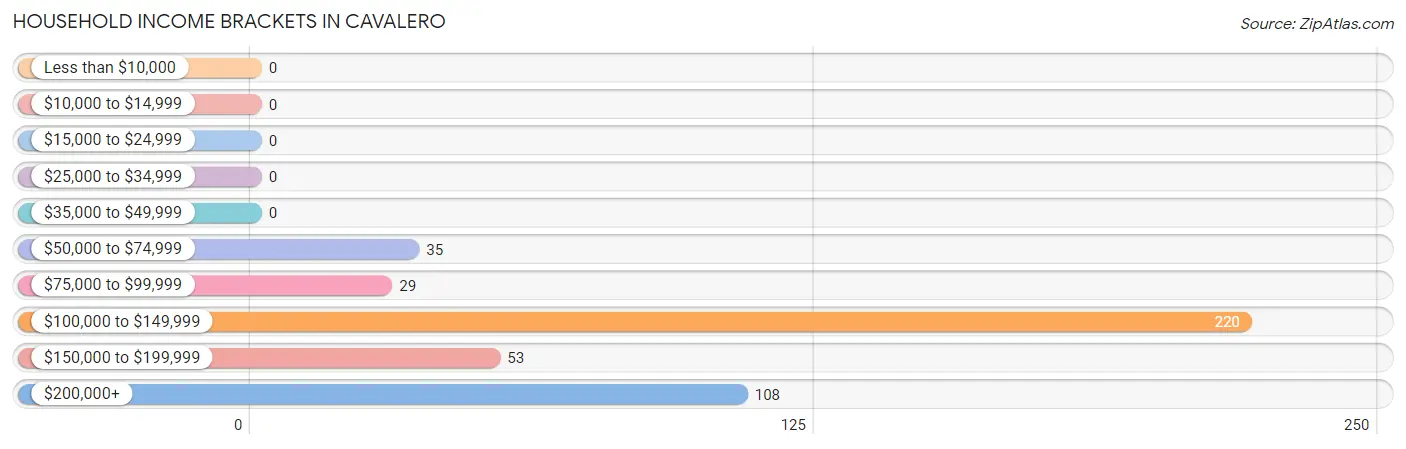
| Income Bracket | # Households | % Households |
| Less than $10,000 | 0 | 0.0% |
| $10,000 to $14,999 | 0 | 0.0% |
| $15,000 to $24,999 | 0 | 0.0% |
| $25,000 to $34,999 | 0 | 0.0% |
| $35,000 to $49,999 | 0 | 0.0% |
| $50,000 to $74,999 | 35 | 7.9% |
| $75,000 to $99,999 | 29 | 6.5% |
| $100,000 to $149,999 | 220 | 49.4% |
| $150,000 to $199,999 | 53 | 11.9% |
| $200,000+ | 108 | 24.3% |
Household Income by Householder Age in Cavalero
The median household income in Cavalero is $138,693, with the highest median household income of $144,063 found in the 45 to 64 years age bracket for the primary householder. A total of 130 households (29.2%) fall into this category.
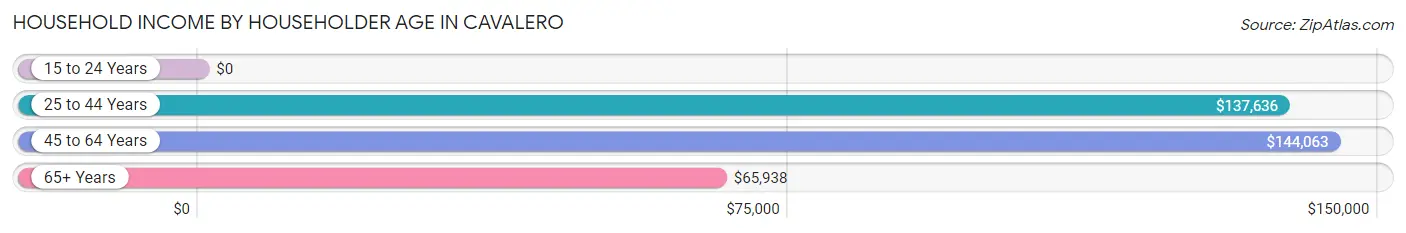
| Income Bracket | # Households | Median Income |
| 15 to 24 Years | 0 (0.0%) | $0 |
| 25 to 44 Years | 273 (61.4%) | $137,636 |
| 45 to 64 Years | 130 (29.2%) | $144,063 |
| 65+ Years | 42 (9.4%) | $65,938 |
| Total | 445 (100.0%) | $138,693 |
Poverty in Cavalero
Income Below Poverty by Sex and Age in Cavalero
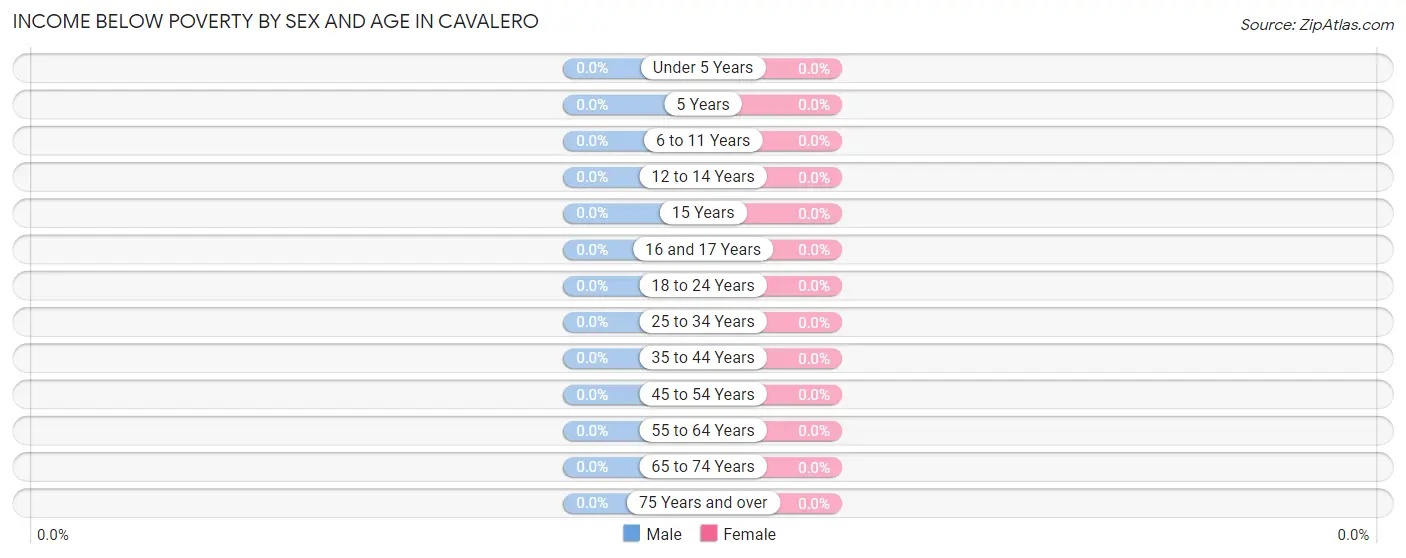
| Age Bracket | Male | Female |
| Under 5 Years | 0 (0.0%) | 0 (0.0%) |
| 5 Years | 0 (0.0%) | 0 (0.0%) |
| 6 to 11 Years | 0 (0.0%) | 0 (0.0%) |
| 12 to 14 Years | 0 (0.0%) | 0 (0.0%) |
| 15 Years | 0 (0.0%) | 0 (0.0%) |
| 16 and 17 Years | 0 (0.0%) | 0 (0.0%) |
| 18 to 24 Years | 0 (0.0%) | 0 (0.0%) |
| 25 to 34 Years | 0 (0.0%) | 0 (0.0%) |
| 35 to 44 Years | 0 (0.0%) | 0 (0.0%) |
| 45 to 54 Years | 0 (0.0%) | 0 (0.0%) |
| 55 to 64 Years | 0 (0.0%) | 0 (0.0%) |
| 65 to 74 Years | 0 (0.0%) | 0 (0.0%) |
| 75 Years and over | 0 (0.0%) | 0 (0.0%) |
| Total | 0 (0.0%) | 0 (0.0%) |
Income Above Poverty by Sex and Age in Cavalero
According to the poverty statistics in Cavalero, males aged under 5 years and females aged under 5 years are the age groups that are most secure financially, with 100.0% of males and 100.0% of females in these age groups living above the poverty line.
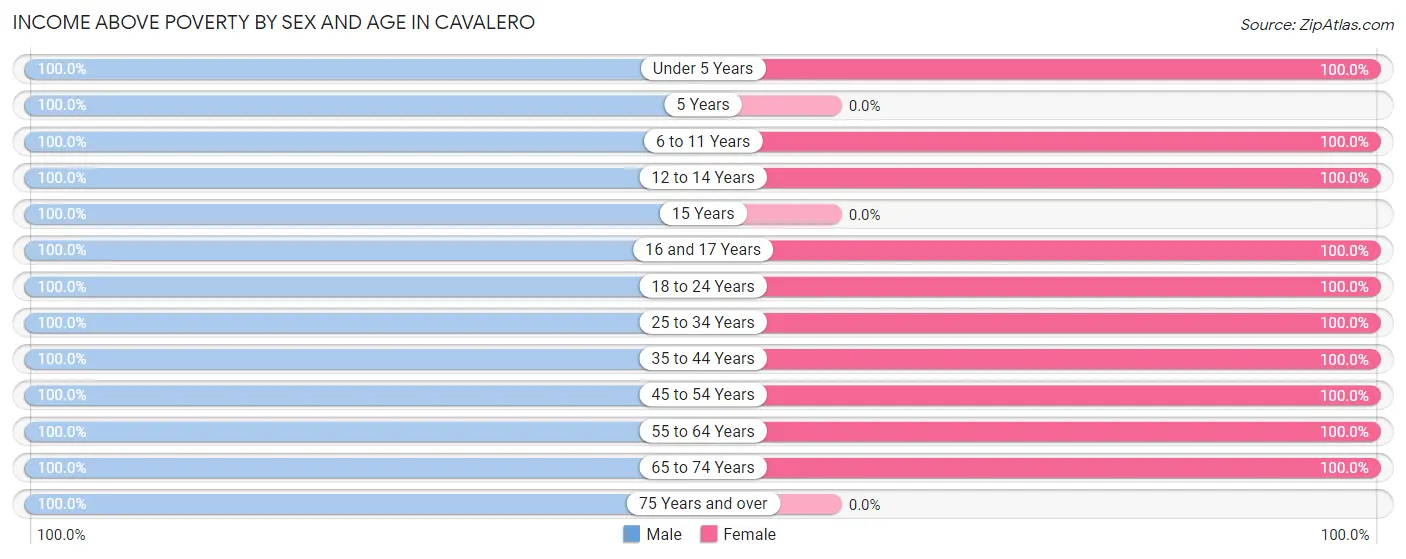
| Age Bracket | Male | Female |
| Under 5 Years | 139 (100.0%) | 68 (100.0%) |
| 5 Years | 16 (100.0%) | 0 (0.0%) |
| 6 to 11 Years | 50 (100.0%) | 26 (100.0%) |
| 12 to 14 Years | 92 (100.0%) | 45 (100.0%) |
| 15 Years | 7 (100.0%) | 0 (0.0%) |
| 16 and 17 Years | 63 (100.0%) | 24 (100.0%) |
| 18 to 24 Years | 12 (100.0%) | 14 (100.0%) |
| 25 to 34 Years | 86 (100.0%) | 130 (100.0%) |
| 35 to 44 Years | 222 (100.0%) | 155 (100.0%) |
| 45 to 54 Years | 91 (100.0%) | 65 (100.0%) |
| 55 to 64 Years | 47 (100.0%) | 29 (100.0%) |
| 65 to 74 Years | 26 (100.0%) | 24 (100.0%) |
| 75 Years and over | 26 (100.0%) | 0 (0.0%) |
| Total | 877 (100.0%) | 580 (100.0%) |
Income Below Poverty Among Married-Couple Families in Cavalero
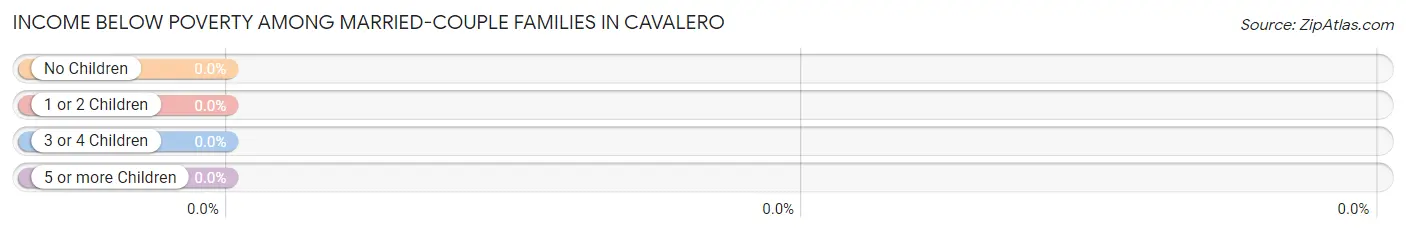
| Children | Above Poverty | Below Poverty |
| No Children | 150 (100.0%) | 0 (0.0%) |
| 1 or 2 Children | 140 (100.0%) | 0 (0.0%) |
| 3 or 4 Children | 85 (100.0%) | 0 (0.0%) |
| 5 or more Children | 0 (0.0%) | 0 (0.0%) |
| Total | 375 (100.0%) | 0 (0.0%) |
Income Below Poverty Among Single-Parent Households in Cavalero
| Children | Single Father | Single Mother |
| No Children | 0 (0.0%) | 0 (0.0%) |
| 1 or 2 Children | 0 (0.0%) | 0 (0.0%) |
| 3 or 4 Children | 0 (0.0%) | 0 (0.0%) |
| 5 or more Children | 0 (0.0%) | 0 (0.0%) |
| Total | 0 (0.0%) | 0 (0.0%) |
Income Below Poverty Among Married-Couple vs Single-Parent Households in Cavalero
| Children | Married-Couple Families | Single-Parent Households |
| No Children | 0 (0.0%) | 0 (0.0%) |
| 1 or 2 Children | 0 (0.0%) | 0 (0.0%) |
| 3 or 4 Children | 0 (0.0%) | 0 (0.0%) |
| 5 or more Children | 0 (0.0%) | 0 (0.0%) |
| Total | 0 (0.0%) | 0 (0.0%) |
Race in Cavalero
The most populous races in Cavalero are White / Caucasian (1,352 | 92.8%), Hispanic or Latino (100 | 6.9%), and Two or more Races (73 | 5.0%).
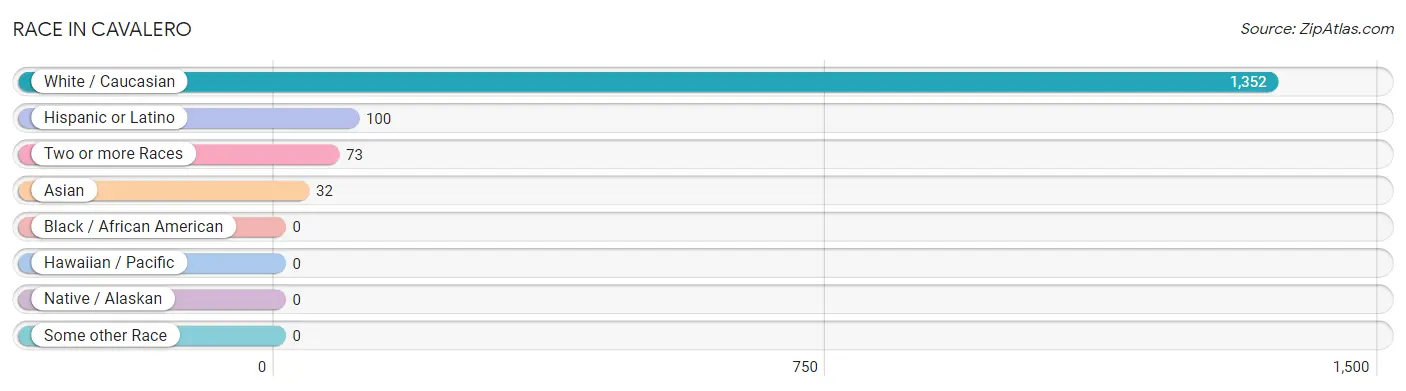
| Race | # Population | % Population |
| Asian | 32 | 2.2% |
| Black / African American | 0 | 0.0% |
| Hawaiian / Pacific | 0 | 0.0% |
| Hispanic or Latino | 100 | 6.9% |
| Native / Alaskan | 0 | 0.0% |
| White / Caucasian | 1,352 | 92.8% |
| Two or more Races | 73 | 5.0% |
| Some other Race | 0 | 0.0% |
| Total | 1,457 | 100.0% |
Ancestry in Cavalero
The most populous ancestries reported in Cavalero are English (232 | 15.9%), Norwegian (170 | 11.7%), Italian (168 | 11.5%), Russian (168 | 11.5%), and Irish (147 | 10.1%), together accounting for 60.7% of all Cavalero residents.
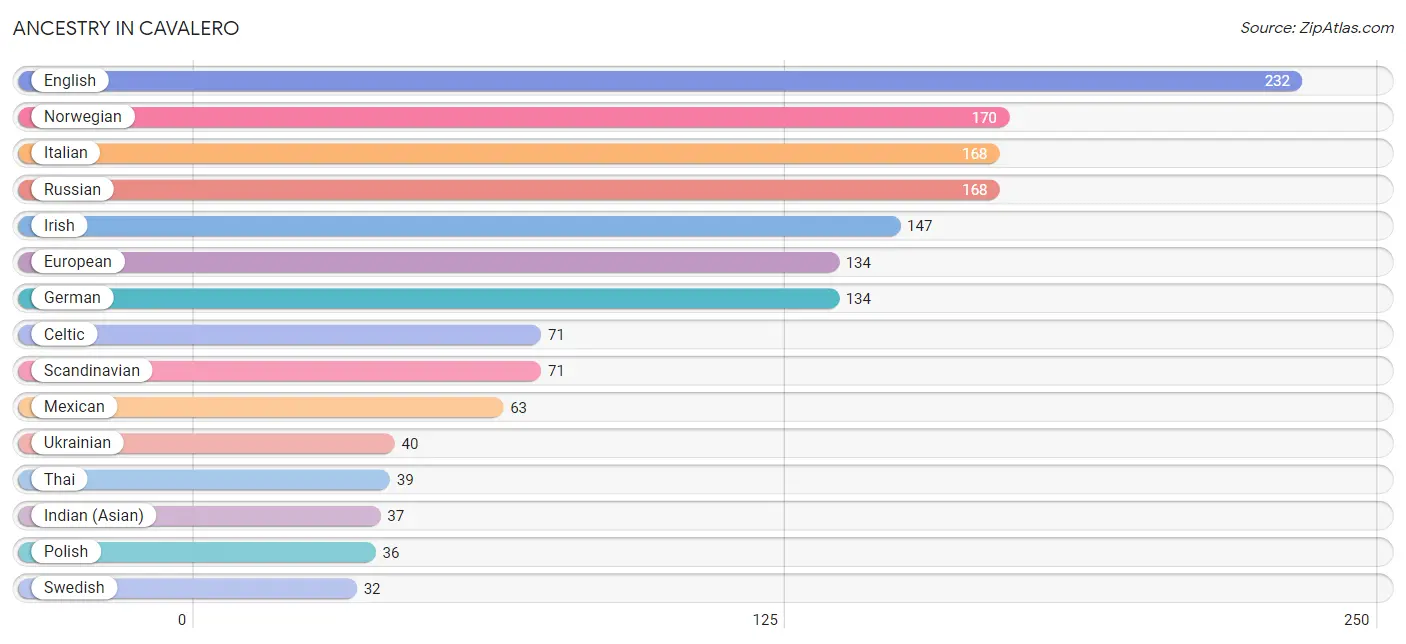
| Ancestry | # Population | % Population |
| American | 8 | 0.5% |
| British | 20 | 1.4% |
| Celtic | 71 | 4.9% |
| Chilean | 16 | 1.1% |
| Dutch | 26 | 1.8% |
| English | 232 | 15.9% |
| European | 134 | 9.2% |
| Finnish | 10 | 0.7% |
| French | 21 | 1.4% |
| German | 134 | 9.2% |
| Indian (Asian) | 37 | 2.5% |
| Irish | 147 | 10.1% |
| Italian | 168 | 11.5% |
| Korean | 29 | 2.0% |
| Lithuanian | 8 | 0.5% |
| Macedonian | 8 | 0.5% |
| Mexican | 63 | 4.3% |
| Northern European | 19 | 1.3% |
| Norwegian | 170 | 11.7% |
| Polish | 36 | 2.5% |
| Russian | 168 | 11.5% |
| Scandinavian | 71 | 4.9% |
| South American | 16 | 1.1% |
| Swedish | 32 | 2.2% |
| Thai | 39 | 2.7% |
| Ukrainian | 40 | 2.8% | View All 26 Rows |
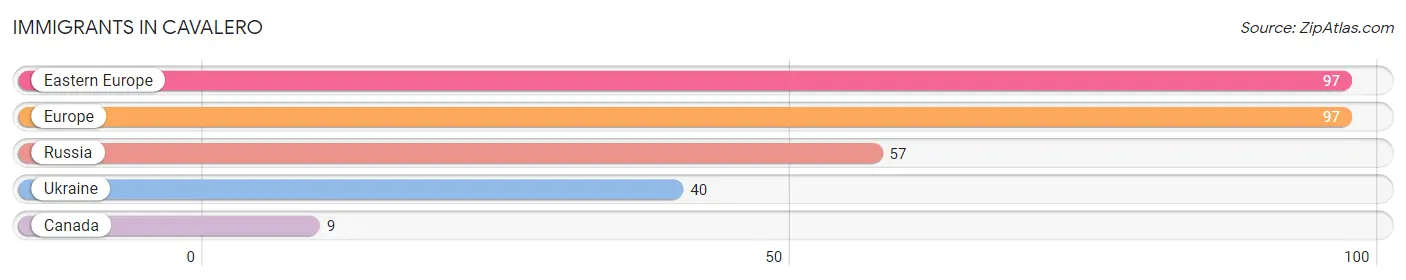
Immigrants in Cavalero
The most numerous immigrant groups reported in Cavalero came from Eastern Europe (97 | 6.7%), Europe (97 | 6.7%), Russia (57 | 3.9%), Ukraine (40 | 2.8%), and Canada (9 | 0.6%), together accounting for 20.6% of all Cavalero residents.
| Immigration Origin | # Population | % Population |
| Canada | 9 | 0.6% |
| Eastern Europe | 97 | 6.7% |
| Europe | 97 | 6.7% |
| Russia | 57 | 3.9% |
| Ukraine | 40 | 2.8% | View All 5 Rows |
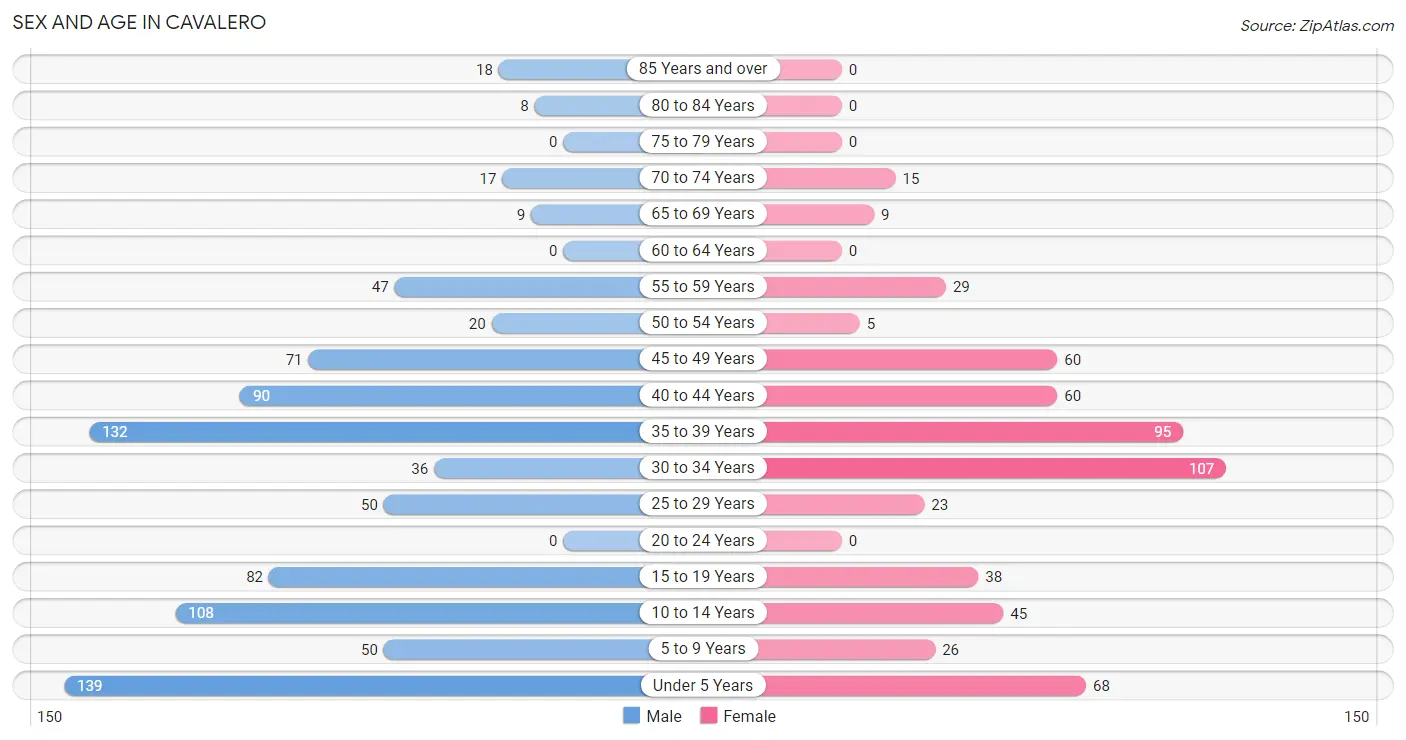
Sex and Age in Cavalero
Sex and Age in Cavalero
The most populous age groups in Cavalero are Under 5 Years (139 | 15.9%) for men and 30 to 34 Years (107 | 18.4%) for women.
| Age Bracket | Male | Female |
| Under 5 Years | 139 (15.9%) | 68 (11.7%) |
| 5 to 9 Years | 50 (5.7%) | 26 (4.5%) |
| 10 to 14 Years | 108 (12.3%) | 45 (7.8%) |
| 15 to 19 Years | 82 (9.3%) | 38 (6.6%) |
| 20 to 24 Years | 0 (0.0%) | 0 (0.0%) |
| 25 to 29 Years | 50 (5.7%) | 23 (4.0%) |
| 30 to 34 Years | 36 (4.1%) | 107 (18.4%) |
| 35 to 39 Years | 132 (15.0%) | 95 (16.4%) |
| 40 to 44 Years | 90 (10.3%) | 60 (10.3%) |
| 45 to 49 Years | 71 (8.1%) | 60 (10.3%) |
| 50 to 54 Years | 20 (2.3%) | 5 (0.9%) |
| 55 to 59 Years | 47 (5.4%) | 29 (5.0%) |
| 60 to 64 Years | 0 (0.0%) | 0 (0.0%) |
| 65 to 69 Years | 9 (1.0%) | 9 (1.5%) |
| 70 to 74 Years | 17 (1.9%) | 15 (2.6%) |
| 75 to 79 Years | 0 (0.0%) | 0 (0.0%) |
| 80 to 84 Years | 8 (0.9%) | 0 (0.0%) |
| 85 Years and over | 18 (2.1%) | 0 (0.0%) |
| Total | 877 (100.0%) | 580 (100.0%) |
Families and Households in Cavalero
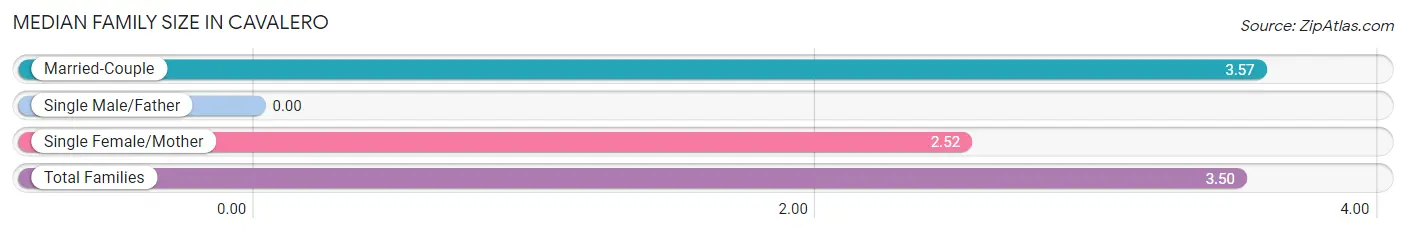
Median Family Size in Cavalero
| Family Type | # Families | Family Size |
| Married-Couple | 375 (93.3%) | 3.57 |
| Single Male/Father | 0 (0.0%) | - |
| Single Female/Mother | 27 (6.7%) | 2.52 |
| Total Families | 402 (100.0%) | 3.50 |
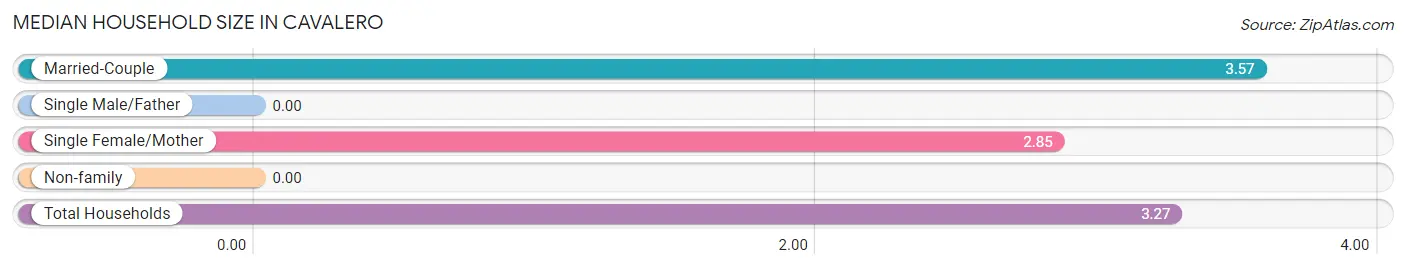
Median Household Size in Cavalero
| Household Type | # Households | Household Size |
| Married-Couple | 375 (84.3%) | 3.57 |
| Single Male/Father | 0 (0.0%) | - |
| Single Female/Mother | 27 (6.1%) | 2.85 |
| Non-family | 43 (9.7%) | - |
| Total Households | 445 (100.0%) | 3.27 |
Household Size by Marriage Status in Cavalero
Out of a total of 445 households in Cavalero, 402 (90.3%) are family households, while 43 (9.7%) are nonfamily households. The most numerous type of family households are 2-person households, comprising 135, and the most common type of nonfamily households are 1-person households, comprising 43.
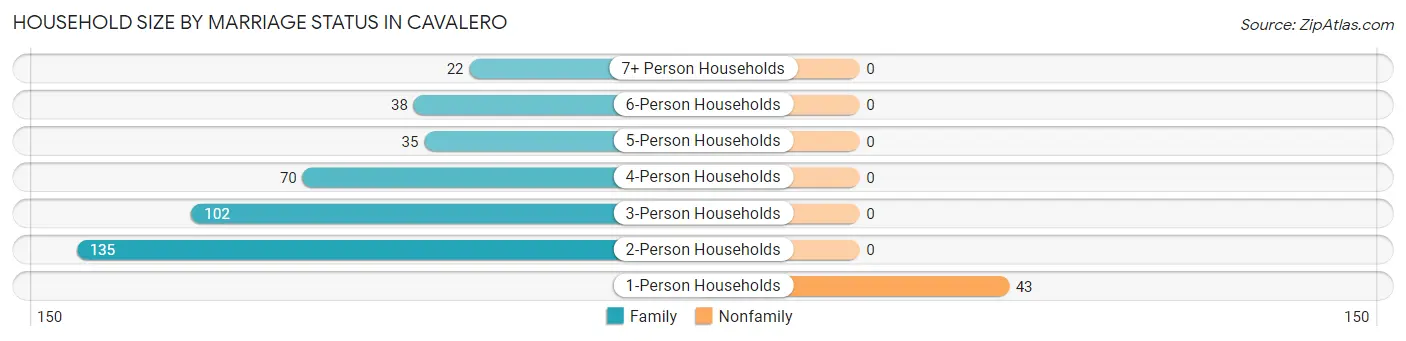
| Household Size | Family Households | Nonfamily Households |
| 1-Person Households | - | 43 (9.7%) |
| 2-Person Households | 135 (30.3%) | 0 (0.0%) |
| 3-Person Households | 102 (22.9%) | 0 (0.0%) |
| 4-Person Households | 70 (15.7%) | 0 (0.0%) |
| 5-Person Households | 35 (7.9%) | 0 (0.0%) |
| 6-Person Households | 38 (8.5%) | 0 (0.0%) |
| 7+ Person Households | 22 (4.9%) | 0 (0.0%) |
| Total | 402 (90.3%) | 43 (9.7%) |
Female Fertility in Cavalero
Fertility by Age in Cavalero
Average fertility rate in Cavalero is 47.0 births per 1,000 women. Women in the age bracket of 20 to 34 years have the highest fertility rate with 138.0 births per 1,000 women. Women in the age bracket of 20 to 34 years acount for 100.0% of all women with births.
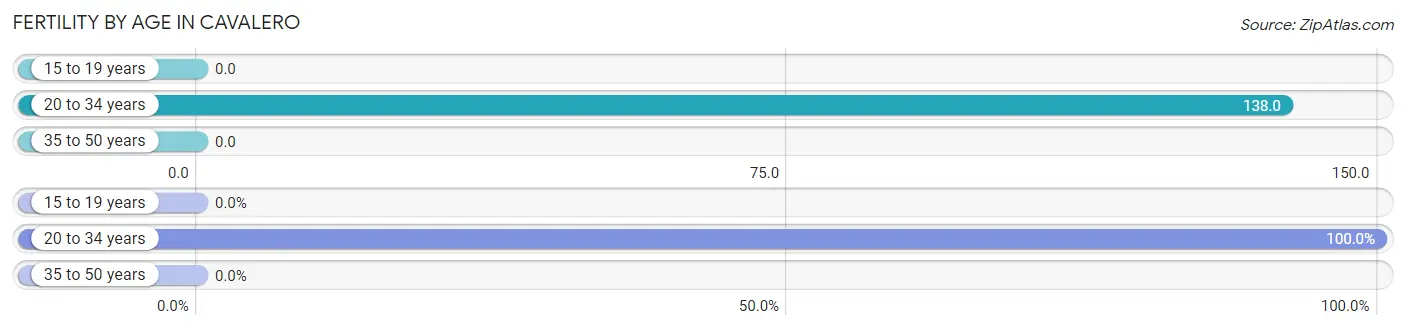
| Age Bracket | Women with Births | Births / 1,000 Women |
| 15 to 19 years | 0 (0.0%) | 0.0 |
| 20 to 34 years | 18 (100.0%) | 138.0 |
| 35 to 50 years | 0 (0.0%) | 0.0 |
| Total | 18 (100.0%) | 47.0 |
Fertility by Age by Marriage Status in Cavalero
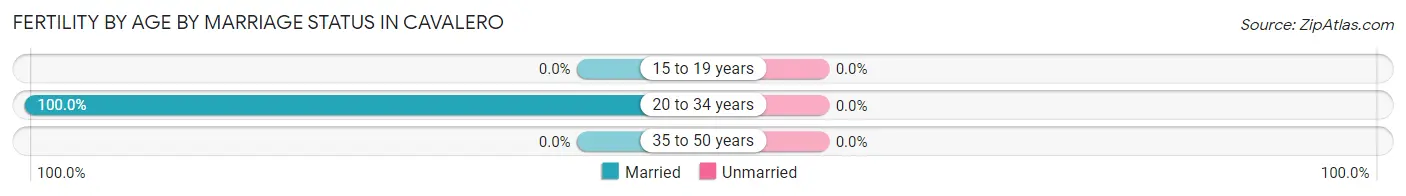
| Age Bracket | Married | Unmarried |
| 15 to 19 years | 0 (0.0%) | 0 (0.0%) |
| 20 to 34 years | 18 (100.0%) | 0 (0.0%) |
| 35 to 50 years | 0 (0.0%) | 0 (0.0%) |
| Total | 18 (100.0%) | 0 (0.0%) |
Fertility by Education in Cavalero
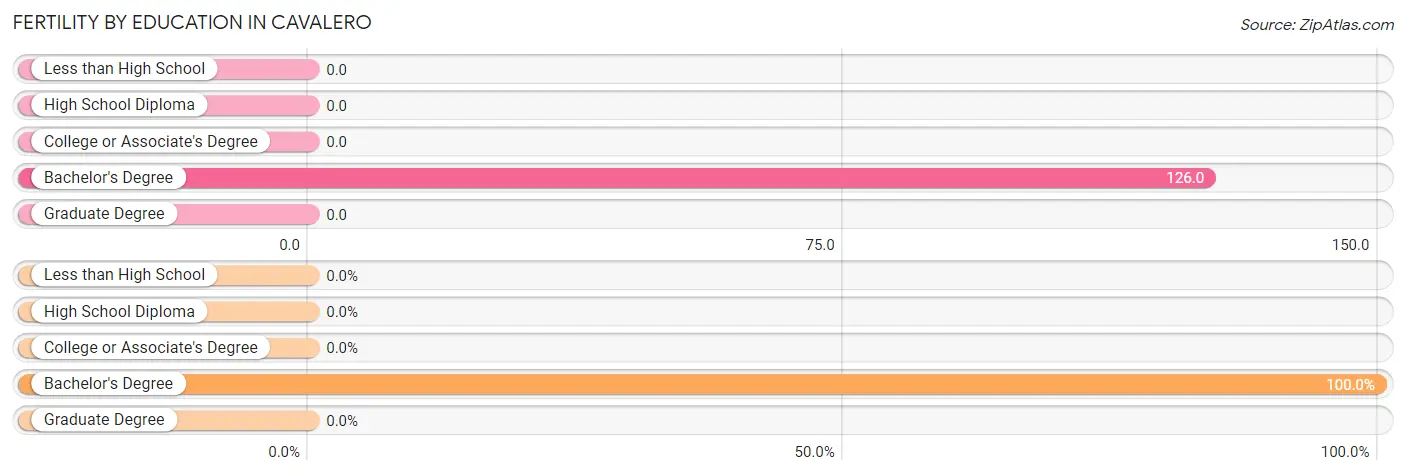
| Educational Attainment | Women with Births | Births / 1,000 Women |
| Less than High School | 0 (0.0%) | 0.0 |
| High School Diploma | 0 (0.0%) | 0.0 |
| College or Associate's Degree | 0 (0.0%) | 0.0 |
| Bachelor's Degree | 18 (100.0%) | 126.0 |
| Graduate Degree | 0 (0.0%) | 0.0 |
| Total | 18 (100.0%) | 47.0 |
Fertility by Education by Marriage Status in Cavalero
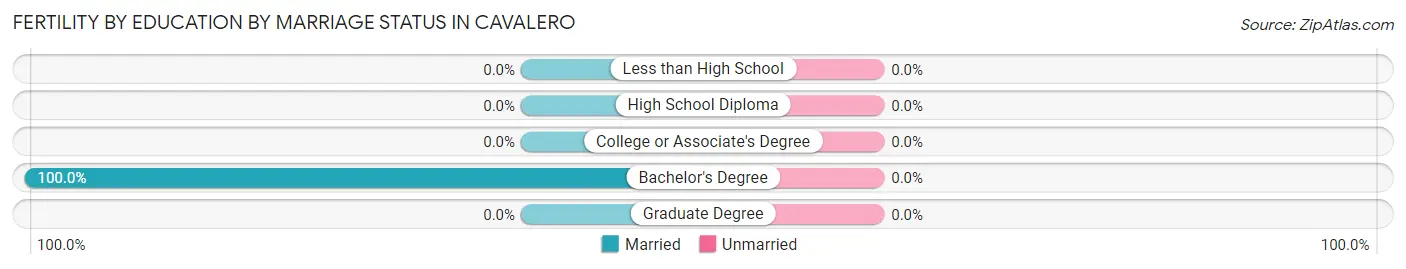
| Educational Attainment | Married | Unmarried |
| Less than High School | 0 (0.0%) | 0 (0.0%) |
| High School Diploma | 0 (0.0%) | 0 (0.0%) |
| College or Associate's Degree | 0 (0.0%) | 0 (0.0%) |
| Bachelor's Degree | 18 (100.0%) | 0 (0.0%) |
| Graduate Degree | 0 (0.0%) | 0 (0.0%) |
| Total | 18 (100.0%) | 0 (0.0%) |
Employment Characteristics in Cavalero
Employment by Class of Employer in Cavalero
Among the 771 employed individuals in Cavalero, private company employees (517 | 67.1%), local government employees (112 | 14.5%), and not-for-profit organizations (67 | 8.7%) make up the most common classes of employment.
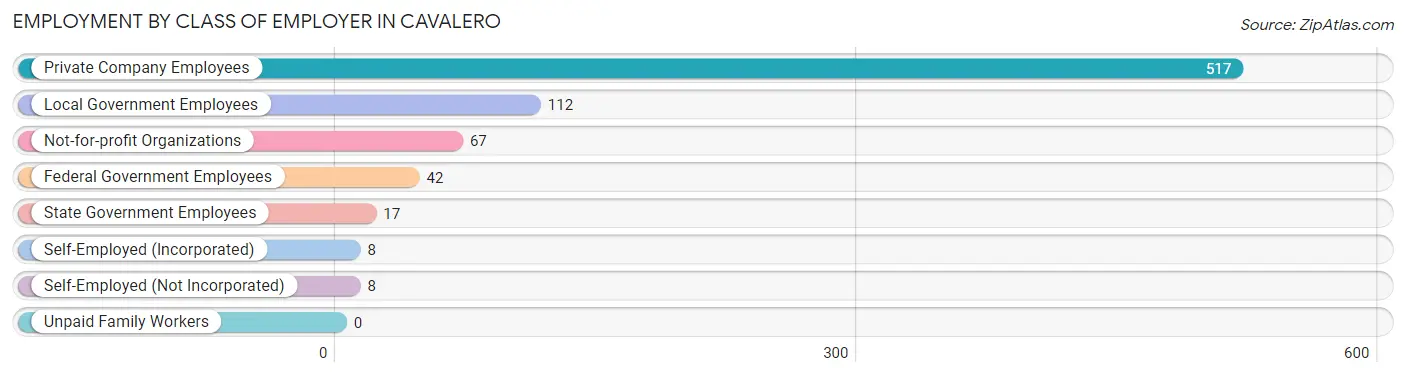
| Employer Class | # Employees | % Employees |
| Private Company Employees | 517 | 67.1% |
| Self-Employed (Incorporated) | 8 | 1.0% |
| Self-Employed (Not Incorporated) | 8 | 1.0% |
| Not-for-profit Organizations | 67 | 8.7% |
| Local Government Employees | 112 | 14.5% |
| State Government Employees | 17 | 2.2% |
| Federal Government Employees | 42 | 5.4% |
| Unpaid Family Workers | 0 | 0.0% |
| Total | 771 | 100.0% |
Employment Status by Age in Cavalero
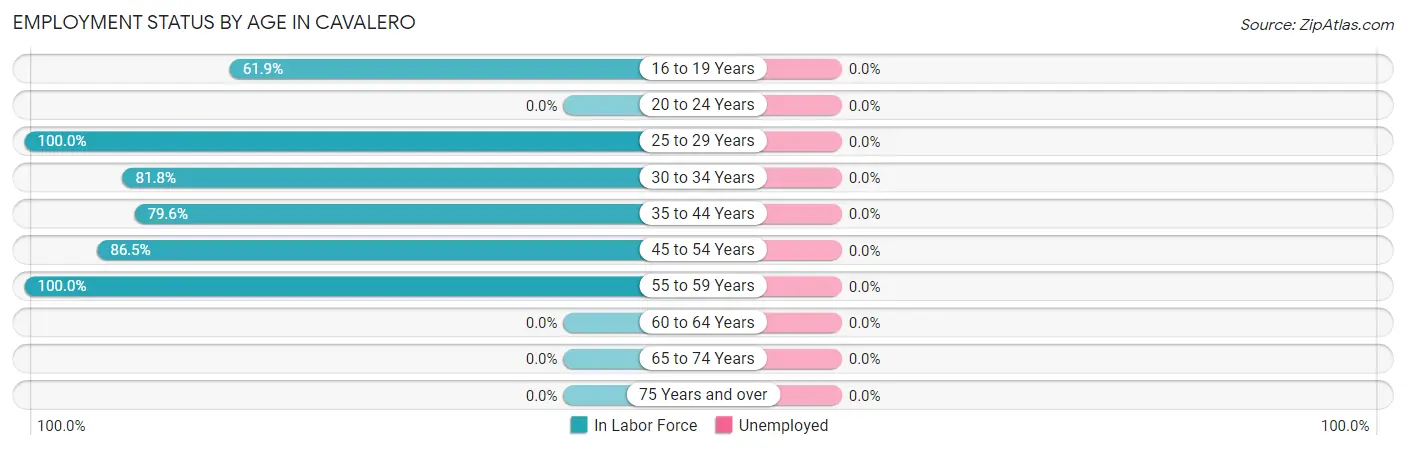
| Age Bracket | In Labor Force | Unemployed |
| 16 to 19 Years | 70 (61.9%) | 0 (0.0%) |
| 20 to 24 Years | 0 (0.0%) | 0 (0.0%) |
| 25 to 29 Years | 73 (100.0%) | 0 (0.0%) |
| 30 to 34 Years | 117 (81.8%) | 0 (0.0%) |
| 35 to 44 Years | 300 (79.6%) | 0 (0.0%) |
| 45 to 54 Years | 135 (86.5%) | 0 (0.0%) |
| 55 to 59 Years | 76 (100.0%) | 0 (0.0%) |
| 60 to 64 Years | 0 (0.0%) | 0 (0.0%) |
| 65 to 74 Years | 0 (0.0%) | 0 (0.0%) |
| 75 Years and over | 0 (0.0%) | 0 (0.0%) |
| Total | 771 (76.0%) | 0 (0.0%) |
Employment Status by Educational Attainment in Cavalero
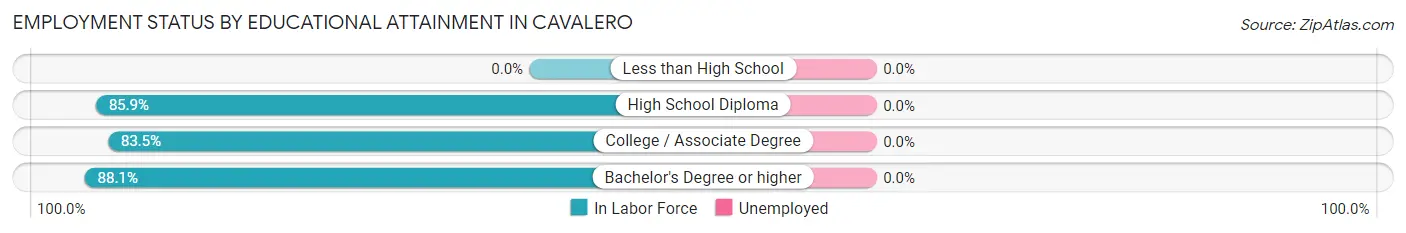
| Educational Attainment | In Labor Force | Unemployed |
| Less than High School | 0 (0.0%) | 0 (0.0%) |
| High School Diploma | 170 (85.9%) | 0 (0.0%) |
| College / Associate Degree | 264 (83.5%) | 0 (0.0%) |
| Bachelor's Degree or higher | 267 (88.1%) | 0 (0.0%) |
| Total | 701 (85.0%) | 0 (0.0%) |
Employment Occupations by Sex in Cavalero
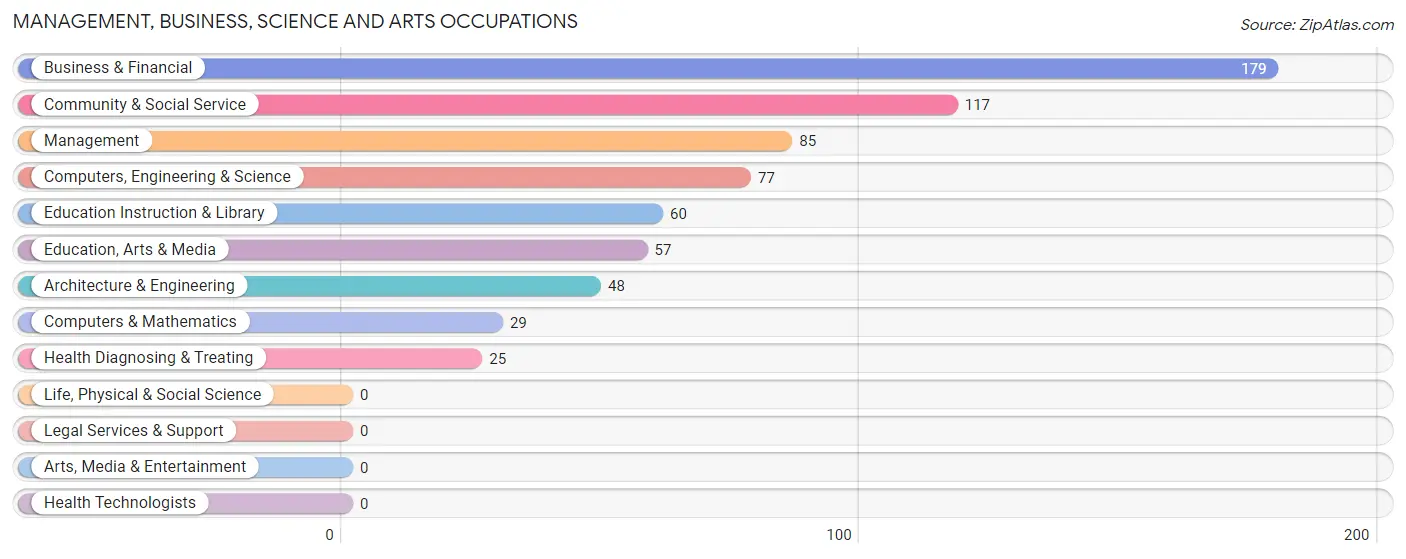
Management, Business, Science and Arts Occupations
The most common Management, Business, Science and Arts occupations in Cavalero are Business & Financial (179 | 24.0%), Community & Social Service (117 | 15.7%), Management (85 | 11.4%), Computers, Engineering & Science (77 | 10.3%), and Education Instruction & Library (60 | 8.1%).
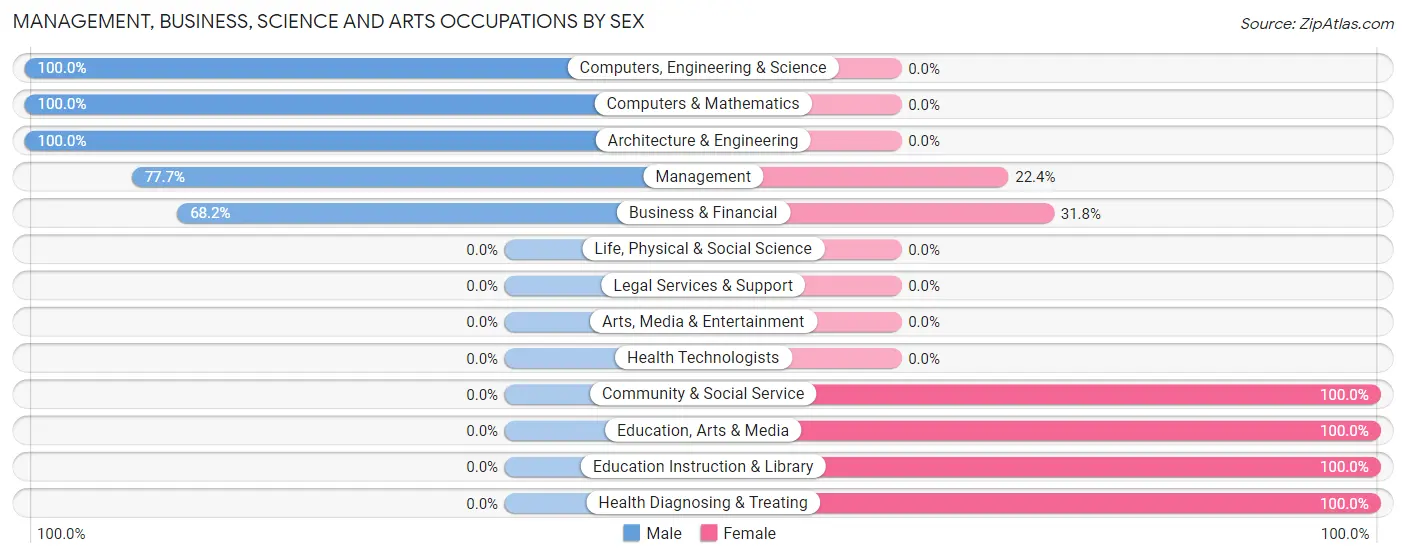
Management, Business, Science and Arts Occupations by Sex
Within the Management, Business, Science and Arts occupations in Cavalero, the most male-oriented occupations are Computers, Engineering & Science (100.0%), Computers & Mathematics (100.0%), and Architecture & Engineering (100.0%), while the most female-oriented occupations are Community & Social Service (100.0%), Education, Arts & Media (100.0%), and Education Instruction & Library (100.0%).
| Occupation | Male | Female |
| Management | 66 (77.6%) | 19 (22.4%) |
| Business & Financial | 122 (68.2%) | 57 (31.8%) |
| Computers, Engineering & Science | 77 (100.0%) | 0 (0.0%) |
| Computers & Mathematics | 29 (100.0%) | 0 (0.0%) |
| Architecture & Engineering | 48 (100.0%) | 0 (0.0%) |
| Life, Physical & Social Science | 0 (0.0%) | 0 (0.0%) |
| Community & Social Service | 0 (0.0%) | 117 (100.0%) |
| Education, Arts & Media | 0 (0.0%) | 57 (100.0%) |
| Legal Services & Support | 0 (0.0%) | 0 (0.0%) |
| Education Instruction & Library | 0 (0.0%) | 60 (100.0%) |
| Arts, Media & Entertainment | 0 (0.0%) | 0 (0.0%) |
| Health Diagnosing & Treating | 0 (0.0%) | 25 (100.0%) |
| Health Technologists | 0 (0.0%) | 0 (0.0%) |
| Total (Category) | 265 (54.9%) | 218 (45.1%) |
| Total (Overall) | 445 (59.7%) | 300 (40.3%) |
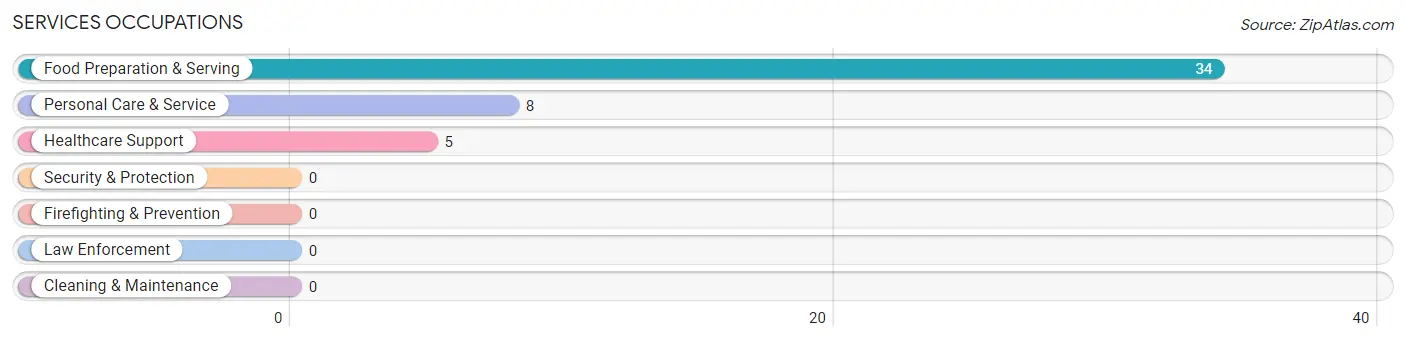
Services Occupations
The most common Services occupations in Cavalero are Food Preparation & Serving (34 | 4.6%), Personal Care & Service (8 | 1.1%), and Healthcare Support (5 | 0.7%).
Services Occupations by Sex
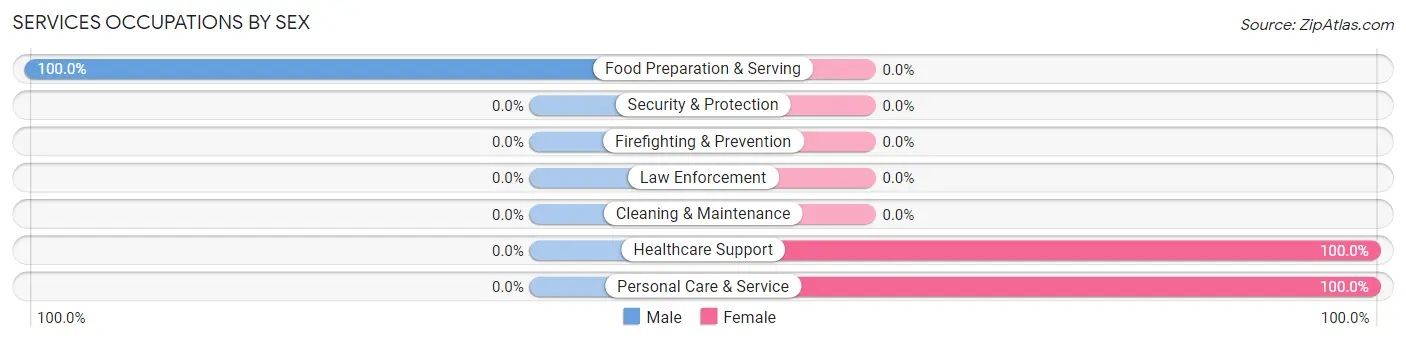
| Occupation | Male | Female |
| Healthcare Support | 0 (0.0%) | 5 (100.0%) |
| Security & Protection | 0 (0.0%) | 0 (0.0%) |
| Firefighting & Prevention | 0 (0.0%) | 0 (0.0%) |
| Law Enforcement | 0 (0.0%) | 0 (0.0%) |
| Food Preparation & Serving | 34 (100.0%) | 0 (0.0%) |
| Cleaning & Maintenance | 0 (0.0%) | 0 (0.0%) |
| Personal Care & Service | 0 (0.0%) | 8 (100.0%) |
| Total (Category) | 34 (72.3%) | 13 (27.7%) |
| Total (Overall) | 445 (59.7%) | 300 (40.3%) |
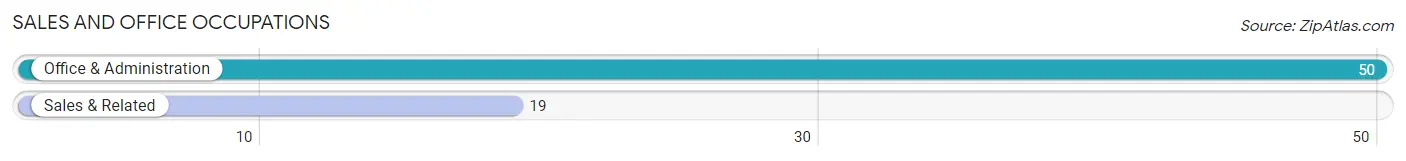
Sales and Office Occupations
The most common Sales and Office occupations in Cavalero are Office & Administration (50 | 6.7%), and Sales & Related (19 | 2.5%).
Sales and Office Occupations by Sex
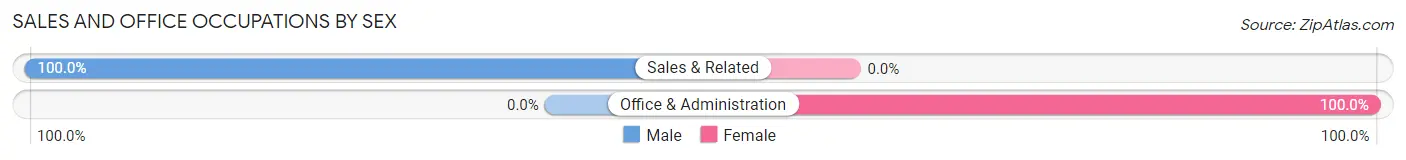
| Occupation | Male | Female |
| Sales & Related | 19 (100.0%) | 0 (0.0%) |
| Office & Administration | 0 (0.0%) | 50 (100.0%) |
| Total (Category) | 19 (27.5%) | 50 (72.5%) |
| Total (Overall) | 445 (59.7%) | 300 (40.3%) |
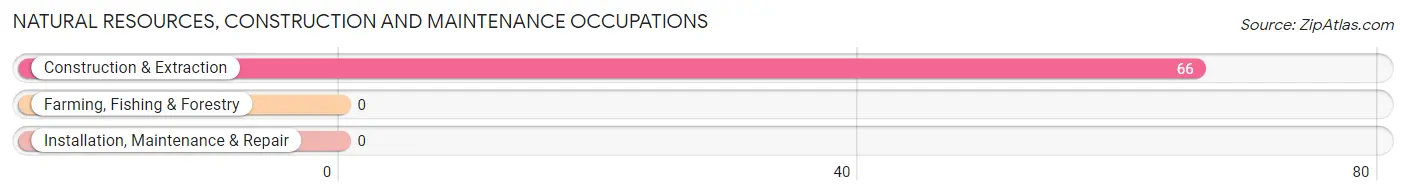
Natural Resources, Construction and Maintenance Occupations
The most common Natural Resources, Construction and Maintenance occupations in Cavalero are , and Construction & Extraction (66 | 8.9%).
Natural Resources, Construction and Maintenance Occupations by Sex
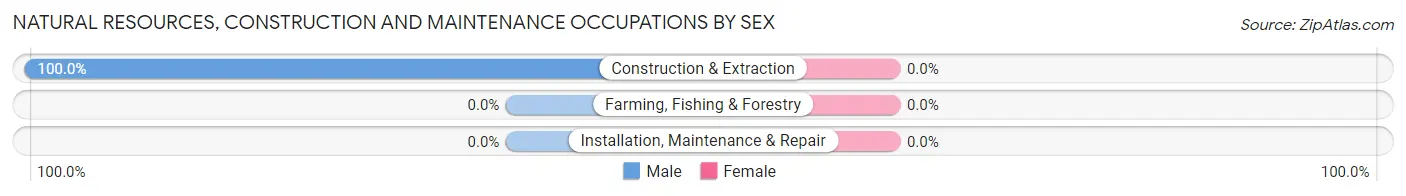
| Occupation | Male | Female |
| Farming, Fishing & Forestry | 0 (0.0%) | 0 (0.0%) |
| Construction & Extraction | 66 (100.0%) | 0 (0.0%) |
| Installation, Maintenance & Repair | 0 (0.0%) | 0 (0.0%) |
| Total (Category) | 66 (100.0%) | 0 (0.0%) |
| Total (Overall) | 445 (59.7%) | 300 (40.3%) |
Production, Transportation and Moving Occupations
The most common Production, Transportation and Moving occupations in Cavalero are Transportation (51 | 6.9%), and Production (29 | 3.9%).
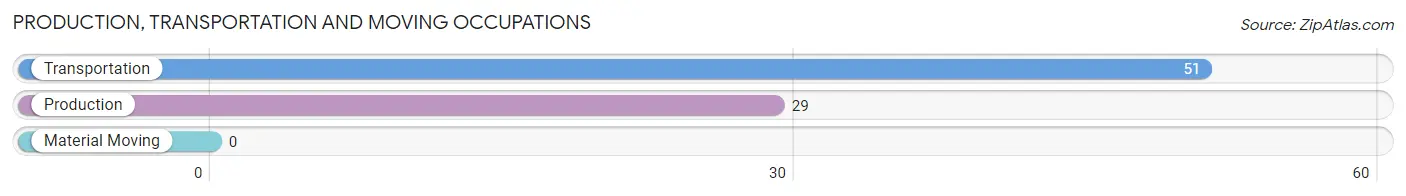
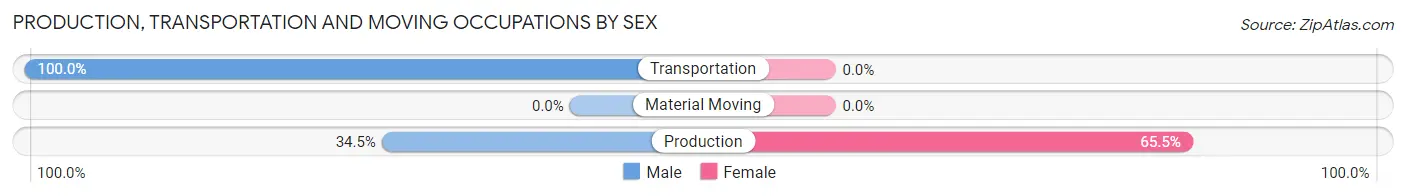
Production, Transportation and Moving Occupations by Sex
| Occupation | Male | Female |
| Production | 10 (34.5%) | 19 (65.5%) |
| Transportation | 51 (100.0%) | 0 (0.0%) |
| Material Moving | 0 (0.0%) | 0 (0.0%) |
| Total (Category) | 61 (76.2%) | 19 (23.7%) |
| Total (Overall) | 445 (59.7%) | 300 (40.3%) |
Employment Industries by Sex in Cavalero
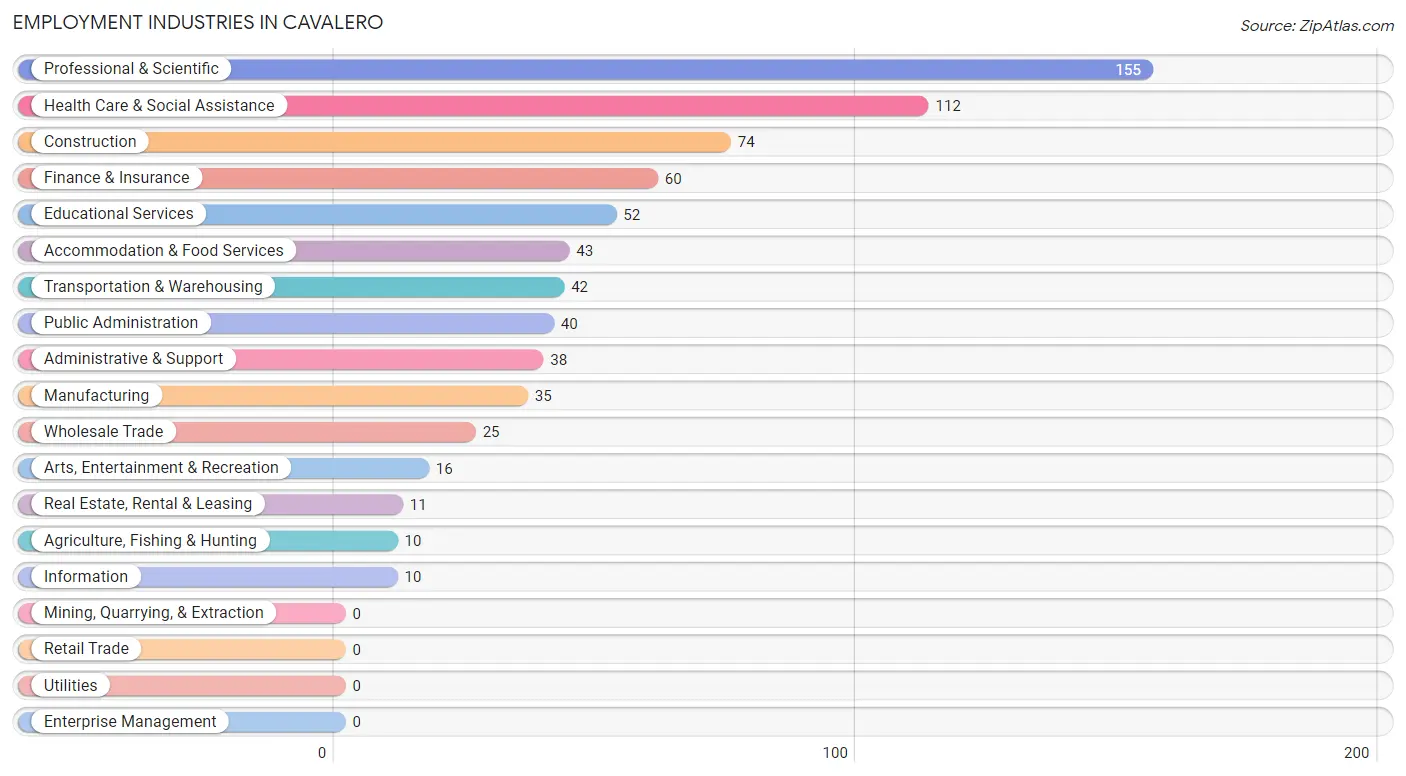
Employment Industries in Cavalero
The major employment industries in Cavalero include Professional & Scientific (155 | 20.8%), Health Care & Social Assistance (112 | 15.0%), Construction (74 | 9.9%), Finance & Insurance (60 | 8.1%), and Educational Services (52 | 7.0%).
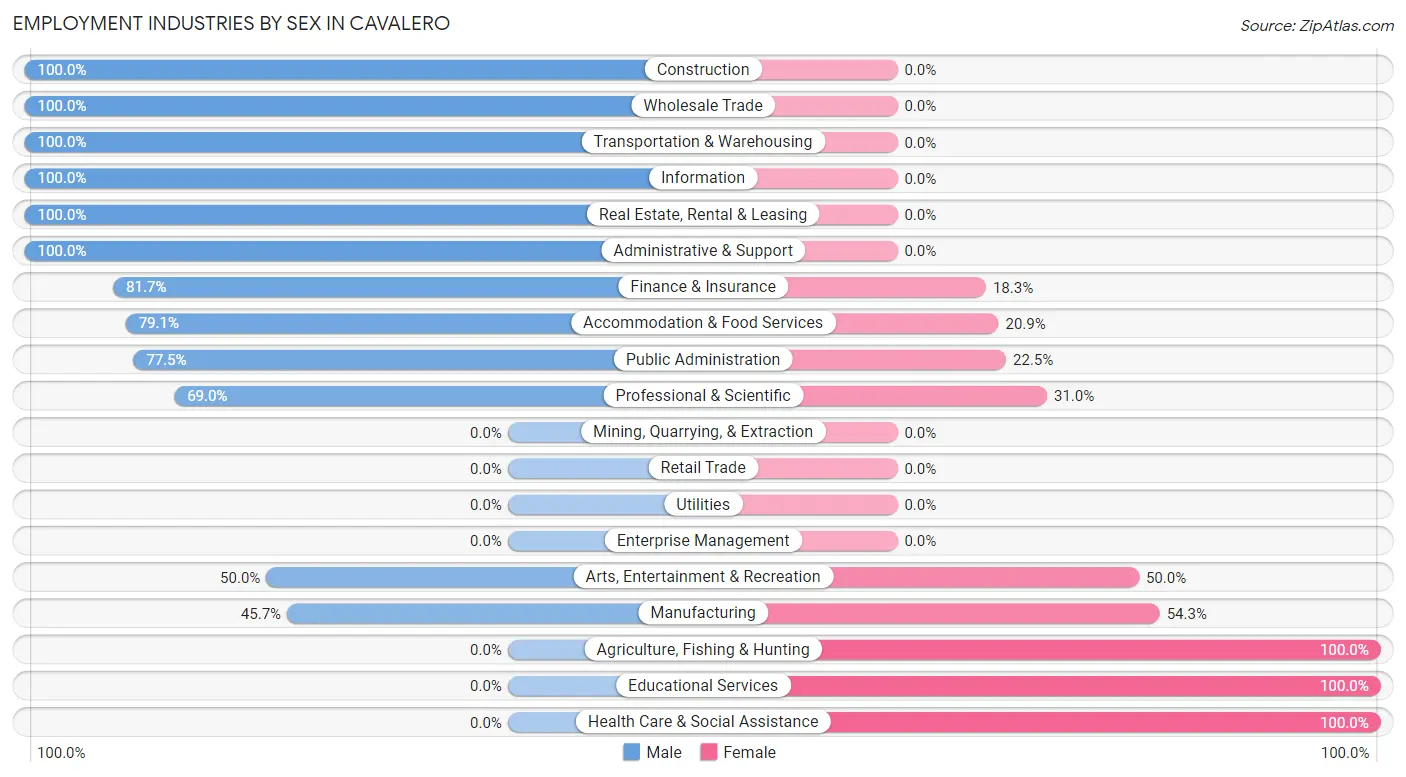
Employment Industries by Sex in Cavalero
The Cavalero industries that see more men than women are Construction (100.0%), Wholesale Trade (100.0%), and Transportation & Warehousing (100.0%), whereas the industries that tend to have a higher number of women are Agriculture, Fishing & Hunting (100.0%), Educational Services (100.0%), and Health Care & Social Assistance (100.0%).
| Industry | Male | Female |
| Agriculture, Fishing & Hunting | 0 (0.0%) | 10 (100.0%) |
| Mining, Quarrying, & Extraction | 0 (0.0%) | 0 (0.0%) |
| Construction | 74 (100.0%) | 0 (0.0%) |
| Manufacturing | 16 (45.7%) | 19 (54.3%) |
| Wholesale Trade | 25 (100.0%) | 0 (0.0%) |
| Retail Trade | 0 (0.0%) | 0 (0.0%) |
| Transportation & Warehousing | 42 (100.0%) | 0 (0.0%) |
| Utilities | 0 (0.0%) | 0 (0.0%) |
| Information | 10 (100.0%) | 0 (0.0%) |
| Finance & Insurance | 49 (81.7%) | 11 (18.3%) |
| Real Estate, Rental & Leasing | 11 (100.0%) | 0 (0.0%) |
| Professional & Scientific | 107 (69.0%) | 48 (31.0%) |
| Enterprise Management | 0 (0.0%) | 0 (0.0%) |
| Administrative & Support | 38 (100.0%) | 0 (0.0%) |
| Educational Services | 0 (0.0%) | 52 (100.0%) |
| Health Care & Social Assistance | 0 (0.0%) | 112 (100.0%) |
| Arts, Entertainment & Recreation | 8 (50.0%) | 8 (50.0%) |
| Accommodation & Food Services | 34 (79.1%) | 9 (20.9%) |
| Public Administration | 31 (77.5%) | 9 (22.5%) |
| Total | 445 (59.7%) | 300 (40.3%) |
Education in Cavalero
School Enrollment in Cavalero
The most common levels of schooling among the 507 students in Cavalero are high school (154 | 30.4%), middle school (107 | 21.1%), and college / undergraduate (95 | 18.7%).
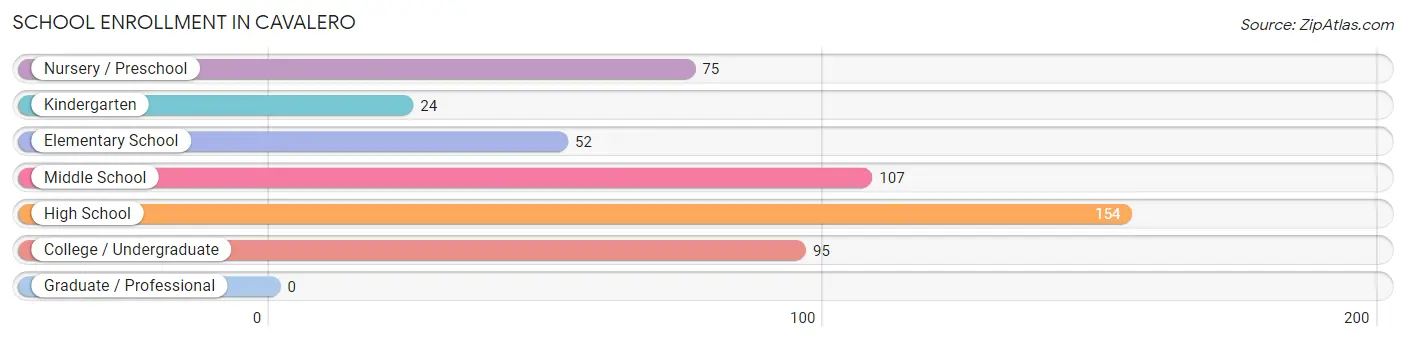
| School Level | # Students | % Students |
| Nursery / Preschool | 75 | 14.8% |
| Kindergarten | 24 | 4.7% |
| Elementary School | 52 | 10.3% |
| Middle School | 107 | 21.1% |
| High School | 154 | 30.4% |
| College / Undergraduate | 95 | 18.7% |
| Graduate / Professional | 0 | 0.0% |
| Total | 507 | 100.0% |
School Enrollment by Age by Funding Source in Cavalero
Out of a total of 507 students who are enrolled in schools in Cavalero, 101 (19.9%) attend a private institution, while the remaining 406 (80.1%) are enrolled in public schools. The age group of 3 to 4 year olds has the highest likelihood of being enrolled in private schools, with 75 (100.0% in the age bracket) enrolled. Conversely, the age group of 5 to 9 year old has the lowest likelihood of being enrolled in a private school, with 76 (100.0% in the age bracket) attending a public institution.
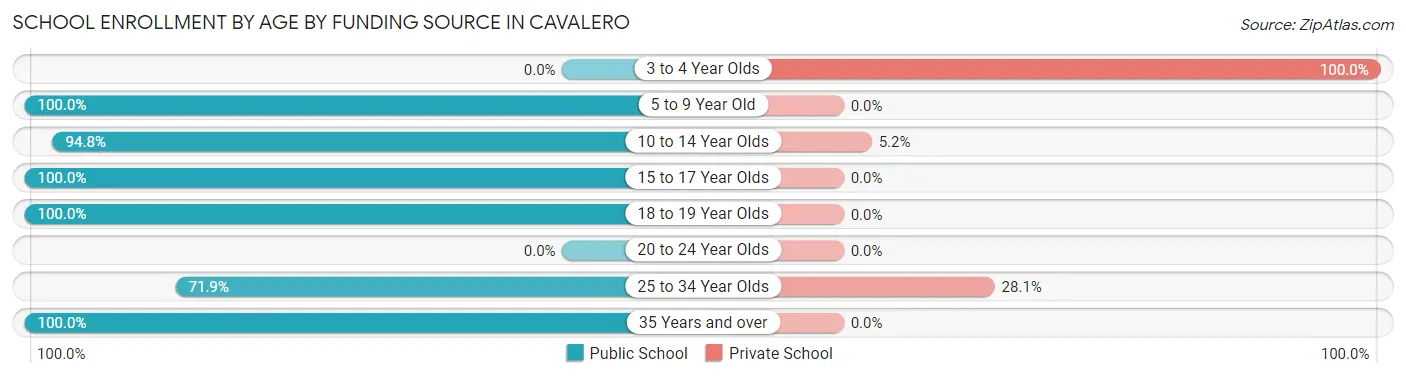
| Age Bracket | Public School | Private School |
| 3 to 4 Year Olds | 0 (0.0%) | 75 (100.0%) |
| 5 to 9 Year Old | 76 (100.0%) | 0 (0.0%) |
| 10 to 14 Year Olds | 145 (94.8%) | 8 (5.2%) |
| 15 to 17 Year Olds | 94 (100.0%) | 0 (0.0%) |
| 18 to 19 Year Olds | 14 (100.0%) | 0 (0.0%) |
| 20 to 24 Year Olds | 0 (0.0%) | 0 (0.0%) |
| 25 to 34 Year Olds | 46 (71.9%) | 18 (28.1%) |
| 35 Years and over | 31 (100.0%) | 0 (0.0%) |
| Total | 406 (80.1%) | 101 (19.9%) |
Educational Attainment by Field of Study in Cavalero
Business (75 | 22.1%), education (60 | 17.7%), psychology (53 | 15.6%), social sciences (27 | 8.0%), and arts & humanities (20 | 5.9%) are the most common fields of study among 339 individuals in Cavalero who have obtained a bachelor's degree or higher.
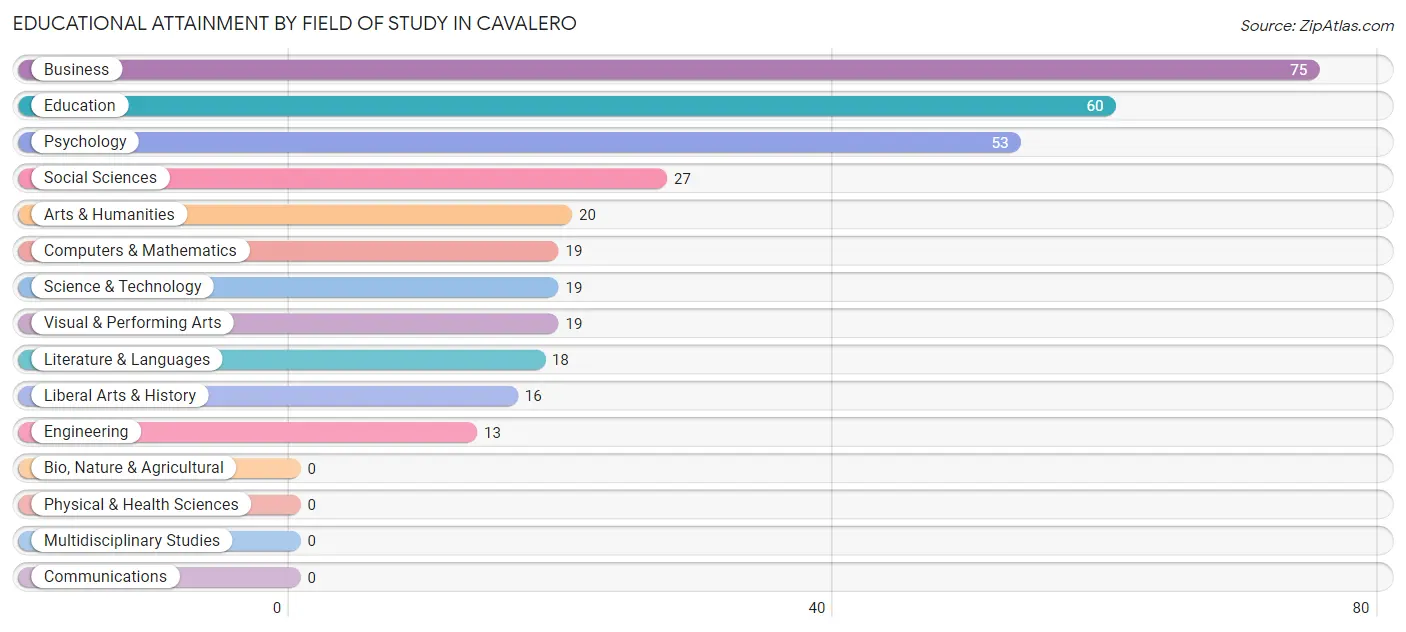
| Field of Study | # Graduates | % Graduates |
| Computers & Mathematics | 19 | 5.6% |
| Bio, Nature & Agricultural | 0 | 0.0% |
| Physical & Health Sciences | 0 | 0.0% |
| Psychology | 53 | 15.6% |
| Social Sciences | 27 | 8.0% |
| Engineering | 13 | 3.8% |
| Multidisciplinary Studies | 0 | 0.0% |
| Science & Technology | 19 | 5.6% |
| Business | 75 | 22.1% |
| Education | 60 | 17.7% |
| Literature & Languages | 18 | 5.3% |
| Liberal Arts & History | 16 | 4.7% |
| Visual & Performing Arts | 19 | 5.6% |
| Communications | 0 | 0.0% |
| Arts & Humanities | 20 | 5.9% |
| Total | 339 | 100.0% |
Transportation & Commute in Cavalero
Vehicle Availability by Sex in Cavalero
The most prevalent vehicle ownership categories in Cavalero are males with 2 vehicles (240, accounting for 51.0%) and females with 2 vehicles (174, making up 80.0%).
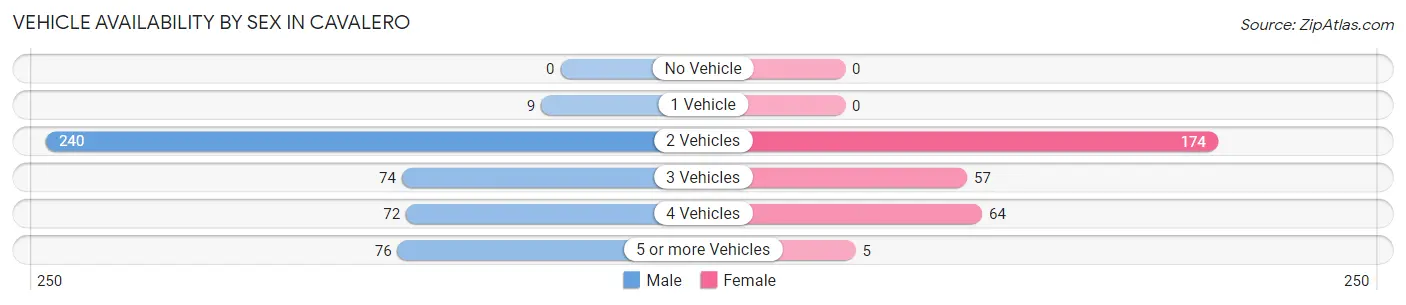
| Vehicles Available | Male | Female |
| No Vehicle | 0 (0.0%) | 0 (0.0%) |
| 1 Vehicle | 9 (1.9%) | 0 (0.0%) |
| 2 Vehicles | 240 (51.0%) | 174 (58.0%) |
| 3 Vehicles | 74 (15.7%) | 57 (19.0%) |
| 4 Vehicles | 72 (15.3%) | 64 (21.3%) |
| 5 or more Vehicles | 76 (16.1%) | 5 (1.7%) |
| Total | 471 (100.0%) | 300 (100.0%) |
Commute Time in Cavalero
The most frequently occuring commute durations in Cavalero are 90 or more minutes (127 commuters, 17.2%), 30 to 34 minutes (106 commuters, 14.4%), and 60 to 89 minutes (97 commuters, 13.2%).
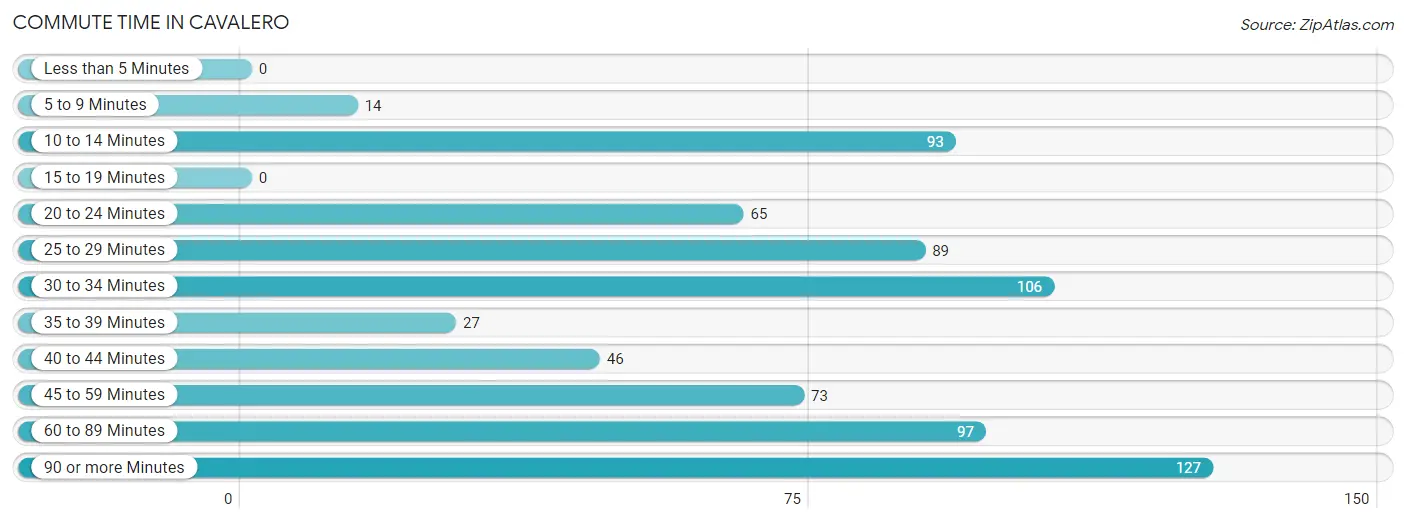
| Commute Time | # Commuters | % Commuters |
| Less than 5 Minutes | 0 | 0.0% |
| 5 to 9 Minutes | 14 | 1.9% |
| 10 to 14 Minutes | 93 | 12.6% |
| 15 to 19 Minutes | 0 | 0.0% |
| 20 to 24 Minutes | 65 | 8.8% |
| 25 to 29 Minutes | 89 | 12.1% |
| 30 to 34 Minutes | 106 | 14.4% |
| 35 to 39 Minutes | 27 | 3.7% |
| 40 to 44 Minutes | 46 | 6.2% |
| 45 to 59 Minutes | 73 | 9.9% |
| 60 to 89 Minutes | 97 | 13.2% |
| 90 or more Minutes | 127 | 17.2% |
Commute Time by Sex in Cavalero
The most common commute times in Cavalero are 60 to 89 minutes (97 commuters, 21.5%) for males and 10 to 14 minutes (68 commuters, 23.9%) for females.
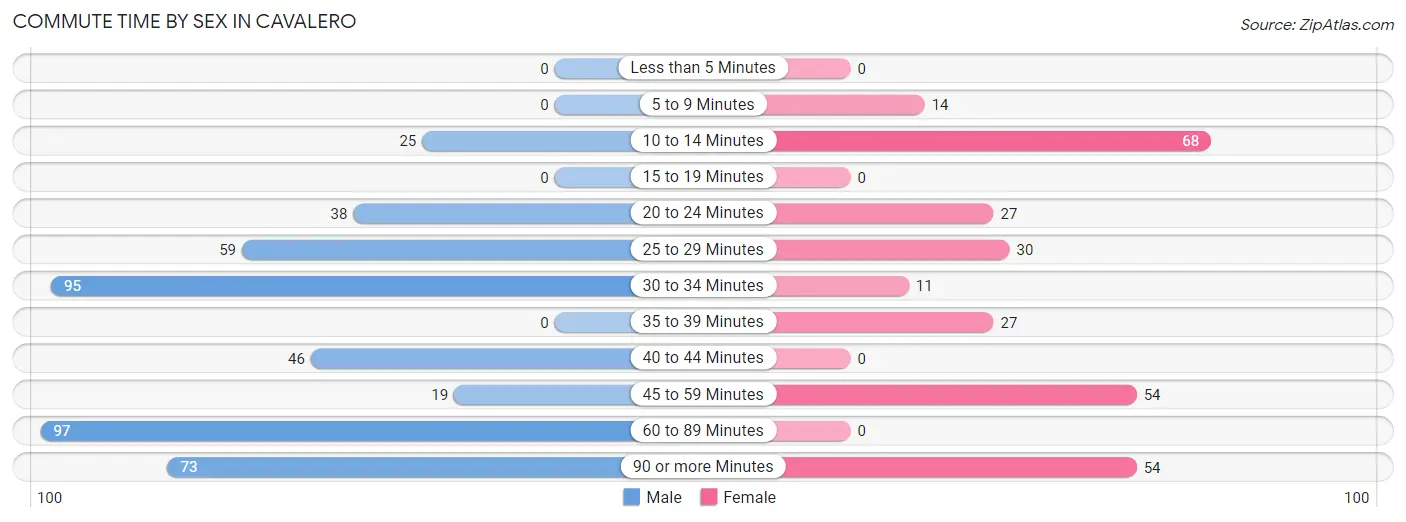
| Commute Time | Male | Female |
| Less than 5 Minutes | 0 (0.0%) | 0 (0.0%) |
| 5 to 9 Minutes | 0 (0.0%) | 14 (4.9%) |
| 10 to 14 Minutes | 25 (5.5%) | 68 (23.9%) |
| 15 to 19 Minutes | 0 (0.0%) | 0 (0.0%) |
| 20 to 24 Minutes | 38 (8.4%) | 27 (9.5%) |
| 25 to 29 Minutes | 59 (13.1%) | 30 (10.5%) |
| 30 to 34 Minutes | 95 (21.0%) | 11 (3.9%) |
| 35 to 39 Minutes | 0 (0.0%) | 27 (9.5%) |
| 40 to 44 Minutes | 46 (10.2%) | 0 (0.0%) |
| 45 to 59 Minutes | 19 (4.2%) | 54 (19.0%) |
| 60 to 89 Minutes | 97 (21.5%) | 0 (0.0%) |
| 90 or more Minutes | 73 (16.2%) | 54 (19.0%) |
Time of Departure to Work by Sex in Cavalero
The most frequent times of departure to work in Cavalero are 12:00 AM to 4:59 AM (113, 25.0%) for males and 6:30 AM to 6:59 AM (89, 31.2%) for females.
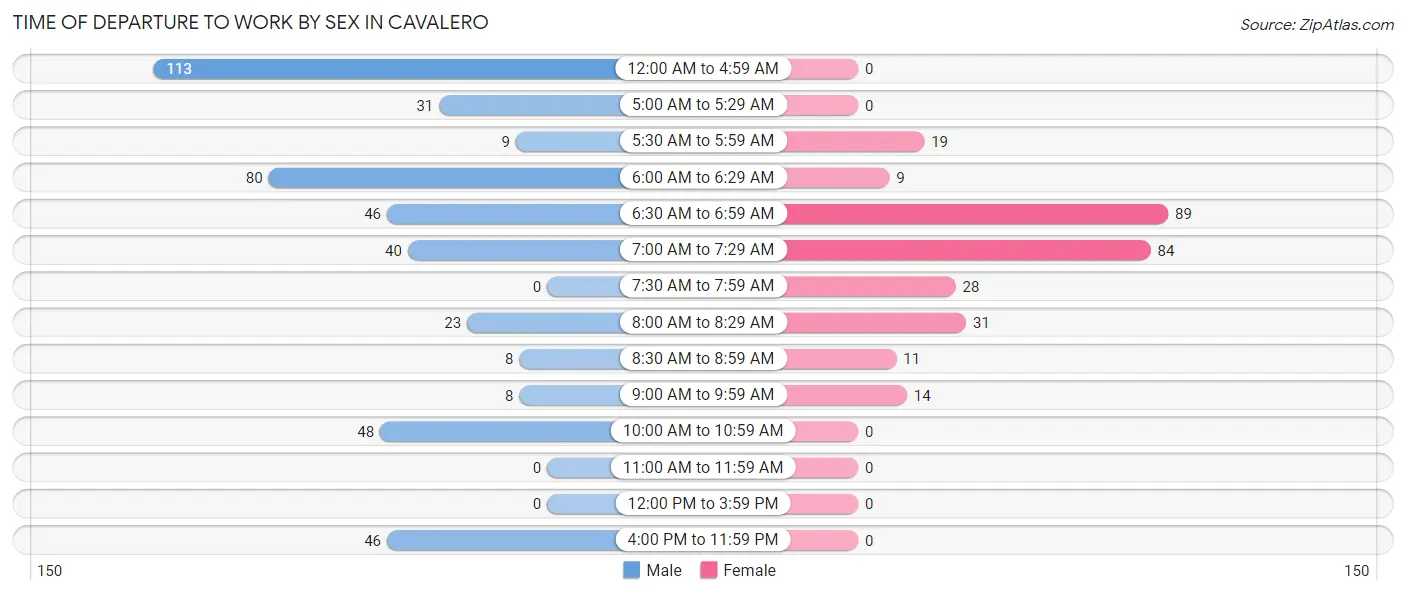
| Time of Departure | Male | Female |
| 12:00 AM to 4:59 AM | 113 (25.0%) | 0 (0.0%) |
| 5:00 AM to 5:29 AM | 31 (6.9%) | 0 (0.0%) |
| 5:30 AM to 5:59 AM | 9 (2.0%) | 19 (6.7%) |
| 6:00 AM to 6:29 AM | 80 (17.7%) | 9 (3.2%) |
| 6:30 AM to 6:59 AM | 46 (10.2%) | 89 (31.2%) |
| 7:00 AM to 7:29 AM | 40 (8.8%) | 84 (29.5%) |
| 7:30 AM to 7:59 AM | 0 (0.0%) | 28 (9.8%) |
| 8:00 AM to 8:29 AM | 23 (5.1%) | 31 (10.9%) |
| 8:30 AM to 8:59 AM | 8 (1.8%) | 11 (3.9%) |
| 9:00 AM to 9:59 AM | 8 (1.8%) | 14 (4.9%) |
| 10:00 AM to 10:59 AM | 48 (10.6%) | 0 (0.0%) |
| 11:00 AM to 11:59 AM | 0 (0.0%) | 0 (0.0%) |
| 12:00 PM to 3:59 PM | 0 (0.0%) | 0 (0.0%) |
| 4:00 PM to 11:59 PM | 46 (10.2%) | 0 (0.0%) |
| Total | 452 (100.0%) | 285 (100.0%) |
Housing Occupancy in Cavalero
Occupancy by Ownership in Cavalero
Of the total 445 dwellings in Cavalero, owner-occupied units account for 420 (94.4%), while renter-occupied units make up 25 (5.6%).
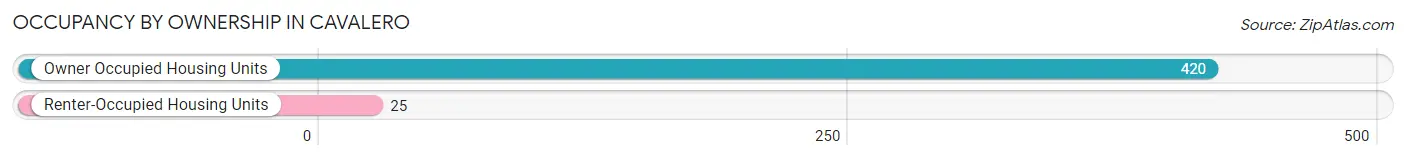
| Occupancy | # Housing Units | % Housing Units |
| Owner Occupied Housing Units | 420 | 94.4% |
| Renter-Occupied Housing Units | 25 | 5.6% |
| Total Occupied Housing Units | 445 | 100.0% |
Occupancy by Household Size in Cavalero
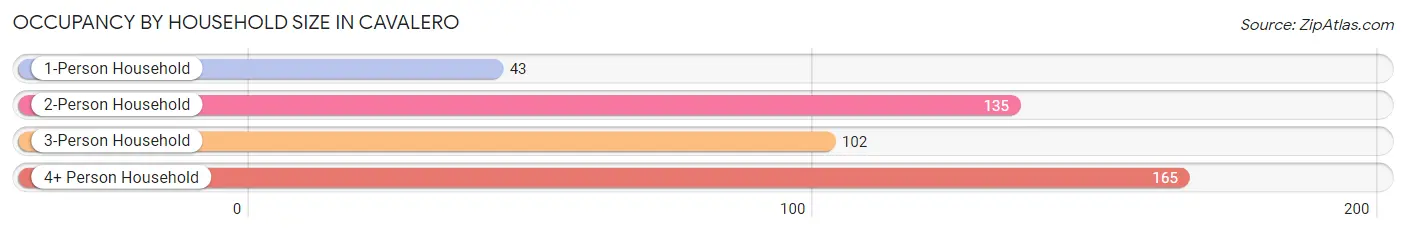
| Household Size | # Housing Units | % Housing Units |
| 1-Person Household | 43 | 9.7% |
| 2-Person Household | 135 | 30.3% |
| 3-Person Household | 102 | 22.9% |
| 4+ Person Household | 165 | 37.1% |
| Total Housing Units | 445 | 100.0% |
Occupancy by Ownership by Household Size in Cavalero
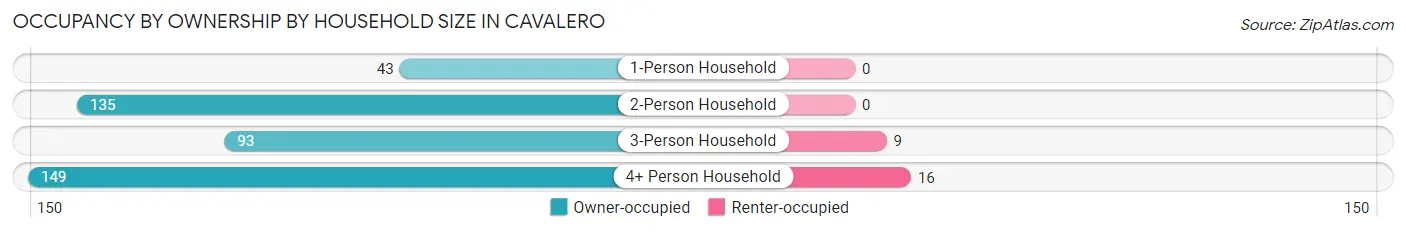
| Household Size | Owner-occupied | Renter-occupied |
| 1-Person Household | 43 (100.0%) | 0 (0.0%) |
| 2-Person Household | 135 (100.0%) | 0 (0.0%) |
| 3-Person Household | 93 (91.2%) | 9 (8.8%) |
| 4+ Person Household | 149 (90.3%) | 16 (9.7%) |
| Total Housing Units | 420 (94.4%) | 25 (5.6%) |
Occupancy by Educational Attainment in Cavalero
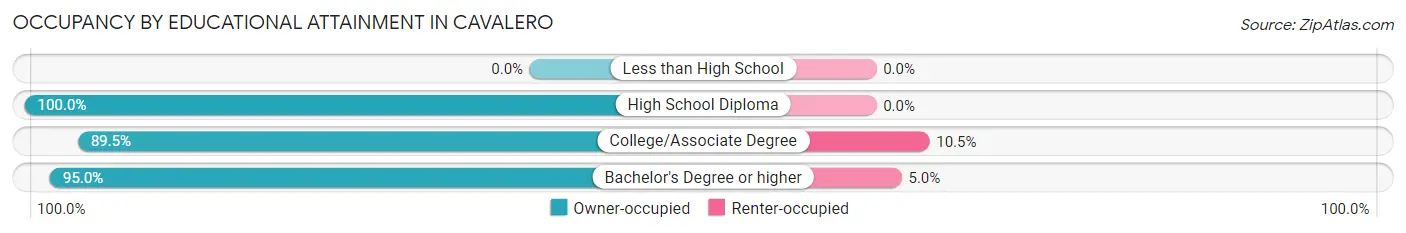
| Household Size | Owner-occupied | Renter-occupied |
| Less than High School | 0 (0.0%) | 0 (0.0%) |
| High School Diploma | 114 (100.0%) | 0 (0.0%) |
| College/Associate Degree | 136 (89.5%) | 16 (10.5%) |
| Bachelor's Degree or higher | 170 (95.0%) | 9 (5.0%) |
Occupancy by Age of Householder in Cavalero
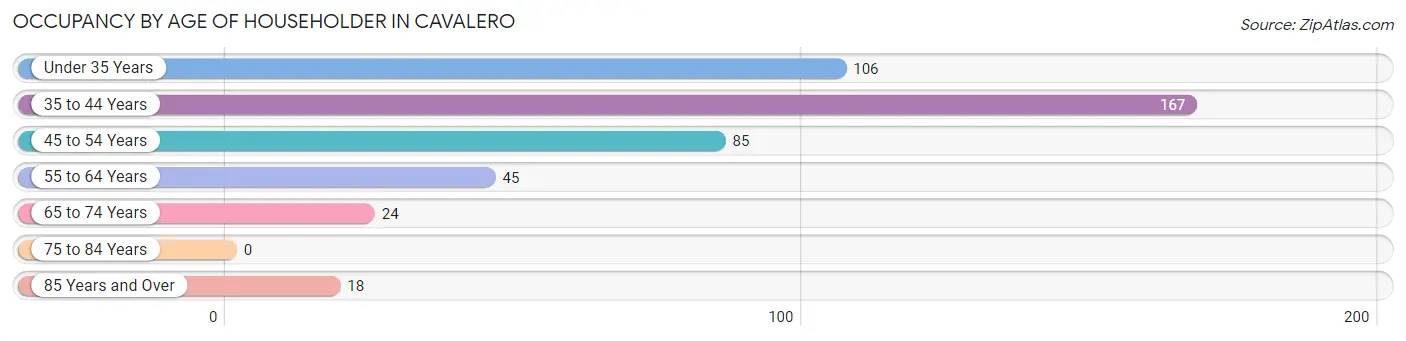
| Age Bracket | # Households | % Households |
| Under 35 Years | 106 | 23.8% |
| 35 to 44 Years | 167 | 37.5% |
| 45 to 54 Years | 85 | 19.1% |
| 55 to 64 Years | 45 | 10.1% |
| 65 to 74 Years | 24 | 5.4% |
| 75 to 84 Years | 0 | 0.0% |
| 85 Years and Over | 18 | 4.0% |
| Total | 445 | 100.0% |
Housing Finances in Cavalero
Median Income by Occupancy in Cavalero
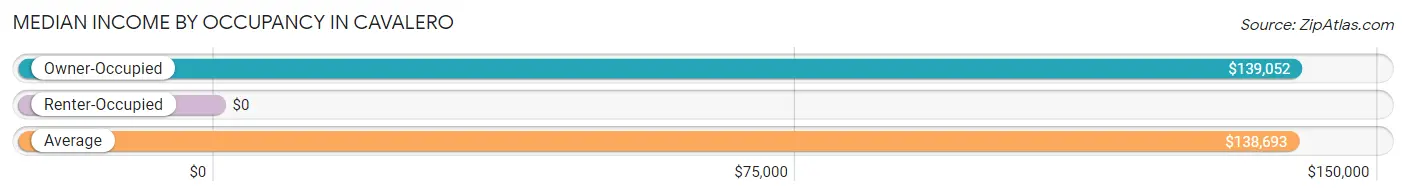
| Occupancy Type | # Households | Median Income |
| Owner-Occupied | 420 (94.4%) | $139,052 |
| Renter-Occupied | 25 (5.6%) | $0 |
| Average | 445 (100.0%) | $138,693 |
Occupancy by Householder Income Bracket in Cavalero
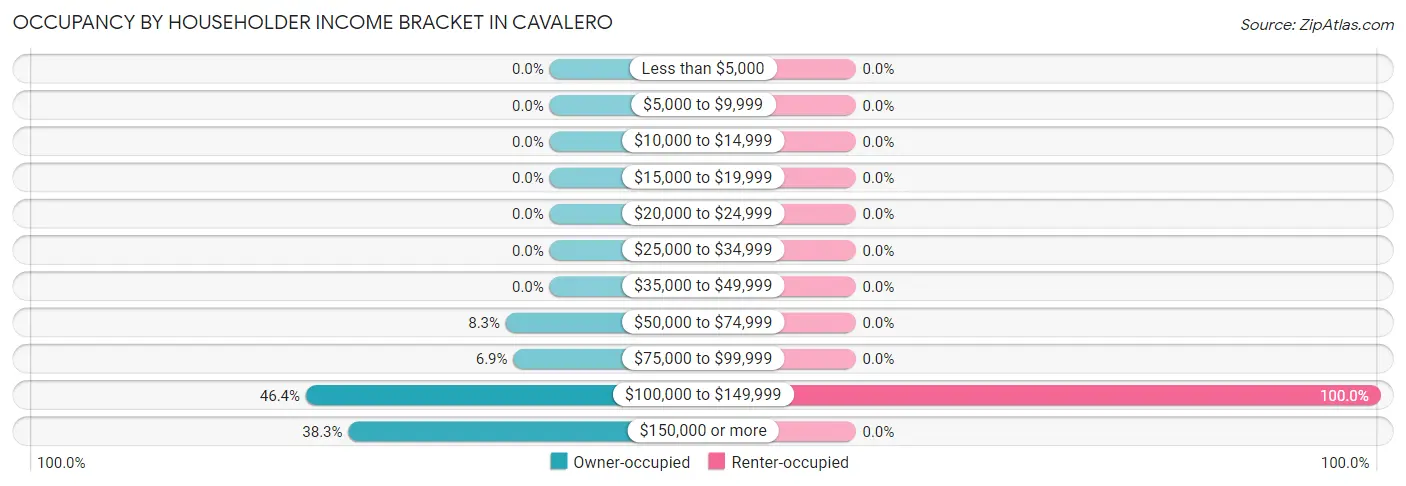
| Income Bracket | Owner-occupied | Renter-occupied |
| Less than $5,000 | 0 (0.0%) | 0 (0.0%) |
| $5,000 to $9,999 | 0 (0.0%) | 0 (0.0%) |
| $10,000 to $14,999 | 0 (0.0%) | 0 (0.0%) |
| $15,000 to $19,999 | 0 (0.0%) | 0 (0.0%) |
| $20,000 to $24,999 | 0 (0.0%) | 0 (0.0%) |
| $25,000 to $34,999 | 0 (0.0%) | 0 (0.0%) |
| $35,000 to $49,999 | 0 (0.0%) | 0 (0.0%) |
| $50,000 to $74,999 | 35 (8.3%) | 0 (0.0%) |
| $75,000 to $99,999 | 29 (6.9%) | 0 (0.0%) |
| $100,000 to $149,999 | 195 (46.4%) | 25 (100.0%) |
| $150,000 or more | 161 (38.3%) | 0 (0.0%) |
| Total | 420 (100.0%) | 25 (100.0%) |
Monthly Housing Cost Tiers in Cavalero
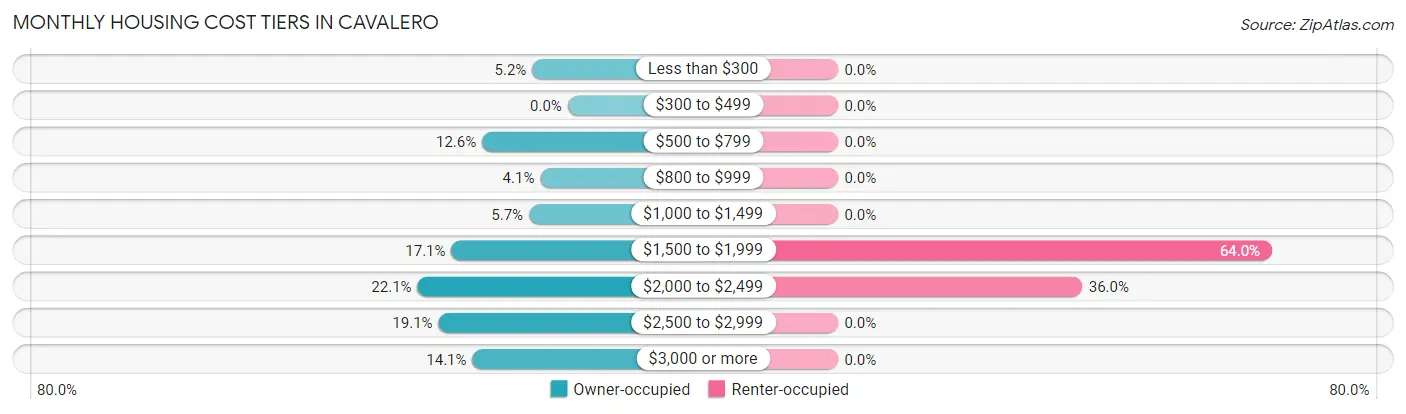
| Monthly Cost | Owner-occupied | Renter-occupied |
| Less than $300 | 22 (5.2%) | 0 (0.0%) |
| $300 to $499 | 0 (0.0%) | 0 (0.0%) |
| $500 to $799 | 53 (12.6%) | 0 (0.0%) |
| $800 to $999 | 17 (4.1%) | 0 (0.0%) |
| $1,000 to $1,499 | 24 (5.7%) | 0 (0.0%) |
| $1,500 to $1,999 | 72 (17.1%) | 16 (64.0%) |
| $2,000 to $2,499 | 93 (22.1%) | 9 (36.0%) |
| $2,500 to $2,999 | 80 (19.1%) | 0 (0.0%) |
| $3,000 or more | 59 (14.1%) | 0 (0.0%) |
| Total | 420 (100.0%) | 25 (100.0%) |
Physical Housing Characteristics in Cavalero
Housing Structures in Cavalero
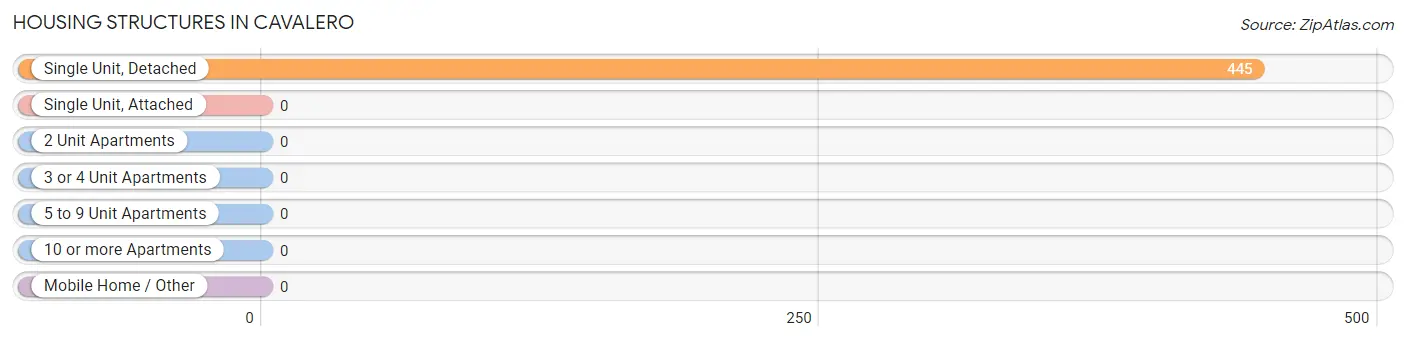
| Structure Type | # Housing Units | % Housing Units |
| Single Unit, Detached | 445 | 100.0% |
| Single Unit, Attached | 0 | 0.0% |
| 2 Unit Apartments | 0 | 0.0% |
| 3 or 4 Unit Apartments | 0 | 0.0% |
| 5 to 9 Unit Apartments | 0 | 0.0% |
| 10 or more Apartments | 0 | 0.0% |
| Mobile Home / Other | 0 | 0.0% |
| Total | 445 | 100.0% |
Housing Structures by Occupancy in Cavalero
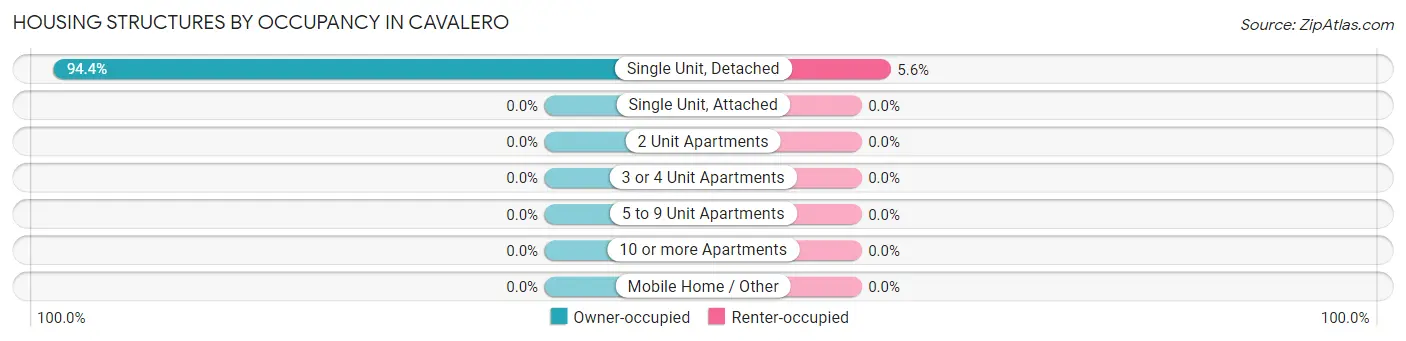
| Structure Type | Owner-occupied | Renter-occupied |
| Single Unit, Detached | 420 (94.4%) | 25 (5.6%) |
| Single Unit, Attached | 0 (0.0%) | 0 (0.0%) |
| 2 Unit Apartments | 0 (0.0%) | 0 (0.0%) |
| 3 or 4 Unit Apartments | 0 (0.0%) | 0 (0.0%) |
| 5 to 9 Unit Apartments | 0 (0.0%) | 0 (0.0%) |
| 10 or more Apartments | 0 (0.0%) | 0 (0.0%) |
| Mobile Home / Other | 0 (0.0%) | 0 (0.0%) |
| Total | 420 (94.4%) | 25 (5.6%) |
Housing Structures by Number of Rooms in Cavalero
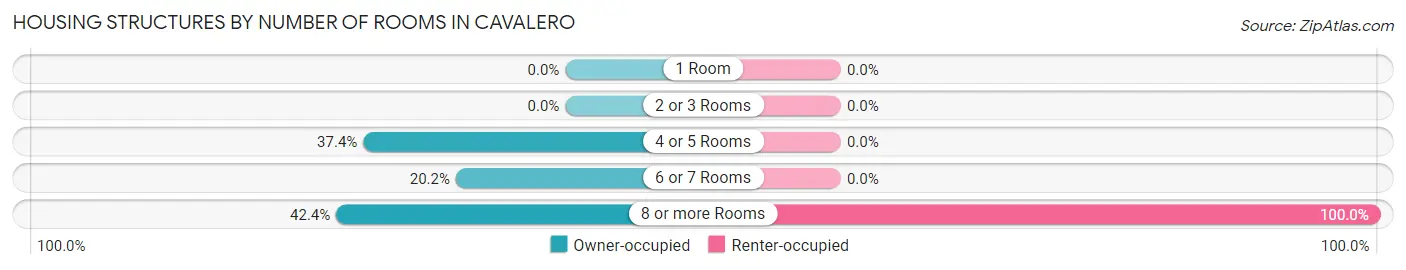
| Number of Rooms | Owner-occupied | Renter-occupied |
| 1 Room | 0 (0.0%) | 0 (0.0%) |
| 2 or 3 Rooms | 0 (0.0%) | 0 (0.0%) |
| 4 or 5 Rooms | 157 (37.4%) | 0 (0.0%) |
| 6 or 7 Rooms | 85 (20.2%) | 0 (0.0%) |
| 8 or more Rooms | 178 (42.4%) | 25 (100.0%) |
| Total | 420 (100.0%) | 25 (100.0%) |
Housing Structure by Heating Type in Cavalero
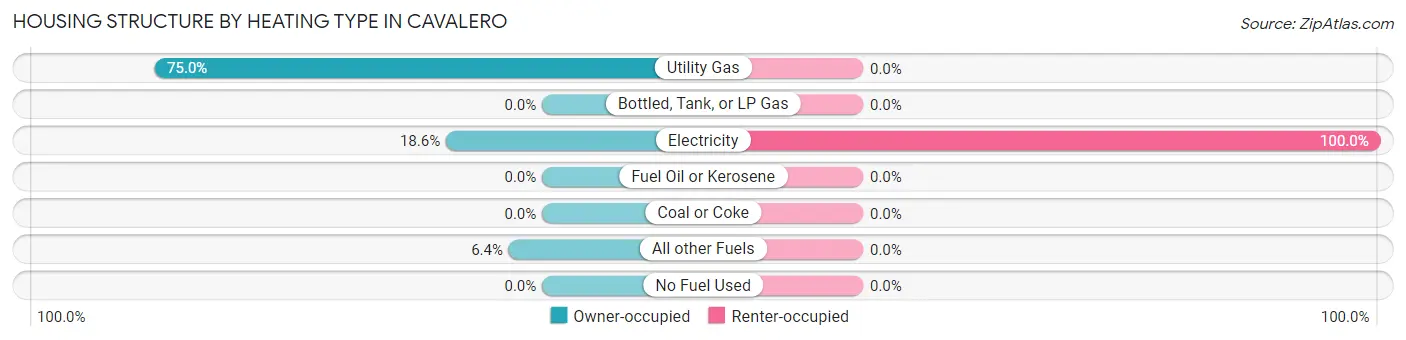
| Heating Type | Owner-occupied | Renter-occupied |
| Utility Gas | 315 (75.0%) | 0 (0.0%) |
| Bottled, Tank, or LP Gas | 0 (0.0%) | 0 (0.0%) |
| Electricity | 78 (18.6%) | 25 (100.0%) |
| Fuel Oil or Kerosene | 0 (0.0%) | 0 (0.0%) |
| Coal or Coke | 0 (0.0%) | 0 (0.0%) |
| All other Fuels | 27 (6.4%) | 0 (0.0%) |
| No Fuel Used | 0 (0.0%) | 0 (0.0%) |
| Total | 420 (100.0%) | 25 (100.0%) |
Household Vehicle Usage in Cavalero
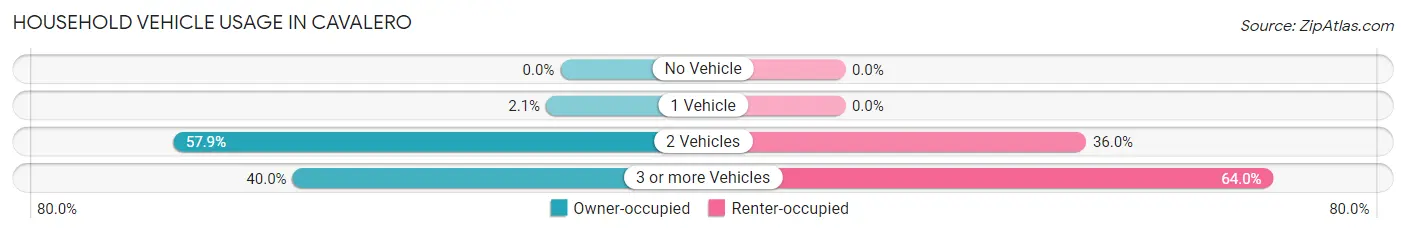
| Vehicles per Household | Owner-occupied | Renter-occupied |
| No Vehicle | 0 (0.0%) | 0 (0.0%) |
| 1 Vehicle | 9 (2.1%) | 0 (0.0%) |
| 2 Vehicles | 243 (57.9%) | 9 (36.0%) |
| 3 or more Vehicles | 168 (40.0%) | 16 (64.0%) |
| Total | 420 (100.0%) | 25 (100.0%) |
Real Estate & Mortgages in Cavalero
Real Estate and Mortgage Overview in Cavalero
| Characteristic | Without Mortgage | With Mortgage |
| Housing Units | 88 | 332 |
| Median Property Value | $607,800 | $539,300 |
| Median Household Income | $139,545 | $137 |
| Monthly Housing Costs | $733 | $59 |
| Real Estate Taxes | $5,570 | $0 |
Property Value by Mortgage Status in Cavalero
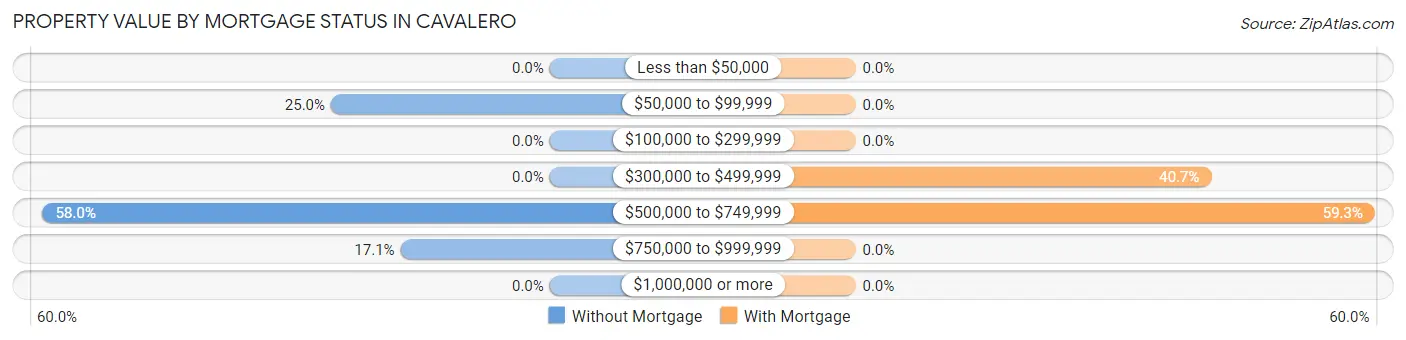
| Property Value | Without Mortgage | With Mortgage |
| Less than $50,000 | 0 (0.0%) | 0 (0.0%) |
| $50,000 to $99,999 | 22 (25.0%) | 0 (0.0%) |
| $100,000 to $299,999 | 0 (0.0%) | 0 (0.0%) |
| $300,000 to $499,999 | 0 (0.0%) | 135 (40.7%) |
| $500,000 to $749,999 | 51 (58.0%) | 197 (59.3%) |
| $750,000 to $999,999 | 15 (17.1%) | 0 (0.0%) |
| $1,000,000 or more | 0 (0.0%) | 0 (0.0%) |
| Total | 88 (100.0%) | 332 (100.0%) |
Household Income by Mortgage Status in Cavalero
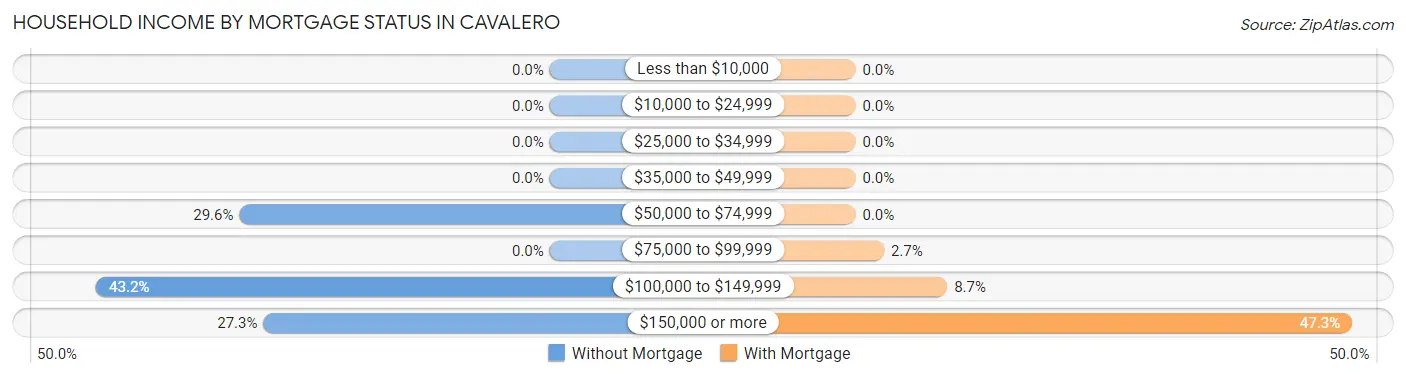
| Household Income | Without Mortgage | With Mortgage |
| Less than $10,000 | 0 (0.0%) | 0 (0.0%) |
| $10,000 to $24,999 | 0 (0.0%) | 0 (0.0%) |
| $25,000 to $34,999 | 0 (0.0%) | 0 (0.0%) |
| $35,000 to $49,999 | 0 (0.0%) | 0 (0.0%) |
| $50,000 to $74,999 | 26 (29.5%) | 0 (0.0%) |
| $75,000 to $99,999 | 0 (0.0%) | 9 (2.7%) |
| $100,000 to $149,999 | 38 (43.2%) | 29 (8.7%) |
| $150,000 or more | 24 (27.3%) | 157 (47.3%) |
| Total | 88 (100.0%) | 332 (100.0%) |
Property Value to Household Income Ratio in Cavalero
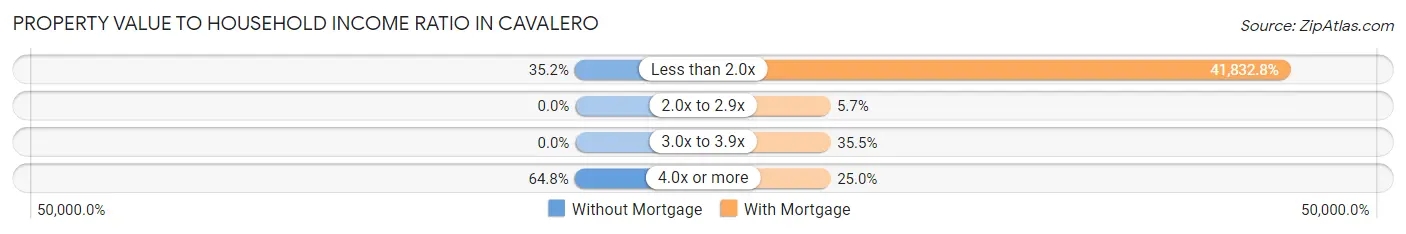
| Value-to-Income Ratio | Without Mortgage | With Mortgage |
| Less than 2.0x | 31 (35.2%) | 138,885 (41,832.8%) |
| 2.0x to 2.9x | 0 (0.0%) | 19 (5.7%) |
| 3.0x to 3.9x | 0 (0.0%) | 118 (35.5%) |
| 4.0x or more | 57 (64.8%) | 83 (25.0%) |
| Total | 88 (100.0%) | 332 (100.0%) |
Real Estate Taxes by Mortgage Status in Cavalero
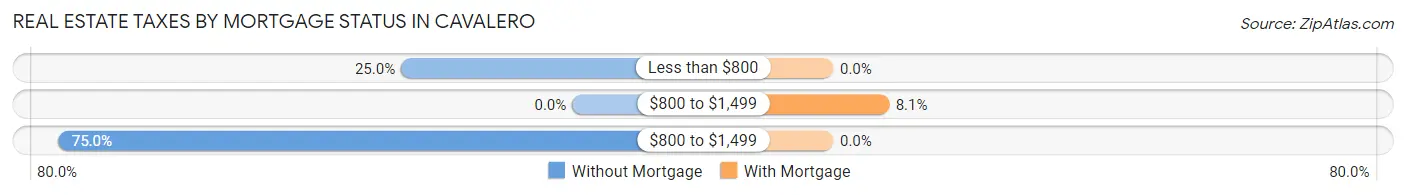
| Property Taxes | Without Mortgage | With Mortgage |
| Less than $800 | 22 (25.0%) | 0 (0.0%) |
| $800 to $1,499 | 0 (0.0%) | 27 (8.1%) |
| $800 to $1,499 | 66 (75.0%) | 0 (0.0%) |
| Total | 88 (100.0%) | 332 (100.0%) |
Health & Disability in Cavalero
Health Insurance Coverage by Age in Cavalero
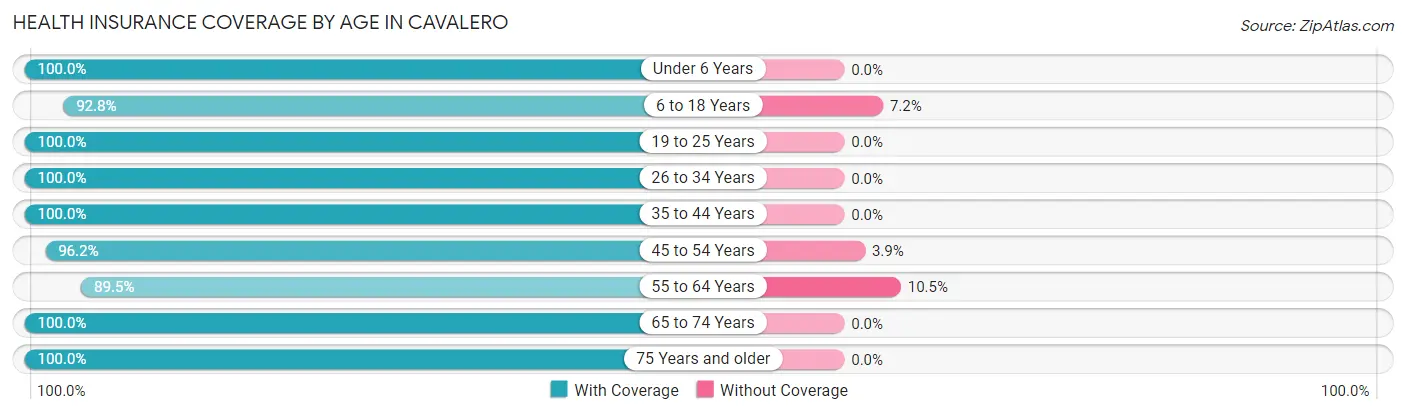
| Age Bracket | With Coverage | Without Coverage |
| Under 6 Years | 223 (100.0%) | 0 (0.0%) |
| 6 to 18 Years | 309 (92.8%) | 24 (7.2%) |
| 19 to 25 Years | 25 (100.0%) | 0 (0.0%) |
| 26 to 34 Years | 165 (100.0%) | 0 (0.0%) |
| 35 to 44 Years | 377 (100.0%) | 0 (0.0%) |
| 45 to 54 Years | 150 (96.2%) | 6 (3.8%) |
| 55 to 64 Years | 68 (89.5%) | 8 (10.5%) |
| 65 to 74 Years | 50 (100.0%) | 0 (0.0%) |
| 75 Years and older | 26 (100.0%) | 0 (0.0%) |
| Total | 1,393 (97.3%) | 38 (2.7%) |
Health Insurance Coverage by Citizenship Status in Cavalero
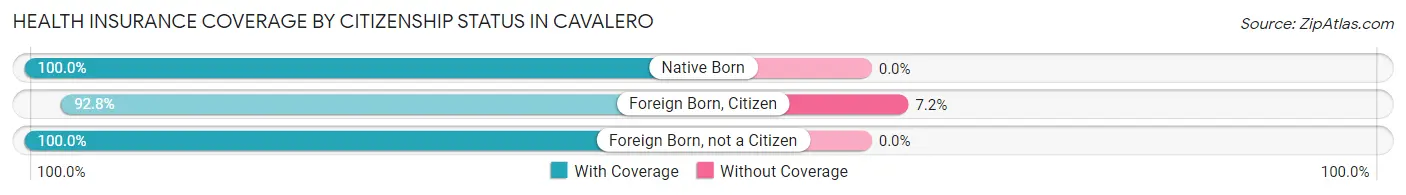
| Citizenship Status | With Coverage | Without Coverage |
| Native Born | 223 (100.0%) | 0 (0.0%) |
| Foreign Born, Citizen | 309 (92.8%) | 24 (7.2%) |
| Foreign Born, not a Citizen | 25 (100.0%) | 0 (0.0%) |
Health Insurance Coverage by Household Income in Cavalero
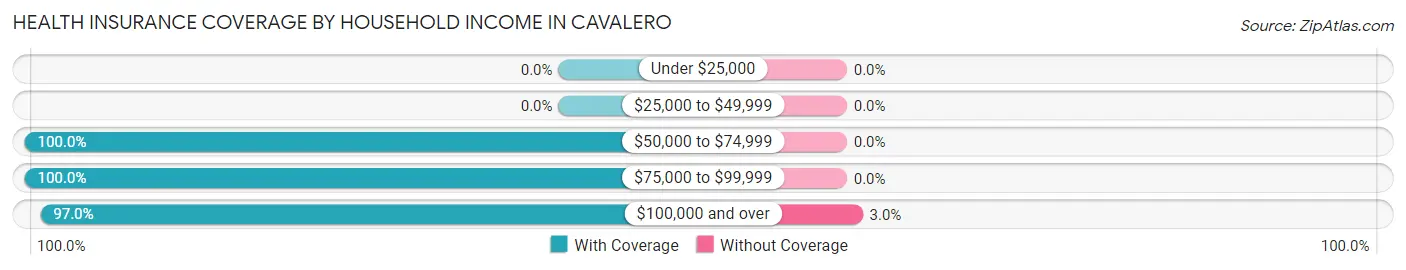
| Household Income | With Coverage | Without Coverage |
| Under $25,000 | 0 (0.0%) | 0 (0.0%) |
| $25,000 to $49,999 | 0 (0.0%) | 0 (0.0%) |
| $50,000 to $74,999 | 45 (100.0%) | 0 (0.0%) |
| $75,000 to $99,999 | 102 (100.0%) | 0 (0.0%) |
| $100,000 and over | 1,246 (97.0%) | 38 (3.0%) |
Public vs Private Health Insurance Coverage by Age in Cavalero
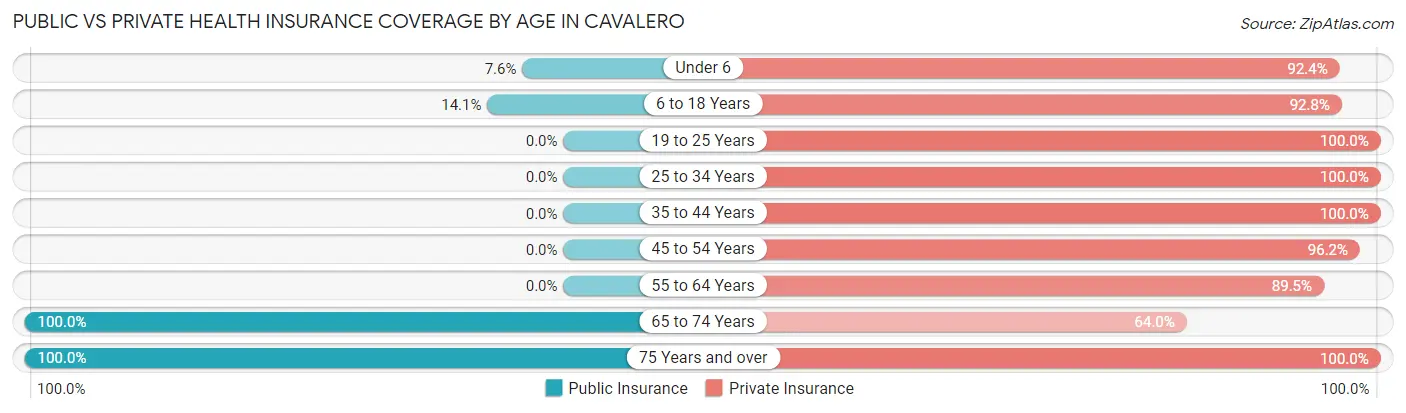
| Age Bracket | Public Insurance | Private Insurance |
| Under 6 | 17 (7.6%) | 206 (92.4%) |
| 6 to 18 Years | 47 (14.1%) | 309 (92.8%) |
| 19 to 25 Years | 0 (0.0%) | 25 (100.0%) |
| 25 to 34 Years | 0 (0.0%) | 165 (100.0%) |
| 35 to 44 Years | 0 (0.0%) | 377 (100.0%) |
| 45 to 54 Years | 0 (0.0%) | 150 (96.2%) |
| 55 to 64 Years | 0 (0.0%) | 68 (89.5%) |
| 65 to 74 Years | 50 (100.0%) | 32 (64.0%) |
| 75 Years and over | 26 (100.0%) | 26 (100.0%) |
| Total | 140 (9.8%) | 1,358 (94.9%) |
Disability Status by Sex by Age in Cavalero
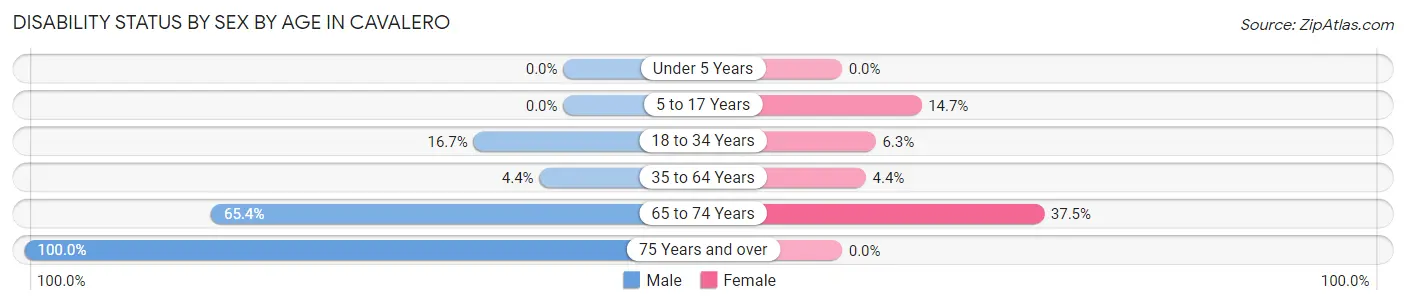
| Age Bracket | Male | Female |
| Under 5 Years | 0 (0.0%) | 0 (0.0%) |
| 5 to 17 Years | 0 (0.0%) | 14 (14.7%) |
| 18 to 34 Years | 12 (16.7%) | 9 (6.2%) |
| 35 to 64 Years | 16 (4.4%) | 11 (4.4%) |
| 65 to 74 Years | 17 (65.4%) | 9 (37.5%) |
| 75 Years and over | 26 (100.0%) | 0 (0.0%) |
Disability Class by Sex by Age in Cavalero
Disability Class: Hearing Difficulty
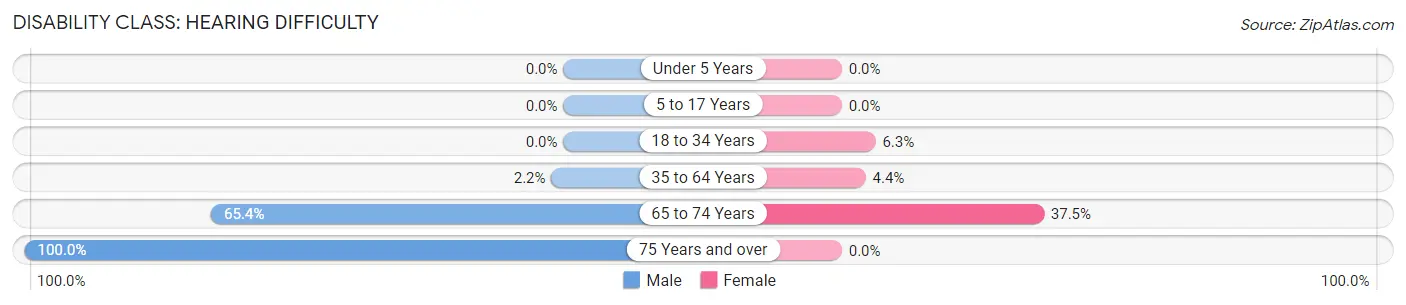
| Age Bracket | Male | Female |
| Under 5 Years | 0 (0.0%) | 0 (0.0%) |
| 5 to 17 Years | 0 (0.0%) | 0 (0.0%) |
| 18 to 34 Years | 0 (0.0%) | 9 (6.2%) |
| 35 to 64 Years | 8 (2.2%) | 11 (4.4%) |
| 65 to 74 Years | 17 (65.4%) | 9 (37.5%) |
| 75 Years and over | 26 (100.0%) | 0 (0.0%) |
Disability Class: Vision Difficulty
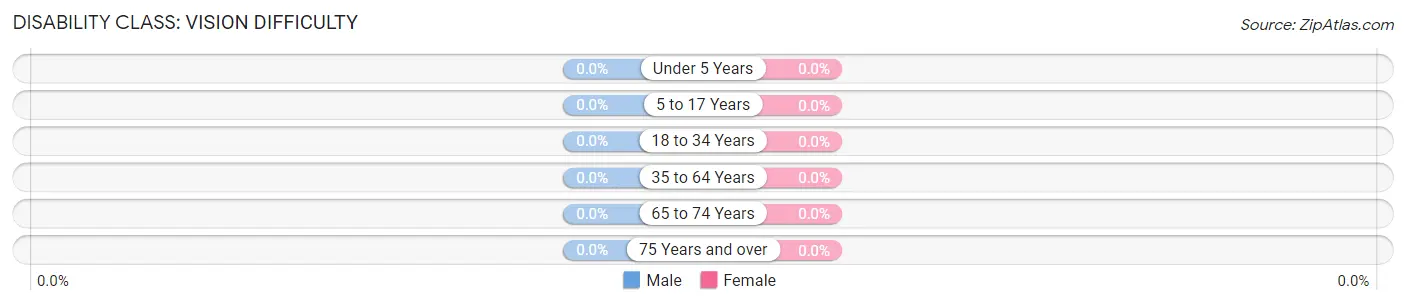
| Age Bracket | Male | Female |
| Under 5 Years | 0 (0.0%) | 0 (0.0%) |
| 5 to 17 Years | 0 (0.0%) | 0 (0.0%) |
| 18 to 34 Years | 0 (0.0%) | 0 (0.0%) |
| 35 to 64 Years | 0 (0.0%) | 0 (0.0%) |
| 65 to 74 Years | 0 (0.0%) | 0 (0.0%) |
| 75 Years and over | 0 (0.0%) | 0 (0.0%) |
Disability Class: Cognitive Difficulty
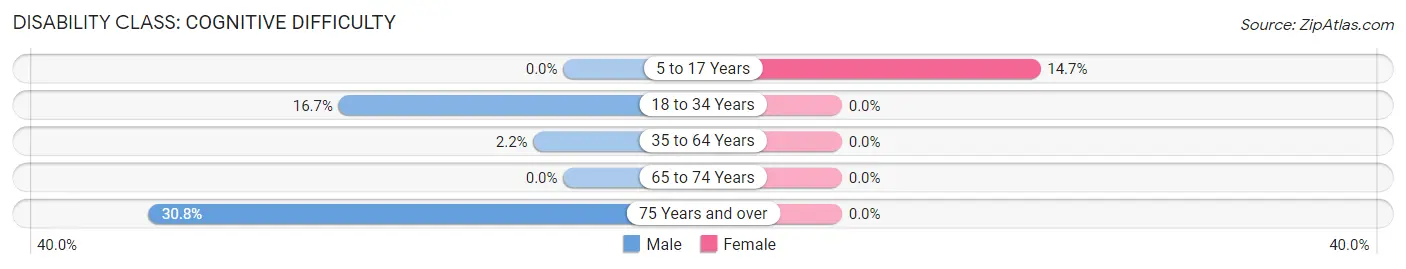
| Age Bracket | Male | Female |
| 5 to 17 Years | 0 (0.0%) | 14 (14.7%) |
| 18 to 34 Years | 12 (16.7%) | 0 (0.0%) |
| 35 to 64 Years | 8 (2.2%) | 0 (0.0%) |
| 65 to 74 Years | 0 (0.0%) | 0 (0.0%) |
| 75 Years and over | 8 (30.8%) | 0 (0.0%) |
Disability Class: Ambulatory Difficulty
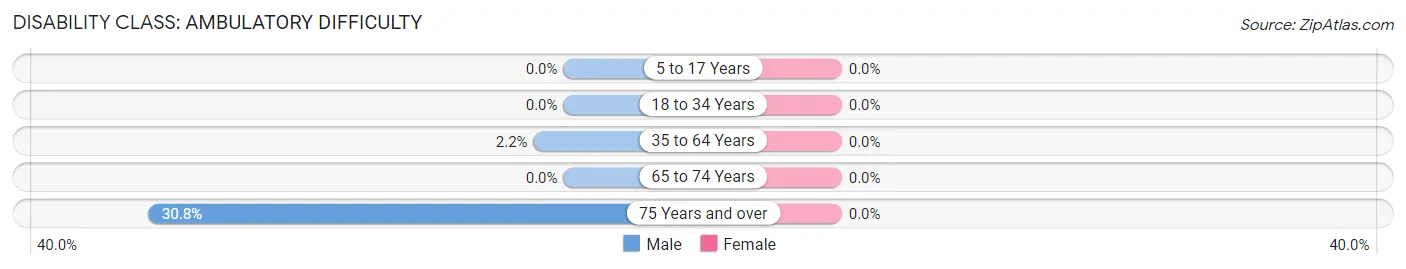
| Age Bracket | Male | Female |
| 5 to 17 Years | 0 (0.0%) | 0 (0.0%) |
| 18 to 34 Years | 0 (0.0%) | 0 (0.0%) |
| 35 to 64 Years | 8 (2.2%) | 0 (0.0%) |
| 65 to 74 Years | 0 (0.0%) | 0 (0.0%) |
| 75 Years and over | 8 (30.8%) | 0 (0.0%) |
Disability Class: Self-Care Difficulty
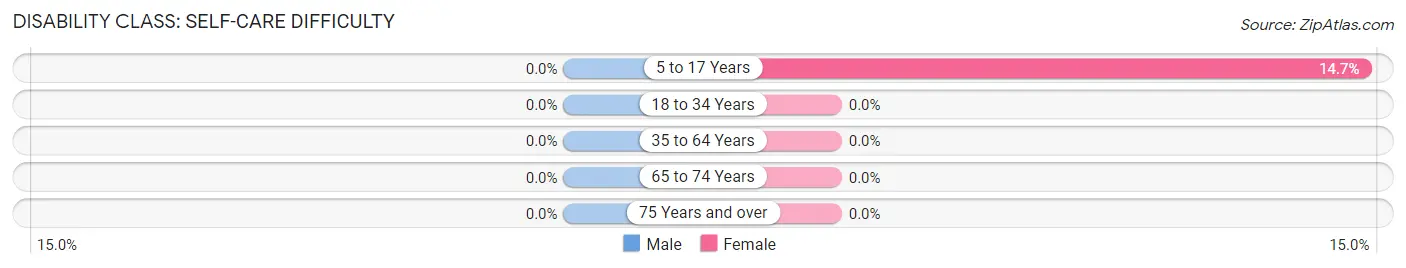
| Age Bracket | Male | Female |
| 5 to 17 Years | 0 (0.0%) | 14 (14.7%) |
| 18 to 34 Years | 0 (0.0%) | 0 (0.0%) |
| 35 to 64 Years | 0 (0.0%) | 0 (0.0%) |
| 65 to 74 Years | 0 (0.0%) | 0 (0.0%) |
| 75 Years and over | 0 (0.0%) | 0 (0.0%) |
Technology Access in Cavalero
Computing Device Access in Cavalero
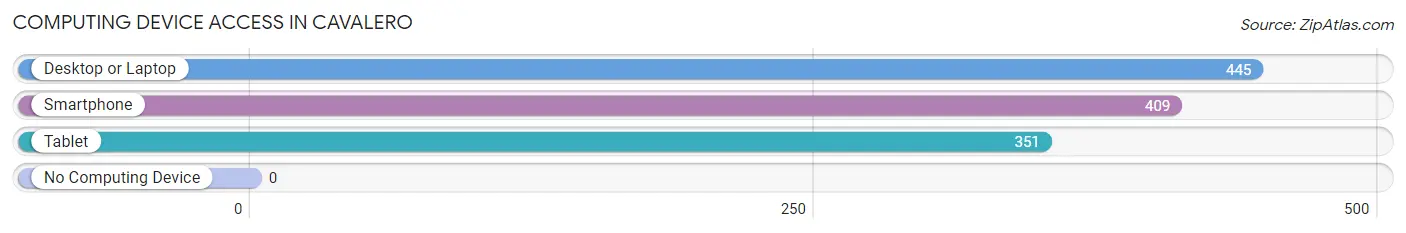
| Device Type | # Households | % Households |
| Desktop or Laptop | 445 | 100.0% |
| Smartphone | 409 | 91.9% |
| Tablet | 351 | 78.9% |
| No Computing Device | 0 | 0.0% |
| Total | 445 | 100.0% |
Internet Access in Cavalero
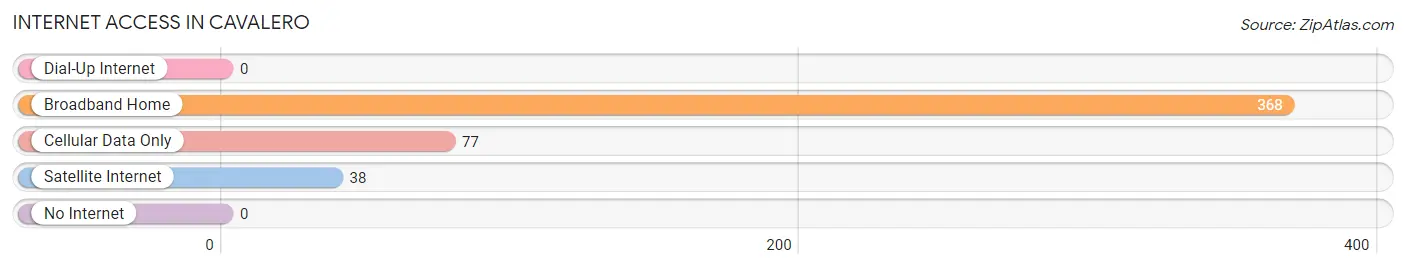
| Internet Type | # Households | % Households |
| Dial-Up Internet | 0 | 0.0% |
| Broadband Home | 368 | 82.7% |
| Cellular Data Only | 77 | 17.3% |
| Satellite Internet | 38 | 8.5% |
| No Internet | 0 | 0.0% |
| Total | 445 | 100.0% |
Cavalero Summary
Washington is a state located in the Pacific Northwest region of the United States. It is bordered by Oregon to the south, Idaho to the east, and the Canadian province of British Columbia to the north. Washington is the 18th largest state in the United States, with an area of 71,362 square miles, and the 13th most populous state, with a population of 7.4 million as of 2019. The state capital is Olympia, and the largest city is Seattle.
History
The area that is now Washington was first inhabited by Native American tribes, including the Chinook, Nisqually, and Yakama. The first European to explore the area was British explorer George Vancouver in 1792. The area was part of the Oregon Country, a disputed region between the United States and Britain until 1846, when the Oregon Treaty established the 49th parallel as the border between the two countries.
In 1853, Washington became a U.S. territory, and in 1889 it was admitted to the Union as the 42nd state. During the late 19th and early 20th centuries, Washington experienced a period of rapid growth and industrialization, driven by the timber, mining, and fishing industries. The state also became a major producer of hydroelectric power, and the Grand Coulee Dam, completed in 1941, was the largest concrete structure in the world at the time.
Geography
Washington is located in the Pacific Northwest region of the United States. It is bordered by Oregon to the south, Idaho to the east, and the Canadian province of British Columbia to the north. The state has a total area of 71,362 square miles, making it the 18th largest state in the country.
Washington is divided into three distinct geographic regions: the Cascade Mountains, the Columbia Plateau, and the Olympic Peninsula. The Cascade Mountains run through the western part of the state, and are home to several active volcanoes, including Mount Rainier, the highest peak in the state at 14,411 feet. The Columbia Plateau is located in the eastern part of the state, and is characterized by rolling hills and wide river valleys. The Olympic Peninsula is located in the northwest corner of the state, and is home to temperate rainforests and rugged coastline.
Economy
Washington has a diverse and robust economy, with a gross state product of $521 billion in 2018. The state is a major producer of timber, and the lumber and wood products industry is the largest in the state. Other major industries include aerospace, technology, agriculture, and tourism.
Washington is also home to several major companies, including Microsoft, Amazon, Starbucks, and Boeing. The state is also a major producer of hydroelectric power, and the Grand Coulee Dam is the largest hydroelectric power producer in the United States.
Demographics
As of 2019, Washington had a population of 7.4 million, making it the 13th most populous state in the country. The state is ethnically and racially diverse, with the largest ethnic groups being White (77.2%), Hispanic or Latino (11.2%), and Asian (7.2%).
The median household income in Washington is $71,835, and the poverty rate is 10.2%. The largest cities in the state are Seattle, Spokane, Tacoma, Vancouver, and Bellevue.
Common Questions
What is Per Capita Income in Cavalero?
Per Capita income in Cavalero is $48,181.
What is the Median Family Income in Cavalero?
Median Family Income in Cavalero is $138,851.
What is the Median Household income in Cavalero?
Median Household Income in Cavalero is $138,693.
What is Income or Wage Gap in Cavalero?
Income or Wage Gap in Cavalero is 31.2%.
Women in Cavalero earn 68.8 cents for every dollar earned by a man.
What is Inequality or Gini Index in Cavalero?
Inequality or Gini Index in Cavalero is 0.23.
What is the Total Population of Cavalero?
Total Population of Cavalero is 1,457.
What is the Total Male Population of Cavalero?
Total Male Population of Cavalero is 877.
What is the Total Female Population of Cavalero?
Total Female Population of Cavalero is 580.
What is the Ratio of Males per 100 Females in Cavalero?
There are 151.21 Males per 100 Females in Cavalero.
What is the Ratio of Females per 100 Males in Cavalero?
There are 66.13 Females per 100 Males in Cavalero.
What is the Median Population Age in Cavalero?
Median Population Age in Cavalero is 34.3 Years.
What is the Average Family Size in Cavalero
Average Family Size in Cavalero is 3.5 People.
What is the Average Household Size in Cavalero
Average Household Size in Cavalero is 3.3 People.
How Large is the Labor Force in Cavalero?
There are 771 People in the Labor Forcein in Cavalero.
What is the Percentage of People in the Labor Force in Cavalero?
76.0% of People are in the Labor Force in Cavalero.