Wilson Creek, WA Map & Demographics
Wilson Creek Map
Wilson Creek Overview
$23,314
PER CAPITA INCOME
$61,607
AVG FAMILY INCOME
$36,250
AVG HOUSEHOLD INCOME
62.8%
WAGE / INCOME GAP [ % ]
37.2¢/ $1
WAGE / INCOME GAP [ $ ]
$3,250
FAMILY INCOME DEFICIT
0.45
INEQUALITY / GINI INDEX
174
TOTAL POPULATION
80
MALE POPULATION
94
FEMALE POPULATION
85.11
MALES / 100 FEMALES
117.50
FEMALES / 100 MALES
50.3
MEDIAN AGE
3.0
AVG FAMILY SIZE
2.1
AVG HOUSEHOLD SIZE
60
LABOR FORCE [ PEOPLE ]
42.9%
PERCENT IN LABOR FORCE
6.7%
UNEMPLOYMENT RATE
Wilson Creek Zip Codes
Wilson Creek Area Codes
Income in Wilson Creek
Income Overview in Wilson Creek
Per Capita Income in Wilson Creek is $23,314, while median incomes of families and households are $61,607 and $36,250 respectively.
| Characteristic | Number | Measure |
| Per Capita Income | 174 | $23,314 |
| Median Family Income | 43 | $61,607 |
| Mean Family Income | 43 | $66,716 |
| Median Household Income | 84 | $36,250 |
| Mean Household Income | 84 | $48,304 |
| Income Deficit | 43 | $3,250 |
| Wage / Income Gap (%) | 174 | 62.81% |
| Wage / Income Gap ($) | 174 | 37.19¢ per $1 |
| Gini / Inequality Index | 174 | 0.45 |
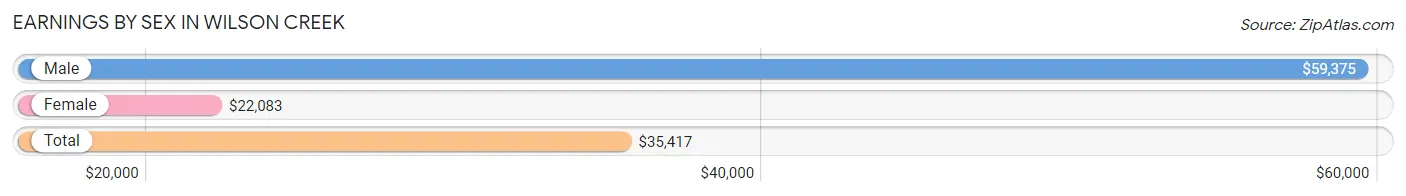
Earnings by Sex in Wilson Creek
Average Earnings in Wilson Creek are $35,417, $59,375 for men and $22,083 for women, a difference of 62.8%.
| Sex | Number | Average Earnings |
| Male | 29 (46.0%) | $59,375 |
| Female | 34 (54.0%) | $22,083 |
| Total | 63 (100.0%) | $35,417 |
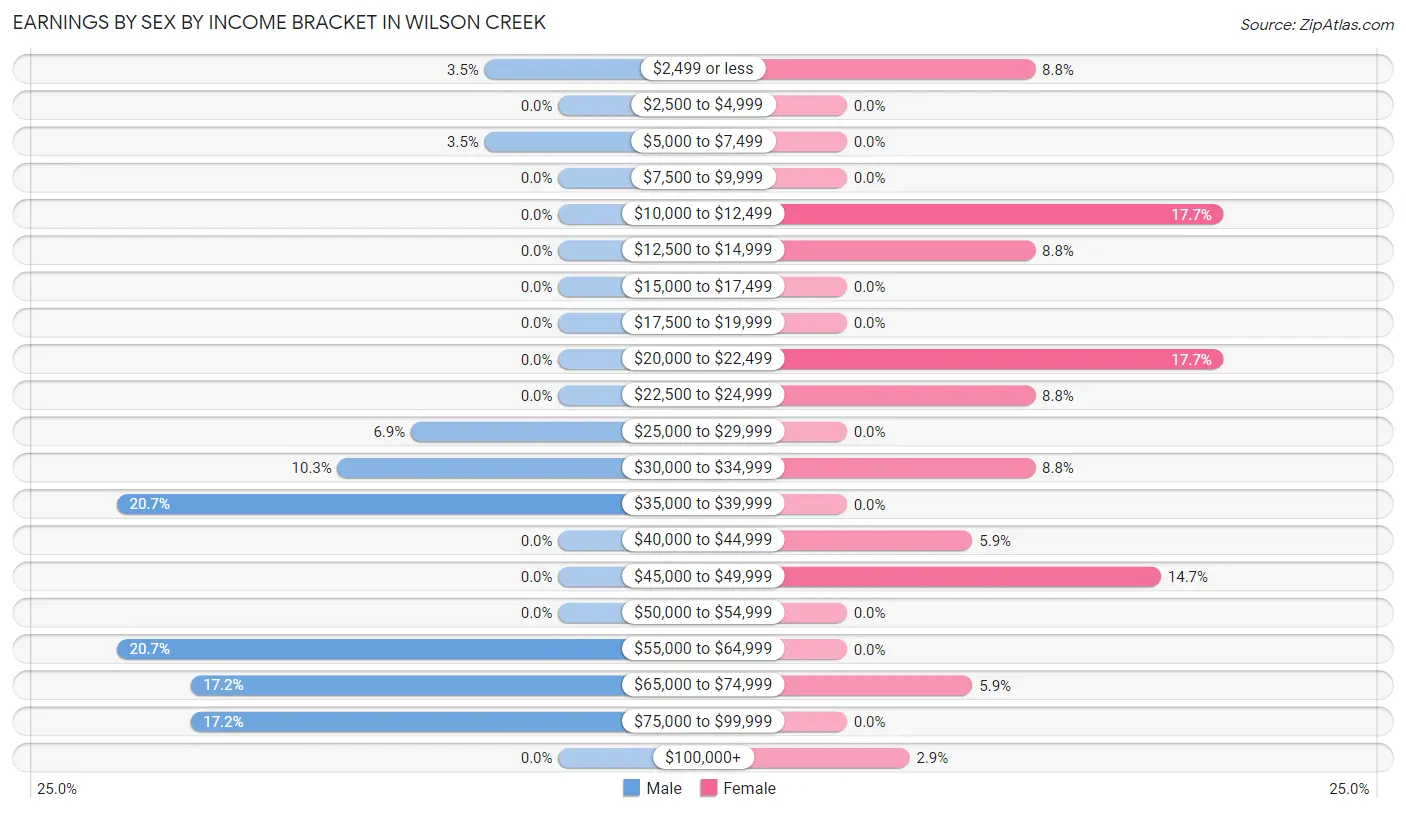
Earnings by Sex by Income Bracket in Wilson Creek
The most common earnings brackets in Wilson Creek are $35,000 to $39,999 for men (6 | 20.7%) and $10,000 to $12,499 for women (6 | 17.6%).
| Income | Male | Female |
| $2,499 or less | 1 (3.5%) | 3 (8.8%) |
| $2,500 to $4,999 | 0 (0.0%) | 0 (0.0%) |
| $5,000 to $7,499 | 1 (3.5%) | 0 (0.0%) |
| $7,500 to $9,999 | 0 (0.0%) | 0 (0.0%) |
| $10,000 to $12,499 | 0 (0.0%) | 6 (17.6%) |
| $12,500 to $14,999 | 0 (0.0%) | 3 (8.8%) |
| $15,000 to $17,499 | 0 (0.0%) | 0 (0.0%) |
| $17,500 to $19,999 | 0 (0.0%) | 0 (0.0%) |
| $20,000 to $22,499 | 0 (0.0%) | 6 (17.6%) |
| $22,500 to $24,999 | 0 (0.0%) | 3 (8.8%) |
| $25,000 to $29,999 | 2 (6.9%) | 0 (0.0%) |
| $30,000 to $34,999 | 3 (10.3%) | 3 (8.8%) |
| $35,000 to $39,999 | 6 (20.7%) | 0 (0.0%) |
| $40,000 to $44,999 | 0 (0.0%) | 2 (5.9%) |
| $45,000 to $49,999 | 0 (0.0%) | 5 (14.7%) |
| $50,000 to $54,999 | 0 (0.0%) | 0 (0.0%) |
| $55,000 to $64,999 | 6 (20.7%) | 0 (0.0%) |
| $65,000 to $74,999 | 5 (17.2%) | 2 (5.9%) |
| $75,000 to $99,999 | 5 (17.2%) | 0 (0.0%) |
| $100,000+ | 0 (0.0%) | 1 (2.9%) |
| Total | 29 (100.0%) | 34 (100.0%) |
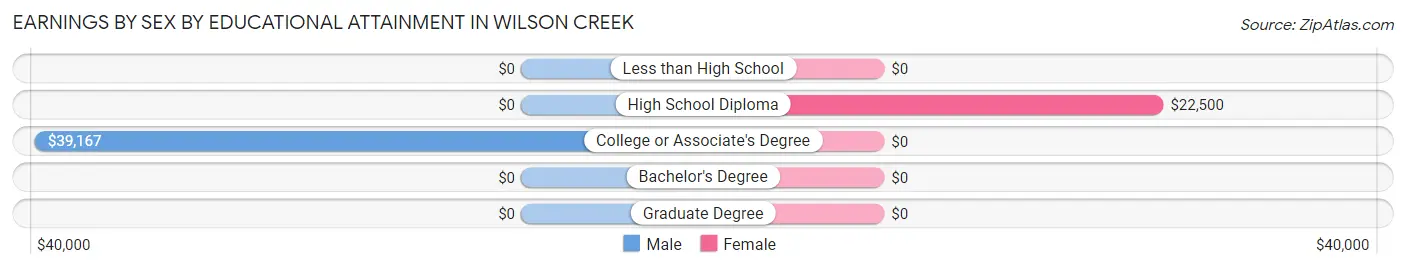
Earnings by Sex by Educational Attainment in Wilson Creek
Average earnings in Wilson Creek are $60,000 for men and $21,458 for women, a difference of 64.2%. Men with an educational attainment of college or associate's degree enjoy the highest average annual earnings of $39,167, while those with college or associate's degree education earn the least with $39,167. Women with an educational attainment of high school diploma earn the most with the average annual earnings of $22,500, while those with high school diploma education have the smallest earnings of $22,500.
| Educational Attainment | Male Income | Female Income |
| Less than High School | - | - |
| High School Diploma | - | - |
| College or Associate's Degree | $39,167 | $0 |
| Bachelor's Degree | - | - |
| Graduate Degree | - | - |
| Total | $60,000 | $21,458 |
Family Income in Wilson Creek
Family Income Brackets in Wilson Creek
According to the Wilson Creek family income data, there are 11 families falling into the $50,000 to $74,999 income range, which is the most common income bracket and makes up 25.6% of all families.
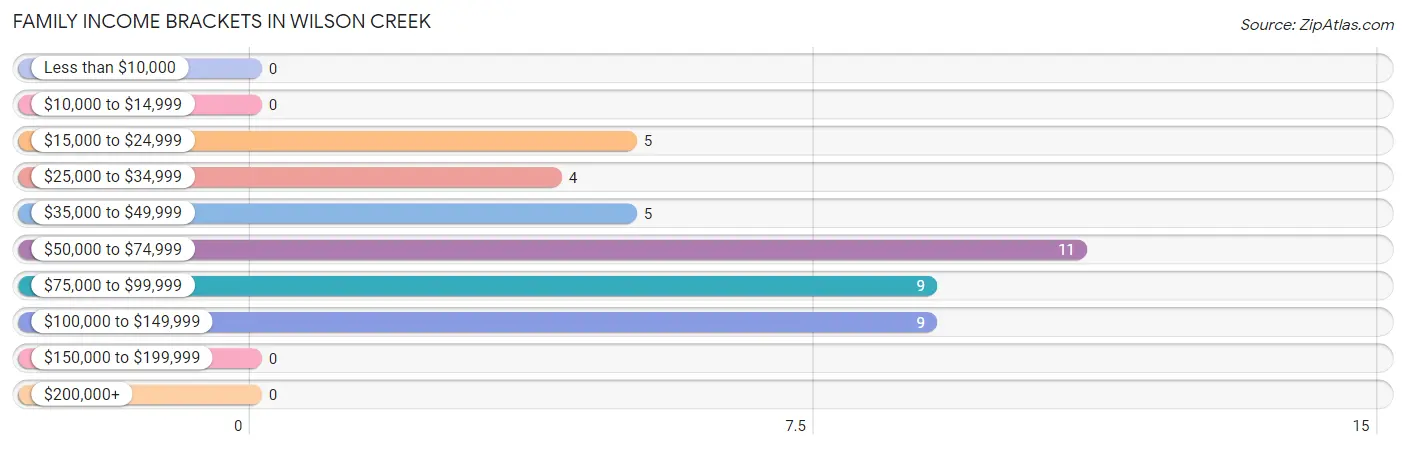
| Income Bracket | # Families | % Families |
| Less than $10,000 | 0 | 0.0% |
| $10,000 to $14,999 | 0 | 0.0% |
| $15,000 to $24,999 | 5 | 11.6% |
| $25,000 to $34,999 | 4 | 9.3% |
| $35,000 to $49,999 | 5 | 11.6% |
| $50,000 to $74,999 | 11 | 25.6% |
| $75,000 to $99,999 | 9 | 20.9% |
| $100,000 to $149,999 | 9 | 20.9% |
| $150,000 to $199,999 | 0 | 0.0% |
| $200,000+ | 0 | 0.0% |
Family Income by Famaliy Size in Wilson Creek
2-person families (28 | 65.1%) account for the highest median family income in Wilson Creek with $70,000 per family, while 2-person families (28 | 65.1%) have the highest median income of $35,000 per family member.
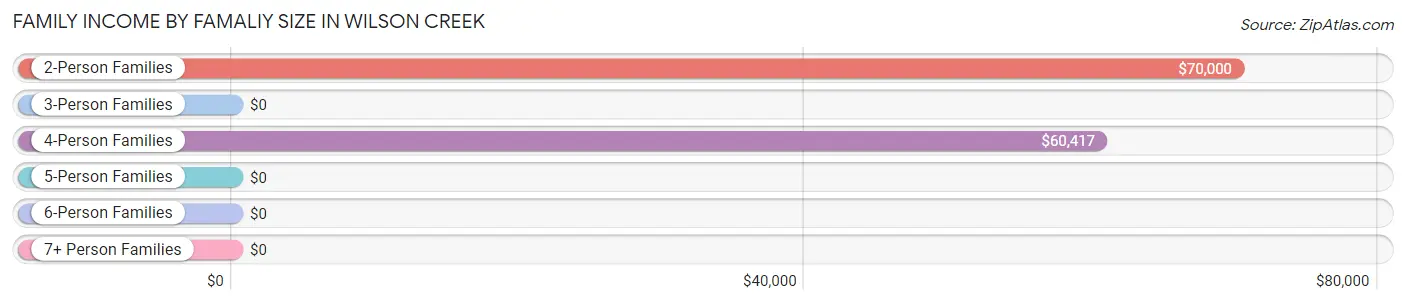
| Income Bracket | # Families | Median Income |
| 2-Person Families | 28 (65.1%) | $70,000 |
| 3-Person Families | 1 (2.3%) | $0 |
| 4-Person Families | 5 (11.6%) | $60,417 |
| 5-Person Families | 8 (18.6%) | $0 |
| 6-Person Families | 1 (2.3%) | $0 |
| 7+ Person Families | 0 (0.0%) | $0 |
| Total | 43 (100.0%) | $61,607 |
Family Income by Number of Earners in Wilson Creek
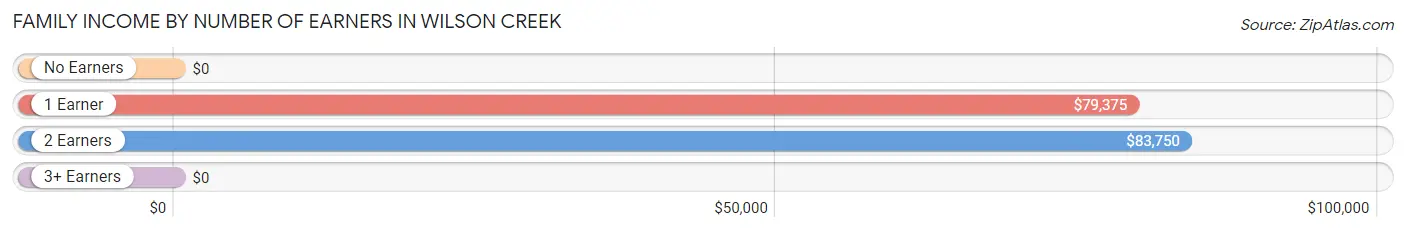
| Number of Earners | # Families | Median Income |
| No Earners | 12 (27.9%) | $0 |
| 1 Earner | 21 (48.8%) | $79,375 |
| 2 Earners | 9 (20.9%) | $83,750 |
| 3+ Earners | 1 (2.3%) | $0 |
| Total | 43 (100.0%) | $61,607 |
Household Income in Wilson Creek
Household Income Brackets in Wilson Creek
With 18 households falling in the category, the $25,000 to $34,999 income range is the most frequent in Wilson Creek, accounting for 21.4% of all households.
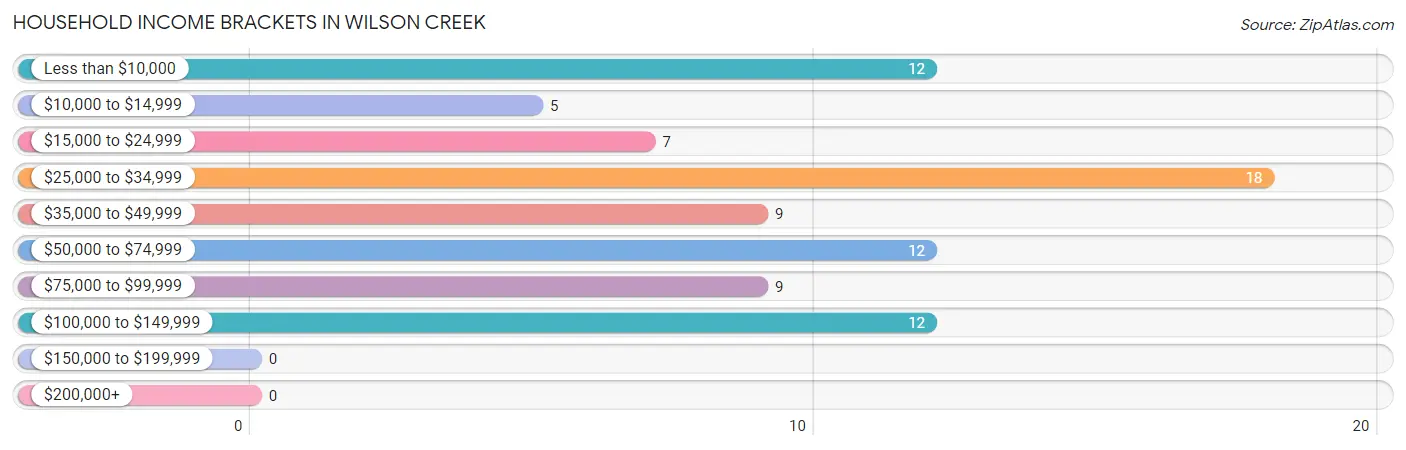
| Income Bracket | # Households | % Households |
| Less than $10,000 | 12 | 14.3% |
| $10,000 to $14,999 | 5 | 6.0% |
| $15,000 to $24,999 | 7 | 8.3% |
| $25,000 to $34,999 | 18 | 21.4% |
| $35,000 to $49,999 | 9 | 10.7% |
| $50,000 to $74,999 | 12 | 14.3% |
| $75,000 to $99,999 | 9 | 10.7% |
| $100,000 to $149,999 | 12 | 14.3% |
| $150,000 to $199,999 | 0 | 0.0% |
| $200,000+ | 0 | 0.0% |
Household Income by Householder Age in Wilson Creek
The median household income in Wilson Creek is $36,250, with the highest median household income of $38,333 found in the 25 to 44 years age bracket for the primary householder. A total of 16 households (19.1%) fall into this category.
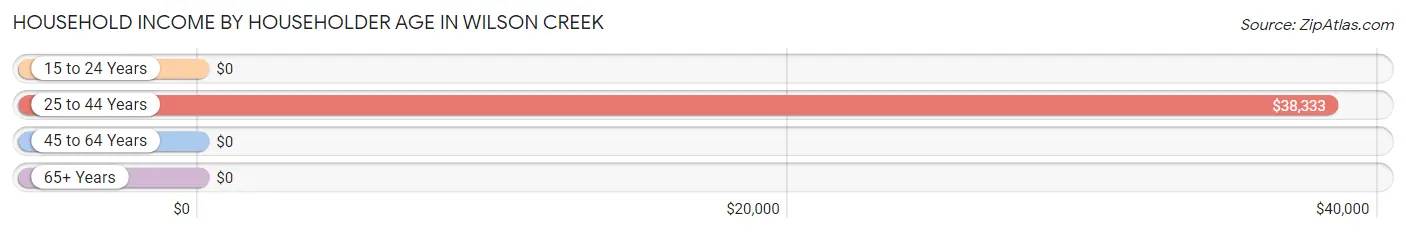
| Income Bracket | # Households | Median Income |
| 15 to 24 Years | 0 (0.0%) | $0 |
| 25 to 44 Years | 16 (19.1%) | $38,333 |
| 45 to 64 Years | 23 (27.4%) | $0 |
| 65+ Years | 45 (53.6%) | $0 |
| Total | 84 (100.0%) | $36,250 |
Poverty in Wilson Creek
Income Below Poverty by Sex and Age in Wilson Creek
With 13.8% poverty level for males and 26.6% for females among the residents of Wilson Creek, 16 and 17 year old males and 15 year old females are the most vulnerable to poverty, with 1 males (33.3%) and 1 females (100.0%) in their respective age groups living below the poverty level.
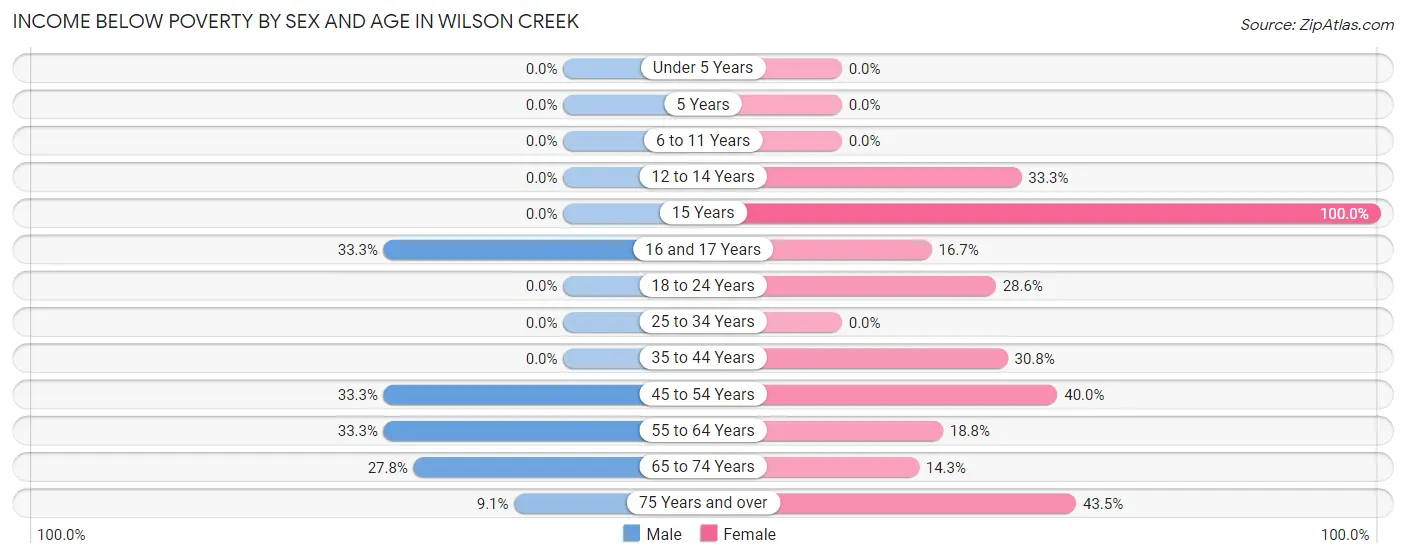
| Age Bracket | Male | Female |
| Under 5 Years | 0 (0.0%) | 0 (0.0%) |
| 5 Years | 0 (0.0%) | 0 (0.0%) |
| 6 to 11 Years | 0 (0.0%) | 0 (0.0%) |
| 12 to 14 Years | 0 (0.0%) | 1 (33.3%) |
| 15 Years | 0 (0.0%) | 1 (100.0%) |
| 16 and 17 Years | 1 (33.3%) | 1 (16.7%) |
| 18 to 24 Years | 0 (0.0%) | 2 (28.6%) |
| 25 to 34 Years | 0 (0.0%) | 0 (0.0%) |
| 35 to 44 Years | 0 (0.0%) | 4 (30.8%) |
| 45 to 54 Years | 2 (33.3%) | 2 (40.0%) |
| 55 to 64 Years | 2 (33.3%) | 3 (18.8%) |
| 65 to 74 Years | 5 (27.8%) | 1 (14.3%) |
| 75 Years and over | 1 (9.1%) | 10 (43.5%) |
| Total | 11 (13.8%) | 25 (26.6%) |
Income Above Poverty by Sex and Age in Wilson Creek
According to the poverty statistics in Wilson Creek, males aged under 5 years and females aged under 5 years are the age groups that are most secure financially, with 100.0% of males and 100.0% of females in these age groups living above the poverty line.
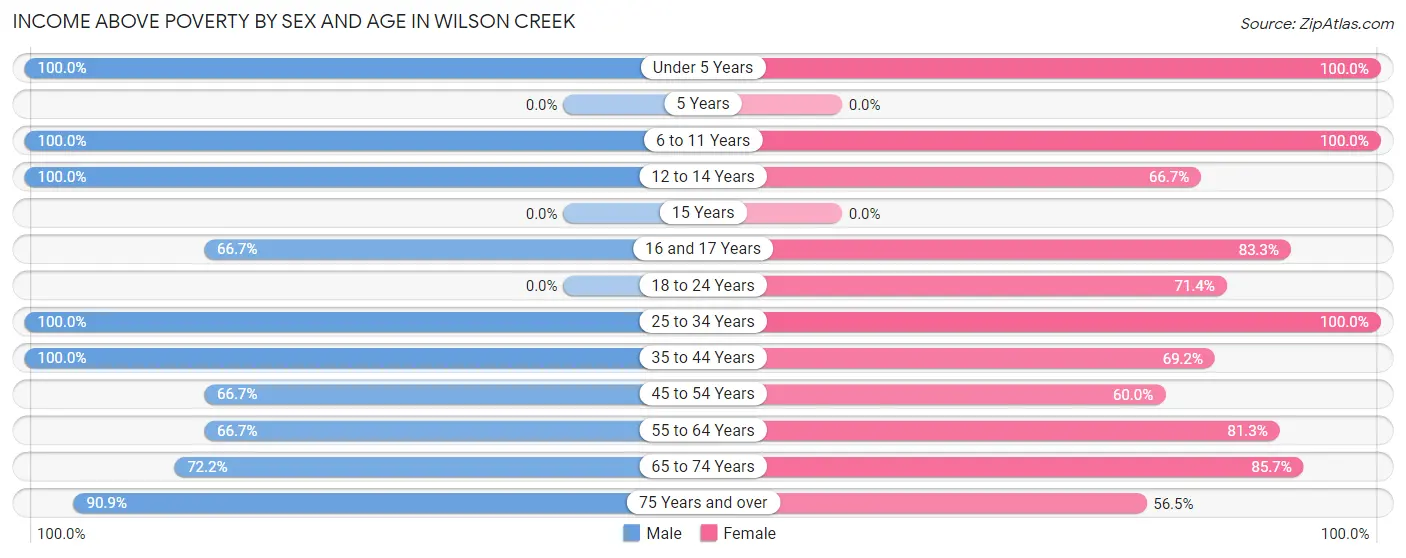
| Age Bracket | Male | Female |
| Under 5 Years | 1 (100.0%) | 4 (100.0%) |
| 5 Years | 0 (0.0%) | 0 (0.0%) |
| 6 to 11 Years | 14 (100.0%) | 2 (100.0%) |
| 12 to 14 Years | 9 (100.0%) | 2 (66.7%) |
| 15 Years | 0 (0.0%) | 0 (0.0%) |
| 16 and 17 Years | 2 (66.7%) | 5 (83.3%) |
| 18 to 24 Years | 0 (0.0%) | 5 (71.4%) |
| 25 to 34 Years | 4 (100.0%) | 7 (100.0%) |
| 35 to 44 Years | 8 (100.0%) | 9 (69.2%) |
| 45 to 54 Years | 4 (66.7%) | 3 (60.0%) |
| 55 to 64 Years | 4 (66.7%) | 13 (81.2%) |
| 65 to 74 Years | 13 (72.2%) | 6 (85.7%) |
| 75 Years and over | 10 (90.9%) | 13 (56.5%) |
| Total | 69 (86.3%) | 69 (73.4%) |
Income Below Poverty Among Married-Couple Families in Wilson Creek
The poverty statistics for married-couple families in Wilson Creek show that 25.0% or 8 of the total 32 families live below the poverty line. Families with 1 or 2 children have the highest poverty rate of 50.0%, comprising of 1 families. On the other hand, families with 3 or 4 children have the lowest poverty rate of 22.2%, which includes 2 families.
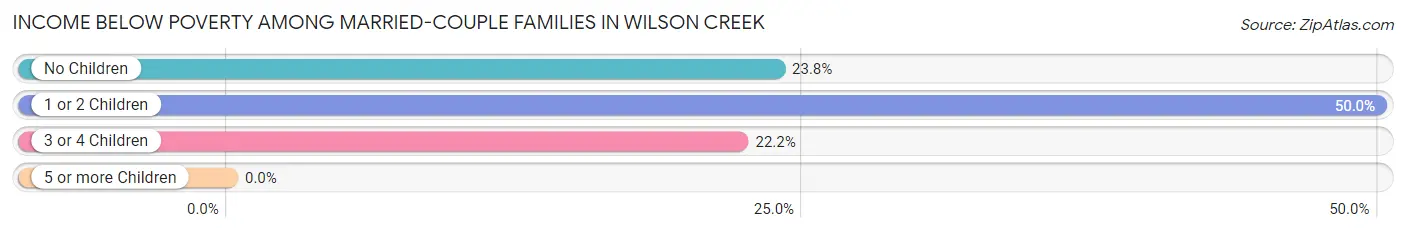
| Children | Above Poverty | Below Poverty |
| No Children | 16 (76.2%) | 5 (23.8%) |
| 1 or 2 Children | 1 (50.0%) | 1 (50.0%) |
| 3 or 4 Children | 7 (77.8%) | 2 (22.2%) |
| 5 or more Children | 0 (0.0%) | 0 (0.0%) |
| Total | 24 (75.0%) | 8 (25.0%) |
Income Below Poverty Among Single-Parent Households in Wilson Creek
| Children | Single Father | Single Mother |
| No Children | 0 (0.0%) | 0 (0.0%) |
| 1 or 2 Children | 0 (0.0%) | 0 (0.0%) |
| 3 or 4 Children | 0 (0.0%) | 0 (0.0%) |
| 5 or more Children | 0 (0.0%) | 0 (0.0%) |
| Total | 0 (0.0%) | 0 (0.0%) |
Income Below Poverty Among Married-Couple vs Single-Parent Households in Wilson Creek
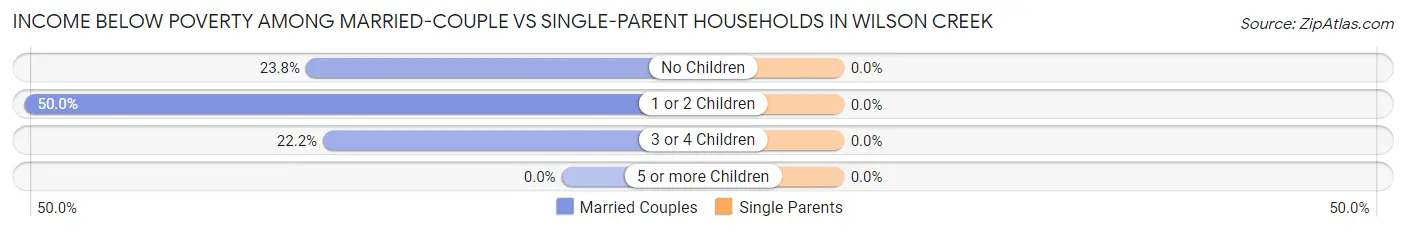
| Children | Married-Couple Families | Single-Parent Households |
| No Children | 5 (23.8%) | 0 (0.0%) |
| 1 or 2 Children | 1 (50.0%) | 0 (0.0%) |
| 3 or 4 Children | 2 (22.2%) | 0 (0.0%) |
| 5 or more Children | 0 (0.0%) | 0 (0.0%) |
| Total | 8 (25.0%) | 0 (0.0%) |
Race in Wilson Creek
The most populous races in Wilson Creek are White / Caucasian (147 | 84.5%), Hispanic or Latino (20 | 11.5%), and Some other Race (20 | 11.5%).
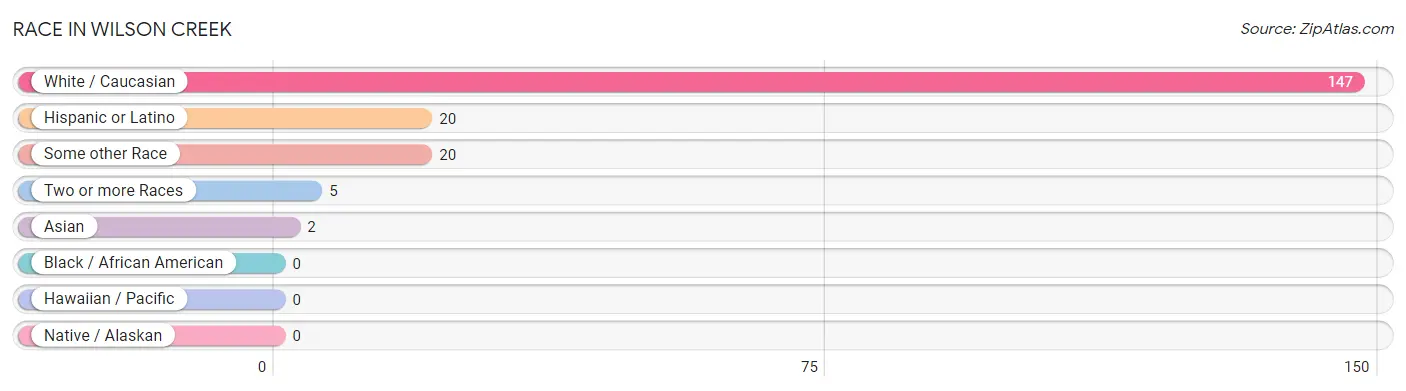
| Race | # Population | % Population |
| Asian | 2 | 1.1% |
| Black / African American | 0 | 0.0% |
| Hawaiian / Pacific | 0 | 0.0% |
| Hispanic or Latino | 20 | 11.5% |
| Native / Alaskan | 0 | 0.0% |
| White / Caucasian | 147 | 84.5% |
| Two or more Races | 5 | 2.9% |
| Some other Race | 20 | 11.5% |
| Total | 174 | 100.0% |
Ancestry in Wilson Creek
The most populous ancestries reported in Wilson Creek are German (30 | 17.2%), English (28 | 16.1%), Norwegian (22 | 12.6%), Central American (15 | 8.6%), and Guatemalan (15 | 8.6%), together accounting for 63.2% of all Wilson Creek residents.
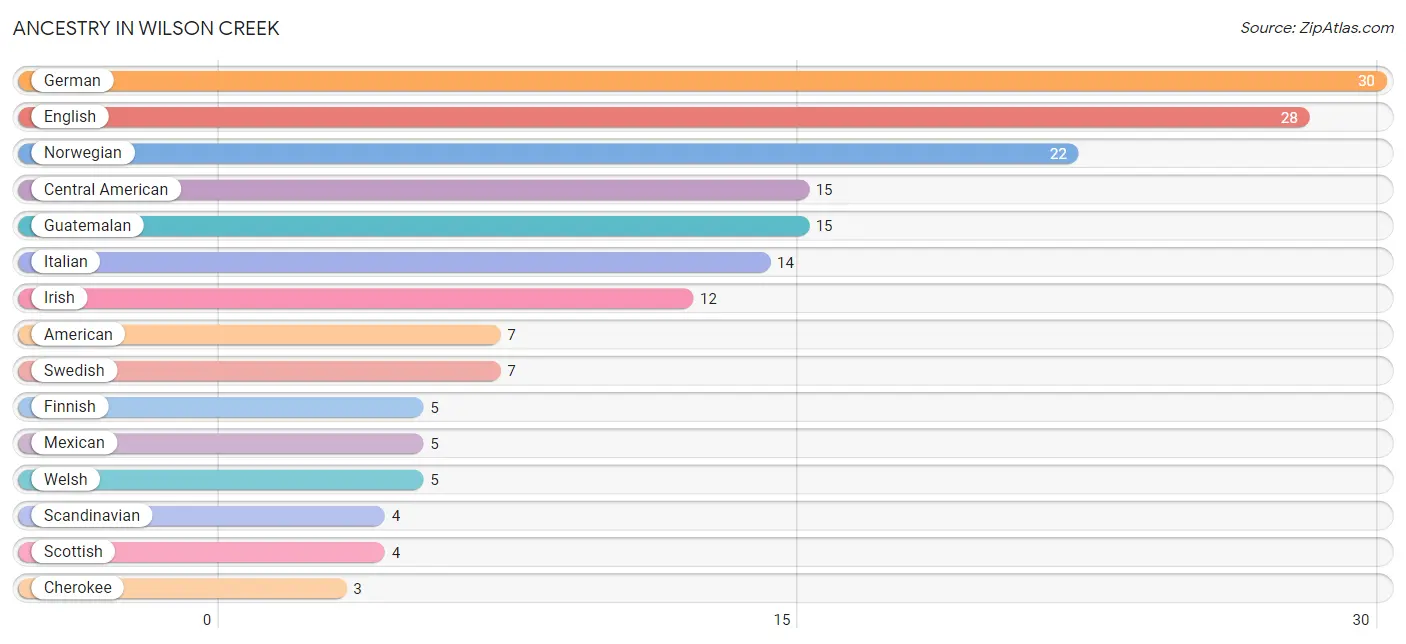
| Ancestry | # Population | % Population |
| American | 7 | 4.0% |
| Bhutanese | 2 | 1.1% |
| British | 2 | 1.1% |
| Central American | 15 | 8.6% |
| Cherokee | 3 | 1.7% |
| English | 28 | 16.1% |
| European | 1 | 0.6% |
| Finnish | 5 | 2.9% |
| German | 30 | 17.2% |
| Guatemalan | 15 | 8.6% |
| Irish | 12 | 6.9% |
| Italian | 14 | 8.1% |
| Mexican | 5 | 2.9% |
| Norwegian | 22 | 12.6% |
| Russian | 2 | 1.1% |
| Scandinavian | 4 | 2.3% |
| Scottish | 4 | 2.3% |
| Swedish | 7 | 4.0% |
| Welsh | 5 | 2.9% | View All 19 Rows |
Immigrants in Wilson Creek

| Immigration Origin | # Population | % Population | View All 0 Rows |
Sex and Age in Wilson Creek
Sex and Age in Wilson Creek
The most populous age groups in Wilson Creek are 10 to 14 Years (16 | 20.0%) for men and 15 to 19 Years (14 | 14.9%) for women.
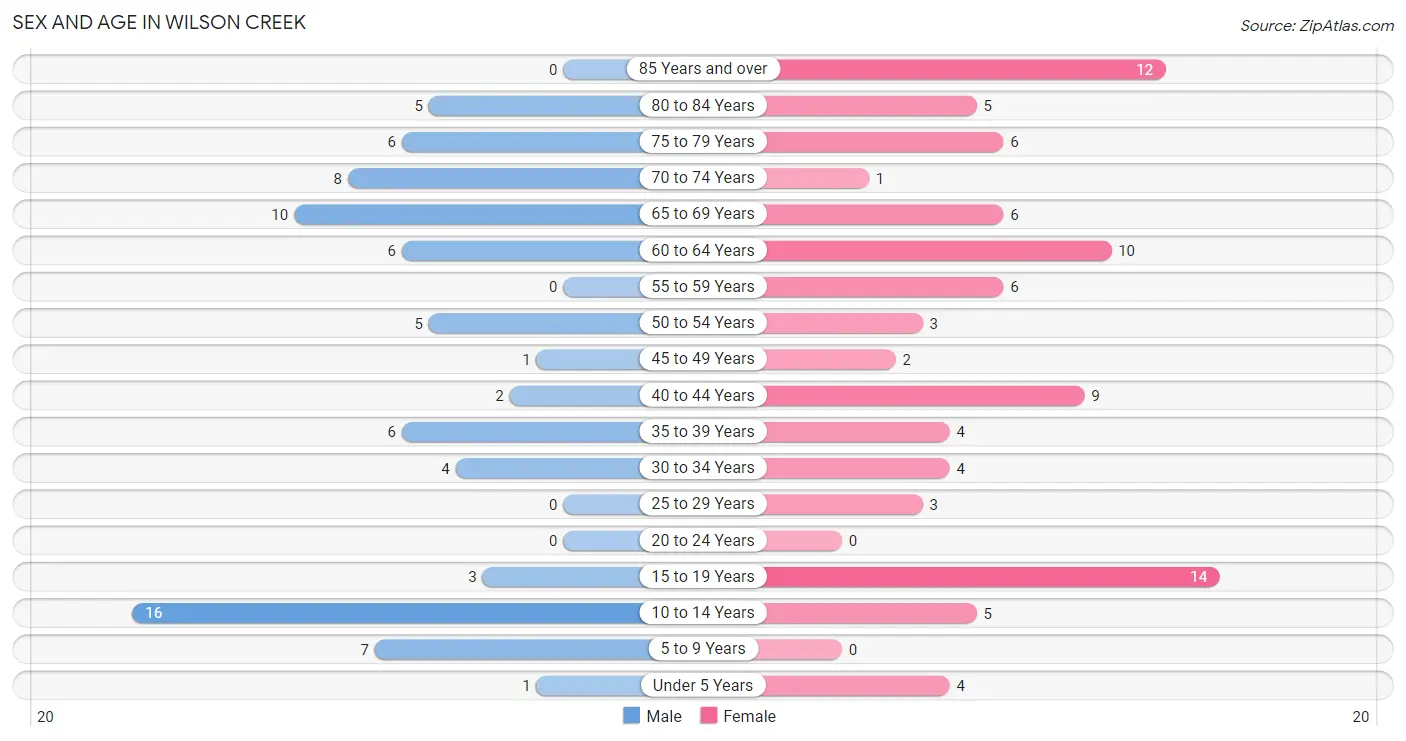
| Age Bracket | Male | Female |
| Under 5 Years | 1 (1.3%) | 4 (4.3%) |
| 5 to 9 Years | 7 (8.7%) | 0 (0.0%) |
| 10 to 14 Years | 16 (20.0%) | 5 (5.3%) |
| 15 to 19 Years | 3 (3.7%) | 14 (14.9%) |
| 20 to 24 Years | 0 (0.0%) | 0 (0.0%) |
| 25 to 29 Years | 0 (0.0%) | 3 (3.2%) |
| 30 to 34 Years | 4 (5.0%) | 4 (4.3%) |
| 35 to 39 Years | 6 (7.5%) | 4 (4.3%) |
| 40 to 44 Years | 2 (2.5%) | 9 (9.6%) |
| 45 to 49 Years | 1 (1.3%) | 2 (2.1%) |
| 50 to 54 Years | 5 (6.2%) | 3 (3.2%) |
| 55 to 59 Years | 0 (0.0%) | 6 (6.4%) |
| 60 to 64 Years | 6 (7.5%) | 10 (10.6%) |
| 65 to 69 Years | 10 (12.5%) | 6 (6.4%) |
| 70 to 74 Years | 8 (10.0%) | 1 (1.1%) |
| 75 to 79 Years | 6 (7.5%) | 6 (6.4%) |
| 80 to 84 Years | 5 (6.2%) | 5 (5.3%) |
| 85 Years and over | 0 (0.0%) | 12 (12.8%) |
| Total | 80 (100.0%) | 94 (100.0%) |
Families and Households in Wilson Creek
Median Family Size in Wilson Creek
The median family size in Wilson Creek is 3.02 persons per family, with single female/mother families (8 | 18.6%) accounting for the largest median family size of 3.38 persons per family. On the other hand, single male/father families (3 | 7.0%) represent the smallest median family size with 2.00 persons per family.
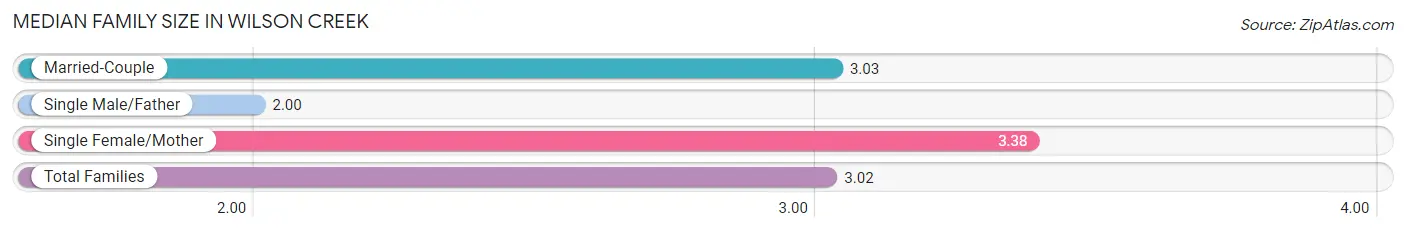
| Family Type | # Families | Family Size |
| Married-Couple | 32 (74.4%) | 3.03 |
| Single Male/Father | 3 (7.0%) | 2.00 |
| Single Female/Mother | 8 (18.6%) | 3.38 |
| Total Families | 43 (100.0%) | 3.02 |
Median Household Size in Wilson Creek
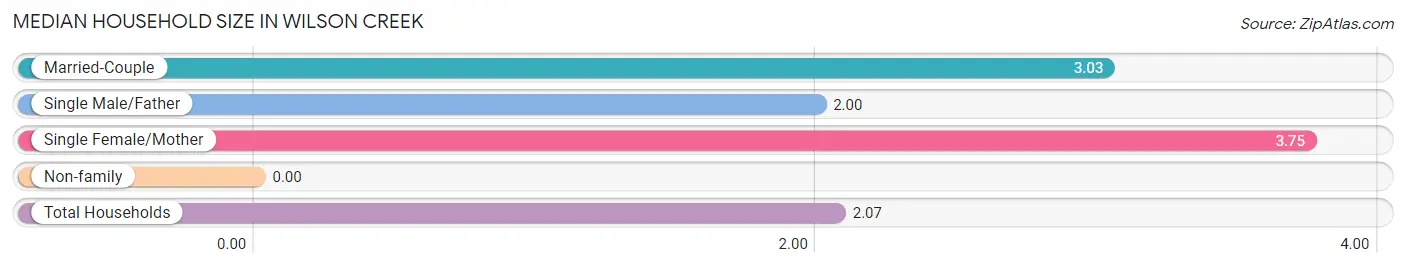
| Household Type | # Households | Household Size |
| Married-Couple | 32 (38.1%) | 3.03 |
| Single Male/Father | 3 (3.6%) | 2.00 |
| Single Female/Mother | 8 (9.5%) | 3.75 |
| Non-family | 41 (48.8%) | - |
| Total Households | 84 (100.0%) | 2.07 |
Household Size by Marriage Status in Wilson Creek
Out of a total of 84 households in Wilson Creek, 43 (51.2%) are family households, while 41 (48.8%) are nonfamily households. The most numerous type of family households are 2-person households, comprising 28, and the most common type of nonfamily households are 1-person households, comprising 41.
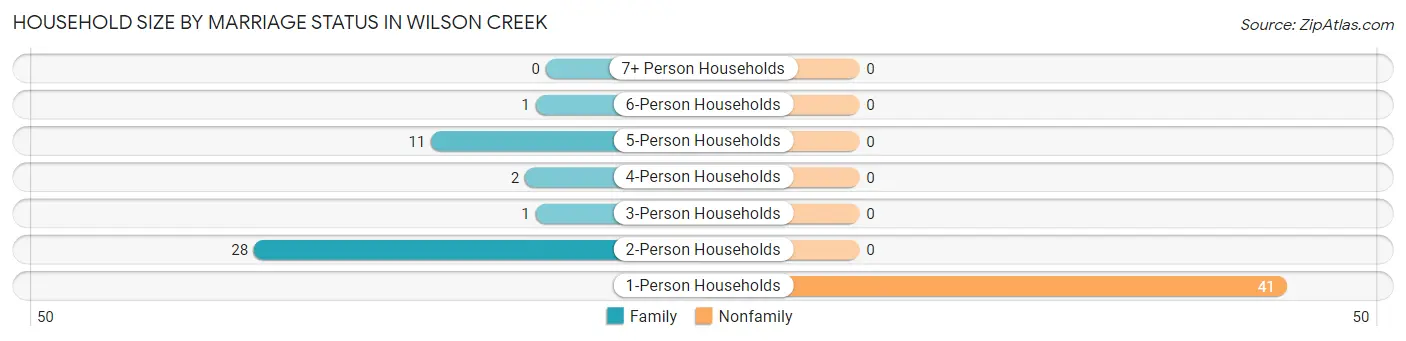
| Household Size | Family Households | Nonfamily Households |
| 1-Person Households | - | 41 (48.8%) |
| 2-Person Households | 28 (33.3%) | 0 (0.0%) |
| 3-Person Households | 1 (1.2%) | 0 (0.0%) |
| 4-Person Households | 2 (2.4%) | 0 (0.0%) |
| 5-Person Households | 11 (13.1%) | 0 (0.0%) |
| 6-Person Households | 1 (1.2%) | 0 (0.0%) |
| 7+ Person Households | 0 (0.0%) | 0 (0.0%) |
| Total | 43 (51.2%) | 41 (48.8%) |
Female Fertility in Wilson Creek
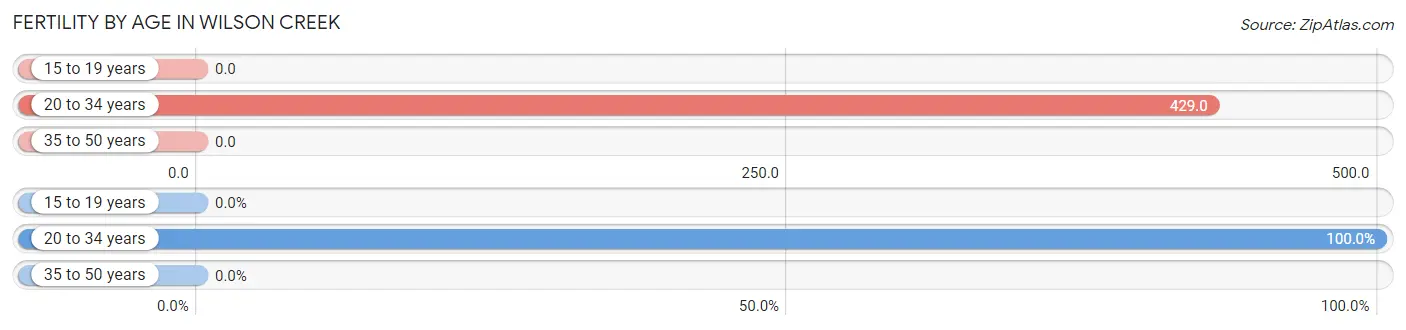
Fertility by Age in Wilson Creek
Average fertility rate in Wilson Creek is 79.0 births per 1,000 women. Women in the age bracket of 20 to 34 years have the highest fertility rate with 429.0 births per 1,000 women. Women in the age bracket of 20 to 34 years acount for 100.0% of all women with births.
| Age Bracket | Women with Births | Births / 1,000 Women |
| 15 to 19 years | 0 (0.0%) | 0.0 |
| 20 to 34 years | 3 (100.0%) | 429.0 |
| 35 to 50 years | 0 (0.0%) | 0.0 |
| Total | 3 (100.0%) | 79.0 |
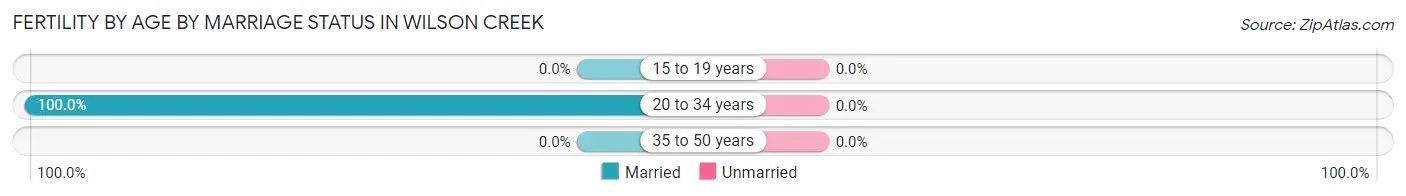
Fertility by Age by Marriage Status in Wilson Creek
| Age Bracket | Married | Unmarried |
| 15 to 19 years | 0 (0.0%) | 0 (0.0%) |
| 20 to 34 years | 3 (100.0%) | 0 (0.0%) |
| 35 to 50 years | 0 (0.0%) | 0 (0.0%) |
| Total | 3 (100.0%) | 0 (0.0%) |
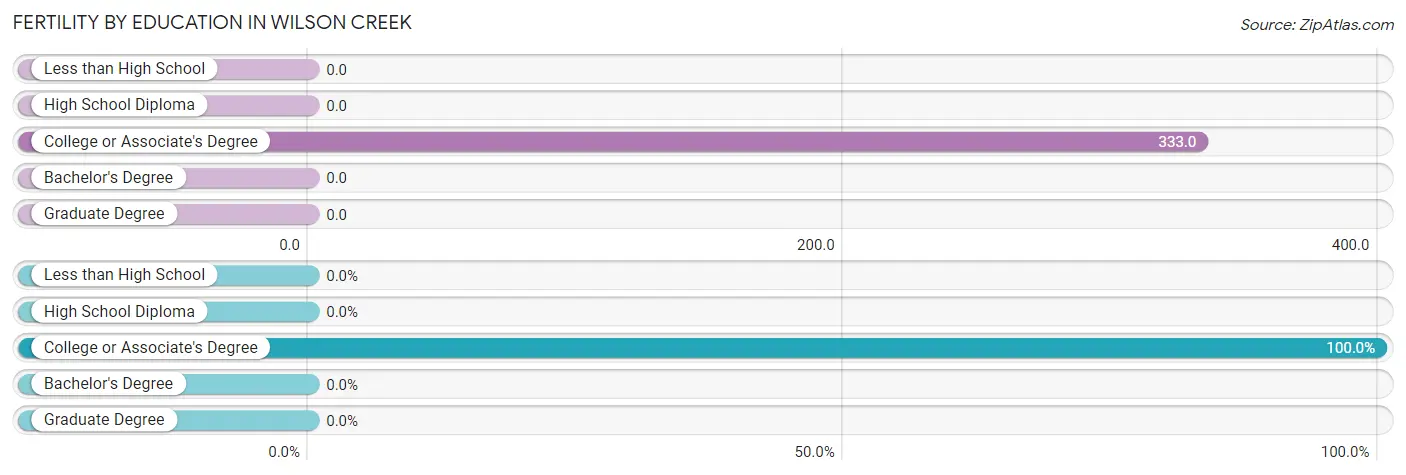
Fertility by Education in Wilson Creek
| Educational Attainment | Women with Births | Births / 1,000 Women |
| Less than High School | 0 (0.0%) | 0.0 |
| High School Diploma | 0 (0.0%) | 0.0 |
| College or Associate's Degree | 3 (100.0%) | 333.0 |
| Bachelor's Degree | 0 (0.0%) | 0.0 |
| Graduate Degree | 0 (0.0%) | 0.0 |
| Total | 3 (100.0%) | 79.0 |
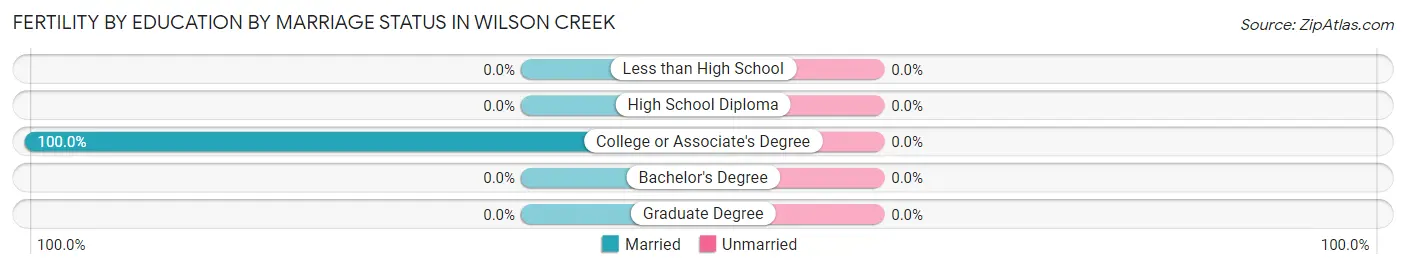
Fertility by Education by Marriage Status in Wilson Creek
| Educational Attainment | Married | Unmarried |
| Less than High School | 0 (0.0%) | 0 (0.0%) |
| High School Diploma | 0 (0.0%) | 0 (0.0%) |
| College or Associate's Degree | 3 (100.0%) | 0 (0.0%) |
| Bachelor's Degree | 0 (0.0%) | 0 (0.0%) |
| Graduate Degree | 0 (0.0%) | 0 (0.0%) |
| Total | 3 (100.0%) | 0 (0.0%) |
Employment Characteristics in Wilson Creek
Employment by Class of Employer in Wilson Creek
Among the 56 employed individuals in Wilson Creek, private company employees (32 | 57.1%), state government employees (10 | 17.9%), and self-employed (incorporated) (5 | 8.9%) make up the most common classes of employment.
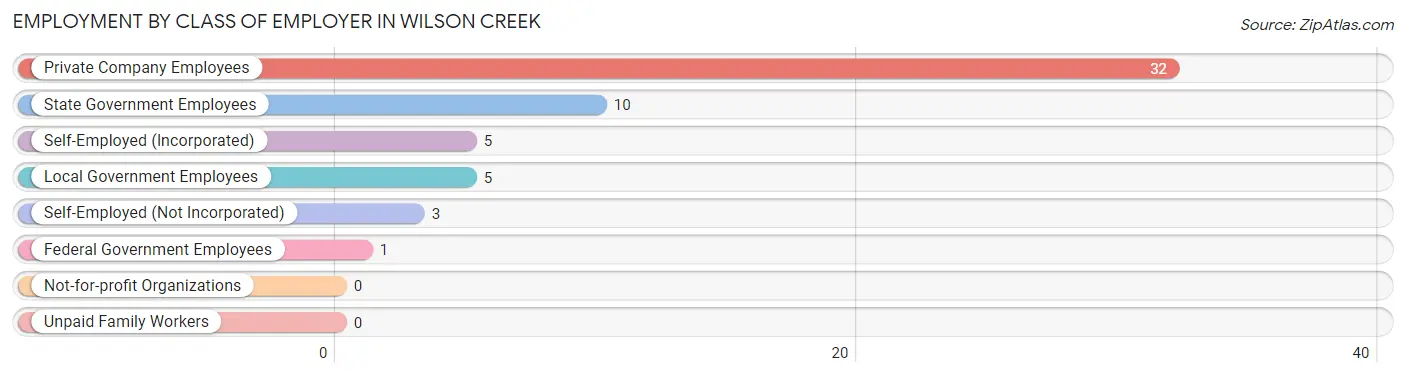
| Employer Class | # Employees | % Employees |
| Private Company Employees | 32 | 57.1% |
| Self-Employed (Incorporated) | 5 | 8.9% |
| Self-Employed (Not Incorporated) | 3 | 5.4% |
| Not-for-profit Organizations | 0 | 0.0% |
| Local Government Employees | 5 | 8.9% |
| State Government Employees | 10 | 17.9% |
| Federal Government Employees | 1 | 1.8% |
| Unpaid Family Workers | 0 | 0.0% |
| Total | 56 | 100.0% |
Employment Status by Age in Wilson Creek
According to the labor force statistics for Wilson Creek, out of the total population over 16 years of age (140), 42.9% or 60 individuals are in the labor force, with 6.7% or 4 of them unemployed. The age group with the highest labor force participation rate is 35 to 44 years, with 100.0% or 21 individuals in the labor force. Within the labor force, the 35 to 44 years age range has the highest percentage of unemployed individuals, with 19.0% or 4 of them being unemployed.
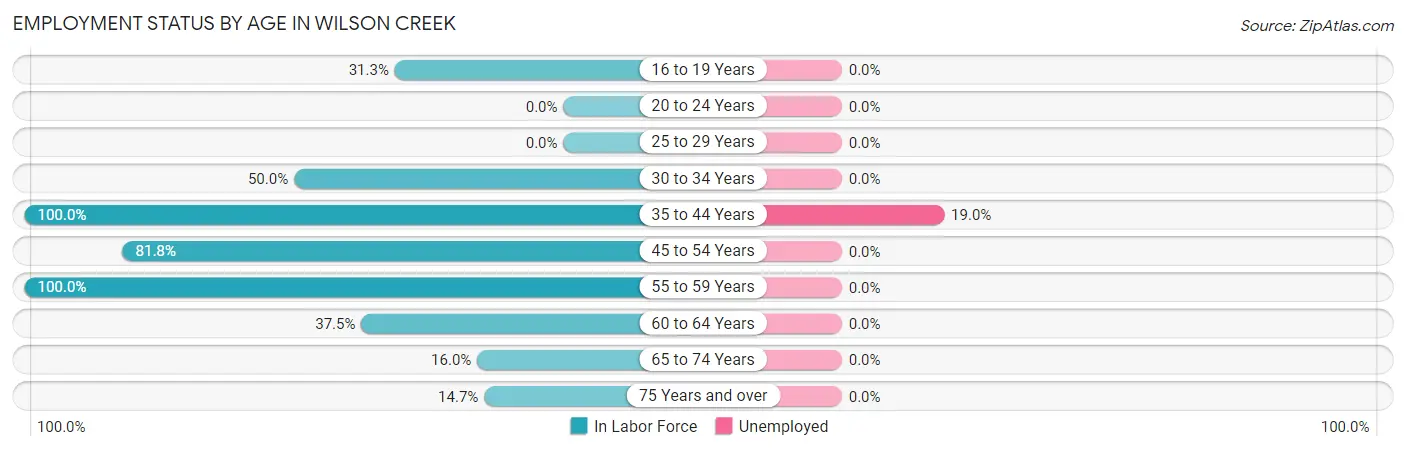
| Age Bracket | In Labor Force | Unemployed |
| 16 to 19 Years | 5 (31.3%) | 0 (0.0%) |
| 20 to 24 Years | 0 (0.0%) | 0 (0.0%) |
| 25 to 29 Years | 0 (0.0%) | 0 (0.0%) |
| 30 to 34 Years | 4 (50.0%) | 0 (0.0%) |
| 35 to 44 Years | 21 (100.0%) | 4 (19.0%) |
| 45 to 54 Years | 9 (81.8%) | 0 (0.0%) |
| 55 to 59 Years | 6 (100.0%) | 0 (0.0%) |
| 60 to 64 Years | 6 (37.5%) | 0 (0.0%) |
| 65 to 74 Years | 4 (16.0%) | 0 (0.0%) |
| 75 Years and over | 5 (14.7%) | 0 (0.0%) |
| Total | 60 (42.9%) | 4 (6.7%) |
Employment Status by Educational Attainment in Wilson Creek
According to labor force statistics for Wilson Creek, 70.8% of individuals (46) out of the total population between 25 and 64 years of age (65) are in the labor force, with 8.7% or 4 of them being unemployed. The group with the highest labor force participation rate are those with the educational attainment of less than high school, with 100.0% or 4 individuals in the labor force. Within the labor force, individuals with high school diploma education have the highest percentage of unemployment, with 16.7% or 4 of them being unemployed.
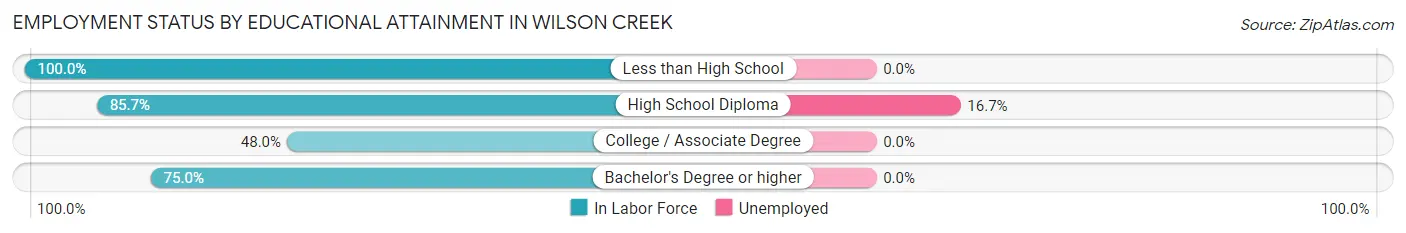
| Educational Attainment | In Labor Force | Unemployed |
| Less than High School | 4 (100.0%) | 0 (0.0%) |
| High School Diploma | 24 (85.7%) | 5 (16.7%) |
| College / Associate Degree | 12 (48.0%) | 0 (0.0%) |
| Bachelor's Degree or higher | 6 (75.0%) | 0 (0.0%) |
| Total | 46 (70.8%) | 6 (8.7%) |
Employment Occupations by Sex in Wilson Creek
Management, Business, Science and Arts Occupations
The most common Management, Business, Science and Arts occupations in Wilson Creek are Computers, Engineering & Science (5 | 8.9%), Architecture & Engineering (5 | 8.9%), and Management (3 | 5.4%).
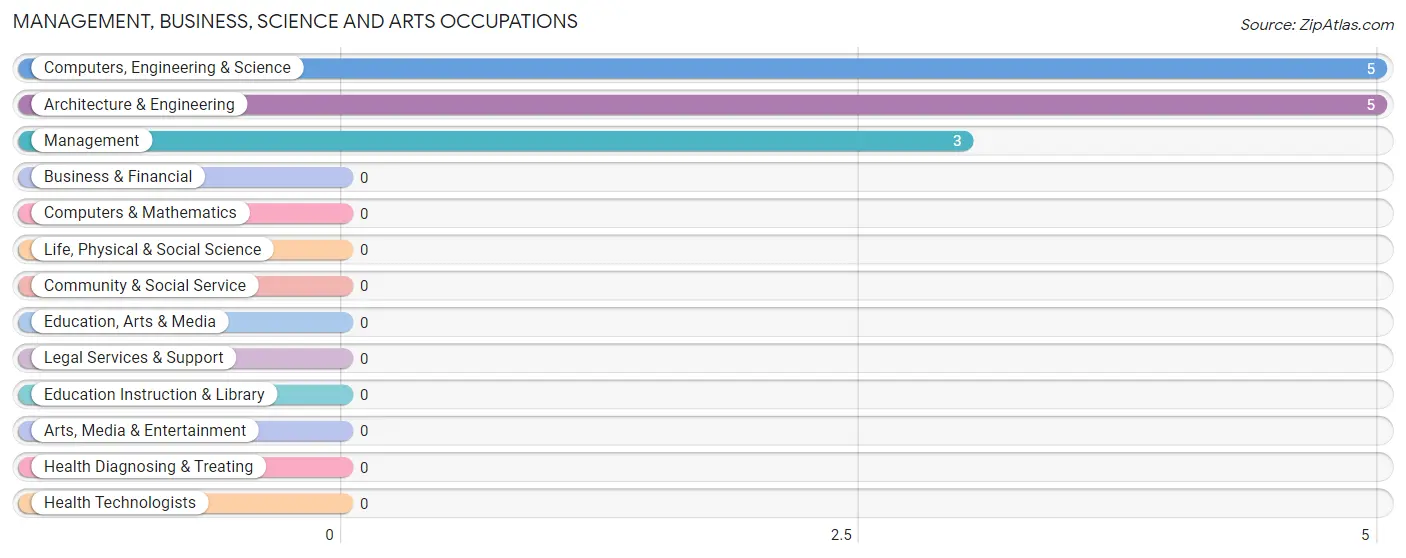
Management, Business, Science and Arts Occupations by Sex
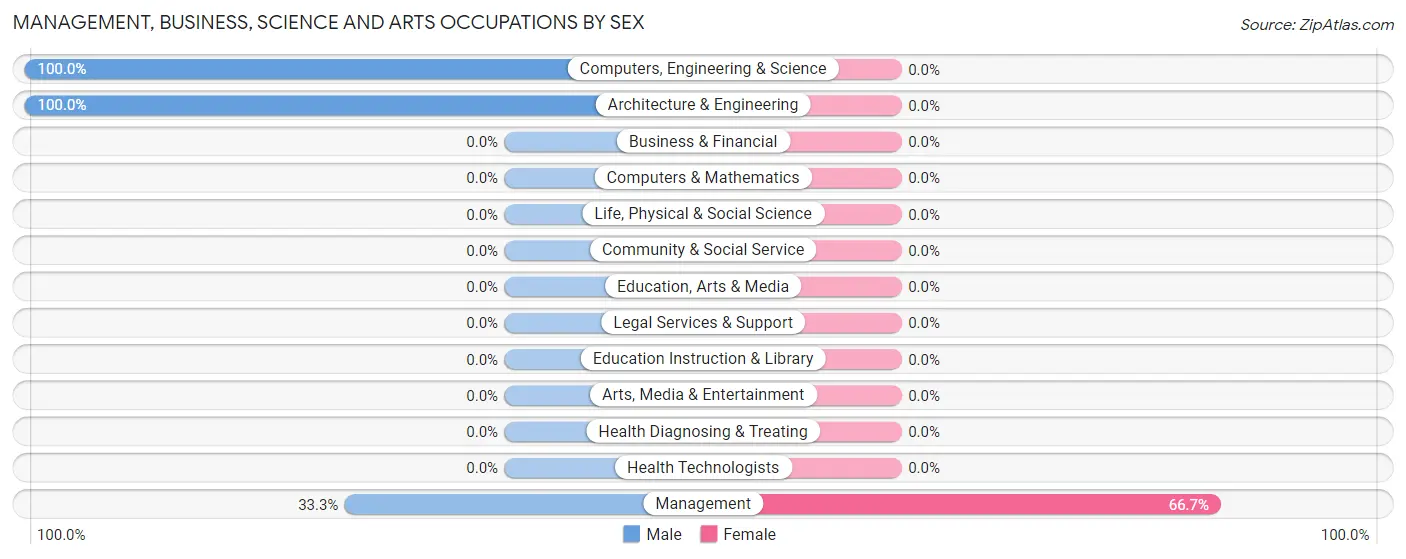
| Occupation | Male | Female |
| Management | 1 (33.3%) | 2 (66.7%) |
| Business & Financial | 0 (0.0%) | 0 (0.0%) |
| Computers, Engineering & Science | 5 (100.0%) | 0 (0.0%) |
| Computers & Mathematics | 0 (0.0%) | 0 (0.0%) |
| Architecture & Engineering | 5 (100.0%) | 0 (0.0%) |
| Life, Physical & Social Science | 0 (0.0%) | 0 (0.0%) |
| Community & Social Service | 0 (0.0%) | 0 (0.0%) |
| Education, Arts & Media | 0 (0.0%) | 0 (0.0%) |
| Legal Services & Support | 0 (0.0%) | 0 (0.0%) |
| Education Instruction & Library | 0 (0.0%) | 0 (0.0%) |
| Arts, Media & Entertainment | 0 (0.0%) | 0 (0.0%) |
| Health Diagnosing & Treating | 0 (0.0%) | 0 (0.0%) |
| Health Technologists | 0 (0.0%) | 0 (0.0%) |
| Total (Category) | 6 (75.0%) | 2 (25.0%) |
| Total (Overall) | 28 (50.0%) | 28 (50.0%) |
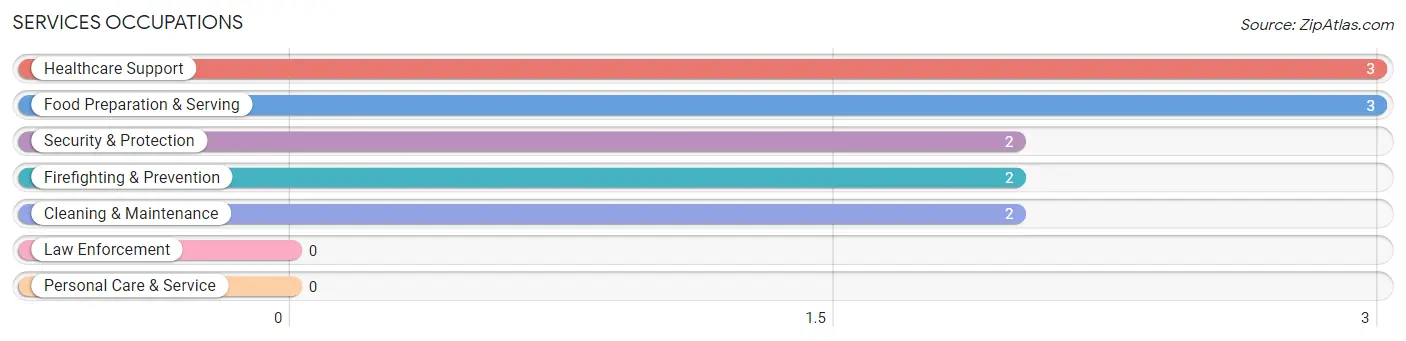
Services Occupations
The most common Services occupations in Wilson Creek are Healthcare Support (3 | 5.4%), Food Preparation & Serving (3 | 5.4%), Security & Protection (2 | 3.6%), Firefighting & Prevention (2 | 3.6%), and Cleaning & Maintenance (2 | 3.6%).
Services Occupations by Sex
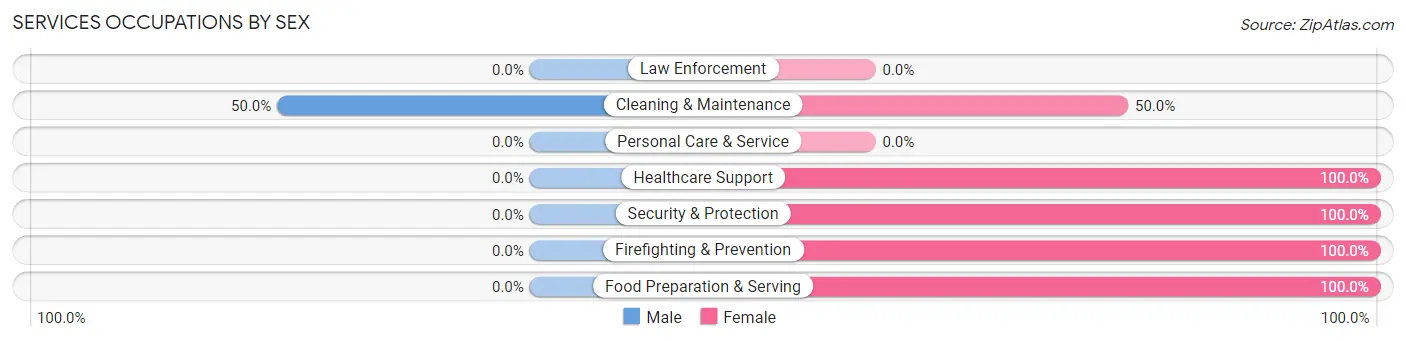
| Occupation | Male | Female |
| Healthcare Support | 0 (0.0%) | 3 (100.0%) |
| Security & Protection | 0 (0.0%) | 2 (100.0%) |
| Firefighting & Prevention | 0 (0.0%) | 2 (100.0%) |
| Law Enforcement | 0 (0.0%) | 0 (0.0%) |
| Food Preparation & Serving | 0 (0.0%) | 3 (100.0%) |
| Cleaning & Maintenance | 1 (50.0%) | 1 (50.0%) |
| Personal Care & Service | 0 (0.0%) | 0 (0.0%) |
| Total (Category) | 1 (10.0%) | 9 (90.0%) |
| Total (Overall) | 28 (50.0%) | 28 (50.0%) |
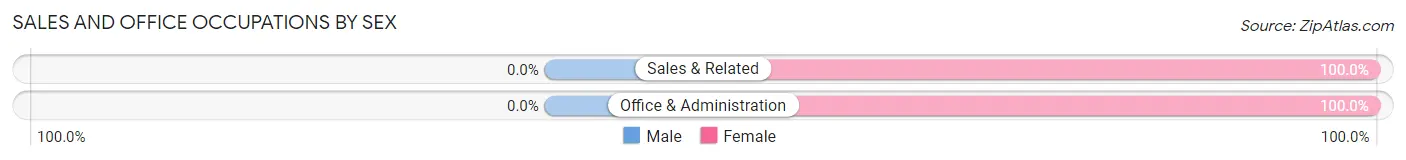
Sales and Office Occupations
The most common Sales and Office occupations in Wilson Creek are Sales & Related (9 | 16.1%), and Office & Administration (3 | 5.4%).
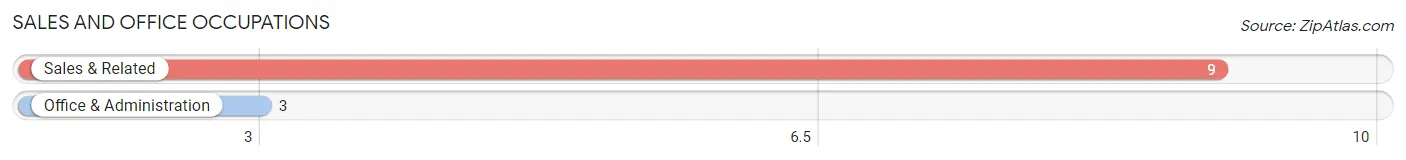
Sales and Office Occupations by Sex
| Occupation | Male | Female |
| Sales & Related | 0 (0.0%) | 9 (100.0%) |
| Office & Administration | 0 (0.0%) | 3 (100.0%) |
| Total (Category) | 0 (0.0%) | 12 (100.0%) |
| Total (Overall) | 28 (50.0%) | 28 (50.0%) |
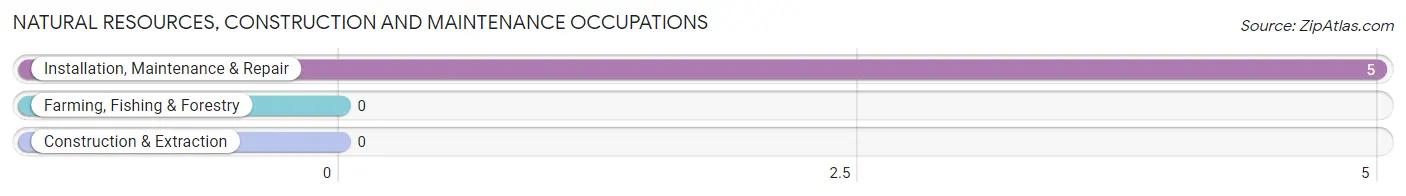
Natural Resources, Construction and Maintenance Occupations
The most common Natural Resources, Construction and Maintenance occupations in Wilson Creek are , and Installation, Maintenance & Repair (5 | 8.9%).
Natural Resources, Construction and Maintenance Occupations by Sex
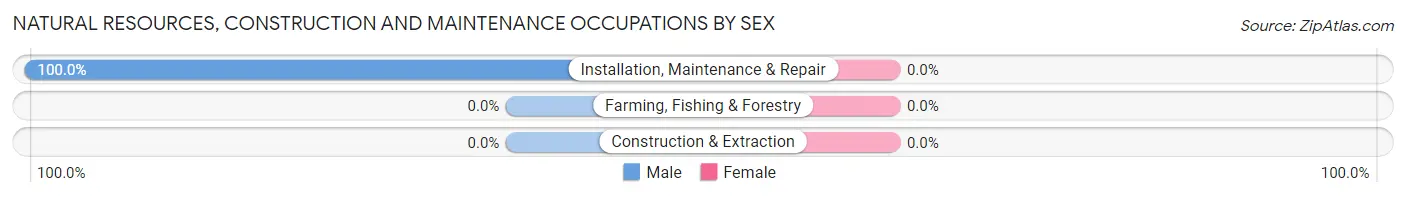
| Occupation | Male | Female |
| Farming, Fishing & Forestry | 0 (0.0%) | 0 (0.0%) |
| Construction & Extraction | 0 (0.0%) | 0 (0.0%) |
| Installation, Maintenance & Repair | 5 (100.0%) | 0 (0.0%) |
| Total (Category) | 5 (100.0%) | 0 (0.0%) |
| Total (Overall) | 28 (50.0%) | 28 (50.0%) |
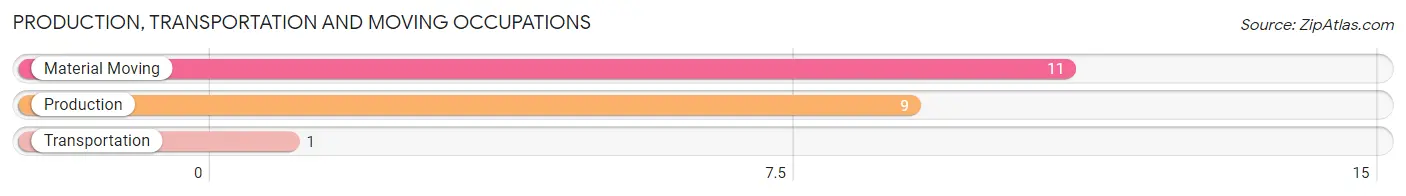
Production, Transportation and Moving Occupations
The most common Production, Transportation and Moving occupations in Wilson Creek are Material Moving (11 | 19.6%), Production (9 | 16.1%), and Transportation (1 | 1.8%).
Production, Transportation and Moving Occupations by Sex
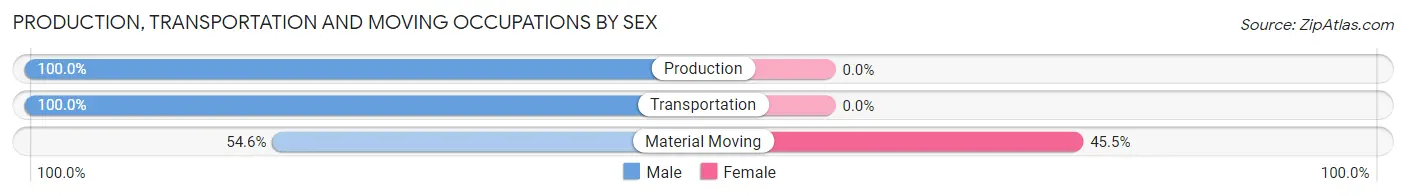
| Occupation | Male | Female |
| Production | 9 (100.0%) | 0 (0.0%) |
| Transportation | 1 (100.0%) | 0 (0.0%) |
| Material Moving | 6 (54.5%) | 5 (45.5%) |
| Total (Category) | 16 (76.2%) | 5 (23.8%) |
| Total (Overall) | 28 (50.0%) | 28 (50.0%) |
Employment Industries by Sex in Wilson Creek
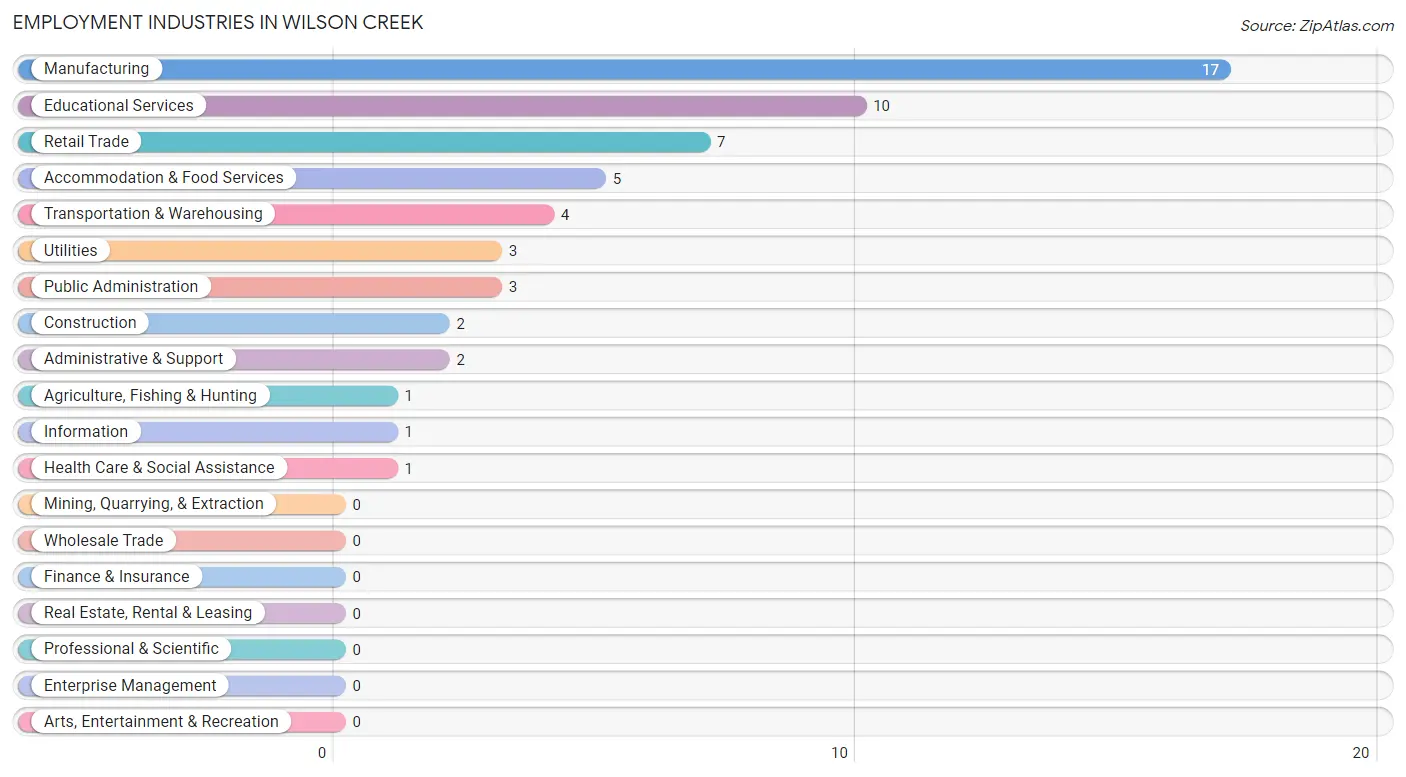
Employment Industries in Wilson Creek
The major employment industries in Wilson Creek include Manufacturing (17 | 30.4%), Educational Services (10 | 17.9%), Retail Trade (7 | 12.5%), Accommodation & Food Services (5 | 8.9%), and Transportation & Warehousing (4 | 7.1%).
Employment Industries by Sex in Wilson Creek
The Wilson Creek industries that see more men than women are Agriculture, Fishing & Hunting (100.0%), Construction (100.0%), and Transportation & Warehousing (100.0%), whereas the industries that tend to have a higher number of women are Retail Trade (100.0%), Information (100.0%), and Health Care & Social Assistance (100.0%).
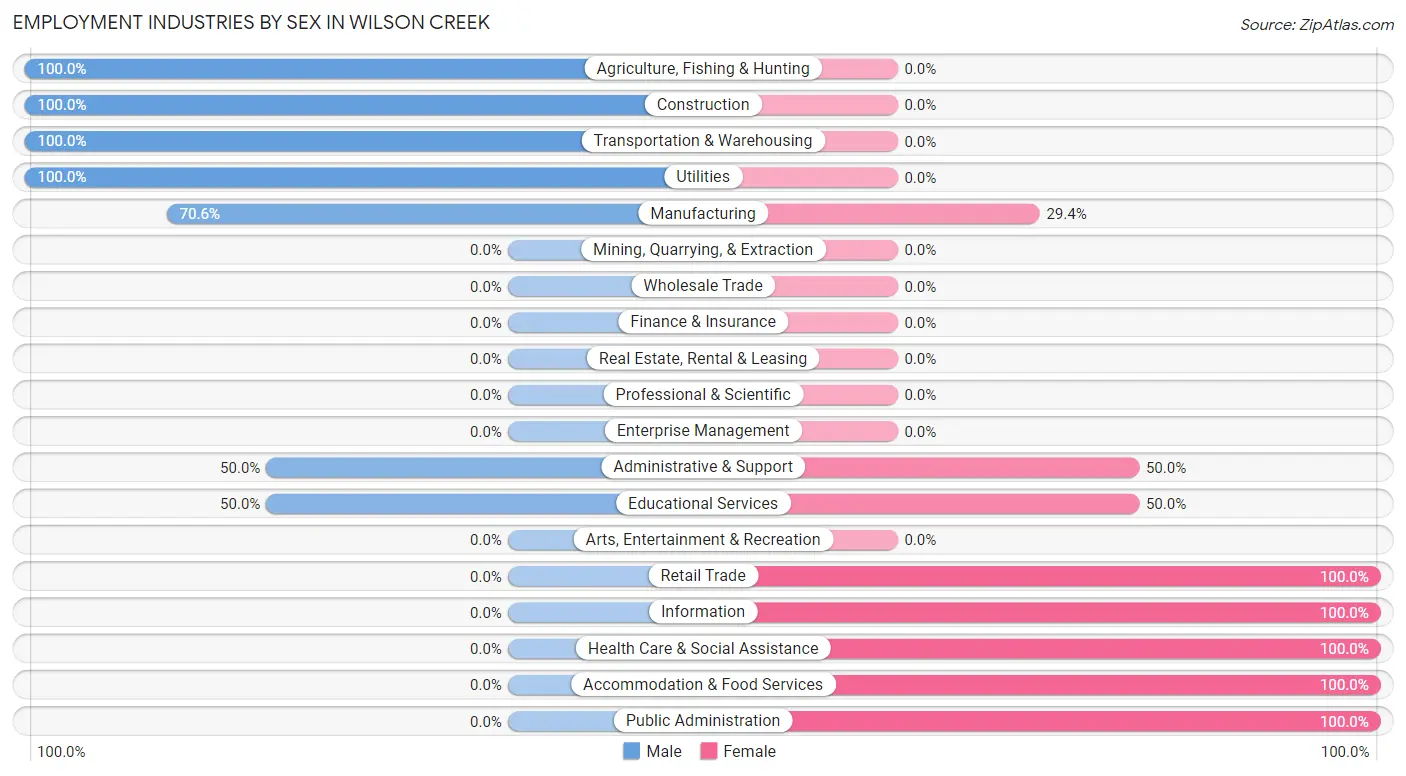
| Industry | Male | Female |
| Agriculture, Fishing & Hunting | 1 (100.0%) | 0 (0.0%) |
| Mining, Quarrying, & Extraction | 0 (0.0%) | 0 (0.0%) |
| Construction | 2 (100.0%) | 0 (0.0%) |
| Manufacturing | 12 (70.6%) | 5 (29.4%) |
| Wholesale Trade | 0 (0.0%) | 0 (0.0%) |
| Retail Trade | 0 (0.0%) | 7 (100.0%) |
| Transportation & Warehousing | 4 (100.0%) | 0 (0.0%) |
| Utilities | 3 (100.0%) | 0 (0.0%) |
| Information | 0 (0.0%) | 1 (100.0%) |
| Finance & Insurance | 0 (0.0%) | 0 (0.0%) |
| Real Estate, Rental & Leasing | 0 (0.0%) | 0 (0.0%) |
| Professional & Scientific | 0 (0.0%) | 0 (0.0%) |
| Enterprise Management | 0 (0.0%) | 0 (0.0%) |
| Administrative & Support | 1 (50.0%) | 1 (50.0%) |
| Educational Services | 5 (50.0%) | 5 (50.0%) |
| Health Care & Social Assistance | 0 (0.0%) | 1 (100.0%) |
| Arts, Entertainment & Recreation | 0 (0.0%) | 0 (0.0%) |
| Accommodation & Food Services | 0 (0.0%) | 5 (100.0%) |
| Public Administration | 0 (0.0%) | 3 (100.0%) |
| Total | 28 (50.0%) | 28 (50.0%) |
Education in Wilson Creek
School Enrollment in Wilson Creek
The most common levels of schooling among the 40 students in Wilson Creek are middle school (17 | 42.5%), high school (12 | 30.0%), and elementary school (8 | 20.0%).
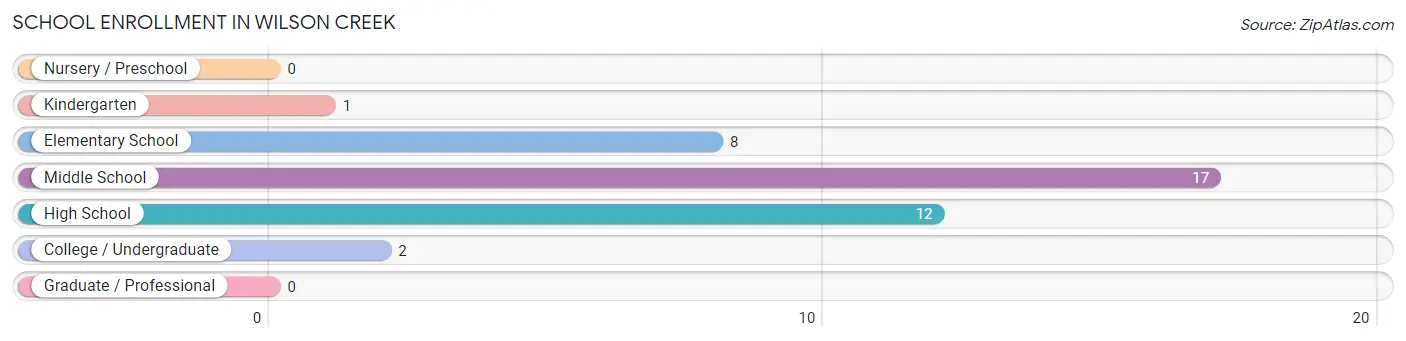
| School Level | # Students | % Students |
| Nursery / Preschool | 0 | 0.0% |
| Kindergarten | 1 | 2.5% |
| Elementary School | 8 | 20.0% |
| Middle School | 17 | 42.5% |
| High School | 12 | 30.0% |
| College / Undergraduate | 2 | 5.0% |
| Graduate / Professional | 0 | 0.0% |
| Total | 40 | 100.0% |
School Enrollment by Age by Funding Source in Wilson Creek
Out of a total of 40 students who are enrolled in schools in Wilson Creek, 3 (7.5%) attend a private institution, while the remaining 37 (92.5%) are enrolled in public schools. The age group of 5 to 9 year old has the highest likelihood of being enrolled in private schools, with 3 (42.9% in the age bracket) enrolled. Conversely, the age group of 10 to 14 year olds has the lowest likelihood of being enrolled in a private school, with 21 (100.0% in the age bracket) attending a public institution.
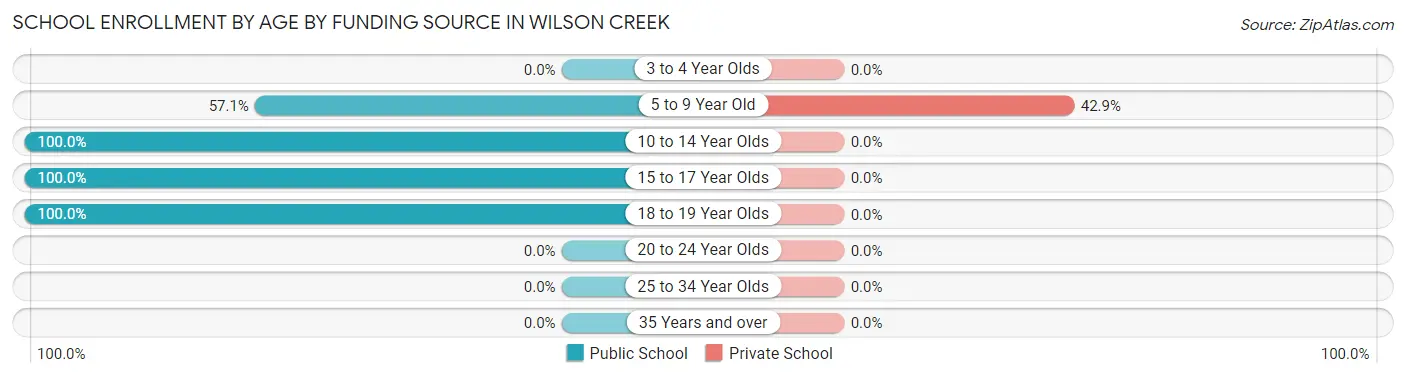
| Age Bracket | Public School | Private School |
| 3 to 4 Year Olds | 0 (0.0%) | 0 (0.0%) |
| 5 to 9 Year Old | 4 (57.1%) | 3 (42.9%) |
| 10 to 14 Year Olds | 21 (100.0%) | 0 (0.0%) |
| 15 to 17 Year Olds | 10 (100.0%) | 0 (0.0%) |
| 18 to 19 Year Olds | 2 (100.0%) | 0 (0.0%) |
| 20 to 24 Year Olds | 0 (0.0%) | 0 (0.0%) |
| 25 to 34 Year Olds | 0 (0.0%) | 0 (0.0%) |
| 35 Years and over | 0 (0.0%) | 0 (0.0%) |
| Total | 37 (92.5%) | 3 (7.5%) |
Educational Attainment by Field of Study in Wilson Creek
Education (12 | 41.4%), engineering (10 | 34.5%), psychology (2 | 6.9%), business (2 | 6.9%), and arts & humanities (2 | 6.9%) are the most common fields of study among 29 individuals in Wilson Creek who have obtained a bachelor's degree or higher.
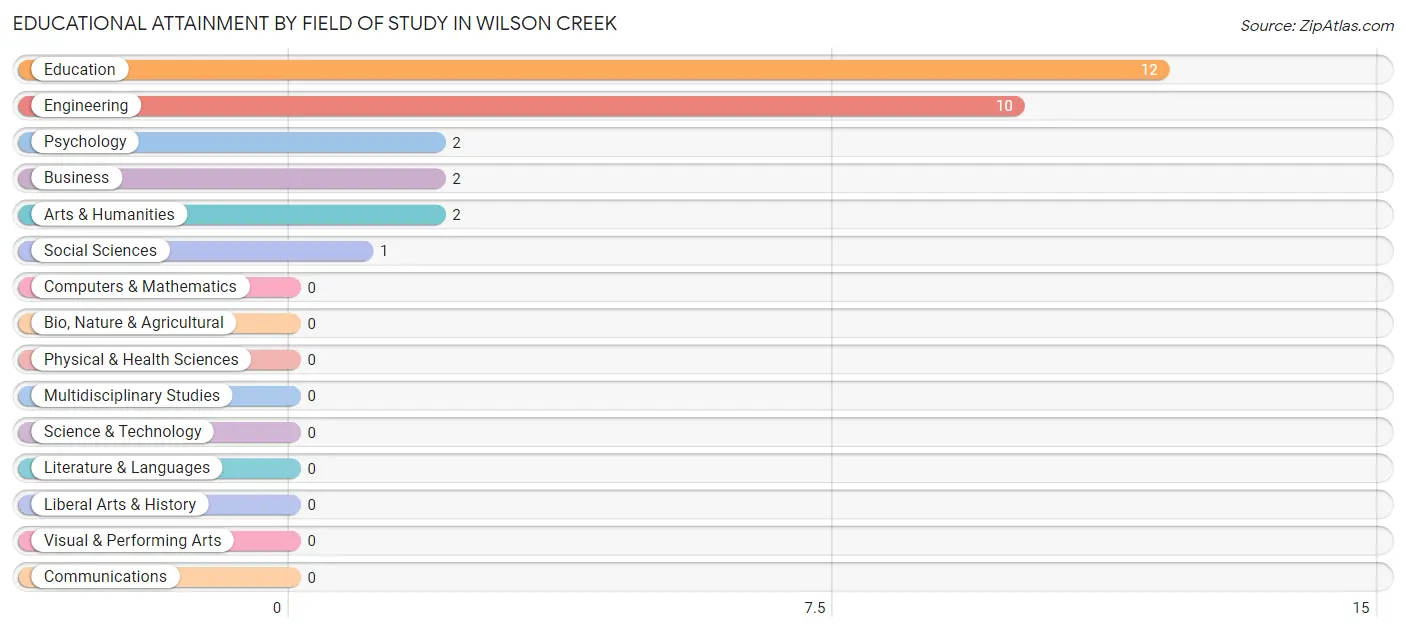
| Field of Study | # Graduates | % Graduates |
| Computers & Mathematics | 0 | 0.0% |
| Bio, Nature & Agricultural | 0 | 0.0% |
| Physical & Health Sciences | 0 | 0.0% |
| Psychology | 2 | 6.9% |
| Social Sciences | 1 | 3.5% |
| Engineering | 10 | 34.5% |
| Multidisciplinary Studies | 0 | 0.0% |
| Science & Technology | 0 | 0.0% |
| Business | 2 | 6.9% |
| Education | 12 | 41.4% |
| Literature & Languages | 0 | 0.0% |
| Liberal Arts & History | 0 | 0.0% |
| Visual & Performing Arts | 0 | 0.0% |
| Communications | 0 | 0.0% |
| Arts & Humanities | 2 | 6.9% |
| Total | 29 | 100.0% |
Transportation & Commute in Wilson Creek
Vehicle Availability by Sex in Wilson Creek
The most prevalent vehicle ownership categories in Wilson Creek are males with 2 vehicles (10, accounting for 35.7%) and females with 2 vehicles (9, making up 35.7%).
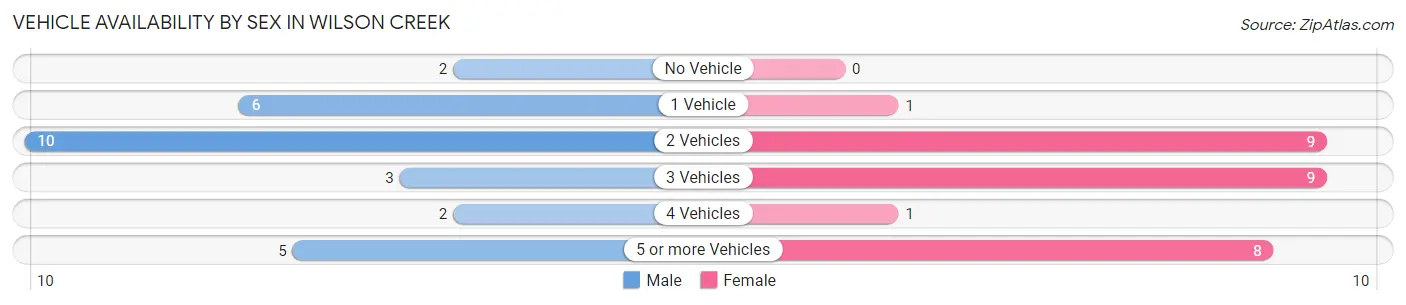
| Vehicles Available | Male | Female |
| No Vehicle | 2 (7.1%) | 0 (0.0%) |
| 1 Vehicle | 6 (21.4%) | 1 (3.6%) |
| 2 Vehicles | 10 (35.7%) | 9 (32.1%) |
| 3 Vehicles | 3 (10.7%) | 9 (32.1%) |
| 4 Vehicles | 2 (7.1%) | 1 (3.6%) |
| 5 or more Vehicles | 5 (17.9%) | 8 (28.6%) |
| Total | 28 (100.0%) | 28 (100.0%) |
Commute Time in Wilson Creek
The most frequently occuring commute durations in Wilson Creek are 30 to 34 minutes (7 commuters, 13.7%), 40 to 44 minutes (7 commuters, 13.7%), and less than 5 minutes (6 commuters, 11.8%).
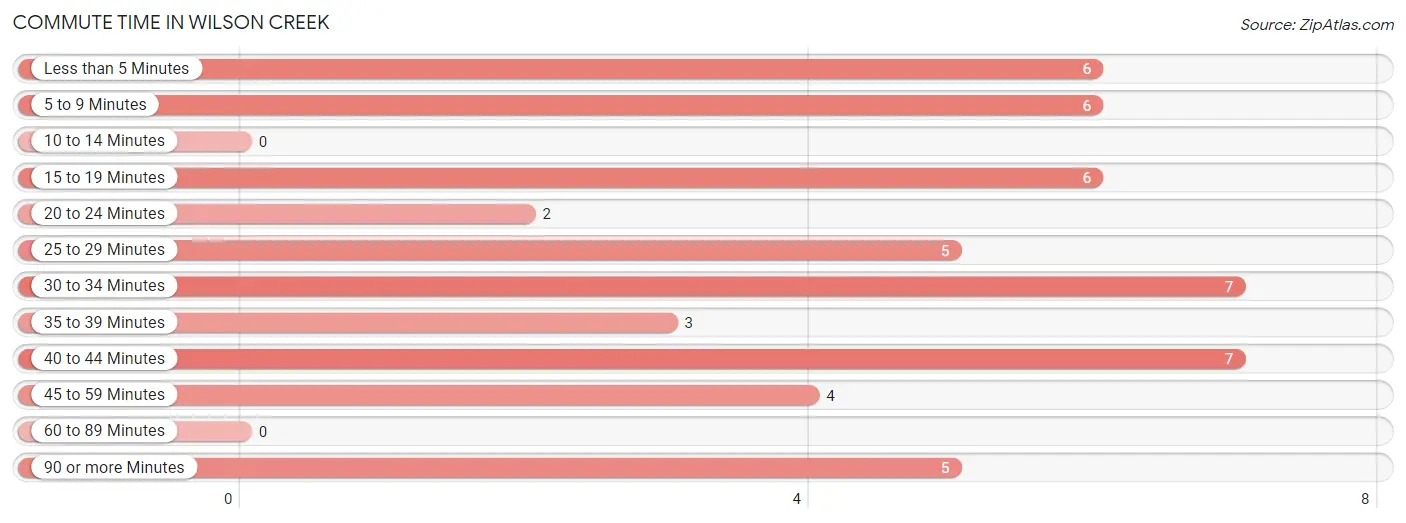
| Commute Time | # Commuters | % Commuters |
| Less than 5 Minutes | 6 | 11.8% |
| 5 to 9 Minutes | 6 | 11.8% |
| 10 to 14 Minutes | 0 | 0.0% |
| 15 to 19 Minutes | 6 | 11.8% |
| 20 to 24 Minutes | 2 | 3.9% |
| 25 to 29 Minutes | 5 | 9.8% |
| 30 to 34 Minutes | 7 | 13.7% |
| 35 to 39 Minutes | 3 | 5.9% |
| 40 to 44 Minutes | 7 | 13.7% |
| 45 to 59 Minutes | 4 | 7.8% |
| 60 to 89 Minutes | 0 | 0.0% |
| 90 or more Minutes | 5 | 9.8% |
Commute Time by Sex in Wilson Creek
The most common commute times in Wilson Creek are 30 to 34 minutes (6 commuters, 26.1%) for males and 15 to 19 minutes (6 commuters, 21.4%) for females.
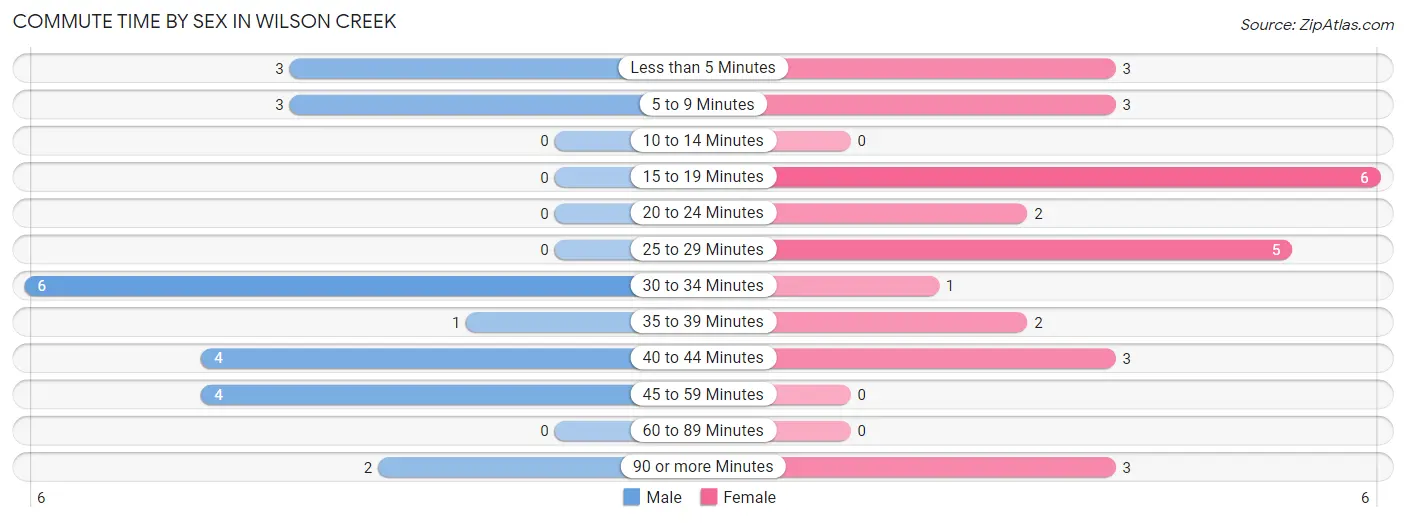
| Commute Time | Male | Female |
| Less than 5 Minutes | 3 (13.0%) | 3 (10.7%) |
| 5 to 9 Minutes | 3 (13.0%) | 3 (10.7%) |
| 10 to 14 Minutes | 0 (0.0%) | 0 (0.0%) |
| 15 to 19 Minutes | 0 (0.0%) | 6 (21.4%) |
| 20 to 24 Minutes | 0 (0.0%) | 2 (7.1%) |
| 25 to 29 Minutes | 0 (0.0%) | 5 (17.9%) |
| 30 to 34 Minutes | 6 (26.1%) | 1 (3.6%) |
| 35 to 39 Minutes | 1 (4.3%) | 2 (7.1%) |
| 40 to 44 Minutes | 4 (17.4%) | 3 (10.7%) |
| 45 to 59 Minutes | 4 (17.4%) | 0 (0.0%) |
| 60 to 89 Minutes | 0 (0.0%) | 0 (0.0%) |
| 90 or more Minutes | 2 (8.7%) | 3 (10.7%) |
Time of Departure to Work by Sex in Wilson Creek
The most frequent times of departure to work in Wilson Creek are 5:00 AM to 5:29 AM (6, 26.1%) for males and 7:00 AM to 7:29 AM (8, 28.6%) for females.
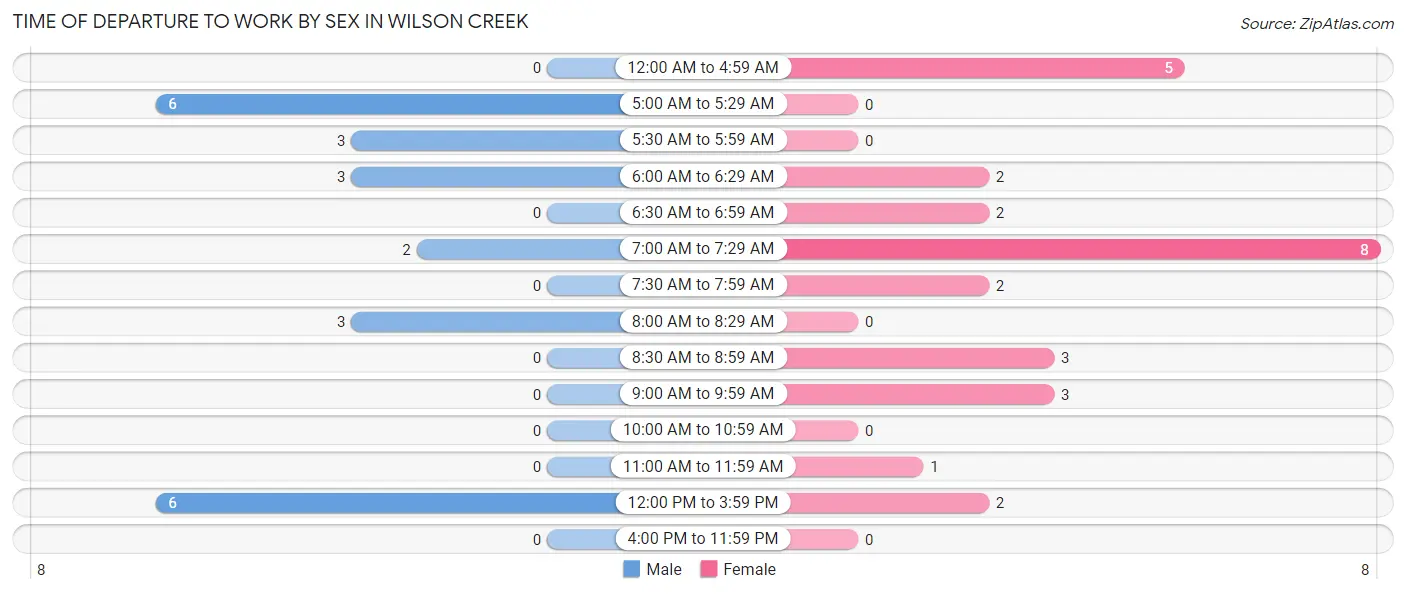
| Time of Departure | Male | Female |
| 12:00 AM to 4:59 AM | 0 (0.0%) | 5 (17.9%) |
| 5:00 AM to 5:29 AM | 6 (26.1%) | 0 (0.0%) |
| 5:30 AM to 5:59 AM | 3 (13.0%) | 0 (0.0%) |
| 6:00 AM to 6:29 AM | 3 (13.0%) | 2 (7.1%) |
| 6:30 AM to 6:59 AM | 0 (0.0%) | 2 (7.1%) |
| 7:00 AM to 7:29 AM | 2 (8.7%) | 8 (28.6%) |
| 7:30 AM to 7:59 AM | 0 (0.0%) | 2 (7.1%) |
| 8:00 AM to 8:29 AM | 3 (13.0%) | 0 (0.0%) |
| 8:30 AM to 8:59 AM | 0 (0.0%) | 3 (10.7%) |
| 9:00 AM to 9:59 AM | 0 (0.0%) | 3 (10.7%) |
| 10:00 AM to 10:59 AM | 0 (0.0%) | 0 (0.0%) |
| 11:00 AM to 11:59 AM | 0 (0.0%) | 1 (3.6%) |
| 12:00 PM to 3:59 PM | 6 (26.1%) | 2 (7.1%) |
| 4:00 PM to 11:59 PM | 0 (0.0%) | 0 (0.0%) |
| Total | 23 (100.0%) | 28 (100.0%) |
Housing Occupancy in Wilson Creek
Occupancy by Ownership in Wilson Creek
Of the total 84 dwellings in Wilson Creek, owner-occupied units account for 67 (79.8%), while renter-occupied units make up 17 (20.2%).
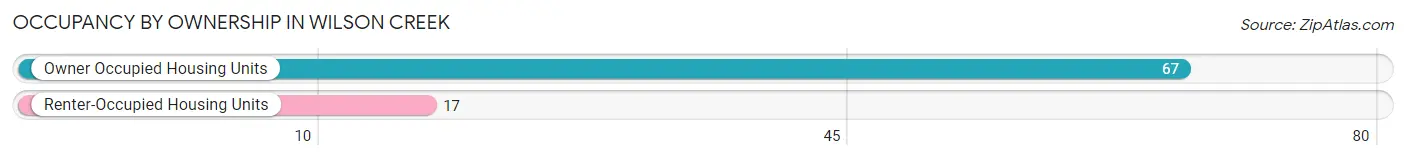
| Occupancy | # Housing Units | % Housing Units |
| Owner Occupied Housing Units | 67 | 79.8% |
| Renter-Occupied Housing Units | 17 | 20.2% |
| Total Occupied Housing Units | 84 | 100.0% |
Occupancy by Household Size in Wilson Creek
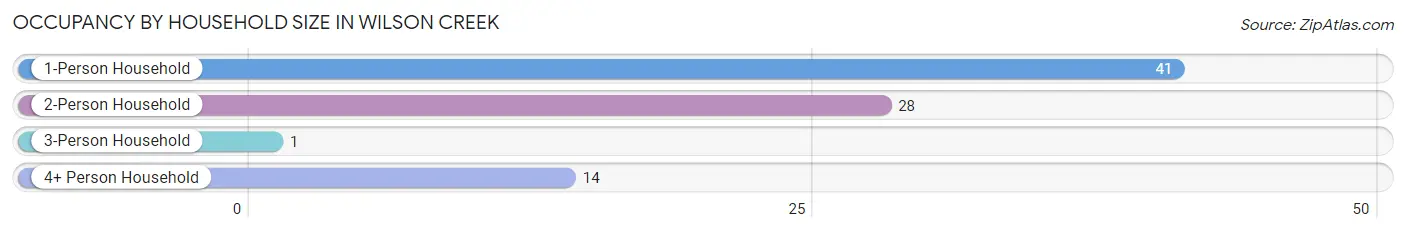
| Household Size | # Housing Units | % Housing Units |
| 1-Person Household | 41 | 48.8% |
| 2-Person Household | 28 | 33.3% |
| 3-Person Household | 1 | 1.2% |
| 4+ Person Household | 14 | 16.7% |
| Total Housing Units | 84 | 100.0% |
Occupancy by Ownership by Household Size in Wilson Creek
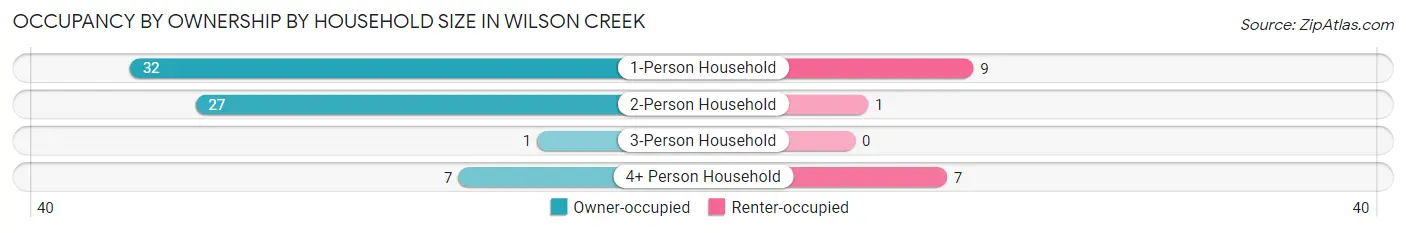
| Household Size | Owner-occupied | Renter-occupied |
| 1-Person Household | 32 (78.0%) | 9 (22.0%) |
| 2-Person Household | 27 (96.4%) | 1 (3.6%) |
| 3-Person Household | 1 (100.0%) | 0 (0.0%) |
| 4+ Person Household | 7 (50.0%) | 7 (50.0%) |
| Total Housing Units | 67 (79.8%) | 17 (20.2%) |
Occupancy by Educational Attainment in Wilson Creek

| Household Size | Owner-occupied | Renter-occupied |
| Less than High School | 7 (100.0%) | 0 (0.0%) |
| High School Diploma | 19 (67.9%) | 9 (32.1%) |
| College/Associate Degree | 21 (72.4%) | 8 (27.6%) |
| Bachelor's Degree or higher | 20 (100.0%) | 0 (0.0%) |
Occupancy by Age of Householder in Wilson Creek
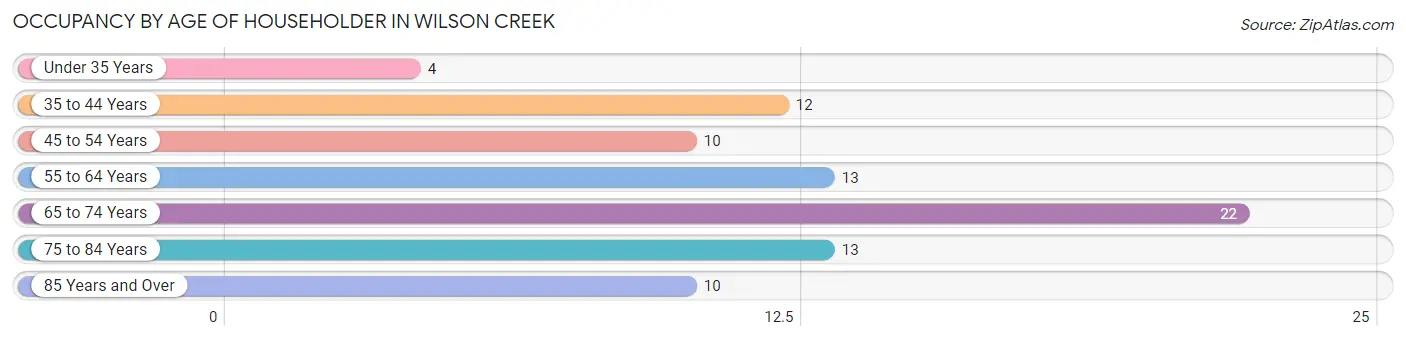
| Age Bracket | # Households | % Households |
| Under 35 Years | 4 | 4.8% |
| 35 to 44 Years | 12 | 14.3% |
| 45 to 54 Years | 10 | 11.9% |
| 55 to 64 Years | 13 | 15.5% |
| 65 to 74 Years | 22 | 26.2% |
| 75 to 84 Years | 13 | 15.5% |
| 85 Years and Over | 10 | 11.9% |
| Total | 84 | 100.0% |
Housing Finances in Wilson Creek
Median Income by Occupancy in Wilson Creek
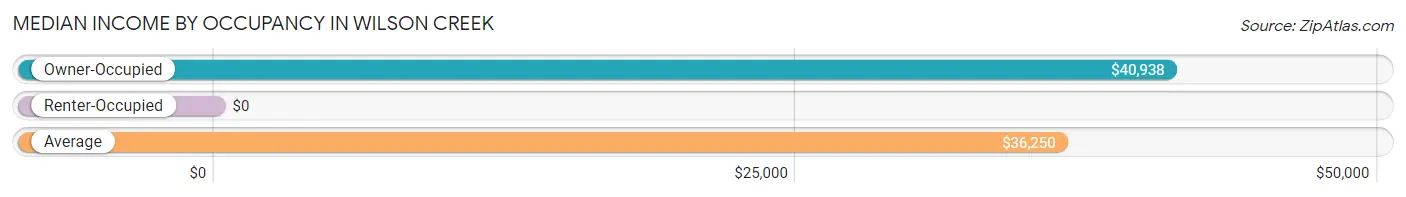
| Occupancy Type | # Households | Median Income |
| Owner-Occupied | 67 (79.8%) | $40,938 |
| Renter-Occupied | 17 (20.2%) | $0 |
| Average | 84 (100.0%) | $36,250 |
Occupancy by Householder Income Bracket in Wilson Creek
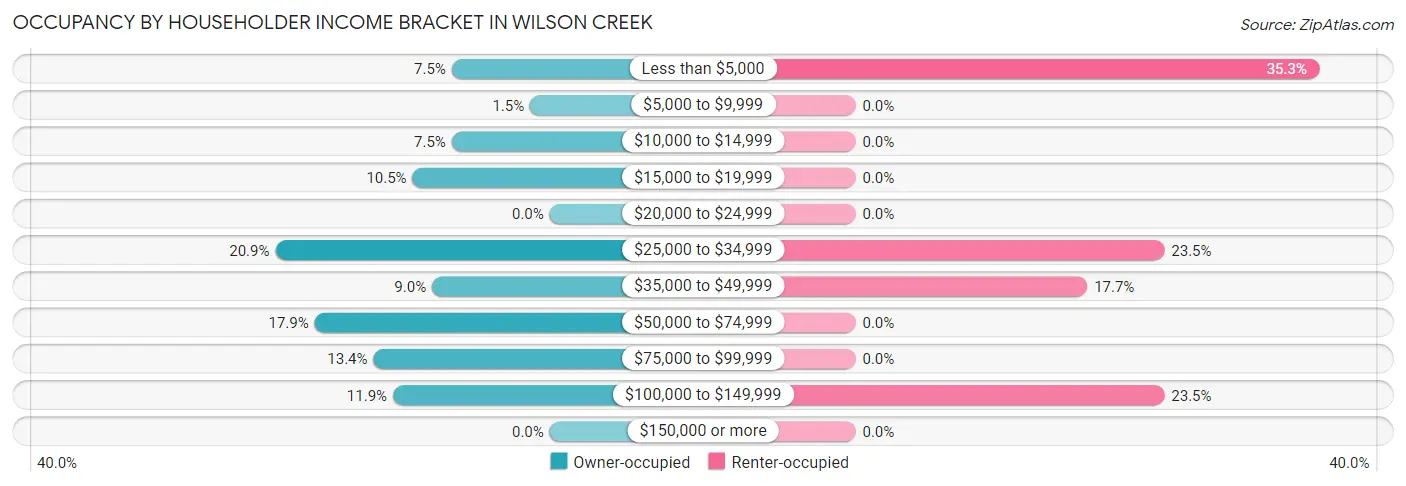
| Income Bracket | Owner-occupied | Renter-occupied |
| Less than $5,000 | 5 (7.5%) | 6 (35.3%) |
| $5,000 to $9,999 | 1 (1.5%) | 0 (0.0%) |
| $10,000 to $14,999 | 5 (7.5%) | 0 (0.0%) |
| $15,000 to $19,999 | 7 (10.4%) | 0 (0.0%) |
| $20,000 to $24,999 | 0 (0.0%) | 0 (0.0%) |
| $25,000 to $34,999 | 14 (20.9%) | 4 (23.5%) |
| $35,000 to $49,999 | 6 (9.0%) | 3 (17.6%) |
| $50,000 to $74,999 | 12 (17.9%) | 0 (0.0%) |
| $75,000 to $99,999 | 9 (13.4%) | 0 (0.0%) |
| $100,000 to $149,999 | 8 (11.9%) | 4 (23.5%) |
| $150,000 or more | 0 (0.0%) | 0 (0.0%) |
| Total | 67 (100.0%) | 17 (100.0%) |
Monthly Housing Cost Tiers in Wilson Creek
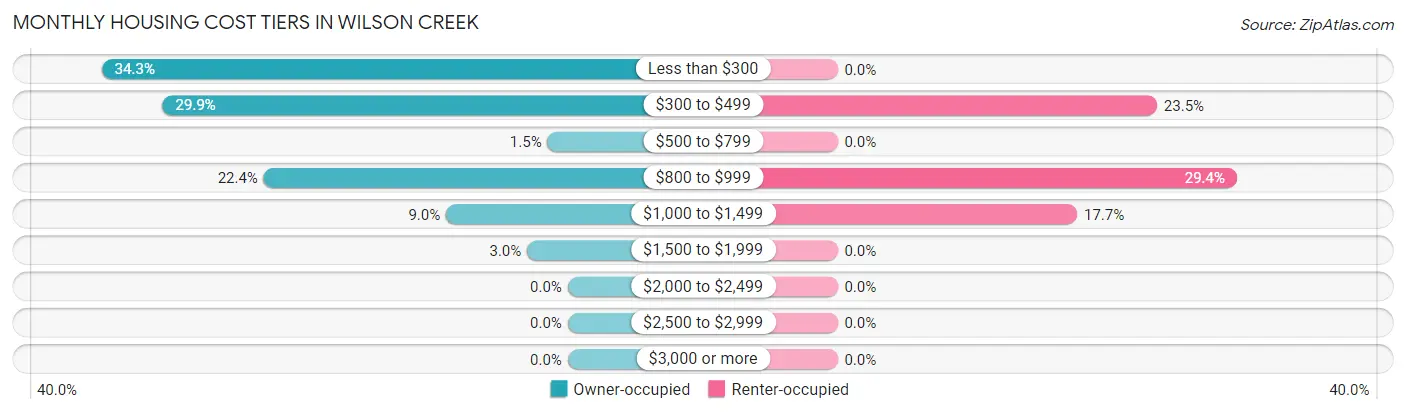
| Monthly Cost | Owner-occupied | Renter-occupied |
| Less than $300 | 23 (34.3%) | 0 (0.0%) |
| $300 to $499 | 20 (29.8%) | 4 (23.5%) |
| $500 to $799 | 1 (1.5%) | 0 (0.0%) |
| $800 to $999 | 15 (22.4%) | 5 (29.4%) |
| $1,000 to $1,499 | 6 (9.0%) | 3 (17.6%) |
| $1,500 to $1,999 | 2 (3.0%) | 0 (0.0%) |
| $2,000 to $2,499 | 0 (0.0%) | 0 (0.0%) |
| $2,500 to $2,999 | 0 (0.0%) | 0 (0.0%) |
| $3,000 or more | 0 (0.0%) | 0 (0.0%) |
| Total | 67 (100.0%) | 17 (100.0%) |
Physical Housing Characteristics in Wilson Creek
Housing Structures in Wilson Creek
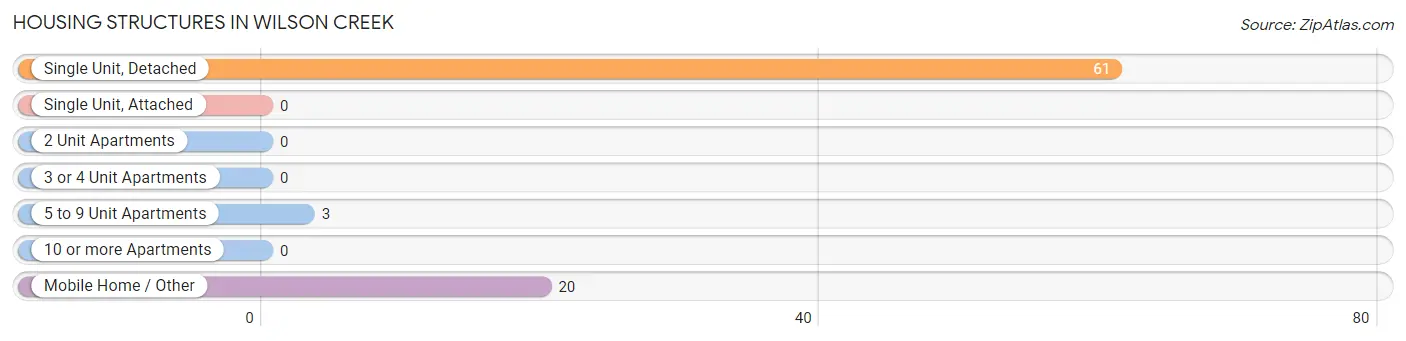
| Structure Type | # Housing Units | % Housing Units |
| Single Unit, Detached | 61 | 72.6% |
| Single Unit, Attached | 0 | 0.0% |
| 2 Unit Apartments | 0 | 0.0% |
| 3 or 4 Unit Apartments | 0 | 0.0% |
| 5 to 9 Unit Apartments | 3 | 3.6% |
| 10 or more Apartments | 0 | 0.0% |
| Mobile Home / Other | 20 | 23.8% |
| Total | 84 | 100.0% |
Housing Structures by Occupancy in Wilson Creek
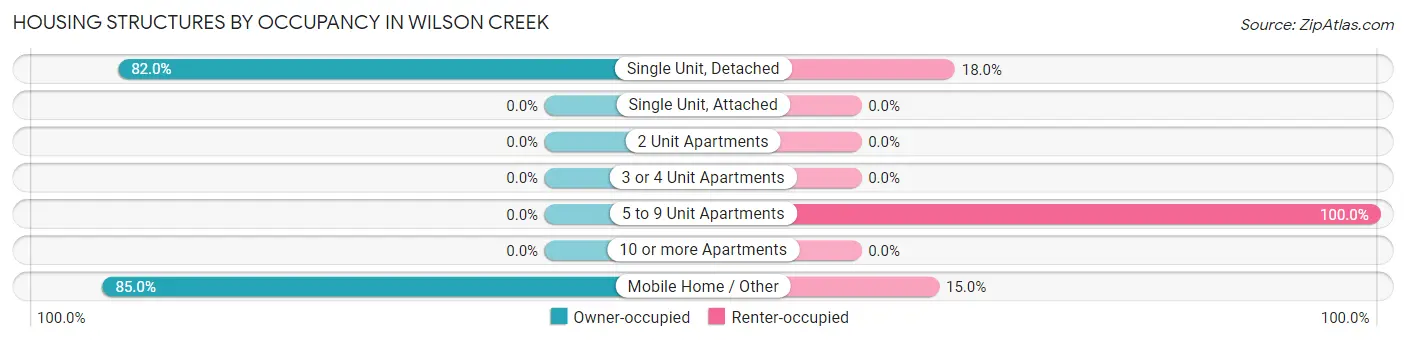
| Structure Type | Owner-occupied | Renter-occupied |
| Single Unit, Detached | 50 (82.0%) | 11 (18.0%) |
| Single Unit, Attached | 0 (0.0%) | 0 (0.0%) |
| 2 Unit Apartments | 0 (0.0%) | 0 (0.0%) |
| 3 or 4 Unit Apartments | 0 (0.0%) | 0 (0.0%) |
| 5 to 9 Unit Apartments | 0 (0.0%) | 3 (100.0%) |
| 10 or more Apartments | 0 (0.0%) | 0 (0.0%) |
| Mobile Home / Other | 17 (85.0%) | 3 (15.0%) |
| Total | 67 (79.8%) | 17 (20.2%) |
Housing Structures by Number of Rooms in Wilson Creek
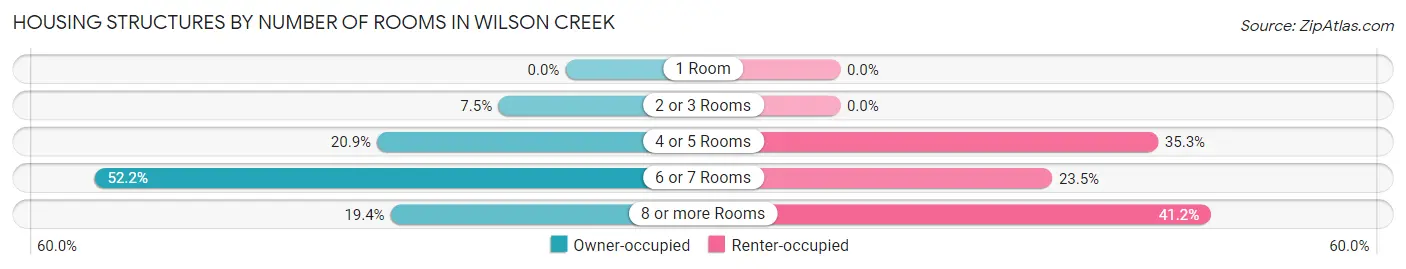
| Number of Rooms | Owner-occupied | Renter-occupied |
| 1 Room | 0 (0.0%) | 0 (0.0%) |
| 2 or 3 Rooms | 5 (7.5%) | 0 (0.0%) |
| 4 or 5 Rooms | 14 (20.9%) | 6 (35.3%) |
| 6 or 7 Rooms | 35 (52.2%) | 4 (23.5%) |
| 8 or more Rooms | 13 (19.4%) | 7 (41.2%) |
| Total | 67 (100.0%) | 17 (100.0%) |
Housing Structure by Heating Type in Wilson Creek
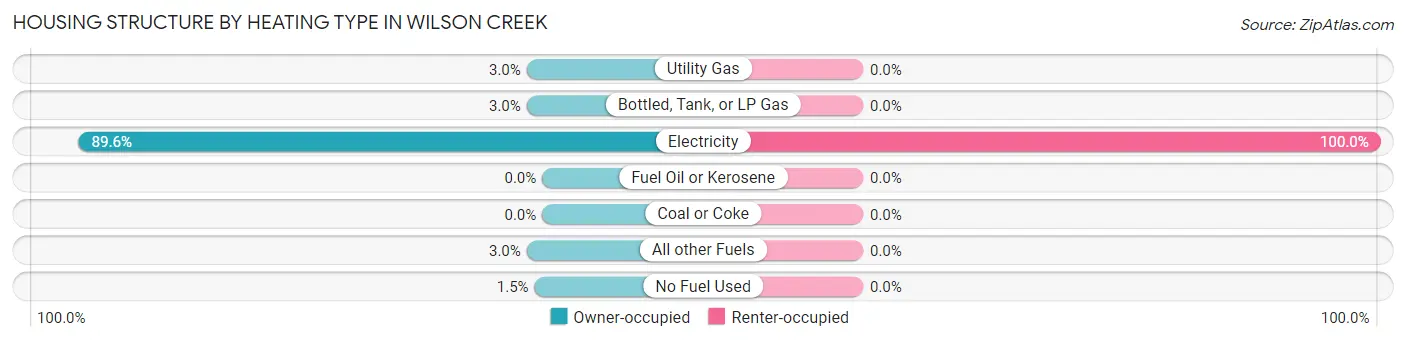
| Heating Type | Owner-occupied | Renter-occupied |
| Utility Gas | 2 (3.0%) | 0 (0.0%) |
| Bottled, Tank, or LP Gas | 2 (3.0%) | 0 (0.0%) |
| Electricity | 60 (89.5%) | 17 (100.0%) |
| Fuel Oil or Kerosene | 0 (0.0%) | 0 (0.0%) |
| Coal or Coke | 0 (0.0%) | 0 (0.0%) |
| All other Fuels | 2 (3.0%) | 0 (0.0%) |
| No Fuel Used | 1 (1.5%) | 0 (0.0%) |
| Total | 67 (100.0%) | 17 (100.0%) |
Household Vehicle Usage in Wilson Creek
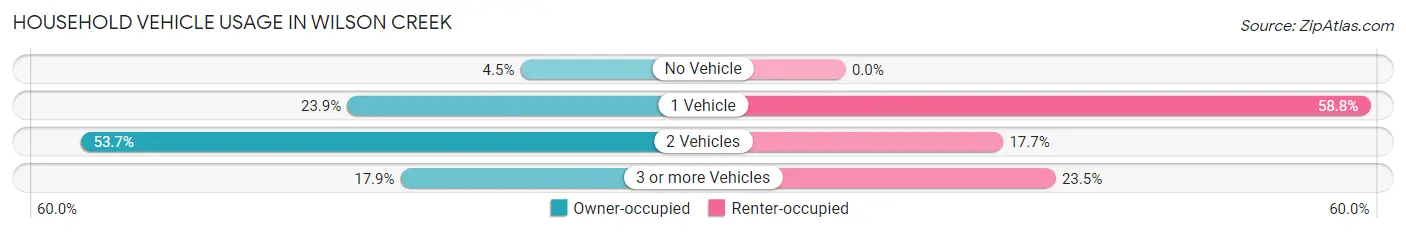
| Vehicles per Household | Owner-occupied | Renter-occupied |
| No Vehicle | 3 (4.5%) | 0 (0.0%) |
| 1 Vehicle | 16 (23.9%) | 10 (58.8%) |
| 2 Vehicles | 36 (53.7%) | 3 (17.6%) |
| 3 or more Vehicles | 12 (17.9%) | 4 (23.5%) |
| Total | 67 (100.0%) | 17 (100.0%) |
Real Estate & Mortgages in Wilson Creek
Real Estate and Mortgage Overview in Wilson Creek
| Characteristic | Without Mortgage | With Mortgage |
| Housing Units | 43 | 24 |
| Median Property Value | $157,800 | $144,200 |
| Median Household Income | $29,250 | $0 |
| Monthly Housing Costs | $285 | $0 |
| Real Estate Taxes | $730 | $0 |
Property Value by Mortgage Status in Wilson Creek
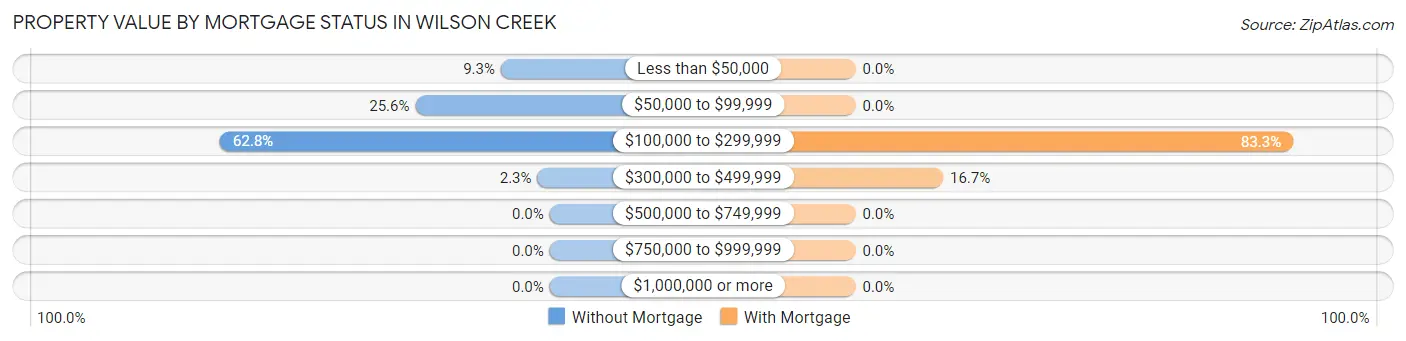
| Property Value | Without Mortgage | With Mortgage |
| Less than $50,000 | 4 (9.3%) | 0 (0.0%) |
| $50,000 to $99,999 | 11 (25.6%) | 0 (0.0%) |
| $100,000 to $299,999 | 27 (62.8%) | 20 (83.3%) |
| $300,000 to $499,999 | 1 (2.3%) | 4 (16.7%) |
| $500,000 to $749,999 | 0 (0.0%) | 0 (0.0%) |
| $750,000 to $999,999 | 0 (0.0%) | 0 (0.0%) |
| $1,000,000 or more | 0 (0.0%) | 0 (0.0%) |
| Total | 43 (100.0%) | 24 (100.0%) |
Household Income by Mortgage Status in Wilson Creek
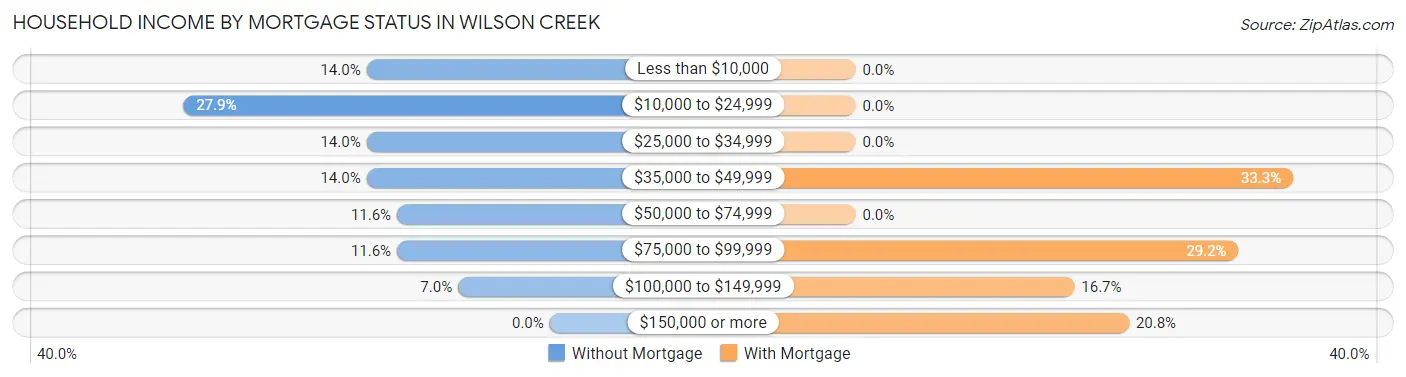
| Household Income | Without Mortgage | With Mortgage |
| Less than $10,000 | 6 (14.0%) | 0 (0.0%) |
| $10,000 to $24,999 | 12 (27.9%) | 0 (0.0%) |
| $25,000 to $34,999 | 6 (14.0%) | 0 (0.0%) |
| $35,000 to $49,999 | 6 (14.0%) | 8 (33.3%) |
| $50,000 to $74,999 | 5 (11.6%) | 0 (0.0%) |
| $75,000 to $99,999 | 5 (11.6%) | 7 (29.2%) |
| $100,000 to $149,999 | 3 (7.0%) | 4 (16.7%) |
| $150,000 or more | 0 (0.0%) | 5 (20.8%) |
| Total | 43 (100.0%) | 24 (100.0%) |
Property Value to Household Income Ratio in Wilson Creek
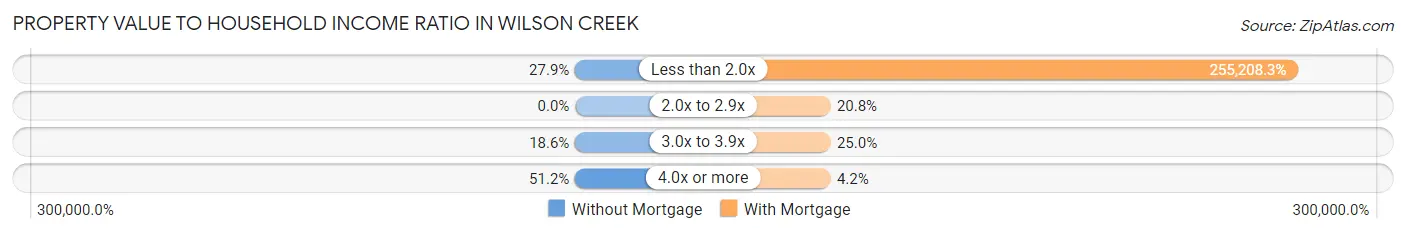
| Value-to-Income Ratio | Without Mortgage | With Mortgage |
| Less than 2.0x | 12 (27.9%) | 61,250 (255,208.3%) |
| 2.0x to 2.9x | 0 (0.0%) | 5 (20.8%) |
| 3.0x to 3.9x | 8 (18.6%) | 6 (25.0%) |
| 4.0x or more | 22 (51.2%) | 1 (4.2%) |
| Total | 43 (100.0%) | 24 (100.0%) |
Real Estate Taxes by Mortgage Status in Wilson Creek
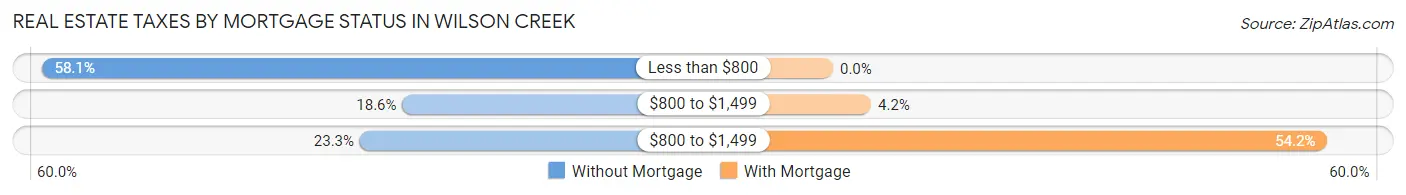
| Property Taxes | Without Mortgage | With Mortgage |
| Less than $800 | 25 (58.1%) | 0 (0.0%) |
| $800 to $1,499 | 8 (18.6%) | 1 (4.2%) |
| $800 to $1,499 | 10 (23.3%) | 13 (54.2%) |
| Total | 43 (100.0%) | 24 (100.0%) |
Health & Disability in Wilson Creek
Health Insurance Coverage by Age in Wilson Creek
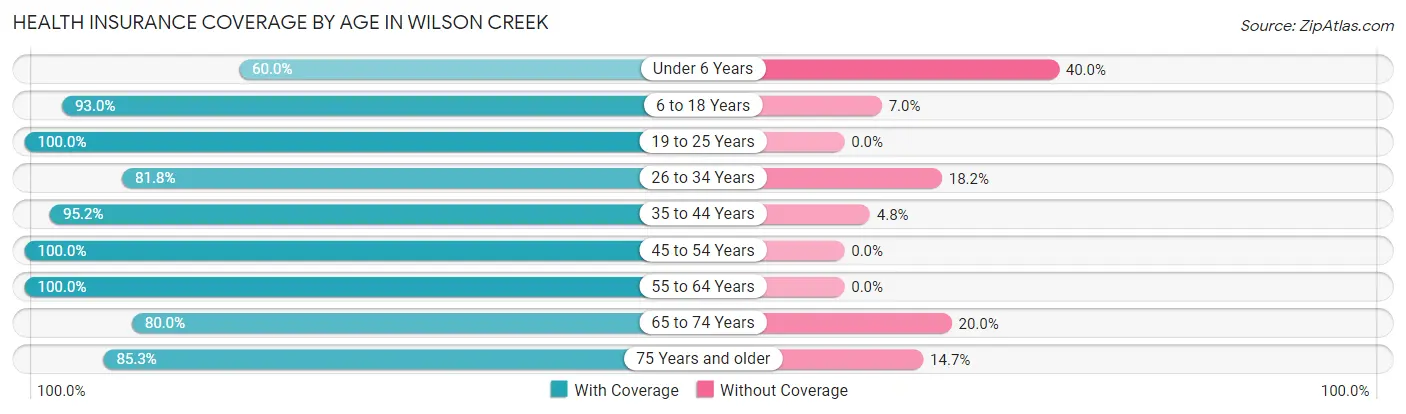
| Age Bracket | With Coverage | Without Coverage |
| Under 6 Years | 3 (60.0%) | 2 (40.0%) |
| 6 to 18 Years | 40 (93.0%) | 3 (7.0%) |
| 19 to 25 Years | 2 (100.0%) | 0 (0.0%) |
| 26 to 34 Years | 9 (81.8%) | 2 (18.2%) |
| 35 to 44 Years | 20 (95.2%) | 1 (4.8%) |
| 45 to 54 Years | 11 (100.0%) | 0 (0.0%) |
| 55 to 64 Years | 22 (100.0%) | 0 (0.0%) |
| 65 to 74 Years | 20 (80.0%) | 5 (20.0%) |
| 75 Years and older | 29 (85.3%) | 5 (14.7%) |
| Total | 156 (89.7%) | 18 (10.3%) |
Health Insurance Coverage by Citizenship Status in Wilson Creek
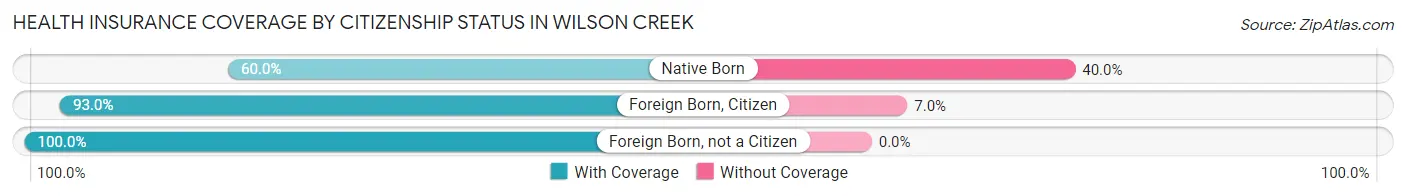
| Citizenship Status | With Coverage | Without Coverage |
| Native Born | 3 (60.0%) | 2 (40.0%) |
| Foreign Born, Citizen | 40 (93.0%) | 3 (7.0%) |
| Foreign Born, not a Citizen | 2 (100.0%) | 0 (0.0%) |
Health Insurance Coverage by Household Income in Wilson Creek
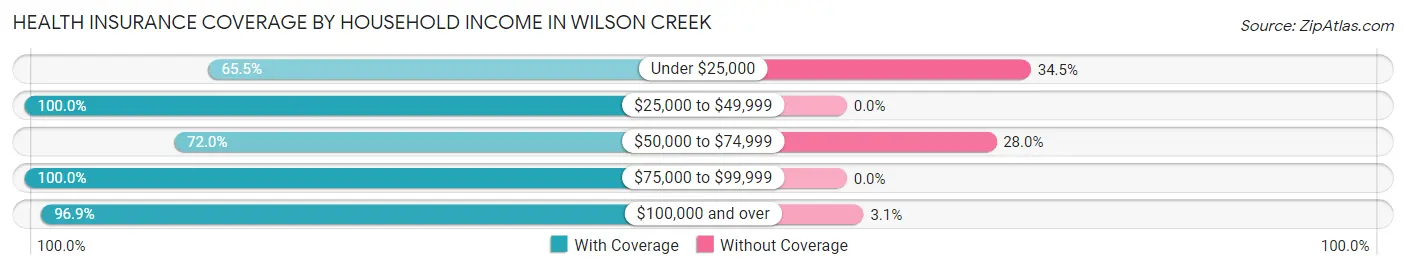
| Household Income | With Coverage | Without Coverage |
| Under $25,000 | 19 (65.5%) | 10 (34.5%) |
| $25,000 to $49,999 | 52 (100.0%) | 0 (0.0%) |
| $50,000 to $74,999 | 18 (72.0%) | 7 (28.0%) |
| $75,000 to $99,999 | 36 (100.0%) | 0 (0.0%) |
| $100,000 and over | 31 (96.9%) | 1 (3.1%) |
Public vs Private Health Insurance Coverage by Age in Wilson Creek
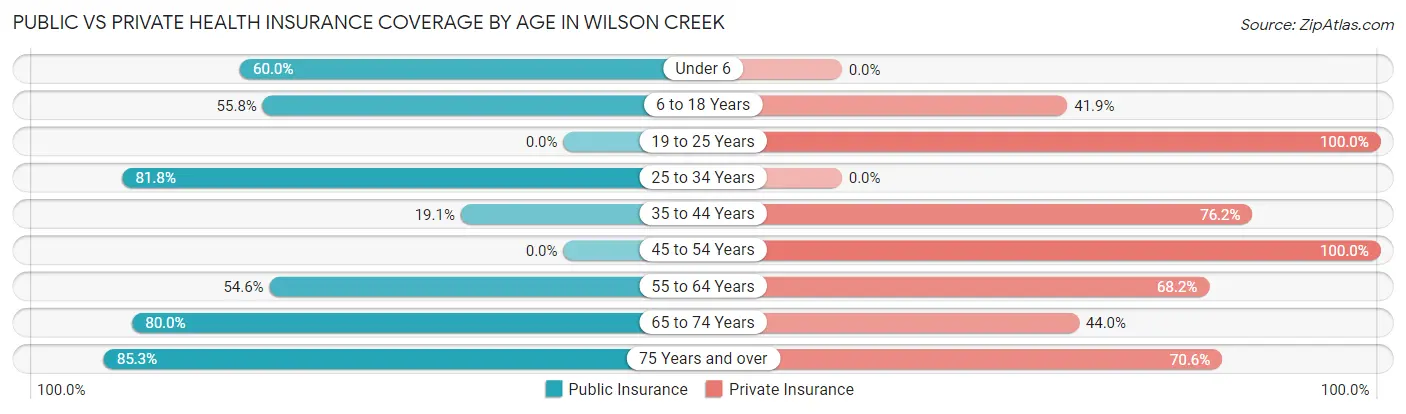
| Age Bracket | Public Insurance | Private Insurance |
| Under 6 | 3 (60.0%) | 0 (0.0%) |
| 6 to 18 Years | 24 (55.8%) | 18 (41.9%) |
| 19 to 25 Years | 0 (0.0%) | 2 (100.0%) |
| 25 to 34 Years | 9 (81.8%) | 0 (0.0%) |
| 35 to 44 Years | 4 (19.1%) | 16 (76.2%) |
| 45 to 54 Years | 0 (0.0%) | 11 (100.0%) |
| 55 to 64 Years | 12 (54.5%) | 15 (68.2%) |
| 65 to 74 Years | 20 (80.0%) | 11 (44.0%) |
| 75 Years and over | 29 (85.3%) | 24 (70.6%) |
| Total | 101 (58.1%) | 97 (55.7%) |
Disability Status by Sex by Age in Wilson Creek
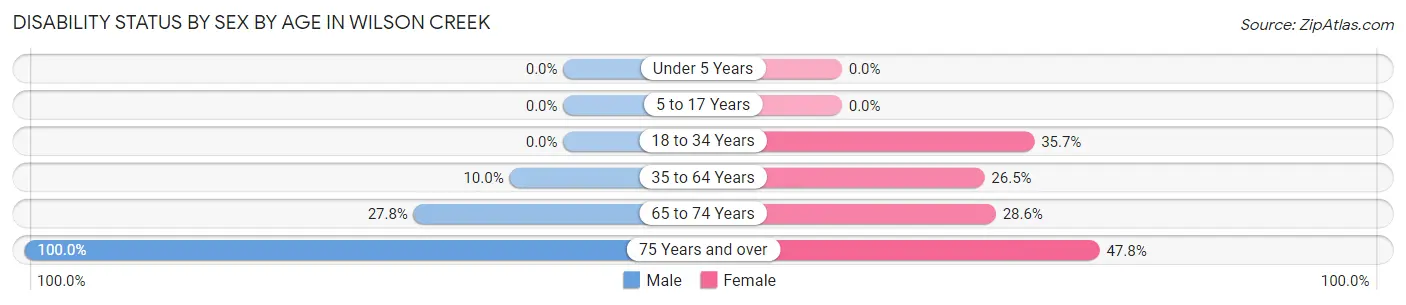
| Age Bracket | Male | Female |
| Under 5 Years | 0 (0.0%) | 0 (0.0%) |
| 5 to 17 Years | 0 (0.0%) | 0 (0.0%) |
| 18 to 34 Years | 0 (0.0%) | 5 (35.7%) |
| 35 to 64 Years | 2 (10.0%) | 9 (26.5%) |
| 65 to 74 Years | 5 (27.8%) | 2 (28.6%) |
| 75 Years and over | 11 (100.0%) | 11 (47.8%) |
Disability Class by Sex by Age in Wilson Creek
Disability Class: Hearing Difficulty
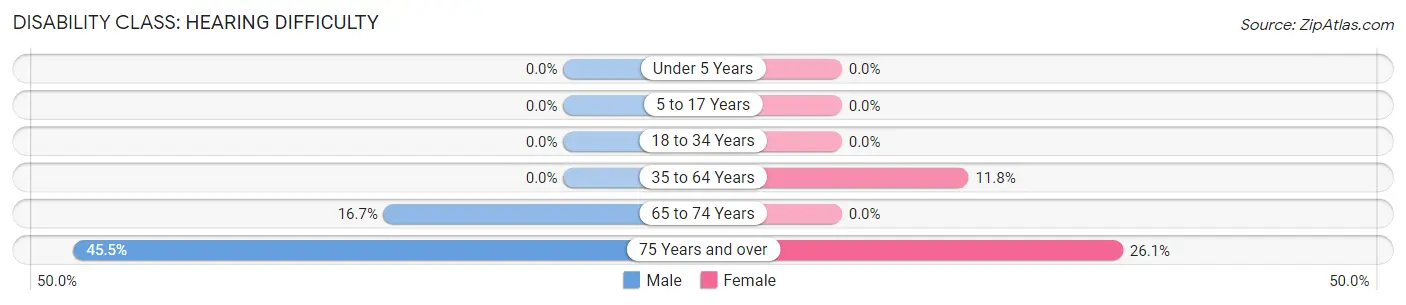
| Age Bracket | Male | Female |
| Under 5 Years | 0 (0.0%) | 0 (0.0%) |
| 5 to 17 Years | 0 (0.0%) | 0 (0.0%) |
| 18 to 34 Years | 0 (0.0%) | 0 (0.0%) |
| 35 to 64 Years | 0 (0.0%) | 4 (11.8%) |
| 65 to 74 Years | 3 (16.7%) | 0 (0.0%) |
| 75 Years and over | 5 (45.5%) | 6 (26.1%) |
Disability Class: Vision Difficulty
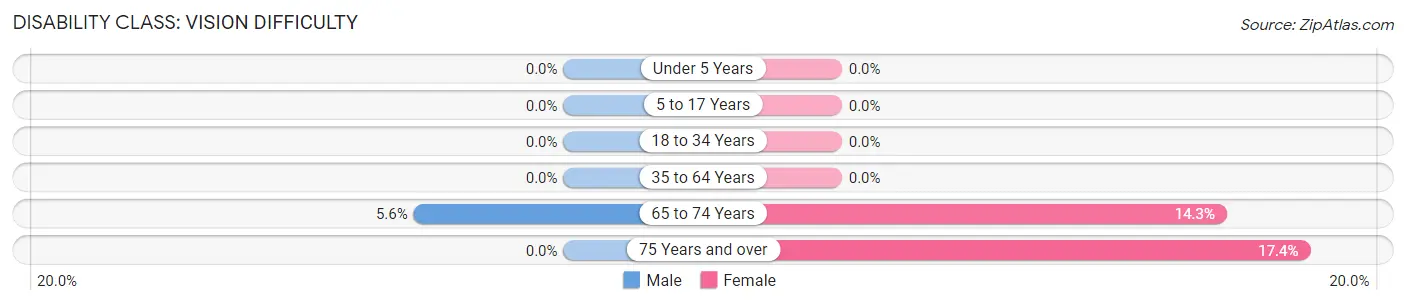
| Age Bracket | Male | Female |
| Under 5 Years | 0 (0.0%) | 0 (0.0%) |
| 5 to 17 Years | 0 (0.0%) | 0 (0.0%) |
| 18 to 34 Years | 0 (0.0%) | 0 (0.0%) |
| 35 to 64 Years | 0 (0.0%) | 0 (0.0%) |
| 65 to 74 Years | 1 (5.6%) | 1 (14.3%) |
| 75 Years and over | 0 (0.0%) | 4 (17.4%) |
Disability Class: Cognitive Difficulty
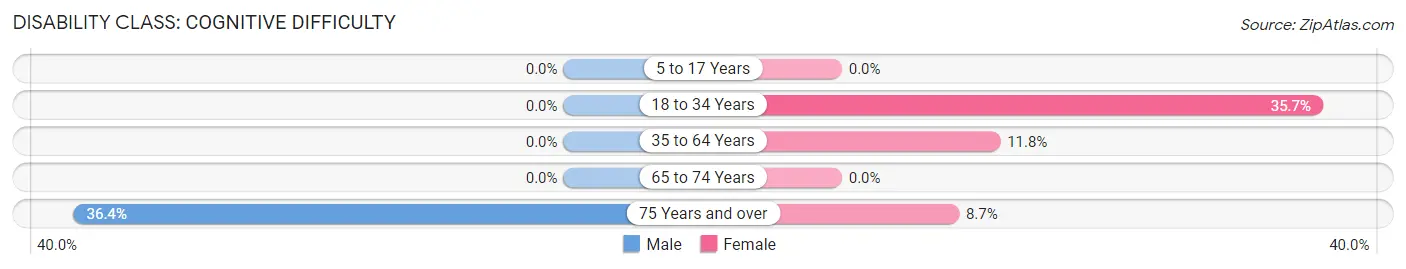
| Age Bracket | Male | Female |
| 5 to 17 Years | 0 (0.0%) | 0 (0.0%) |
| 18 to 34 Years | 0 (0.0%) | 5 (35.7%) |
| 35 to 64 Years | 0 (0.0%) | 4 (11.8%) |
| 65 to 74 Years | 0 (0.0%) | 0 (0.0%) |
| 75 Years and over | 4 (36.4%) | 2 (8.7%) |
Disability Class: Ambulatory Difficulty
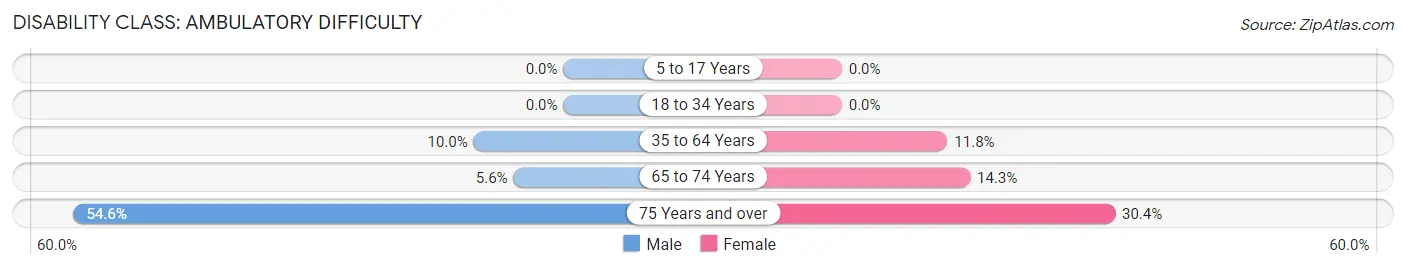
| Age Bracket | Male | Female |
| 5 to 17 Years | 0 (0.0%) | 0 (0.0%) |
| 18 to 34 Years | 0 (0.0%) | 0 (0.0%) |
| 35 to 64 Years | 2 (10.0%) | 4 (11.8%) |
| 65 to 74 Years | 1 (5.6%) | 1 (14.3%) |
| 75 Years and over | 6 (54.5%) | 7 (30.4%) |
Disability Class: Self-Care Difficulty
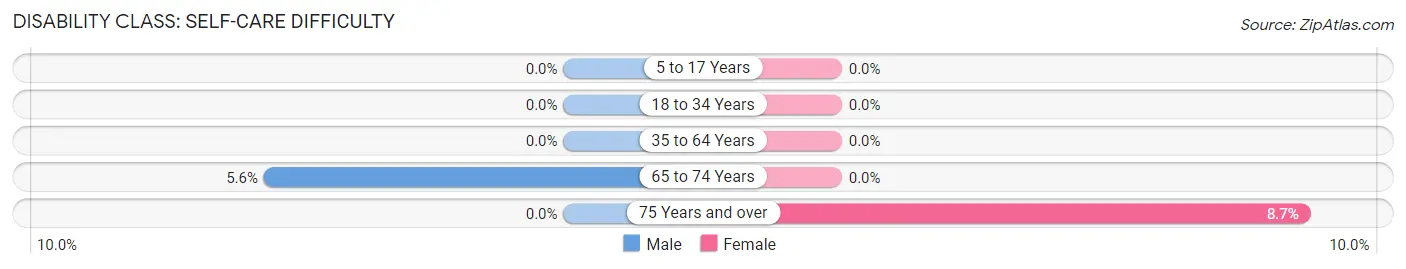
| Age Bracket | Male | Female |
| 5 to 17 Years | 0 (0.0%) | 0 (0.0%) |
| 18 to 34 Years | 0 (0.0%) | 0 (0.0%) |
| 35 to 64 Years | 0 (0.0%) | 0 (0.0%) |
| 65 to 74 Years | 1 (5.6%) | 0 (0.0%) |
| 75 Years and over | 0 (0.0%) | 2 (8.7%) |
Technology Access in Wilson Creek
Computing Device Access in Wilson Creek
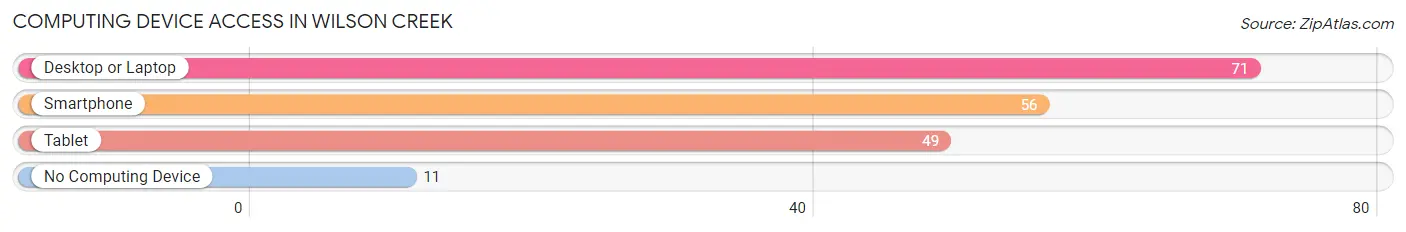
| Device Type | # Households | % Households |
| Desktop or Laptop | 71 | 84.5% |
| Smartphone | 56 | 66.7% |
| Tablet | 49 | 58.3% |
| No Computing Device | 11 | 13.1% |
| Total | 84 | 100.0% |
Internet Access in Wilson Creek
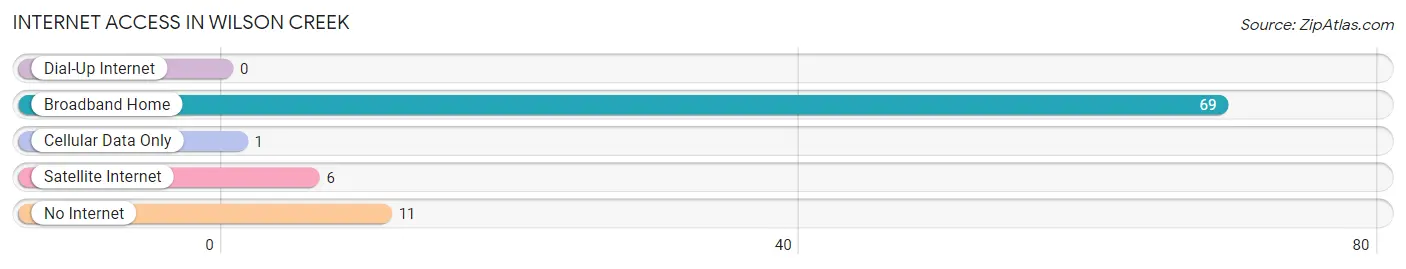
| Internet Type | # Households | % Households |
| Dial-Up Internet | 0 | 0.0% |
| Broadband Home | 69 | 82.1% |
| Cellular Data Only | 1 | 1.2% |
| Satellite Internet | 6 | 7.1% |
| No Internet | 11 | 13.1% |
| Total | 84 | 100.0% |
Wilson Creek Summary
Creek History
Wilson Creek is a small unincorporated community located in the foothills of the Cascade Mountains in Washington State. The area was first settled in the late 1800s by homesteaders who were drawn to the area by its abundant natural resources. The first settlers were mostly of European descent, but there were also some Native Americans who had been living in the area for centuries.
The first settlers built log cabins and cleared the land for farming. They grew a variety of crops, including wheat, oats, potatoes, and hay. They also raised livestock, such as cattle, sheep, and horses. The area was also known for its timber, which was used to build homes and other structures.
The community of Wilson Creek was officially established in 1891. It was named after the creek that runs through the area, which was named after a local settler, William Wilson. The town grew slowly but steadily over the years, and by the early 1900s it had a population of around 200 people.
The town was primarily an agricultural community, but it also had a few small businesses, such as a general store, a blacksmith shop, and a sawmill. The town also had a school, a post office, and a church.
In the early 1900s, the town began to experience a period of growth. The population increased to around 500 people by the 1920s, and the town had a variety of businesses, including a bank, a hotel, and a movie theater.
The town continued to grow throughout the 20th century, and by the 2000 census, the population had reached 1,072 people.
Geography
Wilson Creek is located in the foothills of the Cascade Mountains in Washington State. The town is situated at an elevation of 1,400 feet, and it is surrounded by rolling hills and lush forests. The area is known for its scenic beauty, and it is a popular destination for outdoor activities such as hiking, camping, and fishing.
The town is located near the confluence of the Wilson Creek and the Naches River. The Naches River is a tributary of the Yakima River, which is a major river in the region.
The climate in Wilson Creek is mild and temperate. The average high temperature in the summer is around 80 degrees Fahrenheit, and the average low temperature in the winter is around 30 degrees Fahrenheit. The area receives an average of 20 inches of precipitation per year.
Economy
The economy of Wilson Creek is primarily based on agriculture and tourism. The area is known for its scenic beauty, and it is a popular destination for outdoor activities such as hiking, camping, and fishing.
The town also has a few small businesses, such as a general store, a blacksmith shop, and a sawmill. The town also has a school, a post office, and a church.
Demographics
According to the 2000 census, the population of Wilson Creek was 1,072 people. The racial makeup of the town was 94.3% White, 0.7% African American, 0.7% Native American, 0.7% Asian, 0.7% from other races, and 2.7% from two or more races.
The median household income in Wilson Creek was $37,500, and the median family income was $41,250. The per capita income was $17,500. About 11.7% of the population was below the poverty line.
Common Questions
What is Per Capita Income in Wilson Creek?
Per Capita income in Wilson Creek is $23,314.
What is the Median Family Income in Wilson Creek?
Median Family Income in Wilson Creek is $61,607.
What is the Median Household income in Wilson Creek?
Median Household Income in Wilson Creek is $36,250.
What is Income or Wage Gap in Wilson Creek?
Income or Wage Gap in Wilson Creek is 62.8%.
Women in Wilson Creek earn 37.2 cents for every dollar earned by a man.
What is Family Income Deficit in Wilson Creek?
Family Income Deficit in Wilson Creek is $3,250.
Families that are below poverty line in Wilson Creek earn $3,250 less on average than the poverty threshold level.
What is Inequality or Gini Index in Wilson Creek?
Inequality or Gini Index in Wilson Creek is 0.45.
What is the Total Population of Wilson Creek?
Total Population of Wilson Creek is 174.
What is the Total Male Population of Wilson Creek?
Total Male Population of Wilson Creek is 80.
What is the Total Female Population of Wilson Creek?
Total Female Population of Wilson Creek is 94.
What is the Ratio of Males per 100 Females in Wilson Creek?
There are 85.11 Males per 100 Females in Wilson Creek.
What is the Ratio of Females per 100 Males in Wilson Creek?
There are 117.50 Females per 100 Males in Wilson Creek.
What is the Median Population Age in Wilson Creek?
Median Population Age in Wilson Creek is 50.3 Years.
What is the Average Family Size in Wilson Creek
Average Family Size in Wilson Creek is 3.0 People.
What is the Average Household Size in Wilson Creek
Average Household Size in Wilson Creek is 2.1 People.
How Large is the Labor Force in Wilson Creek?
There are 60 People in the Labor Forcein in Wilson Creek.
What is the Percentage of People in the Labor Force in Wilson Creek?
42.9% of People are in the Labor Force in Wilson Creek.
What is the Unemployment Rate in Wilson Creek?
Unemployment Rate in Wilson Creek is 6.7%.