Chain Lake, WA Map & Demographics
Chain Lake Map
Chain Lake Overview
$65,916
PER CAPITA INCOME
$162,409
AVG FAMILY INCOME
$149,594
AVG HOUSEHOLD INCOME
32.7%
WAGE / INCOME GAP [ % ]
67.3¢/ $1
WAGE / INCOME GAP [ $ ]
0.46
INEQUALITY / GINI INDEX
5,122
TOTAL POPULATION
2,613
MALE POPULATION
2,509
FEMALE POPULATION
104.15
MALES / 100 FEMALES
96.02
FEMALES / 100 MALES
43.7
MEDIAN AGE
3.3
AVG FAMILY SIZE
3.1
AVG HOUSEHOLD SIZE
2,775
LABOR FORCE [ PEOPLE ]
68.6%
PERCENT IN LABOR FORCE
5.0%
UNEMPLOYMENT RATE
Income in Chain Lake
Income Overview in Chain Lake
Per Capita Income in Chain Lake is $65,916, while median incomes of families and households are $162,409 and $149,594 respectively.
| Characteristic | Number | Measure |
| Per Capita Income | 5,122 | $65,916 |
| Median Family Income | 1,383 | $162,409 |
| Mean Family Income | 1,383 | $216,653 |
| Median Household Income | 1,665 | $149,594 |
| Mean Household Income | 1,665 | $197,187 |
| Income Deficit | 1,383 | $0 |
| Wage / Income Gap (%) | 5,122 | 32.69% |
| Wage / Income Gap ($) | 5,122 | 67.31¢ per $1 |
| Gini / Inequality Index | 5,122 | 0.46 |
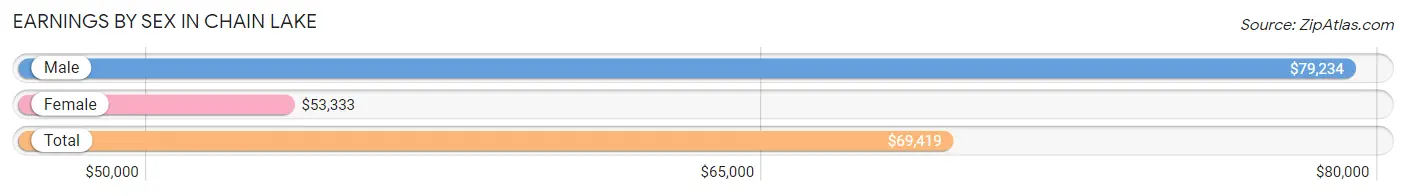
Earnings by Sex in Chain Lake
Average Earnings in Chain Lake are $69,419, $79,234 for men and $53,333 for women, a difference of 32.7%.
| Sex | Number | Average Earnings |
| Male | 1,529 (54.2%) | $79,234 |
| Female | 1,290 (45.8%) | $53,333 |
| Total | 2,819 (100.0%) | $69,419 |
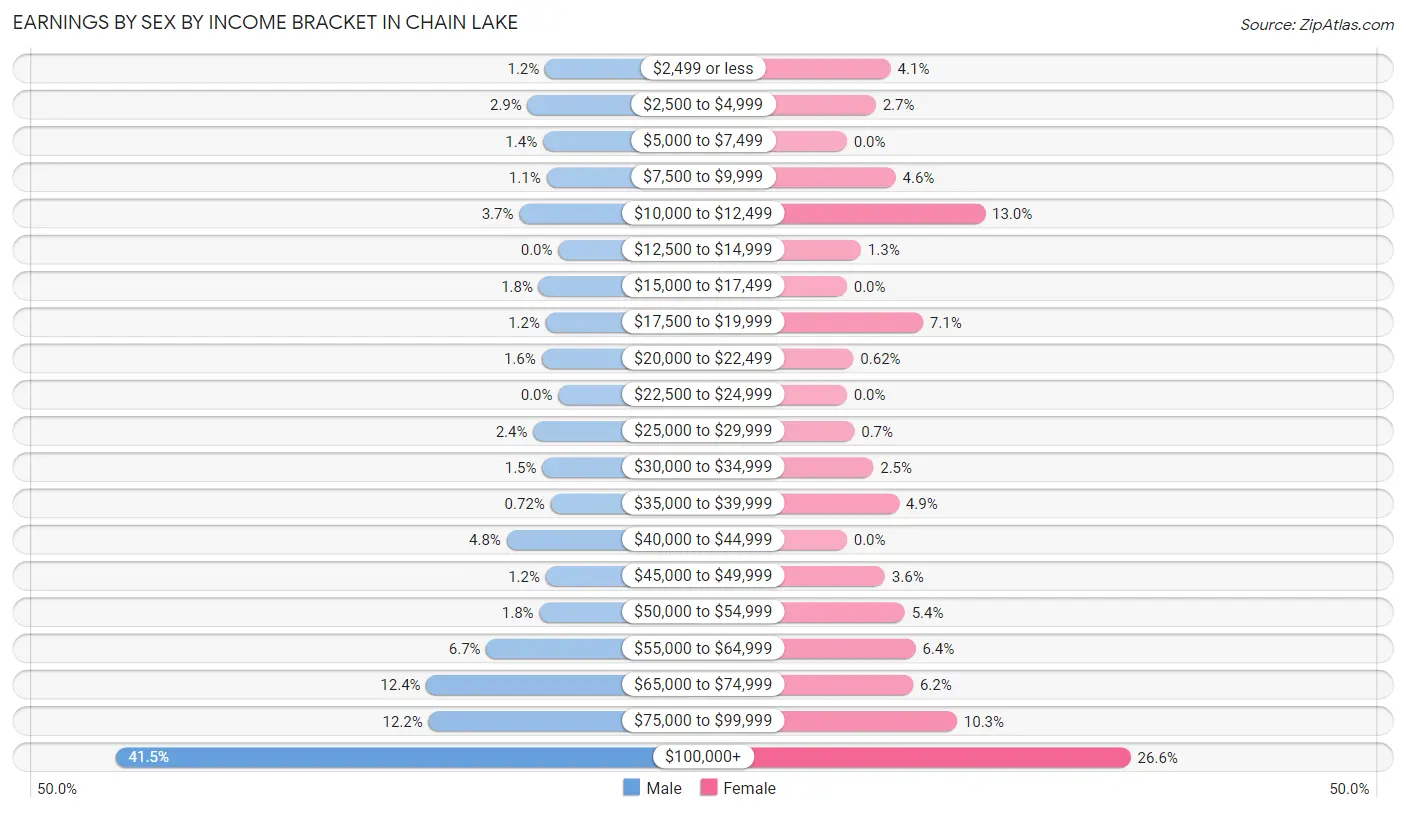
Earnings by Sex by Income Bracket in Chain Lake
The most common earnings brackets in Chain Lake are $100,000+ for men (634 | 41.5%) and $100,000+ for women (343 | 26.6%).
| Income | Male | Female |
| $2,499 or less | 19 (1.2%) | 53 (4.1%) |
| $2,500 to $4,999 | 44 (2.9%) | 35 (2.7%) |
| $5,000 to $7,499 | 22 (1.4%) | 0 (0.0%) |
| $7,500 to $9,999 | 17 (1.1%) | 59 (4.6%) |
| $10,000 to $12,499 | 56 (3.7%) | 167 (13.0%) |
| $12,500 to $14,999 | 0 (0.0%) | 17 (1.3%) |
| $15,000 to $17,499 | 28 (1.8%) | 0 (0.0%) |
| $17,500 to $19,999 | 18 (1.2%) | 92 (7.1%) |
| $20,000 to $22,499 | 24 (1.6%) | 8 (0.6%) |
| $22,500 to $24,999 | 0 (0.0%) | 0 (0.0%) |
| $25,000 to $29,999 | 36 (2.4%) | 9 (0.7%) |
| $30,000 to $34,999 | 23 (1.5%) | 32 (2.5%) |
| $35,000 to $39,999 | 11 (0.7%) | 63 (4.9%) |
| $40,000 to $44,999 | 74 (4.8%) | 0 (0.0%) |
| $45,000 to $49,999 | 18 (1.2%) | 46 (3.6%) |
| $50,000 to $54,999 | 27 (1.8%) | 70 (5.4%) |
| $55,000 to $64,999 | 103 (6.7%) | 83 (6.4%) |
| $65,000 to $74,999 | 189 (12.4%) | 80 (6.2%) |
| $75,000 to $99,999 | 186 (12.2%) | 133 (10.3%) |
| $100,000+ | 634 (41.5%) | 343 (26.6%) |
| Total | 1,529 (100.0%) | 1,290 (100.0%) |
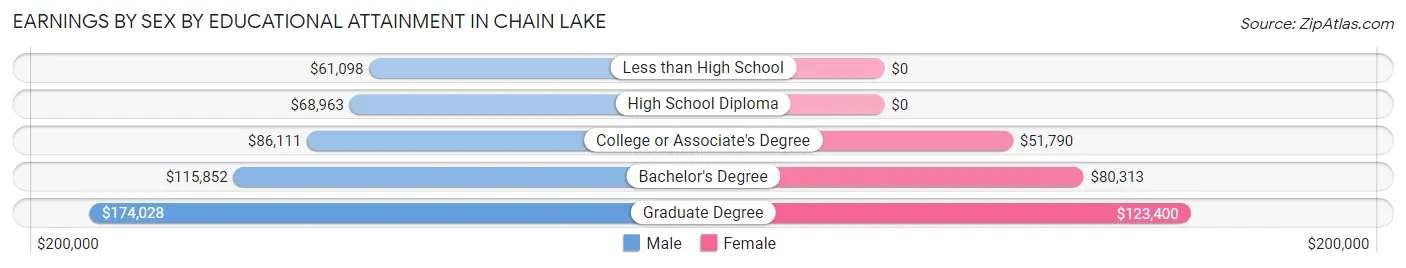
Earnings by Sex by Educational Attainment in Chain Lake
Average earnings in Chain Lake are $88,021 for men and $61,776 for women, a difference of 29.8%. Men with an educational attainment of graduate degree enjoy the highest average annual earnings of $174,028, while those with less than high school education earn the least with $61,098. Women with an educational attainment of graduate degree earn the most with the average annual earnings of $123,400, while those with college or associate's degree education have the smallest earnings of $51,790.
| Educational Attainment | Male Income | Female Income |
| Less than High School | $61,098 | $0 |
| High School Diploma | $68,963 | $0 |
| College or Associate's Degree | $86,111 | $51,790 |
| Bachelor's Degree | $115,852 | $80,313 |
| Graduate Degree | $174,028 | $123,400 |
| Total | $88,021 | $61,776 |
Family Income in Chain Lake
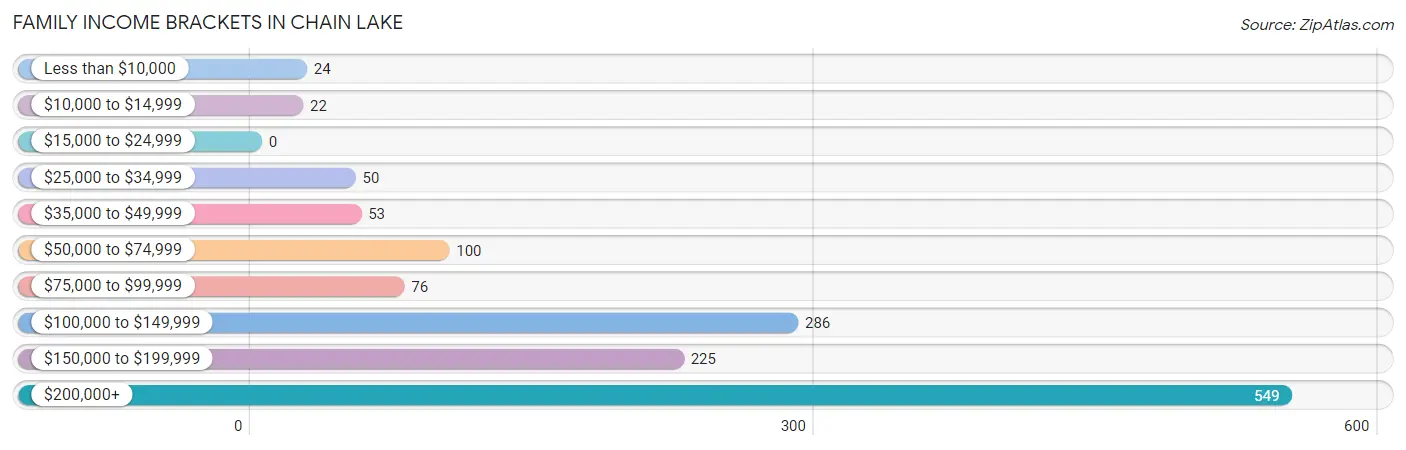
Family Income Brackets in Chain Lake
According to the Chain Lake family income data, there are 549 families falling into the $200,000+ income range, which is the most common income bracket and makes up 39.7% of all families.
| Income Bracket | # Families | % Families |
| Less than $10,000 | 24 | 1.7% |
| $10,000 to $14,999 | 22 | 1.6% |
| $15,000 to $24,999 | 0 | 0.0% |
| $25,000 to $34,999 | 50 | 3.6% |
| $35,000 to $49,999 | 53 | 3.8% |
| $50,000 to $74,999 | 100 | 7.2% |
| $75,000 to $99,999 | 76 | 5.5% |
| $100,000 to $149,999 | 286 | 20.7% |
| $150,000 to $199,999 | 225 | 16.3% |
| $200,000+ | 549 | 39.7% |
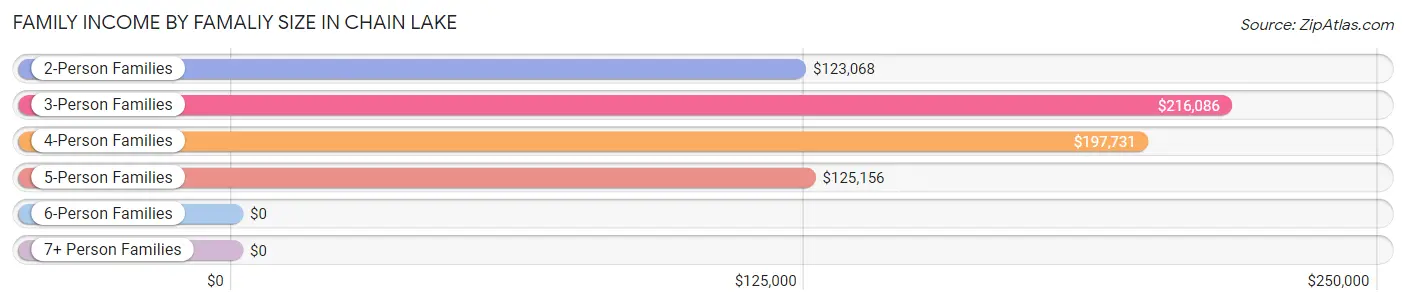
Family Income by Famaliy Size in Chain Lake
3-person families (368 | 26.6%) account for the highest median family income in Chain Lake with $216,086 per family, while 3-person families (368 | 26.6%) have the highest median income of $72,029 per family member.
| Income Bracket | # Families | Median Income |
| 2-Person Families | 567 (41.0%) | $123,068 |
| 3-Person Families | 368 (26.6%) | $216,086 |
| 4-Person Families | 265 (19.2%) | $197,731 |
| 5-Person Families | 103 (7.4%) | $125,156 |
| 6-Person Families | 50 (3.6%) | $0 |
| 7+ Person Families | 30 (2.2%) | $0 |
| Total | 1,383 (100.0%) | $162,409 |
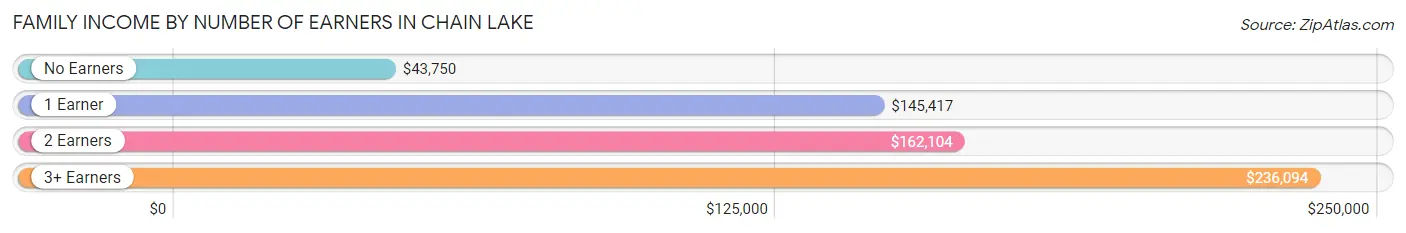
Family Income by Number of Earners in Chain Lake
The median family income in Chain Lake is $162,409, with families comprising 3+ earners (283) having the highest median family income of $236,094, while families with no earners (178) have the lowest median family income of $43,750, accounting for 20.5% and 12.9% of families, respectively.
| Number of Earners | # Families | Median Income |
| No Earners | 178 (12.9%) | $43,750 |
| 1 Earner | 427 (30.9%) | $145,417 |
| 2 Earners | 495 (35.8%) | $162,104 |
| 3+ Earners | 283 (20.5%) | $236,094 |
| Total | 1,383 (100.0%) | $162,409 |
Household Income in Chain Lake
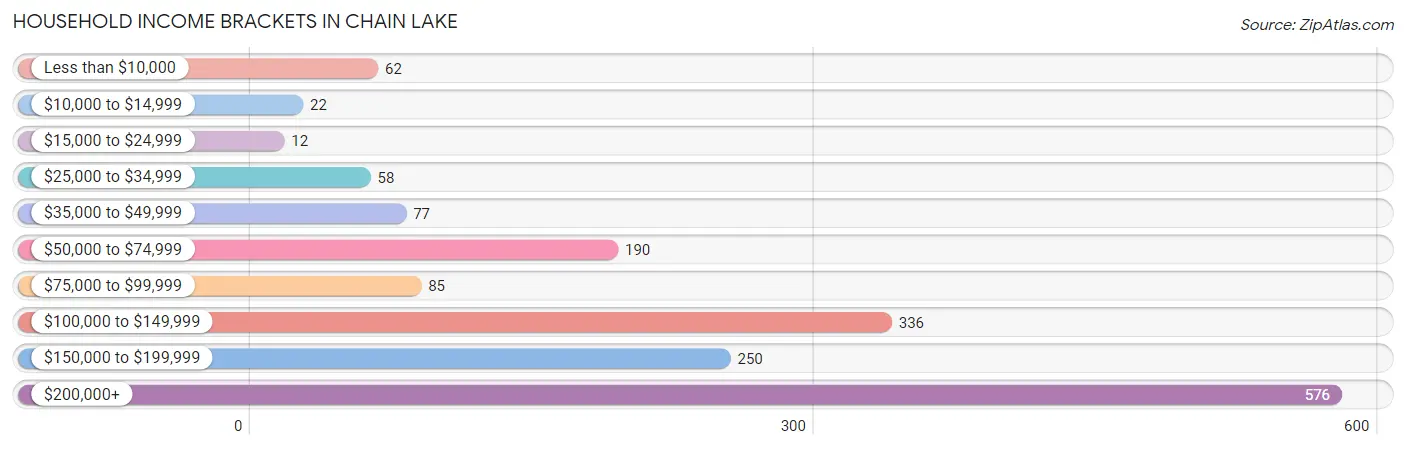
Household Income Brackets in Chain Lake
With 576 households falling in the category, the $200,000+ income range is the most frequent in Chain Lake, accounting for 34.6% of all households. In contrast, only 12 households (0.7%) fall into the $15,000 to $24,999 income bracket, making it the least populous group.
| Income Bracket | # Households | % Households |
| Less than $10,000 | 62 | 3.7% |
| $10,000 to $14,999 | 22 | 1.3% |
| $15,000 to $24,999 | 12 | 0.7% |
| $25,000 to $34,999 | 58 | 3.5% |
| $35,000 to $49,999 | 77 | 4.6% |
| $50,000 to $74,999 | 190 | 11.4% |
| $75,000 to $99,999 | 85 | 5.1% |
| $100,000 to $149,999 | 336 | 20.2% |
| $150,000 to $199,999 | 250 | 15.0% |
| $200,000+ | 576 | 34.6% |
Household Income by Householder Age in Chain Lake
The median household income in Chain Lake is $149,594, with the highest median household income of $161,860 found in the 45 to 64 years age bracket for the primary householder. A total of 807 households (48.5%) fall into this category.
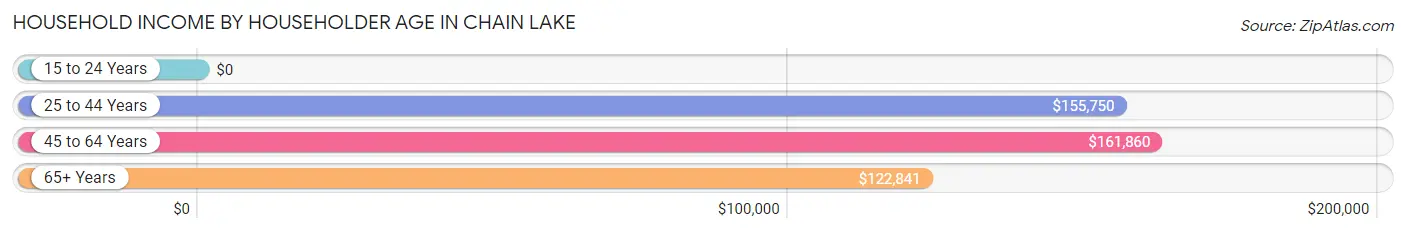
| Income Bracket | # Households | Median Income |
| 15 to 24 Years | 0 (0.0%) | $0 |
| 25 to 44 Years | 425 (25.5%) | $155,750 |
| 45 to 64 Years | 807 (48.5%) | $161,860 |
| 65+ Years | 433 (26.0%) | $122,841 |
| Total | 1,665 (100.0%) | $149,594 |
Poverty in Chain Lake
Income Below Poverty by Sex and Age in Chain Lake
With 1.7% poverty level for males and 6.6% for females among the residents of Chain Lake, 65 to 74 year old males and 12 to 14 year old females are the most vulnerable to poverty, with 14 males (4.4%) and 23 females (41.1%) in their respective age groups living below the poverty level.
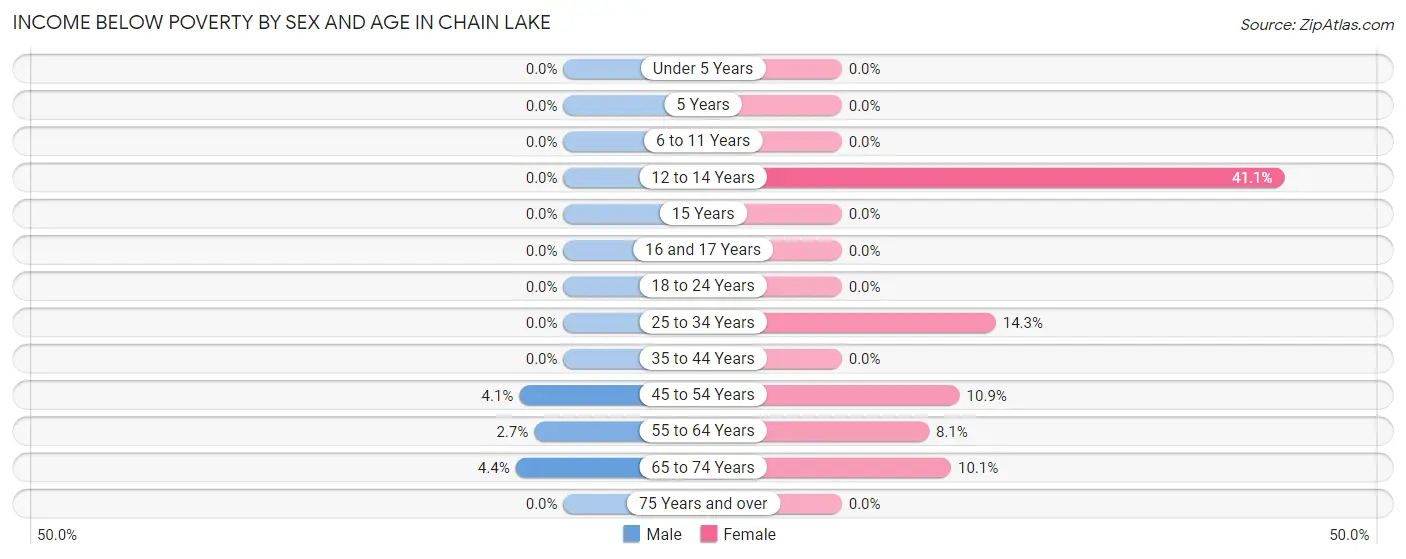
| Age Bracket | Male | Female |
| Under 5 Years | 0 (0.0%) | 0 (0.0%) |
| 5 Years | 0 (0.0%) | 0 (0.0%) |
| 6 to 11 Years | 0 (0.0%) | 0 (0.0%) |
| 12 to 14 Years | 0 (0.0%) | 23 (41.1%) |
| 15 Years | 0 (0.0%) | 0 (0.0%) |
| 16 and 17 Years | 0 (0.0%) | 0 (0.0%) |
| 18 to 24 Years | 0 (0.0%) | 0 (0.0%) |
| 25 to 34 Years | 0 (0.0%) | 31 (14.3%) |
| 35 to 44 Years | 0 (0.0%) | 0 (0.0%) |
| 45 to 54 Years | 20 (4.1%) | 43 (10.9%) |
| 55 to 64 Years | 9 (2.7%) | 38 (8.1%) |
| 65 to 74 Years | 14 (4.4%) | 30 (10.1%) |
| 75 Years and over | 0 (0.0%) | 0 (0.0%) |
| Total | 43 (1.7%) | 165 (6.6%) |
Income Above Poverty by Sex and Age in Chain Lake
According to the poverty statistics in Chain Lake, males aged under 5 years and females aged under 5 years are the age groups that are most secure financially, with 100.0% of males and 100.0% of females in these age groups living above the poverty line.
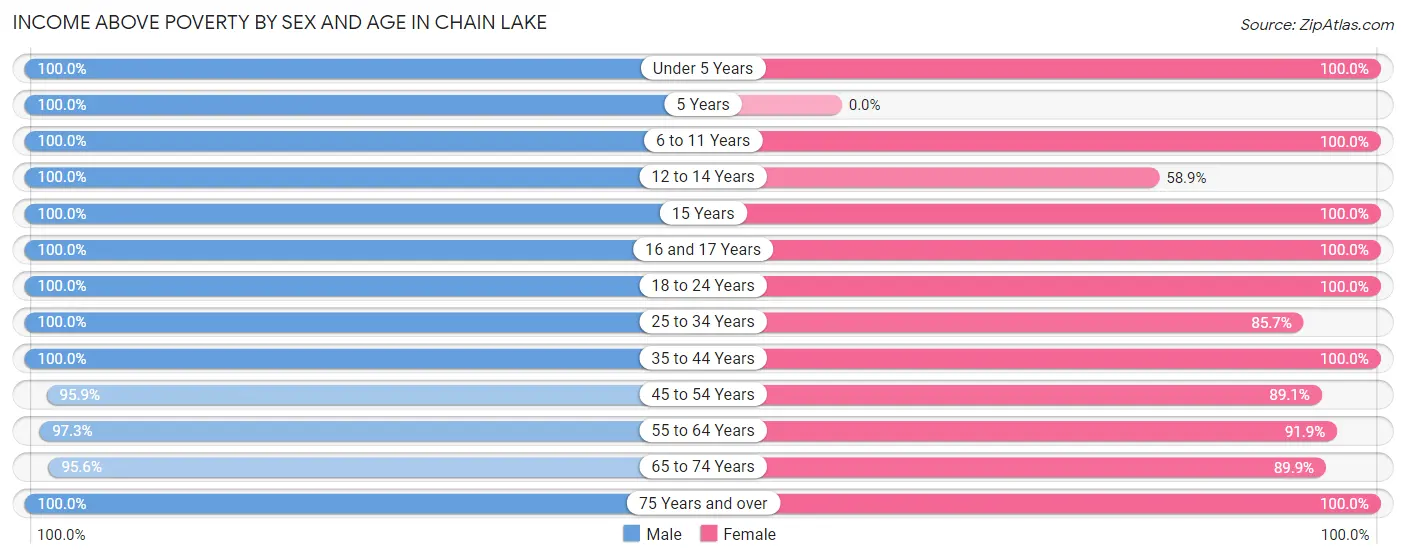
| Age Bracket | Male | Female |
| Under 5 Years | 101 (100.0%) | 165 (100.0%) |
| 5 Years | 160 (100.0%) | 0 (0.0%) |
| 6 to 11 Years | 268 (100.0%) | 185 (100.0%) |
| 12 to 14 Years | 73 (100.0%) | 33 (58.9%) |
| 15 Years | 9 (100.0%) | 60 (100.0%) |
| 16 and 17 Years | 44 (100.0%) | 22 (100.0%) |
| 18 to 24 Years | 94 (100.0%) | 187 (100.0%) |
| 25 to 34 Years | 231 (100.0%) | 186 (85.7%) |
| 35 to 44 Years | 379 (100.0%) | 366 (100.0%) |
| 45 to 54 Years | 468 (95.9%) | 350 (89.1%) |
| 55 to 64 Years | 322 (97.3%) | 432 (91.9%) |
| 65 to 74 Years | 301 (95.6%) | 266 (89.9%) |
| 75 Years and over | 120 (100.0%) | 92 (100.0%) |
| Total | 2,570 (98.4%) | 2,344 (93.4%) |
Income Below Poverty Among Married-Couple Families in Chain Lake
The poverty statistics for married-couple families in Chain Lake show that 2.1% or 24 of the total 1,162 families live below the poverty line. Families with no children have the highest poverty rate of 3.4%, comprising of 24 families. On the other hand, families with 1 or 2 children have the lowest poverty rate of 0.0%, which includes 0 families.
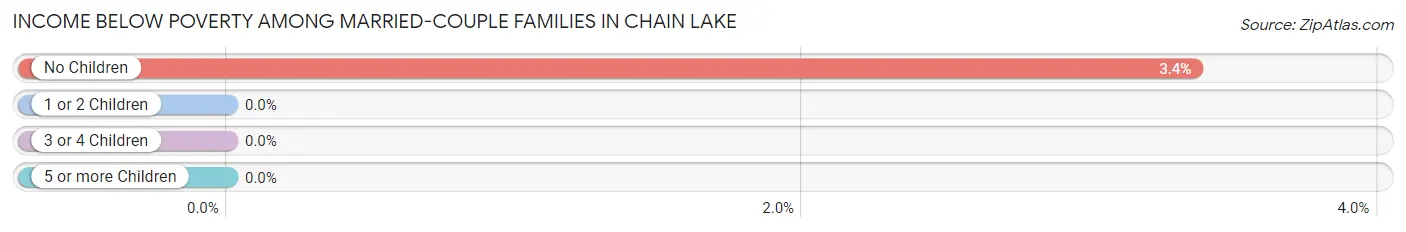
| Children | Above Poverty | Below Poverty |
| No Children | 690 (96.6%) | 24 (3.4%) |
| 1 or 2 Children | 299 (100.0%) | 0 (0.0%) |
| 3 or 4 Children | 149 (100.0%) | 0 (0.0%) |
| 5 or more Children | 0 (0.0%) | 0 (0.0%) |
| Total | 1,138 (97.9%) | 24 (2.1%) |
Income Below Poverty Among Single-Parent Households in Chain Lake
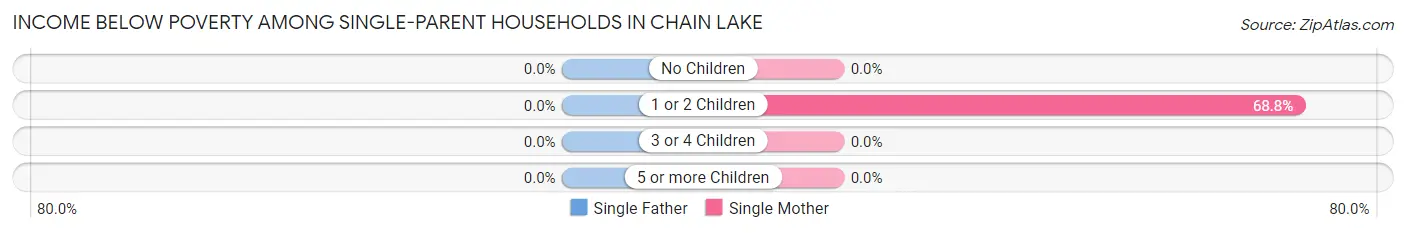
| Children | Single Father | Single Mother |
| No Children | 0 (0.0%) | 0 (0.0%) |
| 1 or 2 Children | 0 (0.0%) | 22 (68.8%) |
| 3 or 4 Children | 0 (0.0%) | 0 (0.0%) |
| 5 or more Children | 0 (0.0%) | 0 (0.0%) |
| Total | 0 (0.0%) | 22 (23.2%) |
Income Below Poverty Among Married-Couple vs Single-Parent Households in Chain Lake
The poverty data for Chain Lake shows that 24 of the married-couple family households (2.1%) and 22 of the single-parent households (10.0%) are living below the poverty level. Within the married-couple family households, those with no children have the highest poverty rate, with 24 households (3.4%) falling below the poverty line. Among the single-parent households, those with 1 or 2 children have the highest poverty rate, with 22 household (20.9%) living below poverty.
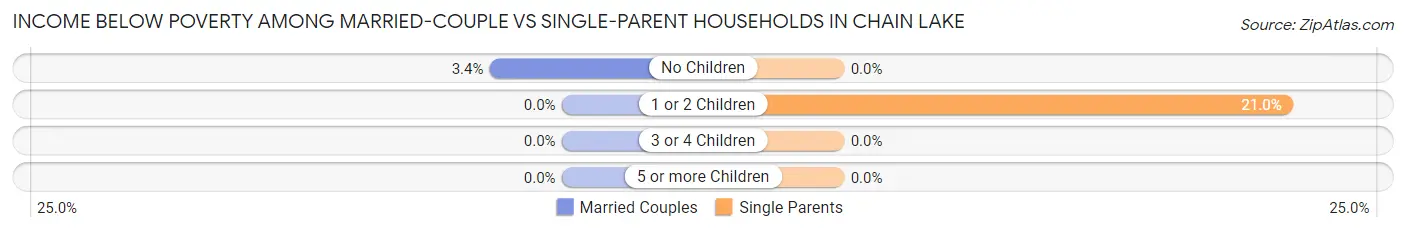
| Children | Married-Couple Families | Single-Parent Households |
| No Children | 24 (3.4%) | 0 (0.0%) |
| 1 or 2 Children | 0 (0.0%) | 22 (20.9%) |
| 3 or 4 Children | 0 (0.0%) | 0 (0.0%) |
| 5 or more Children | 0 (0.0%) | 0 (0.0%) |
| Total | 24 (2.1%) | 22 (10.0%) |
Race in Chain Lake
The most populous races in Chain Lake are White / Caucasian (4,490 | 87.7%), Two or more Races (505 | 9.9%), and Hispanic or Latino (314 | 6.1%).
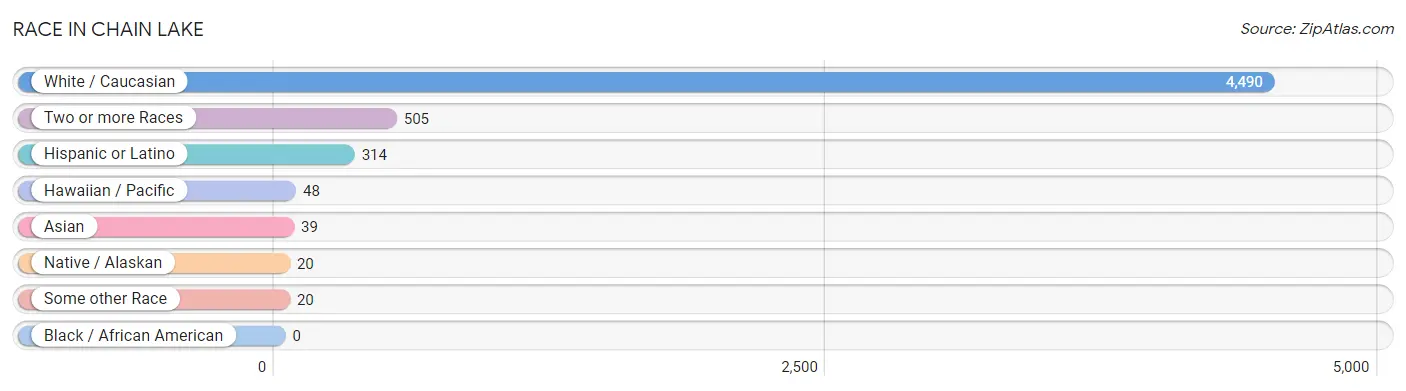
| Race | # Population | % Population |
| Asian | 39 | 0.8% |
| Black / African American | 0 | 0.0% |
| Hawaiian / Pacific | 48 | 0.9% |
| Hispanic or Latino | 314 | 6.1% |
| Native / Alaskan | 20 | 0.4% |
| White / Caucasian | 4,490 | 87.7% |
| Two or more Races | 505 | 9.9% |
| Some other Race | 20 | 0.4% |
| Total | 5,122 | 100.0% |
Ancestry in Chain Lake
The most populous ancestries reported in Chain Lake are German (1,309 | 25.6%), English (679 | 13.3%), Irish (356 | 7.0%), Norwegian (342 | 6.7%), and Polish (213 | 4.2%), together accounting for 56.6% of all Chain Lake residents.
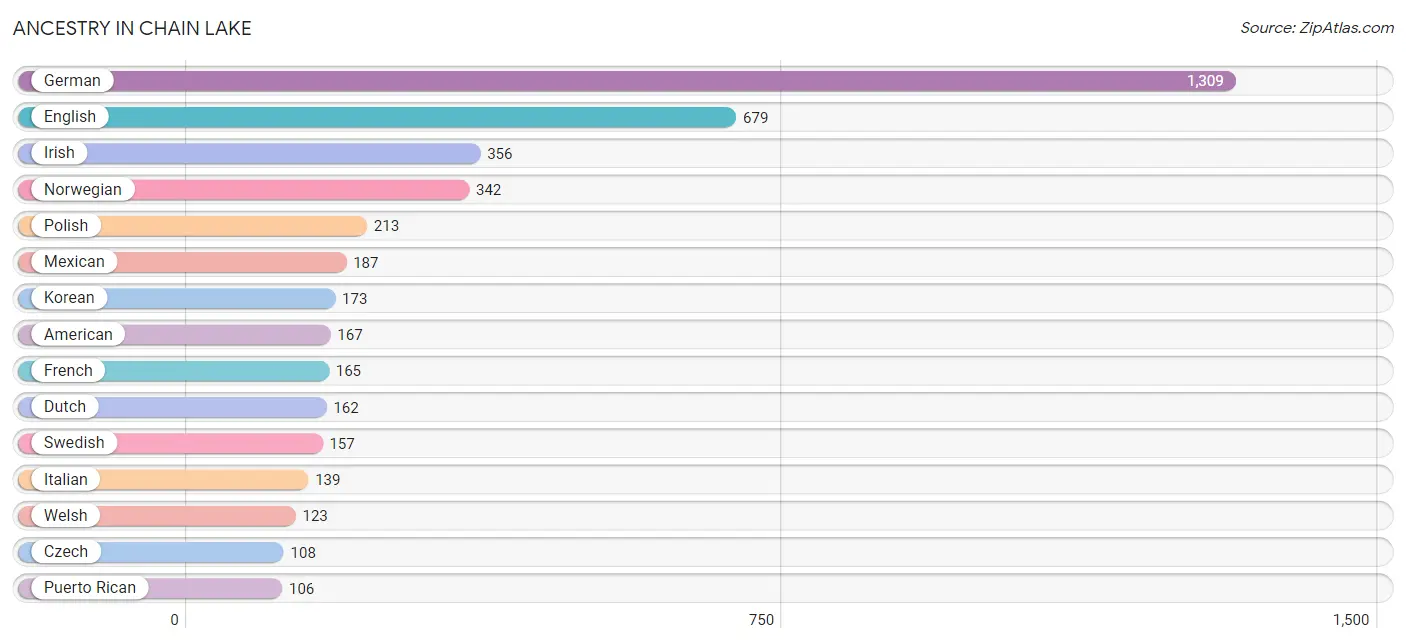
| Ancestry | # Population | % Population |
| Aleut | 6 | 0.1% |
| American | 167 | 3.3% |
| Austrian | 9 | 0.2% |
| Bhutanese | 8 | 0.2% |
| Blackfeet | 6 | 0.1% |
| British | 63 | 1.2% |
| Burmese | 23 | 0.4% |
| Canadian | 56 | 1.1% |
| Central American | 10 | 0.2% |
| Creek | 5 | 0.1% |
| Czech | 108 | 2.1% |
| Czechoslovakian | 82 | 1.6% |
| Danish | 19 | 0.4% |
| Dutch | 162 | 3.2% |
| English | 679 | 13.3% |
| European | 39 | 0.8% |
| Finnish | 67 | 1.3% |
| French | 165 | 3.2% |
| French Canadian | 23 | 0.4% |
| German | 1,309 | 25.6% |
| Irish | 356 | 7.0% |
| Italian | 139 | 2.7% |
| Korean | 173 | 3.4% |
| Lithuanian | 22 | 0.4% |
| Luxembourger | 9 | 0.2% |
| Mexican | 187 | 3.6% |
| Navajo | 9 | 0.2% |
| Northern European | 43 | 0.8% |
| Norwegian | 342 | 6.7% |
| Polish | 213 | 4.2% |
| Puerto Rican | 106 | 2.1% |
| Russian | 9 | 0.2% |
| Salvadoran | 10 | 0.2% |
| Samoan | 48 | 0.9% |
| Scandinavian | 17 | 0.3% |
| Scotch-Irish | 100 | 1.9% |
| Scottish | 65 | 1.3% |
| Spaniard | 11 | 0.2% |
| Sri Lankan | 33 | 0.6% |
| Swedish | 157 | 3.1% |
| Ukrainian | 26 | 0.5% |
| Welsh | 123 | 2.4% | View All 42 Rows |
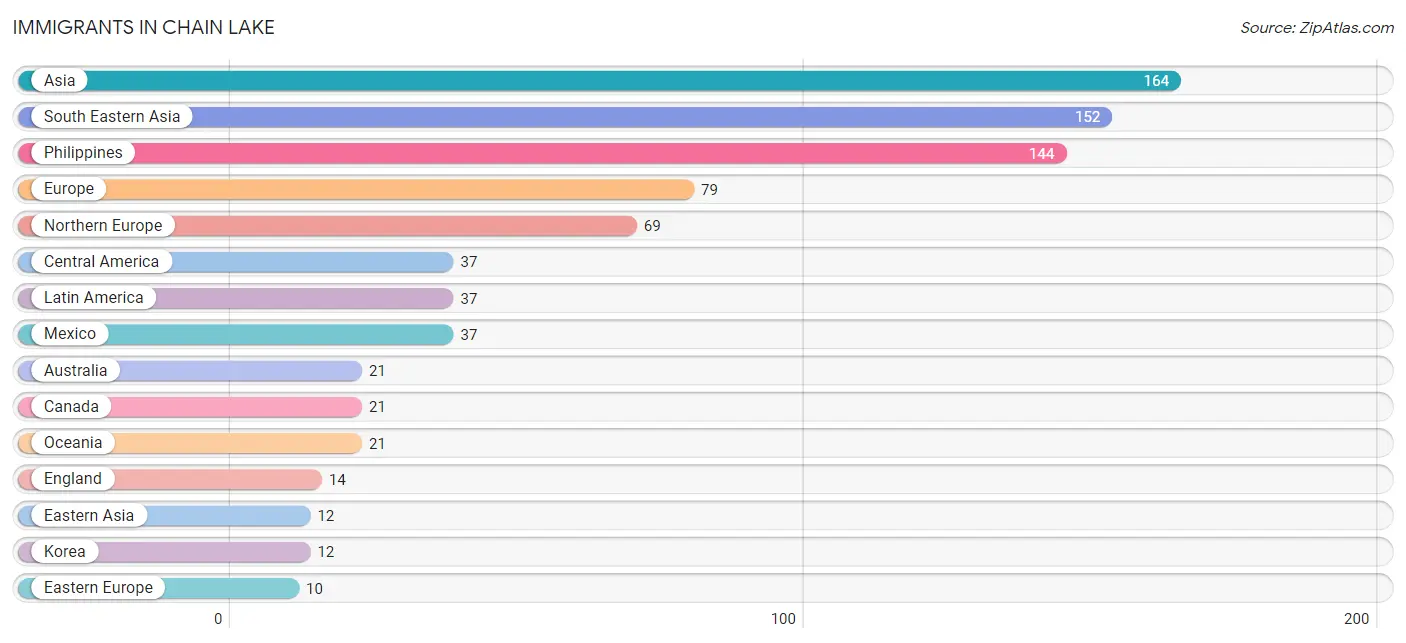
Immigrants in Chain Lake
The most numerous immigrant groups reported in Chain Lake came from Asia (164 | 3.2%), South Eastern Asia (152 | 3.0%), Philippines (144 | 2.8%), Europe (79 | 1.5%), and Northern Europe (69 | 1.3%), together accounting for 11.9% of all Chain Lake residents.
| Immigration Origin | # Population | % Population |
| Asia | 164 | 3.2% |
| Australia | 21 | 0.4% |
| Canada | 21 | 0.4% |
| Central America | 37 | 0.7% |
| Denmark | 9 | 0.2% |
| Eastern Asia | 12 | 0.2% |
| Eastern Europe | 10 | 0.2% |
| England | 14 | 0.3% |
| Europe | 79 | 1.5% |
| Korea | 12 | 0.2% |
| Latin America | 37 | 0.7% |
| Mexico | 37 | 0.7% |
| Northern Europe | 69 | 1.3% |
| Oceania | 21 | 0.4% |
| Philippines | 144 | 2.8% |
| South Eastern Asia | 152 | 3.0% |
| Ukraine | 10 | 0.2% |
| Vietnam | 8 | 0.2% | View All 18 Rows |
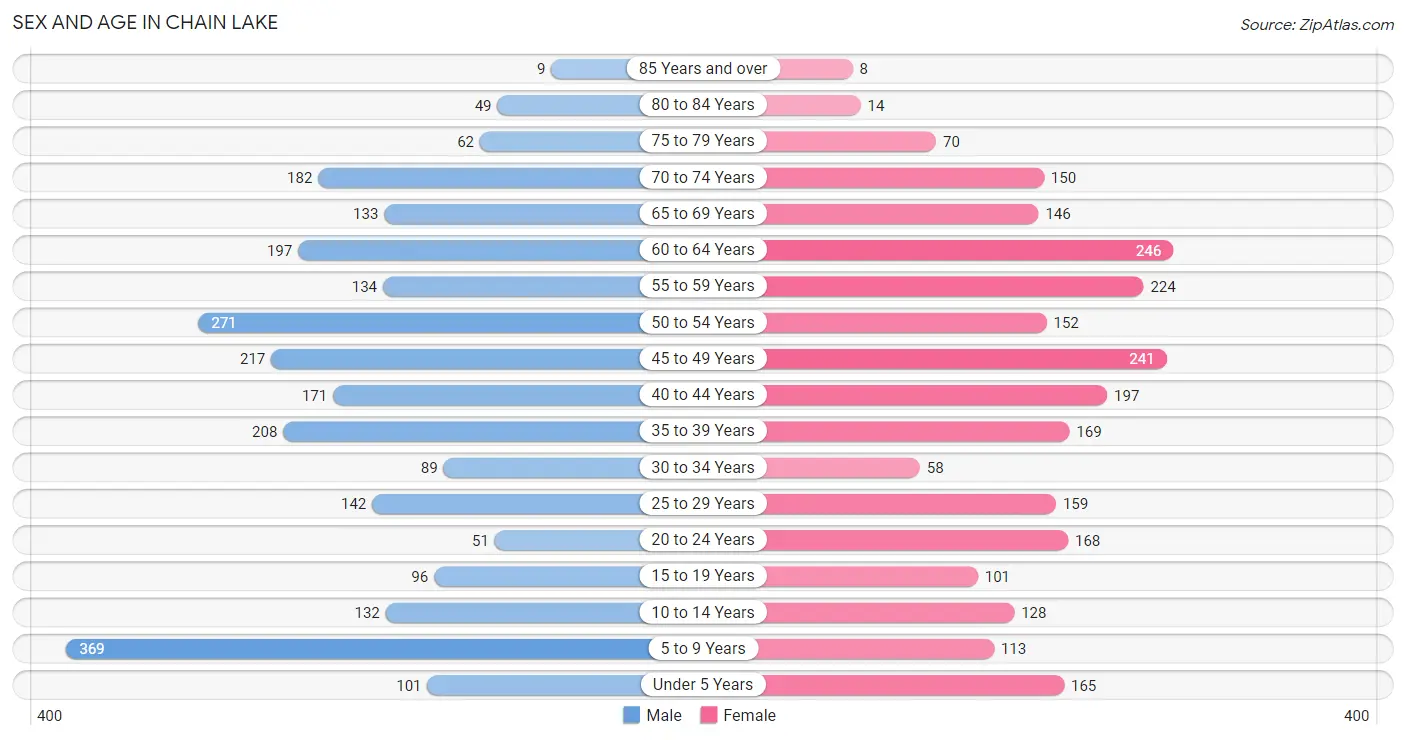
Sex and Age in Chain Lake
Sex and Age in Chain Lake
The most populous age groups in Chain Lake are 5 to 9 Years (369 | 14.1%) for men and 60 to 64 Years (246 | 9.8%) for women.
| Age Bracket | Male | Female |
| Under 5 Years | 101 (3.9%) | 165 (6.6%) |
| 5 to 9 Years | 369 (14.1%) | 113 (4.5%) |
| 10 to 14 Years | 132 (5.1%) | 128 (5.1%) |
| 15 to 19 Years | 96 (3.7%) | 101 (4.0%) |
| 20 to 24 Years | 51 (1.9%) | 168 (6.7%) |
| 25 to 29 Years | 142 (5.4%) | 159 (6.3%) |
| 30 to 34 Years | 89 (3.4%) | 58 (2.3%) |
| 35 to 39 Years | 208 (8.0%) | 169 (6.7%) |
| 40 to 44 Years | 171 (6.5%) | 197 (7.9%) |
| 45 to 49 Years | 217 (8.3%) | 241 (9.6%) |
| 50 to 54 Years | 271 (10.4%) | 152 (6.1%) |
| 55 to 59 Years | 134 (5.1%) | 224 (8.9%) |
| 60 to 64 Years | 197 (7.5%) | 246 (9.8%) |
| 65 to 69 Years | 133 (5.1%) | 146 (5.8%) |
| 70 to 74 Years | 182 (7.0%) | 150 (6.0%) |
| 75 to 79 Years | 62 (2.4%) | 70 (2.8%) |
| 80 to 84 Years | 49 (1.9%) | 14 (0.6%) |
| 85 Years and over | 9 (0.3%) | 8 (0.3%) |
| Total | 2,613 (100.0%) | 2,509 (100.0%) |
Families and Households in Chain Lake
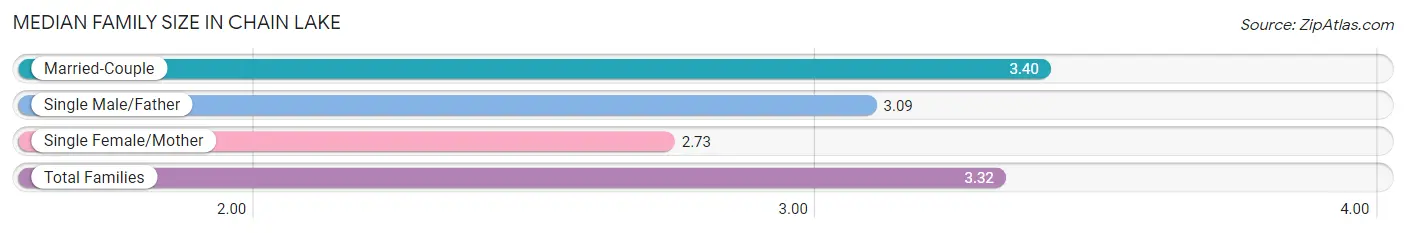
Median Family Size in Chain Lake
The median family size in Chain Lake is 3.32 persons per family, with married-couple families (1,162 | 84.0%) accounting for the largest median family size of 3.4 persons per family. On the other hand, single female/mother families (95 | 6.9%) represent the smallest median family size with 2.73 persons per family.
| Family Type | # Families | Family Size |
| Married-Couple | 1,162 (84.0%) | 3.40 |
| Single Male/Father | 126 (9.1%) | 3.09 |
| Single Female/Mother | 95 (6.9%) | 2.73 |
| Total Families | 1,383 (100.0%) | 3.32 |
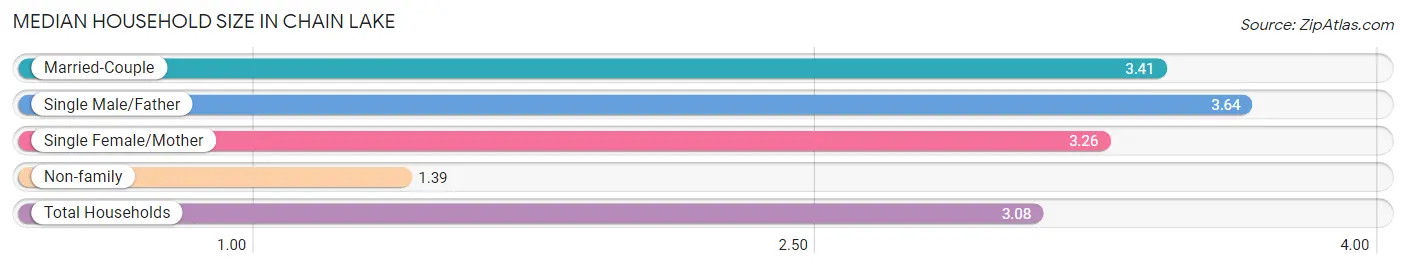
Median Household Size in Chain Lake
The median household size in Chain Lake is 3.08 persons per household, with single male/father households (126 | 7.6%) accounting for the largest median household size of 3.64 persons per household. non-family households (282 | 16.9%) represent the smallest median household size with 1.39 persons per household.
| Household Type | # Households | Household Size |
| Married-Couple | 1,162 (69.8%) | 3.41 |
| Single Male/Father | 126 (7.6%) | 3.64 |
| Single Female/Mother | 95 (5.7%) | 3.26 |
| Non-family | 282 (16.9%) | 1.39 |
| Total Households | 1,665 (100.0%) | 3.08 |
Household Size by Marriage Status in Chain Lake
Out of a total of 1,665 households in Chain Lake, 1,383 (83.1%) are family households, while 282 (16.9%) are nonfamily households. The most numerous type of family households are 2-person households, comprising 548, and the most common type of nonfamily households are 1-person households, comprising 210.
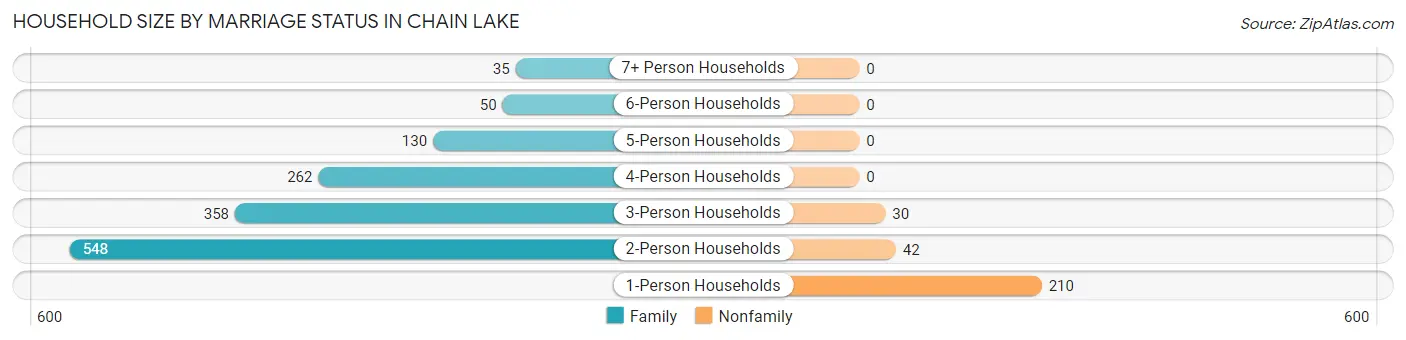
| Household Size | Family Households | Nonfamily Households |
| 1-Person Households | - | 210 (12.6%) |
| 2-Person Households | 548 (32.9%) | 42 (2.5%) |
| 3-Person Households | 358 (21.5%) | 30 (1.8%) |
| 4-Person Households | 262 (15.7%) | 0 (0.0%) |
| 5-Person Households | 130 (7.8%) | 0 (0.0%) |
| 6-Person Households | 50 (3.0%) | 0 (0.0%) |
| 7+ Person Households | 35 (2.1%) | 0 (0.0%) |
| Total | 1,383 (83.1%) | 282 (16.9%) |
Female Fertility in Chain Lake
Fertility by Age in Chain Lake
Average fertility rate in Chain Lake is 75.0 births per 1,000 women. Women in the age bracket of 20 to 34 years have the highest fertility rate with 83.0 births per 1,000 women. Women in the age bracket of 35 to 50 years acount for 61.9% of all women with births.
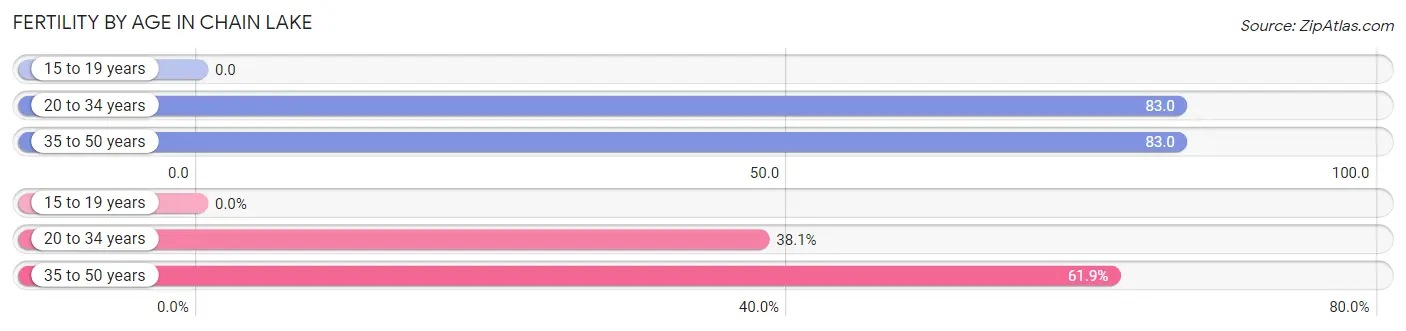
| Age Bracket | Women with Births | Births / 1,000 Women |
| 15 to 19 years | 0 (0.0%) | 0.0 |
| 20 to 34 years | 32 (38.1%) | 83.0 |
| 35 to 50 years | 52 (61.9%) | 83.0 |
| Total | 84 (100.0%) | 75.0 |
Fertility by Age by Marriage Status in Chain Lake
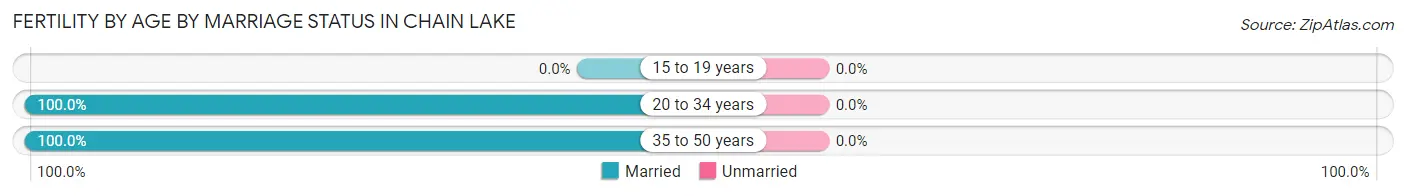
| Age Bracket | Married | Unmarried |
| 15 to 19 years | 0 (0.0%) | 0 (0.0%) |
| 20 to 34 years | 32 (100.0%) | 0 (0.0%) |
| 35 to 50 years | 52 (100.0%) | 0 (0.0%) |
| Total | 84 (100.0%) | 0 (0.0%) |
Fertility by Education in Chain Lake
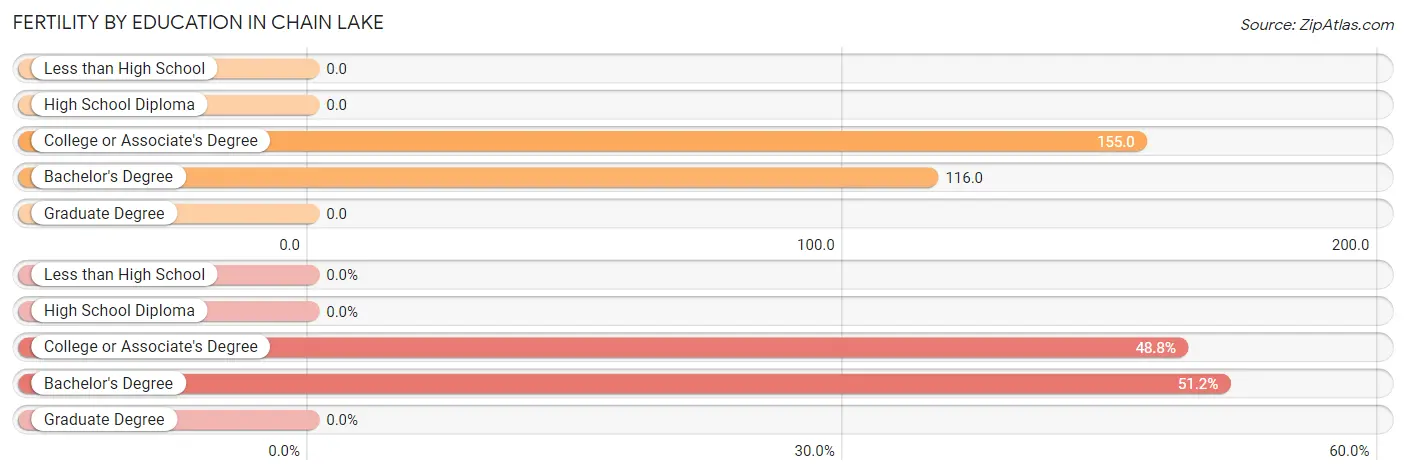
| Educational Attainment | Women with Births | Births / 1,000 Women |
| Less than High School | 0 (0.0%) | 0.0 |
| High School Diploma | 0 (0.0%) | 0.0 |
| College or Associate's Degree | 41 (48.8%) | 155.0 |
| Bachelor's Degree | 43 (51.2%) | 116.0 |
| Graduate Degree | 0 (0.0%) | 0.0 |
| Total | 84 (100.0%) | 75.0 |
Fertility by Education by Marriage Status in Chain Lake
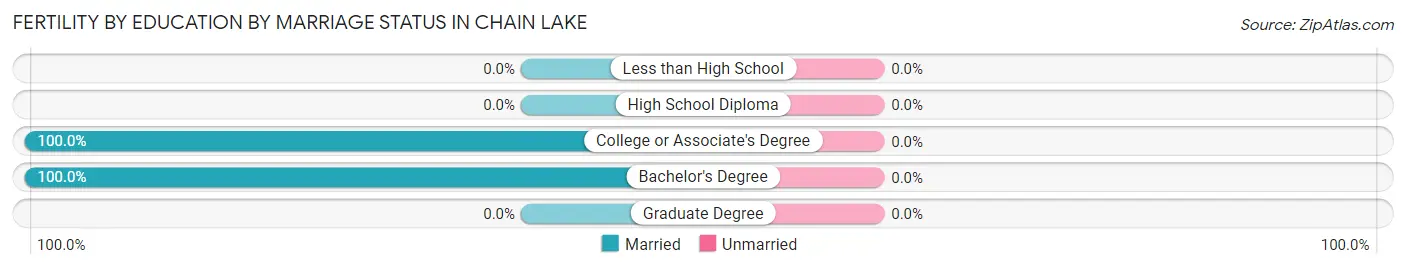
| Educational Attainment | Married | Unmarried |
| Less than High School | 0 (0.0%) | 0 (0.0%) |
| High School Diploma | 0 (0.0%) | 0 (0.0%) |
| College or Associate's Degree | 41 (100.0%) | 0 (0.0%) |
| Bachelor's Degree | 43 (100.0%) | 0 (0.0%) |
| Graduate Degree | 0 (0.0%) | 0 (0.0%) |
| Total | 84 (100.0%) | 0 (0.0%) |
Employment Characteristics in Chain Lake
Employment by Class of Employer in Chain Lake
Among the 2,589 employed individuals in Chain Lake, private company employees (1,729 | 66.8%), local government employees (258 | 10.0%), and self-employed (not incorporated) (200 | 7.7%) make up the most common classes of employment.
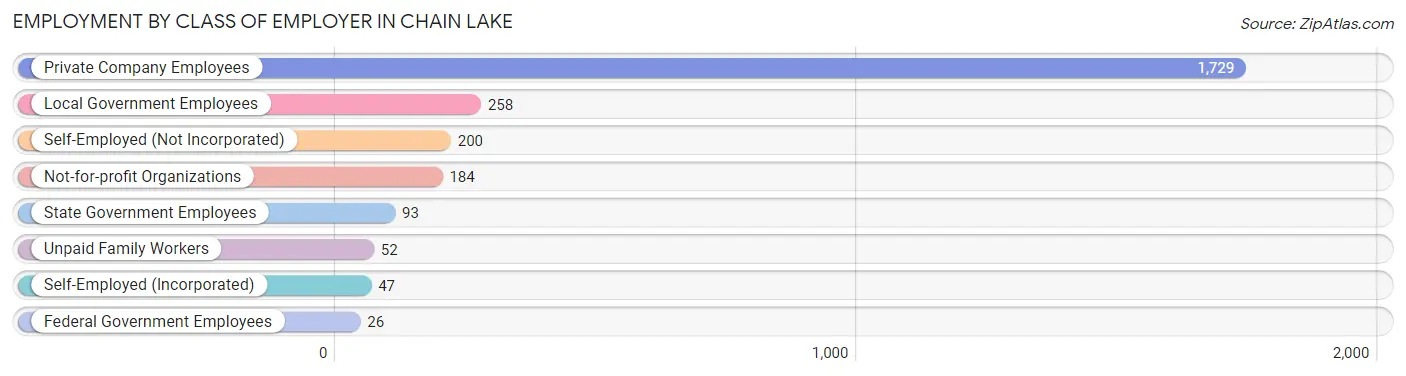
| Employer Class | # Employees | % Employees |
| Private Company Employees | 1,729 | 66.8% |
| Self-Employed (Incorporated) | 47 | 1.8% |
| Self-Employed (Not Incorporated) | 200 | 7.7% |
| Not-for-profit Organizations | 184 | 7.1% |
| Local Government Employees | 258 | 10.0% |
| State Government Employees | 93 | 3.6% |
| Federal Government Employees | 26 | 1.0% |
| Unpaid Family Workers | 52 | 2.0% |
| Total | 2,589 | 100.0% |
Employment Status by Age in Chain Lake
According to the labor force statistics for Chain Lake, out of the total population over 16 years of age (4,045), 68.6% or 2,775 individuals are in the labor force, with 5.0% or 139 of them unemployed. The age group with the highest labor force participation rate is 30 to 34 years, with 100.0% or 147 individuals in the labor force. Within the labor force, the 20 to 24 years age range has the highest percentage of unemployed individuals, with 59.3% or 112 of them being unemployed.
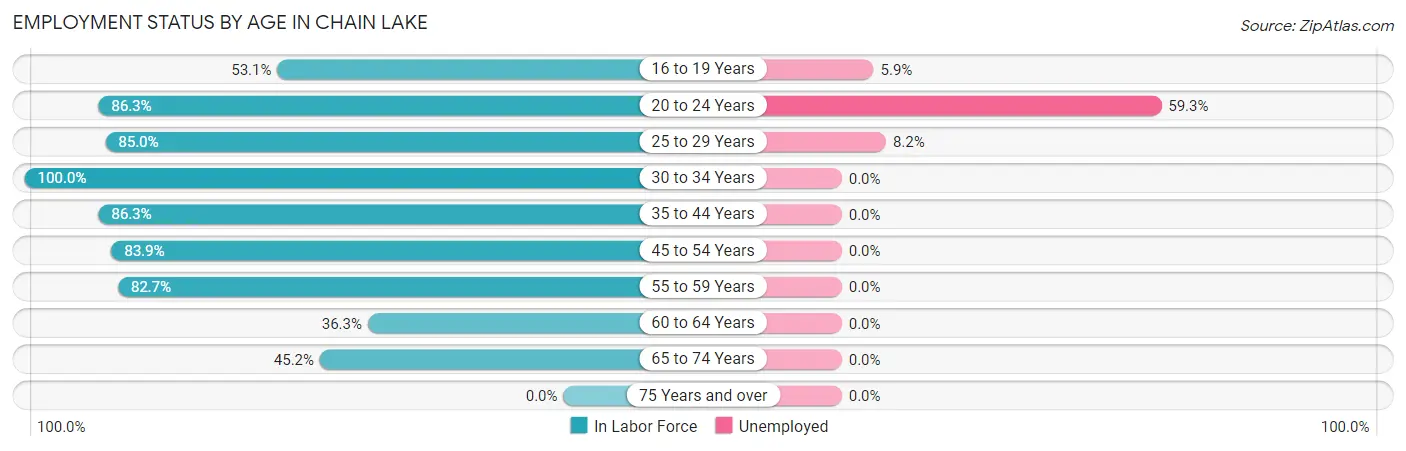
| Age Bracket | In Labor Force | Unemployed |
| 16 to 19 Years | 68 (53.1%) | 4 (5.9%) |
| 20 to 24 Years | 189 (86.3%) | 112 (59.3%) |
| 25 to 29 Years | 256 (85.0%) | 21 (8.2%) |
| 30 to 34 Years | 147 (100.0%) | 0 (0.0%) |
| 35 to 44 Years | 643 (86.3%) | 0 (0.0%) |
| 45 to 54 Years | 739 (83.9%) | 0 (0.0%) |
| 55 to 59 Years | 296 (82.7%) | 0 (0.0%) |
| 60 to 64 Years | 161 (36.3%) | 0 (0.0%) |
| 65 to 74 Years | 276 (45.2%) | 0 (0.0%) |
| 75 Years and over | 0 (0.0%) | 0 (0.0%) |
| Total | 2,775 (68.6%) | 139 (5.0%) |
Employment Status by Educational Attainment in Chain Lake
According to labor force statistics for Chain Lake, 78.0% of individuals (2,242) out of the total population between 25 and 64 years of age (2,875) are in the labor force, with 0.9% or 20 of them being unemployed. The group with the highest labor force participation rate are those with the educational attainment of bachelor's degree or higher, with 88.7% or 1,018 individuals in the labor force. Within the labor force, individuals with less than high school education have the highest percentage of unemployment, with 17.2% or 21 of them being unemployed.
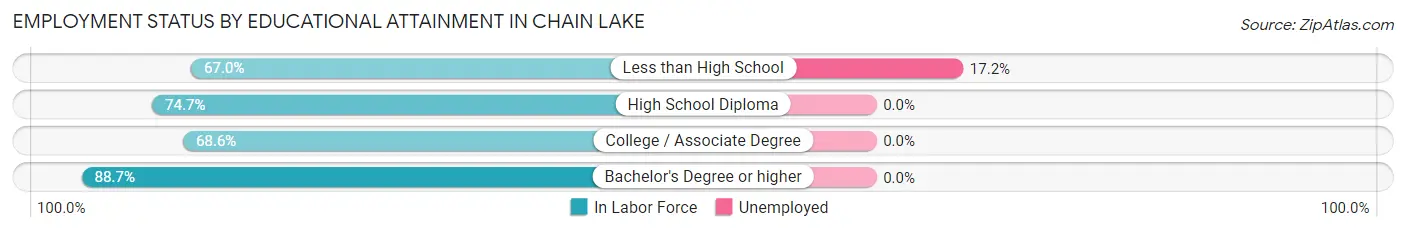
| Educational Attainment | In Labor Force | Unemployed |
| Less than High School | 122 (67.0%) | 31 (17.2%) |
| High School Diploma | 513 (74.7%) | 0 (0.0%) |
| College / Associate Degree | 589 (68.6%) | 0 (0.0%) |
| Bachelor's Degree or higher | 1,018 (88.7%) | 0 (0.0%) |
| Total | 2,242 (78.0%) | 26 (0.9%) |
Employment Occupations by Sex in Chain Lake
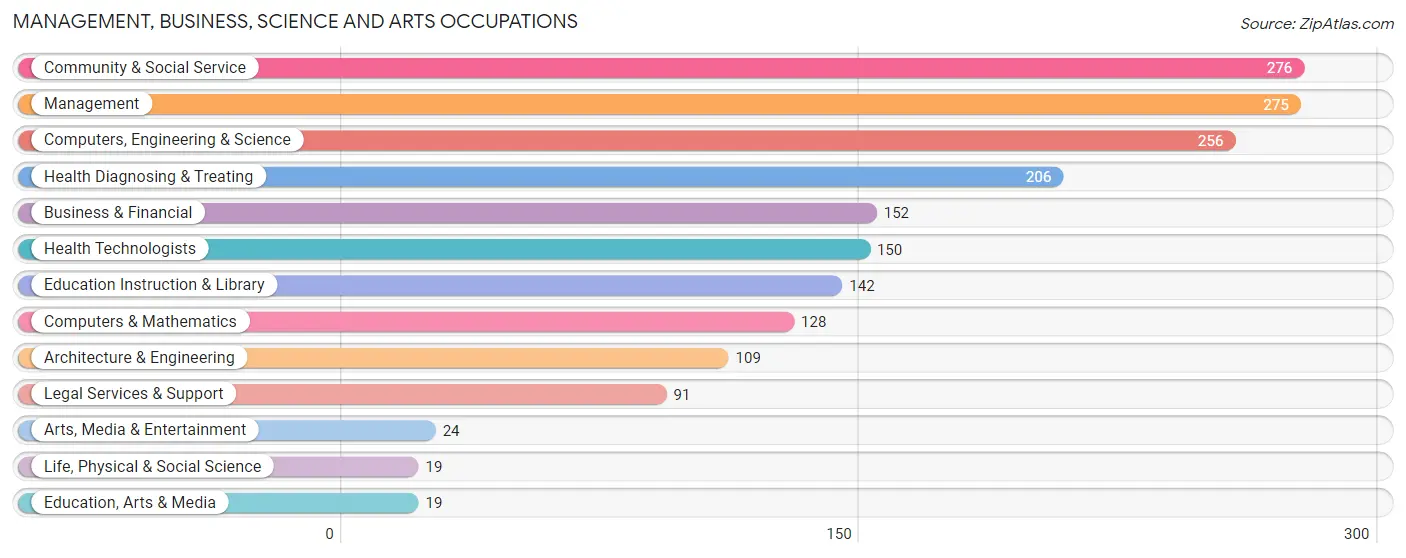
Management, Business, Science and Arts Occupations
The most common Management, Business, Science and Arts occupations in Chain Lake are Community & Social Service (276 | 10.5%), Management (275 | 10.5%), Computers, Engineering & Science (256 | 9.7%), Health Diagnosing & Treating (206 | 7.8%), and Business & Financial (152 | 5.8%).
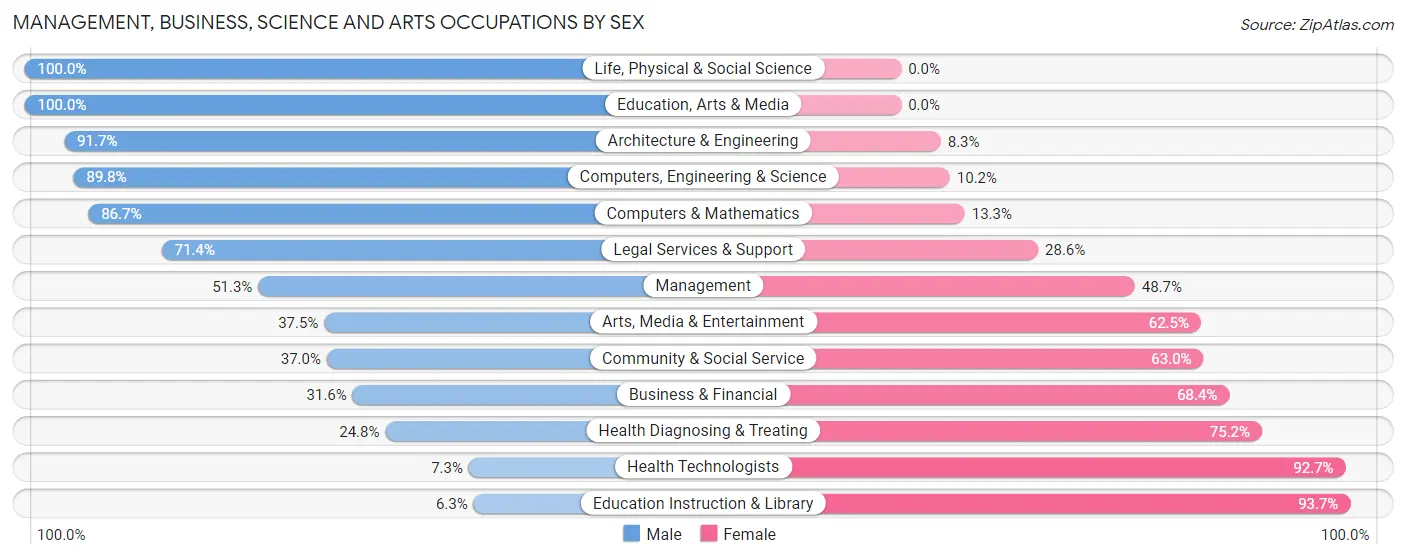
Management, Business, Science and Arts Occupations by Sex
Within the Management, Business, Science and Arts occupations in Chain Lake, the most male-oriented occupations are Life, Physical & Social Science (100.0%), Education, Arts & Media (100.0%), and Architecture & Engineering (91.7%), while the most female-oriented occupations are Education Instruction & Library (93.7%), Health Technologists (92.7%), and Health Diagnosing & Treating (75.2%).
| Occupation | Male | Female |
| Management | 141 (51.3%) | 134 (48.7%) |
| Business & Financial | 48 (31.6%) | 104 (68.4%) |
| Computers, Engineering & Science | 230 (89.8%) | 26 (10.2%) |
| Computers & Mathematics | 111 (86.7%) | 17 (13.3%) |
| Architecture & Engineering | 100 (91.7%) | 9 (8.3%) |
| Life, Physical & Social Science | 19 (100.0%) | 0 (0.0%) |
| Community & Social Service | 102 (37.0%) | 174 (63.0%) |
| Education, Arts & Media | 19 (100.0%) | 0 (0.0%) |
| Legal Services & Support | 65 (71.4%) | 26 (28.6%) |
| Education Instruction & Library | 9 (6.3%) | 133 (93.7%) |
| Arts, Media & Entertainment | 9 (37.5%) | 15 (62.5%) |
| Health Diagnosing & Treating | 51 (24.8%) | 155 (75.2%) |
| Health Technologists | 11 (7.3%) | 139 (92.7%) |
| Total (Category) | 572 (49.1%) | 593 (50.9%) |
| Total (Overall) | 1,501 (57.1%) | 1,127 (42.9%) |
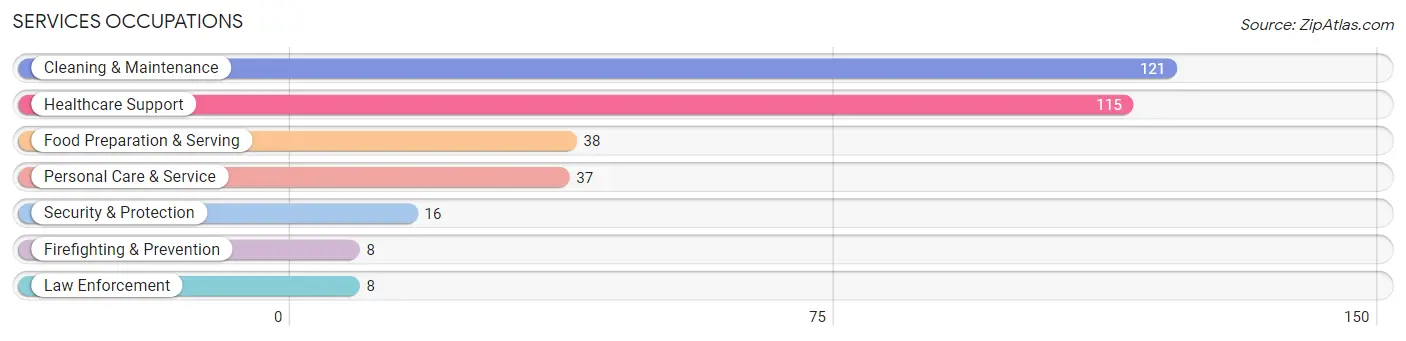
Services Occupations
The most common Services occupations in Chain Lake are Cleaning & Maintenance (121 | 4.6%), Healthcare Support (115 | 4.4%), Food Preparation & Serving (38 | 1.5%), Personal Care & Service (37 | 1.4%), and Security & Protection (16 | 0.6%).
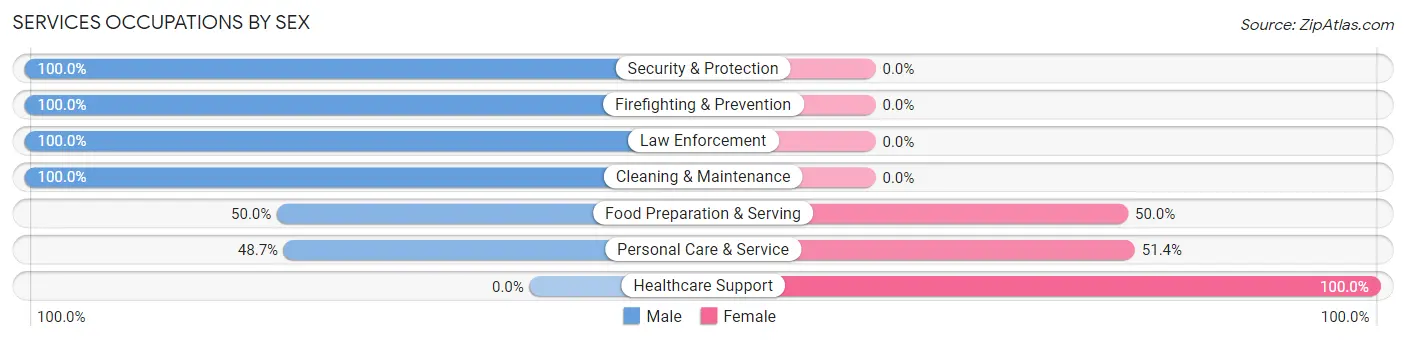
Services Occupations by Sex
Within the Services occupations in Chain Lake, the most male-oriented occupations are Security & Protection (100.0%), Firefighting & Prevention (100.0%), and Law Enforcement (100.0%), while the most female-oriented occupations are Healthcare Support (100.0%), Personal Care & Service (51.3%), and Food Preparation & Serving (50.0%).
| Occupation | Male | Female |
| Healthcare Support | 0 (0.0%) | 115 (100.0%) |
| Security & Protection | 16 (100.0%) | 0 (0.0%) |
| Firefighting & Prevention | 8 (100.0%) | 0 (0.0%) |
| Law Enforcement | 8 (100.0%) | 0 (0.0%) |
| Food Preparation & Serving | 19 (50.0%) | 19 (50.0%) |
| Cleaning & Maintenance | 121 (100.0%) | 0 (0.0%) |
| Personal Care & Service | 18 (48.6%) | 19 (51.3%) |
| Total (Category) | 174 (53.2%) | 153 (46.8%) |
| Total (Overall) | 1,501 (57.1%) | 1,127 (42.9%) |
Sales and Office Occupations
The most common Sales and Office occupations in Chain Lake are Sales & Related (241 | 9.2%), and Office & Administration (219 | 8.3%).
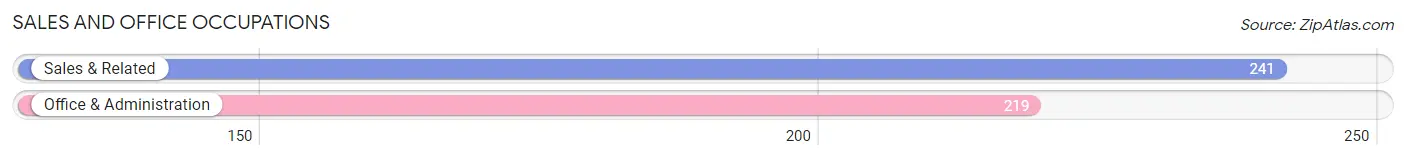
Sales and Office Occupations by Sex
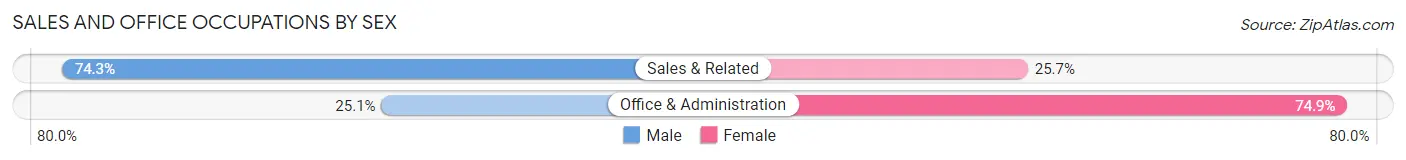
| Occupation | Male | Female |
| Sales & Related | 179 (74.3%) | 62 (25.7%) |
| Office & Administration | 55 (25.1%) | 164 (74.9%) |
| Total (Category) | 234 (50.9%) | 226 (49.1%) |
| Total (Overall) | 1,501 (57.1%) | 1,127 (42.9%) |
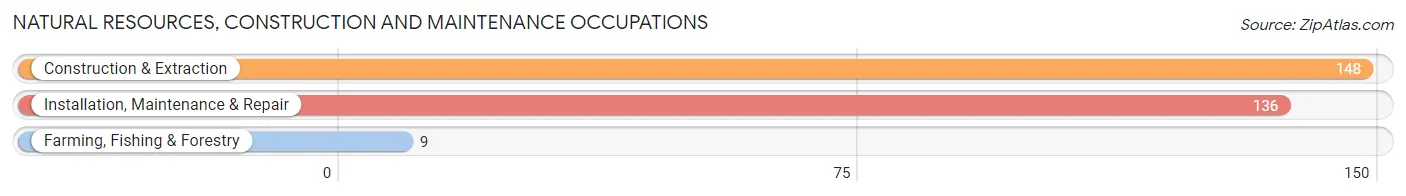
Natural Resources, Construction and Maintenance Occupations
The most common Natural Resources, Construction and Maintenance occupations in Chain Lake are Construction & Extraction (148 | 5.6%), Installation, Maintenance & Repair (136 | 5.2%), and Farming, Fishing & Forestry (9 | 0.3%).
Natural Resources, Construction and Maintenance Occupations by Sex
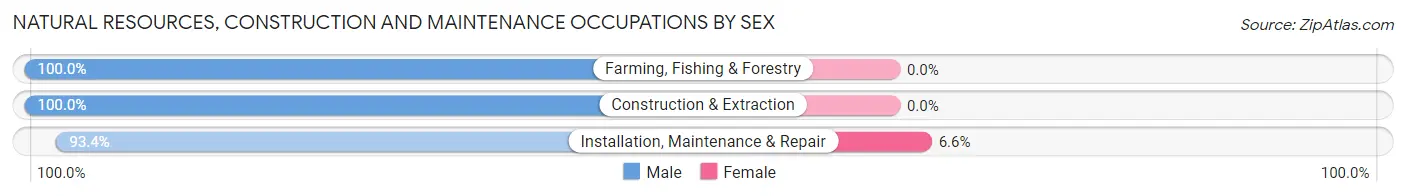
| Occupation | Male | Female |
| Farming, Fishing & Forestry | 9 (100.0%) | 0 (0.0%) |
| Construction & Extraction | 148 (100.0%) | 0 (0.0%) |
| Installation, Maintenance & Repair | 127 (93.4%) | 9 (6.6%) |
| Total (Category) | 284 (96.9%) | 9 (3.1%) |
| Total (Overall) | 1,501 (57.1%) | 1,127 (42.9%) |
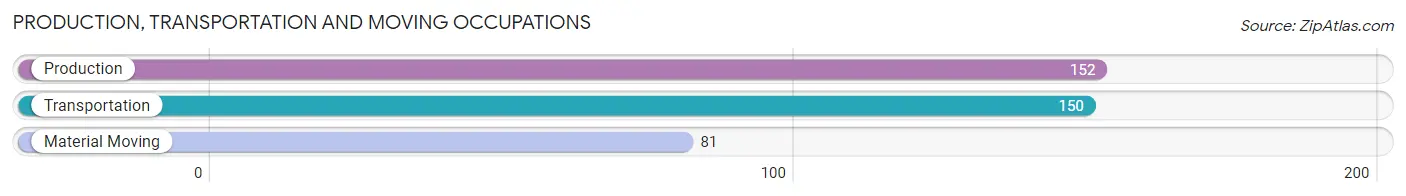
Production, Transportation and Moving Occupations
The most common Production, Transportation and Moving occupations in Chain Lake are Production (152 | 5.8%), Transportation (150 | 5.7%), and Material Moving (81 | 3.1%).
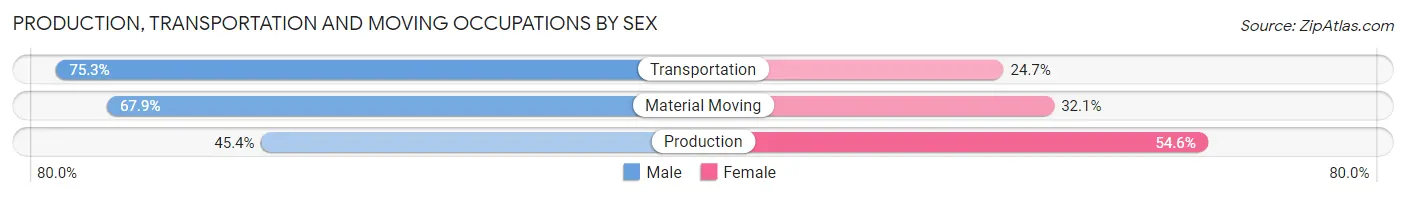
Production, Transportation and Moving Occupations by Sex
| Occupation | Male | Female |
| Production | 69 (45.4%) | 83 (54.6%) |
| Transportation | 113 (75.3%) | 37 (24.7%) |
| Material Moving | 55 (67.9%) | 26 (32.1%) |
| Total (Category) | 237 (61.9%) | 146 (38.1%) |
| Total (Overall) | 1,501 (57.1%) | 1,127 (42.9%) |
Employment Industries by Sex in Chain Lake
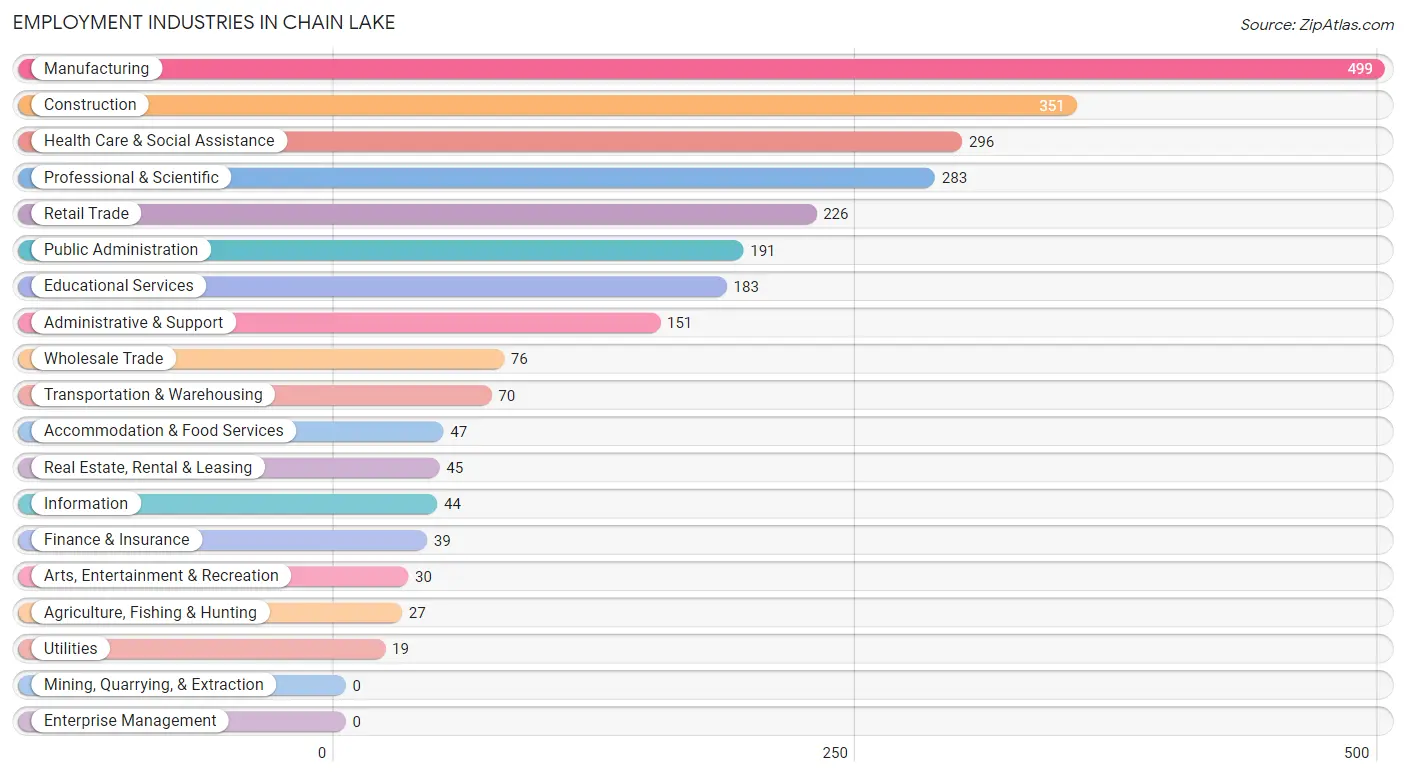
Employment Industries in Chain Lake
The major employment industries in Chain Lake include Manufacturing (499 | 19.0%), Construction (351 | 13.4%), Health Care & Social Assistance (296 | 11.3%), Professional & Scientific (283 | 10.8%), and Retail Trade (226 | 8.6%).
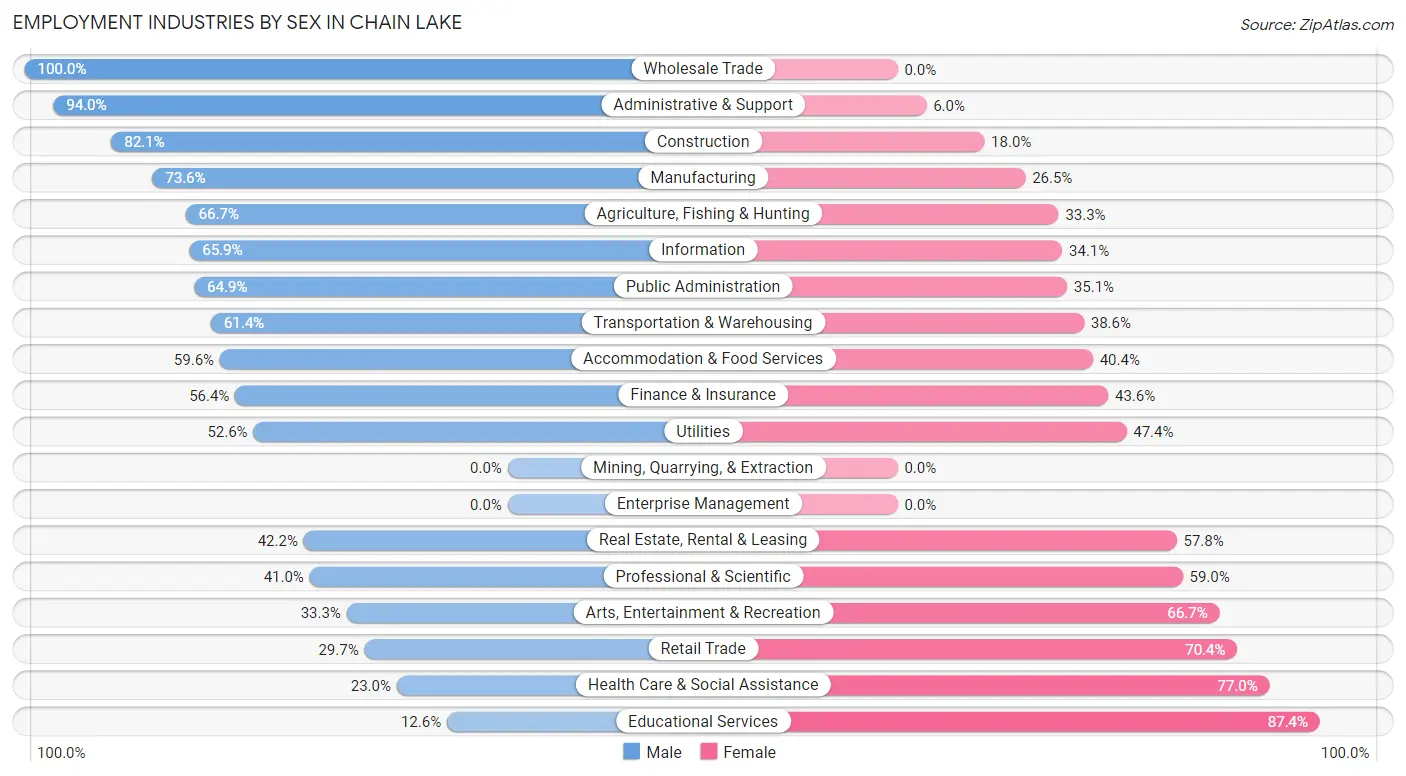
Employment Industries by Sex in Chain Lake
The Chain Lake industries that see more men than women are Wholesale Trade (100.0%), Administrative & Support (94.0%), and Construction (82.1%), whereas the industries that tend to have a higher number of women are Educational Services (87.4%), Health Care & Social Assistance (77.0%), and Retail Trade (70.4%).
| Industry | Male | Female |
| Agriculture, Fishing & Hunting | 18 (66.7%) | 9 (33.3%) |
| Mining, Quarrying, & Extraction | 0 (0.0%) | 0 (0.0%) |
| Construction | 288 (82.1%) | 63 (17.9%) |
| Manufacturing | 367 (73.6%) | 132 (26.5%) |
| Wholesale Trade | 76 (100.0%) | 0 (0.0%) |
| Retail Trade | 67 (29.6%) | 159 (70.4%) |
| Transportation & Warehousing | 43 (61.4%) | 27 (38.6%) |
| Utilities | 10 (52.6%) | 9 (47.4%) |
| Information | 29 (65.9%) | 15 (34.1%) |
| Finance & Insurance | 22 (56.4%) | 17 (43.6%) |
| Real Estate, Rental & Leasing | 19 (42.2%) | 26 (57.8%) |
| Professional & Scientific | 116 (41.0%) | 167 (59.0%) |
| Enterprise Management | 0 (0.0%) | 0 (0.0%) |
| Administrative & Support | 142 (94.0%) | 9 (6.0%) |
| Educational Services | 23 (12.6%) | 160 (87.4%) |
| Health Care & Social Assistance | 68 (23.0%) | 228 (77.0%) |
| Arts, Entertainment & Recreation | 10 (33.3%) | 20 (66.7%) |
| Accommodation & Food Services | 28 (59.6%) | 19 (40.4%) |
| Public Administration | 124 (64.9%) | 67 (35.1%) |
| Total | 1,501 (57.1%) | 1,127 (42.9%) |
Education in Chain Lake
School Enrollment in Chain Lake
The most common levels of schooling among the 989 students in Chain Lake are elementary school (257 | 26.0%), middle school (200 | 20.2%), and high school (185 | 18.7%).
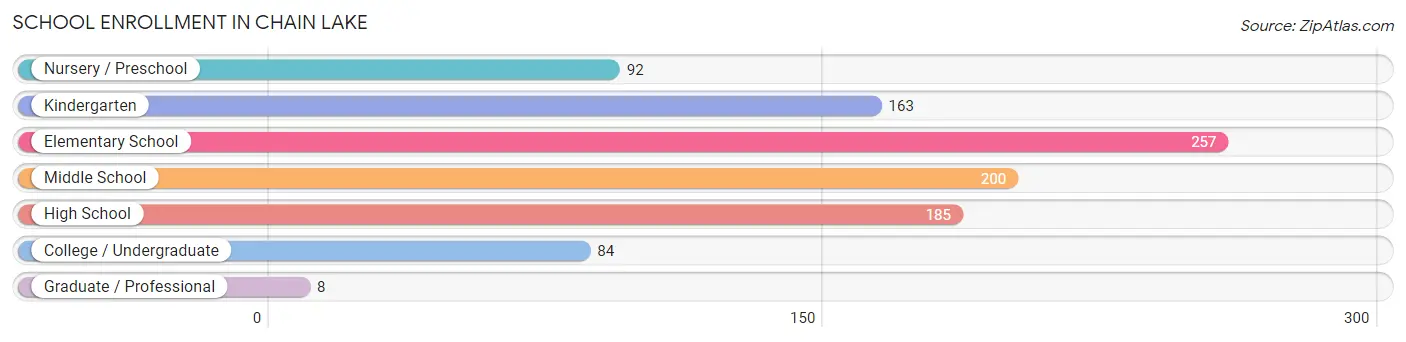
| School Level | # Students | % Students |
| Nursery / Preschool | 92 | 9.3% |
| Kindergarten | 163 | 16.5% |
| Elementary School | 257 | 26.0% |
| Middle School | 200 | 20.2% |
| High School | 185 | 18.7% |
| College / Undergraduate | 84 | 8.5% |
| Graduate / Professional | 8 | 0.8% |
| Total | 989 | 100.0% |
School Enrollment by Age by Funding Source in Chain Lake
Out of a total of 989 students who are enrolled in schools in Chain Lake, 145 (14.7%) attend a private institution, while the remaining 844 (85.3%) are enrolled in public schools. The age group of 3 to 4 year olds has the highest likelihood of being enrolled in private schools, with 46 (100.0% in the age bracket) enrolled. Conversely, the age group of 18 to 19 year olds has the lowest likelihood of being enrolled in a private school, with 47 (100.0% in the age bracket) attending a public institution.
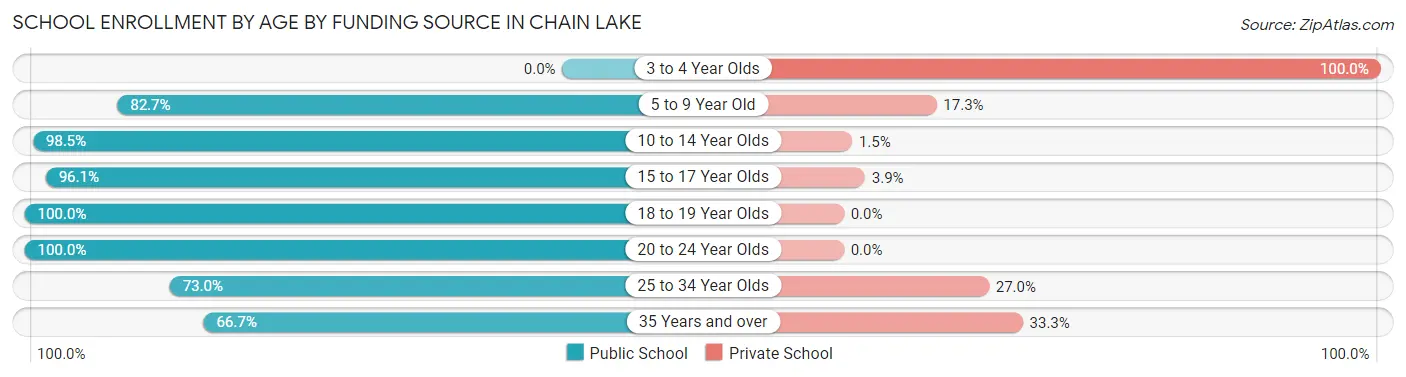
| Age Bracket | Public School | Private School |
| 3 to 4 Year Olds | 0 (0.0%) | 46 (100.0%) |
| 5 to 9 Year Old | 345 (82.7%) | 72 (17.3%) |
| 10 to 14 Year Olds | 256 (98.5%) | 4 (1.5%) |
| 15 to 17 Year Olds | 122 (96.1%) | 5 (3.9%) |
| 18 to 19 Year Olds | 47 (100.0%) | 0 (0.0%) |
| 20 to 24 Year Olds | 31 (100.0%) | 0 (0.0%) |
| 25 to 34 Year Olds | 27 (73.0%) | 10 (27.0%) |
| 35 Years and over | 16 (66.7%) | 8 (33.3%) |
| Total | 844 (85.3%) | 145 (14.7%) |
Educational Attainment by Field of Study in Chain Lake
Business (336 | 20.8%), engineering (190 | 11.8%), arts & humanities (178 | 11.0%), social sciences (144 | 8.9%), and education (134 | 8.3%) are the most common fields of study among 1,613 individuals in Chain Lake who have obtained a bachelor's degree or higher.
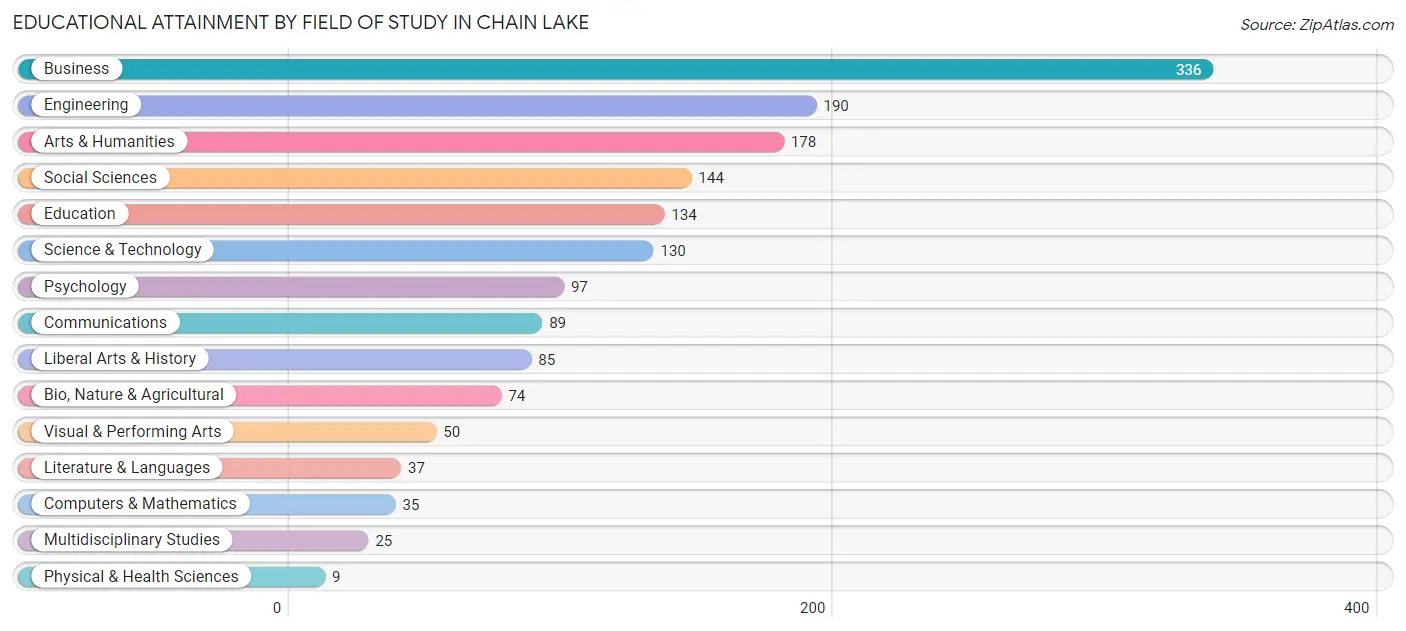
| Field of Study | # Graduates | % Graduates |
| Computers & Mathematics | 35 | 2.2% |
| Bio, Nature & Agricultural | 74 | 4.6% |
| Physical & Health Sciences | 9 | 0.6% |
| Psychology | 97 | 6.0% |
| Social Sciences | 144 | 8.9% |
| Engineering | 190 | 11.8% |
| Multidisciplinary Studies | 25 | 1.5% |
| Science & Technology | 130 | 8.1% |
| Business | 336 | 20.8% |
| Education | 134 | 8.3% |
| Literature & Languages | 37 | 2.3% |
| Liberal Arts & History | 85 | 5.3% |
| Visual & Performing Arts | 50 | 3.1% |
| Communications | 89 | 5.5% |
| Arts & Humanities | 178 | 11.0% |
| Total | 1,613 | 100.0% |
Transportation & Commute in Chain Lake
Vehicle Availability by Sex in Chain Lake
The most prevalent vehicle ownership categories in Chain Lake are males with 3 vehicles (571, accounting for 38.6%) and females with 3 vehicles (396, making up 51.4%).
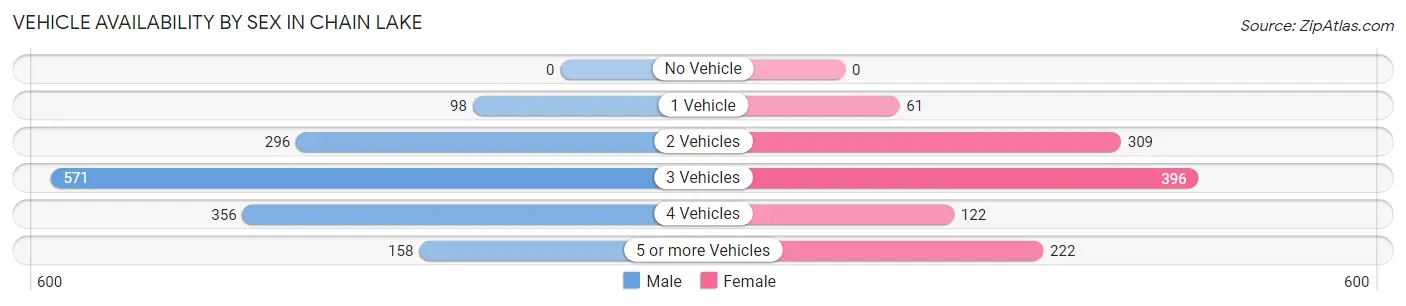
| Vehicles Available | Male | Female |
| No Vehicle | 0 (0.0%) | 0 (0.0%) |
| 1 Vehicle | 98 (6.6%) | 61 (5.5%) |
| 2 Vehicles | 296 (20.0%) | 309 (27.8%) |
| 3 Vehicles | 571 (38.6%) | 396 (35.7%) |
| 4 Vehicles | 356 (24.1%) | 122 (11.0%) |
| 5 or more Vehicles | 158 (10.7%) | 222 (20.0%) |
| Total | 1,479 (100.0%) | 1,110 (100.0%) |
Commute Time in Chain Lake
The most frequently occuring commute durations in Chain Lake are 45 to 59 minutes (404 commuters, 18.5%), 30 to 34 minutes (367 commuters, 16.8%), and 10 to 14 minutes (352 commuters, 16.1%).
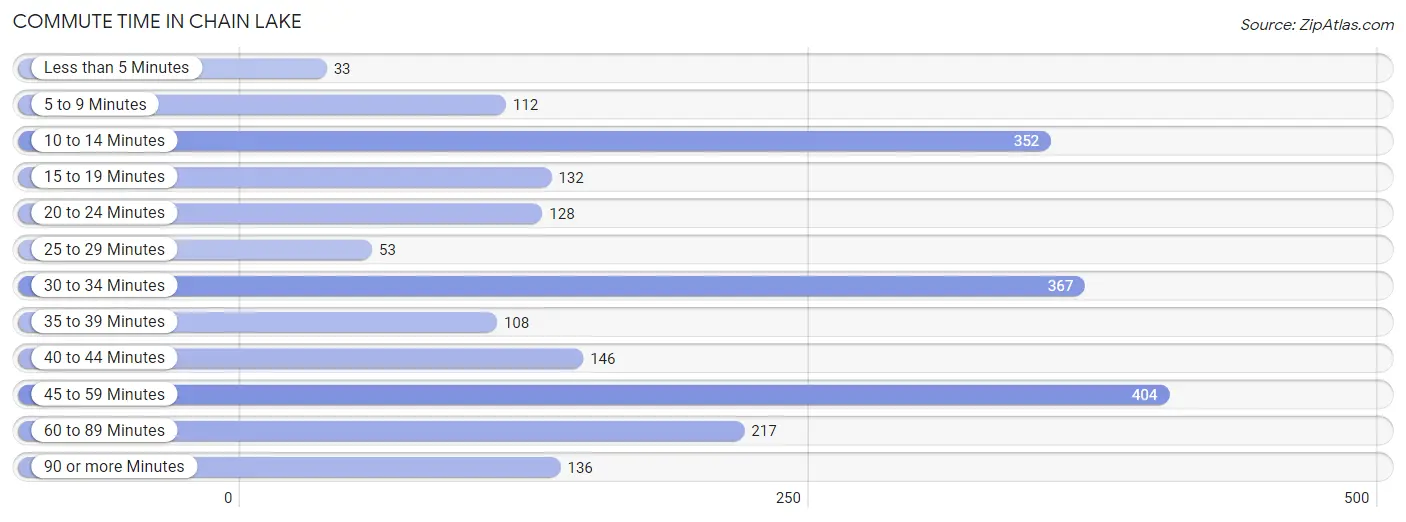
| Commute Time | # Commuters | % Commuters |
| Less than 5 Minutes | 33 | 1.5% |
| 5 to 9 Minutes | 112 | 5.1% |
| 10 to 14 Minutes | 352 | 16.1% |
| 15 to 19 Minutes | 132 | 6.0% |
| 20 to 24 Minutes | 128 | 5.9% |
| 25 to 29 Minutes | 53 | 2.4% |
| 30 to 34 Minutes | 367 | 16.8% |
| 35 to 39 Minutes | 108 | 4.9% |
| 40 to 44 Minutes | 146 | 6.7% |
| 45 to 59 Minutes | 404 | 18.5% |
| 60 to 89 Minutes | 217 | 9.9% |
| 90 or more Minutes | 136 | 6.2% |
Commute Time by Sex in Chain Lake
The most common commute times in Chain Lake are 45 to 59 minutes (310 commuters, 23.5%) for males and 10 to 14 minutes (183 commuters, 21.0%) for females.
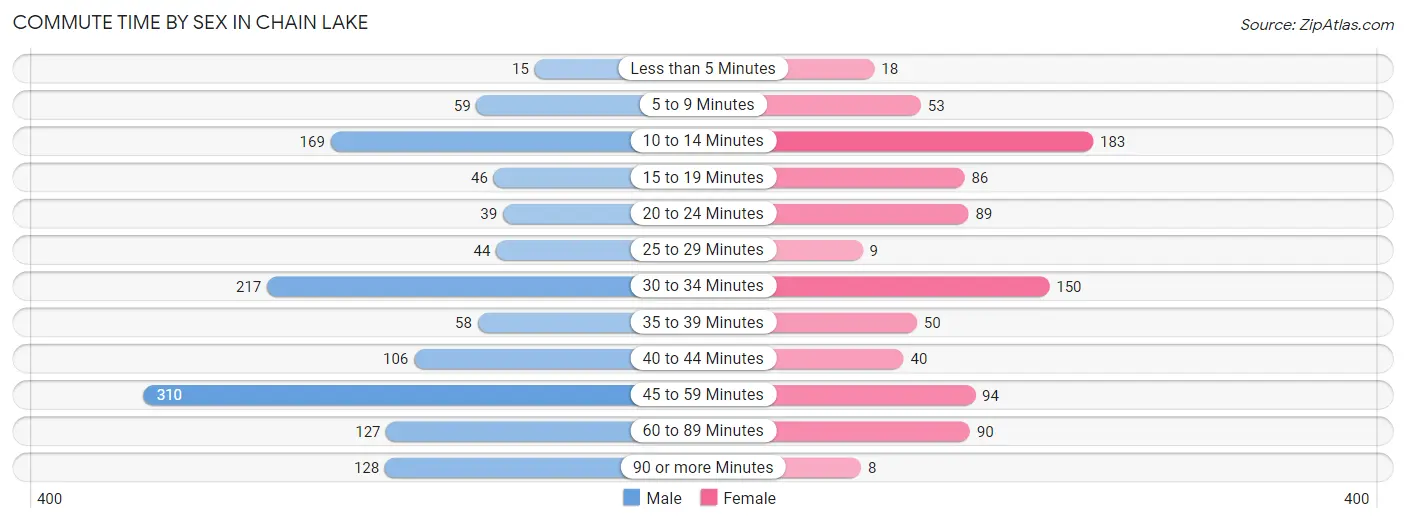
| Commute Time | Male | Female |
| Less than 5 Minutes | 15 (1.1%) | 18 (2.1%) |
| 5 to 9 Minutes | 59 (4.5%) | 53 (6.1%) |
| 10 to 14 Minutes | 169 (12.8%) | 183 (21.0%) |
| 15 to 19 Minutes | 46 (3.5%) | 86 (9.9%) |
| 20 to 24 Minutes | 39 (3.0%) | 89 (10.2%) |
| 25 to 29 Minutes | 44 (3.3%) | 9 (1.0%) |
| 30 to 34 Minutes | 217 (16.5%) | 150 (17.2%) |
| 35 to 39 Minutes | 58 (4.4%) | 50 (5.8%) |
| 40 to 44 Minutes | 106 (8.0%) | 40 (4.6%) |
| 45 to 59 Minutes | 310 (23.5%) | 94 (10.8%) |
| 60 to 89 Minutes | 127 (9.6%) | 90 (10.3%) |
| 90 or more Minutes | 128 (9.7%) | 8 (0.9%) |
Time of Departure to Work by Sex in Chain Lake
The most frequent times of departure to work in Chain Lake are 5:00 AM to 5:29 AM (218, 16.5%) for males and 6:00 AM to 6:29 AM (148, 17.0%) for females.
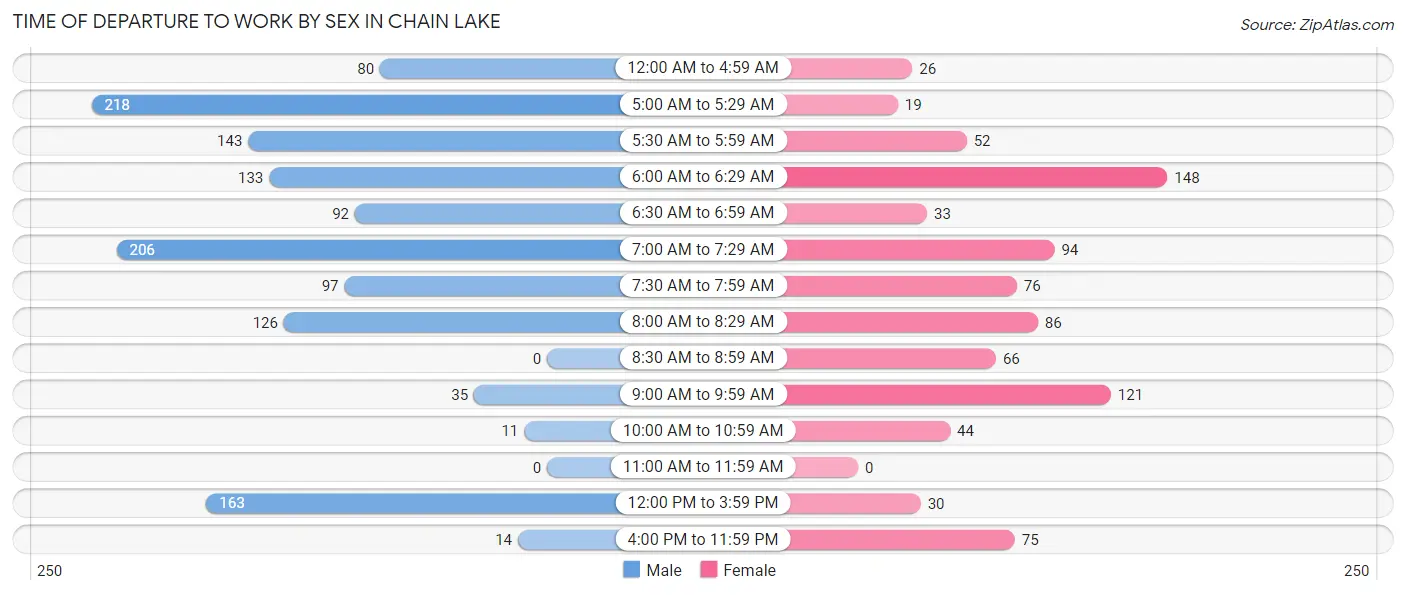
| Time of Departure | Male | Female |
| 12:00 AM to 4:59 AM | 80 (6.1%) | 26 (3.0%) |
| 5:00 AM to 5:29 AM | 218 (16.5%) | 19 (2.2%) |
| 5:30 AM to 5:59 AM | 143 (10.8%) | 52 (6.0%) |
| 6:00 AM to 6:29 AM | 133 (10.1%) | 148 (17.0%) |
| 6:30 AM to 6:59 AM | 92 (7.0%) | 33 (3.8%) |
| 7:00 AM to 7:29 AM | 206 (15.6%) | 94 (10.8%) |
| 7:30 AM to 7:59 AM | 97 (7.4%) | 76 (8.7%) |
| 8:00 AM to 8:29 AM | 126 (9.6%) | 86 (9.9%) |
| 8:30 AM to 8:59 AM | 0 (0.0%) | 66 (7.6%) |
| 9:00 AM to 9:59 AM | 35 (2.7%) | 121 (13.9%) |
| 10:00 AM to 10:59 AM | 11 (0.8%) | 44 (5.1%) |
| 11:00 AM to 11:59 AM | 0 (0.0%) | 0 (0.0%) |
| 12:00 PM to 3:59 PM | 163 (12.4%) | 30 (3.5%) |
| 4:00 PM to 11:59 PM | 14 (1.1%) | 75 (8.6%) |
| Total | 1,318 (100.0%) | 870 (100.0%) |
Housing Occupancy in Chain Lake
Occupancy by Ownership in Chain Lake
Of the total 1,665 dwellings in Chain Lake, owner-occupied units account for 1,547 (92.9%), while renter-occupied units make up 118 (7.1%).
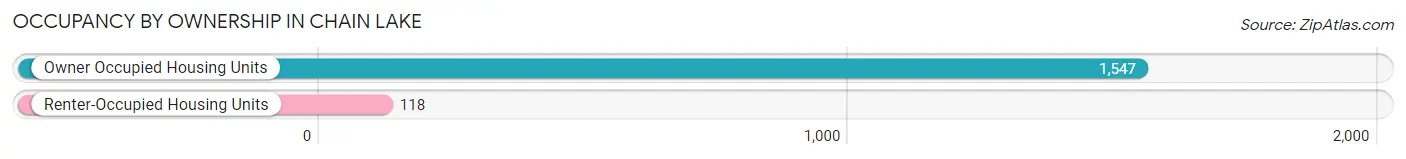
| Occupancy | # Housing Units | % Housing Units |
| Owner Occupied Housing Units | 1,547 | 92.9% |
| Renter-Occupied Housing Units | 118 | 7.1% |
| Total Occupied Housing Units | 1,665 | 100.0% |
Occupancy by Household Size in Chain Lake
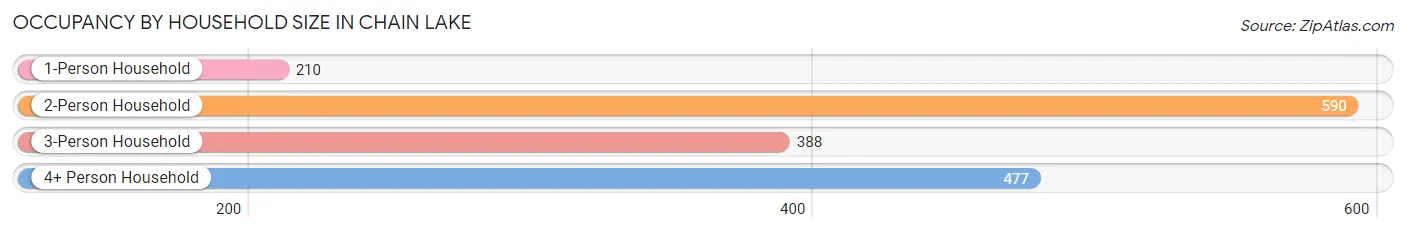
| Household Size | # Housing Units | % Housing Units |
| 1-Person Household | 210 | 12.6% |
| 2-Person Household | 590 | 35.4% |
| 3-Person Household | 388 | 23.3% |
| 4+ Person Household | 477 | 28.6% |
| Total Housing Units | 1,665 | 100.0% |
Occupancy by Ownership by Household Size in Chain Lake
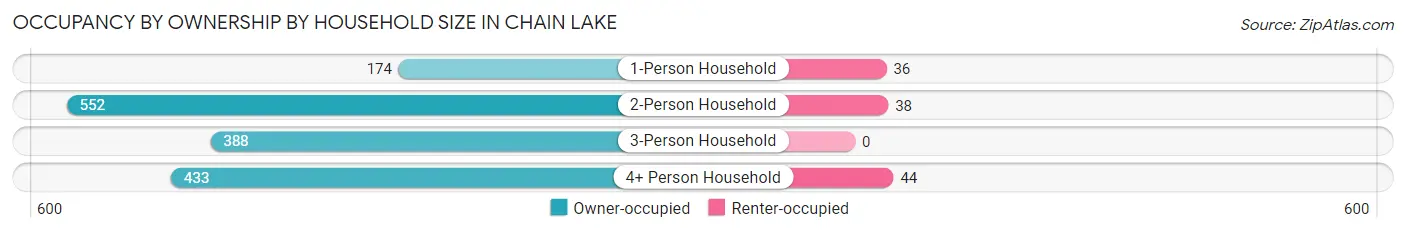
| Household Size | Owner-occupied | Renter-occupied |
| 1-Person Household | 174 (82.9%) | 36 (17.1%) |
| 2-Person Household | 552 (93.6%) | 38 (6.4%) |
| 3-Person Household | 388 (100.0%) | 0 (0.0%) |
| 4+ Person Household | 433 (90.8%) | 44 (9.2%) |
| Total Housing Units | 1,547 (92.9%) | 118 (7.1%) |
Occupancy by Educational Attainment in Chain Lake
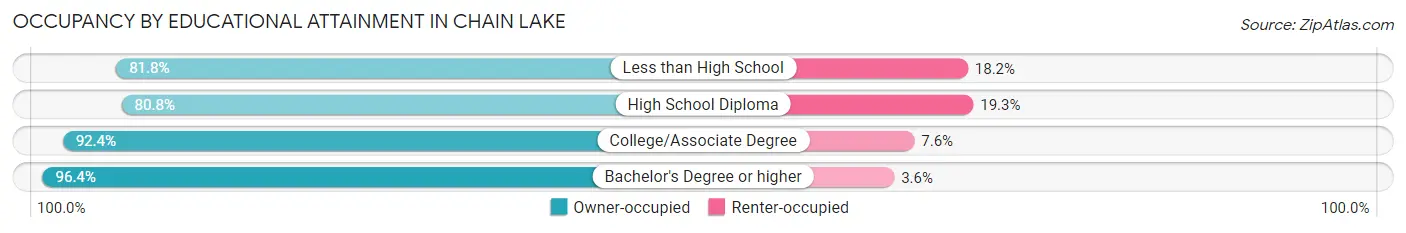
| Household Size | Owner-occupied | Renter-occupied |
| Less than High School | 36 (81.8%) | 8 (18.2%) |
| High School Diploma | 151 (80.7%) | 36 (19.3%) |
| College/Associate Degree | 525 (92.4%) | 43 (7.6%) |
| Bachelor's Degree or higher | 835 (96.4%) | 31 (3.6%) |
Occupancy by Age of Householder in Chain Lake
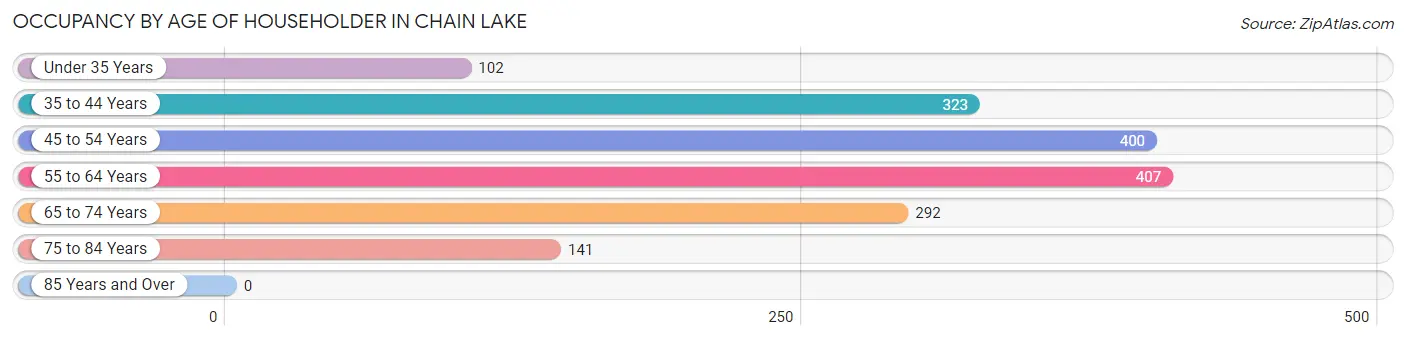
| Age Bracket | # Households | % Households |
| Under 35 Years | 102 | 6.1% |
| 35 to 44 Years | 323 | 19.4% |
| 45 to 54 Years | 400 | 24.0% |
| 55 to 64 Years | 407 | 24.4% |
| 65 to 74 Years | 292 | 17.5% |
| 75 to 84 Years | 141 | 8.5% |
| 85 Years and Over | 0 | 0.0% |
| Total | 1,665 | 100.0% |
Housing Finances in Chain Lake
Median Income by Occupancy in Chain Lake
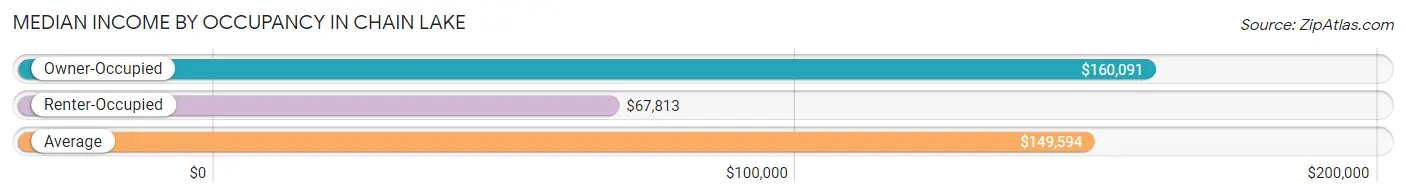
| Occupancy Type | # Households | Median Income |
| Owner-Occupied | 1,547 (92.9%) | $160,091 |
| Renter-Occupied | 118 (7.1%) | $67,813 |
| Average | 1,665 (100.0%) | $149,594 |
Occupancy by Householder Income Bracket in Chain Lake
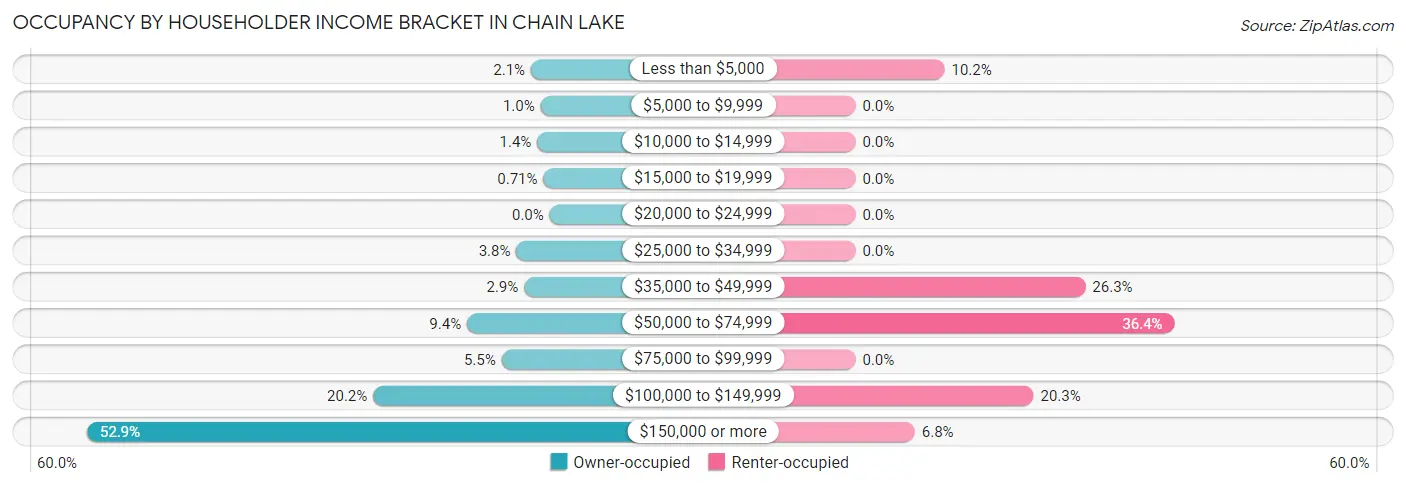
| Income Bracket | Owner-occupied | Renter-occupied |
| Less than $5,000 | 33 (2.1%) | 12 (10.2%) |
| $5,000 to $9,999 | 16 (1.0%) | 0 (0.0%) |
| $10,000 to $14,999 | 22 (1.4%) | 0 (0.0%) |
| $15,000 to $19,999 | 11 (0.7%) | 0 (0.0%) |
| $20,000 to $24,999 | 0 (0.0%) | 0 (0.0%) |
| $25,000 to $34,999 | 59 (3.8%) | 0 (0.0%) |
| $35,000 to $49,999 | 45 (2.9%) | 31 (26.3%) |
| $50,000 to $74,999 | 146 (9.4%) | 43 (36.4%) |
| $75,000 to $99,999 | 85 (5.5%) | 0 (0.0%) |
| $100,000 to $149,999 | 312 (20.2%) | 24 (20.3%) |
| $150,000 or more | 818 (52.9%) | 8 (6.8%) |
| Total | 1,547 (100.0%) | 118 (100.0%) |
Monthly Housing Cost Tiers in Chain Lake
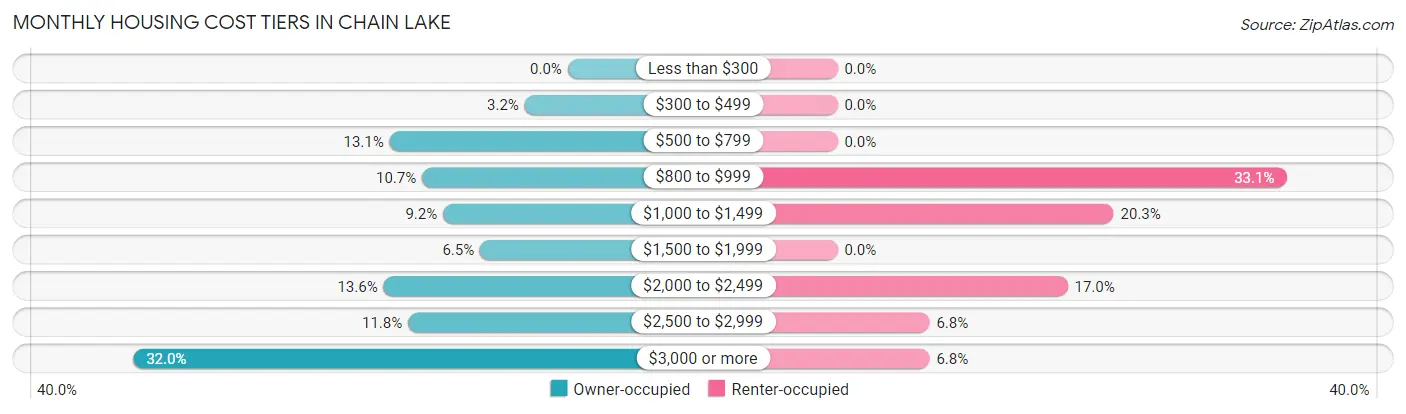
| Monthly Cost | Owner-occupied | Renter-occupied |
| Less than $300 | 0 (0.0%) | 0 (0.0%) |
| $300 to $499 | 49 (3.2%) | 0 (0.0%) |
| $500 to $799 | 203 (13.1%) | 0 (0.0%) |
| $800 to $999 | 166 (10.7%) | 39 (33.1%) |
| $1,000 to $1,499 | 142 (9.2%) | 24 (20.3%) |
| $1,500 to $1,999 | 100 (6.5%) | 0 (0.0%) |
| $2,000 to $2,499 | 210 (13.6%) | 20 (17.0%) |
| $2,500 to $2,999 | 182 (11.8%) | 8 (6.8%) |
| $3,000 or more | 495 (32.0%) | 8 (6.8%) |
| Total | 1,547 (100.0%) | 118 (100.0%) |
Physical Housing Characteristics in Chain Lake
Housing Structures in Chain Lake
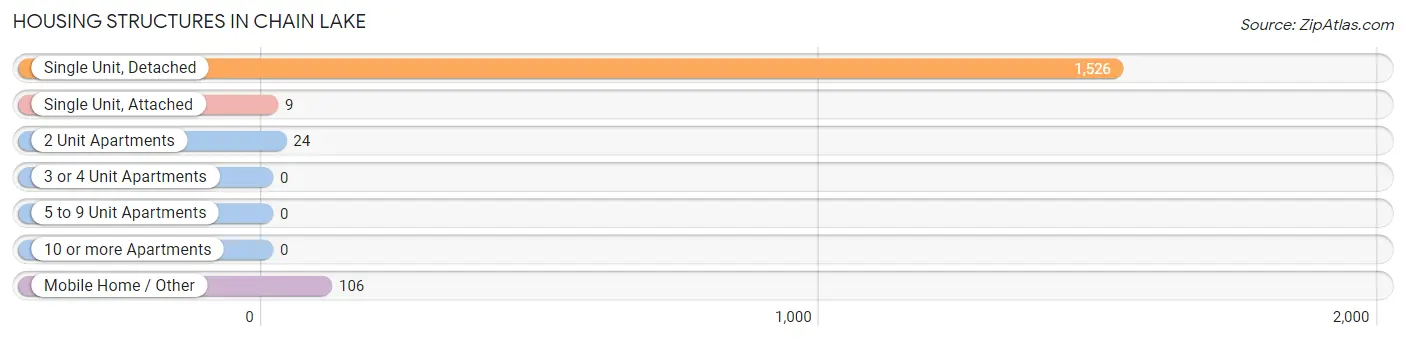
| Structure Type | # Housing Units | % Housing Units |
| Single Unit, Detached | 1,526 | 91.6% |
| Single Unit, Attached | 9 | 0.5% |
| 2 Unit Apartments | 24 | 1.4% |
| 3 or 4 Unit Apartments | 0 | 0.0% |
| 5 to 9 Unit Apartments | 0 | 0.0% |
| 10 or more Apartments | 0 | 0.0% |
| Mobile Home / Other | 106 | 6.4% |
| Total | 1,665 | 100.0% |
Housing Structures by Occupancy in Chain Lake
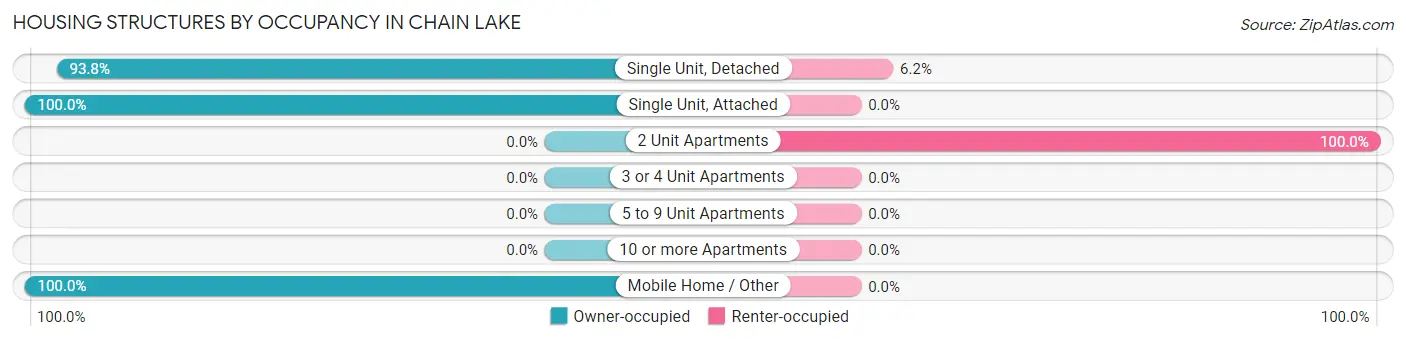
| Structure Type | Owner-occupied | Renter-occupied |
| Single Unit, Detached | 1,432 (93.8%) | 94 (6.2%) |
| Single Unit, Attached | 9 (100.0%) | 0 (0.0%) |
| 2 Unit Apartments | 0 (0.0%) | 24 (100.0%) |
| 3 or 4 Unit Apartments | 0 (0.0%) | 0 (0.0%) |
| 5 to 9 Unit Apartments | 0 (0.0%) | 0 (0.0%) |
| 10 or more Apartments | 0 (0.0%) | 0 (0.0%) |
| Mobile Home / Other | 106 (100.0%) | 0 (0.0%) |
| Total | 1,547 (92.9%) | 118 (7.1%) |
Housing Structures by Number of Rooms in Chain Lake
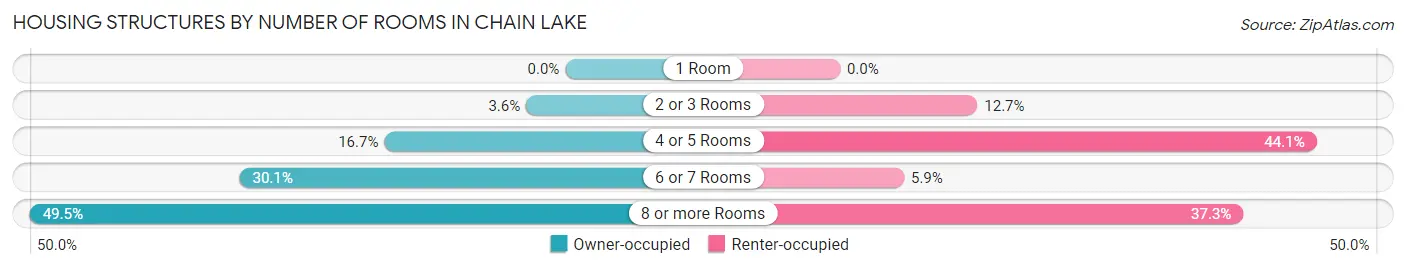
| Number of Rooms | Owner-occupied | Renter-occupied |
| 1 Room | 0 (0.0%) | 0 (0.0%) |
| 2 or 3 Rooms | 56 (3.6%) | 15 (12.7%) |
| 4 or 5 Rooms | 259 (16.7%) | 52 (44.1%) |
| 6 or 7 Rooms | 466 (30.1%) | 7 (5.9%) |
| 8 or more Rooms | 766 (49.5%) | 44 (37.3%) |
| Total | 1,547 (100.0%) | 118 (100.0%) |
Housing Structure by Heating Type in Chain Lake
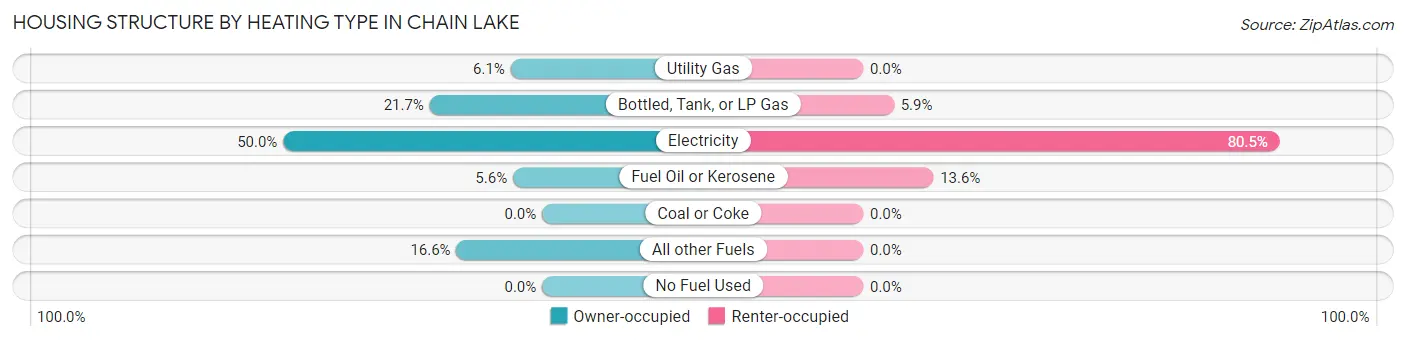
| Heating Type | Owner-occupied | Renter-occupied |
| Utility Gas | 94 (6.1%) | 0 (0.0%) |
| Bottled, Tank, or LP Gas | 336 (21.7%) | 7 (5.9%) |
| Electricity | 774 (50.0%) | 95 (80.5%) |
| Fuel Oil or Kerosene | 87 (5.6%) | 16 (13.6%) |
| Coal or Coke | 0 (0.0%) | 0 (0.0%) |
| All other Fuels | 256 (16.6%) | 0 (0.0%) |
| No Fuel Used | 0 (0.0%) | 0 (0.0%) |
| Total | 1,547 (100.0%) | 118 (100.0%) |
Household Vehicle Usage in Chain Lake
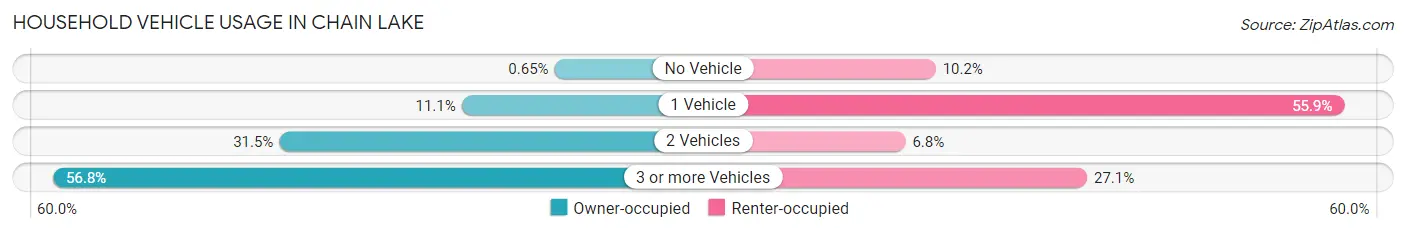
| Vehicles per Household | Owner-occupied | Renter-occupied |
| No Vehicle | 10 (0.6%) | 12 (10.2%) |
| 1 Vehicle | 171 (11.1%) | 66 (55.9%) |
| 2 Vehicles | 487 (31.5%) | 8 (6.8%) |
| 3 or more Vehicles | 879 (56.8%) | 32 (27.1%) |
| Total | 1,547 (100.0%) | 118 (100.0%) |
Real Estate & Mortgages in Chain Lake
Real Estate and Mortgage Overview in Chain Lake
| Characteristic | Without Mortgage | With Mortgage |
| Housing Units | 436 | 1,111 |
| Median Property Value | $515,600 | $812,900 |
| Median Household Income | $121,591 | $663 |
| Monthly Housing Costs | $808 | $495 |
| Real Estate Taxes | $4,946 | $0 |
Property Value by Mortgage Status in Chain Lake
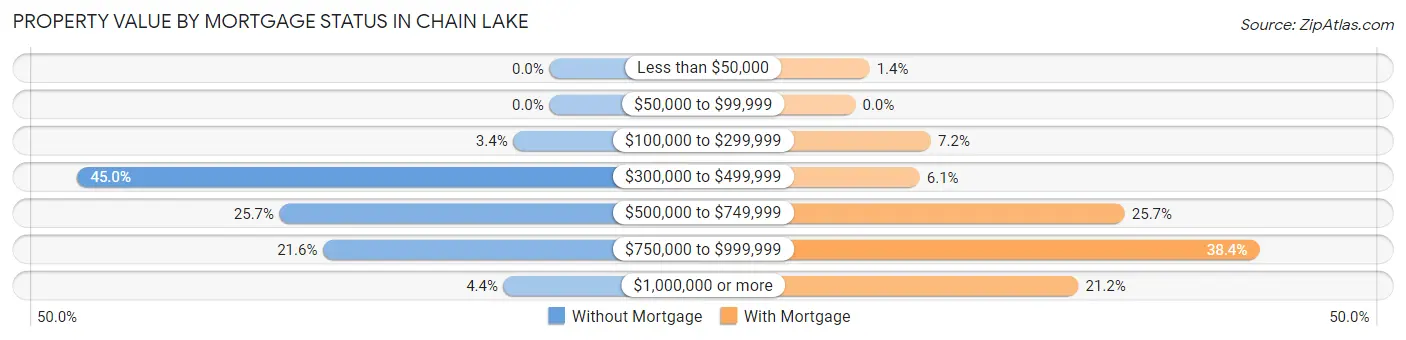
| Property Value | Without Mortgage | With Mortgage |
| Less than $50,000 | 0 (0.0%) | 15 (1.3%) |
| $50,000 to $99,999 | 0 (0.0%) | 0 (0.0%) |
| $100,000 to $299,999 | 15 (3.4%) | 80 (7.2%) |
| $300,000 to $499,999 | 196 (45.0%) | 68 (6.1%) |
| $500,000 to $749,999 | 112 (25.7%) | 285 (25.7%) |
| $750,000 to $999,999 | 94 (21.6%) | 427 (38.4%) |
| $1,000,000 or more | 19 (4.4%) | 236 (21.2%) |
| Total | 436 (100.0%) | 1,111 (100.0%) |
Household Income by Mortgage Status in Chain Lake
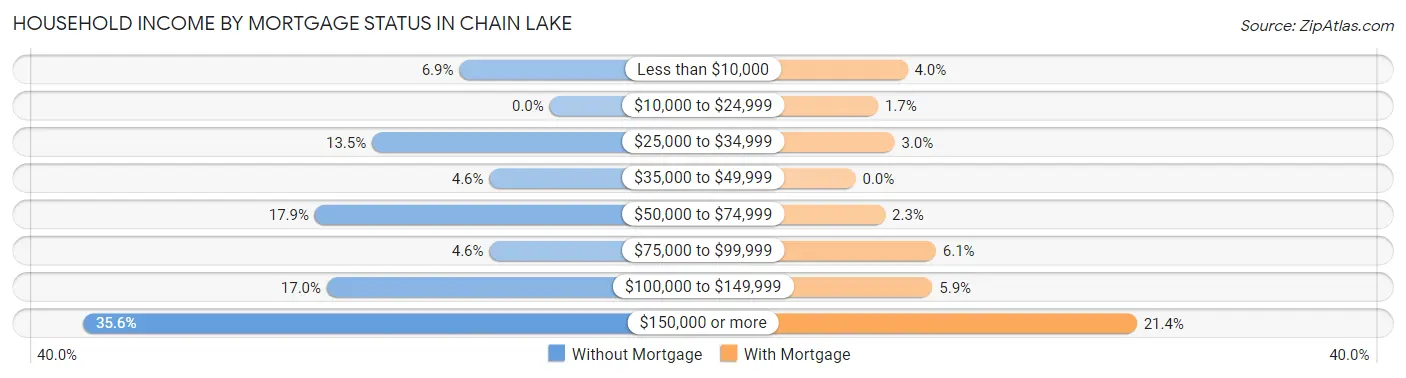
| Household Income | Without Mortgage | With Mortgage |
| Less than $10,000 | 30 (6.9%) | 44 (4.0%) |
| $10,000 to $24,999 | 0 (0.0%) | 19 (1.7%) |
| $25,000 to $34,999 | 59 (13.5%) | 33 (3.0%) |
| $35,000 to $49,999 | 20 (4.6%) | 0 (0.0%) |
| $50,000 to $74,999 | 78 (17.9%) | 25 (2.2%) |
| $75,000 to $99,999 | 20 (4.6%) | 68 (6.1%) |
| $100,000 to $149,999 | 74 (17.0%) | 65 (5.9%) |
| $150,000 or more | 155 (35.5%) | 238 (21.4%) |
| Total | 436 (100.0%) | 1,111 (100.0%) |
Property Value to Household Income Ratio in Chain Lake
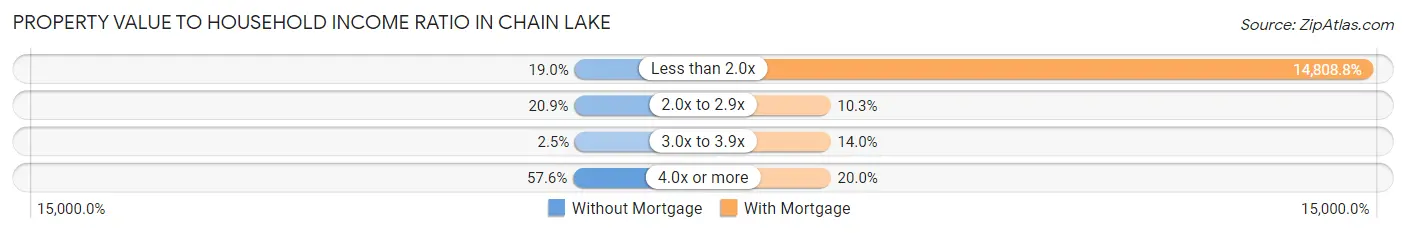
| Value-to-Income Ratio | Without Mortgage | With Mortgage |
| Less than 2.0x | 83 (19.0%) | 164,526 (14,808.8%) |
| 2.0x to 2.9x | 91 (20.9%) | 114 (10.3%) |
| 3.0x to 3.9x | 11 (2.5%) | 155 (14.0%) |
| 4.0x or more | 251 (57.6%) | 222 (20.0%) |
| Total | 436 (100.0%) | 1,111 (100.0%) |
Real Estate Taxes by Mortgage Status in Chain Lake
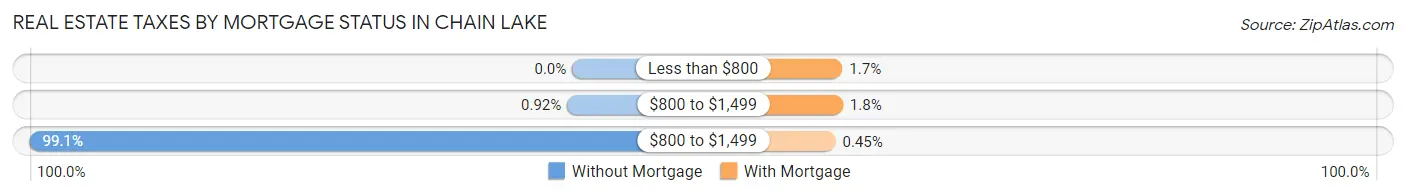
| Property Taxes | Without Mortgage | With Mortgage |
| Less than $800 | 0 (0.0%) | 19 (1.7%) |
| $800 to $1,499 | 4 (0.9%) | 20 (1.8%) |
| $800 to $1,499 | 432 (99.1%) | 5 (0.4%) |
| Total | 436 (100.0%) | 1,111 (100.0%) |
Health & Disability in Chain Lake
Health Insurance Coverage by Age in Chain Lake
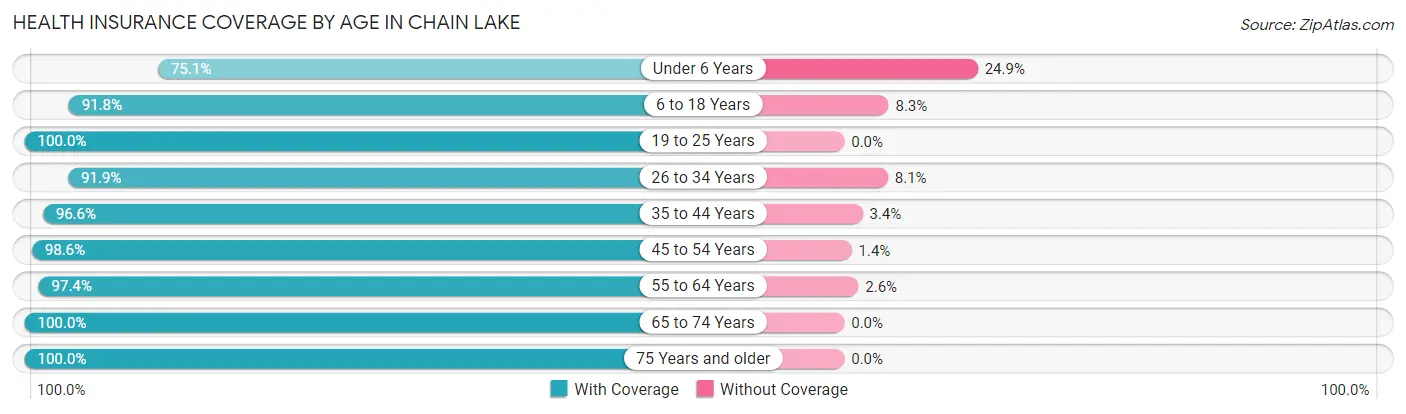
| Age Bracket | With Coverage | Without Coverage |
| Under 6 Years | 320 (75.1%) | 106 (24.9%) |
| 6 to 18 Years | 701 (91.7%) | 63 (8.3%) |
| 19 to 25 Years | 325 (100.0%) | 0 (0.0%) |
| 26 to 34 Years | 328 (91.9%) | 29 (8.1%) |
| 35 to 44 Years | 710 (96.6%) | 25 (3.4%) |
| 45 to 54 Years | 869 (98.6%) | 12 (1.4%) |
| 55 to 64 Years | 780 (97.4%) | 21 (2.6%) |
| 65 to 74 Years | 611 (100.0%) | 0 (0.0%) |
| 75 Years and older | 212 (100.0%) | 0 (0.0%) |
| Total | 4,856 (95.0%) | 256 (5.0%) |
Health Insurance Coverage by Citizenship Status in Chain Lake
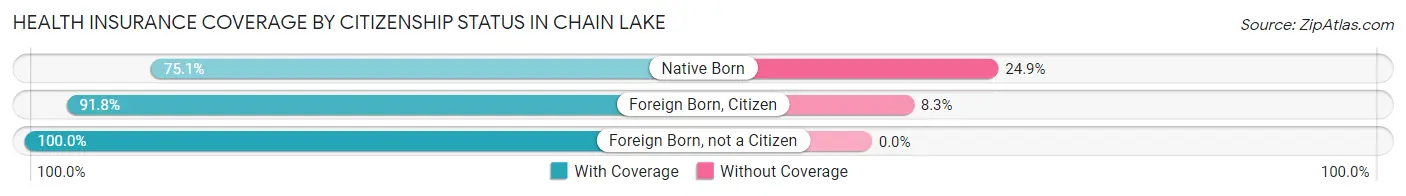
| Citizenship Status | With Coverage | Without Coverage |
| Native Born | 320 (75.1%) | 106 (24.9%) |
| Foreign Born, Citizen | 701 (91.7%) | 63 (8.3%) |
| Foreign Born, not a Citizen | 325 (100.0%) | 0 (0.0%) |
Health Insurance Coverage by Household Income in Chain Lake
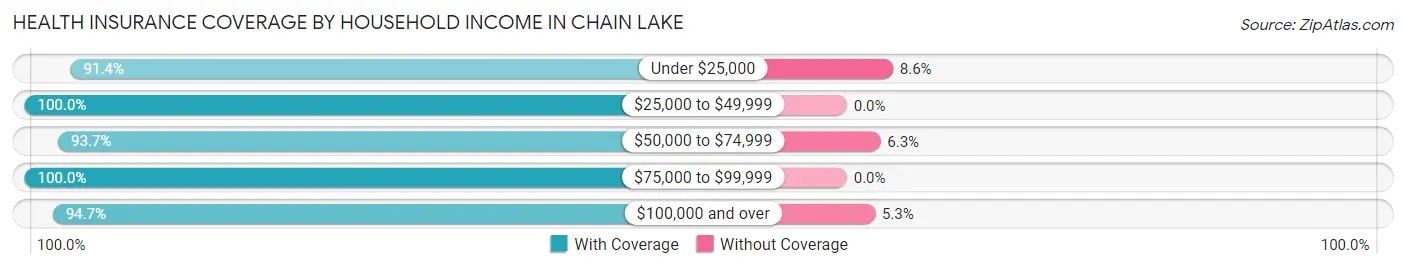
| Household Income | With Coverage | Without Coverage |
| Under $25,000 | 127 (91.4%) | 12 (8.6%) |
| $25,000 to $49,999 | 236 (100.0%) | 0 (0.0%) |
| $50,000 to $74,999 | 432 (93.7%) | 29 (6.3%) |
| $75,000 to $99,999 | 207 (100.0%) | 0 (0.0%) |
| $100,000 and over | 3,854 (94.7%) | 215 (5.3%) |
Public vs Private Health Insurance Coverage by Age in Chain Lake
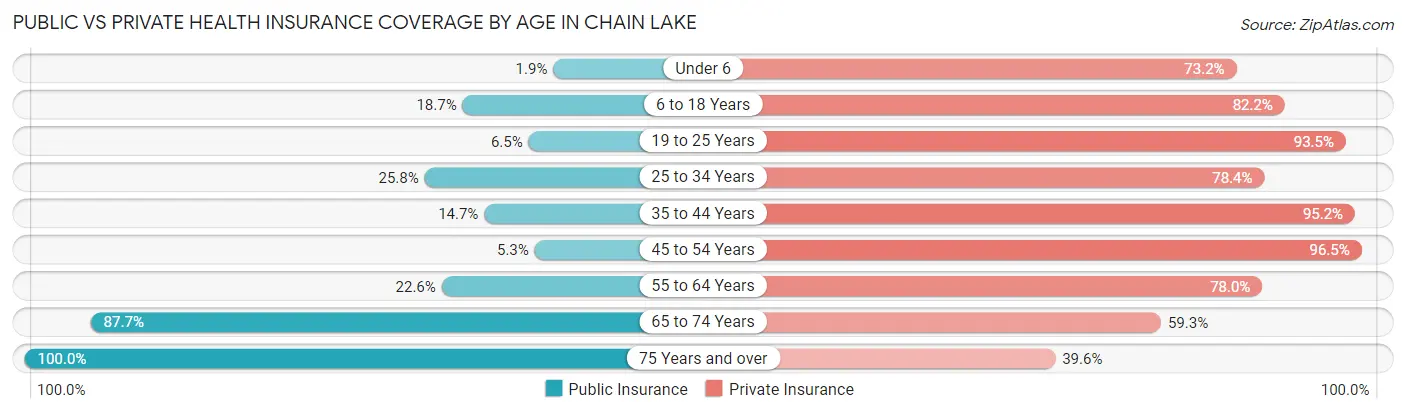
| Age Bracket | Public Insurance | Private Insurance |
| Under 6 | 8 (1.9%) | 312 (73.2%) |
| 6 to 18 Years | 143 (18.7%) | 628 (82.2%) |
| 19 to 25 Years | 21 (6.5%) | 304 (93.5%) |
| 25 to 34 Years | 92 (25.8%) | 280 (78.4%) |
| 35 to 44 Years | 108 (14.7%) | 700 (95.2%) |
| 45 to 54 Years | 47 (5.3%) | 850 (96.5%) |
| 55 to 64 Years | 181 (22.6%) | 625 (78.0%) |
| 65 to 74 Years | 536 (87.7%) | 362 (59.3%) |
| 75 Years and over | 212 (100.0%) | 84 (39.6%) |
| Total | 1,348 (26.4%) | 4,145 (81.1%) |
Disability Status by Sex by Age in Chain Lake
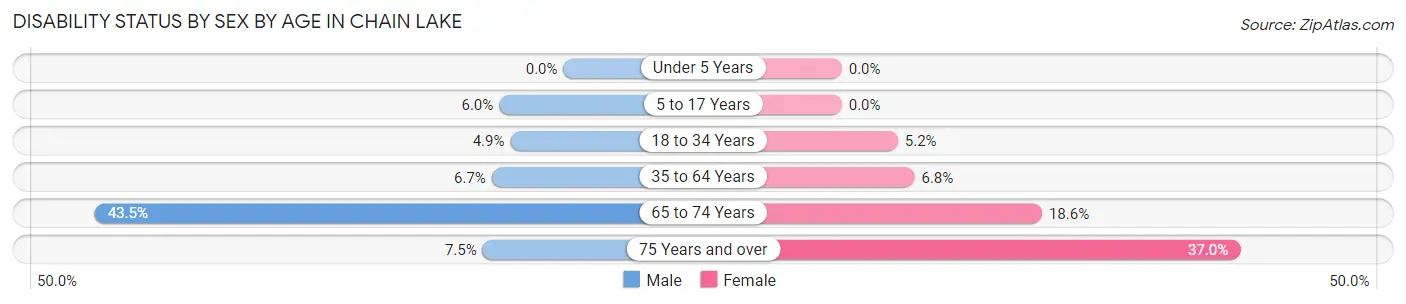
| Age Bracket | Male | Female |
| Under 5 Years | 0 (0.0%) | 0 (0.0%) |
| 5 to 17 Years | 33 (6.0%) | 0 (0.0%) |
| 18 to 34 Years | 16 (4.9%) | 21 (5.2%) |
| 35 to 64 Years | 79 (6.7%) | 83 (6.8%) |
| 65 to 74 Years | 137 (43.5%) | 55 (18.6%) |
| 75 Years and over | 9 (7.5%) | 34 (37.0%) |
Disability Class by Sex by Age in Chain Lake
Disability Class: Hearing Difficulty
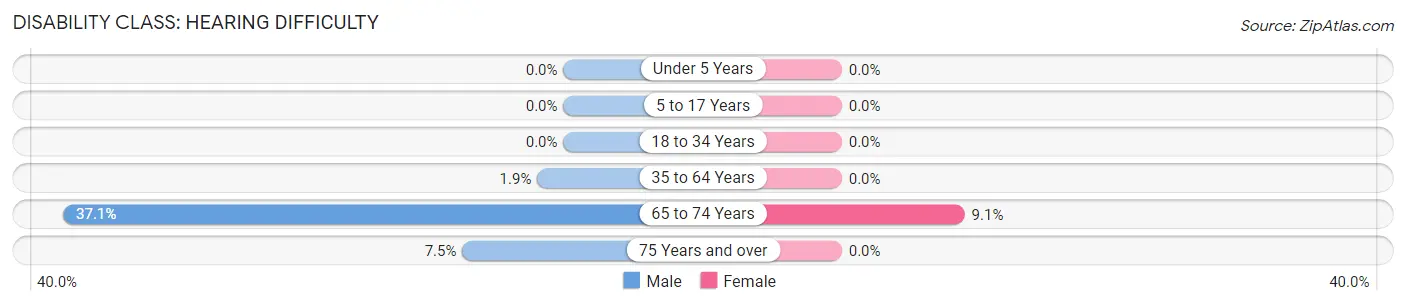
| Age Bracket | Male | Female |
| Under 5 Years | 0 (0.0%) | 0 (0.0%) |
| 5 to 17 Years | 0 (0.0%) | 0 (0.0%) |
| 18 to 34 Years | 0 (0.0%) | 0 (0.0%) |
| 35 to 64 Years | 23 (1.9%) | 0 (0.0%) |
| 65 to 74 Years | 117 (37.1%) | 27 (9.1%) |
| 75 Years and over | 9 (7.5%) | 0 (0.0%) |
Disability Class: Vision Difficulty
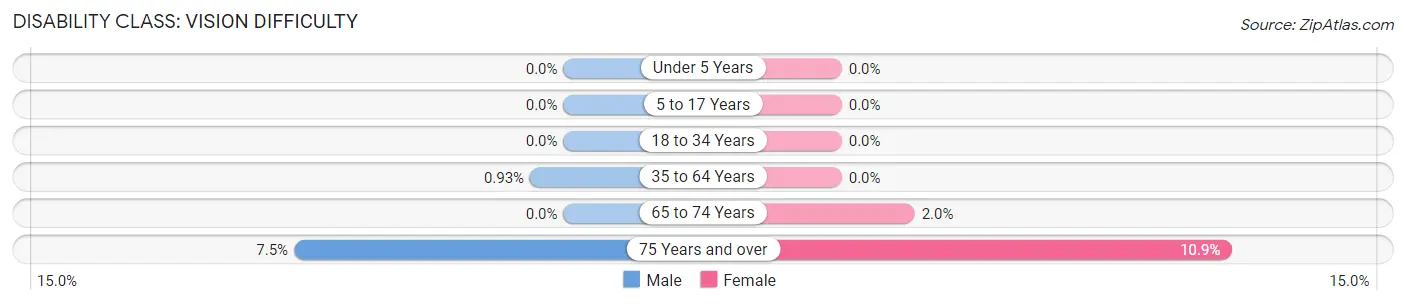
| Age Bracket | Male | Female |
| Under 5 Years | 0 (0.0%) | 0 (0.0%) |
| 5 to 17 Years | 0 (0.0%) | 0 (0.0%) |
| 18 to 34 Years | 0 (0.0%) | 0 (0.0%) |
| 35 to 64 Years | 11 (0.9%) | 0 (0.0%) |
| 65 to 74 Years | 0 (0.0%) | 6 (2.0%) |
| 75 Years and over | 9 (7.5%) | 10 (10.9%) |
Disability Class: Cognitive Difficulty
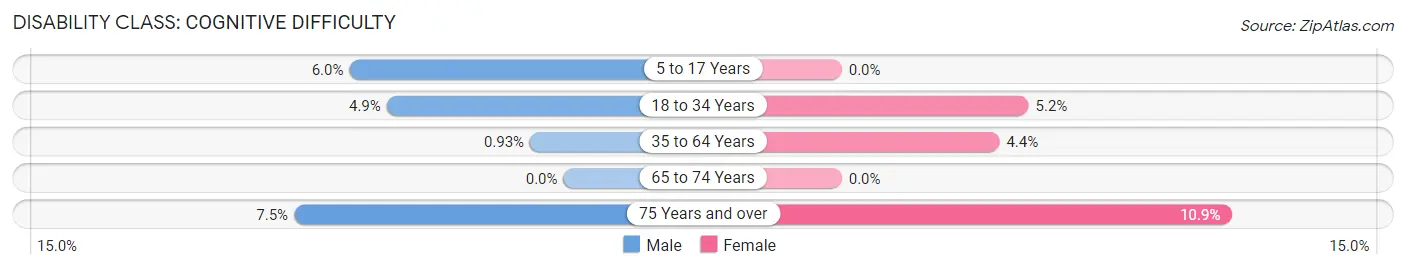
| Age Bracket | Male | Female |
| 5 to 17 Years | 33 (6.0%) | 0 (0.0%) |
| 18 to 34 Years | 16 (4.9%) | 21 (5.2%) |
| 35 to 64 Years | 11 (0.9%) | 54 (4.4%) |
| 65 to 74 Years | 0 (0.0%) | 0 (0.0%) |
| 75 Years and over | 9 (7.5%) | 10 (10.9%) |
Disability Class: Ambulatory Difficulty
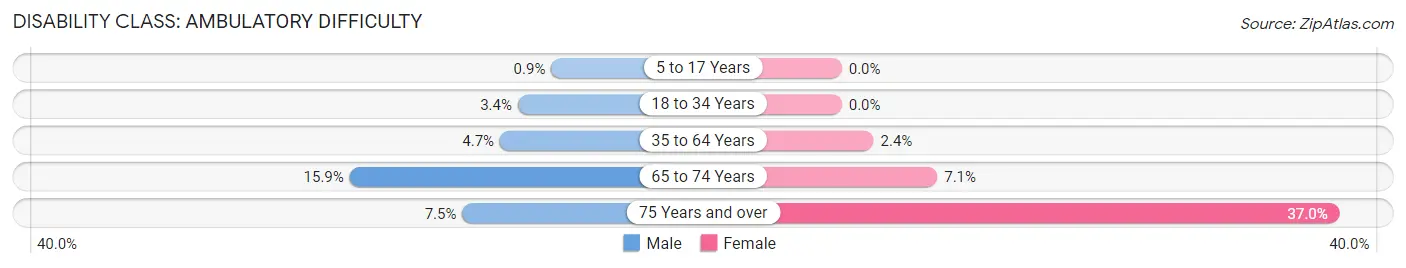
| Age Bracket | Male | Female |
| 5 to 17 Years | 5 (0.9%) | 0 (0.0%) |
| 18 to 34 Years | 11 (3.4%) | 0 (0.0%) |
| 35 to 64 Years | 56 (4.7%) | 29 (2.4%) |
| 65 to 74 Years | 50 (15.9%) | 21 (7.1%) |
| 75 Years and over | 9 (7.5%) | 34 (37.0%) |
Disability Class: Self-Care Difficulty
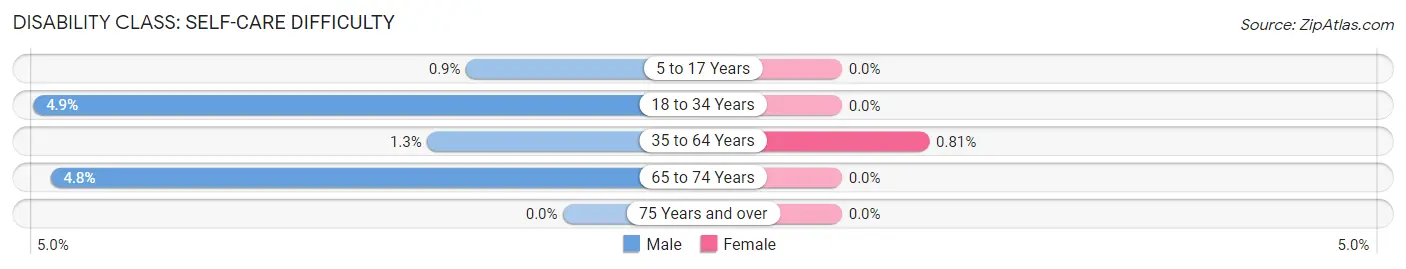
| Age Bracket | Male | Female |
| 5 to 17 Years | 5 (0.9%) | 0 (0.0%) |
| 18 to 34 Years | 16 (4.9%) | 0 (0.0%) |
| 35 to 64 Years | 15 (1.3%) | 10 (0.8%) |
| 65 to 74 Years | 15 (4.8%) | 0 (0.0%) |
| 75 Years and over | 0 (0.0%) | 0 (0.0%) |
Technology Access in Chain Lake
Computing Device Access in Chain Lake
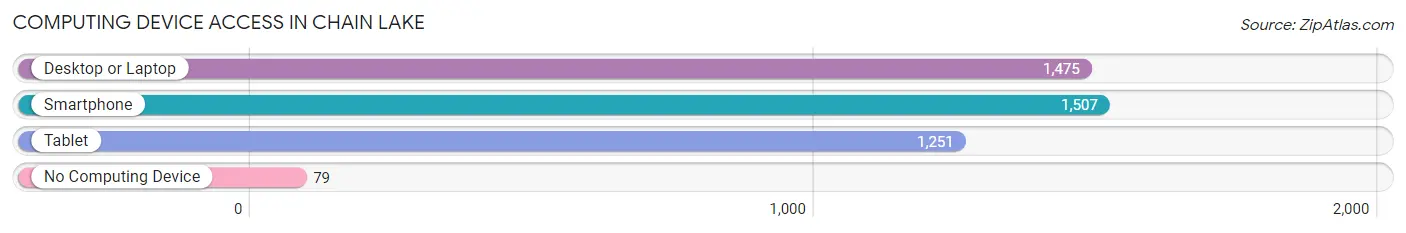
| Device Type | # Households | % Households |
| Desktop or Laptop | 1,475 | 88.6% |
| Smartphone | 1,507 | 90.5% |
| Tablet | 1,251 | 75.1% |
| No Computing Device | 79 | 4.7% |
| Total | 1,665 | 100.0% |
Internet Access in Chain Lake
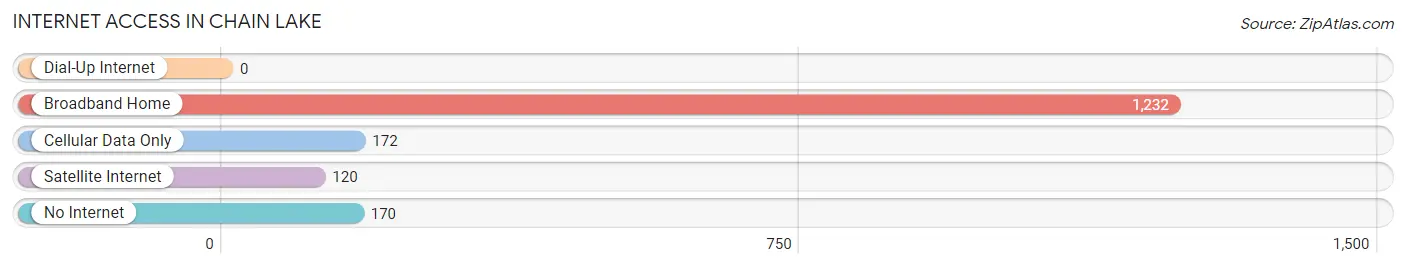
| Internet Type | # Households | % Households |
| Dial-Up Internet | 0 | 0.0% |
| Broadband Home | 1,232 | 74.0% |
| Cellular Data Only | 172 | 10.3% |
| Satellite Internet | 120 | 7.2% |
| No Internet | 170 | 10.2% |
| Total | 1,665 | 100.0% |
Chain Lake Summary
Lake Chain is a small unincorporated community located in the Cascade Mountains of Washington State, United States. It is situated in the foothills of the Cascade Range, approximately 25 miles east of the city of Seattle. The community is located in King County, and is part of the Snoqualmie Valley.
History
The area around Lake Chain was first settled in the late 1800s by homesteaders. The first settlers were mostly of Scandinavian descent, and the area was known as “Little Norway”. The area was primarily used for logging and farming, and the community was known for its abundance of wild game.
In the early 1900s, the area was developed as a resort community. The first resort was built in 1910, and the area quickly became a popular destination for tourists. The resort was known as the Lake Chain Resort, and it was a popular destination for fishing, boating, and swimming.
In the 1950s, the area began to experience a decline in tourism. The resort was closed in the late 1950s, and the area began to experience a population decline. The area was mostly abandoned by the 1970s, and the population had dropped to less than 100 people.
Geography
Lake Chain is located in the foothills of the Cascade Range, approximately 25 miles east of the city of Seattle. The community is situated in the Snoqualmie Valley, and is surrounded by the Cascade Mountains. The area is known for its lush forests and abundant wildlife.
The area is home to several lakes, including Lake Chain, Lake Alice, and Lake Sammamish. The area is also home to several rivers, including the Snoqualmie River, the Skykomish River, and the Tolt River.
Economy
The economy of Lake Chain is largely based on tourism. The area is home to several resorts, including the Lake Chain Resort, which is a popular destination for fishing, boating, and swimming. The area is also home to several restaurants, bars, and other businesses that cater to tourists.
The area is also home to several small businesses, including a lumber mill, a sawmill, and a general store. The area is also home to several farms, which produce a variety of crops, including apples, cherries, and hay.
Demographics
As of the 2010 census, the population of Lake Chain was estimated to be around 100 people. The population is primarily white, with a small percentage of African American, Asian, and Hispanic residents. The median household income in the area is around $50,000, and the median home value is around $200,000.
The area is served by the Lake Chain School District, which serves students in grades K-12. The area is also home to several churches, including the Lake Chain Lutheran Church and the Lake Chain Baptist Church.
Conclusion
Lake Chain is a small unincorporated community located in the Cascade Mountains of Washington State, United States. The area was first settled in the late 1800s by homesteaders, and the area was developed as a resort community in the early 1900s. The area is known for its lush forests and abundant wildlife, and the economy of the area is largely based on tourism. The population of the area is estimated to be around 100 people, and the median household income is around $50,000. The area is served by the Lake Chain School District, and is home to several churches.
Common Questions
What is Per Capita Income in Chain Lake?
Per Capita income in Chain Lake is $65,916.
What is the Median Family Income in Chain Lake?
Median Family Income in Chain Lake is $162,409.
What is the Median Household income in Chain Lake?
Median Household Income in Chain Lake is $149,594.
What is Income or Wage Gap in Chain Lake?
Income or Wage Gap in Chain Lake is 32.7%.
Women in Chain Lake earn 67.3 cents for every dollar earned by a man.
What is Inequality or Gini Index in Chain Lake?
Inequality or Gini Index in Chain Lake is 0.46.
What is the Total Population of Chain Lake?
Total Population of Chain Lake is 5,122.
What is the Total Male Population of Chain Lake?
Total Male Population of Chain Lake is 2,613.
What is the Total Female Population of Chain Lake?
Total Female Population of Chain Lake is 2,509.
What is the Ratio of Males per 100 Females in Chain Lake?
There are 104.15 Males per 100 Females in Chain Lake.
What is the Ratio of Females per 100 Males in Chain Lake?
There are 96.02 Females per 100 Males in Chain Lake.
What is the Median Population Age in Chain Lake?
Median Population Age in Chain Lake is 43.7 Years.
What is the Average Family Size in Chain Lake
Average Family Size in Chain Lake is 3.3 People.
What is the Average Household Size in Chain Lake
Average Household Size in Chain Lake is 3.1 People.
How Large is the Labor Force in Chain Lake?
There are 2,775 People in the Labor Forcein in Chain Lake.
What is the Percentage of People in the Labor Force in Chain Lake?
68.6% of People are in the Labor Force in Chain Lake.
What is the Unemployment Rate in Chain Lake?
Unemployment Rate in Chain Lake is 5.0%.