Lake Forest Park, WA Map & Demographics
Lake Forest Park Map
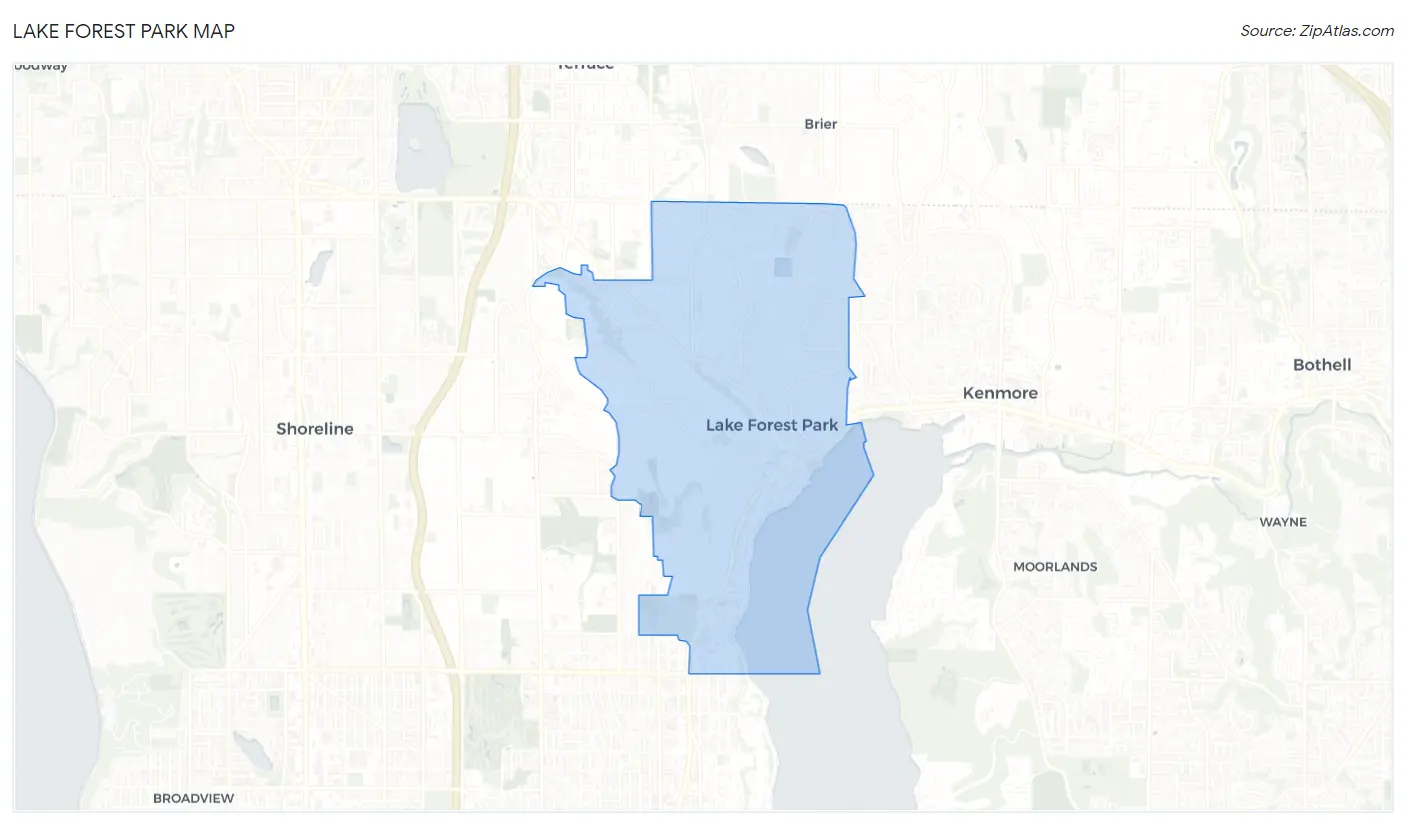
Lake Forest Park Overview
$72,992
PER CAPITA INCOME
$180,587
AVG FAMILY INCOME
$152,010
AVG HOUSEHOLD INCOME
7.3%
WAGE / INCOME GAP [ % ]
92.7¢/ $1
WAGE / INCOME GAP [ $ ]
0.39
INEQUALITY / GINI INDEX
13,462
TOTAL POPULATION
6,781
MALE POPULATION
6,681
FEMALE POPULATION
101.50
MALES / 100 FEMALES
98.53
FEMALES / 100 MALES
42.6
MEDIAN AGE
2.9
AVG FAMILY SIZE
2.5
AVG HOUSEHOLD SIZE
7,701
LABOR FORCE [ PEOPLE ]
68.7%
PERCENT IN LABOR FORCE
2.9%
UNEMPLOYMENT RATE
Income in Lake Forest Park
Income Overview in Lake Forest Park
Per Capita Income in Lake Forest Park is $72,992, while median incomes of families and households are $180,587 and $152,010 respectively.
| Characteristic | Number | Measure |
| Per Capita Income | 13,462 | $72,992 |
| Median Family Income | 3,625 | $180,587 |
| Mean Family Income | 3,625 | $207,178 |
| Median Household Income | 5,448 | $152,010 |
| Mean Household Income | 5,448 | $178,355 |
| Income Deficit | 3,625 | $0 |
| Wage / Income Gap (%) | 13,462 | 7.34% |
| Wage / Income Gap ($) | 13,462 | 92.66¢ per $1 |
| Gini / Inequality Index | 13,462 | 0.39 |
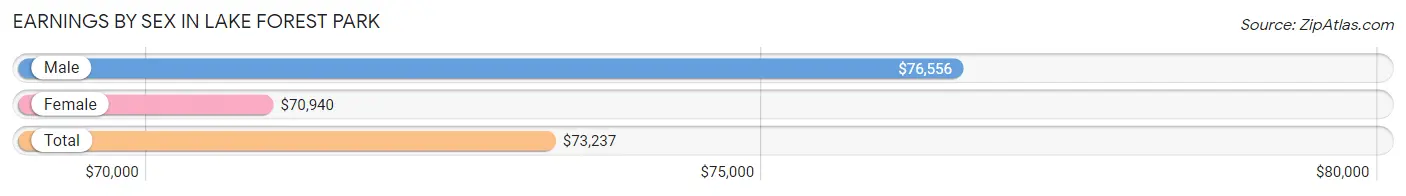
Earnings by Sex in Lake Forest Park
Average Earnings in Lake Forest Park are $73,237, $76,556 for men and $70,940 for women, a difference of 7.3%.
| Sex | Number | Average Earnings |
| Male | 4,472 (54.7%) | $76,556 |
| Female | 3,709 (45.3%) | $70,940 |
| Total | 8,181 (100.0%) | $73,237 |
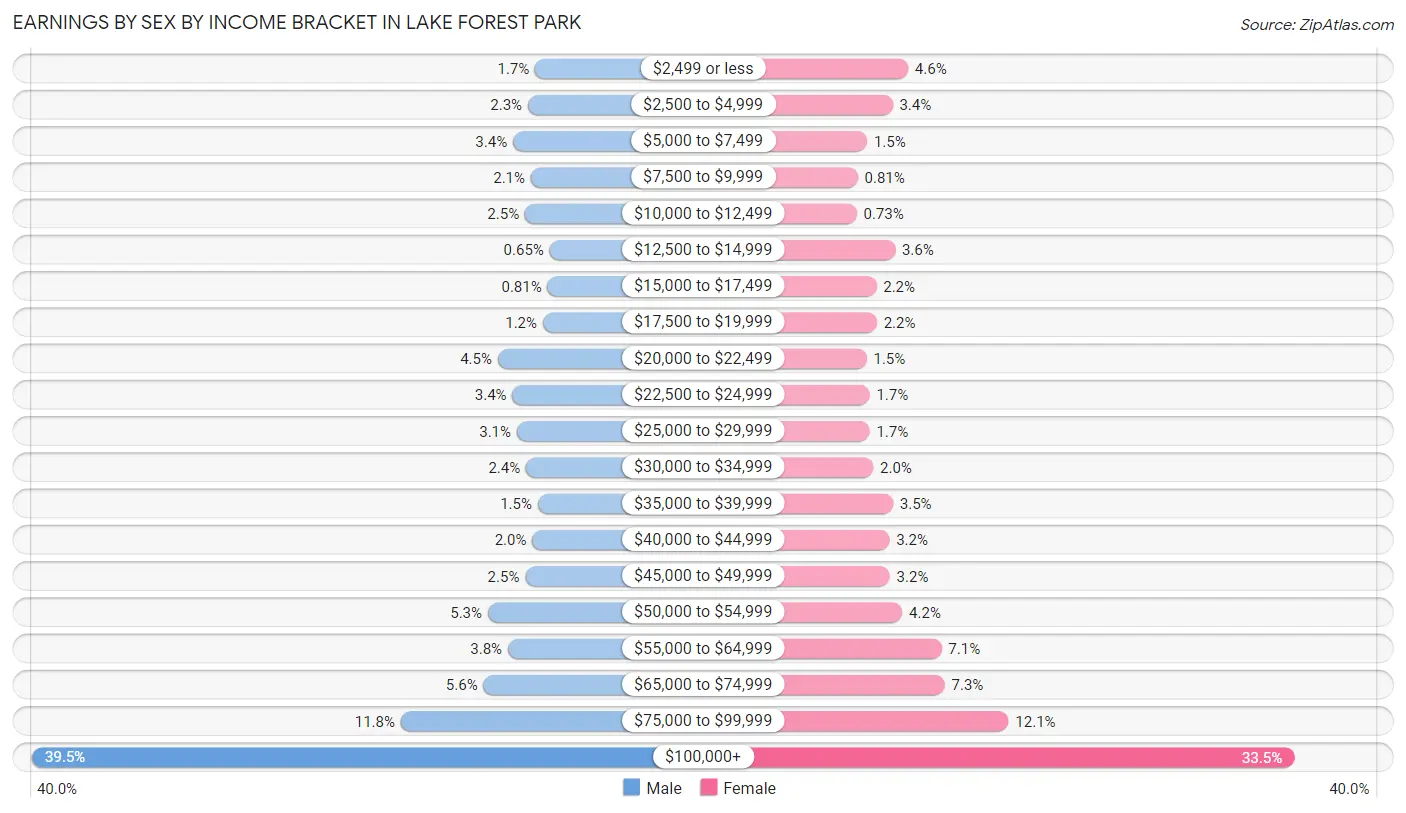
Earnings by Sex by Income Bracket in Lake Forest Park
The most common earnings brackets in Lake Forest Park are $100,000+ for men (1,764 | 39.5%) and $100,000+ for women (1,243 | 33.5%).
| Income | Male | Female |
| $2,499 or less | 78 (1.7%) | 170 (4.6%) |
| $2,500 to $4,999 | 102 (2.3%) | 127 (3.4%) |
| $5,000 to $7,499 | 152 (3.4%) | 56 (1.5%) |
| $7,500 to $9,999 | 92 (2.1%) | 30 (0.8%) |
| $10,000 to $12,499 | 112 (2.5%) | 27 (0.7%) |
| $12,500 to $14,999 | 29 (0.6%) | 134 (3.6%) |
| $15,000 to $17,499 | 36 (0.8%) | 82 (2.2%) |
| $17,500 to $19,999 | 52 (1.2%) | 83 (2.2%) |
| $20,000 to $22,499 | 203 (4.5%) | 55 (1.5%) |
| $22,500 to $24,999 | 154 (3.4%) | 63 (1.7%) |
| $25,000 to $29,999 | 139 (3.1%) | 63 (1.7%) |
| $30,000 to $34,999 | 108 (2.4%) | 73 (2.0%) |
| $35,000 to $39,999 | 69 (1.5%) | 128 (3.5%) |
| $40,000 to $44,999 | 87 (1.9%) | 118 (3.2%) |
| $45,000 to $49,999 | 111 (2.5%) | 119 (3.2%) |
| $50,000 to $54,999 | 236 (5.3%) | 154 (4.2%) |
| $55,000 to $64,999 | 169 (3.8%) | 263 (7.1%) |
| $65,000 to $74,999 | 251 (5.6%) | 272 (7.3%) |
| $75,000 to $99,999 | 528 (11.8%) | 449 (12.1%) |
| $100,000+ | 1,764 (39.5%) | 1,243 (33.5%) |
| Total | 4,472 (100.0%) | 3,709 (100.0%) |
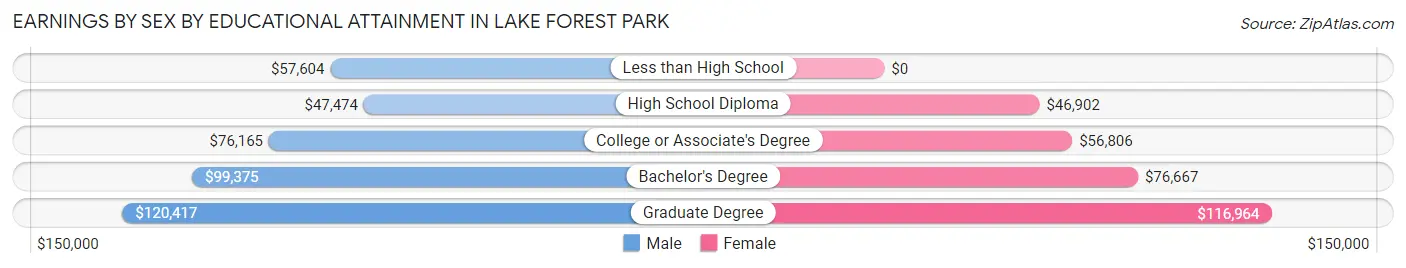
Earnings by Sex by Educational Attainment in Lake Forest Park
Average earnings in Lake Forest Park are $89,313 for men and $75,625 for women, a difference of 15.3%. Men with an educational attainment of graduate degree enjoy the highest average annual earnings of $120,417, while those with high school diploma education earn the least with $47,474. Women with an educational attainment of graduate degree earn the most with the average annual earnings of $116,964, while those with high school diploma education have the smallest earnings of $46,902.
| Educational Attainment | Male Income | Female Income |
| Less than High School | $57,604 | $0 |
| High School Diploma | $47,474 | $46,902 |
| College or Associate's Degree | $76,165 | $56,806 |
| Bachelor's Degree | $99,375 | $76,667 |
| Graduate Degree | $120,417 | $116,964 |
| Total | $89,313 | $75,625 |
Family Income in Lake Forest Park
Family Income Brackets in Lake Forest Park
According to the Lake Forest Park family income data, there are 1,504 families falling into the $200,000+ income range, which is the most common income bracket and makes up 41.5% of all families.
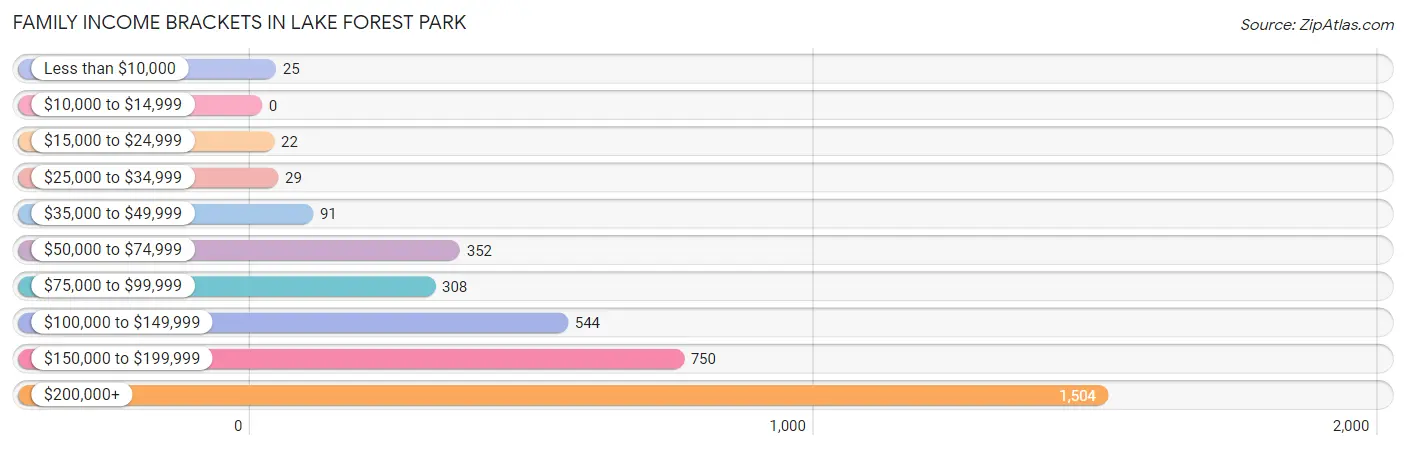
| Income Bracket | # Families | % Families |
| Less than $10,000 | 25 | 0.7% |
| $10,000 to $14,999 | 0 | 0.0% |
| $15,000 to $24,999 | 22 | 0.6% |
| $25,000 to $34,999 | 29 | 0.8% |
| $35,000 to $49,999 | 91 | 2.5% |
| $50,000 to $74,999 | 352 | 9.7% |
| $75,000 to $99,999 | 308 | 8.5% |
| $100,000 to $149,999 | 544 | 15.0% |
| $150,000 to $199,999 | 750 | 20.7% |
| $200,000+ | 1,504 | 41.5% |
Family Income by Famaliy Size in Lake Forest Park
4-person families (985 | 27.2%) account for the highest median family income in Lake Forest Park with $242,118 per family, while 2-person families (1,784 | 49.2%) have the highest median income of $71,364 per family member.
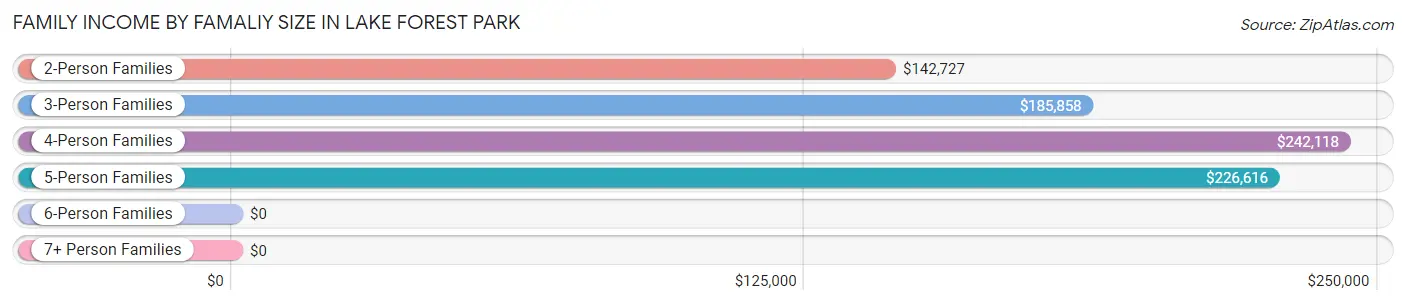
| Income Bracket | # Families | Median Income |
| 2-Person Families | 1,784 (49.2%) | $142,727 |
| 3-Person Families | 669 (18.5%) | $185,858 |
| 4-Person Families | 985 (27.2%) | $242,118 |
| 5-Person Families | 149 (4.1%) | $226,616 |
| 6-Person Families | 17 (0.5%) | $0 |
| 7+ Person Families | 21 (0.6%) | $0 |
| Total | 3,625 (100.0%) | $180,587 |
Family Income by Number of Earners in Lake Forest Park
The median family income in Lake Forest Park is $180,587, with families comprising 3+ earners (410) having the highest median family income of $243,125, while families with no earners (472) have the lowest median family income of $92,500, accounting for 11.3% and 13.0% of families, respectively.
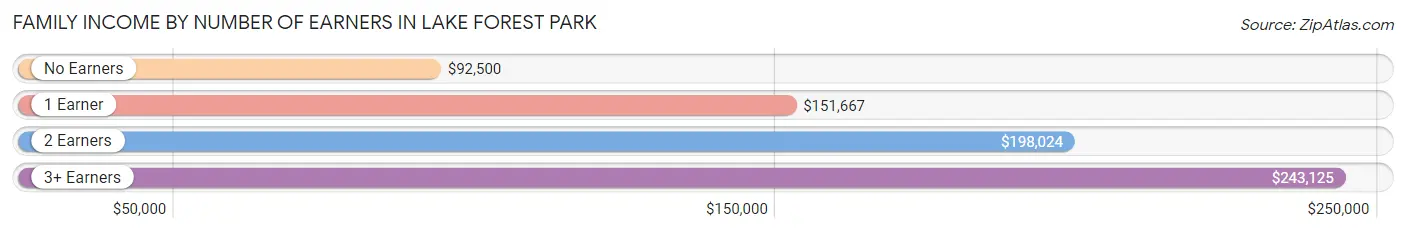
| Number of Earners | # Families | Median Income |
| No Earners | 472 (13.0%) | $92,500 |
| 1 Earner | 852 (23.5%) | $151,667 |
| 2 Earners | 1,891 (52.2%) | $198,024 |
| 3+ Earners | 410 (11.3%) | $243,125 |
| Total | 3,625 (100.0%) | $180,587 |
Household Income in Lake Forest Park
Household Income Brackets in Lake Forest Park
With 1,711 households falling in the category, the $200,000+ income range is the most frequent in Lake Forest Park, accounting for 31.4% of all households. In contrast, only 22 households (0.4%) fall into the $10,000 to $14,999 income bracket, making it the least populous group.
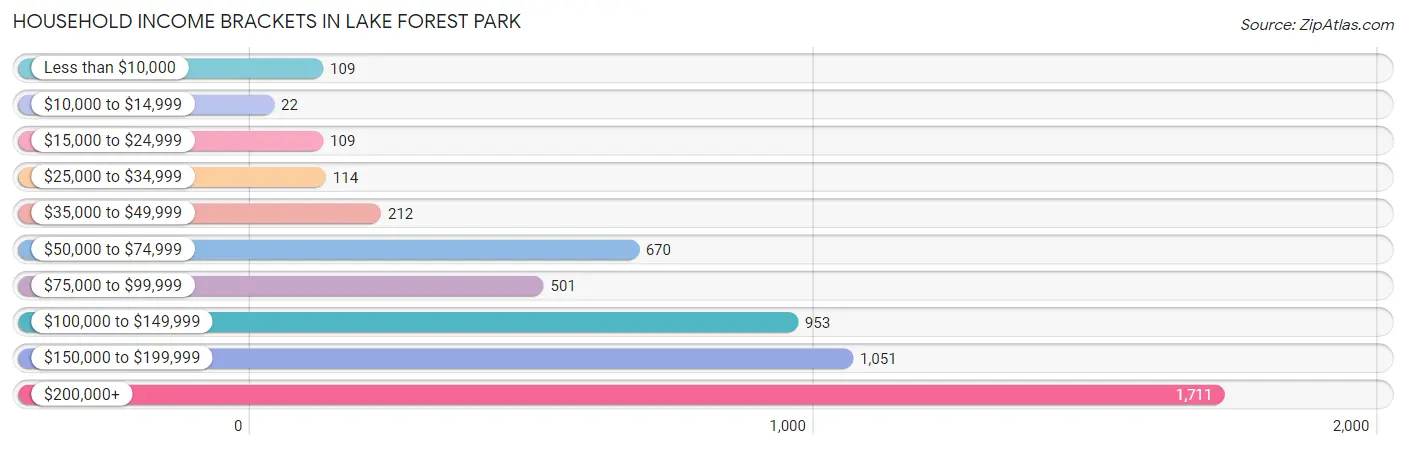
| Income Bracket | # Households | % Households |
| Less than $10,000 | 109 | 2.0% |
| $10,000 to $14,999 | 22 | 0.4% |
| $15,000 to $24,999 | 109 | 2.0% |
| $25,000 to $34,999 | 114 | 2.1% |
| $35,000 to $49,999 | 212 | 3.9% |
| $50,000 to $74,999 | 670 | 12.3% |
| $75,000 to $99,999 | 501 | 9.2% |
| $100,000 to $149,999 | 953 | 17.5% |
| $150,000 to $199,999 | 1,051 | 19.3% |
| $200,000+ | 1,711 | 31.4% |
Household Income by Householder Age in Lake Forest Park
The median household income in Lake Forest Park is $152,010, with the highest median household income of $199,464 found in the 25 to 44 years age bracket for the primary householder. A total of 1,601 households (29.4%) fall into this category. Meanwhile, the 15 to 24 years age bracket for the primary householder has the lowest median household income of $0, with 112 households (2.1%) in this group.
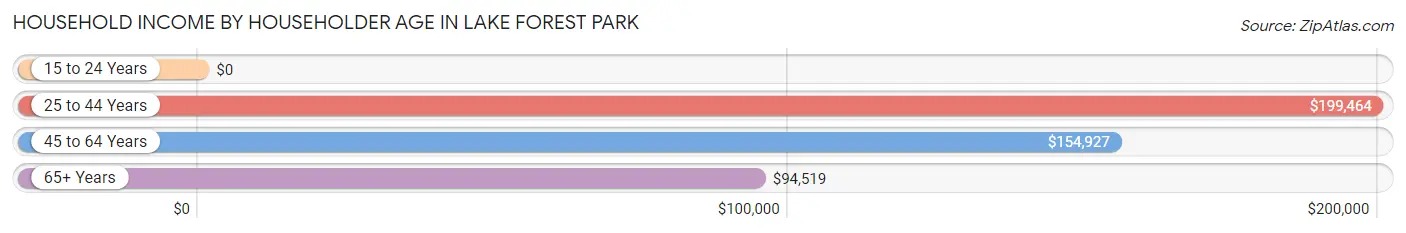
| Income Bracket | # Households | Median Income |
| 15 to 24 Years | 112 (2.1%) | $0 |
| 25 to 44 Years | 1,601 (29.4%) | $199,464 |
| 45 to 64 Years | 2,257 (41.4%) | $154,927 |
| 65+ Years | 1,478 (27.1%) | $94,519 |
| Total | 5,448 (100.0%) | $152,010 |
Poverty in Lake Forest Park
Income Below Poverty by Sex and Age in Lake Forest Park
With 3.4% poverty level for males and 3.1% for females among the residents of Lake Forest Park, 18 to 24 year old males and 16 and 17 year old females are the most vulnerable to poverty, with 43 males (9.7%) and 37 females (19.3%) in their respective age groups living below the poverty level.
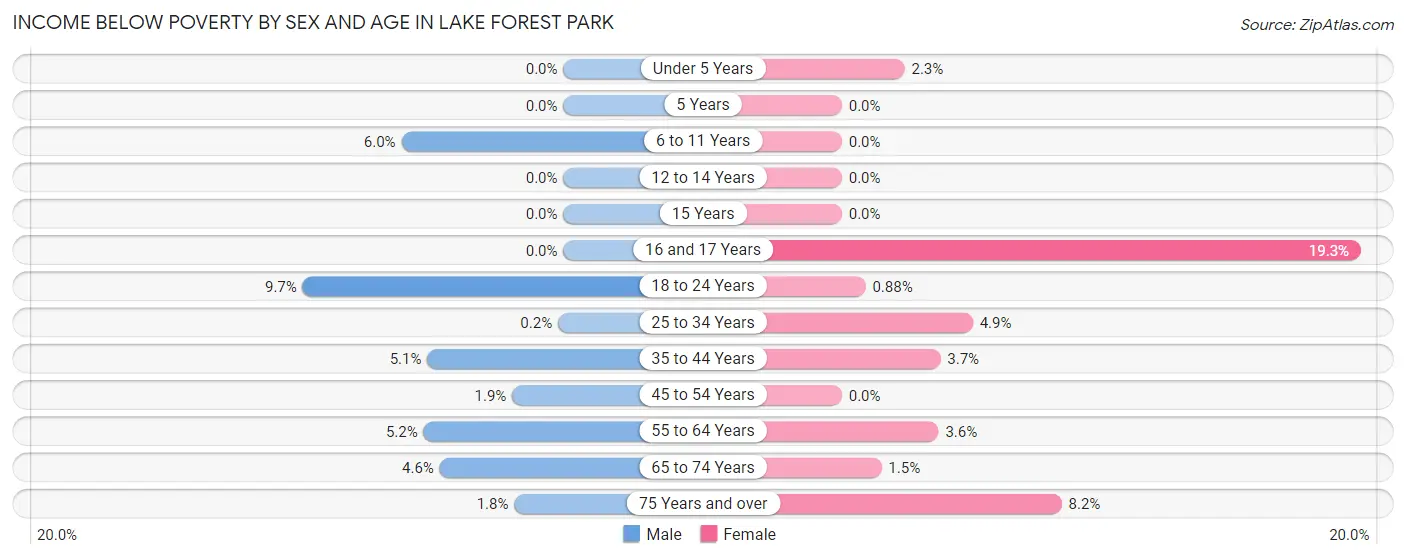
| Age Bracket | Male | Female |
| Under 5 Years | 0 (0.0%) | 7 (2.3%) |
| 5 Years | 0 (0.0%) | 0 (0.0%) |
| 6 to 11 Years | 20 (6.0%) | 0 (0.0%) |
| 12 to 14 Years | 0 (0.0%) | 0 (0.0%) |
| 15 Years | 0 (0.0%) | 0 (0.0%) |
| 16 and 17 Years | 0 (0.0%) | 37 (19.3%) |
| 18 to 24 Years | 43 (9.7%) | 3 (0.9%) |
| 25 to 34 Years | 2 (0.2%) | 42 (4.9%) |
| 35 to 44 Years | 47 (5.1%) | 32 (3.7%) |
| 45 to 54 Years | 19 (1.9%) | 0 (0.0%) |
| 55 to 64 Years | 55 (5.2%) | 30 (3.6%) |
| 65 to 74 Years | 35 (4.6%) | 11 (1.5%) |
| 75 Years and over | 7 (1.8%) | 44 (8.2%) |
| Total | 228 (3.4%) | 206 (3.1%) |
Income Above Poverty by Sex and Age in Lake Forest Park
According to the poverty statistics in Lake Forest Park, males aged under 5 years and females aged 5 years are the age groups that are most secure financially, with 100.0% of males and 100.0% of females in these age groups living above the poverty line.
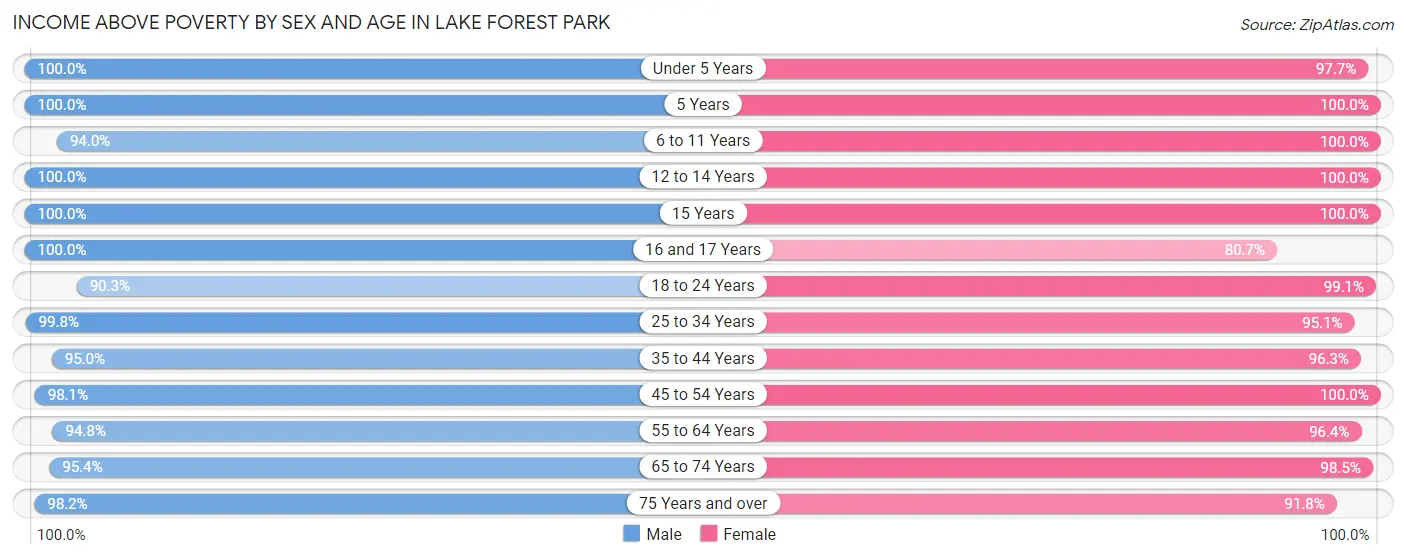
| Age Bracket | Male | Female |
| Under 5 Years | 258 (100.0%) | 293 (97.7%) |
| 5 Years | 81 (100.0%) | 128 (100.0%) |
| 6 to 11 Years | 313 (94.0%) | 464 (100.0%) |
| 12 to 14 Years | 276 (100.0%) | 222 (100.0%) |
| 15 Years | 119 (100.0%) | 39 (100.0%) |
| 16 and 17 Years | 132 (100.0%) | 155 (80.7%) |
| 18 to 24 Years | 401 (90.3%) | 337 (99.1%) |
| 25 to 34 Years | 983 (99.8%) | 823 (95.1%) |
| 35 to 44 Years | 883 (95.0%) | 843 (96.3%) |
| 45 to 54 Years | 981 (98.1%) | 1,095 (100.0%) |
| 55 to 64 Years | 1,005 (94.8%) | 805 (96.4%) |
| 65 to 74 Years | 727 (95.4%) | 735 (98.5%) |
| 75 Years and over | 378 (98.2%) | 495 (91.8%) |
| Total | 6,537 (96.6%) | 6,434 (96.9%) |
Income Below Poverty Among Married-Couple Families in Lake Forest Park
The poverty statistics for married-couple families in Lake Forest Park show that 0.6% or 18 of the total 3,227 families live below the poverty line. Families with no children have the highest poverty rate of 0.9%, comprising of 18 families. On the other hand, families with 1 or 2 children have the lowest poverty rate of 0.0%, which includes 0 families.
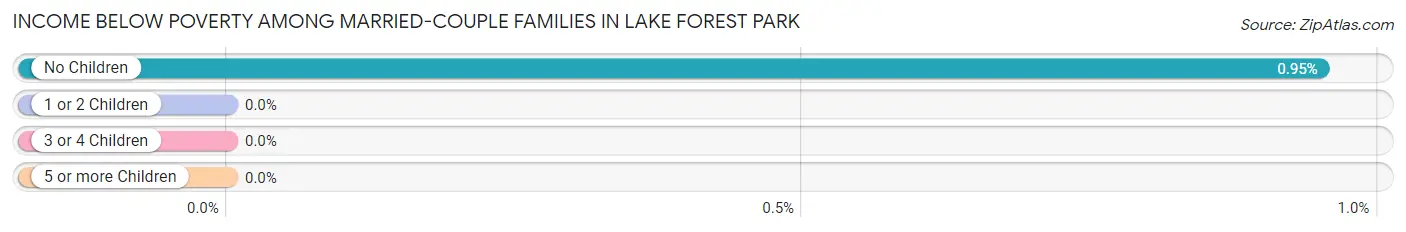
| Children | Above Poverty | Below Poverty |
| No Children | 1,869 (99.1%) | 18 (0.9%) |
| 1 or 2 Children | 1,222 (100.0%) | 0 (0.0%) |
| 3 or 4 Children | 105 (100.0%) | 0 (0.0%) |
| 5 or more Children | 13 (100.0%) | 0 (0.0%) |
| Total | 3,209 (99.4%) | 18 (0.6%) |
Income Below Poverty Among Single-Parent Households in Lake Forest Park
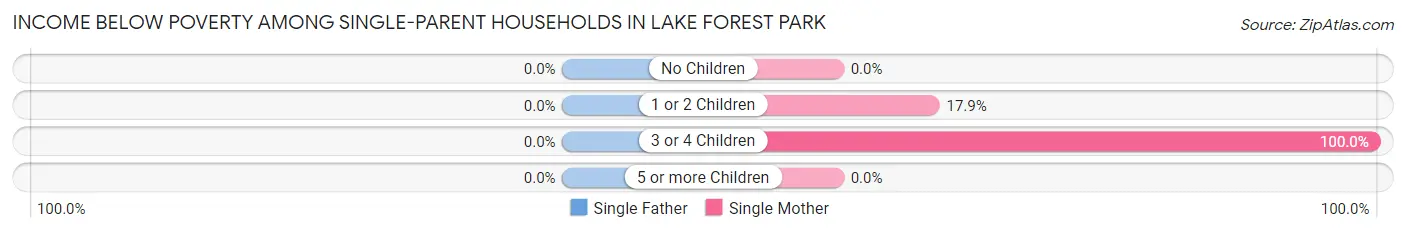
| Children | Single Father | Single Mother |
| No Children | 0 (0.0%) | 0 (0.0%) |
| 1 or 2 Children | 0 (0.0%) | 20 (17.9%) |
| 3 or 4 Children | 0 (0.0%) | 7 (100.0%) |
| 5 or more Children | 0 (0.0%) | 0 (0.0%) |
| Total | 0 (0.0%) | 27 (10.7%) |
Income Below Poverty Among Married-Couple vs Single-Parent Households in Lake Forest Park
The poverty data for Lake Forest Park shows that 18 of the married-couple family households (0.6%) and 27 of the single-parent households (6.8%) are living below the poverty level. Within the married-couple family households, those with no children have the highest poverty rate, with 18 households (0.9%) falling below the poverty line. Among the single-parent households, those with 3 or 4 children have the highest poverty rate, with 7 household (100.0%) living below poverty.
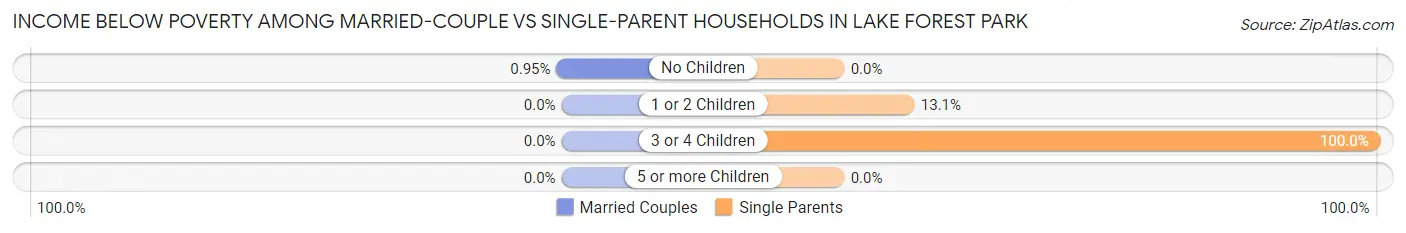
| Children | Married-Couple Families | Single-Parent Households |
| No Children | 18 (0.9%) | 0 (0.0%) |
| 1 or 2 Children | 0 (0.0%) | 20 (13.1%) |
| 3 or 4 Children | 0 (0.0%) | 7 (100.0%) |
| 5 or more Children | 0 (0.0%) | 0 (0.0%) |
| Total | 18 (0.6%) | 27 (6.8%) |
Race in Lake Forest Park
The most populous races in Lake Forest Park are White / Caucasian (10,360 | 77.0%), Asian (1,099 | 8.2%), and Two or more Races (838 | 6.2%).
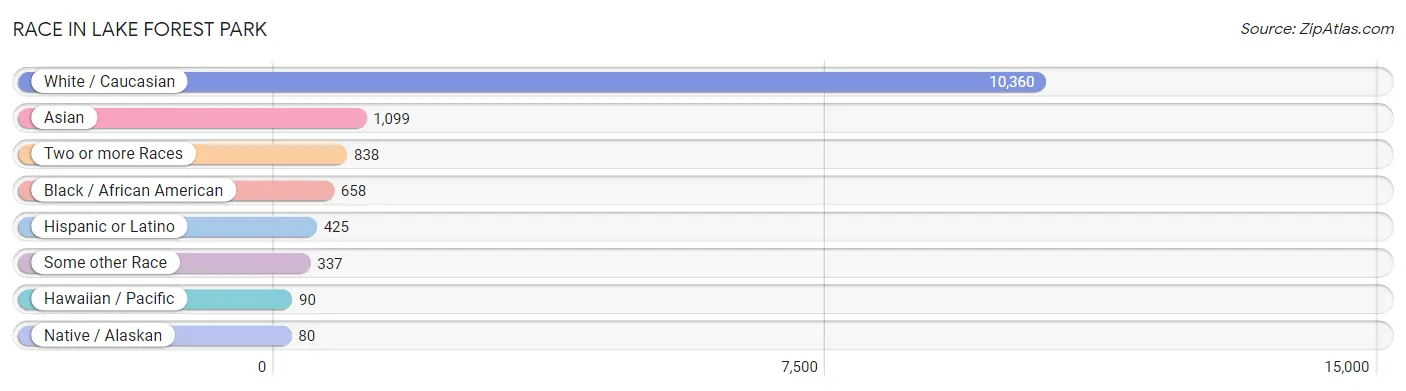
| Race | # Population | % Population |
| Asian | 1,099 | 8.2% |
| Black / African American | 658 | 4.9% |
| Hawaiian / Pacific | 90 | 0.7% |
| Hispanic or Latino | 425 | 3.2% |
| Native / Alaskan | 80 | 0.6% |
| White / Caucasian | 10,360 | 77.0% |
| Two or more Races | 838 | 6.2% |
| Some other Race | 337 | 2.5% |
| Total | 13,462 | 100.0% |
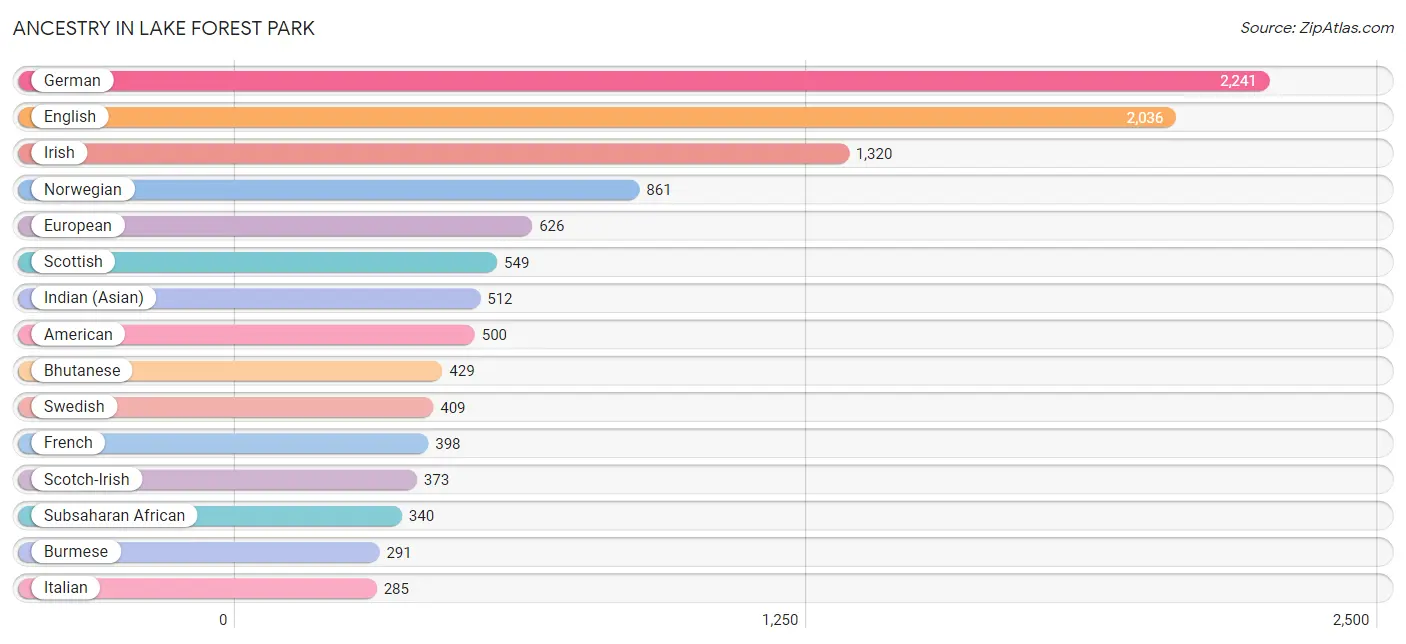
Ancestry in Lake Forest Park
The most populous ancestries reported in Lake Forest Park are German (2,241 | 16.7%), English (2,036 | 15.1%), Irish (1,320 | 9.8%), Norwegian (861 | 6.4%), and European (626 | 4.6%), together accounting for 52.6% of all Lake Forest Park residents.
| Ancestry | # Population | % Population |
| African | 76 | 0.6% |
| Albanian | 2 | 0.0% |
| Aleut | 15 | 0.1% |
| American | 500 | 3.7% |
| Arab | 127 | 0.9% |
| Argentinean | 17 | 0.1% |
| Armenian | 11 | 0.1% |
| Australian | 19 | 0.1% |
| Austrian | 38 | 0.3% |
| Bangladeshi | 21 | 0.2% |
| Barbadian | 17 | 0.1% |
| Belgian | 10 | 0.1% |
| Bhutanese | 429 | 3.2% |
| Brazilian | 41 | 0.3% |
| British | 221 | 1.6% |
| Burmese | 291 | 2.2% |
| Canadian | 26 | 0.2% |
| Cape Verdean | 12 | 0.1% |
| Central American | 69 | 0.5% |
| Chickasaw | 30 | 0.2% |
| Chilean | 21 | 0.2% |
| Chinese | 26 | 0.2% |
| Colombian | 27 | 0.2% |
| Comanche | 89 | 0.7% |
| Croatian | 89 | 0.7% |
| Czech | 137 | 1.0% |
| Czechoslovakian | 22 | 0.2% |
| Danish | 137 | 1.0% |
| Dutch | 211 | 1.6% |
| Eastern European | 173 | 1.3% |
| Ecuadorian | 9 | 0.1% |
| English | 2,036 | 15.1% |
| Estonian | 8 | 0.1% |
| Ethiopian | 45 | 0.3% |
| European | 626 | 4.6% |
| Filipino | 33 | 0.3% |
| Finnish | 65 | 0.5% |
| French | 398 | 3.0% |
| French Canadian | 84 | 0.6% |
| German | 2,241 | 16.7% |
| Greek | 144 | 1.1% |
| Guamanian / Chamorro | 11 | 0.1% |
| Guatemalan | 69 | 0.5% |
| Haitian | 17 | 0.1% |
| Hungarian | 246 | 1.8% |
| Icelander | 36 | 0.3% |
| Indian (Asian) | 512 | 3.8% |
| Iranian | 32 | 0.2% |
| Irish | 1,320 | 9.8% |
| Italian | 285 | 2.1% |
| Japanese | 56 | 0.4% |
| Korean | 86 | 0.6% |
| Laotian | 13 | 0.1% |
| Lebanese | 34 | 0.3% |
| Lithuanian | 75 | 0.6% |
| Macedonian | 16 | 0.1% |
| Mexican | 213 | 1.6% |
| Moroccan | 93 | 0.7% |
| Native Hawaiian | 175 | 1.3% |
| Northern European | 84 | 0.6% |
| Norwegian | 861 | 6.4% |
| Okinawan | 23 | 0.2% |
| Pakistani | 36 | 0.3% |
| Peruvian | 23 | 0.2% |
| Polish | 148 | 1.1% |
| Portuguese | 95 | 0.7% |
| Puerto Rican | 9 | 0.1% |
| Romanian | 12 | 0.1% |
| Russian | 254 | 1.9% |
| Samoan | 17 | 0.1% |
| Scandinavian | 178 | 1.3% |
| Scotch-Irish | 373 | 2.8% |
| Scottish | 549 | 4.1% |
| Serbian | 21 | 0.2% |
| Slovak | 26 | 0.2% |
| Slovene | 12 | 0.1% |
| Somali | 207 | 1.5% |
| South American | 106 | 0.8% |
| South American Indian | 10 | 0.1% |
| Spaniard | 8 | 0.1% |
| Spanish | 16 | 0.1% |
| Sri Lankan | 77 | 0.6% |
| Subsaharan African | 340 | 2.5% |
| Swedish | 409 | 3.0% |
| Swiss | 81 | 0.6% |
| Thai | 101 | 0.7% |
| Ukrainian | 29 | 0.2% |
| Venezuelan | 9 | 0.1% |
| Welsh | 126 | 0.9% |
| Yugoslavian | 8 | 0.1% | View All 90 Rows |
Immigrants in Lake Forest Park
The most numerous immigrant groups reported in Lake Forest Park came from Asia (774 | 5.8%), Eastern Asia (573 | 4.3%), China (372 | 2.8%), Europe (359 | 2.7%), and Africa (219 | 1.6%), together accounting for 17.1% of all Lake Forest Park residents.
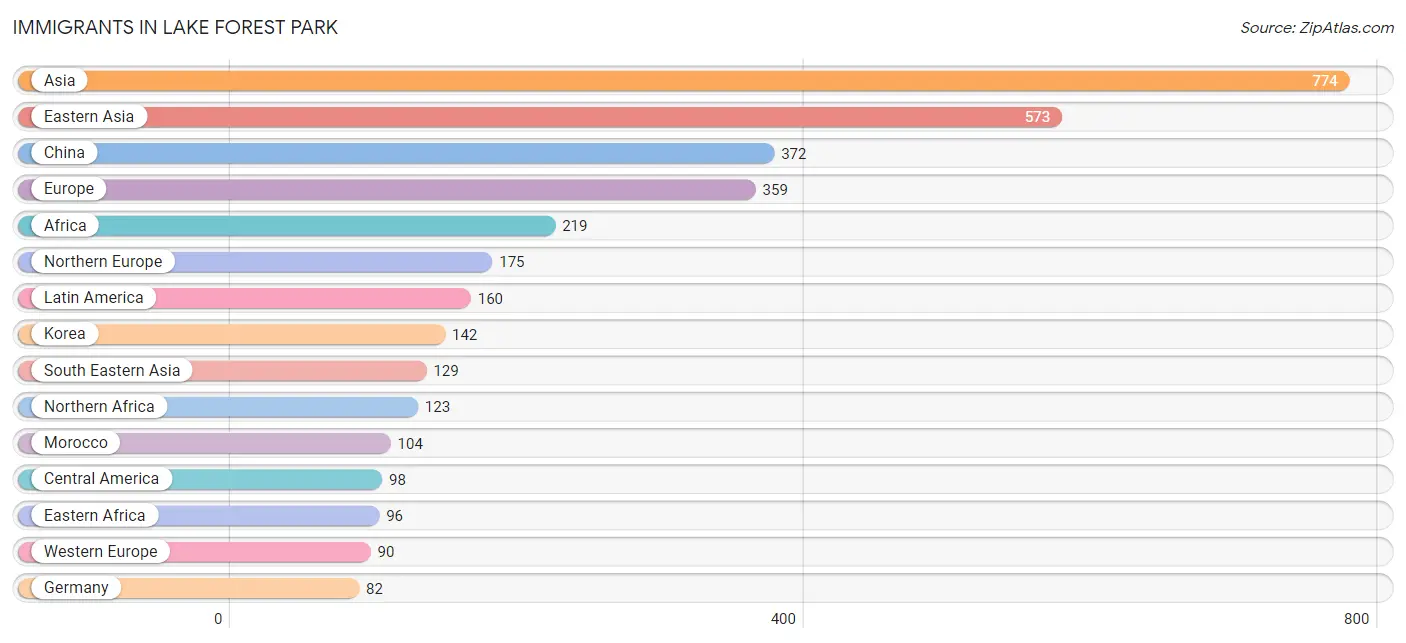
| Immigration Origin | # Population | % Population |
| Africa | 219 | 1.6% |
| Asia | 774 | 5.8% |
| Australia | 27 | 0.2% |
| Belarus | 7 | 0.1% |
| Bosnia and Herzegovina | 11 | 0.1% |
| Brazil | 14 | 0.1% |
| Canada | 72 | 0.5% |
| Central America | 98 | 0.7% |
| Chile | 8 | 0.1% |
| China | 372 | 2.8% |
| Colombia | 8 | 0.1% |
| Eastern Africa | 96 | 0.7% |
| Eastern Asia | 573 | 4.3% |
| Eastern Europe | 59 | 0.4% |
| Egypt | 19 | 0.1% |
| England | 16 | 0.1% |
| Ethiopia | 45 | 0.3% |
| Europe | 359 | 2.7% |
| Germany | 82 | 0.6% |
| Guatemala | 69 | 0.5% |
| Hong Kong | 15 | 0.1% |
| India | 46 | 0.3% |
| Iran | 9 | 0.1% |
| Ireland | 34 | 0.3% |
| Japan | 59 | 0.4% |
| Korea | 142 | 1.1% |
| Laos | 11 | 0.1% |
| Latin America | 160 | 1.2% |
| Lebanon | 17 | 0.1% |
| Malaysia | 14 | 0.1% |
| Mexico | 24 | 0.2% |
| Morocco | 104 | 0.8% |
| Netherlands | 8 | 0.1% |
| North Macedonia | 16 | 0.1% |
| Northern Africa | 123 | 0.9% |
| Northern Europe | 175 | 1.3% |
| Norway | 24 | 0.2% |
| Oceania | 35 | 0.3% |
| Panama | 5 | 0.0% |
| Peru | 23 | 0.2% |
| Philippines | 32 | 0.2% |
| Poland | 5 | 0.0% |
| Portugal | 27 | 0.2% |
| Russia | 20 | 0.2% |
| Singapore | 23 | 0.2% |
| Somalia | 51 | 0.4% |
| South America | 62 | 0.5% |
| South Central Asia | 55 | 0.4% |
| South Eastern Asia | 129 | 1.0% |
| Southern Europe | 35 | 0.3% |
| Spain | 8 | 0.1% |
| Sweden | 37 | 0.3% |
| Taiwan | 41 | 0.3% |
| Thailand | 22 | 0.2% |
| Venezuela | 9 | 0.1% |
| Vietnam | 27 | 0.2% |
| Western Asia | 17 | 0.1% |
| Western Europe | 90 | 0.7% | View All 58 Rows |
Sex and Age in Lake Forest Park
Sex and Age in Lake Forest Park
The most populous age groups in Lake Forest Park are 30 to 34 Years (553 | 8.2%) for men and 45 to 49 Years (603 | 9.0%) for women.
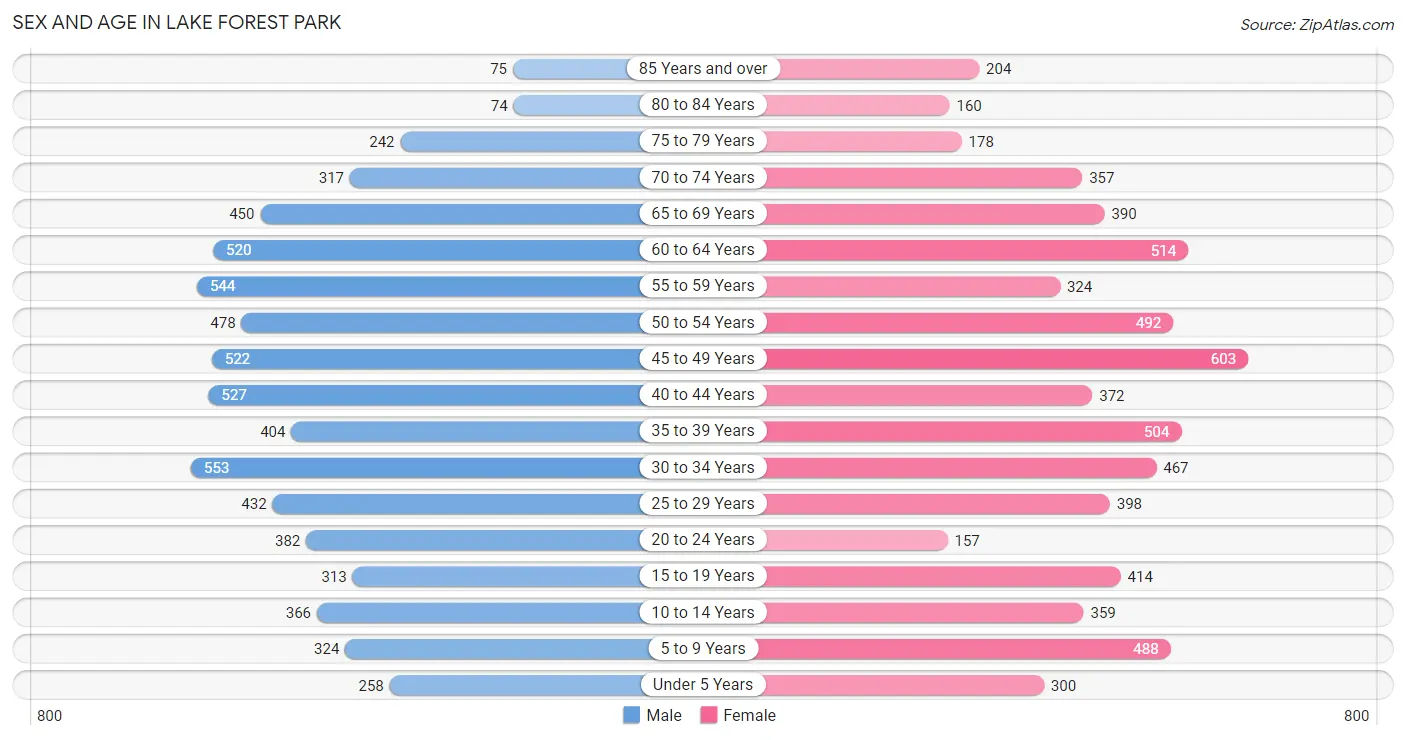
| Age Bracket | Male | Female |
| Under 5 Years | 258 (3.8%) | 300 (4.5%) |
| 5 to 9 Years | 324 (4.8%) | 488 (7.3%) |
| 10 to 14 Years | 366 (5.4%) | 359 (5.4%) |
| 15 to 19 Years | 313 (4.6%) | 414 (6.2%) |
| 20 to 24 Years | 382 (5.6%) | 157 (2.4%) |
| 25 to 29 Years | 432 (6.4%) | 398 (6.0%) |
| 30 to 34 Years | 553 (8.2%) | 467 (7.0%) |
| 35 to 39 Years | 404 (6.0%) | 504 (7.5%) |
| 40 to 44 Years | 527 (7.8%) | 372 (5.6%) |
| 45 to 49 Years | 522 (7.7%) | 603 (9.0%) |
| 50 to 54 Years | 478 (7.0%) | 492 (7.4%) |
| 55 to 59 Years | 544 (8.0%) | 324 (4.9%) |
| 60 to 64 Years | 520 (7.7%) | 514 (7.7%) |
| 65 to 69 Years | 450 (6.6%) | 390 (5.8%) |
| 70 to 74 Years | 317 (4.7%) | 357 (5.3%) |
| 75 to 79 Years | 242 (3.6%) | 178 (2.7%) |
| 80 to 84 Years | 74 (1.1%) | 160 (2.4%) |
| 85 Years and over | 75 (1.1%) | 204 (3.0%) |
| Total | 6,781 (100.0%) | 6,681 (100.0%) |
Families and Households in Lake Forest Park
Median Family Size in Lake Forest Park
The median family size in Lake Forest Park is 2.94 persons per family, with married-couple families (3,227 | 89.0%) accounting for the largest median family size of 2.96 persons per family. On the other hand, single female/mother families (252 | 7.0%) represent the smallest median family size with 2.76 persons per family.
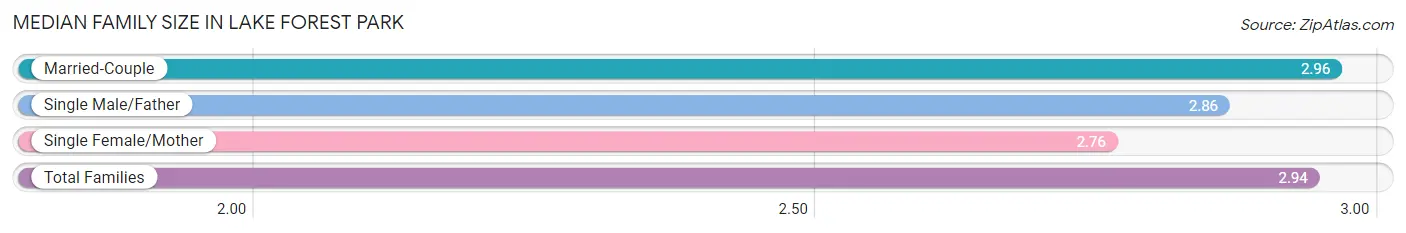
| Family Type | # Families | Family Size |
| Married-Couple | 3,227 (89.0%) | 2.96 |
| Single Male/Father | 146 (4.0%) | 2.86 |
| Single Female/Mother | 252 (7.0%) | 2.76 |
| Total Families | 3,625 (100.0%) | 2.94 |
Median Household Size in Lake Forest Park
The median household size in Lake Forest Park is 2.46 persons per household, with single male/father households (146 | 2.7%) accounting for the largest median household size of 3.34 persons per household. non-family households (1,823 | 33.5%) represent the smallest median household size with 1.32 persons per household.
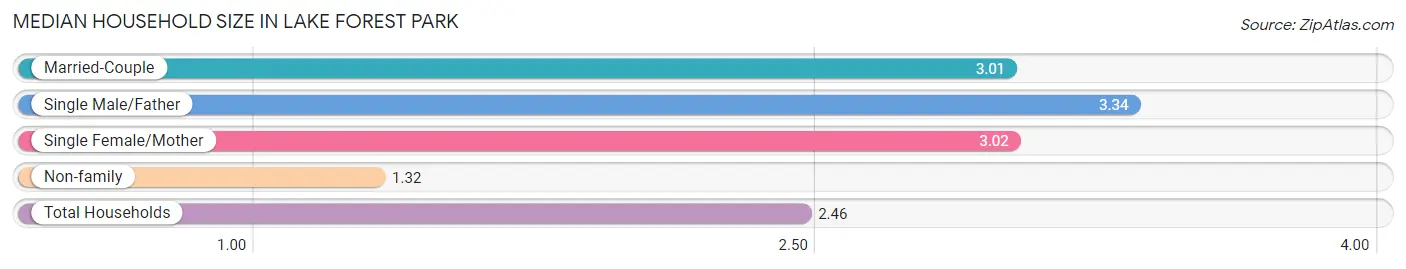
| Household Type | # Households | Household Size |
| Married-Couple | 3,227 (59.2%) | 3.01 |
| Single Male/Father | 146 (2.7%) | 3.34 |
| Single Female/Mother | 252 (4.6%) | 3.02 |
| Non-family | 1,823 (33.5%) | 1.32 |
| Total Households | 5,448 (100.0%) | 2.46 |
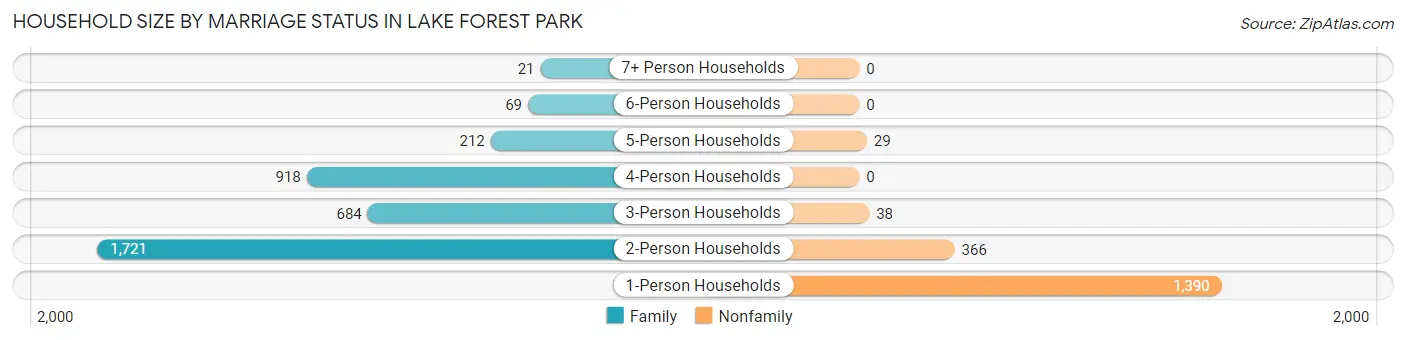
Household Size by Marriage Status in Lake Forest Park
Out of a total of 5,448 households in Lake Forest Park, 3,625 (66.5%) are family households, while 1,823 (33.5%) are nonfamily households. The most numerous type of family households are 2-person households, comprising 1,721, and the most common type of nonfamily households are 1-person households, comprising 1,390.
| Household Size | Family Households | Nonfamily Households |
| 1-Person Households | - | 1,390 (25.5%) |
| 2-Person Households | 1,721 (31.6%) | 366 (6.7%) |
| 3-Person Households | 684 (12.6%) | 38 (0.7%) |
| 4-Person Households | 918 (16.9%) | 0 (0.0%) |
| 5-Person Households | 212 (3.9%) | 29 (0.5%) |
| 6-Person Households | 69 (1.3%) | 0 (0.0%) |
| 7+ Person Households | 21 (0.4%) | 0 (0.0%) |
| Total | 3,625 (66.5%) | 1,823 (33.5%) |
Female Fertility in Lake Forest Park
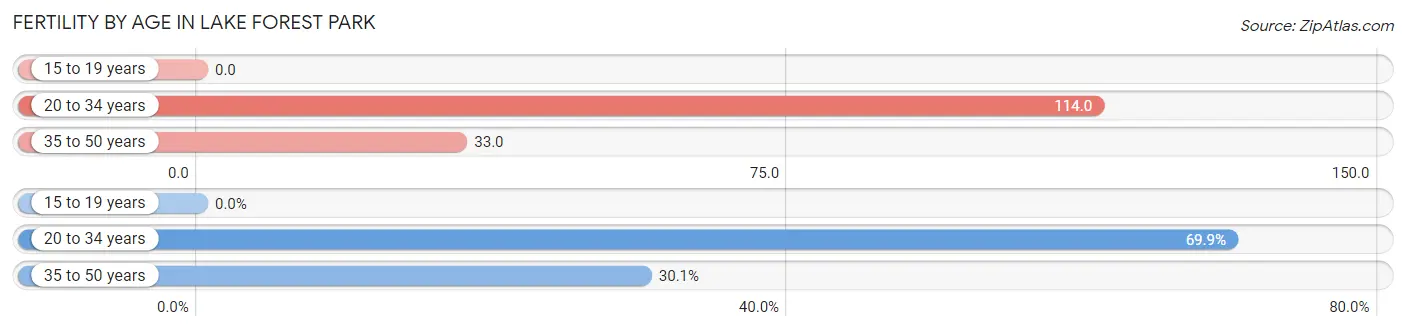
Fertility by Age in Lake Forest Park
Average fertility rate in Lake Forest Park is 56.0 births per 1,000 women. Women in the age bracket of 20 to 34 years have the highest fertility rate with 114.0 births per 1,000 women. Women in the age bracket of 20 to 34 years acount for 69.9% of all women with births.
| Age Bracket | Women with Births | Births / 1,000 Women |
| 15 to 19 years | 0 (0.0%) | 0.0 |
| 20 to 34 years | 116 (69.9%) | 114.0 |
| 35 to 50 years | 50 (30.1%) | 33.0 |
| Total | 166 (100.0%) | 56.0 |
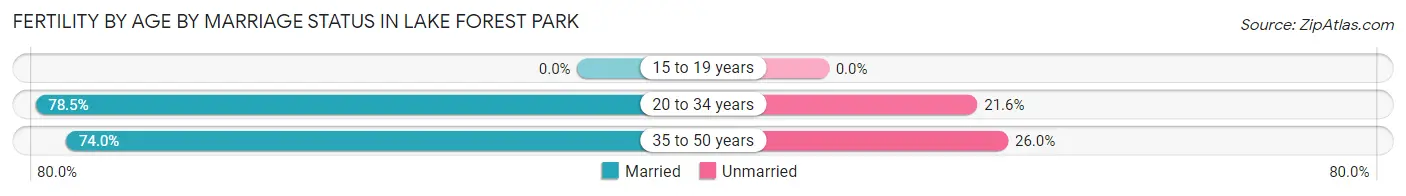
Fertility by Age by Marriage Status in Lake Forest Park
77.1% of women with births (166) in Lake Forest Park are married. The highest percentage of unmarried women with births falls into 35 to 50 years age bracket with 26.0% of them unmarried at the time of birth, while the lowest percentage of unmarried women with births belong to 20 to 34 years age bracket with 21.6% of them unmarried.
| Age Bracket | Married | Unmarried |
| 15 to 19 years | 0 (0.0%) | 0 (0.0%) |
| 20 to 34 years | 91 (78.4%) | 25 (21.5%) |
| 35 to 50 years | 37 (74.0%) | 13 (26.0%) |
| Total | 128 (77.1%) | 38 (22.9%) |
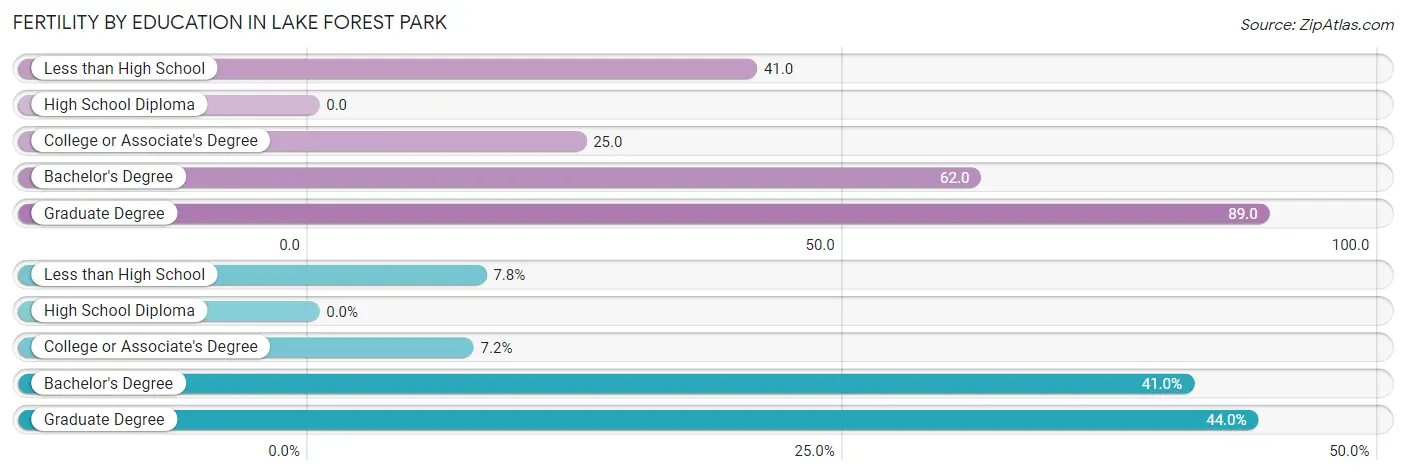
Fertility by Education in Lake Forest Park
| Educational Attainment | Women with Births | Births / 1,000 Women |
| Less than High School | 13 (7.8%) | 41.0 |
| High School Diploma | 0 (0.0%) | 0.0 |
| College or Associate's Degree | 12 (7.2%) | 25.0 |
| Bachelor's Degree | 68 (41.0%) | 62.0 |
| Graduate Degree | 73 (44.0%) | 89.0 |
| Total | 166 (100.0%) | 56.0 |
Fertility by Education by Marriage Status in Lake Forest Park
22.9% of women with births in Lake Forest Park are unmarried. Women with the educational attainment of bachelor's degree are most likely to be married with 100.0% of them married at childbirth, while women with the educational attainment of less than high school are least likely to be married with 100.0% of them unmarried at childbirth.
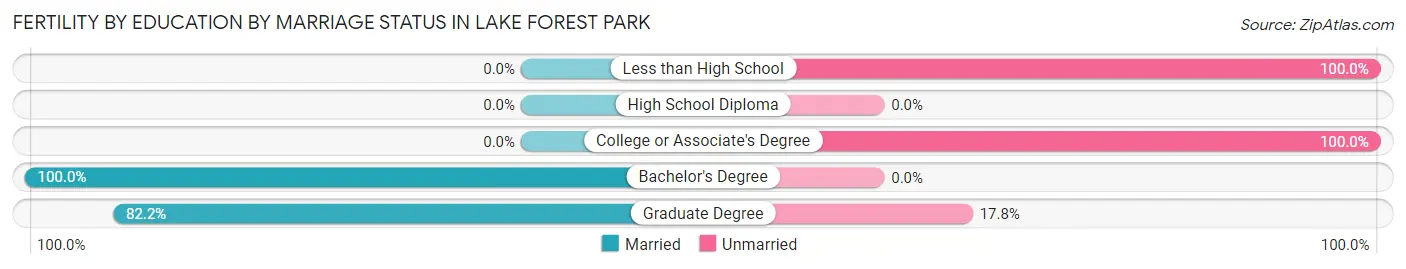
| Educational Attainment | Married | Unmarried |
| Less than High School | 0 (0.0%) | 13 (100.0%) |
| High School Diploma | 0 (0.0%) | 0 (0.0%) |
| College or Associate's Degree | 0 (0.0%) | 12 (100.0%) |
| Bachelor's Degree | 68 (100.0%) | 0 (0.0%) |
| Graduate Degree | 60 (82.2%) | 13 (17.8%) |
| Total | 128 (77.1%) | 38 (22.9%) |
Employment Characteristics in Lake Forest Park
Employment by Class of Employer in Lake Forest Park
Among the 7,296 employed individuals in Lake Forest Park, private company employees (4,589 | 62.9%), not-for-profit organizations (687 | 9.4%), and state government employees (528 | 7.2%) make up the most common classes of employment.
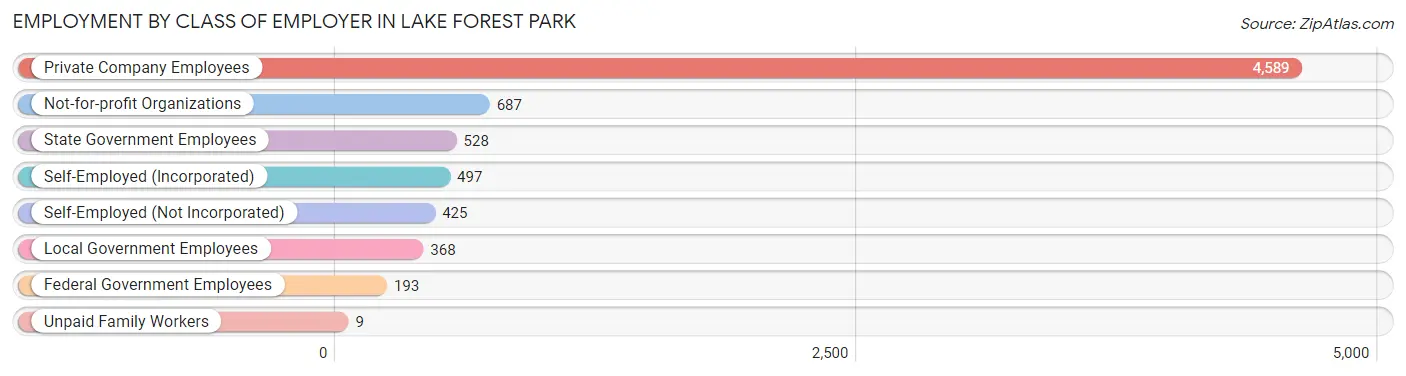
| Employer Class | # Employees | % Employees |
| Private Company Employees | 4,589 | 62.9% |
| Self-Employed (Incorporated) | 497 | 6.8% |
| Self-Employed (Not Incorporated) | 425 | 5.8% |
| Not-for-profit Organizations | 687 | 9.4% |
| Local Government Employees | 368 | 5.0% |
| State Government Employees | 528 | 7.2% |
| Federal Government Employees | 193 | 2.6% |
| Unpaid Family Workers | 9 | 0.1% |
| Total | 7,296 | 100.0% |
Employment Status by Age in Lake Forest Park
According to the labor force statistics for Lake Forest Park, out of the total population over 16 years of age (11,209), 68.7% or 7,701 individuals are in the labor force, with 2.9% or 223 of them unemployed. The age group with the highest labor force participation rate is 20 to 24 years, with 93.3% or 503 individuals in the labor force. Within the labor force, the 20 to 24 years age range has the highest percentage of unemployed individuals, with 16.9% or 85 of them being unemployed.
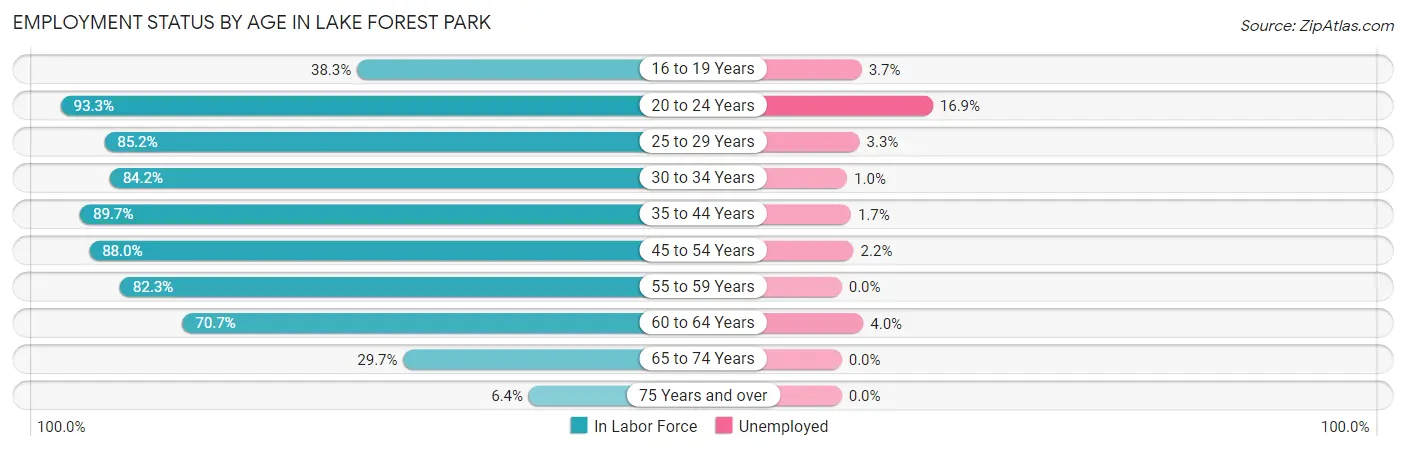
| Age Bracket | In Labor Force | Unemployed |
| 16 to 19 Years | 218 (38.3%) | 8 (3.7%) |
| 20 to 24 Years | 503 (93.3%) | 85 (16.9%) |
| 25 to 29 Years | 707 (85.2%) | 23 (3.3%) |
| 30 to 34 Years | 859 (84.2%) | 9 (1.0%) |
| 35 to 44 Years | 1,621 (89.7%) | 28 (1.7%) |
| 45 to 54 Years | 1,844 (88.0%) | 41 (2.2%) |
| 55 to 59 Years | 714 (82.3%) | 0 (0.0%) |
| 60 to 64 Years | 731 (70.7%) | 29 (4.0%) |
| 65 to 74 Years | 450 (29.7%) | 0 (0.0%) |
| 75 Years and over | 60 (6.4%) | 0 (0.0%) |
| Total | 7,701 (68.7%) | 223 (2.9%) |
Employment Status by Educational Attainment in Lake Forest Park
According to labor force statistics for Lake Forest Park, 84.6% of individuals (6,475) out of the total population between 25 and 64 years of age (7,654) are in the labor force, with 2.0% or 130 of them being unemployed. The group with the highest labor force participation rate are those with the educational attainment of bachelor's degree or higher, with 87.5% or 4,333 individuals in the labor force. Within the labor force, individuals with bachelor's degree or higher education have the highest percentage of unemployment, with 2.3% or 100 of them being unemployed.
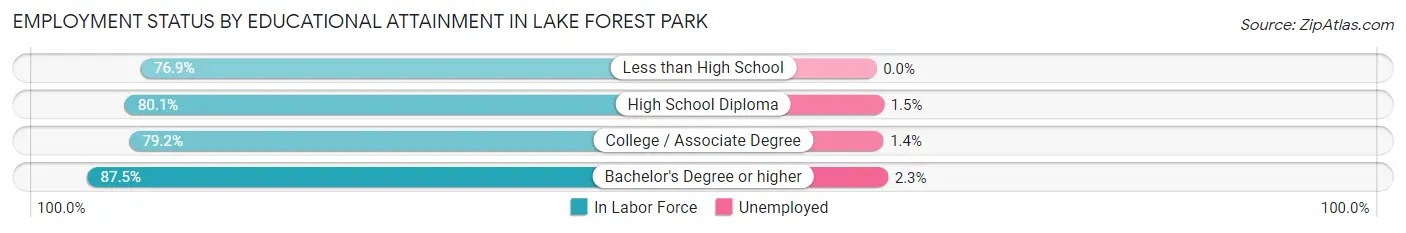
| Educational Attainment | In Labor Force | Unemployed |
| Less than High School | 166 (76.9%) | 0 (0.0%) |
| High School Diploma | 592 (80.1%) | 11 (1.5%) |
| College / Associate Degree | 1,384 (79.2%) | 24 (1.4%) |
| Bachelor's Degree or higher | 4,333 (87.5%) | 114 (2.3%) |
| Total | 6,475 (84.6%) | 153 (2.0%) |
Employment Occupations by Sex in Lake Forest Park
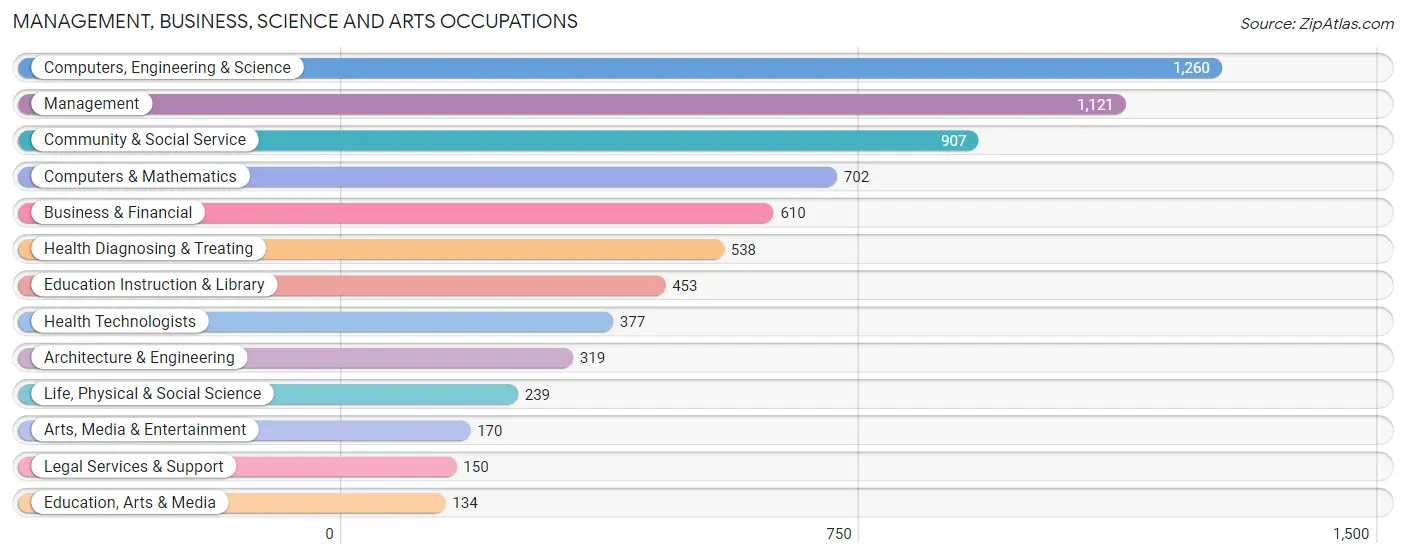
Management, Business, Science and Arts Occupations
The most common Management, Business, Science and Arts occupations in Lake Forest Park are Computers, Engineering & Science (1,260 | 16.8%), Management (1,121 | 15.0%), Community & Social Service (907 | 12.1%), Computers & Mathematics (702 | 9.4%), and Business & Financial (610 | 8.2%).
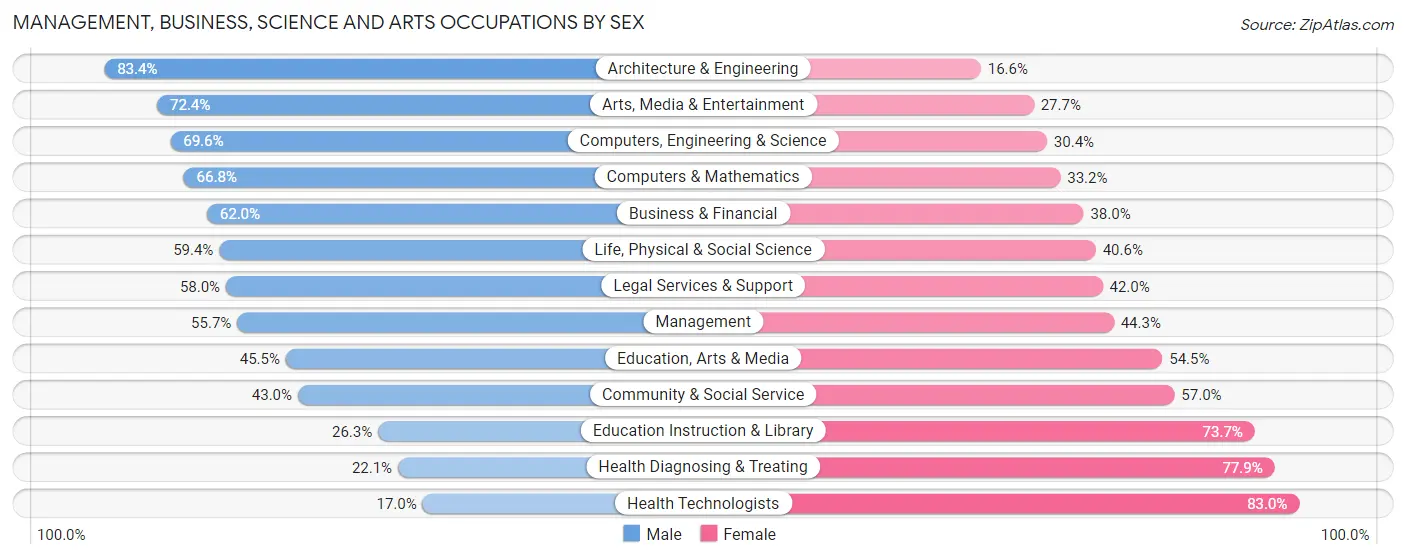
Management, Business, Science and Arts Occupations by Sex
Within the Management, Business, Science and Arts occupations in Lake Forest Park, the most male-oriented occupations are Architecture & Engineering (83.4%), Arts, Media & Entertainment (72.4%), and Computers, Engineering & Science (69.6%), while the most female-oriented occupations are Health Technologists (83.0%), Health Diagnosing & Treating (77.9%), and Education Instruction & Library (73.7%).
| Occupation | Male | Female |
| Management | 624 (55.7%) | 497 (44.3%) |
| Business & Financial | 378 (62.0%) | 232 (38.0%) |
| Computers, Engineering & Science | 877 (69.6%) | 383 (30.4%) |
| Computers & Mathematics | 469 (66.8%) | 233 (33.2%) |
| Architecture & Engineering | 266 (83.4%) | 53 (16.6%) |
| Life, Physical & Social Science | 142 (59.4%) | 97 (40.6%) |
| Community & Social Service | 390 (43.0%) | 517 (57.0%) |
| Education, Arts & Media | 61 (45.5%) | 73 (54.5%) |
| Legal Services & Support | 87 (58.0%) | 63 (42.0%) |
| Education Instruction & Library | 119 (26.3%) | 334 (73.7%) |
| Arts, Media & Entertainment | 123 (72.4%) | 47 (27.7%) |
| Health Diagnosing & Treating | 119 (22.1%) | 419 (77.9%) |
| Health Technologists | 64 (17.0%) | 313 (83.0%) |
| Total (Category) | 2,388 (53.8%) | 2,048 (46.2%) |
| Total (Overall) | 4,077 (54.5%) | 3,407 (45.5%) |
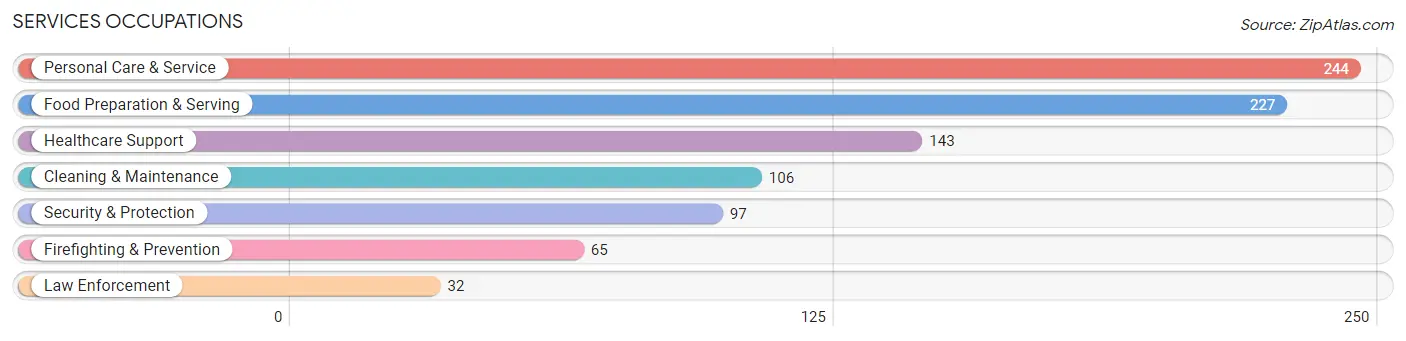
Services Occupations
The most common Services occupations in Lake Forest Park are Personal Care & Service (244 | 3.3%), Food Preparation & Serving (227 | 3.0%), Healthcare Support (143 | 1.9%), Cleaning & Maintenance (106 | 1.4%), and Security & Protection (97 | 1.3%).
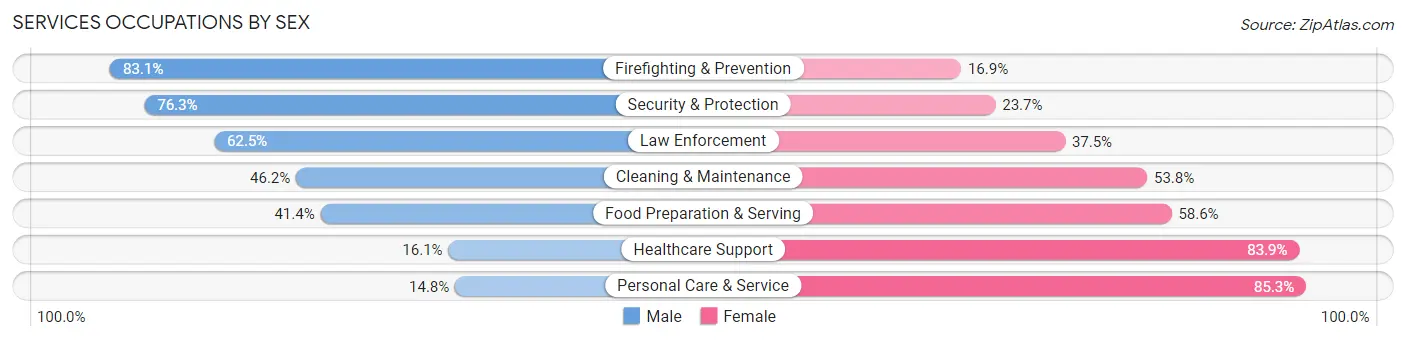
Services Occupations by Sex
Within the Services occupations in Lake Forest Park, the most male-oriented occupations are Firefighting & Prevention (83.1%), Security & Protection (76.3%), and Law Enforcement (62.5%), while the most female-oriented occupations are Personal Care & Service (85.3%), Healthcare Support (83.9%), and Food Preparation & Serving (58.6%).
| Occupation | Male | Female |
| Healthcare Support | 23 (16.1%) | 120 (83.9%) |
| Security & Protection | 74 (76.3%) | 23 (23.7%) |
| Firefighting & Prevention | 54 (83.1%) | 11 (16.9%) |
| Law Enforcement | 20 (62.5%) | 12 (37.5%) |
| Food Preparation & Serving | 94 (41.4%) | 133 (58.6%) |
| Cleaning & Maintenance | 49 (46.2%) | 57 (53.8%) |
| Personal Care & Service | 36 (14.7%) | 208 (85.3%) |
| Total (Category) | 276 (33.8%) | 541 (66.2%) |
| Total (Overall) | 4,077 (54.5%) | 3,407 (45.5%) |
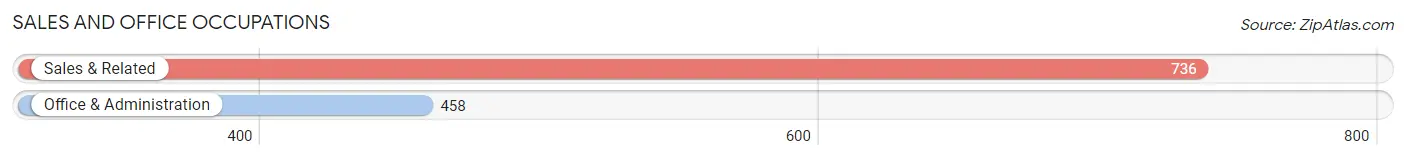
Sales and Office Occupations
The most common Sales and Office occupations in Lake Forest Park are Sales & Related (736 | 9.8%), and Office & Administration (458 | 6.1%).
Sales and Office Occupations by Sex
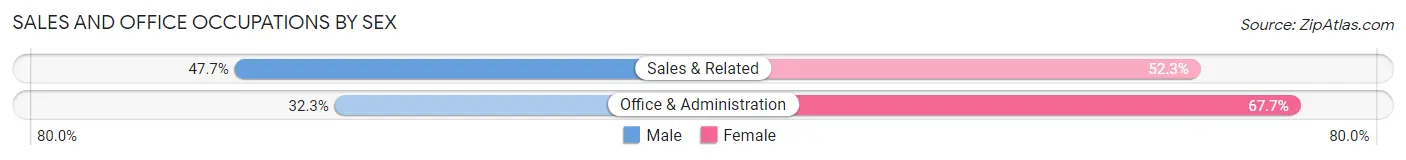
| Occupation | Male | Female |
| Sales & Related | 351 (47.7%) | 385 (52.3%) |
| Office & Administration | 148 (32.3%) | 310 (67.7%) |
| Total (Category) | 499 (41.8%) | 695 (58.2%) |
| Total (Overall) | 4,077 (54.5%) | 3,407 (45.5%) |
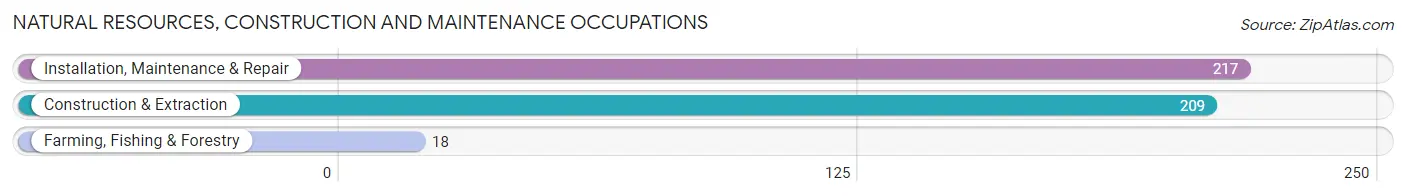
Natural Resources, Construction and Maintenance Occupations
The most common Natural Resources, Construction and Maintenance occupations in Lake Forest Park are Installation, Maintenance & Repair (217 | 2.9%), Construction & Extraction (209 | 2.8%), and Farming, Fishing & Forestry (18 | 0.2%).
Natural Resources, Construction and Maintenance Occupations by Sex
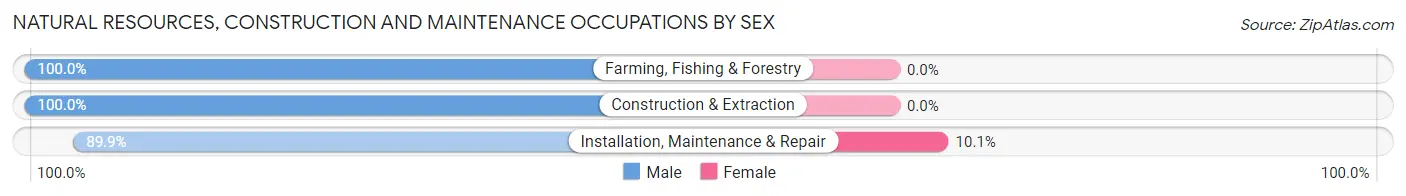
| Occupation | Male | Female |
| Farming, Fishing & Forestry | 18 (100.0%) | 0 (0.0%) |
| Construction & Extraction | 209 (100.0%) | 0 (0.0%) |
| Installation, Maintenance & Repair | 195 (89.9%) | 22 (10.1%) |
| Total (Category) | 422 (95.1%) | 22 (5.0%) |
| Total (Overall) | 4,077 (54.5%) | 3,407 (45.5%) |
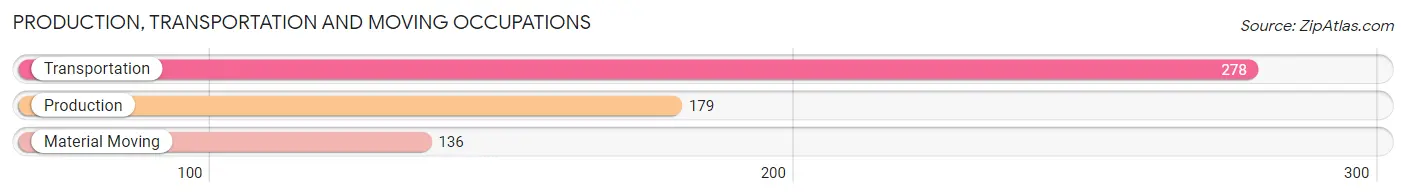
Production, Transportation and Moving Occupations
The most common Production, Transportation and Moving occupations in Lake Forest Park are Transportation (278 | 3.7%), Production (179 | 2.4%), and Material Moving (136 | 1.8%).
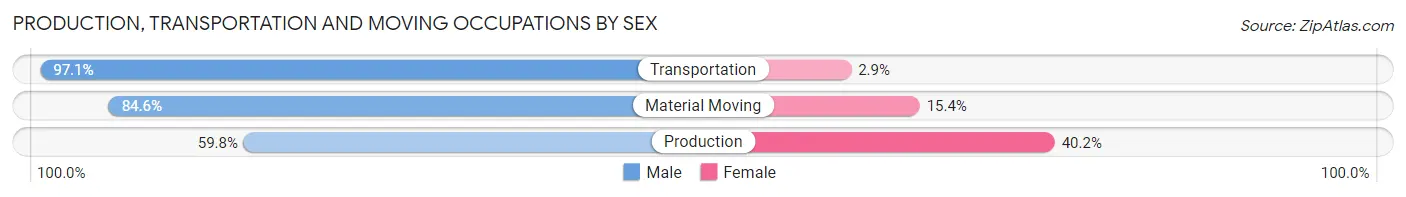
Production, Transportation and Moving Occupations by Sex
| Occupation | Male | Female |
| Production | 107 (59.8%) | 72 (40.2%) |
| Transportation | 270 (97.1%) | 8 (2.9%) |
| Material Moving | 115 (84.6%) | 21 (15.4%) |
| Total (Category) | 492 (83.0%) | 101 (17.0%) |
| Total (Overall) | 4,077 (54.5%) | 3,407 (45.5%) |
Employment Industries by Sex in Lake Forest Park
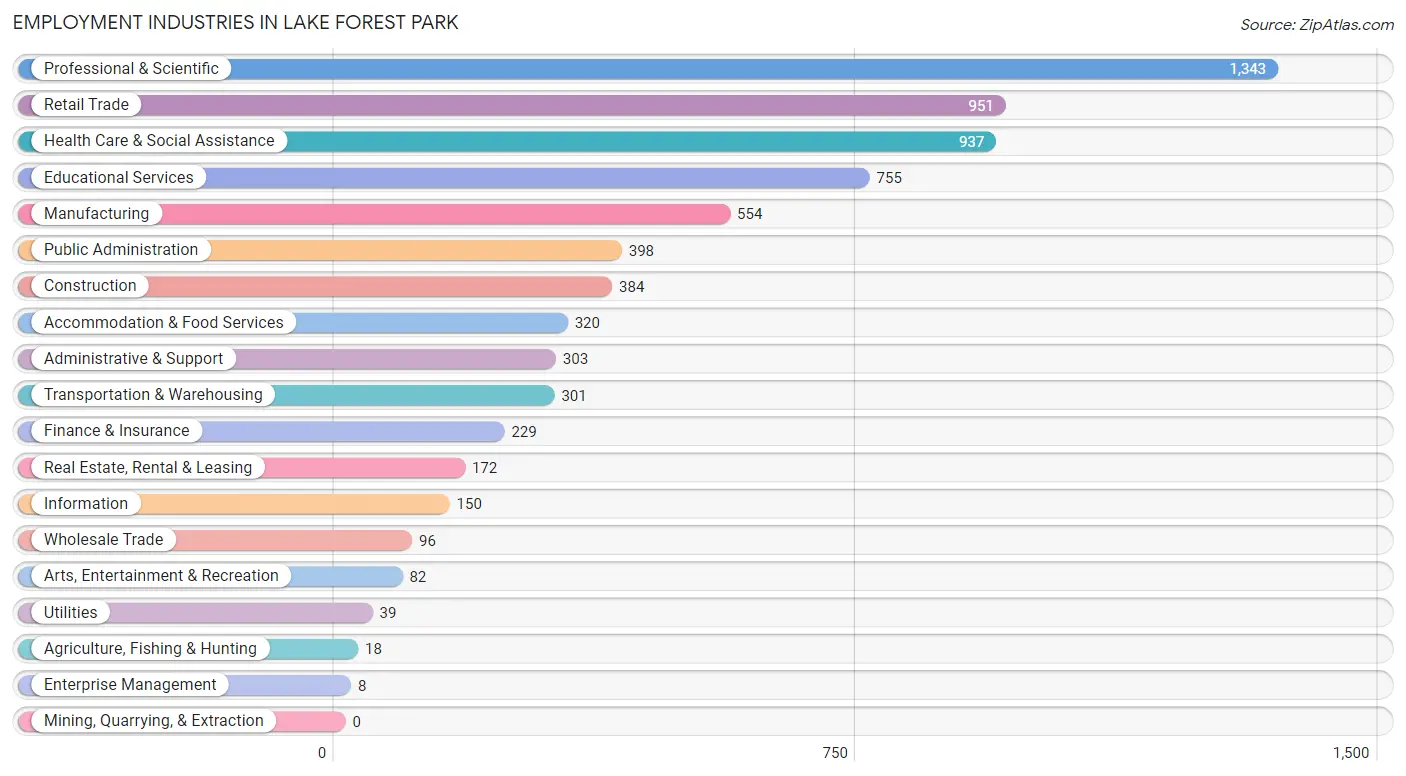
Employment Industries in Lake Forest Park
The major employment industries in Lake Forest Park include Professional & Scientific (1,343 | 17.9%), Retail Trade (951 | 12.7%), Health Care & Social Assistance (937 | 12.5%), Educational Services (755 | 10.1%), and Manufacturing (554 | 7.4%).
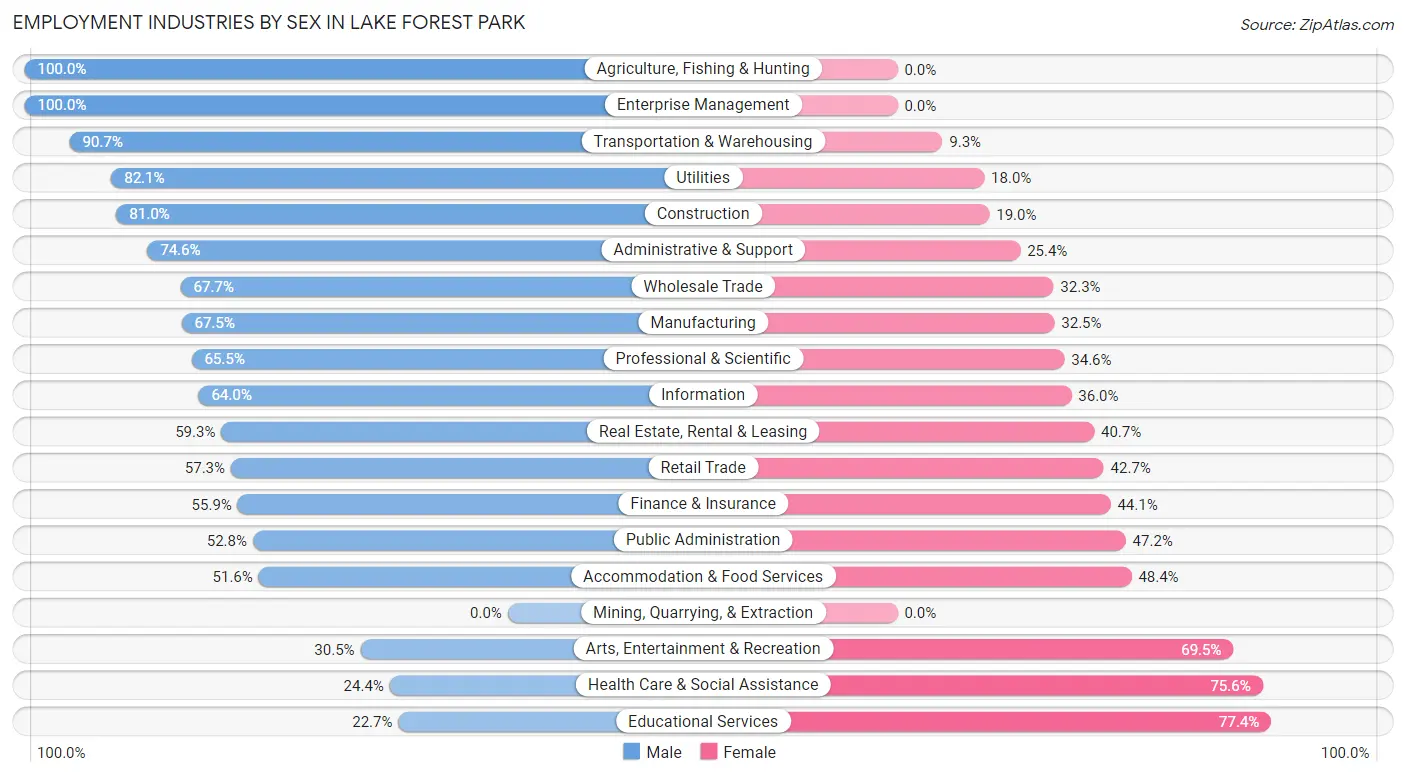
Employment Industries by Sex in Lake Forest Park
The Lake Forest Park industries that see more men than women are Agriculture, Fishing & Hunting (100.0%), Enterprise Management (100.0%), and Transportation & Warehousing (90.7%), whereas the industries that tend to have a higher number of women are Educational Services (77.3%), Health Care & Social Assistance (75.6%), and Arts, Entertainment & Recreation (69.5%).
| Industry | Male | Female |
| Agriculture, Fishing & Hunting | 18 (100.0%) | 0 (0.0%) |
| Mining, Quarrying, & Extraction | 0 (0.0%) | 0 (0.0%) |
| Construction | 311 (81.0%) | 73 (19.0%) |
| Manufacturing | 374 (67.5%) | 180 (32.5%) |
| Wholesale Trade | 65 (67.7%) | 31 (32.3%) |
| Retail Trade | 545 (57.3%) | 406 (42.7%) |
| Transportation & Warehousing | 273 (90.7%) | 28 (9.3%) |
| Utilities | 32 (82.1%) | 7 (17.9%) |
| Information | 96 (64.0%) | 54 (36.0%) |
| Finance & Insurance | 128 (55.9%) | 101 (44.1%) |
| Real Estate, Rental & Leasing | 102 (59.3%) | 70 (40.7%) |
| Professional & Scientific | 879 (65.4%) | 464 (34.5%) |
| Enterprise Management | 8 (100.0%) | 0 (0.0%) |
| Administrative & Support | 226 (74.6%) | 77 (25.4%) |
| Educational Services | 171 (22.7%) | 584 (77.3%) |
| Health Care & Social Assistance | 229 (24.4%) | 708 (75.6%) |
| Arts, Entertainment & Recreation | 25 (30.5%) | 57 (69.5%) |
| Accommodation & Food Services | 165 (51.6%) | 155 (48.4%) |
| Public Administration | 210 (52.8%) | 188 (47.2%) |
| Total | 4,077 (54.5%) | 3,407 (45.5%) |
Education in Lake Forest Park
School Enrollment in Lake Forest Park
The most common levels of schooling among the 2,582 students in Lake Forest Park are middle school (604 | 23.4%), high school (586 | 22.7%), and elementary school (509 | 19.7%).
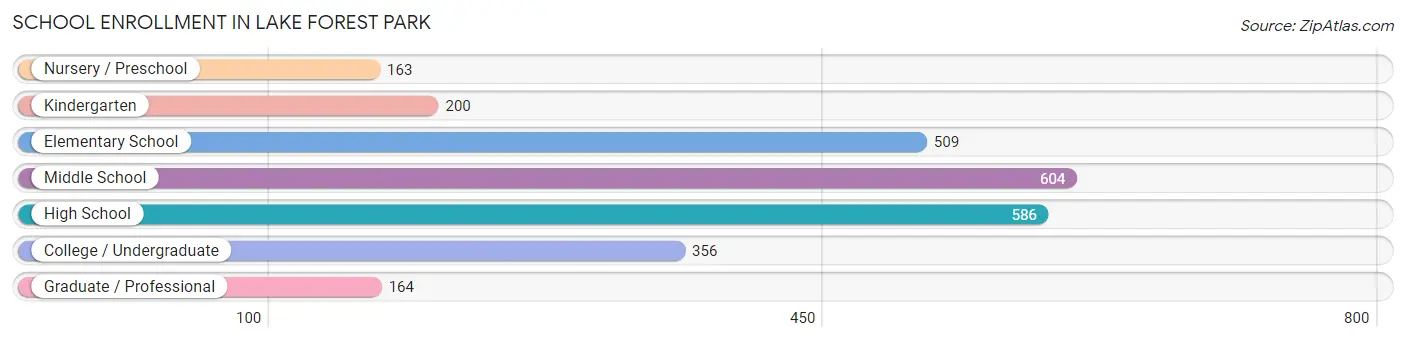
| School Level | # Students | % Students |
| Nursery / Preschool | 163 | 6.3% |
| Kindergarten | 200 | 7.7% |
| Elementary School | 509 | 19.7% |
| Middle School | 604 | 23.4% |
| High School | 586 | 22.7% |
| College / Undergraduate | 356 | 13.8% |
| Graduate / Professional | 164 | 6.4% |
| Total | 2,582 | 100.0% |
School Enrollment by Age by Funding Source in Lake Forest Park
Out of a total of 2,582 students who are enrolled in schools in Lake Forest Park, 599 (23.2%) attend a private institution, while the remaining 1,983 (76.8%) are enrolled in public schools. The age group of 3 to 4 year olds has the highest likelihood of being enrolled in private schools, with 65 (100.0% in the age bracket) enrolled. Conversely, the age group of 25 to 34 year olds has the lowest likelihood of being enrolled in a private school, with 96 (100.0% in the age bracket) attending a public institution.
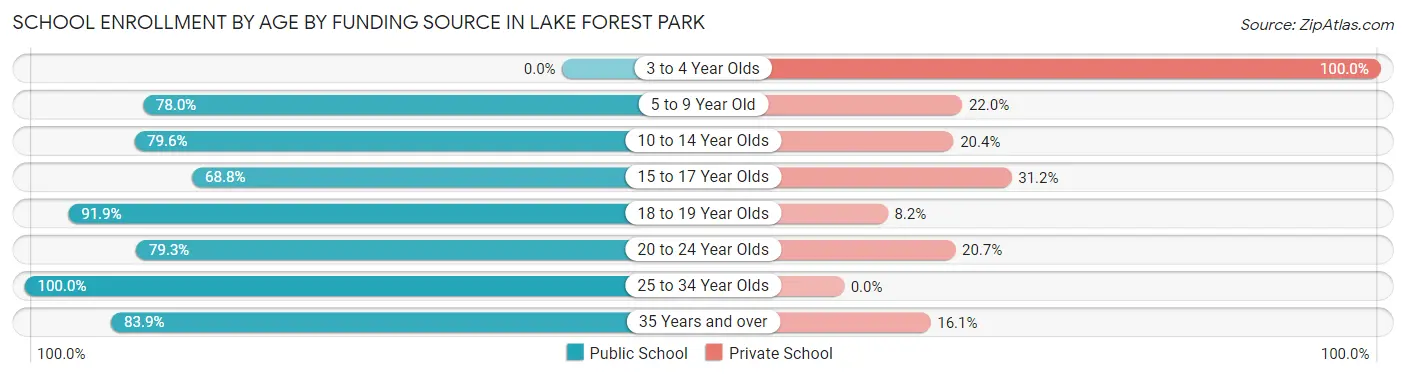
| Age Bracket | Public School | Private School |
| 3 to 4 Year Olds | 0 (0.0%) | 65 (100.0%) |
| 5 to 9 Year Old | 580 (78.0%) | 164 (22.0%) |
| 10 to 14 Year Olds | 577 (79.6%) | 148 (20.4%) |
| 15 to 17 Year Olds | 326 (68.8%) | 148 (31.2%) |
| 18 to 19 Year Olds | 124 (91.8%) | 11 (8.2%) |
| 20 to 24 Year Olds | 149 (79.3%) | 39 (20.7%) |
| 25 to 34 Year Olds | 96 (100.0%) | 0 (0.0%) |
| 35 Years and over | 130 (83.9%) | 25 (16.1%) |
| Total | 1,983 (76.8%) | 599 (23.2%) |
Educational Attainment by Field of Study in Lake Forest Park
Business (882 | 12.1%), bio, nature & agricultural (696 | 9.6%), science & technology (658 | 9.0%), education (647 | 8.9%), and engineering (635 | 8.7%) are the most common fields of study among 7,284 individuals in Lake Forest Park who have obtained a bachelor's degree or higher.
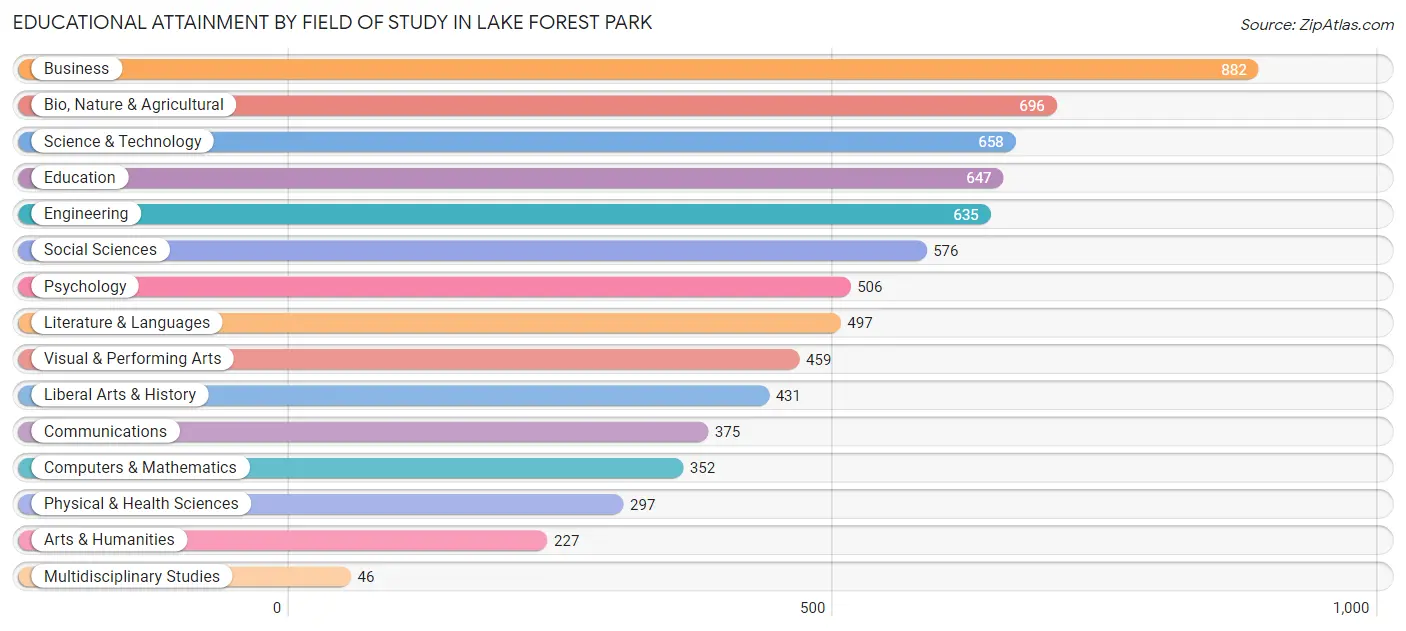
| Field of Study | # Graduates | % Graduates |
| Computers & Mathematics | 352 | 4.8% |
| Bio, Nature & Agricultural | 696 | 9.6% |
| Physical & Health Sciences | 297 | 4.1% |
| Psychology | 506 | 7.0% |
| Social Sciences | 576 | 7.9% |
| Engineering | 635 | 8.7% |
| Multidisciplinary Studies | 46 | 0.6% |
| Science & Technology | 658 | 9.0% |
| Business | 882 | 12.1% |
| Education | 647 | 8.9% |
| Literature & Languages | 497 | 6.8% |
| Liberal Arts & History | 431 | 5.9% |
| Visual & Performing Arts | 459 | 6.3% |
| Communications | 375 | 5.1% |
| Arts & Humanities | 227 | 3.1% |
| Total | 7,284 | 100.0% |
Transportation & Commute in Lake Forest Park
Vehicle Availability by Sex in Lake Forest Park
The most prevalent vehicle ownership categories in Lake Forest Park are males with 2 vehicles (1,771, accounting for 44.6%) and females with 2 vehicles (1,406, making up 53.3%).
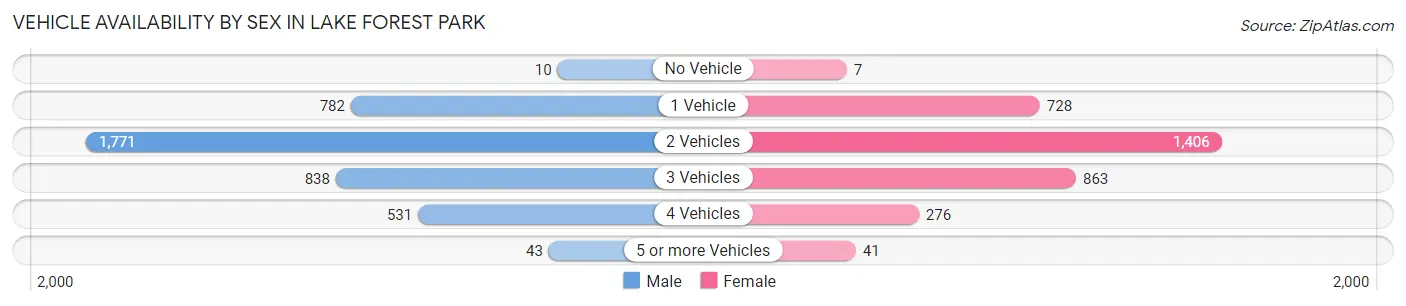
| Vehicles Available | Male | Female |
| No Vehicle | 10 (0.3%) | 7 (0.2%) |
| 1 Vehicle | 782 (19.7%) | 728 (21.9%) |
| 2 Vehicles | 1,771 (44.6%) | 1,406 (42.3%) |
| 3 Vehicles | 838 (21.1%) | 863 (26.0%) |
| 4 Vehicles | 531 (13.4%) | 276 (8.3%) |
| 5 or more Vehicles | 43 (1.1%) | 41 (1.2%) |
| Total | 3,975 (100.0%) | 3,321 (100.0%) |
Commute Time in Lake Forest Park
The most frequently occuring commute durations in Lake Forest Park are 30 to 34 minutes (1,092 commuters, 19.5%), 20 to 24 minutes (968 commuters, 17.3%), and 45 to 59 minutes (772 commuters, 13.8%).
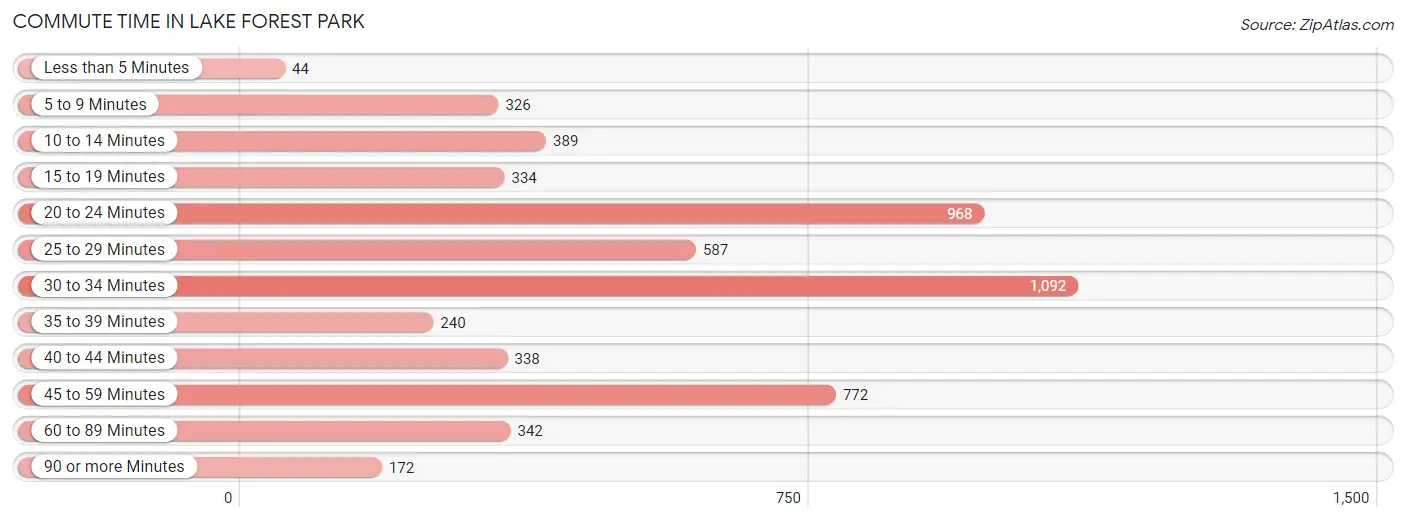
| Commute Time | # Commuters | % Commuters |
| Less than 5 Minutes | 44 | 0.8% |
| 5 to 9 Minutes | 326 | 5.8% |
| 10 to 14 Minutes | 389 | 6.9% |
| 15 to 19 Minutes | 334 | 6.0% |
| 20 to 24 Minutes | 968 | 17.3% |
| 25 to 29 Minutes | 587 | 10.5% |
| 30 to 34 Minutes | 1,092 | 19.5% |
| 35 to 39 Minutes | 240 | 4.3% |
| 40 to 44 Minutes | 338 | 6.0% |
| 45 to 59 Minutes | 772 | 13.8% |
| 60 to 89 Minutes | 342 | 6.1% |
| 90 or more Minutes | 172 | 3.1% |
Commute Time by Sex in Lake Forest Park
The most common commute times in Lake Forest Park are 20 to 24 minutes (628 commuters, 20.4%) for males and 30 to 34 minutes (591 commuters, 23.4%) for females.
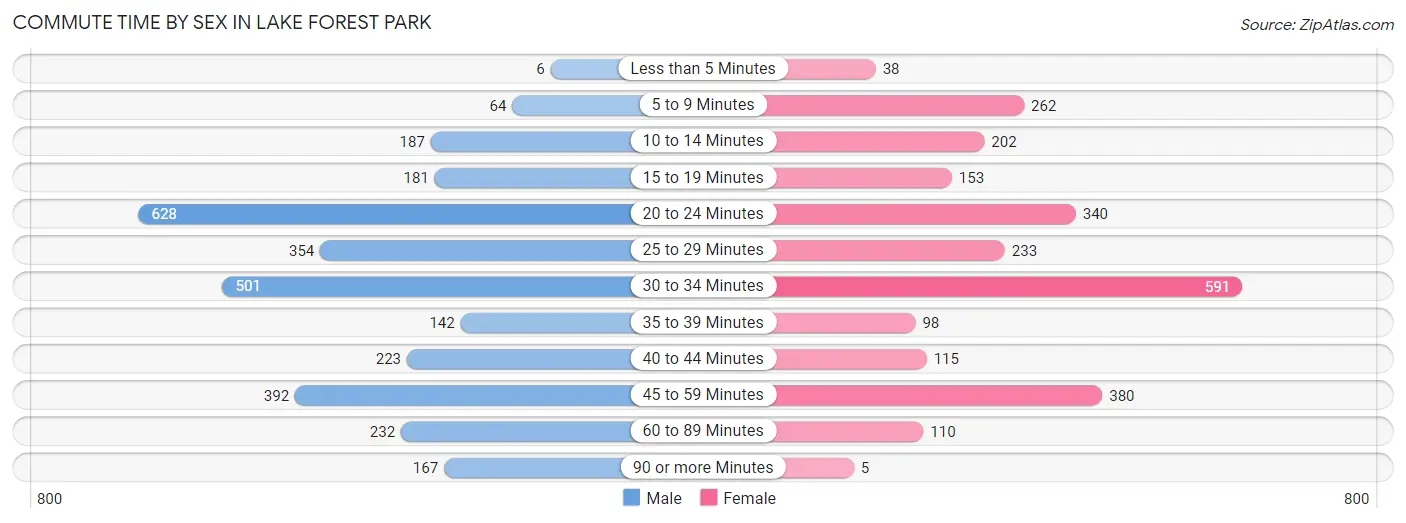
| Commute Time | Male | Female |
| Less than 5 Minutes | 6 (0.2%) | 38 (1.5%) |
| 5 to 9 Minutes | 64 (2.1%) | 262 (10.4%) |
| 10 to 14 Minutes | 187 (6.1%) | 202 (8.0%) |
| 15 to 19 Minutes | 181 (5.9%) | 153 (6.0%) |
| 20 to 24 Minutes | 628 (20.4%) | 340 (13.5%) |
| 25 to 29 Minutes | 354 (11.5%) | 233 (9.2%) |
| 30 to 34 Minutes | 501 (16.3%) | 591 (23.4%) |
| 35 to 39 Minutes | 142 (4.6%) | 98 (3.9%) |
| 40 to 44 Minutes | 223 (7.2%) | 115 (4.5%) |
| 45 to 59 Minutes | 392 (12.7%) | 380 (15.0%) |
| 60 to 89 Minutes | 232 (7.5%) | 110 (4.3%) |
| 90 or more Minutes | 167 (5.4%) | 5 (0.2%) |
Time of Departure to Work by Sex in Lake Forest Park
The most frequent times of departure to work in Lake Forest Park are 6:00 AM to 6:29 AM (385, 12.5%) for males and 7:00 AM to 7:29 AM (514, 20.3%) for females.
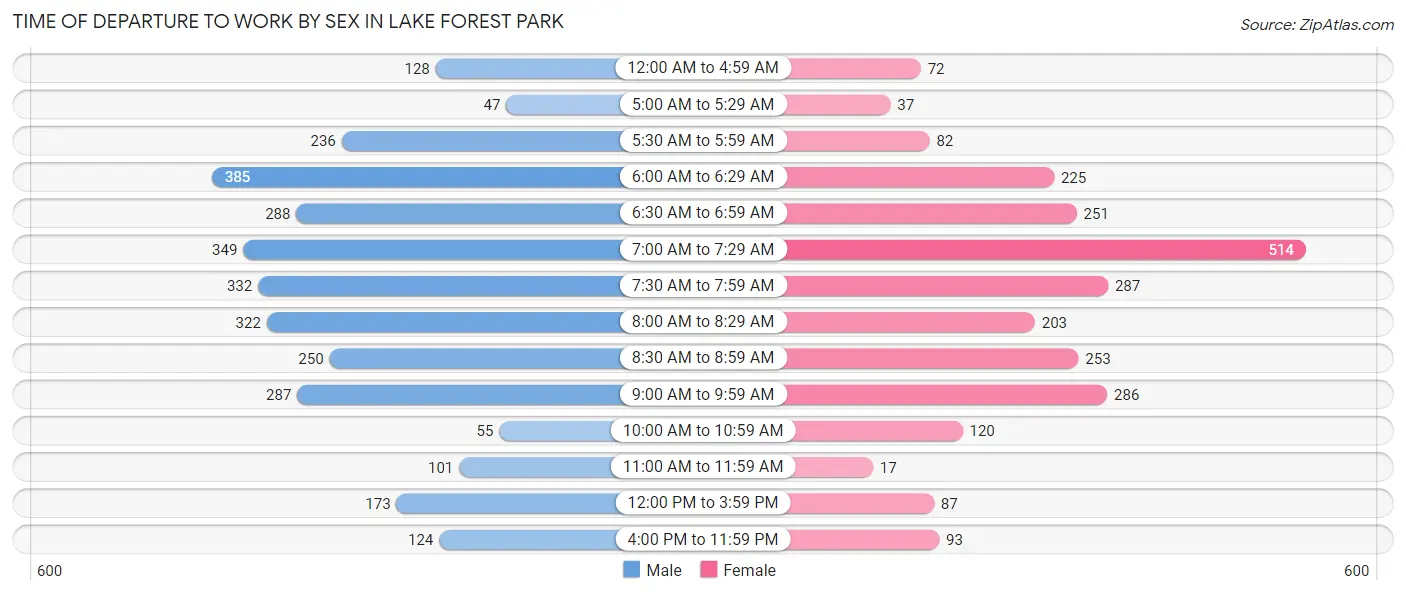
| Time of Departure | Male | Female |
| 12:00 AM to 4:59 AM | 128 (4.2%) | 72 (2.9%) |
| 5:00 AM to 5:29 AM | 47 (1.5%) | 37 (1.5%) |
| 5:30 AM to 5:59 AM | 236 (7.7%) | 82 (3.2%) |
| 6:00 AM to 6:29 AM | 385 (12.5%) | 225 (8.9%) |
| 6:30 AM to 6:59 AM | 288 (9.4%) | 251 (9.9%) |
| 7:00 AM to 7:29 AM | 349 (11.3%) | 514 (20.3%) |
| 7:30 AM to 7:59 AM | 332 (10.8%) | 287 (11.4%) |
| 8:00 AM to 8:29 AM | 322 (10.5%) | 203 (8.0%) |
| 8:30 AM to 8:59 AM | 250 (8.1%) | 253 (10.0%) |
| 9:00 AM to 9:59 AM | 287 (9.3%) | 286 (11.3%) |
| 10:00 AM to 10:59 AM | 55 (1.8%) | 120 (4.8%) |
| 11:00 AM to 11:59 AM | 101 (3.3%) | 17 (0.7%) |
| 12:00 PM to 3:59 PM | 173 (5.6%) | 87 (3.4%) |
| 4:00 PM to 11:59 PM | 124 (4.0%) | 93 (3.7%) |
| Total | 3,077 (100.0%) | 2,527 (100.0%) |
Housing Occupancy in Lake Forest Park
Occupancy by Ownership in Lake Forest Park
Of the total 5,448 dwellings in Lake Forest Park, owner-occupied units account for 4,343 (79.7%), while renter-occupied units make up 1,105 (20.3%).
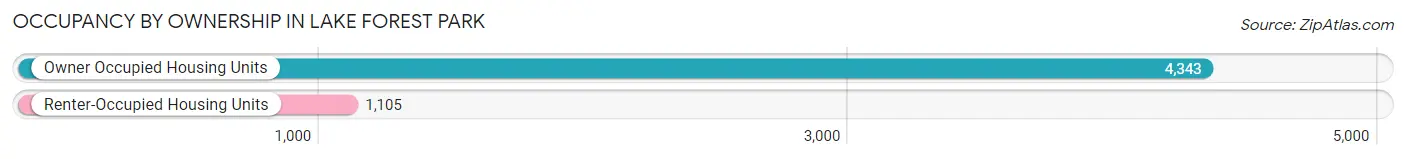
| Occupancy | # Housing Units | % Housing Units |
| Owner Occupied Housing Units | 4,343 | 79.7% |
| Renter-Occupied Housing Units | 1,105 | 20.3% |
| Total Occupied Housing Units | 5,448 | 100.0% |
Occupancy by Household Size in Lake Forest Park
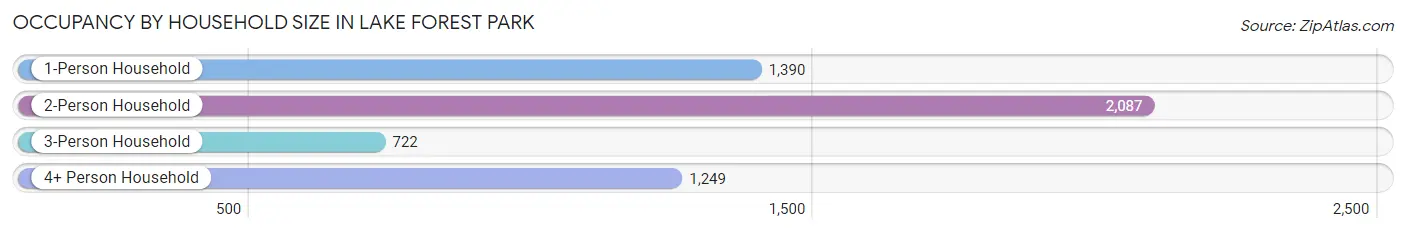
| Household Size | # Housing Units | % Housing Units |
| 1-Person Household | 1,390 | 25.5% |
| 2-Person Household | 2,087 | 38.3% |
| 3-Person Household | 722 | 13.3% |
| 4+ Person Household | 1,249 | 22.9% |
| Total Housing Units | 5,448 | 100.0% |
Occupancy by Ownership by Household Size in Lake Forest Park
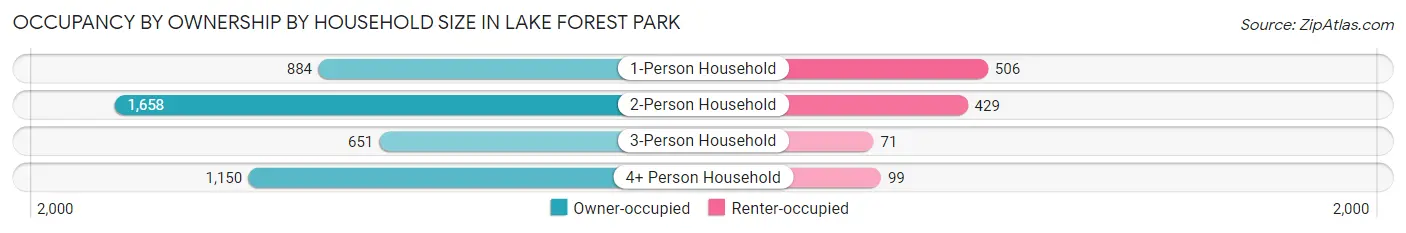
| Household Size | Owner-occupied | Renter-occupied |
| 1-Person Household | 884 (63.6%) | 506 (36.4%) |
| 2-Person Household | 1,658 (79.4%) | 429 (20.6%) |
| 3-Person Household | 651 (90.2%) | 71 (9.8%) |
| 4+ Person Household | 1,150 (92.1%) | 99 (7.9%) |
| Total Housing Units | 4,343 (79.7%) | 1,105 (20.3%) |
Occupancy by Educational Attainment in Lake Forest Park
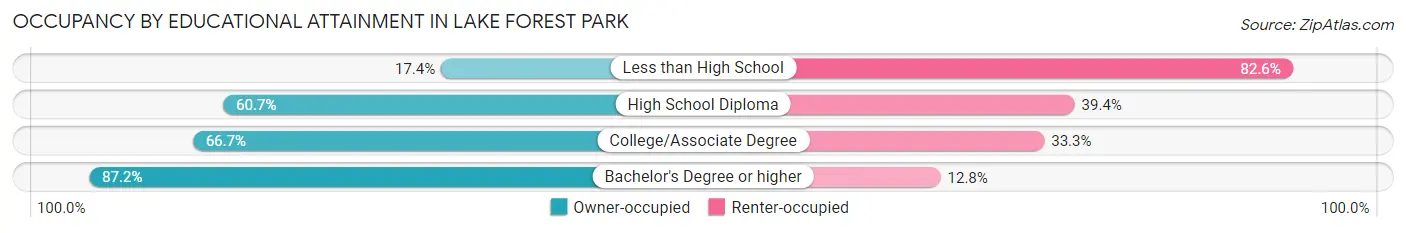
| Household Size | Owner-occupied | Renter-occupied |
| Less than High School | 15 (17.4%) | 71 (82.6%) |
| High School Diploma | 188 (60.7%) | 122 (39.4%) |
| College/Associate Degree | 864 (66.7%) | 432 (33.3%) |
| Bachelor's Degree or higher | 3,276 (87.2%) | 480 (12.8%) |
Occupancy by Age of Householder in Lake Forest Park
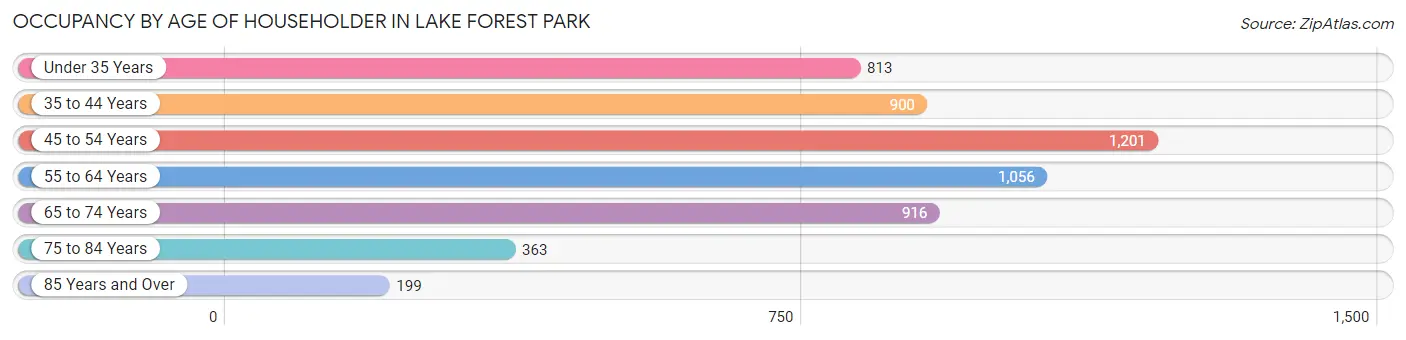
| Age Bracket | # Households | % Households |
| Under 35 Years | 813 | 14.9% |
| 35 to 44 Years | 900 | 16.5% |
| 45 to 54 Years | 1,201 | 22.0% |
| 55 to 64 Years | 1,056 | 19.4% |
| 65 to 74 Years | 916 | 16.8% |
| 75 to 84 Years | 363 | 6.7% |
| 85 Years and Over | 199 | 3.6% |
| Total | 5,448 | 100.0% |
Housing Finances in Lake Forest Park
Median Income by Occupancy in Lake Forest Park
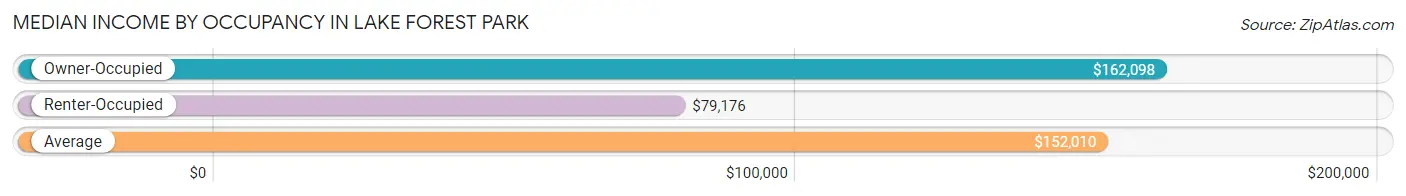
| Occupancy Type | # Households | Median Income |
| Owner-Occupied | 4,343 (79.7%) | $162,098 |
| Renter-Occupied | 1,105 (20.3%) | $79,176 |
| Average | 5,448 (100.0%) | $152,010 |
Occupancy by Householder Income Bracket in Lake Forest Park
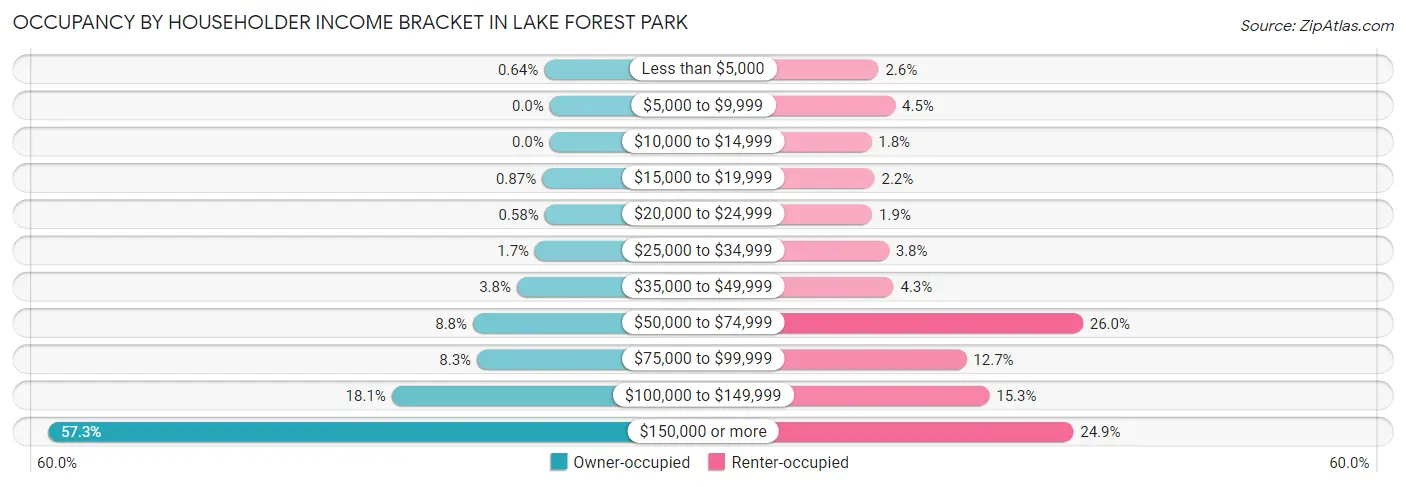
| Income Bracket | Owner-occupied | Renter-occupied |
| Less than $5,000 | 28 (0.6%) | 29 (2.6%) |
| $5,000 to $9,999 | 0 (0.0%) | 50 (4.5%) |
| $10,000 to $14,999 | 0 (0.0%) | 20 (1.8%) |
| $15,000 to $19,999 | 38 (0.9%) | 24 (2.2%) |
| $20,000 to $24,999 | 25 (0.6%) | 21 (1.9%) |
| $25,000 to $34,999 | 73 (1.7%) | 42 (3.8%) |
| $35,000 to $49,999 | 163 (3.7%) | 48 (4.3%) |
| $50,000 to $74,999 | 381 (8.8%) | 287 (26.0%) |
| $75,000 to $99,999 | 361 (8.3%) | 140 (12.7%) |
| $100,000 to $149,999 | 784 (18.0%) | 169 (15.3%) |
| $150,000 or more | 2,490 (57.3%) | 275 (24.9%) |
| Total | 4,343 (100.0%) | 1,105 (100.0%) |
Monthly Housing Cost Tiers in Lake Forest Park
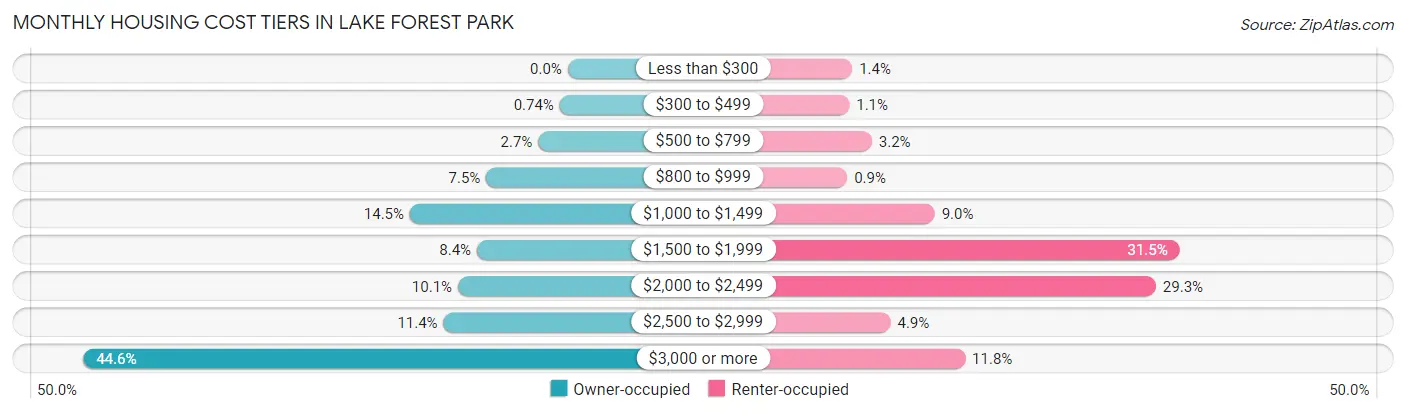
| Monthly Cost | Owner-occupied | Renter-occupied |
| Less than $300 | 0 (0.0%) | 15 (1.4%) |
| $300 to $499 | 32 (0.7%) | 12 (1.1%) |
| $500 to $799 | 118 (2.7%) | 35 (3.2%) |
| $800 to $999 | 326 (7.5%) | 10 (0.9%) |
| $1,000 to $1,499 | 631 (14.5%) | 99 (9.0%) |
| $1,500 to $1,999 | 363 (8.4%) | 348 (31.5%) |
| $2,000 to $2,499 | 439 (10.1%) | 324 (29.3%) |
| $2,500 to $2,999 | 497 (11.4%) | 54 (4.9%) |
| $3,000 or more | 1,937 (44.6%) | 130 (11.8%) |
| Total | 4,343 (100.0%) | 1,105 (100.0%) |
Physical Housing Characteristics in Lake Forest Park
Housing Structures in Lake Forest Park
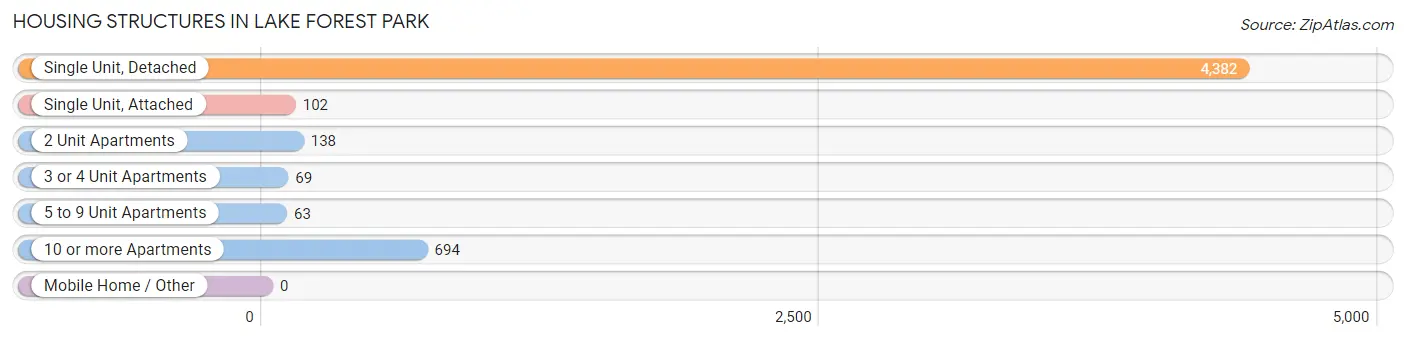
| Structure Type | # Housing Units | % Housing Units |
| Single Unit, Detached | 4,382 | 80.4% |
| Single Unit, Attached | 102 | 1.9% |
| 2 Unit Apartments | 138 | 2.5% |
| 3 or 4 Unit Apartments | 69 | 1.3% |
| 5 to 9 Unit Apartments | 63 | 1.2% |
| 10 or more Apartments | 694 | 12.7% |
| Mobile Home / Other | 0 | 0.0% |
| Total | 5,448 | 100.0% |
Housing Structures by Occupancy in Lake Forest Park
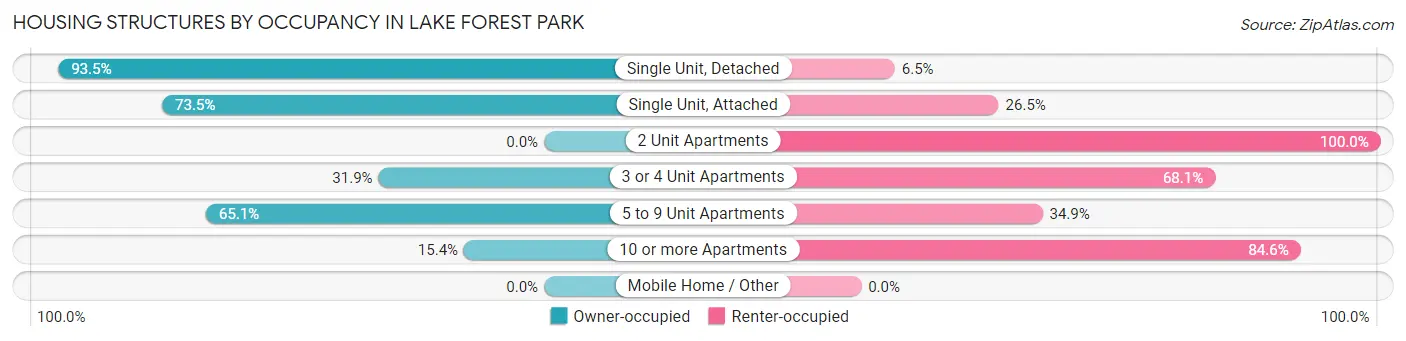
| Structure Type | Owner-occupied | Renter-occupied |
| Single Unit, Detached | 4,098 (93.5%) | 284 (6.5%) |
| Single Unit, Attached | 75 (73.5%) | 27 (26.5%) |
| 2 Unit Apartments | 0 (0.0%) | 138 (100.0%) |
| 3 or 4 Unit Apartments | 22 (31.9%) | 47 (68.1%) |
| 5 to 9 Unit Apartments | 41 (65.1%) | 22 (34.9%) |
| 10 or more Apartments | 107 (15.4%) | 587 (84.6%) |
| Mobile Home / Other | 0 (0.0%) | 0 (0.0%) |
| Total | 4,343 (79.7%) | 1,105 (20.3%) |
Housing Structures by Number of Rooms in Lake Forest Park
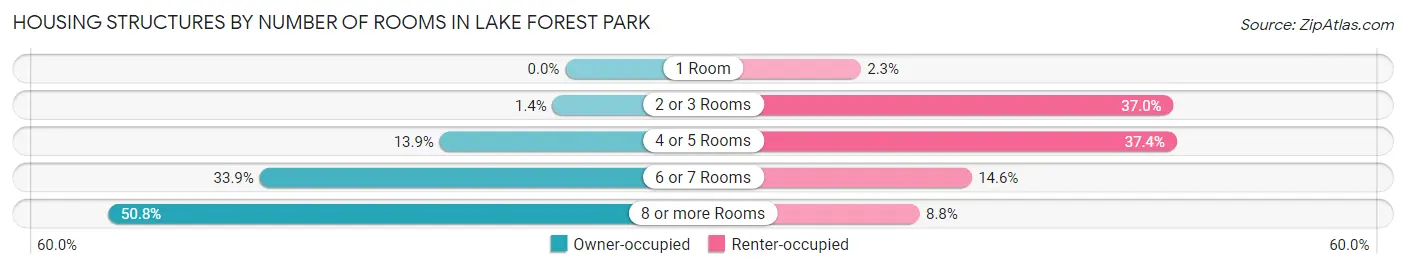
| Number of Rooms | Owner-occupied | Renter-occupied |
| 1 Room | 0 (0.0%) | 25 (2.3%) |
| 2 or 3 Rooms | 61 (1.4%) | 409 (37.0%) |
| 4 or 5 Rooms | 605 (13.9%) | 413 (37.4%) |
| 6 or 7 Rooms | 1,473 (33.9%) | 161 (14.6%) |
| 8 or more Rooms | 2,204 (50.7%) | 97 (8.8%) |
| Total | 4,343 (100.0%) | 1,105 (100.0%) |
Housing Structure by Heating Type in Lake Forest Park
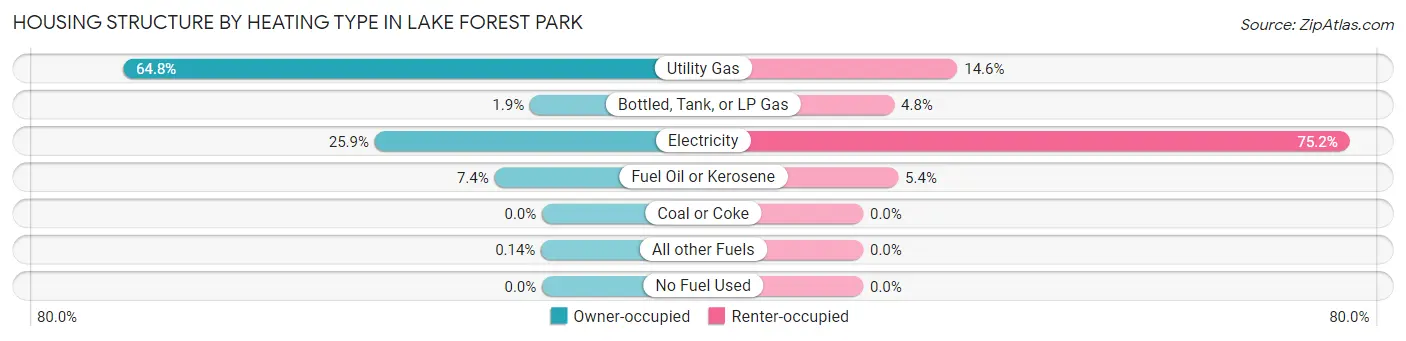
| Heating Type | Owner-occupied | Renter-occupied |
| Utility Gas | 2,814 (64.8%) | 161 (14.6%) |
| Bottled, Tank, or LP Gas | 81 (1.9%) | 53 (4.8%) |
| Electricity | 1,123 (25.9%) | 831 (75.2%) |
| Fuel Oil or Kerosene | 319 (7.3%) | 60 (5.4%) |
| Coal or Coke | 0 (0.0%) | 0 (0.0%) |
| All other Fuels | 6 (0.1%) | 0 (0.0%) |
| No Fuel Used | 0 (0.0%) | 0 (0.0%) |
| Total | 4,343 (100.0%) | 1,105 (100.0%) |
Household Vehicle Usage in Lake Forest Park
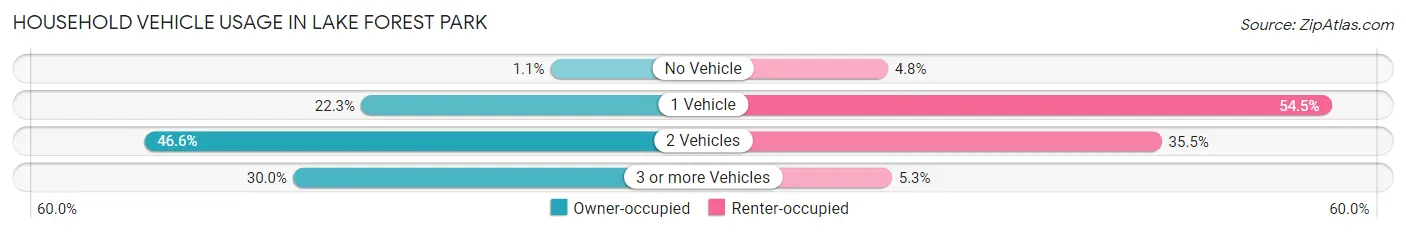
| Vehicles per Household | Owner-occupied | Renter-occupied |
| No Vehicle | 48 (1.1%) | 53 (4.8%) |
| 1 Vehicle | 970 (22.3%) | 602 (54.5%) |
| 2 Vehicles | 2,024 (46.6%) | 392 (35.5%) |
| 3 or more Vehicles | 1,301 (30.0%) | 58 (5.2%) |
| Total | 4,343 (100.0%) | 1,105 (100.0%) |
Real Estate & Mortgages in Lake Forest Park
Real Estate and Mortgage Overview in Lake Forest Park
| Characteristic | Without Mortgage | With Mortgage |
| Housing Units | 1,176 | 3,167 |
| Median Property Value | $791,700 | $898,100 |
| Median Household Income | $104,583 | $2,097 |
| Monthly Housing Costs | $1,064 | $1,930 |
| Real Estate Taxes | $7,583 | $29 |
Property Value by Mortgage Status in Lake Forest Park
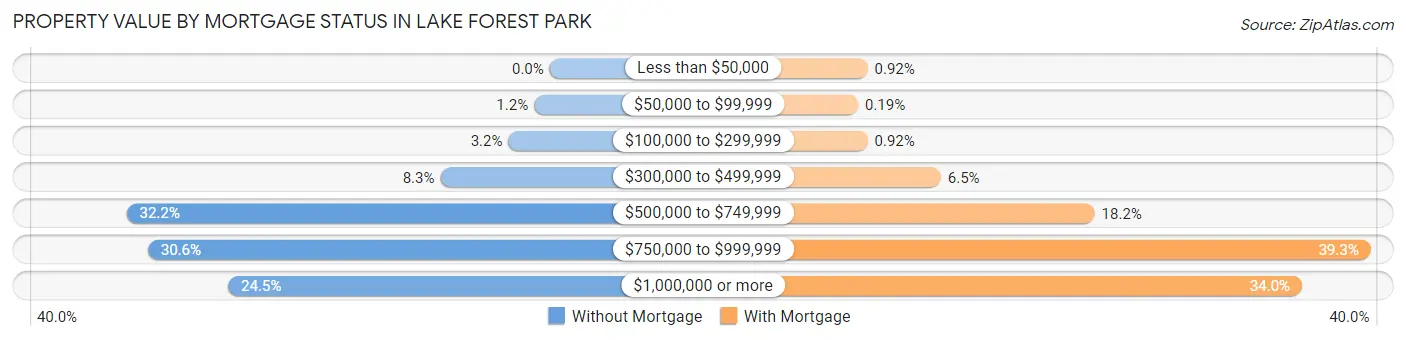
| Property Value | Without Mortgage | With Mortgage |
| Less than $50,000 | 0 (0.0%) | 29 (0.9%) |
| $50,000 to $99,999 | 14 (1.2%) | 6 (0.2%) |
| $100,000 to $299,999 | 37 (3.2%) | 29 (0.9%) |
| $300,000 to $499,999 | 98 (8.3%) | 206 (6.5%) |
| $500,000 to $749,999 | 379 (32.2%) | 577 (18.2%) |
| $750,000 to $999,999 | 360 (30.6%) | 1,243 (39.3%) |
| $1,000,000 or more | 288 (24.5%) | 1,077 (34.0%) |
| Total | 1,176 (100.0%) | 3,167 (100.0%) |
Household Income by Mortgage Status in Lake Forest Park
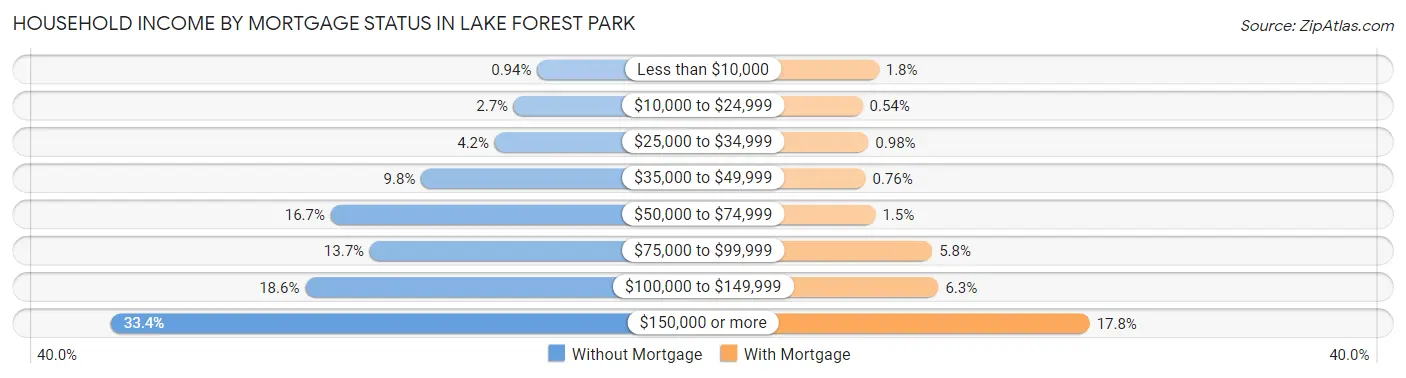
| Household Income | Without Mortgage | With Mortgage |
| Less than $10,000 | 11 (0.9%) | 56 (1.8%) |
| $10,000 to $24,999 | 32 (2.7%) | 17 (0.5%) |
| $25,000 to $34,999 | 49 (4.2%) | 31 (1.0%) |
| $35,000 to $49,999 | 115 (9.8%) | 24 (0.8%) |
| $50,000 to $74,999 | 196 (16.7%) | 48 (1.5%) |
| $75,000 to $99,999 | 161 (13.7%) | 185 (5.8%) |
| $100,000 to $149,999 | 219 (18.6%) | 200 (6.3%) |
| $150,000 or more | 393 (33.4%) | 565 (17.8%) |
| Total | 1,176 (100.0%) | 3,167 (100.0%) |
Property Value to Household Income Ratio in Lake Forest Park
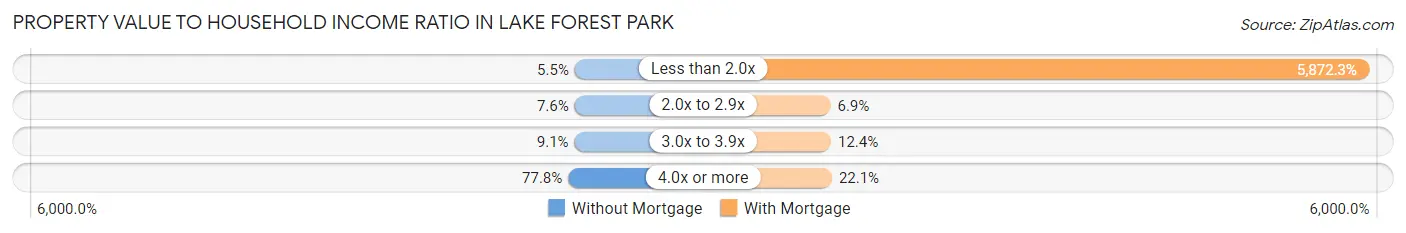
| Value-to-Income Ratio | Without Mortgage | With Mortgage |
| Less than 2.0x | 65 (5.5%) | 185,975 (5,872.3%) |
| 2.0x to 2.9x | 89 (7.6%) | 218 (6.9%) |
| 3.0x to 3.9x | 107 (9.1%) | 391 (12.3%) |
| 4.0x or more | 915 (77.8%) | 700 (22.1%) |
| Total | 1,176 (100.0%) | 3,167 (100.0%) |
Real Estate Taxes by Mortgage Status in Lake Forest Park
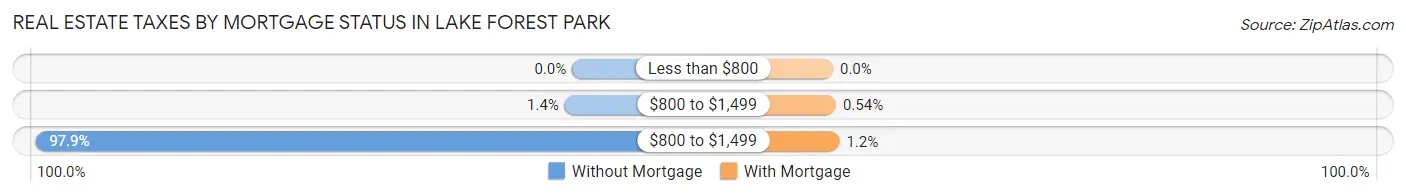
| Property Taxes | Without Mortgage | With Mortgage |
| Less than $800 | 0 (0.0%) | 0 (0.0%) |
| $800 to $1,499 | 16 (1.4%) | 17 (0.5%) |
| $800 to $1,499 | 1,151 (97.9%) | 37 (1.2%) |
| Total | 1,176 (100.0%) | 3,167 (100.0%) |
Health & Disability in Lake Forest Park
Health Insurance Coverage by Age in Lake Forest Park
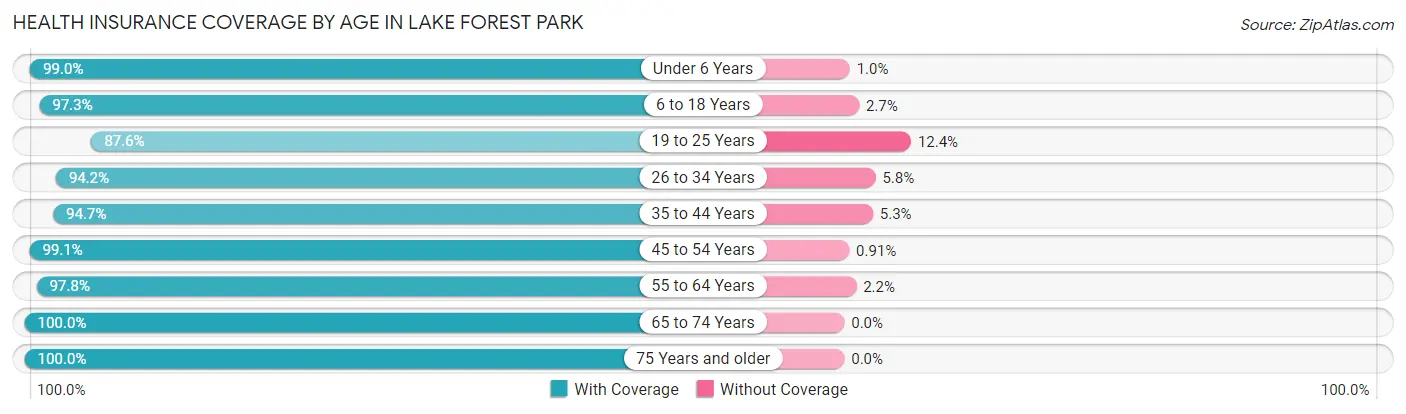
| Age Bracket | With Coverage | Without Coverage |
| Under 6 Years | 783 (99.0%) | 8 (1.0%) |
| 6 to 18 Years | 1,884 (97.3%) | 53 (2.7%) |
| 19 to 25 Years | 761 (87.6%) | 108 (12.4%) |
| 26 to 34 Years | 1,520 (94.2%) | 94 (5.8%) |
| 35 to 44 Years | 1,709 (94.7%) | 96 (5.3%) |
| 45 to 54 Years | 2,076 (99.1%) | 19 (0.9%) |
| 55 to 64 Years | 1,853 (97.8%) | 42 (2.2%) |
| 65 to 74 Years | 1,508 (100.0%) | 0 (0.0%) |
| 75 Years and older | 924 (100.0%) | 0 (0.0%) |
| Total | 13,018 (96.9%) | 420 (3.1%) |
Health Insurance Coverage by Citizenship Status in Lake Forest Park
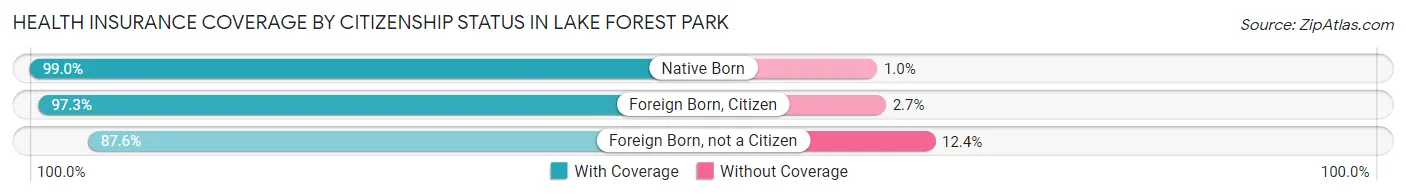
| Citizenship Status | With Coverage | Without Coverage |
| Native Born | 783 (99.0%) | 8 (1.0%) |
| Foreign Born, Citizen | 1,884 (97.3%) | 53 (2.7%) |
| Foreign Born, not a Citizen | 761 (87.6%) | 108 (12.4%) |
Health Insurance Coverage by Household Income in Lake Forest Park
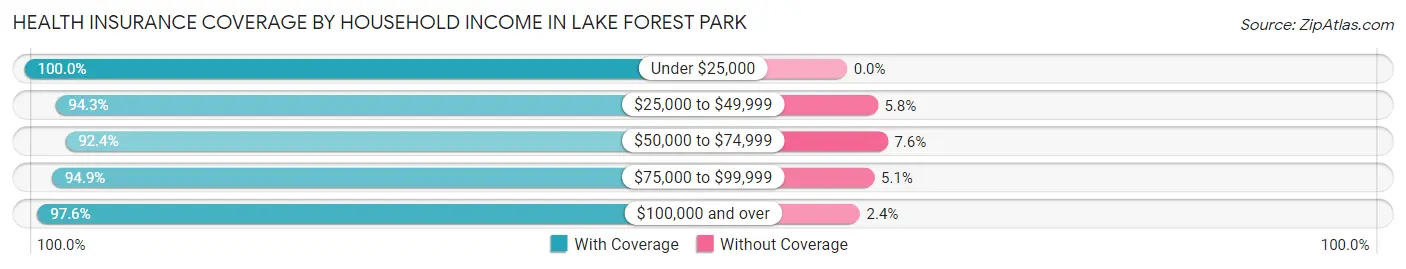
| Household Income | With Coverage | Without Coverage |
| Under $25,000 | 312 (100.0%) | 0 (0.0%) |
| $25,000 to $49,999 | 459 (94.3%) | 28 (5.8%) |
| $50,000 to $74,999 | 1,127 (92.4%) | 93 (7.6%) |
| $75,000 to $99,999 | 853 (94.9%) | 46 (5.1%) |
| $100,000 and over | 10,211 (97.6%) | 251 (2.4%) |
Public vs Private Health Insurance Coverage by Age in Lake Forest Park
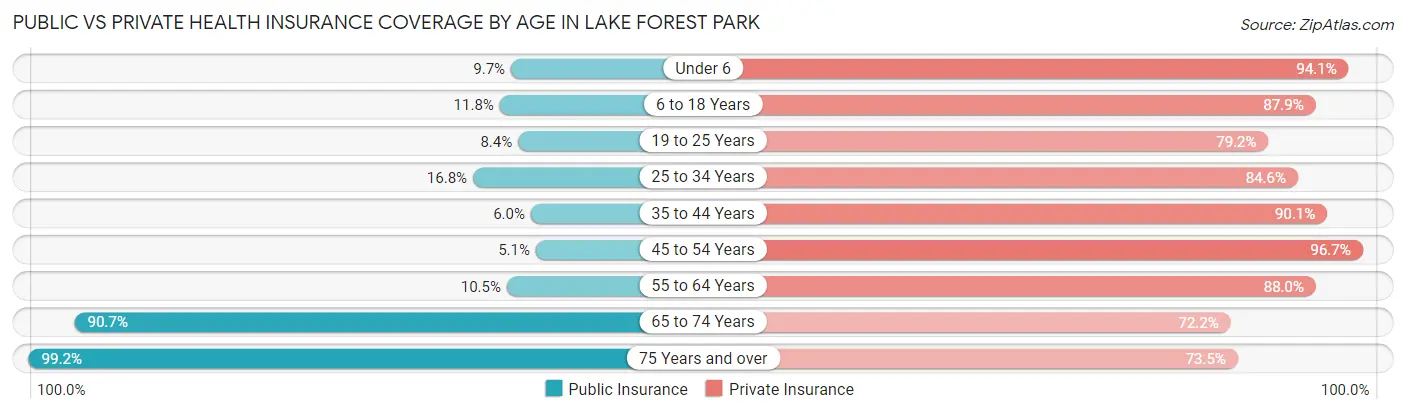
| Age Bracket | Public Insurance | Private Insurance |
| Under 6 | 77 (9.7%) | 744 (94.1%) |
| 6 to 18 Years | 229 (11.8%) | 1,703 (87.9%) |
| 19 to 25 Years | 73 (8.4%) | 688 (79.2%) |
| 25 to 34 Years | 271 (16.8%) | 1,366 (84.6%) |
| 35 to 44 Years | 109 (6.0%) | 1,626 (90.1%) |
| 45 to 54 Years | 107 (5.1%) | 2,025 (96.7%) |
| 55 to 64 Years | 199 (10.5%) | 1,667 (88.0%) |
| 65 to 74 Years | 1,368 (90.7%) | 1,088 (72.2%) |
| 75 Years and over | 917 (99.2%) | 679 (73.5%) |
| Total | 3,350 (24.9%) | 11,586 (86.2%) |
Disability Status by Sex by Age in Lake Forest Park
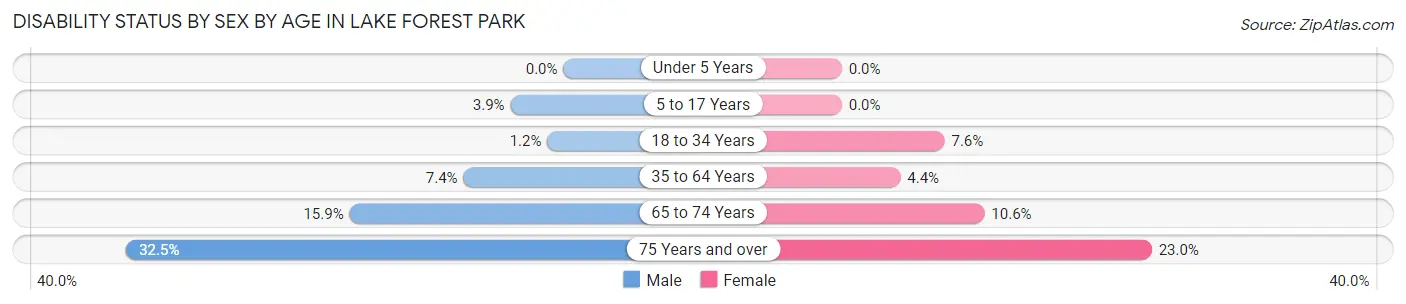
| Age Bracket | Male | Female |
| Under 5 Years | 0 (0.0%) | 0 (0.0%) |
| 5 to 17 Years | 37 (3.9%) | 0 (0.0%) |
| 18 to 34 Years | 17 (1.2%) | 92 (7.6%) |
| 35 to 64 Years | 222 (7.4%) | 122 (4.3%) |
| 65 to 74 Years | 121 (15.9%) | 79 (10.6%) |
| 75 Years and over | 125 (32.5%) | 124 (23.0%) |
Disability Class by Sex by Age in Lake Forest Park
Disability Class: Hearing Difficulty
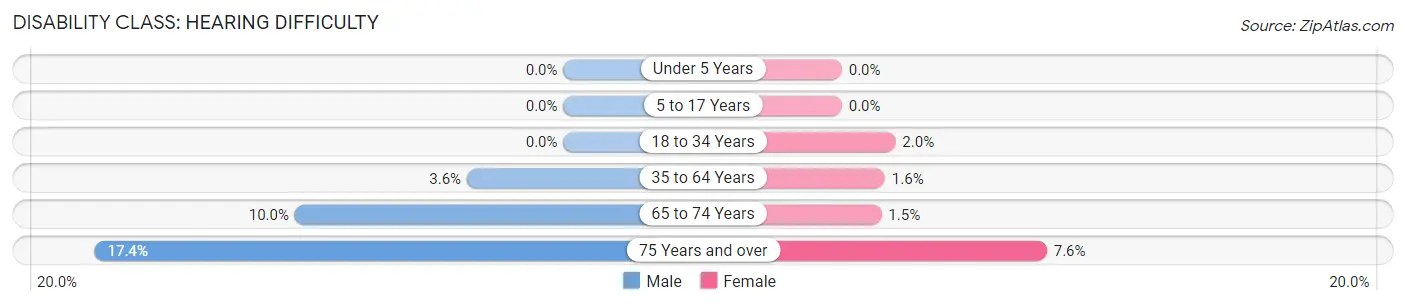
| Age Bracket | Male | Female |
| Under 5 Years | 0 (0.0%) | 0 (0.0%) |
| 5 to 17 Years | 0 (0.0%) | 0 (0.0%) |
| 18 to 34 Years | 0 (0.0%) | 24 (2.0%) |
| 35 to 64 Years | 107 (3.6%) | 45 (1.6%) |
| 65 to 74 Years | 76 (10.0%) | 11 (1.5%) |
| 75 Years and over | 67 (17.4%) | 41 (7.6%) |
Disability Class: Vision Difficulty
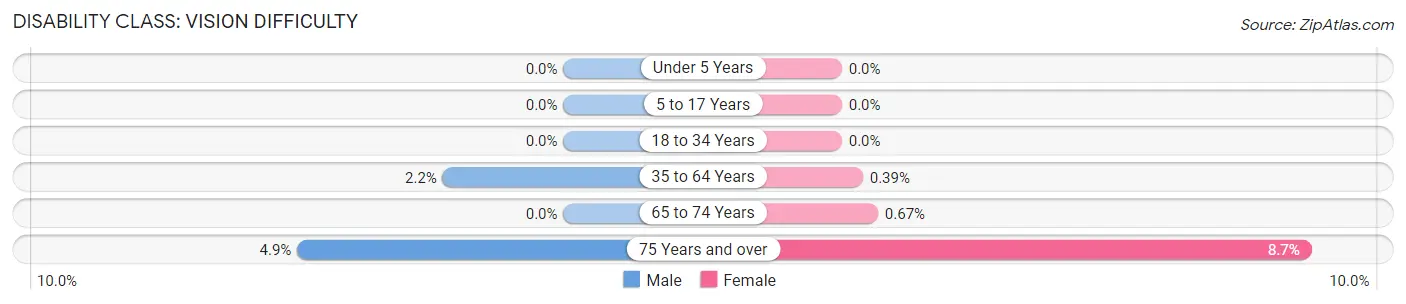
| Age Bracket | Male | Female |
| Under 5 Years | 0 (0.0%) | 0 (0.0%) |
| 5 to 17 Years | 0 (0.0%) | 0 (0.0%) |
| 18 to 34 Years | 0 (0.0%) | 0 (0.0%) |
| 35 to 64 Years | 67 (2.2%) | 11 (0.4%) |
| 65 to 74 Years | 0 (0.0%) | 5 (0.7%) |
| 75 Years and over | 19 (4.9%) | 47 (8.7%) |
Disability Class: Cognitive Difficulty
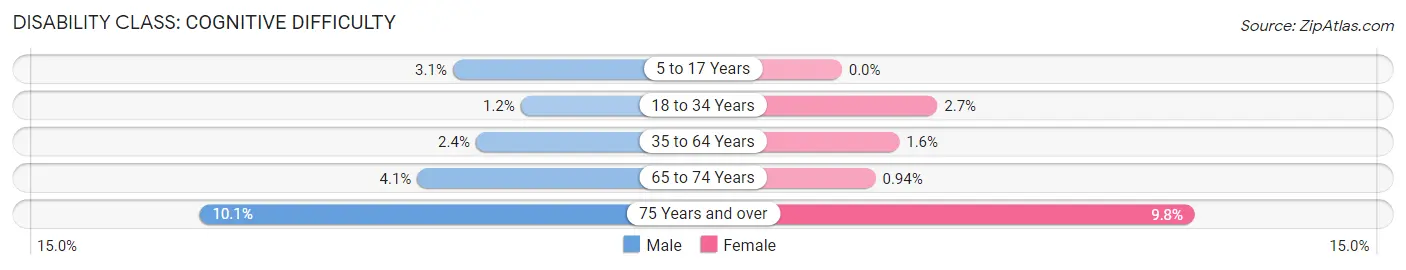
| Age Bracket | Male | Female |
| 5 to 17 Years | 29 (3.1%) | 0 (0.0%) |
| 18 to 34 Years | 17 (1.2%) | 32 (2.7%) |
| 35 to 64 Years | 73 (2.4%) | 45 (1.6%) |
| 65 to 74 Years | 31 (4.1%) | 7 (0.9%) |
| 75 Years and over | 39 (10.1%) | 53 (9.8%) |
Disability Class: Ambulatory Difficulty
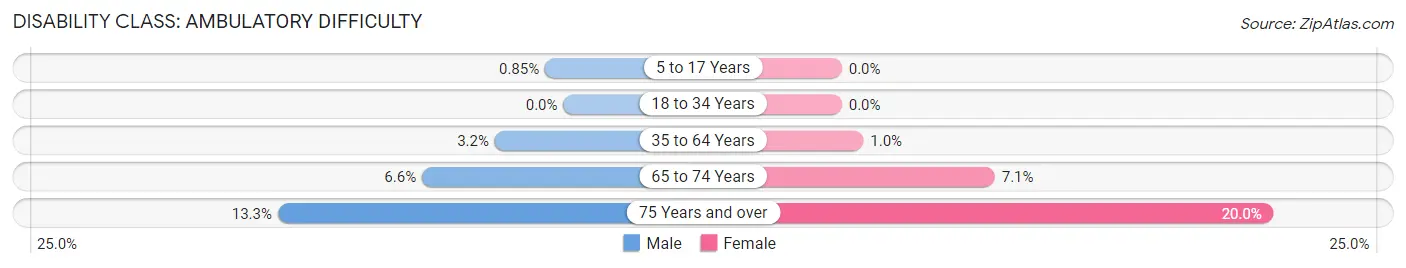
| Age Bracket | Male | Female |
| 5 to 17 Years | 8 (0.9%) | 0 (0.0%) |
| 18 to 34 Years | 0 (0.0%) | 0 (0.0%) |
| 35 to 64 Years | 95 (3.2%) | 28 (1.0%) |
| 65 to 74 Years | 50 (6.6%) | 53 (7.1%) |
| 75 Years and over | 51 (13.3%) | 108 (20.0%) |
Disability Class: Self-Care Difficulty
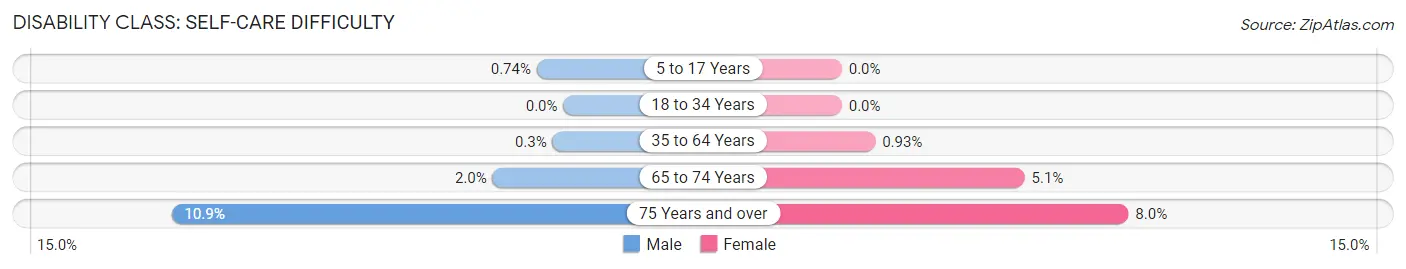
| Age Bracket | Male | Female |
| 5 to 17 Years | 7 (0.7%) | 0 (0.0%) |
| 18 to 34 Years | 0 (0.0%) | 0 (0.0%) |
| 35 to 64 Years | 9 (0.3%) | 26 (0.9%) |
| 65 to 74 Years | 15 (2.0%) | 38 (5.1%) |
| 75 Years and over | 42 (10.9%) | 43 (8.0%) |
Technology Access in Lake Forest Park
Computing Device Access in Lake Forest Park
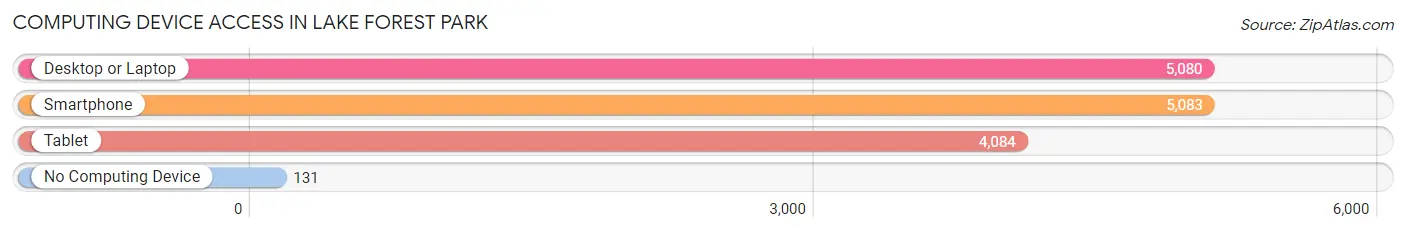
| Device Type | # Households | % Households |
| Desktop or Laptop | 5,080 | 93.2% |
| Smartphone | 5,083 | 93.3% |
| Tablet | 4,084 | 75.0% |
| No Computing Device | 131 | 2.4% |
| Total | 5,448 | 100.0% |
Internet Access in Lake Forest Park
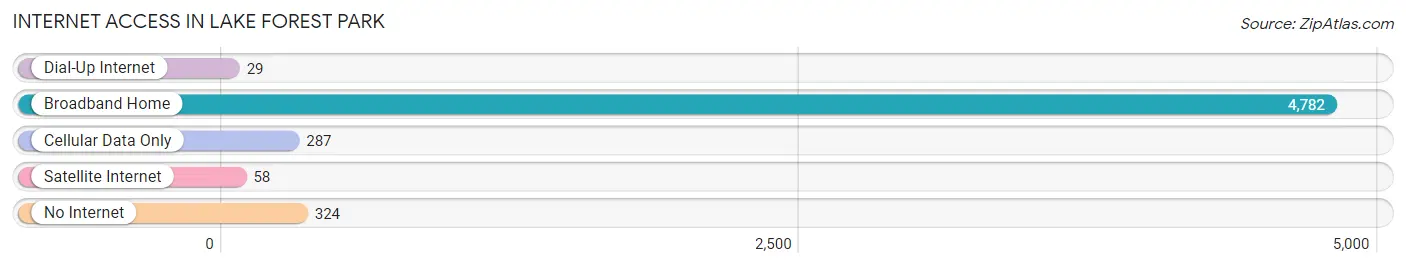
| Internet Type | # Households | % Households |
| Dial-Up Internet | 29 | 0.5% |
| Broadband Home | 4,782 | 87.8% |
| Cellular Data Only | 287 | 5.3% |
| Satellite Internet | 58 | 1.1% |
| No Internet | 324 | 5.9% |
| Total | 5,448 | 100.0% |
Lake Forest Park Summary
History
The area now known as Lake Forest Park was first inhabited by the Duwamish and Snohomish Native American tribes. The first non-Native American settlers arrived in the area in the late 1800s, and the area was officially incorporated as a city in 1961.
The city of Lake Forest Park was founded in 1961 by a group of local residents who wanted to create a community that was close to Seattle, but still had a rural feel. The city was named after the nearby Lake Forest Park, which was established in the early 1900s.
The city has a long history of environmental stewardship, and was one of the first cities in the state to adopt a comprehensive plan for land use and development. The city has also been a leader in the preservation of green spaces, and has been recognized for its efforts to protect and restore the natural environment.
Geography
Lake Forest Park is located in King County, Washington, just north of Seattle. The city is situated on the shores of Lake Washington, and is bordered by the cities of Shoreline, Kenmore, and Bothell. The city covers an area of 4.2 square miles, and has a population of approximately 12,000 people.
The city is located in a temperate climate zone, and experiences mild temperatures throughout the year. The average high temperature in the summer is around 75 degrees Fahrenheit, and the average low temperature in the winter is around 40 degrees Fahrenheit.
Economy
The economy of Lake Forest Park is largely driven by the retail and service industries. The city is home to a number of retail stores, restaurants, and other businesses. The city also has a number of medical and professional offices, as well as a number of technology companies.
The city is also home to a number of parks and recreational facilities, including the Lake Forest Park Town Center, which is a popular shopping and entertainment destination.
Demographics
As of the 2010 census, the population of Lake Forest Park was 11,944. The racial makeup of the city was 79.3% White, 8.2% Asian, 6.2% African American, 0.7% Native American, and 5.6% from other races. The median household income was $68,945, and the median family income was $77,945.
The city is home to a number of educational institutions, including the University of Washington, Seattle Pacific University, and Shoreline Community College. The city also has a number of public and private schools, including Lake Forest Park Elementary School, Lake Forest Park Middle School, and Lake Forest Park High School.
Conclusion
Lake Forest Park is a small city located in King County, Washington, just north of Seattle. The city was founded in 1961, and has a long history of environmental stewardship and preservation. The city has a population of approximately 12,000 people, and is home to a number of retail stores, restaurants, and other businesses. The city is also home to a number of educational institutions, parks, and recreational facilities.
Common Questions
What is Per Capita Income in Lake Forest Park?
Per Capita income in Lake Forest Park is $72,992.
What is the Median Family Income in Lake Forest Park?
Median Family Income in Lake Forest Park is $180,587.
What is the Median Household income in Lake Forest Park?
Median Household Income in Lake Forest Park is $152,010.
What is Income or Wage Gap in Lake Forest Park?
Income or Wage Gap in Lake Forest Park is 7.3%.
Women in Lake Forest Park earn 92.7 cents for every dollar earned by a man.
What is Inequality or Gini Index in Lake Forest Park?
Inequality or Gini Index in Lake Forest Park is 0.39.
What is the Total Population of Lake Forest Park?
Total Population of Lake Forest Park is 13,462.
What is the Total Male Population of Lake Forest Park?
Total Male Population of Lake Forest Park is 6,781.
What is the Total Female Population of Lake Forest Park?
Total Female Population of Lake Forest Park is 6,681.
What is the Ratio of Males per 100 Females in Lake Forest Park?
There are 101.50 Males per 100 Females in Lake Forest Park.
What is the Ratio of Females per 100 Males in Lake Forest Park?
There are 98.53 Females per 100 Males in Lake Forest Park.
What is the Median Population Age in Lake Forest Park?
Median Population Age in Lake Forest Park is 42.6 Years.
What is the Average Family Size in Lake Forest Park
Average Family Size in Lake Forest Park is 2.9 People.
What is the Average Household Size in Lake Forest Park
Average Household Size in Lake Forest Park is 2.5 People.
How Large is the Labor Force in Lake Forest Park?
There are 7,701 People in the Labor Forcein in Lake Forest Park.
What is the Percentage of People in the Labor Force in Lake Forest Park?
68.7% of People are in the Labor Force in Lake Forest Park.
What is the Unemployment Rate in Lake Forest Park?
Unemployment Rate in Lake Forest Park is 2.9%.