Lake Goodwin, WA Map & Demographics
Lake Goodwin Map
Lake Goodwin Overview
$71,482
PER CAPITA INCOME
$119,100
AVG FAMILY INCOME
$105,673
AVG HOUSEHOLD INCOME
48.0%
WAGE / INCOME GAP [ % ]
52.0¢/ $1
WAGE / INCOME GAP [ $ ]
0.51
INEQUALITY / GINI INDEX
5,581
TOTAL POPULATION
2,788
MALE POPULATION
2,793
FEMALE POPULATION
99.82
MALES / 100 FEMALES
100.18
FEMALES / 100 MALES
51.5
MEDIAN AGE
2.8
AVG FAMILY SIZE
2.5
AVG HOUSEHOLD SIZE
3,049
LABOR FORCE [ PEOPLE ]
61.7%
PERCENT IN LABOR FORCE
3.7%
UNEMPLOYMENT RATE
Income in Lake Goodwin
Income Overview in Lake Goodwin
Per Capita Income in Lake Goodwin is $71,482, while median incomes of families and households are $119,100 and $105,673 respectively.
| Characteristic | Number | Measure |
| Per Capita Income | 5,581 | $71,482 |
| Median Family Income | 1,724 | $119,100 |
| Mean Family Income | 1,724 | $193,381 |
| Median Household Income | 2,190 | $105,673 |
| Mean Household Income | 2,190 | $175,096 |
| Income Deficit | 1,724 | $0 |
| Wage / Income Gap (%) | 5,581 | 47.96% |
| Wage / Income Gap ($) | 5,581 | 52.04¢ per $1 |
| Gini / Inequality Index | 5,581 | 0.51 |
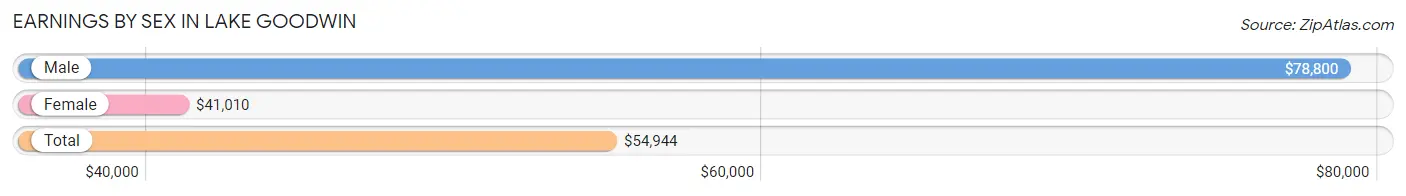
Earnings by Sex in Lake Goodwin
Average Earnings in Lake Goodwin are $54,944, $78,800 for men and $41,010 for women, a difference of 48.0%.
| Sex | Number | Average Earnings |
| Male | 1,756 (54.3%) | $78,800 |
| Female | 1,475 (45.7%) | $41,010 |
| Total | 3,231 (100.0%) | $54,944 |
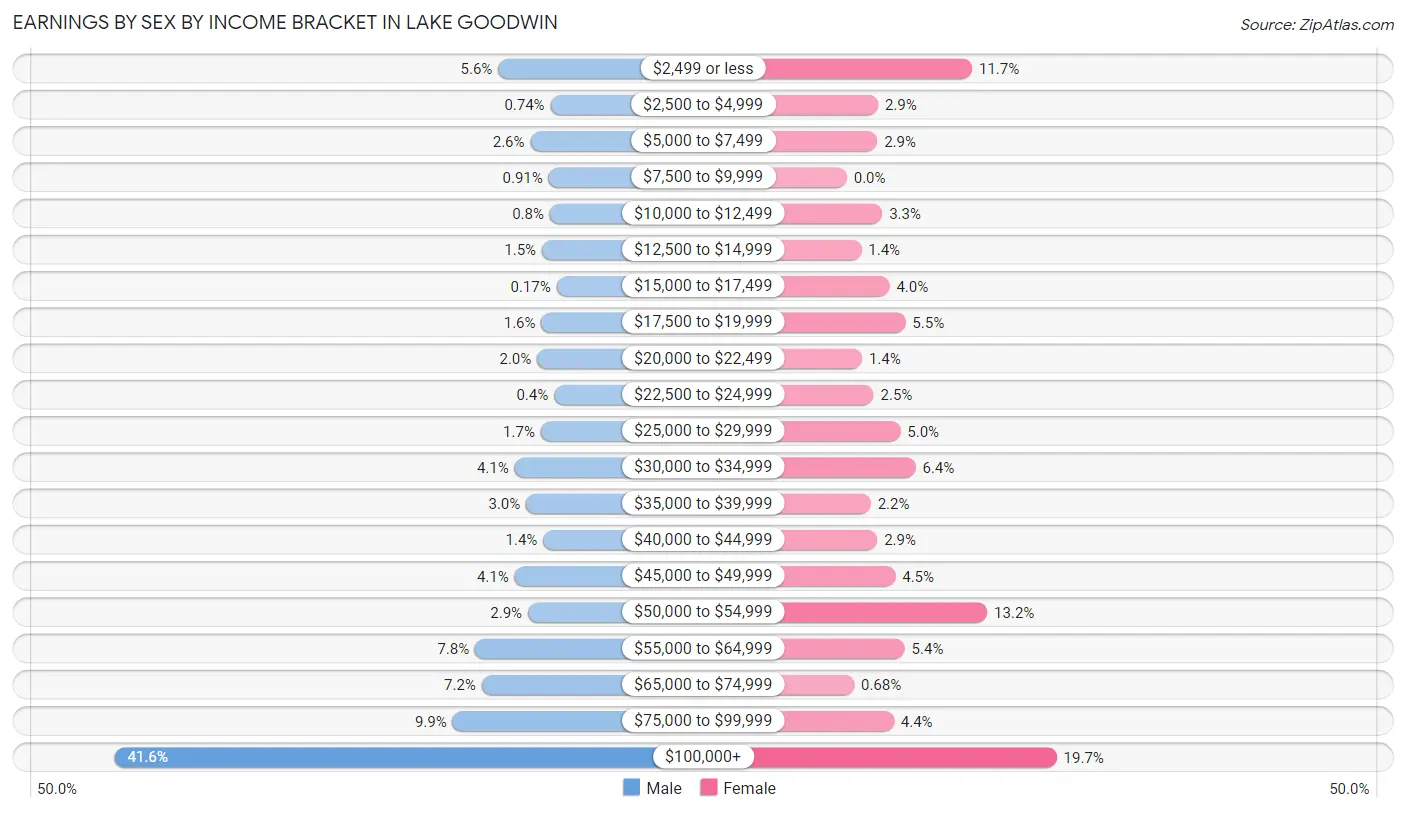
Earnings by Sex by Income Bracket in Lake Goodwin
The most common earnings brackets in Lake Goodwin are $100,000+ for men (730 | 41.6%) and $100,000+ for women (290 | 19.7%).
| Income | Male | Female |
| $2,499 or less | 99 (5.6%) | 173 (11.7%) |
| $2,500 to $4,999 | 13 (0.7%) | 43 (2.9%) |
| $5,000 to $7,499 | 46 (2.6%) | 42 (2.9%) |
| $7,500 to $9,999 | 16 (0.9%) | 0 (0.0%) |
| $10,000 to $12,499 | 14 (0.8%) | 49 (3.3%) |
| $12,500 to $14,999 | 27 (1.5%) | 20 (1.4%) |
| $15,000 to $17,499 | 3 (0.2%) | 59 (4.0%) |
| $17,500 to $19,999 | 28 (1.6%) | 81 (5.5%) |
| $20,000 to $22,499 | 35 (2.0%) | 21 (1.4%) |
| $22,500 to $24,999 | 7 (0.4%) | 37 (2.5%) |
| $25,000 to $29,999 | 29 (1.7%) | 74 (5.0%) |
| $30,000 to $34,999 | 72 (4.1%) | 95 (6.4%) |
| $35,000 to $39,999 | 53 (3.0%) | 33 (2.2%) |
| $40,000 to $44,999 | 25 (1.4%) | 42 (2.9%) |
| $45,000 to $49,999 | 72 (4.1%) | 67 (4.5%) |
| $50,000 to $54,999 | 50 (2.9%) | 194 (13.2%) |
| $55,000 to $64,999 | 137 (7.8%) | 80 (5.4%) |
| $65,000 to $74,999 | 126 (7.2%) | 10 (0.7%) |
| $75,000 to $99,999 | 174 (9.9%) | 65 (4.4%) |
| $100,000+ | 730 (41.6%) | 290 (19.7%) |
| Total | 1,756 (100.0%) | 1,475 (100.0%) |
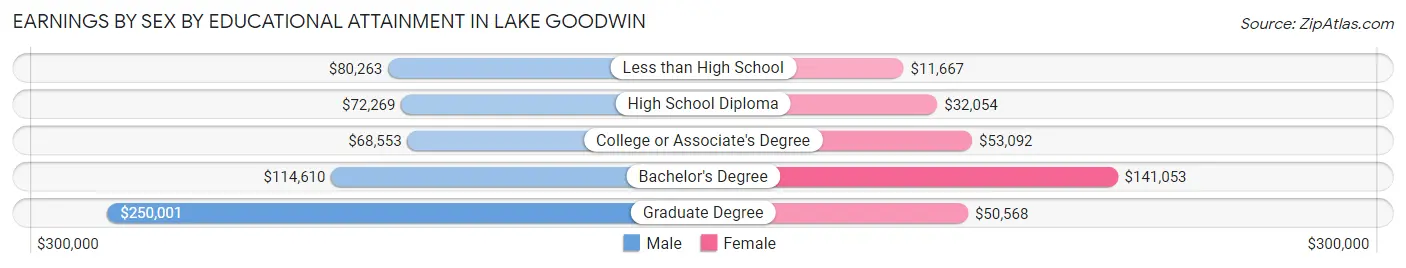
Earnings by Sex by Educational Attainment in Lake Goodwin
Average earnings in Lake Goodwin are $85,658 for men and $47,260 for women, a difference of 44.8%. Men with an educational attainment of graduate degree enjoy the highest average annual earnings of $250,001, while those with college or associate's degree education earn the least with $68,553. Women with an educational attainment of bachelor's degree earn the most with the average annual earnings of $141,053, while those with less than high school education have the smallest earnings of $11,667.
| Educational Attainment | Male Income | Female Income |
| Less than High School | $80,263 | $11,667 |
| High School Diploma | $72,269 | $32,054 |
| College or Associate's Degree | $68,553 | $53,092 |
| Bachelor's Degree | $114,610 | $141,053 |
| Graduate Degree | $250,001 | $50,568 |
| Total | $85,658 | $47,260 |
Family Income in Lake Goodwin
Family Income Brackets in Lake Goodwin
According to the Lake Goodwin family income data, there are 402 families falling into the $200,000+ income range, which is the most common income bracket and makes up 23.3% of all families.
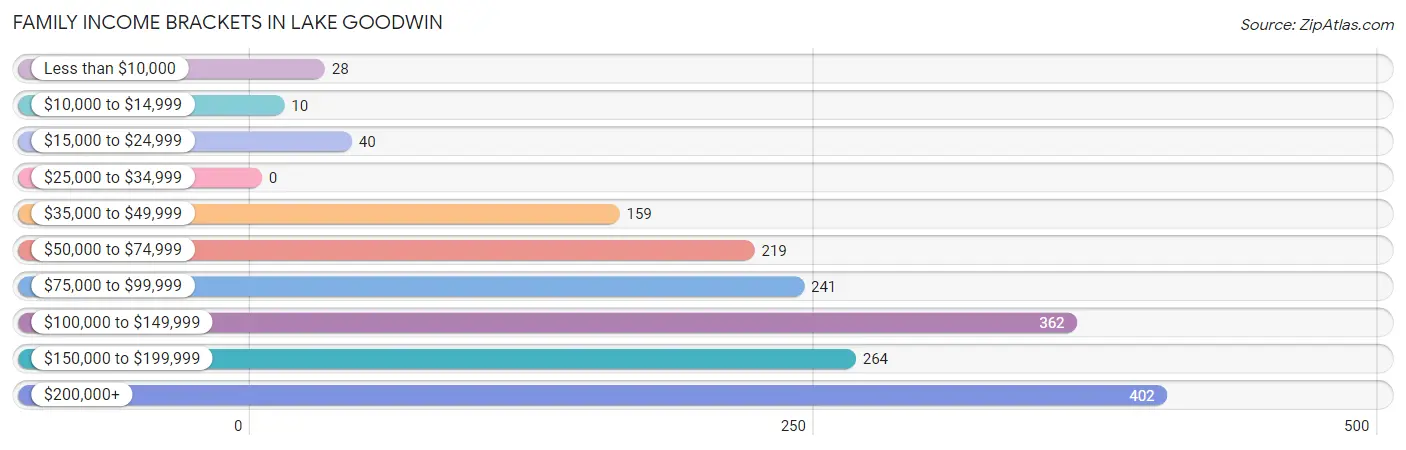
| Income Bracket | # Families | % Families |
| Less than $10,000 | 28 | 1.6% |
| $10,000 to $14,999 | 10 | 0.6% |
| $15,000 to $24,999 | 40 | 2.3% |
| $25,000 to $34,999 | 0 | 0.0% |
| $35,000 to $49,999 | 159 | 9.2% |
| $50,000 to $74,999 | 219 | 12.7% |
| $75,000 to $99,999 | 241 | 14.0% |
| $100,000 to $149,999 | 362 | 21.0% |
| $150,000 to $199,999 | 264 | 15.3% |
| $200,000+ | 402 | 23.3% |
Family Income by Famaliy Size in Lake Goodwin
5-person families (87 | 5.1%) account for the highest median family income in Lake Goodwin with $190,156 per family, while 2-person families (900 | 52.2%) have the highest median income of $50,096 per family member.
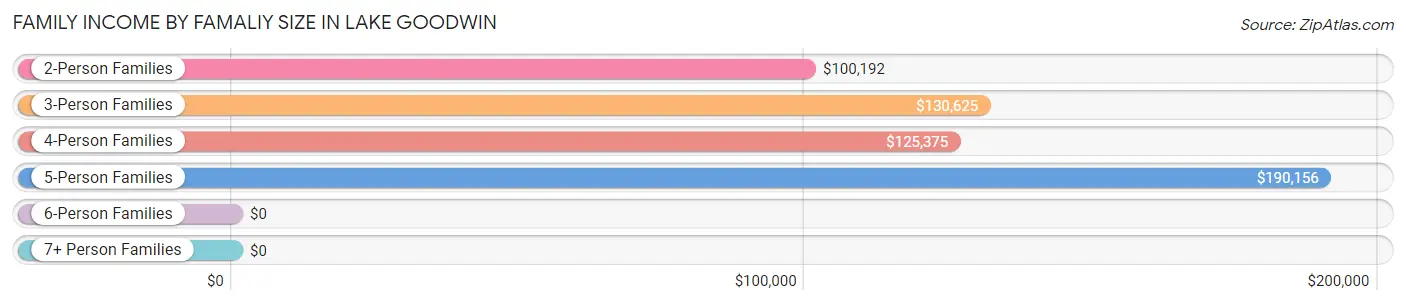
| Income Bracket | # Families | Median Income |
| 2-Person Families | 900 (52.2%) | $100,192 |
| 3-Person Families | 475 (27.6%) | $130,625 |
| 4-Person Families | 238 (13.8%) | $125,375 |
| 5-Person Families | 87 (5.1%) | $190,156 |
| 6-Person Families | 8 (0.5%) | $0 |
| 7+ Person Families | 16 (0.9%) | $0 |
| Total | 1,724 (100.0%) | $119,100 |
Family Income by Number of Earners in Lake Goodwin
The median family income in Lake Goodwin is $119,100, with families comprising 3+ earners (253) having the highest median family income of $169,063, while families with 1 earner (552) have the lowest median family income of $72,375, accounting for 14.7% and 32.0% of families, respectively.
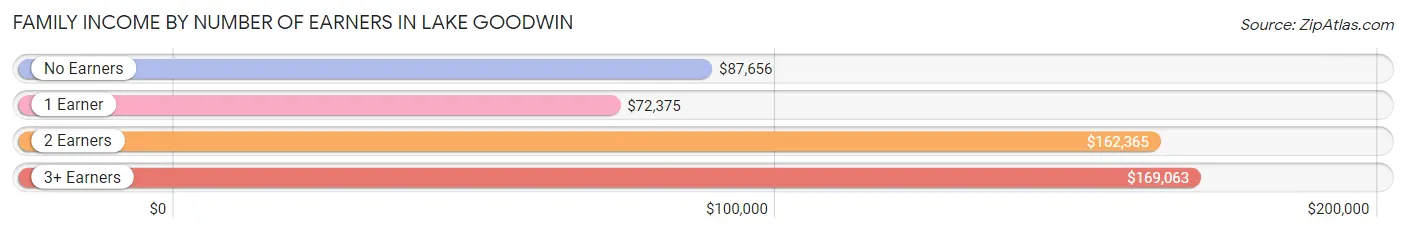
| Number of Earners | # Families | Median Income |
| No Earners | 271 (15.7%) | $87,656 |
| 1 Earner | 552 (32.0%) | $72,375 |
| 2 Earners | 648 (37.6%) | $162,365 |
| 3+ Earners | 253 (14.7%) | $169,063 |
| Total | 1,724 (100.0%) | $119,100 |
Household Income in Lake Goodwin
Household Income Brackets in Lake Goodwin
With 491 households falling in the category, the $200,000+ income range is the most frequent in Lake Goodwin, accounting for 22.4% of all households.
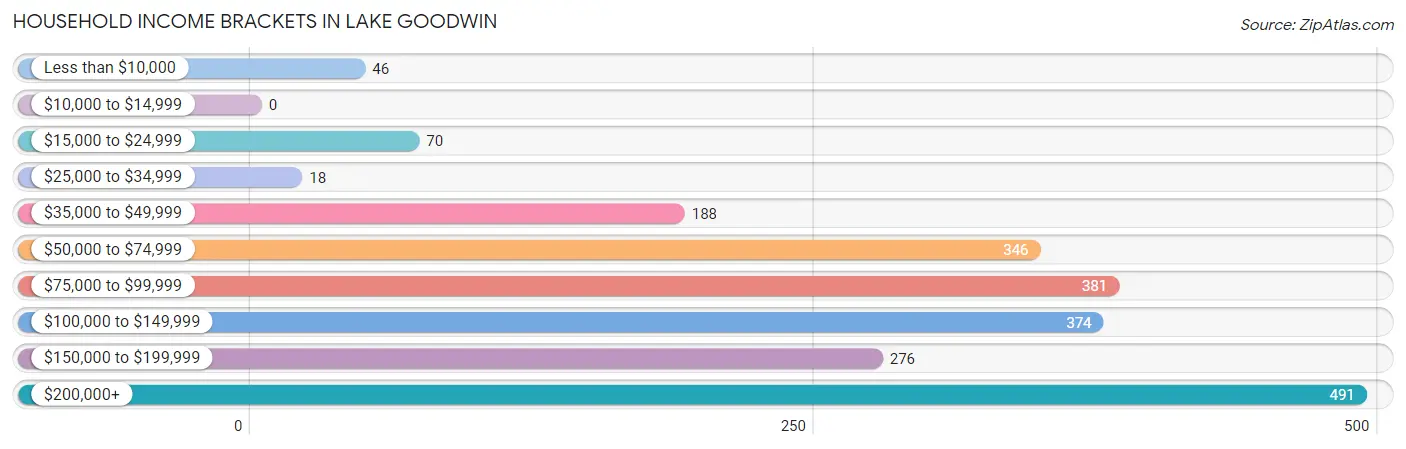
| Income Bracket | # Households | % Households |
| Less than $10,000 | 46 | 2.1% |
| $10,000 to $14,999 | 0 | 0.0% |
| $15,000 to $24,999 | 70 | 3.2% |
| $25,000 to $34,999 | 18 | 0.8% |
| $35,000 to $49,999 | 188 | 8.6% |
| $50,000 to $74,999 | 346 | 15.8% |
| $75,000 to $99,999 | 381 | 17.4% |
| $100,000 to $149,999 | 374 | 17.1% |
| $150,000 to $199,999 | 276 | 12.6% |
| $200,000+ | 491 | 22.4% |
Household Income by Householder Age in Lake Goodwin
The median household income in Lake Goodwin is $105,673, with the highest median household income of $169,649 found in the 45 to 64 years age bracket for the primary householder. A total of 1,006 households (45.9%) fall into this category. Meanwhile, the 15 to 24 years age bracket for the primary householder has the lowest median household income of $0, with 17 households (0.8%) in this group.
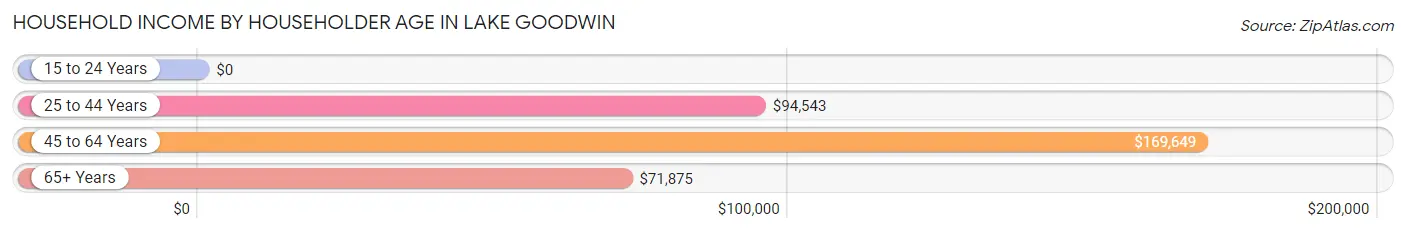
| Income Bracket | # Households | Median Income |
| 15 to 24 Years | 17 (0.8%) | $0 |
| 25 to 44 Years | 433 (19.8%) | $94,543 |
| 45 to 64 Years | 1,006 (45.9%) | $169,649 |
| 65+ Years | 734 (33.5%) | $71,875 |
| Total | 2,190 (100.0%) | $105,673 |
Poverty in Lake Goodwin
Income Below Poverty by Sex and Age in Lake Goodwin
With 4.2% poverty level for males and 5.3% for females among the residents of Lake Goodwin, 18 to 24 year old males and 45 to 54 year old females are the most vulnerable to poverty, with 11 males (12.6%) and 47 females (12.0%) in their respective age groups living below the poverty level.
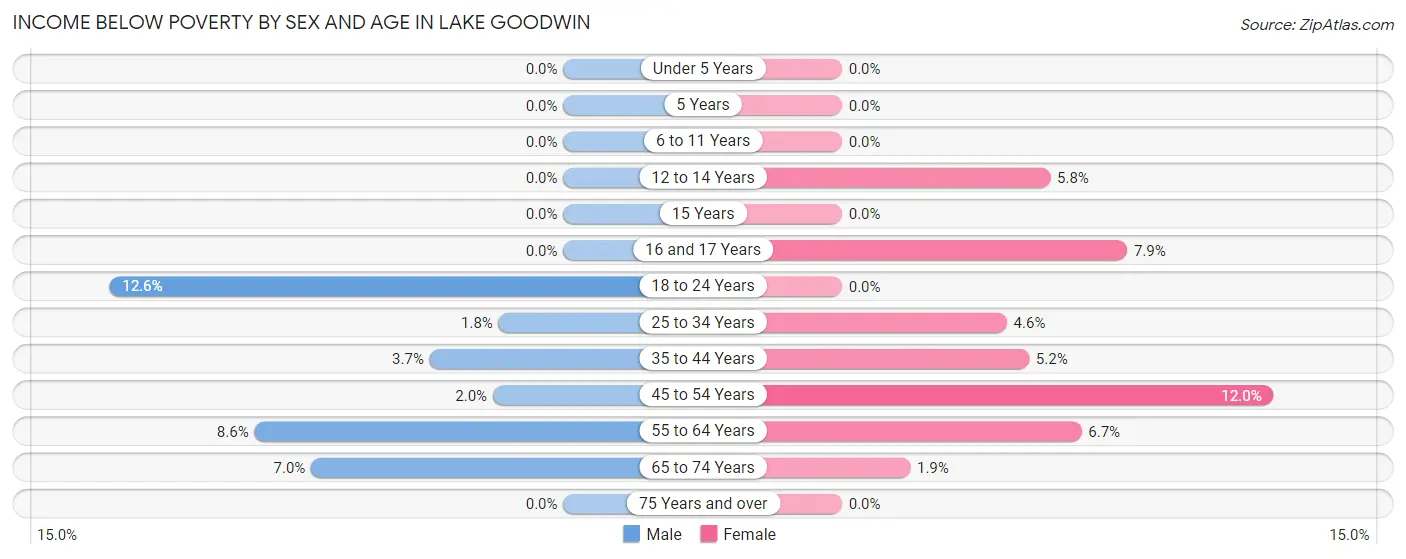
| Age Bracket | Male | Female |
| Under 5 Years | 0 (0.0%) | 0 (0.0%) |
| 5 Years | 0 (0.0%) | 0 (0.0%) |
| 6 to 11 Years | 0 (0.0%) | 0 (0.0%) |
| 12 to 14 Years | 0 (0.0%) | 8 (5.8%) |
| 15 Years | 0 (0.0%) | 0 (0.0%) |
| 16 and 17 Years | 0 (0.0%) | 10 (7.9%) |
| 18 to 24 Years | 11 (12.6%) | 0 (0.0%) |
| 25 to 34 Years | 7 (1.8%) | 15 (4.6%) |
| 35 to 44 Years | 11 (3.7%) | 15 (5.2%) |
| 45 to 54 Years | 8 (2.0%) | 47 (12.0%) |
| 55 to 64 Years | 57 (8.6%) | 43 (6.7%) |
| 65 to 74 Years | 21 (7.0%) | 8 (1.9%) |
| 75 Years and over | 0 (0.0%) | 0 (0.0%) |
| Total | 115 (4.2%) | 146 (5.3%) |
Income Above Poverty by Sex and Age in Lake Goodwin
According to the poverty statistics in Lake Goodwin, males aged under 5 years and females aged under 5 years are the age groups that are most secure financially, with 100.0% of males and 100.0% of females in these age groups living above the poverty line.
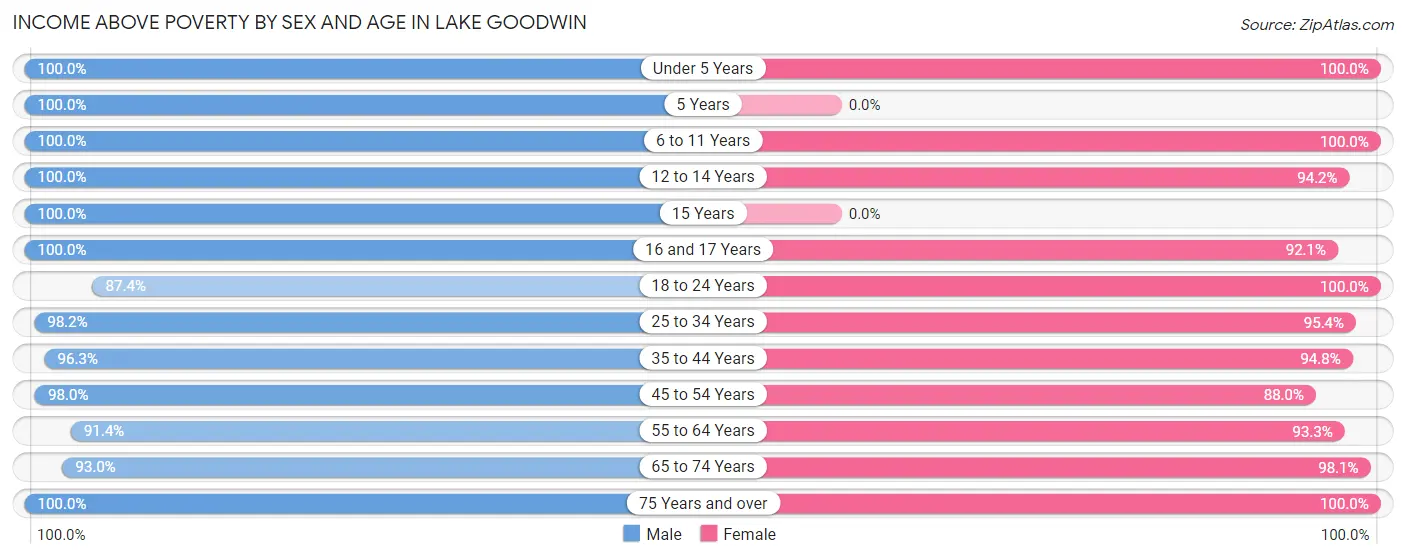
| Age Bracket | Male | Female |
| Under 5 Years | 77 (100.0%) | 101 (100.0%) |
| 5 Years | 16 (100.0%) | 0 (0.0%) |
| 6 to 11 Years | 68 (100.0%) | 86 (100.0%) |
| 12 to 14 Years | 50 (100.0%) | 130 (94.2%) |
| 15 Years | 58 (100.0%) | 0 (0.0%) |
| 16 and 17 Years | 147 (100.0%) | 116 (92.1%) |
| 18 to 24 Years | 76 (87.4%) | 122 (100.0%) |
| 25 to 34 Years | 382 (98.2%) | 312 (95.4%) |
| 35 to 44 Years | 285 (96.3%) | 273 (94.8%) |
| 45 to 54 Years | 401 (98.0%) | 344 (88.0%) |
| 55 to 64 Years | 606 (91.4%) | 602 (93.3%) |
| 65 to 74 Years | 278 (93.0%) | 414 (98.1%) |
| 75 Years and over | 209 (100.0%) | 122 (100.0%) |
| Total | 2,653 (95.9%) | 2,622 (94.7%) |
Income Below Poverty Among Married-Couple Families in Lake Goodwin
The poverty statistics for married-couple families in Lake Goodwin show that 4.7% or 65 of the total 1,383 families live below the poverty line. Families with no children have the highest poverty rate of 5.9%, comprising of 65 families. On the other hand, families with 1 or 2 children have the lowest poverty rate of 0.0%, which includes 0 families.
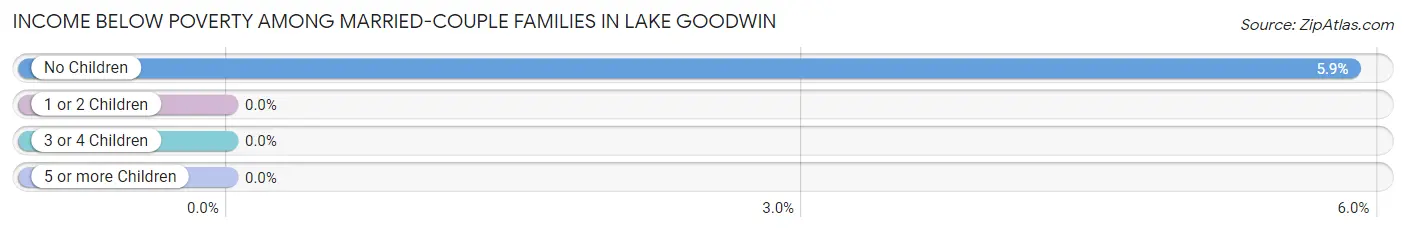
| Children | Above Poverty | Below Poverty |
| No Children | 1,044 (94.1%) | 65 (5.9%) |
| 1 or 2 Children | 251 (100.0%) | 0 (0.0%) |
| 3 or 4 Children | 7 (100.0%) | 0 (0.0%) |
| 5 or more Children | 16 (100.0%) | 0 (0.0%) |
| Total | 1,318 (95.3%) | 65 (4.7%) |
Income Below Poverty Among Single-Parent Households in Lake Goodwin
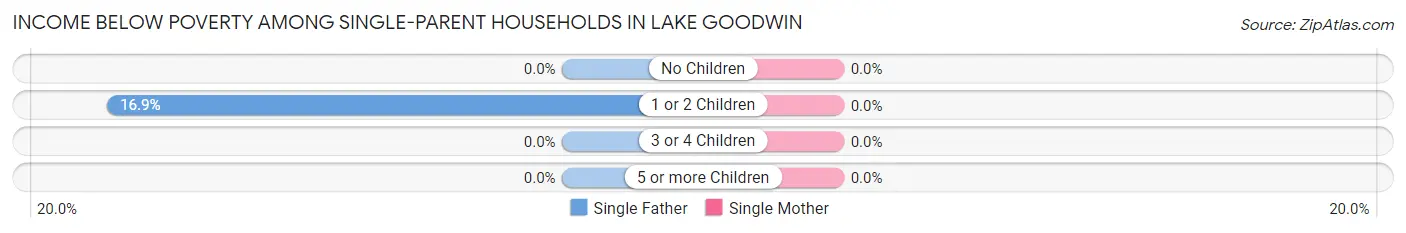
| Children | Single Father | Single Mother |
| No Children | 0 (0.0%) | 0 (0.0%) |
| 1 or 2 Children | 11 (16.9%) | 0 (0.0%) |
| 3 or 4 Children | 0 (0.0%) | 0 (0.0%) |
| 5 or more Children | 0 (0.0%) | 0 (0.0%) |
| Total | 11 (12.2%) | 0 (0.0%) |
Income Below Poverty Among Married-Couple vs Single-Parent Households in Lake Goodwin
The poverty data for Lake Goodwin shows that 65 of the married-couple family households (4.7%) and 11 of the single-parent households (3.2%) are living below the poverty level. Within the married-couple family households, those with no children have the highest poverty rate, with 65 households (5.9%) falling below the poverty line. Among the single-parent households, those with 1 or 2 children have the highest poverty rate, with 11 household (5.2%) living below poverty.
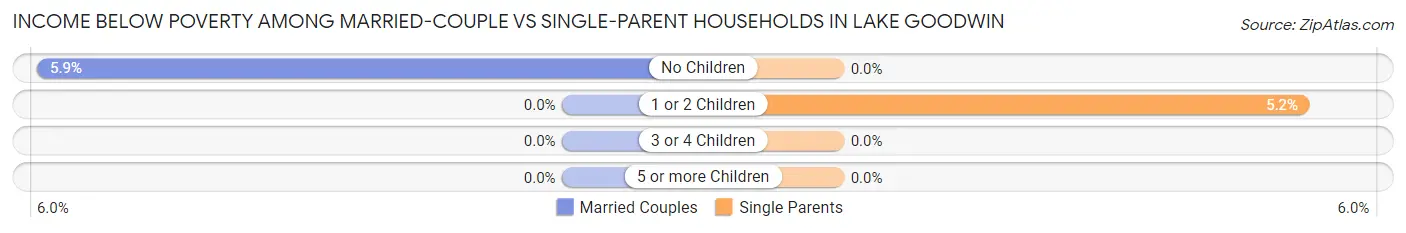
| Children | Married-Couple Families | Single-Parent Households |
| No Children | 65 (5.9%) | 0 (0.0%) |
| 1 or 2 Children | 0 (0.0%) | 11 (5.2%) |
| 3 or 4 Children | 0 (0.0%) | 0 (0.0%) |
| 5 or more Children | 0 (0.0%) | 0 (0.0%) |
| Total | 65 (4.7%) | 11 (3.2%) |
Race in Lake Goodwin
The most populous races in Lake Goodwin are White / Caucasian (4,813 | 86.2%), Two or more Races (445 | 8.0%), and Hispanic or Latino (228 | 4.1%).
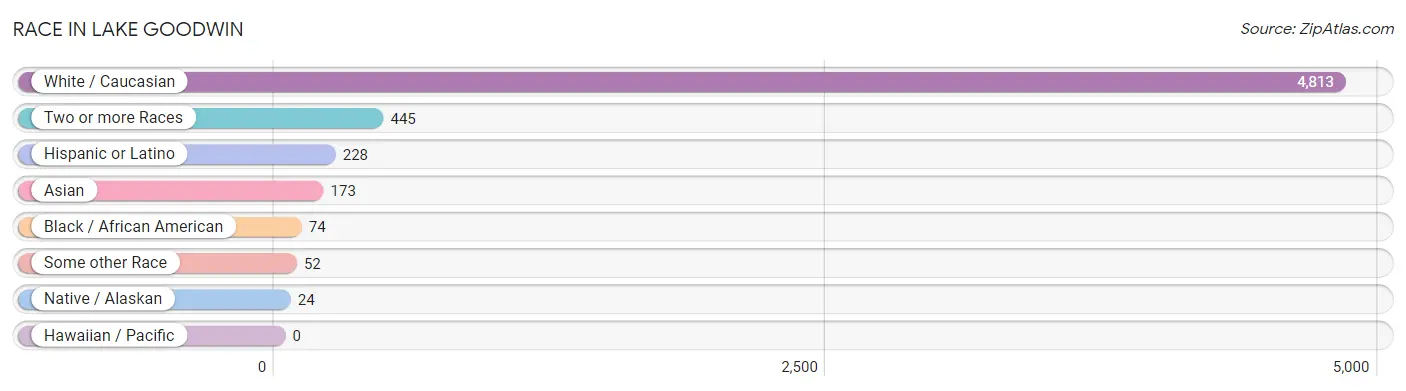
| Race | # Population | % Population |
| Asian | 173 | 3.1% |
| Black / African American | 74 | 1.3% |
| Hawaiian / Pacific | 0 | 0.0% |
| Hispanic or Latino | 228 | 4.1% |
| Native / Alaskan | 24 | 0.4% |
| White / Caucasian | 4,813 | 86.2% |
| Two or more Races | 445 | 8.0% |
| Some other Race | 52 | 0.9% |
| Total | 5,581 | 100.0% |
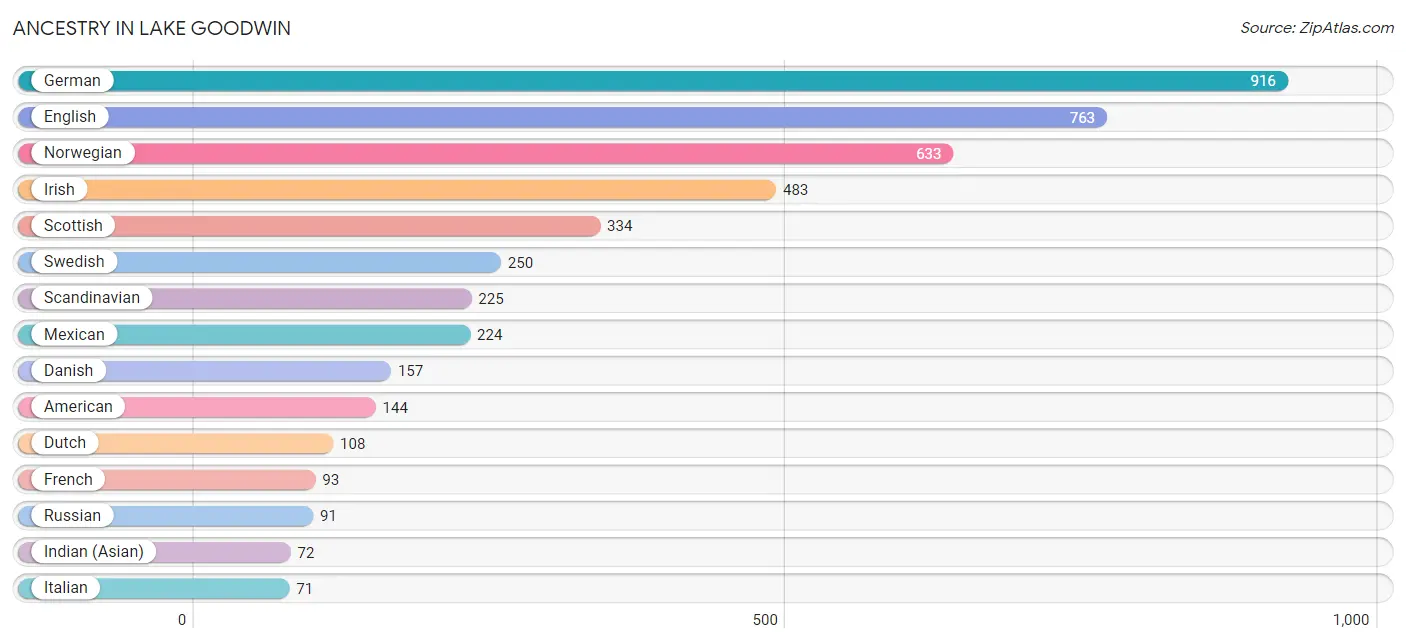
Ancestry in Lake Goodwin
The most populous ancestries reported in Lake Goodwin are German (916 | 16.4%), English (763 | 13.7%), Norwegian (633 | 11.3%), Irish (483 | 8.6%), and Scottish (334 | 6.0%), together accounting for 56.0% of all Lake Goodwin residents.
| Ancestry | # Population | % Population |
| African | 27 | 0.5% |
| American | 144 | 2.6% |
| Austrian | 32 | 0.6% |
| Basque | 16 | 0.3% |
| Bhutanese | 20 | 0.4% |
| British | 8 | 0.1% |
| Burmese | 56 | 1.0% |
| Canadian | 23 | 0.4% |
| Choctaw | 4 | 0.1% |
| Croatian | 10 | 0.2% |
| Danish | 157 | 2.8% |
| Dutch | 108 | 1.9% |
| Eastern European | 7 | 0.1% |
| English | 763 | 13.7% |
| European | 39 | 0.7% |
| Finnish | 30 | 0.5% |
| French | 93 | 1.7% |
| German | 916 | 16.4% |
| Ghanaian | 13 | 0.2% |
| Indian (Asian) | 72 | 1.3% |
| Irish | 483 | 8.6% |
| Italian | 71 | 1.3% |
| Korean | 12 | 0.2% |
| Latvian | 16 | 0.3% |
| Lithuanian | 43 | 0.8% |
| Mexican | 224 | 4.0% |
| Native Hawaiian | 17 | 0.3% |
| Nigerian | 19 | 0.3% |
| Northern European | 14 | 0.3% |
| Norwegian | 633 | 11.3% |
| Polish | 13 | 0.2% |
| Portuguese | 40 | 0.7% |
| Puget Sound Salish | 25 | 0.4% |
| Romanian | 10 | 0.2% |
| Russian | 91 | 1.6% |
| Scandinavian | 225 | 4.0% |
| Scotch-Irish | 14 | 0.3% |
| Scottish | 334 | 6.0% |
| Spanish American Indian | 8 | 0.1% |
| Subsaharan African | 46 | 0.8% |
| Swedish | 250 | 4.5% |
| Swiss | 5 | 0.1% |
| Thai | 62 | 1.1% |
| Ukrainian | 11 | 0.2% |
| Welsh | 50 | 0.9% | View All 45 Rows |
Immigrants in Lake Goodwin
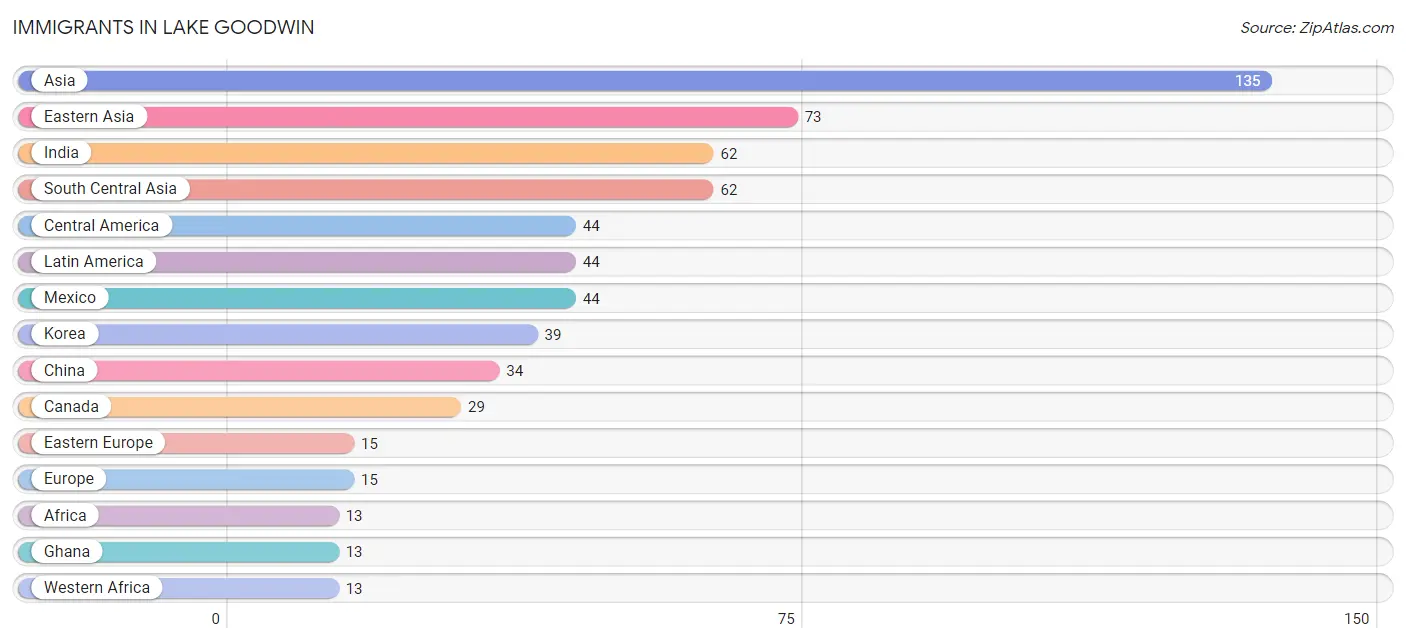
The most numerous immigrant groups reported in Lake Goodwin came from Asia (135 | 2.4%), Eastern Asia (73 | 1.3%), India (62 | 1.1%), South Central Asia (62 | 1.1%), and Central America (44 | 0.8%), together accounting for 6.7% of all Lake Goodwin residents.
| Immigration Origin | # Population | % Population |
| Africa | 13 | 0.2% |
| Asia | 135 | 2.4% |
| Canada | 29 | 0.5% |
| Central America | 44 | 0.8% |
| China | 34 | 0.6% |
| Eastern Asia | 73 | 1.3% |
| Eastern Europe | 15 | 0.3% |
| Europe | 15 | 0.3% |
| Ghana | 13 | 0.2% |
| India | 62 | 1.1% |
| Korea | 39 | 0.7% |
| Latin America | 44 | 0.8% |
| Mexico | 44 | 0.8% |
| Russia | 10 | 0.2% |
| South Central Asia | 62 | 1.1% |
| Ukraine | 5 | 0.1% |
| Western Africa | 13 | 0.2% | View All 17 Rows |
Sex and Age in Lake Goodwin
Sex and Age in Lake Goodwin
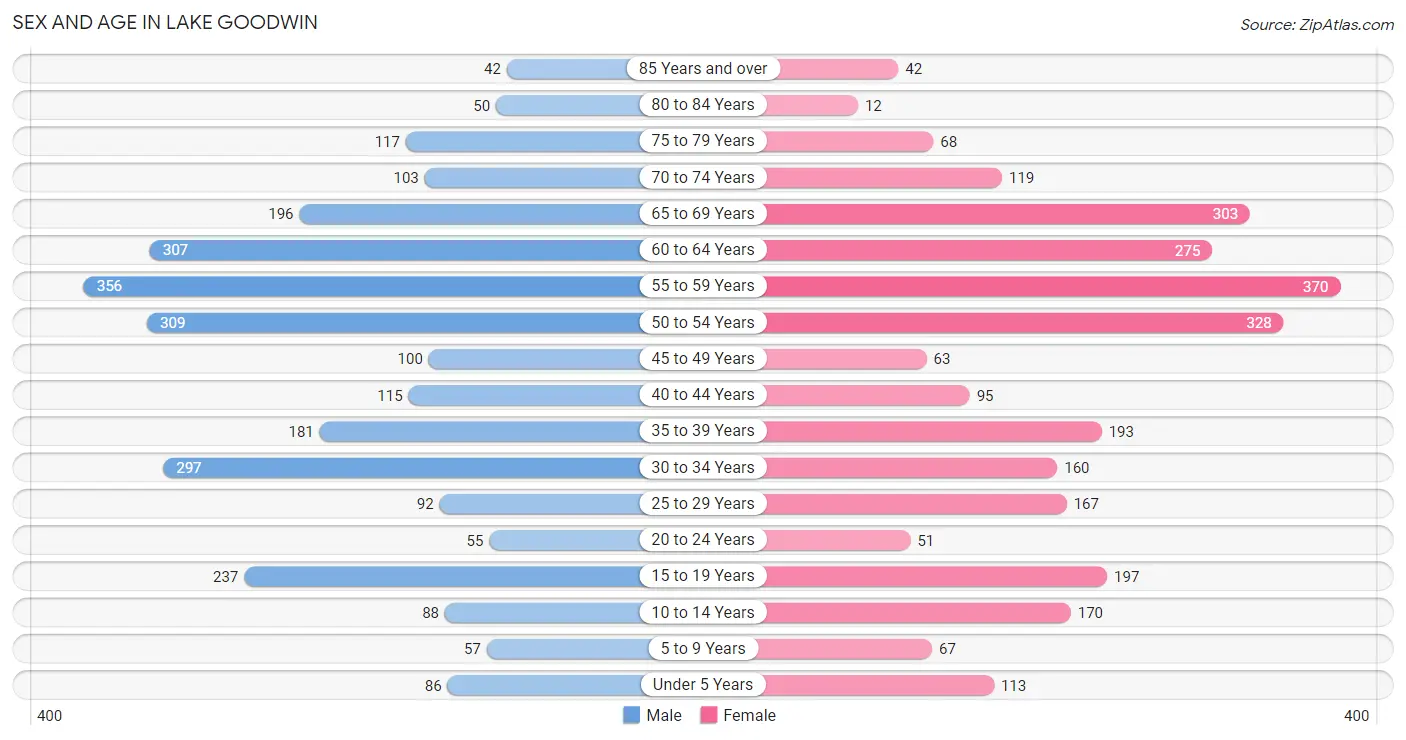
The most populous age groups in Lake Goodwin are 55 to 59 Years (356 | 12.8%) for men and 55 to 59 Years (370 | 13.3%) for women.
| Age Bracket | Male | Female |
| Under 5 Years | 86 (3.1%) | 113 (4.1%) |
| 5 to 9 Years | 57 (2.0%) | 67 (2.4%) |
| 10 to 14 Years | 88 (3.2%) | 170 (6.1%) |
| 15 to 19 Years | 237 (8.5%) | 197 (7.0%) |
| 20 to 24 Years | 55 (2.0%) | 51 (1.8%) |
| 25 to 29 Years | 92 (3.3%) | 167 (6.0%) |
| 30 to 34 Years | 297 (10.6%) | 160 (5.7%) |
| 35 to 39 Years | 181 (6.5%) | 193 (6.9%) |
| 40 to 44 Years | 115 (4.1%) | 95 (3.4%) |
| 45 to 49 Years | 100 (3.6%) | 63 (2.3%) |
| 50 to 54 Years | 309 (11.1%) | 328 (11.7%) |
| 55 to 59 Years | 356 (12.8%) | 370 (13.3%) |
| 60 to 64 Years | 307 (11.0%) | 275 (9.9%) |
| 65 to 69 Years | 196 (7.0%) | 303 (10.8%) |
| 70 to 74 Years | 103 (3.7%) | 119 (4.3%) |
| 75 to 79 Years | 117 (4.2%) | 68 (2.4%) |
| 80 to 84 Years | 50 (1.8%) | 12 (0.4%) |
| 85 Years and over | 42 (1.5%) | 42 (1.5%) |
| Total | 2,788 (100.0%) | 2,793 (100.0%) |
Families and Households in Lake Goodwin
Median Family Size in Lake Goodwin
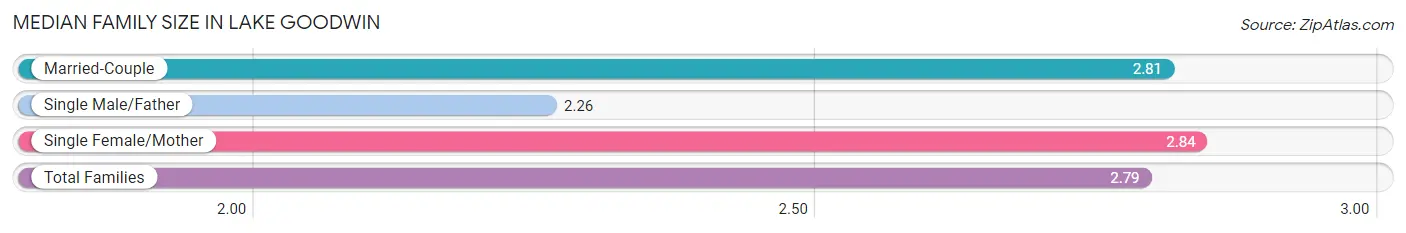
The median family size in Lake Goodwin is 2.79 persons per family, with single female/mother families (251 | 14.6%) accounting for the largest median family size of 2.84 persons per family. On the other hand, single male/father families (90 | 5.2%) represent the smallest median family size with 2.26 persons per family.
| Family Type | # Families | Family Size |
| Married-Couple | 1,383 (80.2%) | 2.81 |
| Single Male/Father | 90 (5.2%) | 2.26 |
| Single Female/Mother | 251 (14.6%) | 2.84 |
| Total Families | 1,724 (100.0%) | 2.79 |
Median Household Size in Lake Goodwin
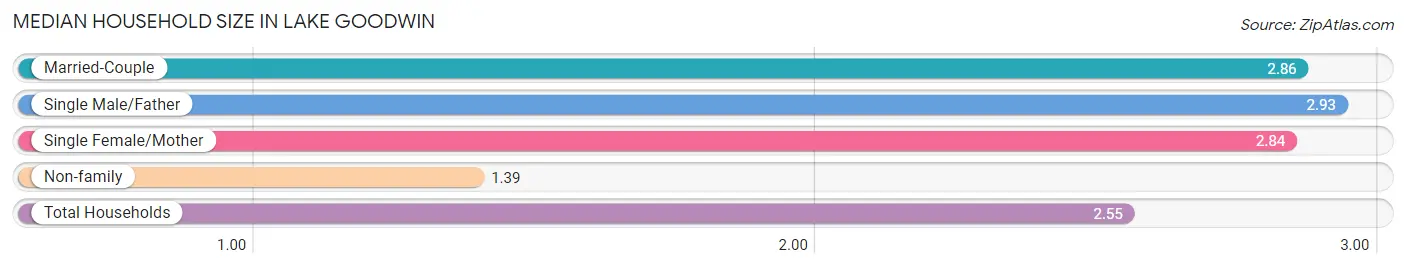
The median household size in Lake Goodwin is 2.55 persons per household, with single male/father households (90 | 4.1%) accounting for the largest median household size of 2.93 persons per household. non-family households (466 | 21.3%) represent the smallest median household size with 1.39 persons per household.
| Household Type | # Households | Household Size |
| Married-Couple | 1,383 (63.1%) | 2.86 |
| Single Male/Father | 90 (4.1%) | 2.93 |
| Single Female/Mother | 251 (11.5%) | 2.84 |
| Non-family | 466 (21.3%) | 1.39 |
| Total Households | 2,190 (100.0%) | 2.55 |
Household Size by Marriage Status in Lake Goodwin
Out of a total of 2,190 households in Lake Goodwin, 1,724 (78.7%) are family households, while 466 (21.3%) are nonfamily households. The most numerous type of family households are 2-person households, comprising 853, and the most common type of nonfamily households are 1-person households, comprising 356.
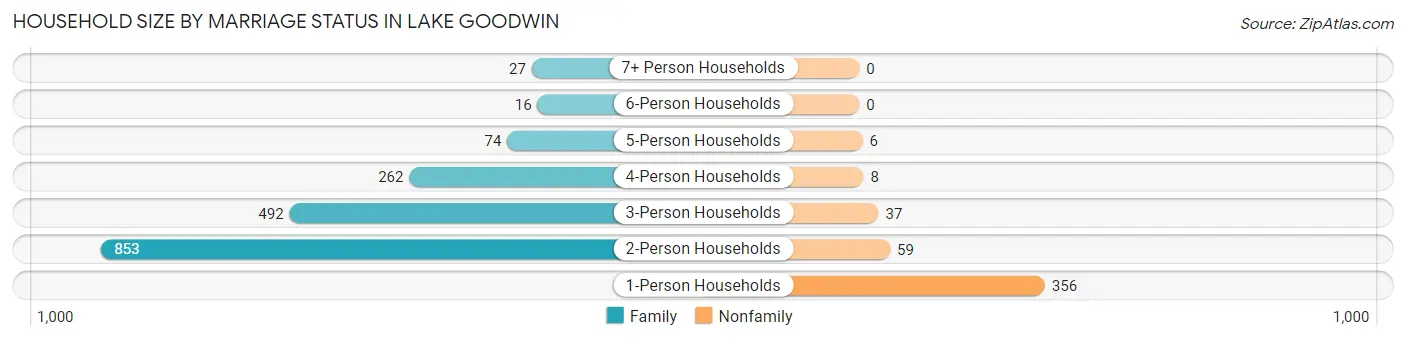
| Household Size | Family Households | Nonfamily Households |
| 1-Person Households | - | 356 (16.3%) |
| 2-Person Households | 853 (39.0%) | 59 (2.7%) |
| 3-Person Households | 492 (22.5%) | 37 (1.7%) |
| 4-Person Households | 262 (12.0%) | 8 (0.4%) |
| 5-Person Households | 74 (3.4%) | 6 (0.3%) |
| 6-Person Households | 16 (0.7%) | 0 (0.0%) |
| 7+ Person Households | 27 (1.2%) | 0 (0.0%) |
| Total | 1,724 (78.7%) | 466 (21.3%) |
Female Fertility in Lake Goodwin
Fertility by Age in Lake Goodwin
Average fertility rate in Lake Goodwin is 11.0 births per 1,000 women. Women in the age bracket of 20 to 34 years have the highest fertility rate with 29.0 births per 1,000 women. Women in the age bracket of 20 to 34 years acount for 100.0% of all women with births.
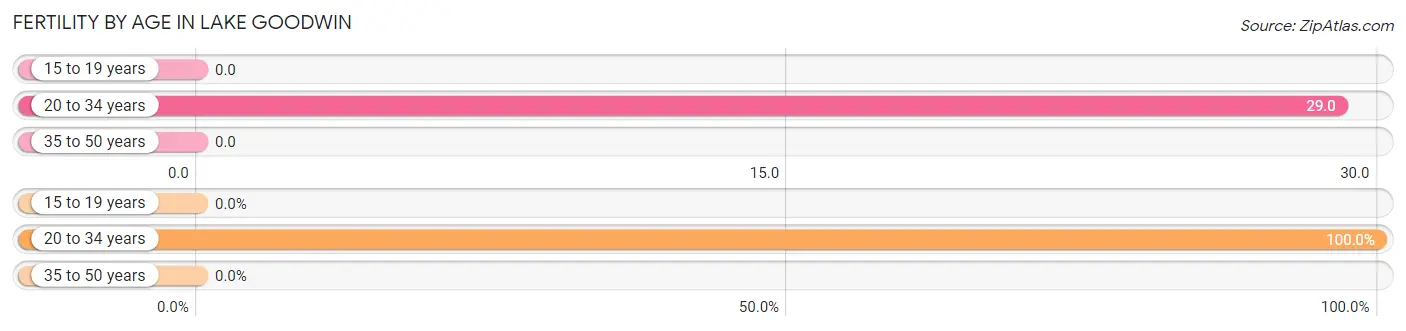
| Age Bracket | Women with Births | Births / 1,000 Women |
| 15 to 19 years | 0 (0.0%) | 0.0 |
| 20 to 34 years | 11 (100.0%) | 29.0 |
| 35 to 50 years | 0 (0.0%) | 0.0 |
| Total | 11 (100.0%) | 11.0 |
Fertility by Age by Marriage Status in Lake Goodwin
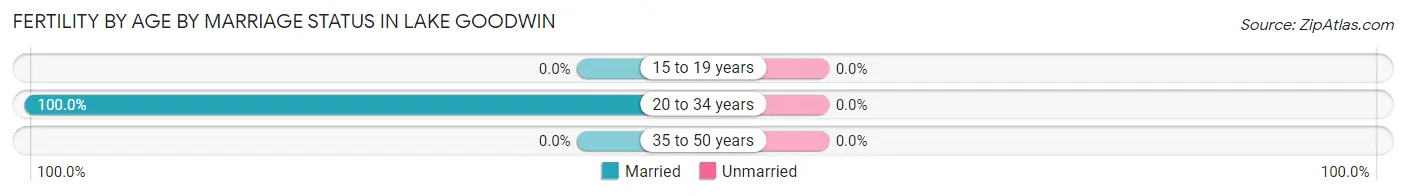
| Age Bracket | Married | Unmarried |
| 15 to 19 years | 0 (0.0%) | 0 (0.0%) |
| 20 to 34 years | 11 (100.0%) | 0 (0.0%) |
| 35 to 50 years | 0 (0.0%) | 0 (0.0%) |
| Total | 11 (100.0%) | 0 (0.0%) |
Fertility by Education in Lake Goodwin
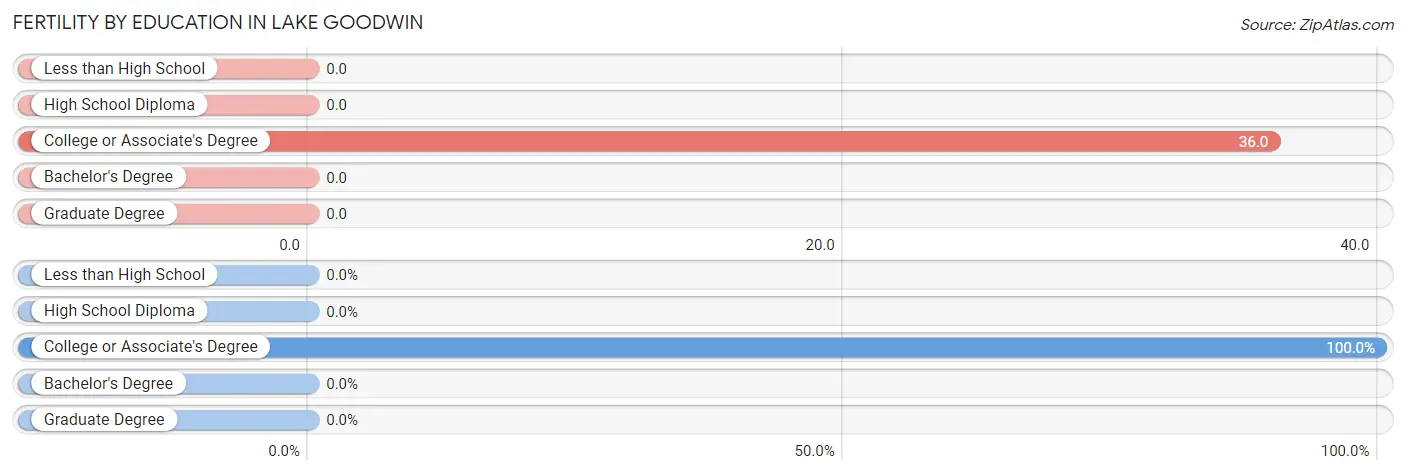
| Educational Attainment | Women with Births | Births / 1,000 Women |
| Less than High School | 0 (0.0%) | 0.0 |
| High School Diploma | 0 (0.0%) | 0.0 |
| College or Associate's Degree | 11 (100.0%) | 36.0 |
| Bachelor's Degree | 0 (0.0%) | 0.0 |
| Graduate Degree | 0 (0.0%) | 0.0 |
| Total | 11 (100.0%) | 11.0 |
Fertility by Education by Marriage Status in Lake Goodwin
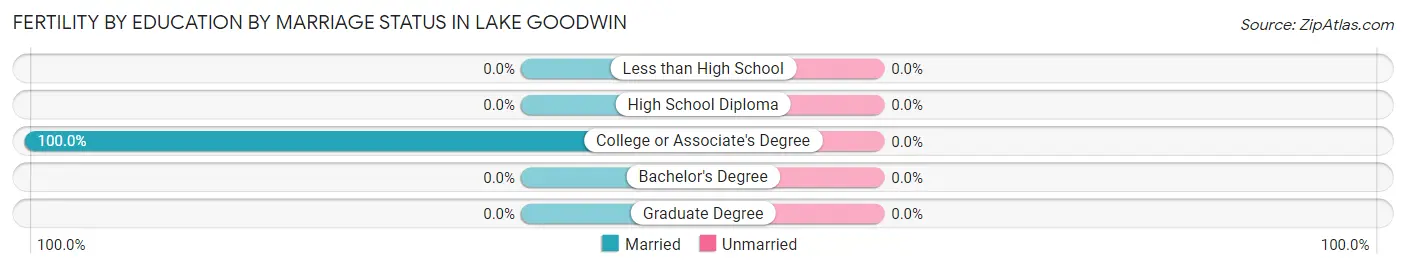
| Educational Attainment | Married | Unmarried |
| Less than High School | 0 (0.0%) | 0 (0.0%) |
| High School Diploma | 0 (0.0%) | 0 (0.0%) |
| College or Associate's Degree | 11 (100.0%) | 0 (0.0%) |
| Bachelor's Degree | 0 (0.0%) | 0 (0.0%) |
| Graduate Degree | 0 (0.0%) | 0 (0.0%) |
| Total | 11 (100.0%) | 0 (0.0%) |
Employment Characteristics in Lake Goodwin
Employment by Class of Employer in Lake Goodwin
Among the 2,893 employed individuals in Lake Goodwin, private company employees (2,059 | 71.2%), not-for-profit organizations (262 | 9.1%), and local government employees (237 | 8.2%) make up the most common classes of employment.
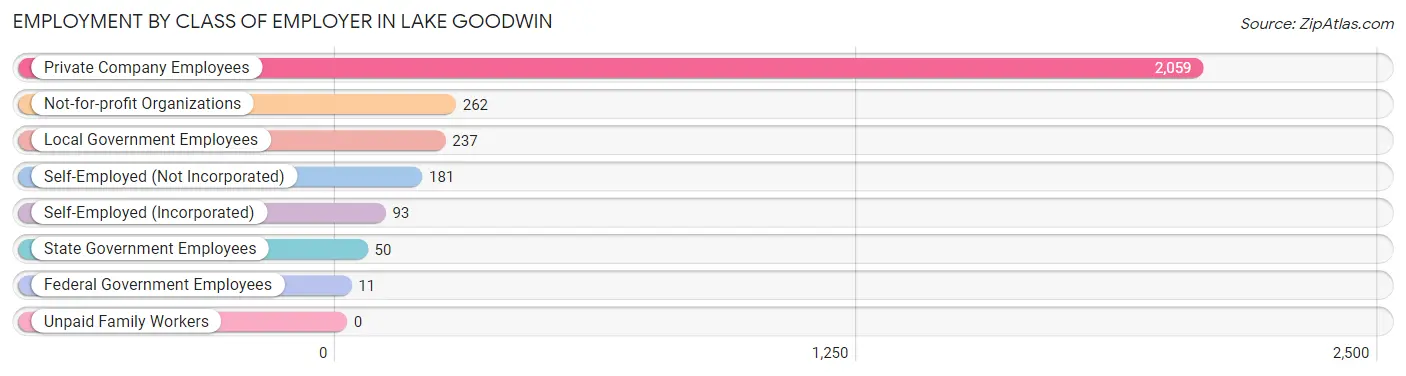
| Employer Class | # Employees | % Employees |
| Private Company Employees | 2,059 | 71.2% |
| Self-Employed (Incorporated) | 93 | 3.2% |
| Self-Employed (Not Incorporated) | 181 | 6.3% |
| Not-for-profit Organizations | 262 | 9.1% |
| Local Government Employees | 237 | 8.2% |
| State Government Employees | 50 | 1.7% |
| Federal Government Employees | 11 | 0.4% |
| Unpaid Family Workers | 0 | 0.0% |
| Total | 2,893 | 100.0% |
Employment Status by Age in Lake Goodwin
According to the labor force statistics for Lake Goodwin, out of the total population over 16 years of age (4,942), 61.7% or 3,049 individuals are in the labor force, with 3.7% or 113 of them unemployed. The age group with the highest labor force participation rate is 30 to 34 years, with 96.5% or 441 individuals in the labor force. Within the labor force, the 16 to 19 years age range has the highest percentage of unemployed individuals, with 28.2% or 60 of them being unemployed.

| Age Bracket | In Labor Force | Unemployed |
| 16 to 19 Years | 213 (56.6%) | 60 (28.2%) |
| 20 to 24 Years | 97 (91.5%) | 0 (0.0%) |
| 25 to 29 Years | 163 (62.9%) | 0 (0.0%) |
| 30 to 34 Years | 441 (96.5%) | 9 (2.0%) |
| 35 to 44 Years | 461 (78.9%) | 35 (7.6%) |
| 45 to 54 Years | 662 (82.8%) | 0 (0.0%) |
| 55 to 59 Years | 540 (74.4%) | 0 (0.0%) |
| 60 to 64 Years | 356 (61.2%) | 8 (2.2%) |
| 65 to 74 Years | 110 (15.3%) | 0 (0.0%) |
| 75 Years and over | 7 (2.1%) | 0 (0.0%) |
| Total | 3,049 (61.7%) | 113 (3.7%) |
Employment Status by Educational Attainment in Lake Goodwin
According to labor force statistics for Lake Goodwin, 77.0% of individuals (2,624) out of the total population between 25 and 64 years of age (3,408) are in the labor force, with 2.0% or 52 of them being unemployed. The group with the highest labor force participation rate are those with the educational attainment of college / associate degree, with 81.3% or 1,008 individuals in the labor force. Within the labor force, individuals with less than high school education have the highest percentage of unemployment, with 6.0% or 6 of them being unemployed.
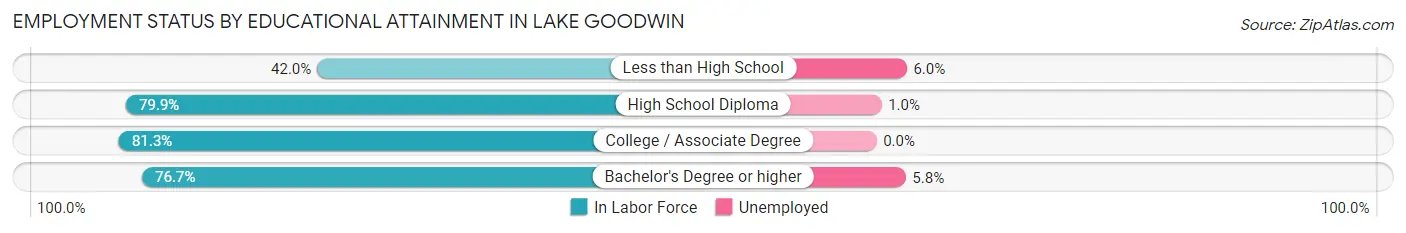
| Educational Attainment | In Labor Force | Unemployed |
| Less than High School | 100 (42.0%) | 14 (6.0%) |
| High School Diploma | 873 (79.9%) | 11 (1.0%) |
| College / Associate Degree | 1,008 (81.3%) | 0 (0.0%) |
| Bachelor's Degree or higher | 643 (76.7%) | 49 (5.8%) |
| Total | 2,624 (77.0%) | 68 (2.0%) |
Employment Occupations by Sex in Lake Goodwin
Management, Business, Science and Arts Occupations
The most common Management, Business, Science and Arts occupations in Lake Goodwin are Computers, Engineering & Science (394 | 13.4%), Community & Social Service (258 | 8.8%), Management (250 | 8.5%), Architecture & Engineering (233 | 7.9%), and Computers & Mathematics (161 | 5.5%).
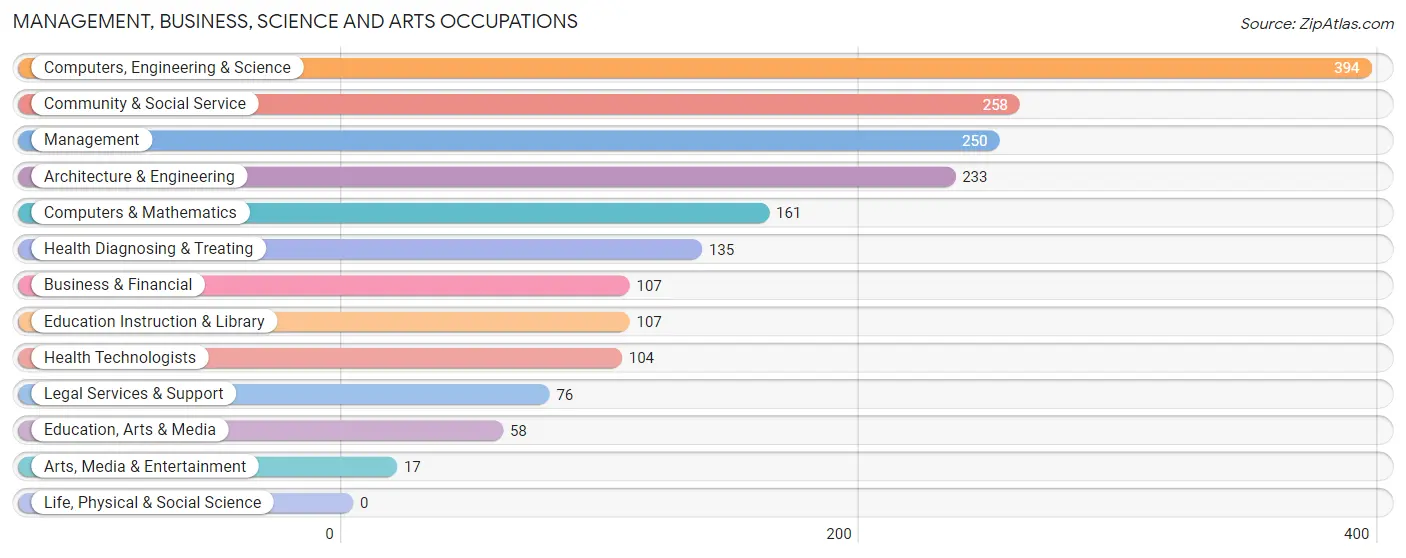
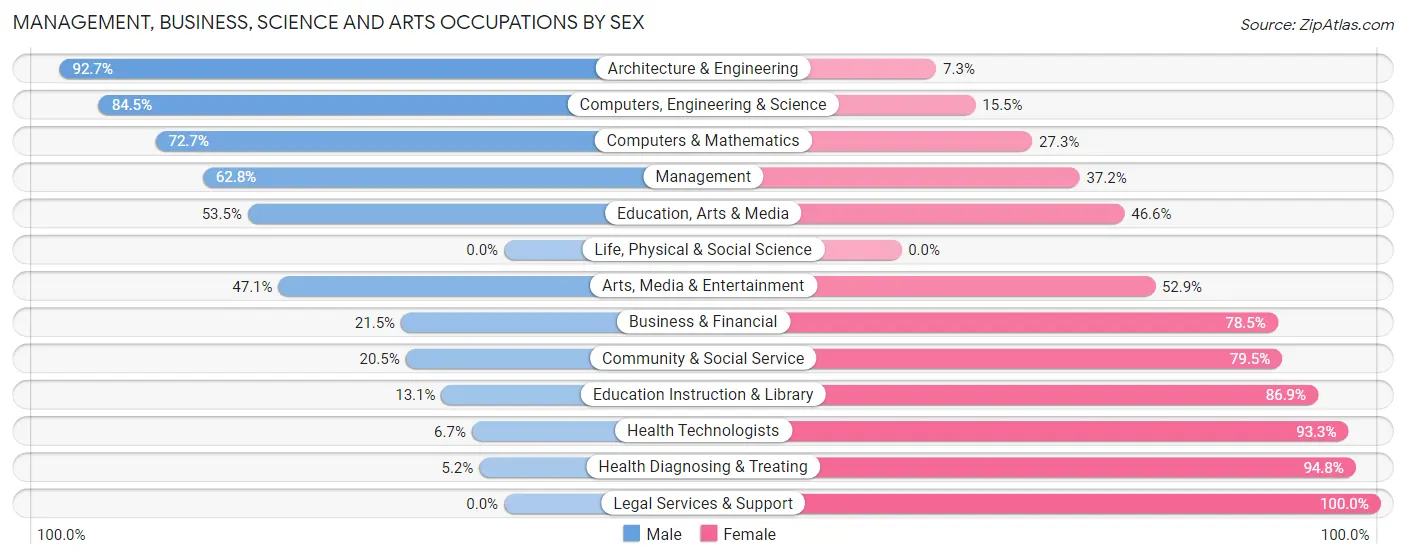
Management, Business, Science and Arts Occupations by Sex
Within the Management, Business, Science and Arts occupations in Lake Goodwin, the most male-oriented occupations are Architecture & Engineering (92.7%), Computers, Engineering & Science (84.5%), and Computers & Mathematics (72.7%), while the most female-oriented occupations are Legal Services & Support (100.0%), Health Diagnosing & Treating (94.8%), and Health Technologists (93.3%).
| Occupation | Male | Female |
| Management | 157 (62.8%) | 93 (37.2%) |
| Business & Financial | 23 (21.5%) | 84 (78.5%) |
| Computers, Engineering & Science | 333 (84.5%) | 61 (15.5%) |
| Computers & Mathematics | 117 (72.7%) | 44 (27.3%) |
| Architecture & Engineering | 216 (92.7%) | 17 (7.3%) |
| Life, Physical & Social Science | 0 (0.0%) | 0 (0.0%) |
| Community & Social Service | 53 (20.5%) | 205 (79.5%) |
| Education, Arts & Media | 31 (53.4%) | 27 (46.6%) |
| Legal Services & Support | 0 (0.0%) | 76 (100.0%) |
| Education Instruction & Library | 14 (13.1%) | 93 (86.9%) |
| Arts, Media & Entertainment | 8 (47.1%) | 9 (52.9%) |
| Health Diagnosing & Treating | 7 (5.2%) | 128 (94.8%) |
| Health Technologists | 7 (6.7%) | 97 (93.3%) |
| Total (Category) | 573 (50.1%) | 571 (49.9%) |
| Total (Overall) | 1,643 (55.9%) | 1,295 (44.1%) |
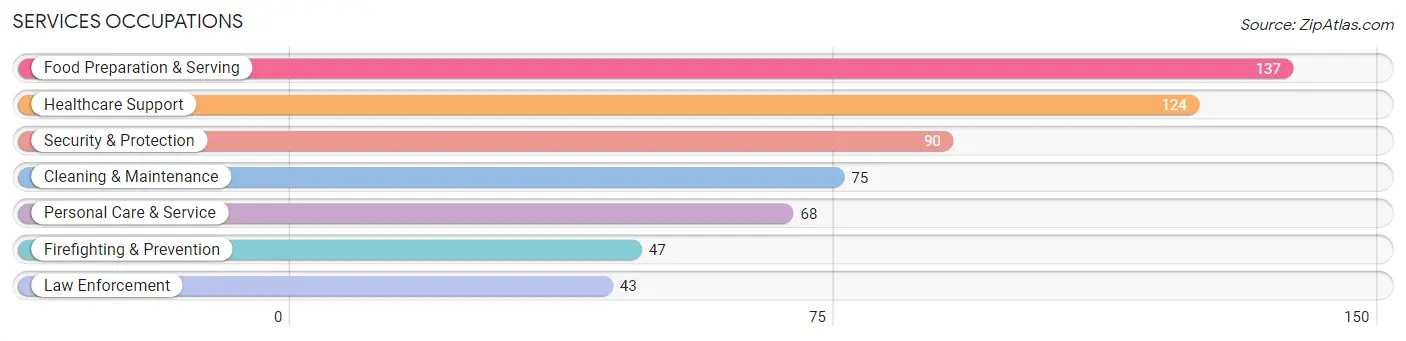
Services Occupations
The most common Services occupations in Lake Goodwin are Food Preparation & Serving (137 | 4.7%), Healthcare Support (124 | 4.2%), Security & Protection (90 | 3.1%), Cleaning & Maintenance (75 | 2.5%), and Personal Care & Service (68 | 2.3%).
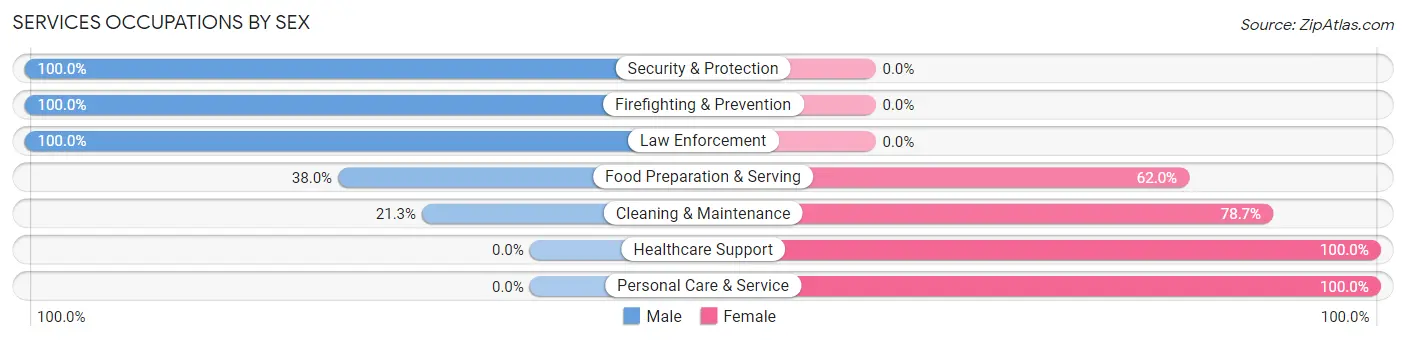
Services Occupations by Sex
Within the Services occupations in Lake Goodwin, the most male-oriented occupations are Security & Protection (100.0%), Firefighting & Prevention (100.0%), and Law Enforcement (100.0%), while the most female-oriented occupations are Healthcare Support (100.0%), Personal Care & Service (100.0%), and Cleaning & Maintenance (78.7%).
| Occupation | Male | Female |
| Healthcare Support | 0 (0.0%) | 124 (100.0%) |
| Security & Protection | 90 (100.0%) | 0 (0.0%) |
| Firefighting & Prevention | 47 (100.0%) | 0 (0.0%) |
| Law Enforcement | 43 (100.0%) | 0 (0.0%) |
| Food Preparation & Serving | 52 (38.0%) | 85 (62.0%) |
| Cleaning & Maintenance | 16 (21.3%) | 59 (78.7%) |
| Personal Care & Service | 0 (0.0%) | 68 (100.0%) |
| Total (Category) | 158 (32.0%) | 336 (68.0%) |
| Total (Overall) | 1,643 (55.9%) | 1,295 (44.1%) |
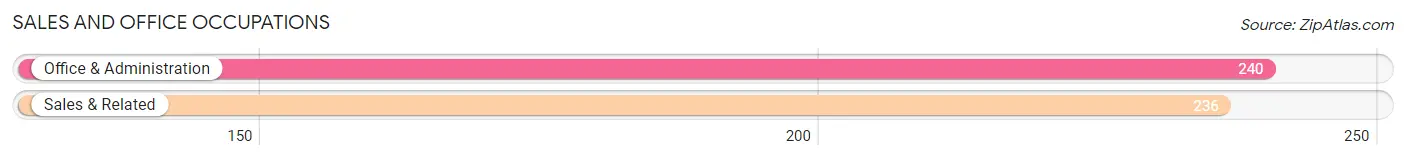
Sales and Office Occupations
The most common Sales and Office occupations in Lake Goodwin are Office & Administration (240 | 8.2%), and Sales & Related (236 | 8.0%).
Sales and Office Occupations by Sex
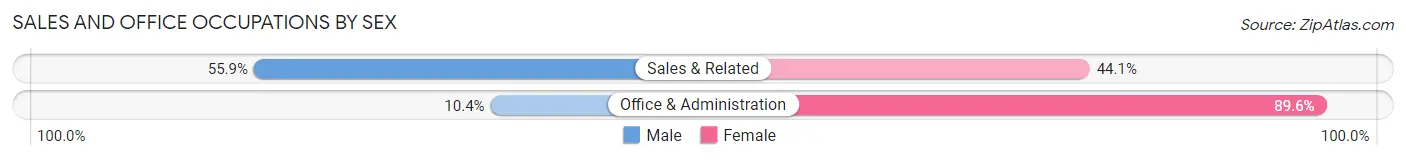
| Occupation | Male | Female |
| Sales & Related | 132 (55.9%) | 104 (44.1%) |
| Office & Administration | 25 (10.4%) | 215 (89.6%) |
| Total (Category) | 157 (33.0%) | 319 (67.0%) |
| Total (Overall) | 1,643 (55.9%) | 1,295 (44.1%) |
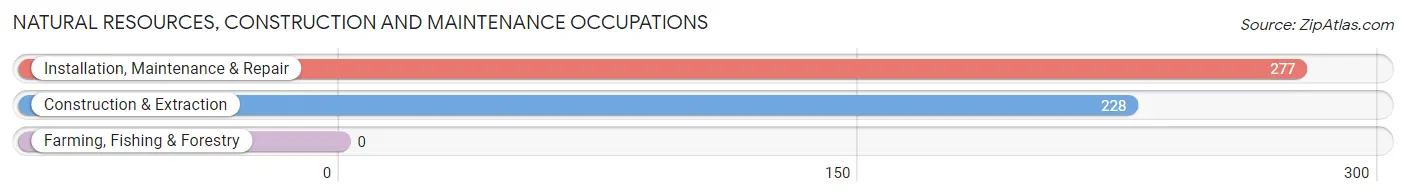
Natural Resources, Construction and Maintenance Occupations
The most common Natural Resources, Construction and Maintenance occupations in Lake Goodwin are Installation, Maintenance & Repair (277 | 9.4%), and Construction & Extraction (228 | 7.8%).
Natural Resources, Construction and Maintenance Occupations by Sex
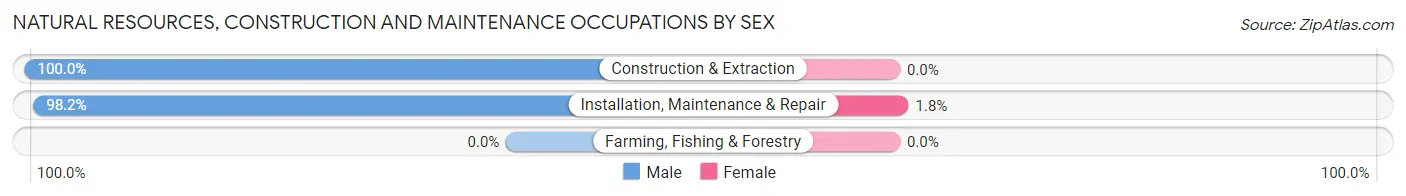
| Occupation | Male | Female |
| Farming, Fishing & Forestry | 0 (0.0%) | 0 (0.0%) |
| Construction & Extraction | 228 (100.0%) | 0 (0.0%) |
| Installation, Maintenance & Repair | 272 (98.2%) | 5 (1.8%) |
| Total (Category) | 500 (99.0%) | 5 (1.0%) |
| Total (Overall) | 1,643 (55.9%) | 1,295 (44.1%) |
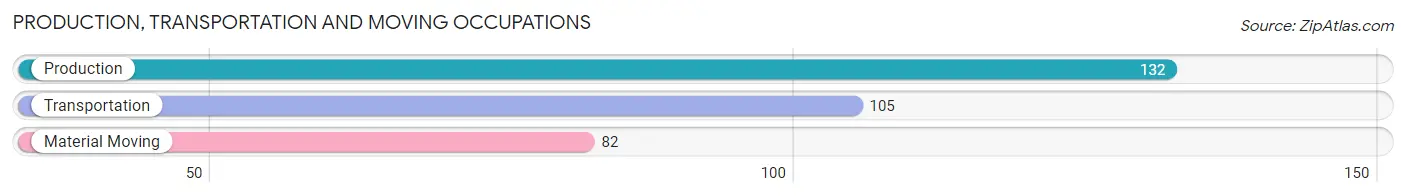
Production, Transportation and Moving Occupations
The most common Production, Transportation and Moving occupations in Lake Goodwin are Production (132 | 4.5%), Transportation (105 | 3.6%), and Material Moving (82 | 2.8%).
Production, Transportation and Moving Occupations by Sex
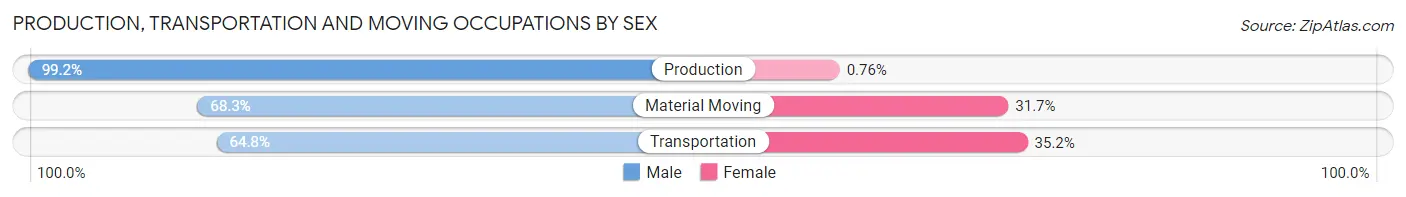
| Occupation | Male | Female |
| Production | 131 (99.2%) | 1 (0.8%) |
| Transportation | 68 (64.8%) | 37 (35.2%) |
| Material Moving | 56 (68.3%) | 26 (31.7%) |
| Total (Category) | 255 (79.9%) | 64 (20.1%) |
| Total (Overall) | 1,643 (55.9%) | 1,295 (44.1%) |
Employment Industries by Sex in Lake Goodwin
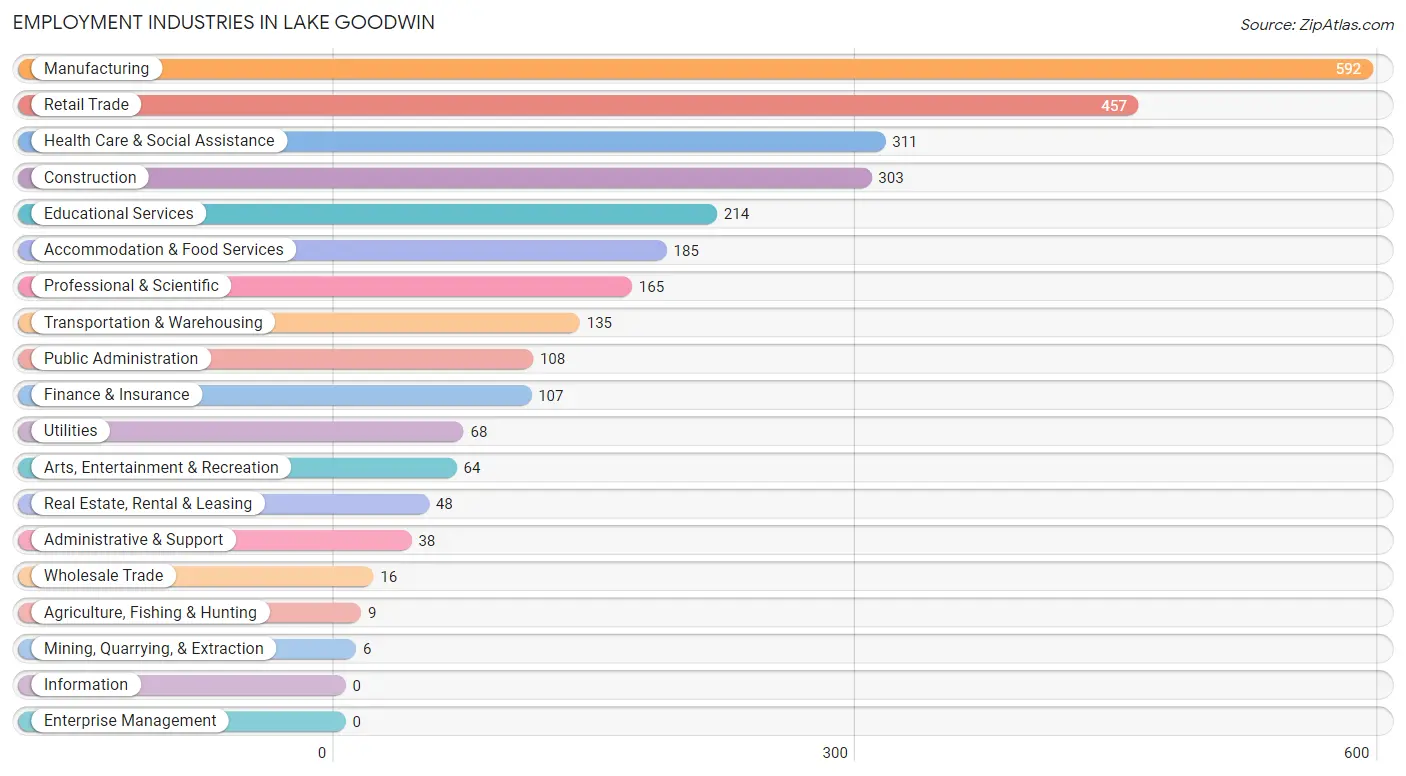
Employment Industries in Lake Goodwin
The major employment industries in Lake Goodwin include Manufacturing (592 | 20.2%), Retail Trade (457 | 15.5%), Health Care & Social Assistance (311 | 10.6%), Construction (303 | 10.3%), and Educational Services (214 | 7.3%).
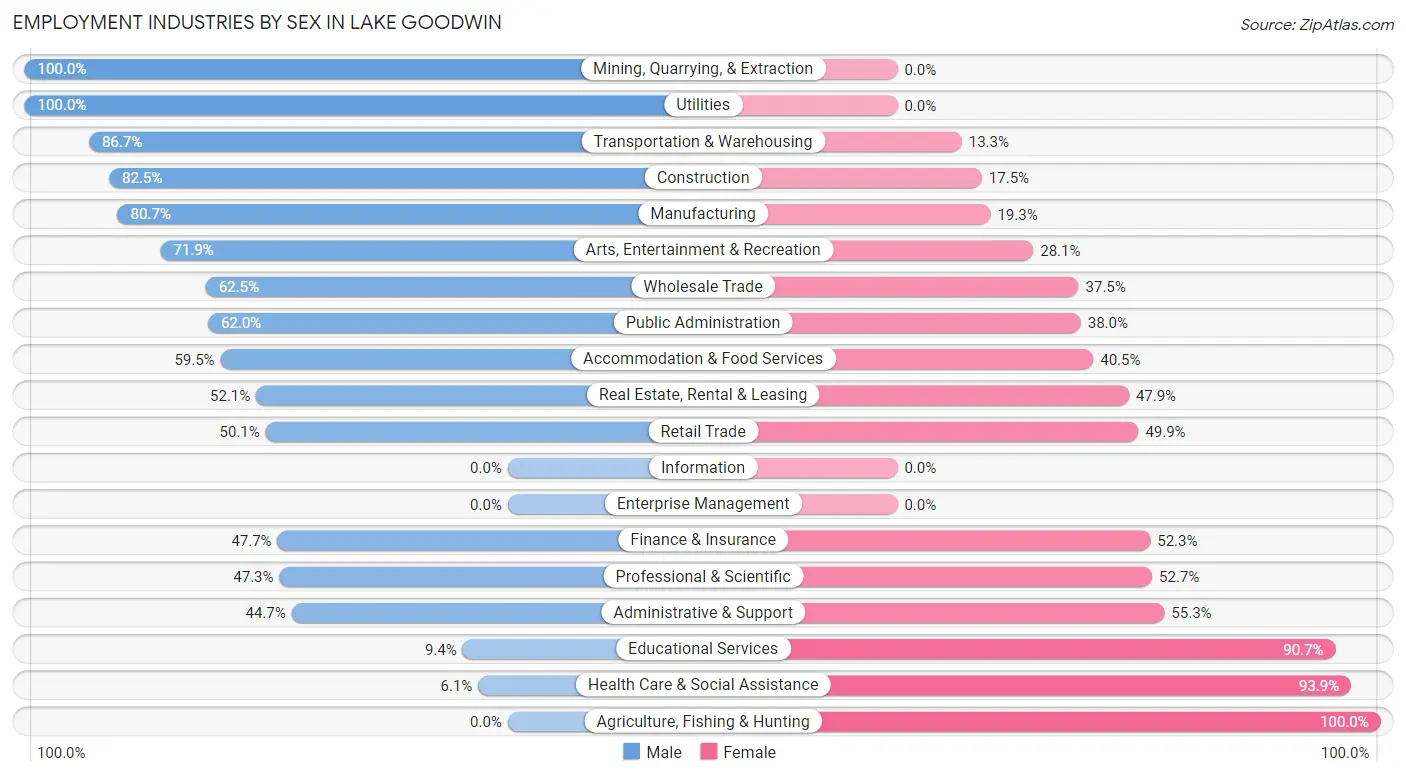
Employment Industries by Sex in Lake Goodwin
The Lake Goodwin industries that see more men than women are Mining, Quarrying, & Extraction (100.0%), Utilities (100.0%), and Transportation & Warehousing (86.7%), whereas the industries that tend to have a higher number of women are Agriculture, Fishing & Hunting (100.0%), Health Care & Social Assistance (93.9%), and Educational Services (90.6%).
| Industry | Male | Female |
| Agriculture, Fishing & Hunting | 0 (0.0%) | 9 (100.0%) |
| Mining, Quarrying, & Extraction | 6 (100.0%) | 0 (0.0%) |
| Construction | 250 (82.5%) | 53 (17.5%) |
| Manufacturing | 478 (80.7%) | 114 (19.3%) |
| Wholesale Trade | 10 (62.5%) | 6 (37.5%) |
| Retail Trade | 229 (50.1%) | 228 (49.9%) |
| Transportation & Warehousing | 117 (86.7%) | 18 (13.3%) |
| Utilities | 68 (100.0%) | 0 (0.0%) |
| Information | 0 (0.0%) | 0 (0.0%) |
| Finance & Insurance | 51 (47.7%) | 56 (52.3%) |
| Real Estate, Rental & Leasing | 25 (52.1%) | 23 (47.9%) |
| Professional & Scientific | 78 (47.3%) | 87 (52.7%) |
| Enterprise Management | 0 (0.0%) | 0 (0.0%) |
| Administrative & Support | 17 (44.7%) | 21 (55.3%) |
| Educational Services | 20 (9.3%) | 194 (90.6%) |
| Health Care & Social Assistance | 19 (6.1%) | 292 (93.9%) |
| Arts, Entertainment & Recreation | 46 (71.9%) | 18 (28.1%) |
| Accommodation & Food Services | 110 (59.5%) | 75 (40.5%) |
| Public Administration | 67 (62.0%) | 41 (38.0%) |
| Total | 1,643 (55.9%) | 1,295 (44.1%) |
Education in Lake Goodwin
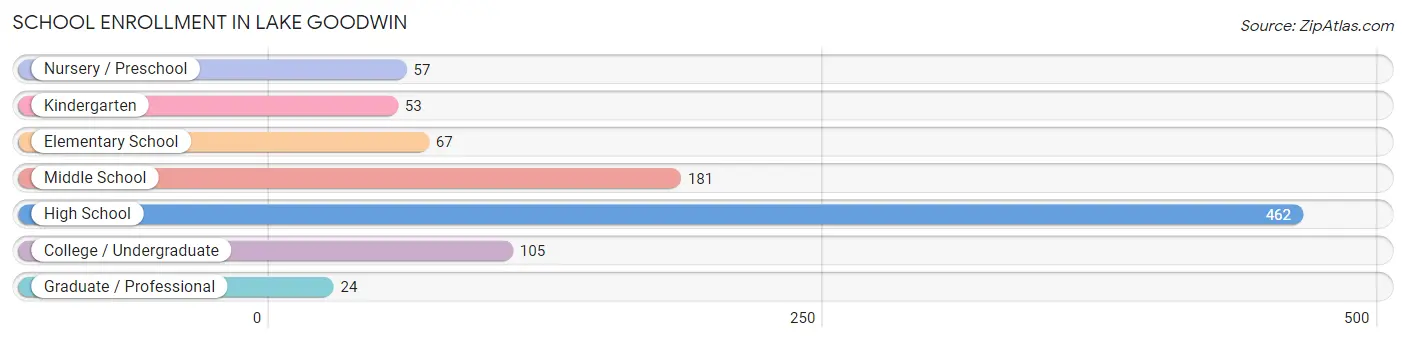
School Enrollment in Lake Goodwin
The most common levels of schooling among the 949 students in Lake Goodwin are high school (462 | 48.7%), middle school (181 | 19.1%), and college / undergraduate (105 | 11.1%).
| School Level | # Students | % Students |
| Nursery / Preschool | 57 | 6.0% |
| Kindergarten | 53 | 5.6% |
| Elementary School | 67 | 7.1% |
| Middle School | 181 | 19.1% |
| High School | 462 | 48.7% |
| College / Undergraduate | 105 | 11.1% |
| Graduate / Professional | 24 | 2.5% |
| Total | 949 | 100.0% |
School Enrollment by Age by Funding Source in Lake Goodwin
Out of a total of 949 students who are enrolled in schools in Lake Goodwin, 280 (29.5%) attend a private institution, while the remaining 669 (70.5%) are enrolled in public schools. The age group of 3 to 4 year olds has the highest likelihood of being enrolled in private schools, with 40 (70.2% in the age bracket) enrolled. Conversely, the age group of 18 to 19 year olds has the lowest likelihood of being enrolled in a private school, with 78 (100.0% in the age bracket) attending a public institution.
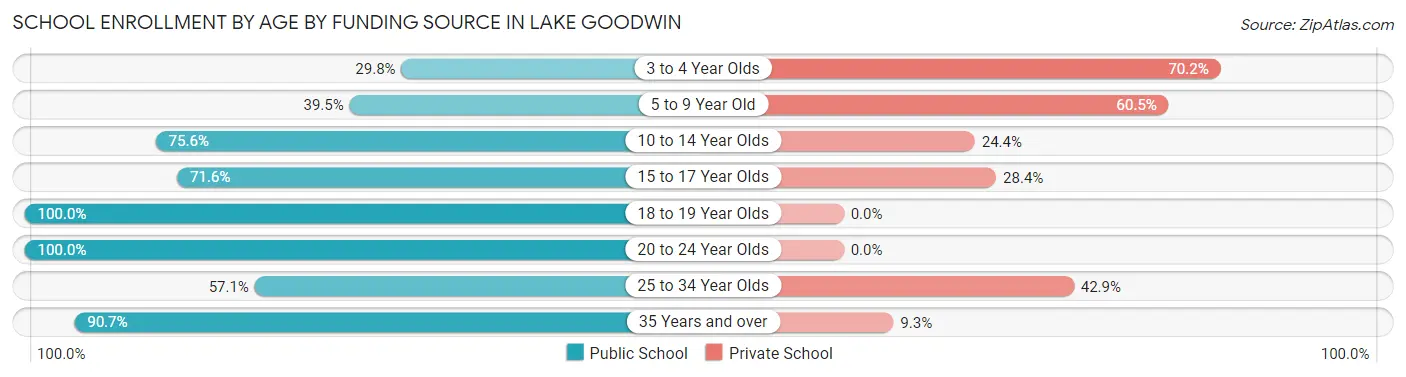
| Age Bracket | Public School | Private School |
| 3 to 4 Year Olds | 17 (29.8%) | 40 (70.2%) |
| 5 to 9 Year Old | 45 (39.5%) | 69 (60.5%) |
| 10 to 14 Year Olds | 195 (75.6%) | 63 (24.4%) |
| 15 to 17 Year Olds | 237 (71.6%) | 94 (28.4%) |
| 18 to 19 Year Olds | 78 (100.0%) | 0 (0.0%) |
| 20 to 24 Year Olds | 36 (100.0%) | 0 (0.0%) |
| 25 to 34 Year Olds | 12 (57.1%) | 9 (42.9%) |
| 35 Years and over | 49 (90.7%) | 5 (9.3%) |
| Total | 669 (70.5%) | 280 (29.5%) |
Educational Attainment by Field of Study in Lake Goodwin
Engineering (214 | 17.4%), arts & humanities (190 | 15.5%), physical & health sciences (144 | 11.7%), education (113 | 9.2%), and social sciences (97 | 7.9%) are the most common fields of study among 1,228 individuals in Lake Goodwin who have obtained a bachelor's degree or higher.
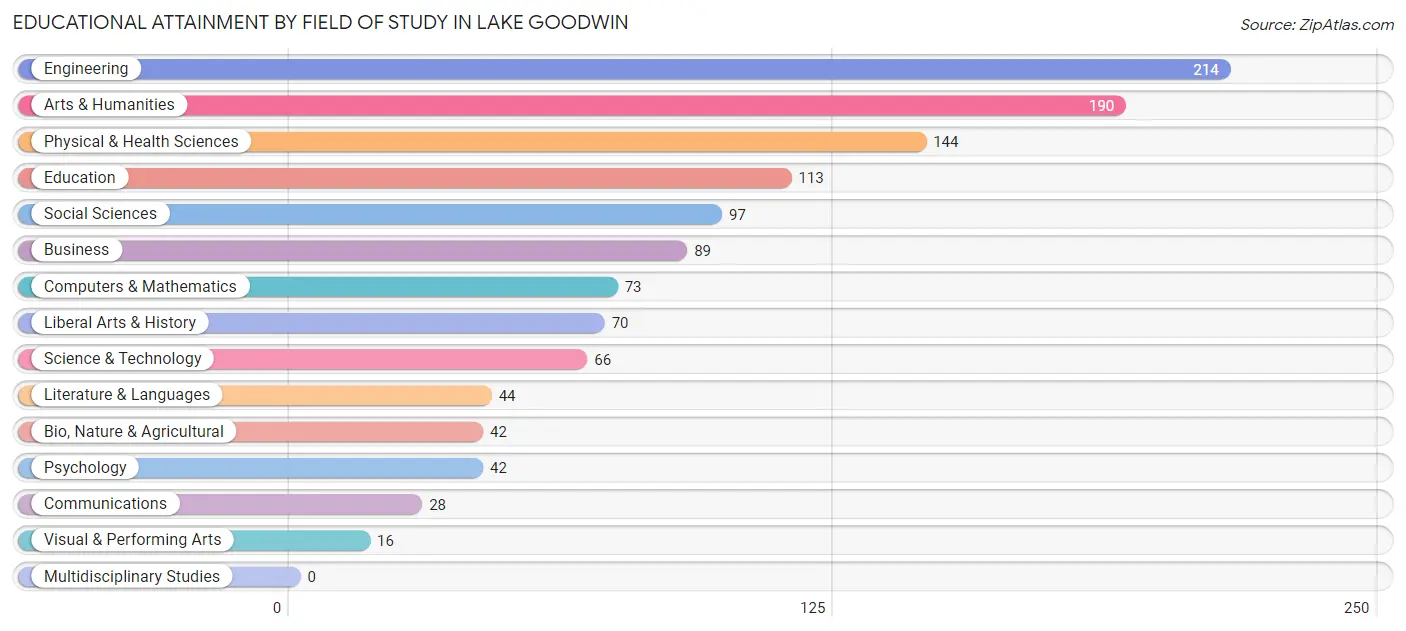
| Field of Study | # Graduates | % Graduates |
| Computers & Mathematics | 73 | 5.9% |
| Bio, Nature & Agricultural | 42 | 3.4% |
| Physical & Health Sciences | 144 | 11.7% |
| Psychology | 42 | 3.4% |
| Social Sciences | 97 | 7.9% |
| Engineering | 214 | 17.4% |
| Multidisciplinary Studies | 0 | 0.0% |
| Science & Technology | 66 | 5.4% |
| Business | 89 | 7.2% |
| Education | 113 | 9.2% |
| Literature & Languages | 44 | 3.6% |
| Liberal Arts & History | 70 | 5.7% |
| Visual & Performing Arts | 16 | 1.3% |
| Communications | 28 | 2.3% |
| Arts & Humanities | 190 | 15.5% |
| Total | 1,228 | 100.0% |
Transportation & Commute in Lake Goodwin
Vehicle Availability by Sex in Lake Goodwin
The most prevalent vehicle ownership categories in Lake Goodwin are males with 3 vehicles (659, accounting for 40.3%) and females with 3 vehicles (491, making up 52.3%).
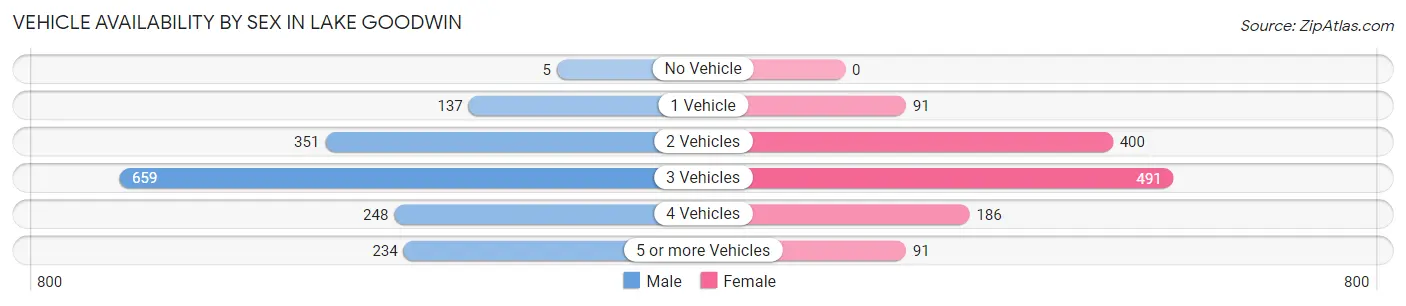
| Vehicles Available | Male | Female |
| No Vehicle | 5 (0.3%) | 0 (0.0%) |
| 1 Vehicle | 137 (8.4%) | 91 (7.2%) |
| 2 Vehicles | 351 (21.5%) | 400 (31.8%) |
| 3 Vehicles | 659 (40.3%) | 491 (39.0%) |
| 4 Vehicles | 248 (15.2%) | 186 (14.8%) |
| 5 or more Vehicles | 234 (14.3%) | 91 (7.2%) |
| Total | 1,634 (100.0%) | 1,259 (100.0%) |
Commute Time in Lake Goodwin
The most frequently occuring commute durations in Lake Goodwin are 20 to 24 minutes (376 commuters, 14.4%), 30 to 34 minutes (322 commuters, 12.4%), and 60 to 89 minutes (310 commuters, 11.9%).
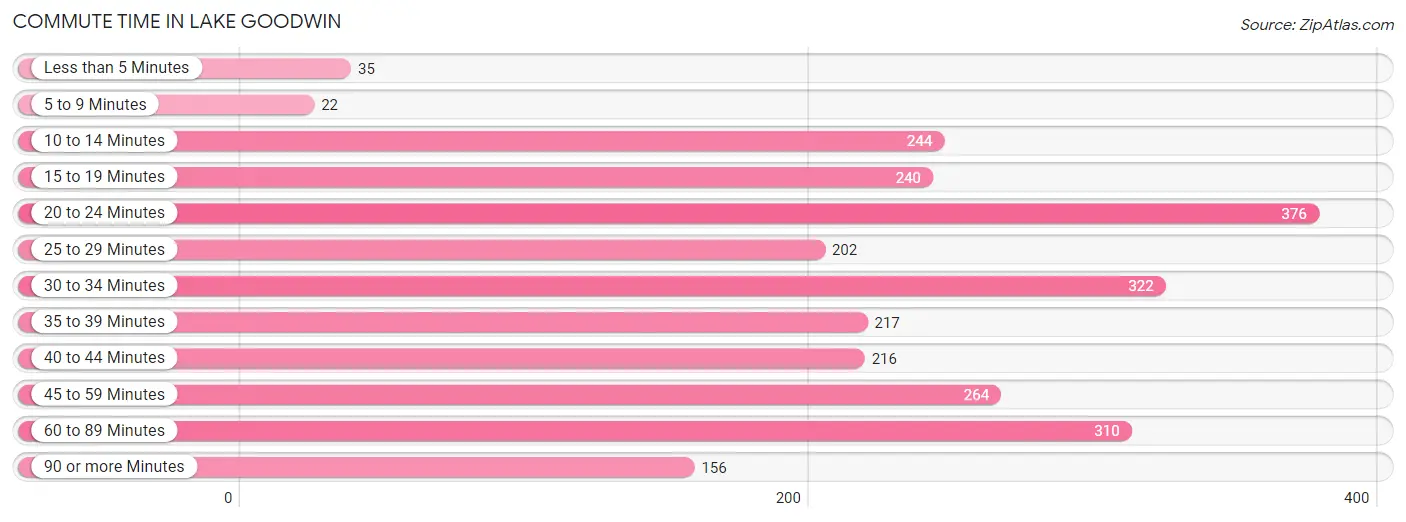
| Commute Time | # Commuters | % Commuters |
| Less than 5 Minutes | 35 | 1.3% |
| 5 to 9 Minutes | 22 | 0.8% |
| 10 to 14 Minutes | 244 | 9.4% |
| 15 to 19 Minutes | 240 | 9.2% |
| 20 to 24 Minutes | 376 | 14.4% |
| 25 to 29 Minutes | 202 | 7.8% |
| 30 to 34 Minutes | 322 | 12.4% |
| 35 to 39 Minutes | 217 | 8.3% |
| 40 to 44 Minutes | 216 | 8.3% |
| 45 to 59 Minutes | 264 | 10.1% |
| 60 to 89 Minutes | 310 | 11.9% |
| 90 or more Minutes | 156 | 6.0% |
Commute Time by Sex in Lake Goodwin
The most common commute times in Lake Goodwin are 40 to 44 minutes (201 commuters, 13.3%) for males and 20 to 24 minutes (226 commuters, 20.7%) for females.
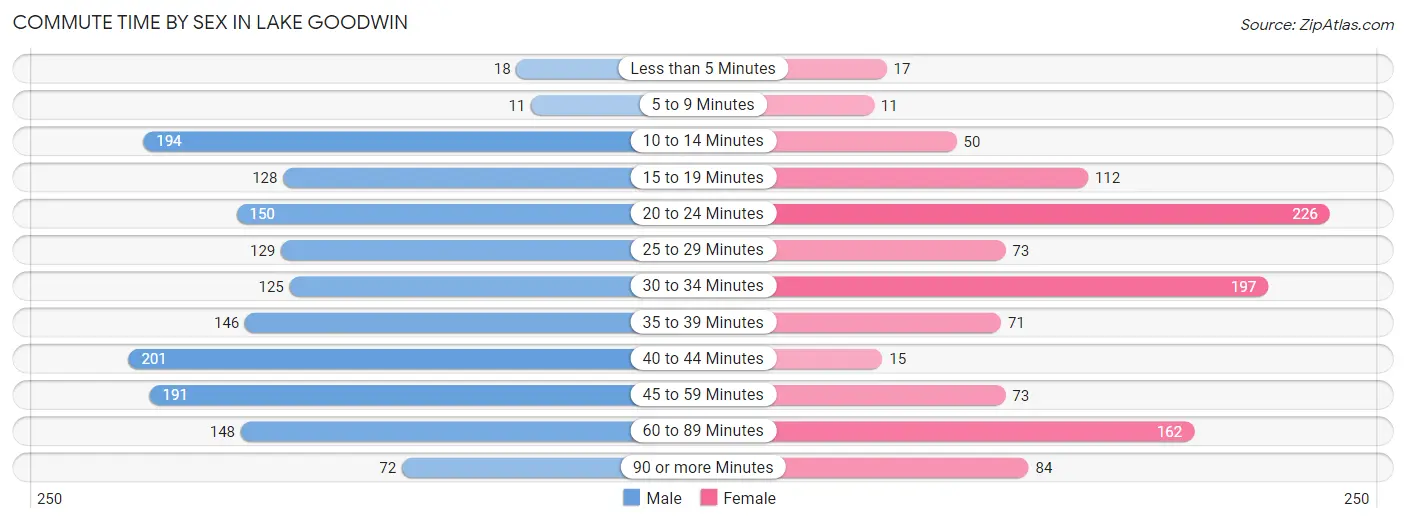
| Commute Time | Male | Female |
| Less than 5 Minutes | 18 (1.2%) | 17 (1.6%) |
| 5 to 9 Minutes | 11 (0.7%) | 11 (1.0%) |
| 10 to 14 Minutes | 194 (12.8%) | 50 (4.6%) |
| 15 to 19 Minutes | 128 (8.5%) | 112 (10.3%) |
| 20 to 24 Minutes | 150 (9.9%) | 226 (20.7%) |
| 25 to 29 Minutes | 129 (8.5%) | 73 (6.7%) |
| 30 to 34 Minutes | 125 (8.3%) | 197 (18.1%) |
| 35 to 39 Minutes | 146 (9.7%) | 71 (6.5%) |
| 40 to 44 Minutes | 201 (13.3%) | 15 (1.4%) |
| 45 to 59 Minutes | 191 (12.6%) | 73 (6.7%) |
| 60 to 89 Minutes | 148 (9.8%) | 162 (14.8%) |
| 90 or more Minutes | 72 (4.8%) | 84 (7.7%) |
Time of Departure to Work by Sex in Lake Goodwin
The most frequent times of departure to work in Lake Goodwin are 6:00 AM to 6:29 AM (193, 12.8%) for males and 7:30 AM to 7:59 AM (196, 18.0%) for females.
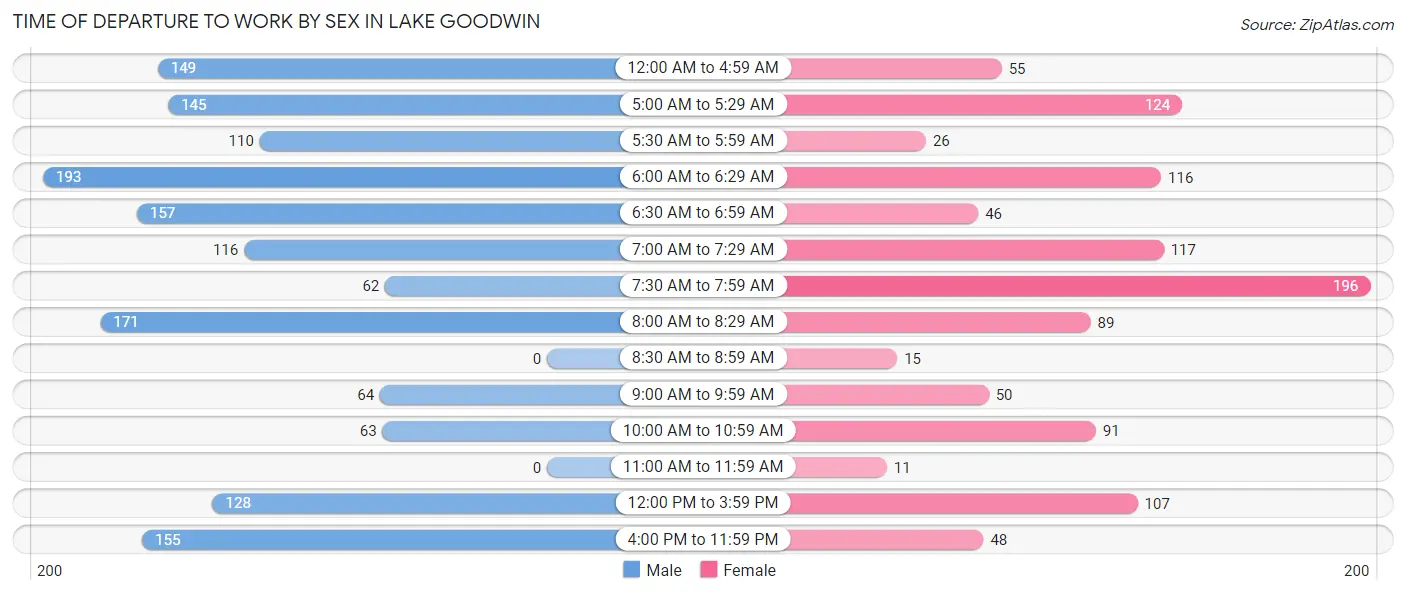
| Time of Departure | Male | Female |
| 12:00 AM to 4:59 AM | 149 (9.9%) | 55 (5.0%) |
| 5:00 AM to 5:29 AM | 145 (9.6%) | 124 (11.4%) |
| 5:30 AM to 5:59 AM | 110 (7.3%) | 26 (2.4%) |
| 6:00 AM to 6:29 AM | 193 (12.8%) | 116 (10.6%) |
| 6:30 AM to 6:59 AM | 157 (10.4%) | 46 (4.2%) |
| 7:00 AM to 7:29 AM | 116 (7.7%) | 117 (10.7%) |
| 7:30 AM to 7:59 AM | 62 (4.1%) | 196 (18.0%) |
| 8:00 AM to 8:29 AM | 171 (11.3%) | 89 (8.2%) |
| 8:30 AM to 8:59 AM | 0 (0.0%) | 15 (1.4%) |
| 9:00 AM to 9:59 AM | 64 (4.2%) | 50 (4.6%) |
| 10:00 AM to 10:59 AM | 63 (4.2%) | 91 (8.3%) |
| 11:00 AM to 11:59 AM | 0 (0.0%) | 11 (1.0%) |
| 12:00 PM to 3:59 PM | 128 (8.5%) | 107 (9.8%) |
| 4:00 PM to 11:59 PM | 155 (10.2%) | 48 (4.4%) |
| Total | 1,513 (100.0%) | 1,091 (100.0%) |
Housing Occupancy in Lake Goodwin
Occupancy by Ownership in Lake Goodwin
Of the total 2,190 dwellings in Lake Goodwin, owner-occupied units account for 2,005 (91.5%), while renter-occupied units make up 185 (8.5%).
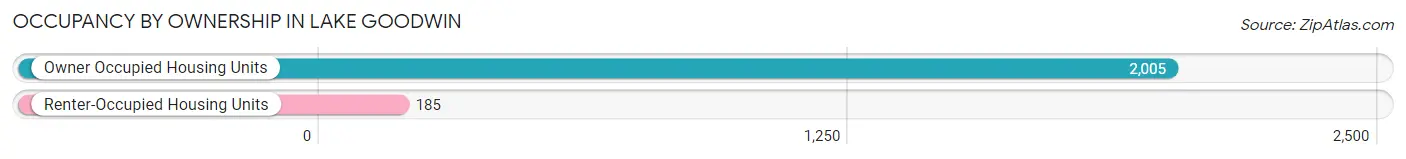
| Occupancy | # Housing Units | % Housing Units |
| Owner Occupied Housing Units | 2,005 | 91.5% |
| Renter-Occupied Housing Units | 185 | 8.5% |
| Total Occupied Housing Units | 2,190 | 100.0% |
Occupancy by Household Size in Lake Goodwin
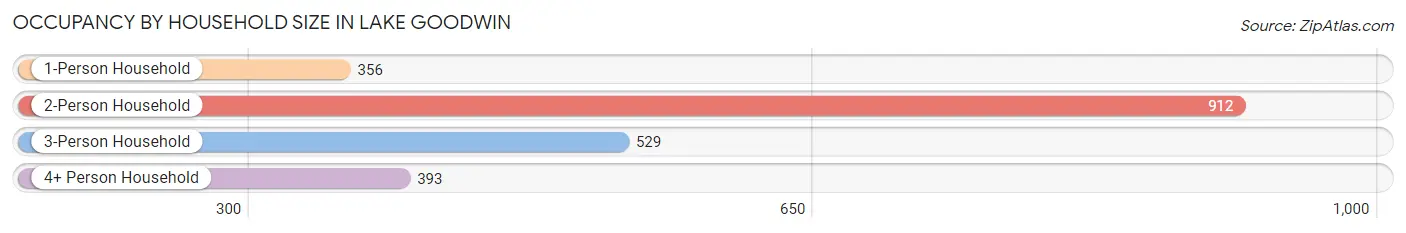
| Household Size | # Housing Units | % Housing Units |
| 1-Person Household | 356 | 16.3% |
| 2-Person Household | 912 | 41.6% |
| 3-Person Household | 529 | 24.2% |
| 4+ Person Household | 393 | 17.9% |
| Total Housing Units | 2,190 | 100.0% |
Occupancy by Ownership by Household Size in Lake Goodwin
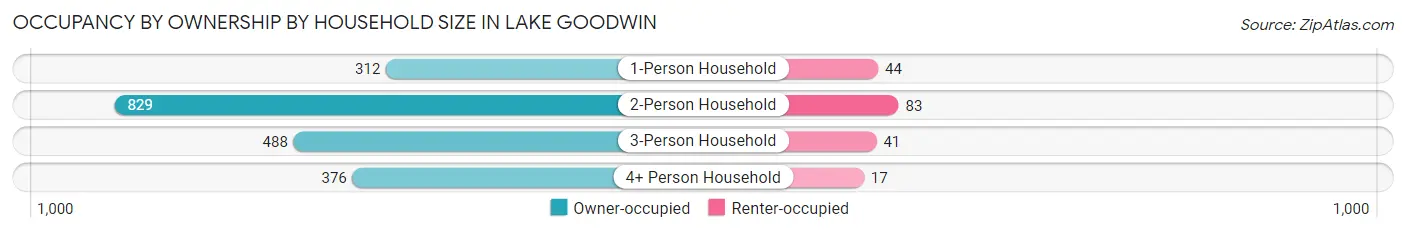
| Household Size | Owner-occupied | Renter-occupied |
| 1-Person Household | 312 (87.6%) | 44 (12.4%) |
| 2-Person Household | 829 (90.9%) | 83 (9.1%) |
| 3-Person Household | 488 (92.2%) | 41 (7.7%) |
| 4+ Person Household | 376 (95.7%) | 17 (4.3%) |
| Total Housing Units | 2,005 (91.5%) | 185 (8.5%) |
Occupancy by Educational Attainment in Lake Goodwin
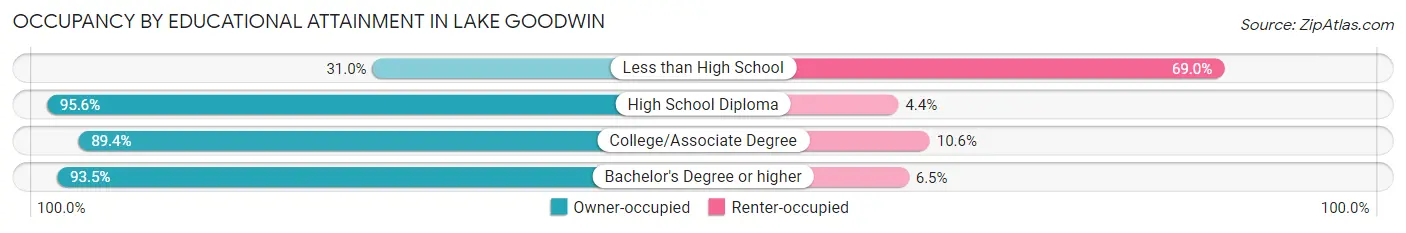
| Household Size | Owner-occupied | Renter-occupied |
| Less than High School | 9 (31.0%) | 20 (69.0%) |
| High School Diploma | 648 (95.6%) | 30 (4.4%) |
| College/Associate Degree | 841 (89.4%) | 100 (10.6%) |
| Bachelor's Degree or higher | 507 (93.5%) | 35 (6.5%) |
Occupancy by Age of Householder in Lake Goodwin
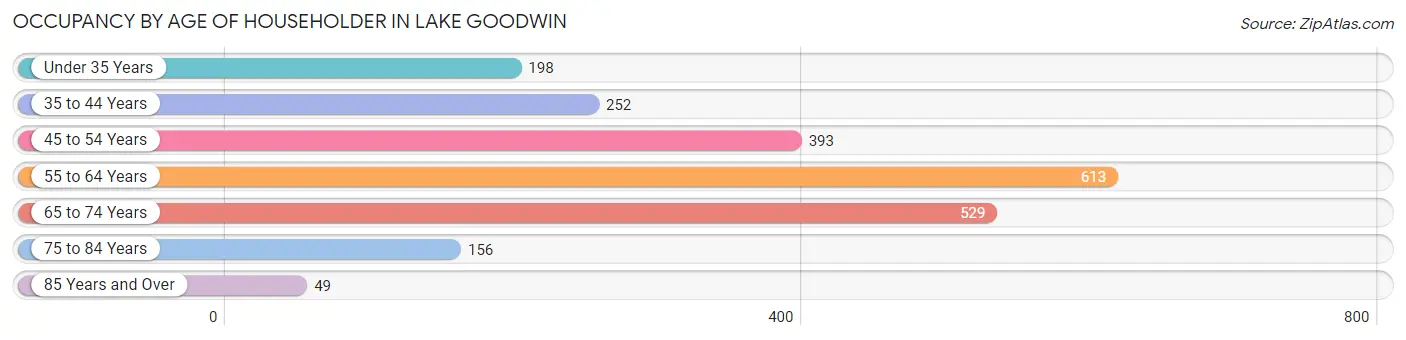
| Age Bracket | # Households | % Households |
| Under 35 Years | 198 | 9.0% |
| 35 to 44 Years | 252 | 11.5% |
| 45 to 54 Years | 393 | 17.9% |
| 55 to 64 Years | 613 | 28.0% |
| 65 to 74 Years | 529 | 24.2% |
| 75 to 84 Years | 156 | 7.1% |
| 85 Years and Over | 49 | 2.2% |
| Total | 2,190 | 100.0% |
Housing Finances in Lake Goodwin
Median Income by Occupancy in Lake Goodwin
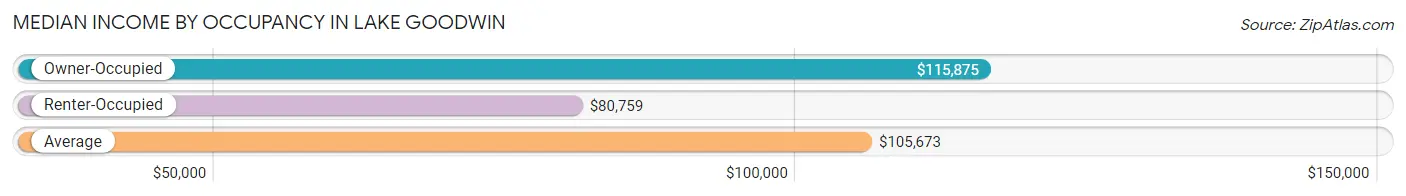
| Occupancy Type | # Households | Median Income |
| Owner-Occupied | 2,005 (91.5%) | $115,875 |
| Renter-Occupied | 185 (8.5%) | $80,759 |
| Average | 2,190 (100.0%) | $105,673 |
Occupancy by Householder Income Bracket in Lake Goodwin
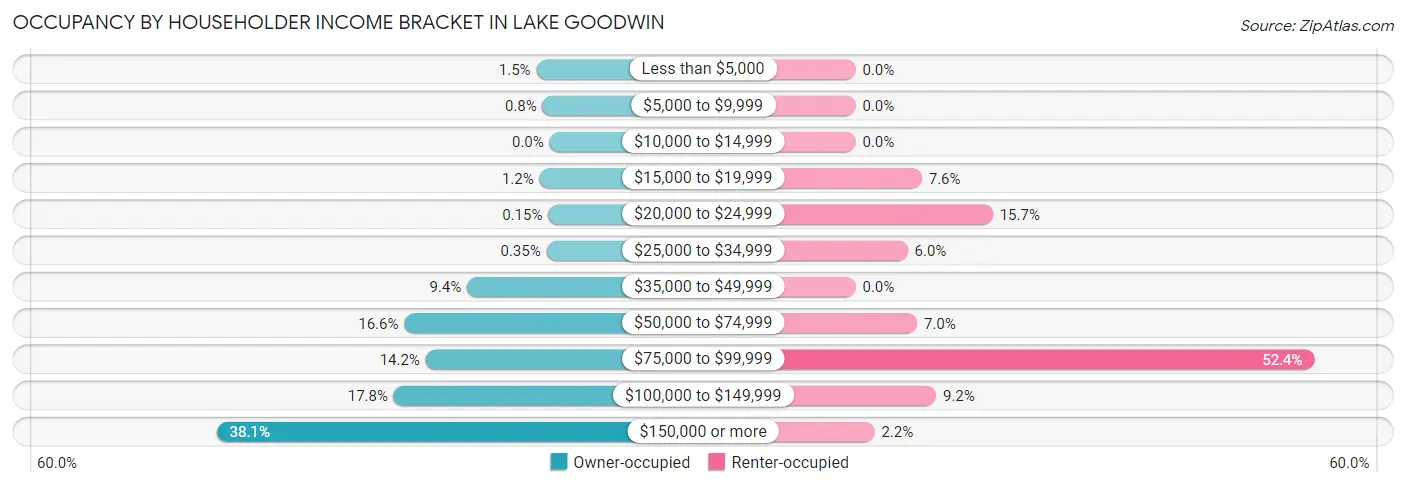
| Income Bracket | Owner-occupied | Renter-occupied |
| Less than $5,000 | 30 (1.5%) | 0 (0.0%) |
| $5,000 to $9,999 | 16 (0.8%) | 0 (0.0%) |
| $10,000 to $14,999 | 0 (0.0%) | 0 (0.0%) |
| $15,000 to $19,999 | 23 (1.1%) | 14 (7.6%) |
| $20,000 to $24,999 | 3 (0.2%) | 29 (15.7%) |
| $25,000 to $34,999 | 7 (0.4%) | 11 (5.9%) |
| $35,000 to $49,999 | 189 (9.4%) | 0 (0.0%) |
| $50,000 to $74,999 | 333 (16.6%) | 13 (7.0%) |
| $75,000 to $99,999 | 284 (14.2%) | 97 (52.4%) |
| $100,000 to $149,999 | 357 (17.8%) | 17 (9.2%) |
| $150,000 or more | 763 (38.1%) | 4 (2.2%) |
| Total | 2,005 (100.0%) | 185 (100.0%) |
Monthly Housing Cost Tiers in Lake Goodwin
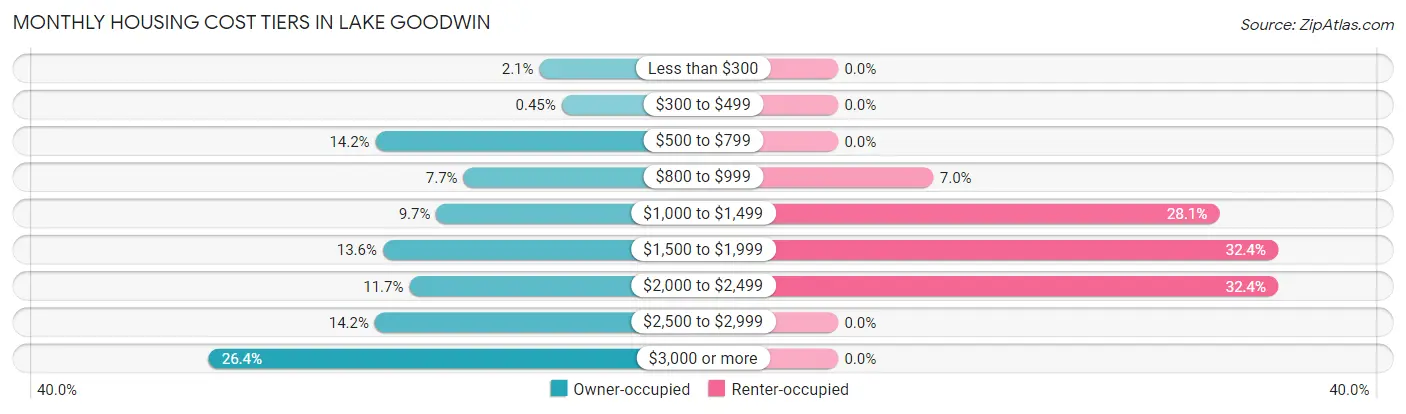
| Monthly Cost | Owner-occupied | Renter-occupied |
| Less than $300 | 42 (2.1%) | 0 (0.0%) |
| $300 to $499 | 9 (0.4%) | 0 (0.0%) |
| $500 to $799 | 284 (14.2%) | 0 (0.0%) |
| $800 to $999 | 154 (7.7%) | 13 (7.0%) |
| $1,000 to $1,499 | 194 (9.7%) | 52 (28.1%) |
| $1,500 to $1,999 | 273 (13.6%) | 60 (32.4%) |
| $2,000 to $2,499 | 234 (11.7%) | 60 (32.4%) |
| $2,500 to $2,999 | 285 (14.2%) | 0 (0.0%) |
| $3,000 or more | 530 (26.4%) | 0 (0.0%) |
| Total | 2,005 (100.0%) | 185 (100.0%) |
Physical Housing Characteristics in Lake Goodwin
Housing Structures in Lake Goodwin
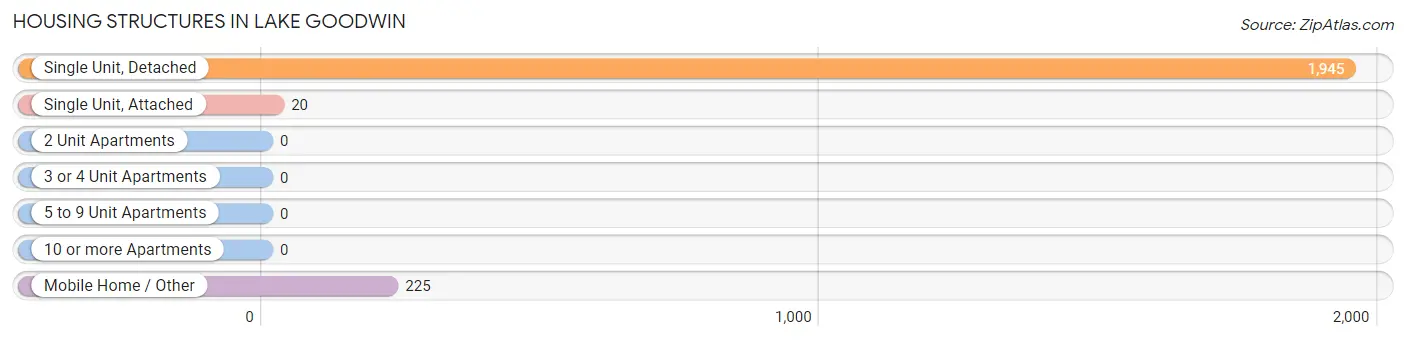
| Structure Type | # Housing Units | % Housing Units |
| Single Unit, Detached | 1,945 | 88.8% |
| Single Unit, Attached | 20 | 0.9% |
| 2 Unit Apartments | 0 | 0.0% |
| 3 or 4 Unit Apartments | 0 | 0.0% |
| 5 to 9 Unit Apartments | 0 | 0.0% |
| 10 or more Apartments | 0 | 0.0% |
| Mobile Home / Other | 225 | 10.3% |
| Total | 2,190 | 100.0% |
Housing Structures by Occupancy in Lake Goodwin
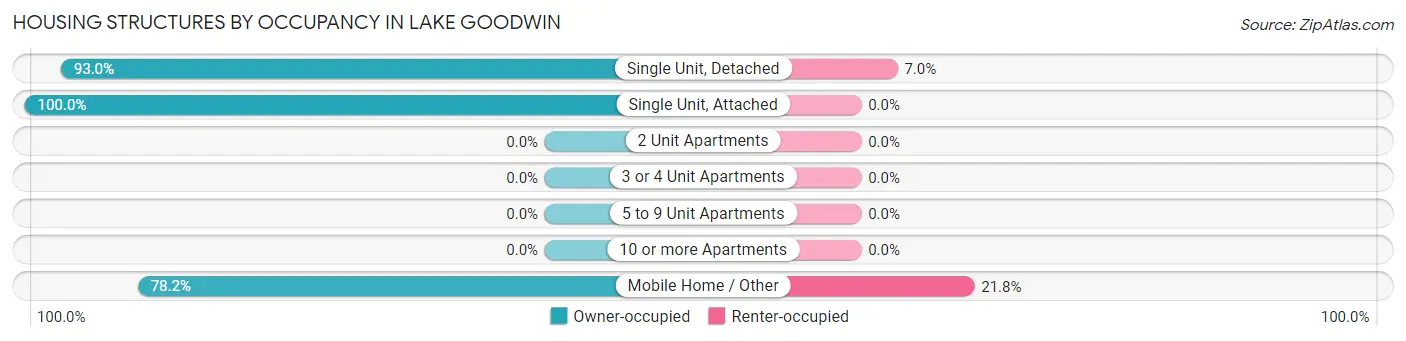
| Structure Type | Owner-occupied | Renter-occupied |
| Single Unit, Detached | 1,809 (93.0%) | 136 (7.0%) |
| Single Unit, Attached | 20 (100.0%) | 0 (0.0%) |
| 2 Unit Apartments | 0 (0.0%) | 0 (0.0%) |
| 3 or 4 Unit Apartments | 0 (0.0%) | 0 (0.0%) |
| 5 to 9 Unit Apartments | 0 (0.0%) | 0 (0.0%) |
| 10 or more Apartments | 0 (0.0%) | 0 (0.0%) |
| Mobile Home / Other | 176 (78.2%) | 49 (21.8%) |
| Total | 2,005 (91.5%) | 185 (8.5%) |
Housing Structures by Number of Rooms in Lake Goodwin
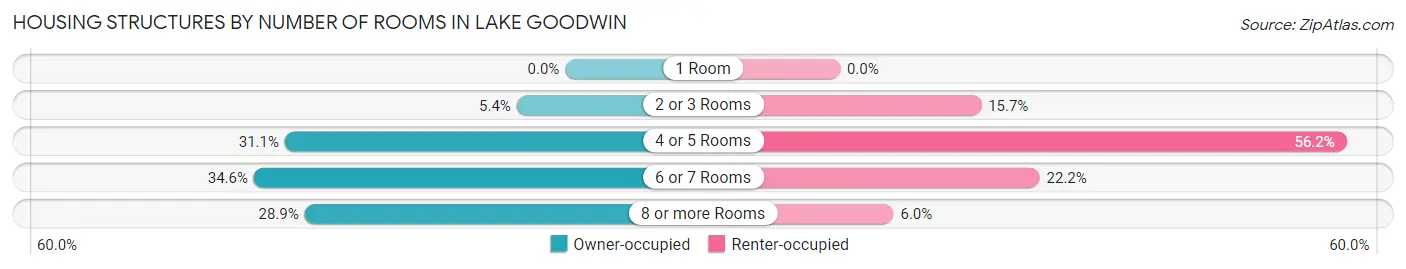
| Number of Rooms | Owner-occupied | Renter-occupied |
| 1 Room | 0 (0.0%) | 0 (0.0%) |
| 2 or 3 Rooms | 108 (5.4%) | 29 (15.7%) |
| 4 or 5 Rooms | 624 (31.1%) | 104 (56.2%) |
| 6 or 7 Rooms | 693 (34.6%) | 41 (22.2%) |
| 8 or more Rooms | 580 (28.9%) | 11 (5.9%) |
| Total | 2,005 (100.0%) | 185 (100.0%) |
Housing Structure by Heating Type in Lake Goodwin
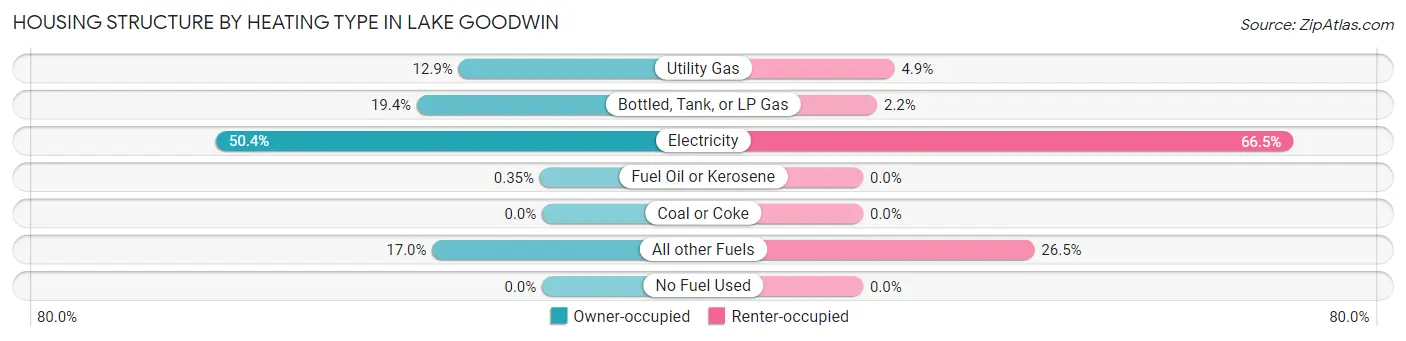
| Heating Type | Owner-occupied | Renter-occupied |
| Utility Gas | 259 (12.9%) | 9 (4.9%) |
| Bottled, Tank, or LP Gas | 388 (19.4%) | 4 (2.2%) |
| Electricity | 1,011 (50.4%) | 123 (66.5%) |
| Fuel Oil or Kerosene | 7 (0.4%) | 0 (0.0%) |
| Coal or Coke | 0 (0.0%) | 0 (0.0%) |
| All other Fuels | 340 (17.0%) | 49 (26.5%) |
| No Fuel Used | 0 (0.0%) | 0 (0.0%) |
| Total | 2,005 (100.0%) | 185 (100.0%) |
Household Vehicle Usage in Lake Goodwin
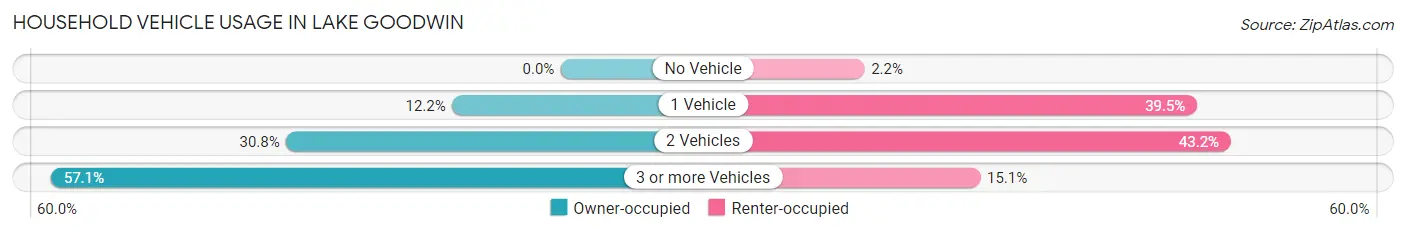
| Vehicles per Household | Owner-occupied | Renter-occupied |
| No Vehicle | 0 (0.0%) | 4 (2.2%) |
| 1 Vehicle | 244 (12.2%) | 73 (39.5%) |
| 2 Vehicles | 617 (30.8%) | 80 (43.2%) |
| 3 or more Vehicles | 1,144 (57.1%) | 28 (15.1%) |
| Total | 2,005 (100.0%) | 185 (100.0%) |
Real Estate & Mortgages in Lake Goodwin
Real Estate and Mortgage Overview in Lake Goodwin
| Characteristic | Without Mortgage | With Mortgage |
| Housing Units | 612 | 1,393 |
| Median Property Value | $566,100 | $614,200 |
| Median Household Income | $96,458 | $559 |
| Monthly Housing Costs | $796 | $530 |
| Real Estate Taxes | $4,776 | $0 |
Property Value by Mortgage Status in Lake Goodwin
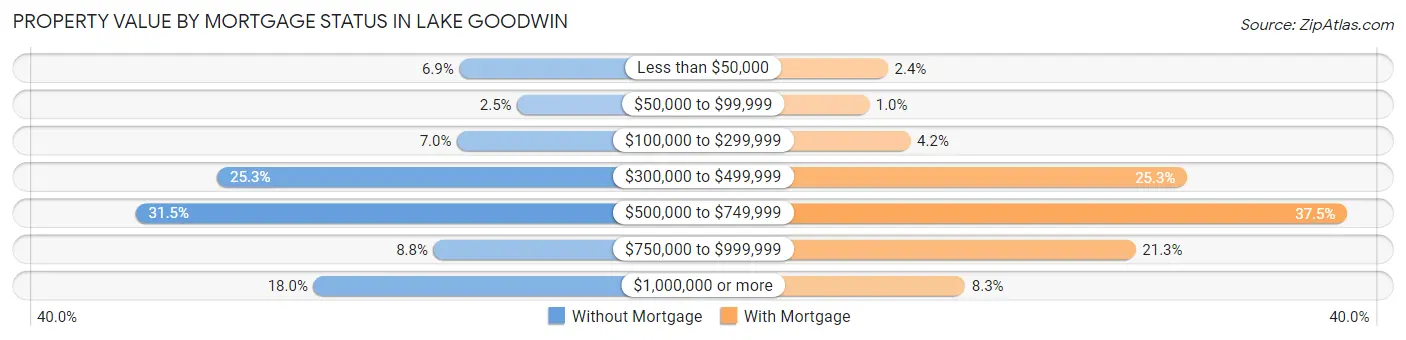
| Property Value | Without Mortgage | With Mortgage |
| Less than $50,000 | 42 (6.9%) | 34 (2.4%) |
| $50,000 to $99,999 | 15 (2.5%) | 14 (1.0%) |
| $100,000 to $299,999 | 43 (7.0%) | 58 (4.2%) |
| $300,000 to $499,999 | 155 (25.3%) | 352 (25.3%) |
| $500,000 to $749,999 | 193 (31.5%) | 522 (37.5%) |
| $750,000 to $999,999 | 54 (8.8%) | 297 (21.3%) |
| $1,000,000 or more | 110 (18.0%) | 116 (8.3%) |
| Total | 612 (100.0%) | 1,393 (100.0%) |
Household Income by Mortgage Status in Lake Goodwin
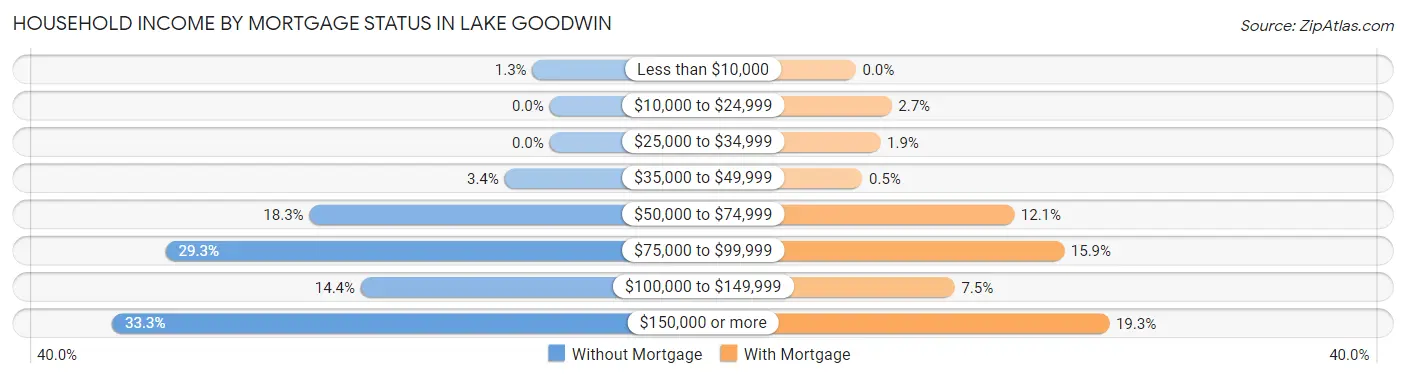
| Household Income | Without Mortgage | With Mortgage |
| Less than $10,000 | 8 (1.3%) | 0 (0.0%) |
| $10,000 to $24,999 | 0 (0.0%) | 38 (2.7%) |
| $25,000 to $34,999 | 0 (0.0%) | 26 (1.9%) |
| $35,000 to $49,999 | 21 (3.4%) | 7 (0.5%) |
| $50,000 to $74,999 | 112 (18.3%) | 168 (12.1%) |
| $75,000 to $99,999 | 179 (29.2%) | 221 (15.9%) |
| $100,000 to $149,999 | 88 (14.4%) | 105 (7.5%) |
| $150,000 or more | 204 (33.3%) | 269 (19.3%) |
| Total | 612 (100.0%) | 1,393 (100.0%) |
Property Value to Household Income Ratio in Lake Goodwin
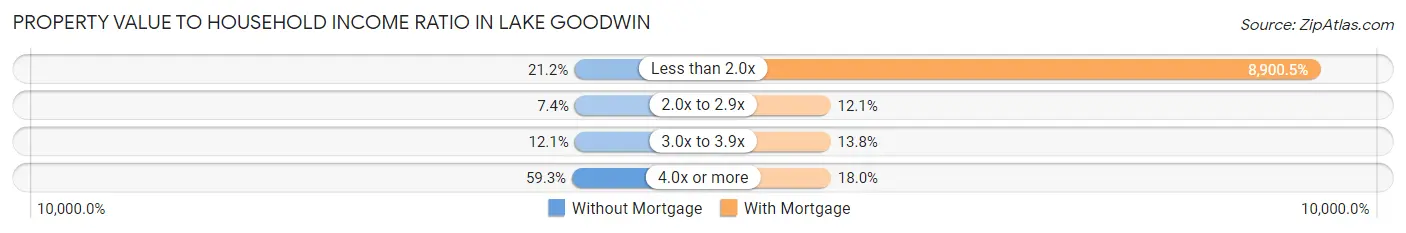
| Value-to-Income Ratio | Without Mortgage | With Mortgage |
| Less than 2.0x | 130 (21.2%) | 123,984 (8,900.5%) |
| 2.0x to 2.9x | 45 (7.3%) | 168 (12.1%) |
| 3.0x to 3.9x | 74 (12.1%) | 192 (13.8%) |
| 4.0x or more | 363 (59.3%) | 250 (17.9%) |
| Total | 612 (100.0%) | 1,393 (100.0%) |
Real Estate Taxes by Mortgage Status in Lake Goodwin
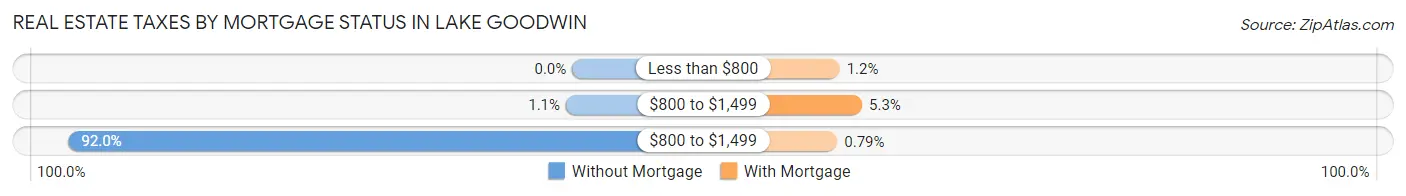
| Property Taxes | Without Mortgage | With Mortgage |
| Less than $800 | 0 (0.0%) | 17 (1.2%) |
| $800 to $1,499 | 7 (1.1%) | 74 (5.3%) |
| $800 to $1,499 | 563 (92.0%) | 11 (0.8%) |
| Total | 612 (100.0%) | 1,393 (100.0%) |
Health & Disability in Lake Goodwin
Health Insurance Coverage by Age in Lake Goodwin
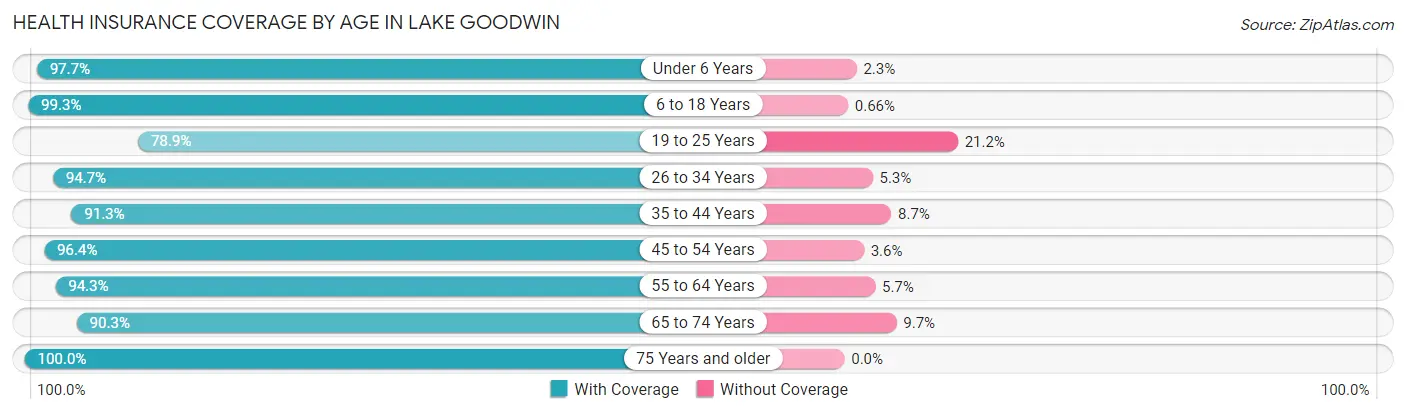
| Age Bracket | With Coverage | Without Coverage |
| Under 6 Years | 215 (97.7%) | 5 (2.3%) |
| 6 to 18 Years | 758 (99.3%) | 5 (0.7%) |
| 19 to 25 Years | 179 (78.8%) | 48 (21.1%) |
| 26 to 34 Years | 594 (94.7%) | 33 (5.3%) |
| 35 to 44 Years | 533 (91.3%) | 51 (8.7%) |
| 45 to 54 Years | 771 (96.4%) | 29 (3.6%) |
| 55 to 64 Years | 1,233 (94.3%) | 75 (5.7%) |
| 65 to 74 Years | 651 (90.3%) | 70 (9.7%) |
| 75 Years and older | 331 (100.0%) | 0 (0.0%) |
| Total | 5,265 (94.3%) | 316 (5.7%) |
Health Insurance Coverage by Citizenship Status in Lake Goodwin
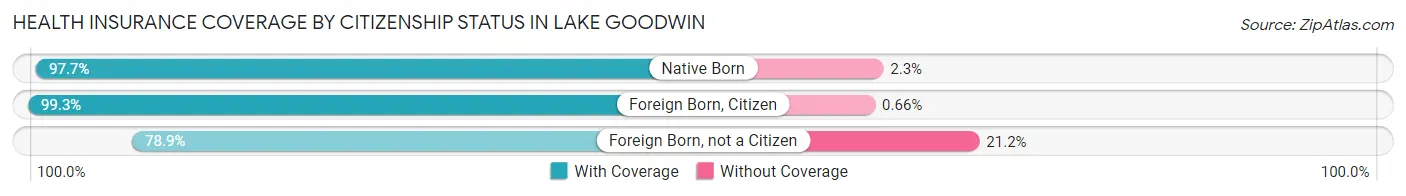
| Citizenship Status | With Coverage | Without Coverage |
| Native Born | 215 (97.7%) | 5 (2.3%) |
| Foreign Born, Citizen | 758 (99.3%) | 5 (0.7%) |
| Foreign Born, not a Citizen | 179 (78.8%) | 48 (21.1%) |
Health Insurance Coverage by Household Income in Lake Goodwin
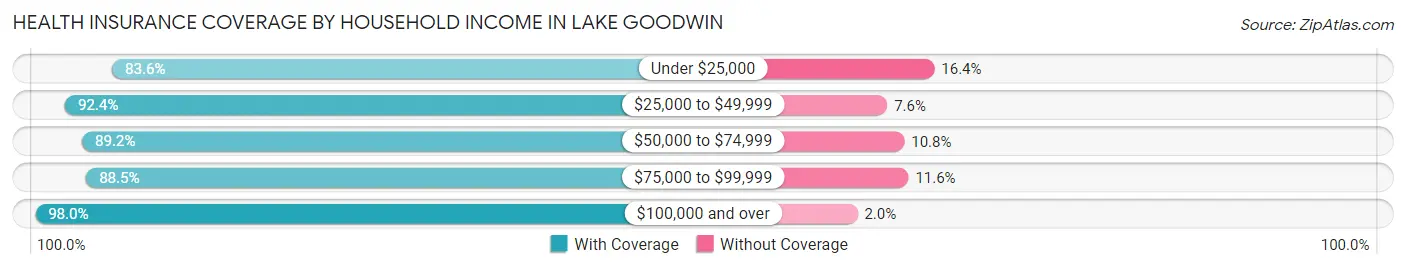
| Household Income | With Coverage | Without Coverage |
| Under $25,000 | 163 (83.6%) | 32 (16.4%) |
| $25,000 to $49,999 | 391 (92.4%) | 32 (7.6%) |
| $50,000 to $74,999 | 605 (89.2%) | 73 (10.8%) |
| $75,000 to $99,999 | 865 (88.4%) | 113 (11.6%) |
| $100,000 and over | 3,241 (98.0%) | 66 (2.0%) |
Public vs Private Health Insurance Coverage by Age in Lake Goodwin
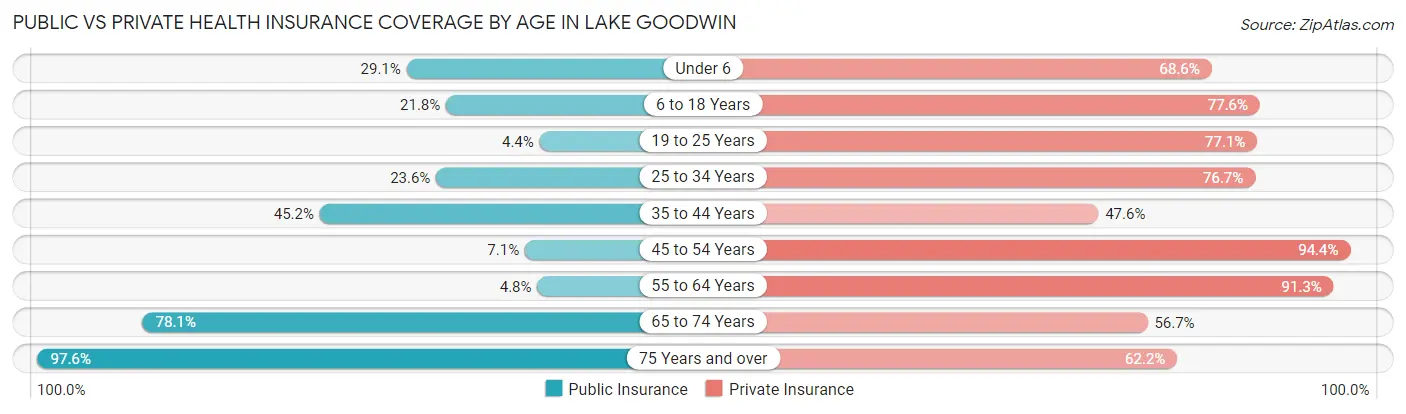
| Age Bracket | Public Insurance | Private Insurance |
| Under 6 | 64 (29.1%) | 151 (68.6%) |
| 6 to 18 Years | 166 (21.8%) | 592 (77.6%) |
| 19 to 25 Years | 10 (4.4%) | 175 (77.1%) |
| 25 to 34 Years | 148 (23.6%) | 481 (76.7%) |
| 35 to 44 Years | 264 (45.2%) | 278 (47.6%) |
| 45 to 54 Years | 57 (7.1%) | 755 (94.4%) |
| 55 to 64 Years | 63 (4.8%) | 1,194 (91.3%) |
| 65 to 74 Years | 563 (78.1%) | 409 (56.7%) |
| 75 Years and over | 323 (97.6%) | 206 (62.2%) |
| Total | 1,658 (29.7%) | 4,241 (76.0%) |
Disability Status by Sex by Age in Lake Goodwin
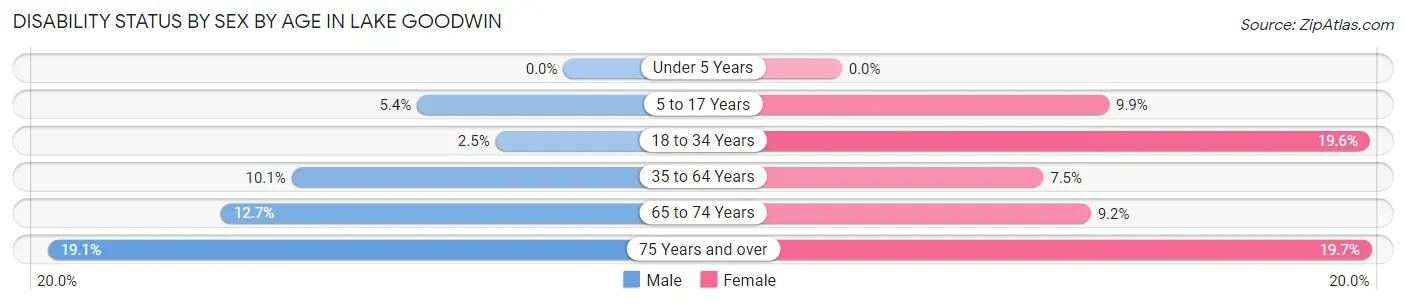
| Age Bracket | Male | Female |
| Under 5 Years | 0 (0.0%) | 0 (0.0%) |
| 5 to 17 Years | 19 (5.4%) | 36 (9.9%) |
| 18 to 34 Years | 12 (2.5%) | 88 (19.6%) |
| 35 to 64 Years | 138 (10.1%) | 99 (7.5%) |
| 65 to 74 Years | 38 (12.7%) | 39 (9.2%) |
| 75 Years and over | 40 (19.1%) | 24 (19.7%) |
Disability Class by Sex by Age in Lake Goodwin
Disability Class: Hearing Difficulty
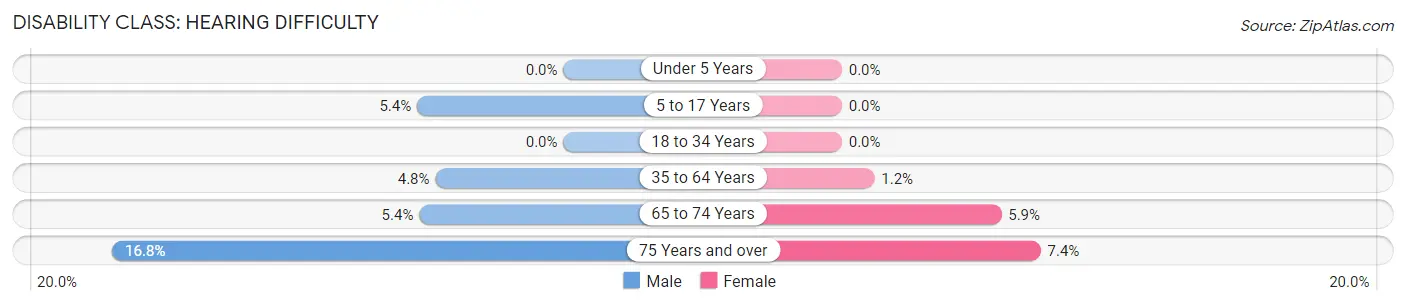
| Age Bracket | Male | Female |
| Under 5 Years | 0 (0.0%) | 0 (0.0%) |
| 5 to 17 Years | 19 (5.4%) | 0 (0.0%) |
| 18 to 34 Years | 0 (0.0%) | 0 (0.0%) |
| 35 to 64 Years | 65 (4.8%) | 16 (1.2%) |
| 65 to 74 Years | 16 (5.3%) | 25 (5.9%) |
| 75 Years and over | 35 (16.8%) | 9 (7.4%) |
Disability Class: Vision Difficulty
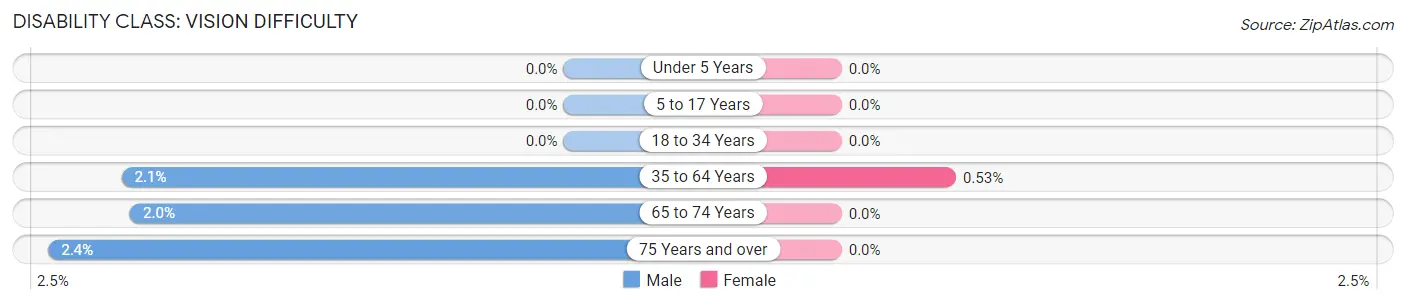
| Age Bracket | Male | Female |
| Under 5 Years | 0 (0.0%) | 0 (0.0%) |
| 5 to 17 Years | 0 (0.0%) | 0 (0.0%) |
| 18 to 34 Years | 0 (0.0%) | 0 (0.0%) |
| 35 to 64 Years | 28 (2.1%) | 7 (0.5%) |
| 65 to 74 Years | 6 (2.0%) | 0 (0.0%) |
| 75 Years and over | 5 (2.4%) | 0 (0.0%) |
Disability Class: Cognitive Difficulty
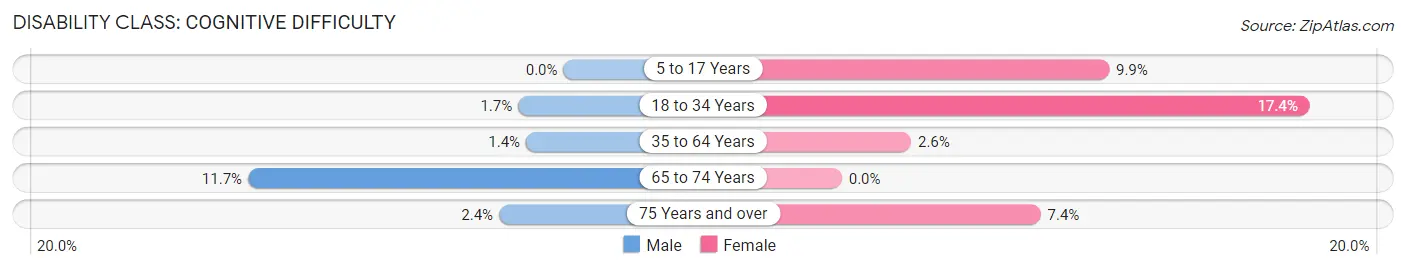
| Age Bracket | Male | Female |
| 5 to 17 Years | 0 (0.0%) | 36 (9.9%) |
| 18 to 34 Years | 8 (1.7%) | 78 (17.4%) |
| 35 to 64 Years | 19 (1.4%) | 34 (2.6%) |
| 65 to 74 Years | 35 (11.7%) | 0 (0.0%) |
| 75 Years and over | 5 (2.4%) | 9 (7.4%) |
Disability Class: Ambulatory Difficulty
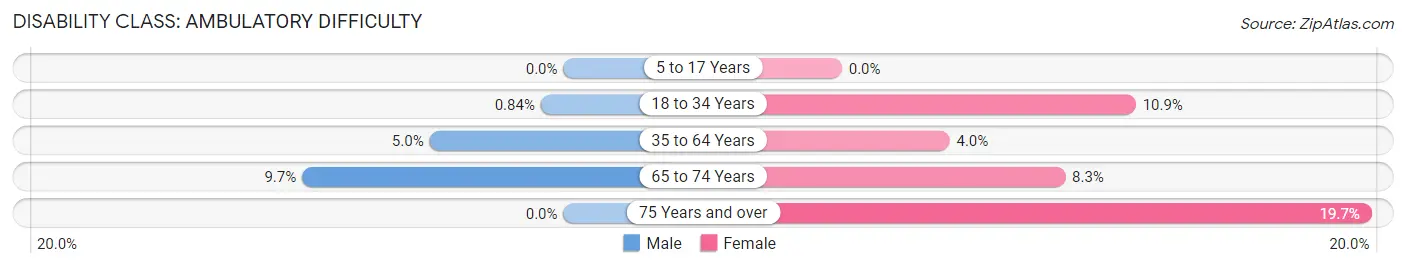
| Age Bracket | Male | Female |
| 5 to 17 Years | 0 (0.0%) | 0 (0.0%) |
| 18 to 34 Years | 4 (0.8%) | 49 (10.9%) |
| 35 to 64 Years | 68 (5.0%) | 53 (4.0%) |
| 65 to 74 Years | 29 (9.7%) | 35 (8.3%) |
| 75 Years and over | 0 (0.0%) | 24 (19.7%) |
Disability Class: Self-Care Difficulty
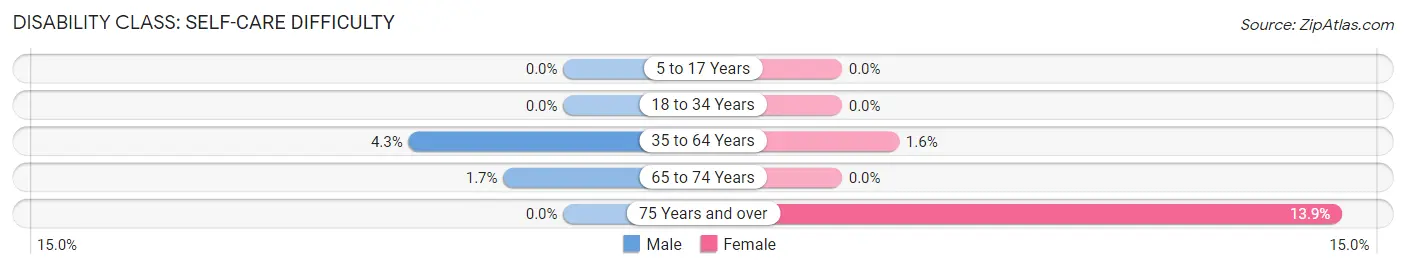
| Age Bracket | Male | Female |
| 5 to 17 Years | 0 (0.0%) | 0 (0.0%) |
| 18 to 34 Years | 0 (0.0%) | 0 (0.0%) |
| 35 to 64 Years | 59 (4.3%) | 21 (1.6%) |
| 65 to 74 Years | 5 (1.7%) | 0 (0.0%) |
| 75 Years and over | 0 (0.0%) | 17 (13.9%) |
Technology Access in Lake Goodwin
Computing Device Access in Lake Goodwin
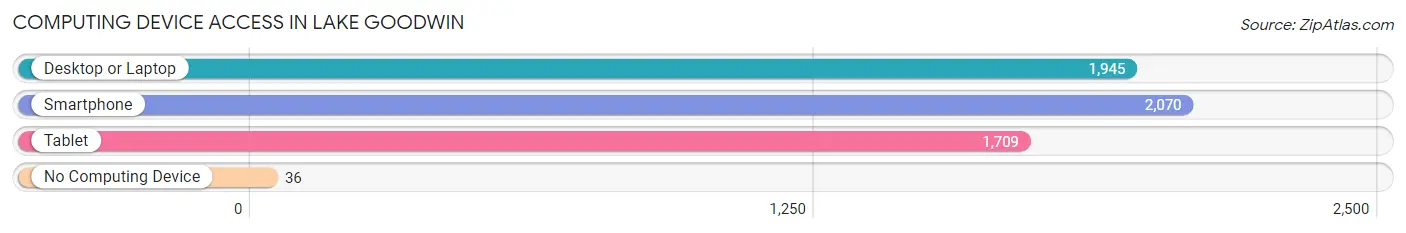
| Device Type | # Households | % Households |
| Desktop or Laptop | 1,945 | 88.8% |
| Smartphone | 2,070 | 94.5% |
| Tablet | 1,709 | 78.0% |
| No Computing Device | 36 | 1.6% |
| Total | 2,190 | 100.0% |
Internet Access in Lake Goodwin
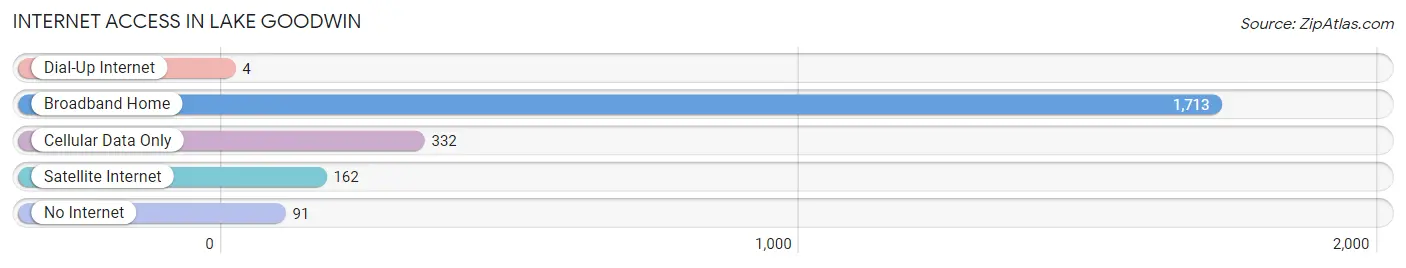
| Internet Type | # Households | % Households |
| Dial-Up Internet | 4 | 0.2% |
| Broadband Home | 1,713 | 78.2% |
| Cellular Data Only | 332 | 15.2% |
| Satellite Internet | 162 | 7.4% |
| No Internet | 91 | 4.2% |
| Total | 2,190 | 100.0% |
Lake Goodwin Summary
Lake Goodwin is a small unincorporated community located in Snohomish County, Washington, United States. It is situated on the northern shore of Lake Goodwin, a large lake in the northern part of the county. The community is located approximately 25 miles north of Seattle and is part of the Seattle metropolitan area.
History
The area around Lake Goodwin has been inhabited for thousands of years by the Snohomish people, who were part of the Coast Salish culture. The lake was named after William Goodwin, an early settler who arrived in the area in the late 1800s.
In the early 1900s, the area around Lake Goodwin began to be developed as a resort community. The lake was a popular destination for fishing, boating, and swimming. In the 1920s, a road was built connecting the lake to the nearby town of Stanwood.
In the 1950s, the area around Lake Goodwin began to be developed for residential use. The lake was a popular destination for vacation homes and retirement homes. The community of Lake Goodwin was officially established in the 1960s.
Geography
Lake Goodwin is located in the northern part of Snohomish County, Washington. It is situated on the northern shore of Lake Goodwin, a large lake in the northern part of the county. The lake is approximately 4 miles long and 1 mile wide.
The community of Lake Goodwin is located approximately 25 miles north of Seattle and is part of the Seattle metropolitan area. The area is surrounded by forests and is home to a variety of wildlife, including deer, elk, and bald eagles.
Economy
The economy of Lake Goodwin is largely based on tourism and recreation. The lake is a popular destination for fishing, boating, and swimming. There are several marinas and boat launches located around the lake.
The area is also home to several small businesses, including restaurants, convenience stores, and gas stations. The community is also home to a number of small farms and orchards.
Demographics
As of the 2010 census, the population of Lake Goodwin was 1,845. The racial makeup of the community was 94.3% White, 0.7% African American, 0.7% Native American, 0.7% Asian, 0.2% Pacific Islander, and 2.6% from other races.
The median household income in Lake Goodwin was $50,938, and the median family income was $54,844. The per capita income was $25,945. About 8.3% of families and 10.2% of the population were below the poverty line.
Conclusion
Lake Goodwin is a small unincorporated community located in Snohomish County, Washington. It is situated on the northern shore of Lake Goodwin, a large lake in the northern part of the county. The community is located approximately 25 miles north of Seattle and is part of the Seattle metropolitan area. The economy of Lake Goodwin is largely based on tourism and recreation, and the area is home to a variety of small businesses. As of the 2010 census, the population of Lake Goodwin was 1,845. The median household income in Lake Goodwin was $50,938, and the median family income was $54,844.
Common Questions
What is Per Capita Income in Lake Goodwin?
Per Capita income in Lake Goodwin is $71,482.
What is the Median Family Income in Lake Goodwin?
Median Family Income in Lake Goodwin is $119,100.
What is the Median Household income in Lake Goodwin?
Median Household Income in Lake Goodwin is $105,673.
What is Income or Wage Gap in Lake Goodwin?
Income or Wage Gap in Lake Goodwin is 48.0%.
Women in Lake Goodwin earn 52.0 cents for every dollar earned by a man.
What is Inequality or Gini Index in Lake Goodwin?
Inequality or Gini Index in Lake Goodwin is 0.51.
What is the Total Population of Lake Goodwin?
Total Population of Lake Goodwin is 5,581.
What is the Total Male Population of Lake Goodwin?
Total Male Population of Lake Goodwin is 2,788.
What is the Total Female Population of Lake Goodwin?
Total Female Population of Lake Goodwin is 2,793.
What is the Ratio of Males per 100 Females in Lake Goodwin?
There are 99.82 Males per 100 Females in Lake Goodwin.
What is the Ratio of Females per 100 Males in Lake Goodwin?
There are 100.18 Females per 100 Males in Lake Goodwin.
What is the Median Population Age in Lake Goodwin?
Median Population Age in Lake Goodwin is 51.5 Years.
What is the Average Family Size in Lake Goodwin
Average Family Size in Lake Goodwin is 2.8 People.
What is the Average Household Size in Lake Goodwin
Average Household Size in Lake Goodwin is 2.5 People.
How Large is the Labor Force in Lake Goodwin?
There are 3,049 People in the Labor Forcein in Lake Goodwin.
What is the Percentage of People in the Labor Force in Lake Goodwin?
61.7% of People are in the Labor Force in Lake Goodwin.
What is the Unemployment Rate in Lake Goodwin?
Unemployment Rate in Lake Goodwin is 3.7%.