Woodinville, WA Map & Demographics
Woodinville Map
Woodinville Overview
$74,866
PER CAPITA INCOME
$180,385
AVG FAMILY INCOME
$142,500
AVG HOUSEHOLD INCOME
50.3%
WAGE / INCOME GAP [ % ]
49.7¢/ $1
WAGE / INCOME GAP [ $ ]
0.42
INEQUALITY / GINI INDEX
13,301
TOTAL POPULATION
6,645
MALE POPULATION
6,656
FEMALE POPULATION
99.83
MALES / 100 FEMALES
100.17
FEMALES / 100 MALES
40.6
MEDIAN AGE
2.9
AVG FAMILY SIZE
2.4
AVG HOUSEHOLD SIZE
7,681
LABOR FORCE [ PEOPLE ]
70.2%
PERCENT IN LABOR FORCE
3.8%
UNEMPLOYMENT RATE
Woodinville Area Codes
Income in Woodinville
Income Overview in Woodinville
Per Capita Income in Woodinville is $74,866, while median incomes of families and households are $180,385 and $142,500 respectively.
| Characteristic | Number | Measure |
| Per Capita Income | 13,301 | $74,866 |
| Median Family Income | 3,524 | $180,385 |
| Mean Family Income | 3,524 | $211,474 |
| Median Household Income | 5,550 | $142,500 |
| Mean Household Income | 5,550 | $177,877 |
| Income Deficit | 3,524 | $0 |
| Wage / Income Gap (%) | 13,301 | 50.27% |
| Wage / Income Gap ($) | 13,301 | 49.73¢ per $1 |
| Gini / Inequality Index | 13,301 | 0.42 |
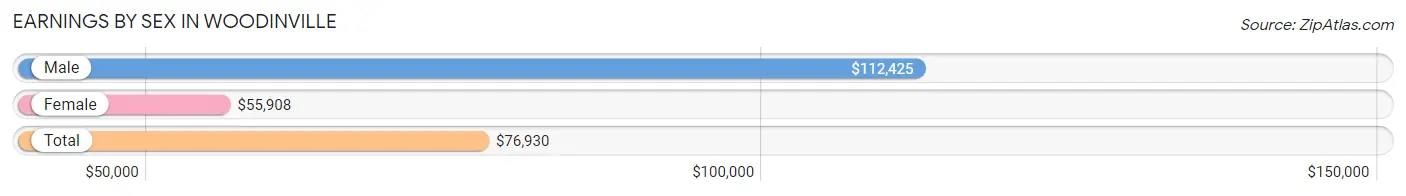
Earnings by Sex in Woodinville
Average Earnings in Woodinville are $76,930, $112,425 for men and $55,908 for women, a difference of 50.3%.
| Sex | Number | Average Earnings |
| Male | 4,228 (52.1%) | $112,425 |
| Female | 3,892 (47.9%) | $55,908 |
| Total | 8,120 (100.0%) | $76,930 |
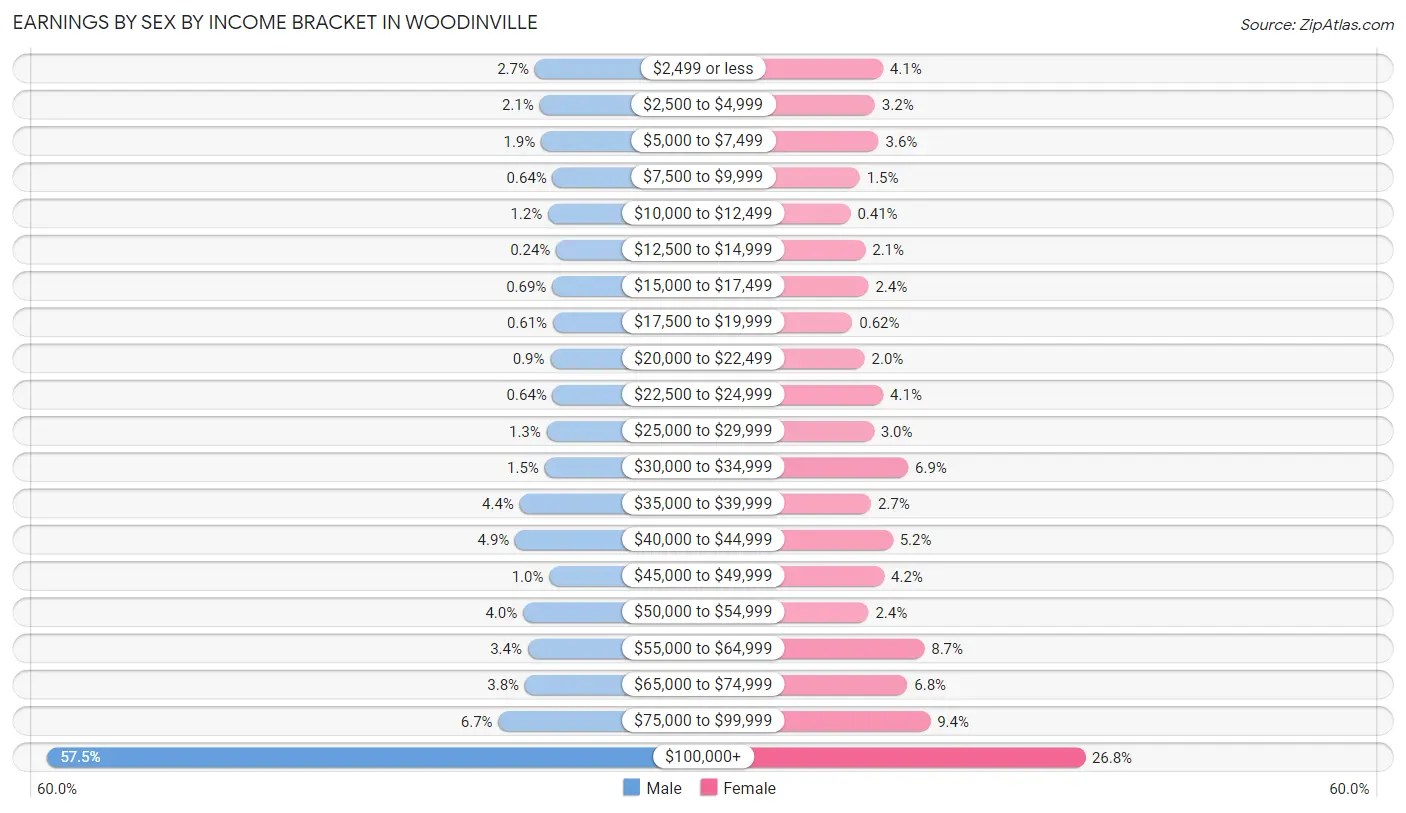
Earnings by Sex by Income Bracket in Woodinville
The most common earnings brackets in Woodinville are $100,000+ for men (2,429 | 57.5%) and $100,000+ for women (1,042 | 26.8%).
| Income | Male | Female |
| $2,499 or less | 112 (2.6%) | 158 (4.1%) |
| $2,500 to $4,999 | 89 (2.1%) | 123 (3.2%) |
| $5,000 to $7,499 | 82 (1.9%) | 139 (3.6%) |
| $7,500 to $9,999 | 27 (0.6%) | 57 (1.5%) |
| $10,000 to $12,499 | 49 (1.2%) | 16 (0.4%) |
| $12,500 to $14,999 | 10 (0.2%) | 81 (2.1%) |
| $15,000 to $17,499 | 29 (0.7%) | 95 (2.4%) |
| $17,500 to $19,999 | 26 (0.6%) | 24 (0.6%) |
| $20,000 to $22,499 | 38 (0.9%) | 78 (2.0%) |
| $22,500 to $24,999 | 27 (0.6%) | 159 (4.1%) |
| $25,000 to $29,999 | 56 (1.3%) | 118 (3.0%) |
| $30,000 to $34,999 | 65 (1.5%) | 268 (6.9%) |
| $35,000 to $39,999 | 184 (4.3%) | 106 (2.7%) |
| $40,000 to $44,999 | 205 (4.9%) | 201 (5.2%) |
| $45,000 to $49,999 | 43 (1.0%) | 163 (4.2%) |
| $50,000 to $54,999 | 168 (4.0%) | 95 (2.4%) |
| $55,000 to $64,999 | 145 (3.4%) | 339 (8.7%) |
| $65,000 to $74,999 | 159 (3.8%) | 265 (6.8%) |
| $75,000 to $99,999 | 285 (6.7%) | 365 (9.4%) |
| $100,000+ | 2,429 (57.5%) | 1,042 (26.8%) |
| Total | 4,228 (100.0%) | 3,892 (100.0%) |
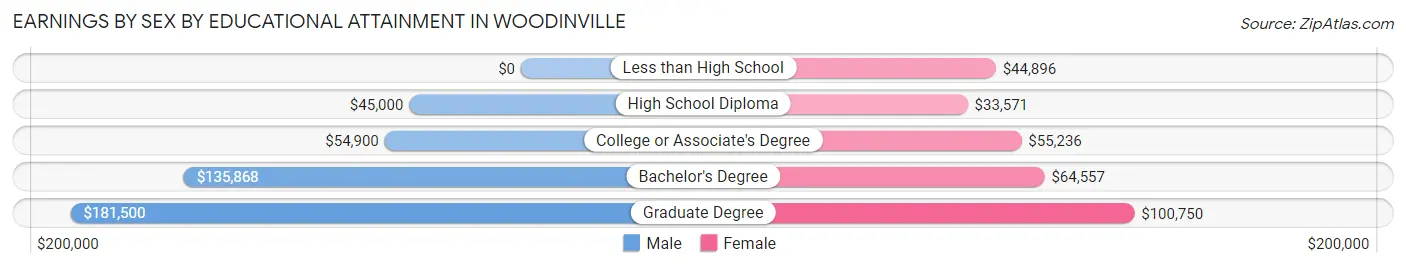
Earnings by Sex by Educational Attainment in Woodinville
Average earnings in Woodinville are $115,633 for men and $65,799 for women, a difference of 43.1%. Men with an educational attainment of graduate degree enjoy the highest average annual earnings of $181,500, while those with high school diploma education earn the least with $45,000. Women with an educational attainment of graduate degree earn the most with the average annual earnings of $100,750, while those with high school diploma education have the smallest earnings of $33,571.
| Educational Attainment | Male Income | Female Income |
| Less than High School | - | - |
| High School Diploma | $45,000 | $33,571 |
| College or Associate's Degree | $54,900 | $55,236 |
| Bachelor's Degree | $135,868 | $64,557 |
| Graduate Degree | $181,500 | $100,750 |
| Total | $115,633 | $65,799 |
Family Income in Woodinville
Family Income Brackets in Woodinville
According to the Woodinville family income data, there are 1,459 families falling into the $200,000+ income range, which is the most common income bracket and makes up 41.4% of all families. Conversely, the $10,000 to $14,999 income bracket is the least frequent group with only 14 families (0.4%) belonging to this category.
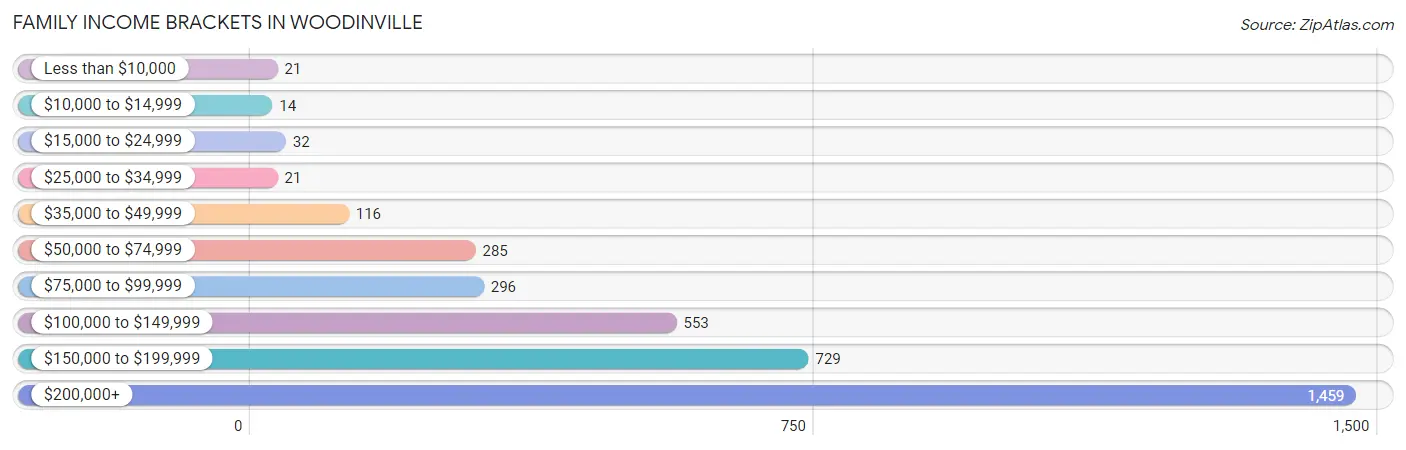
| Income Bracket | # Families | % Families |
| Less than $10,000 | 21 | 0.6% |
| $10,000 to $14,999 | 14 | 0.4% |
| $15,000 to $24,999 | 32 | 0.9% |
| $25,000 to $34,999 | 21 | 0.6% |
| $35,000 to $49,999 | 116 | 3.3% |
| $50,000 to $74,999 | 285 | 8.1% |
| $75,000 to $99,999 | 296 | 8.4% |
| $100,000 to $149,999 | 553 | 15.7% |
| $150,000 to $199,999 | 729 | 20.7% |
| $200,000+ | 1,459 | 41.4% |
Family Income by Famaliy Size in Woodinville
6-person families (61 | 1.7%) account for the highest median family income in Woodinville with $250,001 per family, while 2-person families (1,587 | 45.0%) have the highest median income of $68,271 per family member.
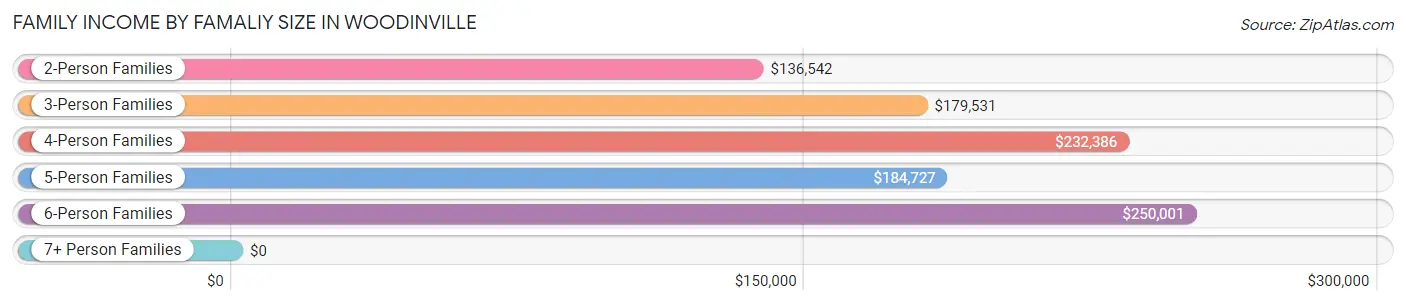
| Income Bracket | # Families | Median Income |
| 2-Person Families | 1,587 (45.0%) | $136,542 |
| 3-Person Families | 1,079 (30.6%) | $179,531 |
| 4-Person Families | 465 (13.2%) | $232,386 |
| 5-Person Families | 319 (9.0%) | $184,727 |
| 6-Person Families | 61 (1.7%) | $250,001 |
| 7+ Person Families | 13 (0.4%) | $0 |
| Total | 3,524 (100.0%) | $180,385 |
Family Income by Number of Earners in Woodinville
The median family income in Woodinville is $180,385, with families comprising 3+ earners (260) having the highest median family income of $250,001, while families with no earners (386) have the lowest median family income of $71,144, accounting for 7.4% and 11.0% of families, respectively.
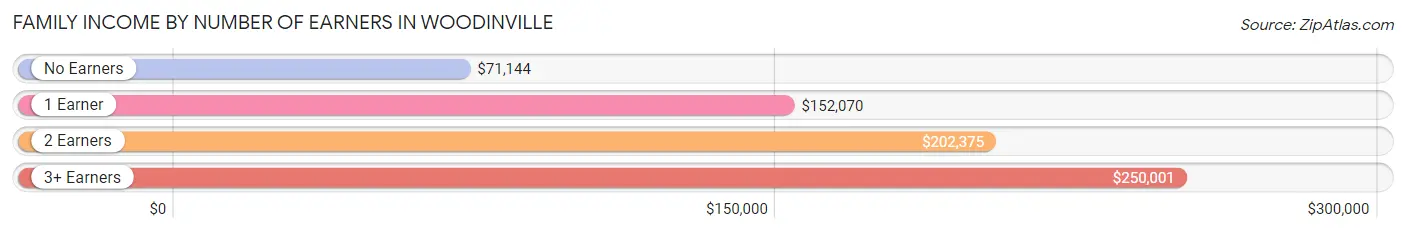
| Number of Earners | # Families | Median Income |
| No Earners | 386 (11.0%) | $71,144 |
| 1 Earner | 1,023 (29.0%) | $152,070 |
| 2 Earners | 1,855 (52.6%) | $202,375 |
| 3+ Earners | 260 (7.4%) | $250,001 |
| Total | 3,524 (100.0%) | $180,385 |
Household Income in Woodinville
Household Income Brackets in Woodinville
With 1,848 households falling in the category, the $200,000+ income range is the most frequent in Woodinville, accounting for 33.3% of all households. In contrast, only 72 households (1.3%) fall into the less than $10,000 income bracket, making it the least populous group.
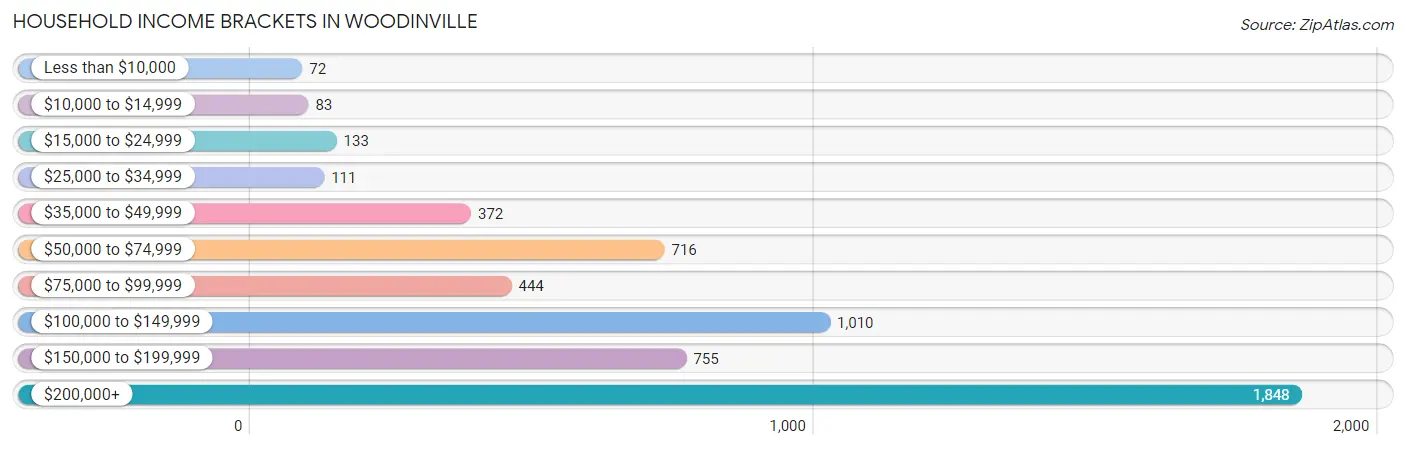
| Income Bracket | # Households | % Households |
| Less than $10,000 | 72 | 1.3% |
| $10,000 to $14,999 | 83 | 1.5% |
| $15,000 to $24,999 | 133 | 2.4% |
| $25,000 to $34,999 | 111 | 2.0% |
| $35,000 to $49,999 | 372 | 6.7% |
| $50,000 to $74,999 | 716 | 12.9% |
| $75,000 to $99,999 | 444 | 8.0% |
| $100,000 to $149,999 | 1,010 | 18.2% |
| $150,000 to $199,999 | 755 | 13.6% |
| $200,000+ | 1,848 | 33.3% |
Household Income by Householder Age in Woodinville
The median household income in Woodinville is $142,500, with the highest median household income of $179,813 found in the 45 to 64 years age bracket for the primary householder. A total of 1,990 households (35.9%) fall into this category. Meanwhile, the 15 to 24 years age bracket for the primary householder has the lowest median household income of $64,274, with 168 households (3.0%) in this group.
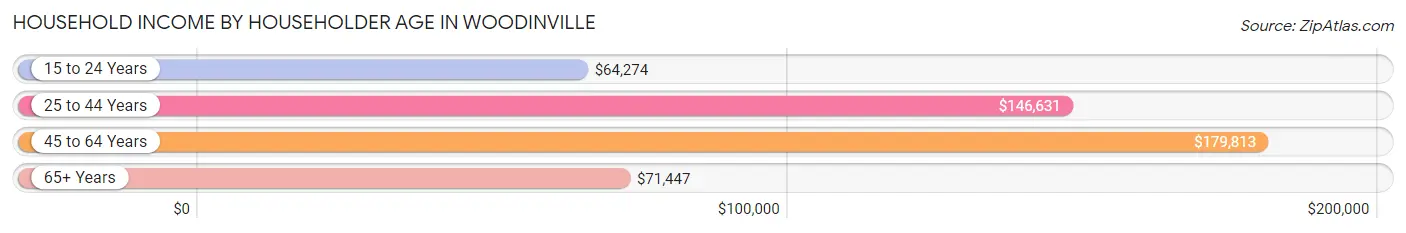
| Income Bracket | # Households | Median Income |
| 15 to 24 Years | 168 (3.0%) | $64,274 |
| 25 to 44 Years | 2,282 (41.1%) | $146,631 |
| 45 to 64 Years | 1,990 (35.9%) | $179,813 |
| 65+ Years | 1,110 (20.0%) | $71,447 |
| Total | 5,550 (100.0%) | $142,500 |
Poverty in Woodinville
Income Below Poverty by Sex and Age in Woodinville
With 3.0% poverty level for males and 4.6% for females among the residents of Woodinville, 16 and 17 year old males and 5 year old females are the most vulnerable to poverty, with 12 males (12.9%) and 13 females (54.2%) in their respective age groups living below the poverty level.
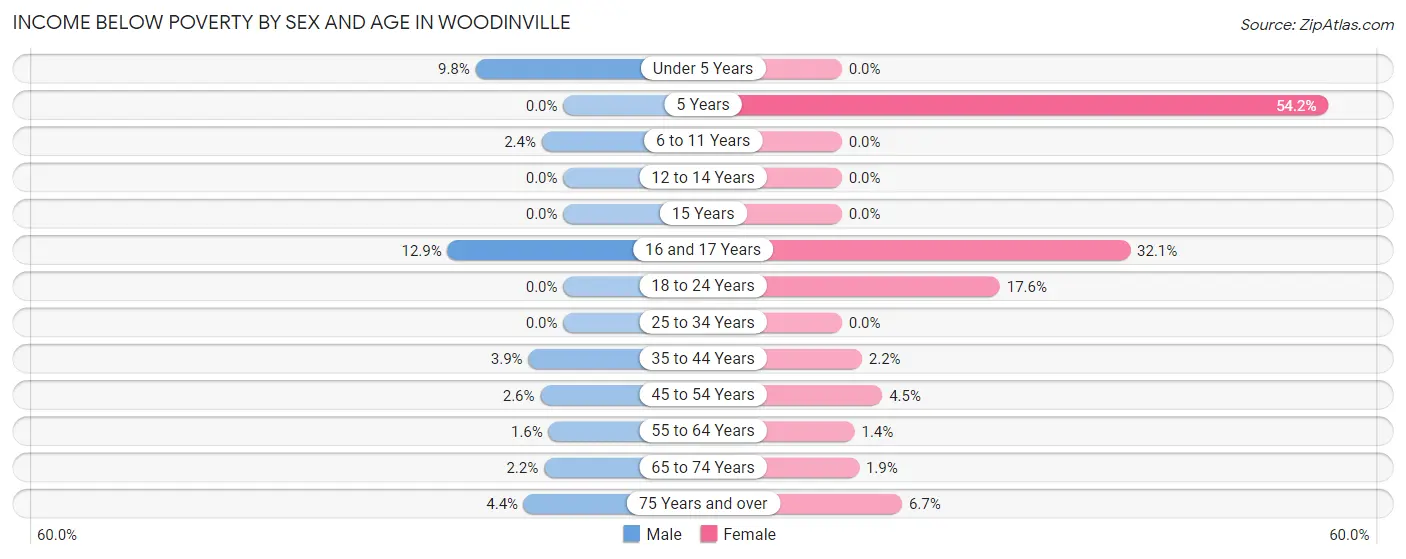
| Age Bracket | Male | Female |
| Under 5 Years | 56 (9.8%) | 0 (0.0%) |
| 5 Years | 0 (0.0%) | 13 (54.2%) |
| 6 to 11 Years | 13 (2.4%) | 0 (0.0%) |
| 12 to 14 Years | 0 (0.0%) | 0 (0.0%) |
| 15 Years | 0 (0.0%) | 0 (0.0%) |
| 16 and 17 Years | 12 (12.9%) | 35 (32.1%) |
| 18 to 24 Years | 0 (0.0%) | 123 (17.6%) |
| 25 to 34 Years | 0 (0.0%) | 0 (0.0%) |
| 35 to 44 Years | 55 (3.9%) | 27 (2.2%) |
| 45 to 54 Years | 21 (2.6%) | 44 (4.5%) |
| 55 to 64 Years | 18 (1.6%) | 10 (1.4%) |
| 65 to 74 Years | 9 (2.1%) | 10 (1.9%) |
| 75 Years and over | 18 (4.4%) | 44 (6.7%) |
| Total | 202 (3.0%) | 306 (4.6%) |
Income Above Poverty by Sex and Age in Woodinville
According to the poverty statistics in Woodinville, males aged 5 years and females aged under 5 years are the age groups that are most secure financially, with 100.0% of males and 100.0% of females in these age groups living above the poverty line.
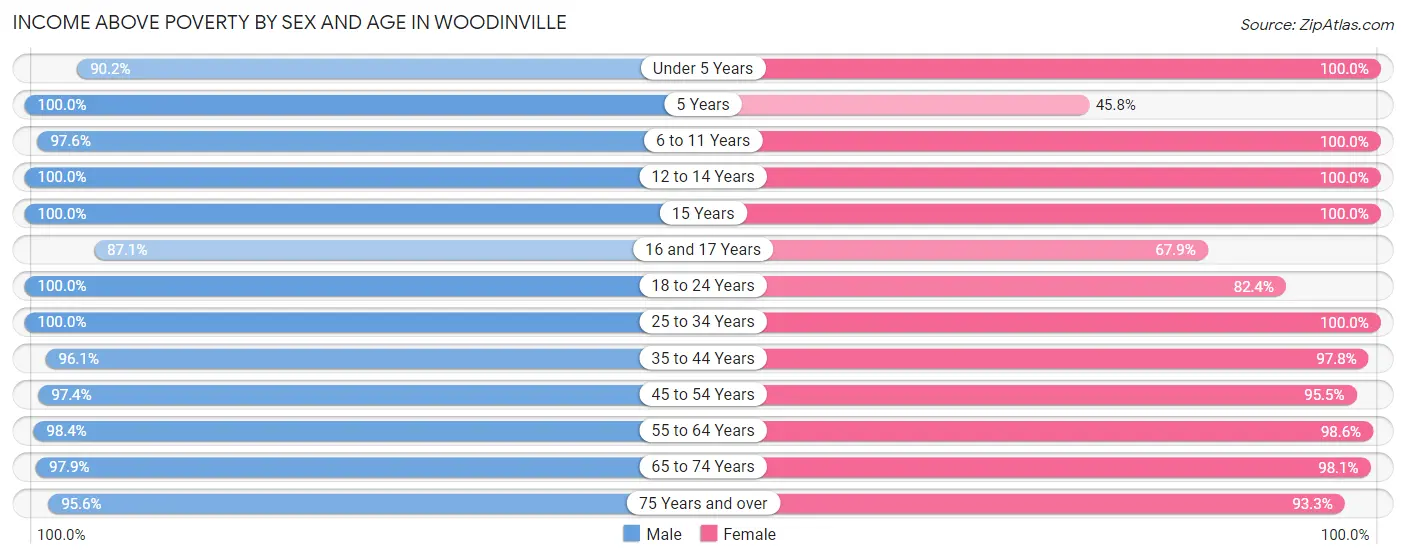
| Age Bracket | Male | Female |
| Under 5 Years | 517 (90.2%) | 370 (100.0%) |
| 5 Years | 82 (100.0%) | 11 (45.8%) |
| 6 to 11 Years | 528 (97.6%) | 340 (100.0%) |
| 12 to 14 Years | 127 (100.0%) | 206 (100.0%) |
| 15 Years | 16 (100.0%) | 64 (100.0%) |
| 16 and 17 Years | 81 (87.1%) | 74 (67.9%) |
| 18 to 24 Years | 184 (100.0%) | 576 (82.4%) |
| 25 to 34 Years | 848 (100.0%) | 768 (100.0%) |
| 35 to 44 Years | 1,358 (96.1%) | 1,185 (97.8%) |
| 45 to 54 Years | 798 (97.4%) | 934 (95.5%) |
| 55 to 64 Years | 1,081 (98.4%) | 696 (98.6%) |
| 65 to 74 Years | 410 (97.9%) | 513 (98.1%) |
| 75 Years and over | 392 (95.6%) | 613 (93.3%) |
| Total | 6,422 (97.0%) | 6,350 (95.4%) |
Income Below Poverty Among Married-Couple Families in Woodinville
The poverty statistics for married-couple families in Woodinville show that 1.0% or 31 of the total 3,054 families live below the poverty line. Families with no children have the highest poverty rate of 1.1%, comprising of 19 families. On the other hand, families with 3 or 4 children have the lowest poverty rate of 0.0%, which includes 0 families.
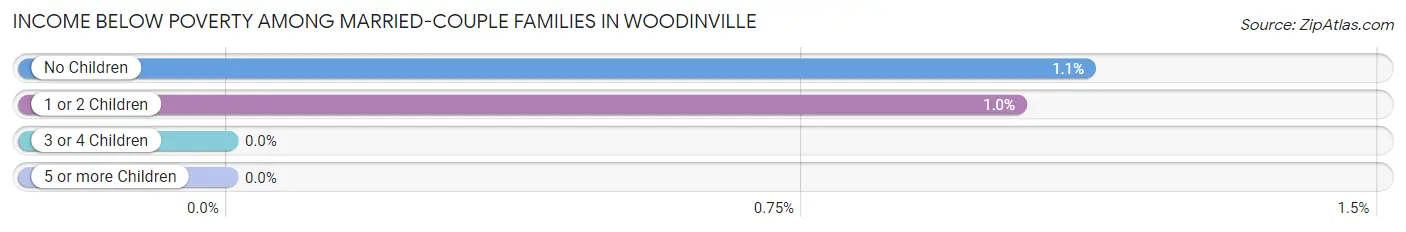
| Children | Above Poverty | Below Poverty |
| No Children | 1,672 (98.9%) | 19 (1.1%) |
| 1 or 2 Children | 1,156 (99.0%) | 12 (1.0%) |
| 3 or 4 Children | 195 (100.0%) | 0 (0.0%) |
| 5 or more Children | 0 (0.0%) | 0 (0.0%) |
| Total | 3,023 (99.0%) | 31 (1.0%) |
Income Below Poverty Among Single-Parent Households in Woodinville
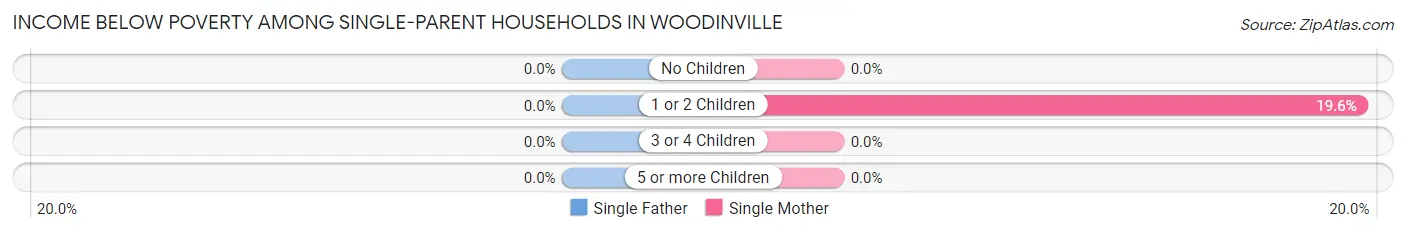
| Children | Single Father | Single Mother |
| No Children | 0 (0.0%) | 0 (0.0%) |
| 1 or 2 Children | 0 (0.0%) | 35 (19.6%) |
| 3 or 4 Children | 0 (0.0%) | 0 (0.0%) |
| 5 or more Children | 0 (0.0%) | 0 (0.0%) |
| Total | 0 (0.0%) | 35 (12.8%) |
Income Below Poverty Among Married-Couple vs Single-Parent Households in Woodinville
The poverty data for Woodinville shows that 31 of the married-couple family households (1.0%) and 35 of the single-parent households (7.4%) are living below the poverty level. Within the married-couple family households, those with no children have the highest poverty rate, with 19 households (1.1%) falling below the poverty line. Among the single-parent households, those with 1 or 2 children have the highest poverty rate, with 35 household (17.0%) living below poverty.
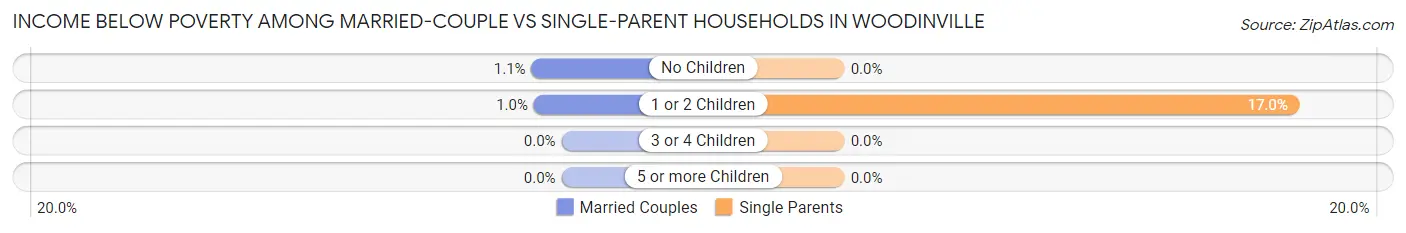
| Children | Married-Couple Families | Single-Parent Households |
| No Children | 19 (1.1%) | 0 (0.0%) |
| 1 or 2 Children | 12 (1.0%) | 35 (17.0%) |
| 3 or 4 Children | 0 (0.0%) | 0 (0.0%) |
| 5 or more Children | 0 (0.0%) | 0 (0.0%) |
| Total | 31 (1.0%) | 35 (7.4%) |
Race in Woodinville
The most populous races in Woodinville are White / Caucasian (9,996 | 75.1%), Asian (2,223 | 16.7%), and Hispanic or Latino (1,227 | 9.2%).
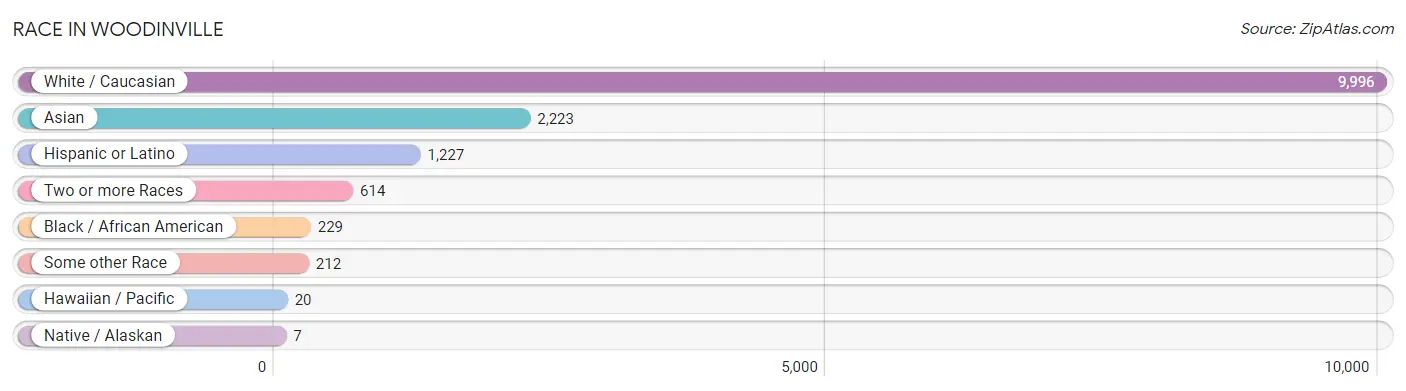
| Race | # Population | % Population |
| Asian | 2,223 | 16.7% |
| Black / African American | 229 | 1.7% |
| Hawaiian / Pacific | 20 | 0.2% |
| Hispanic or Latino | 1,227 | 9.2% |
| Native / Alaskan | 7 | 0.1% |
| White / Caucasian | 9,996 | 75.1% |
| Two or more Races | 614 | 4.6% |
| Some other Race | 212 | 1.6% |
| Total | 13,301 | 100.0% |
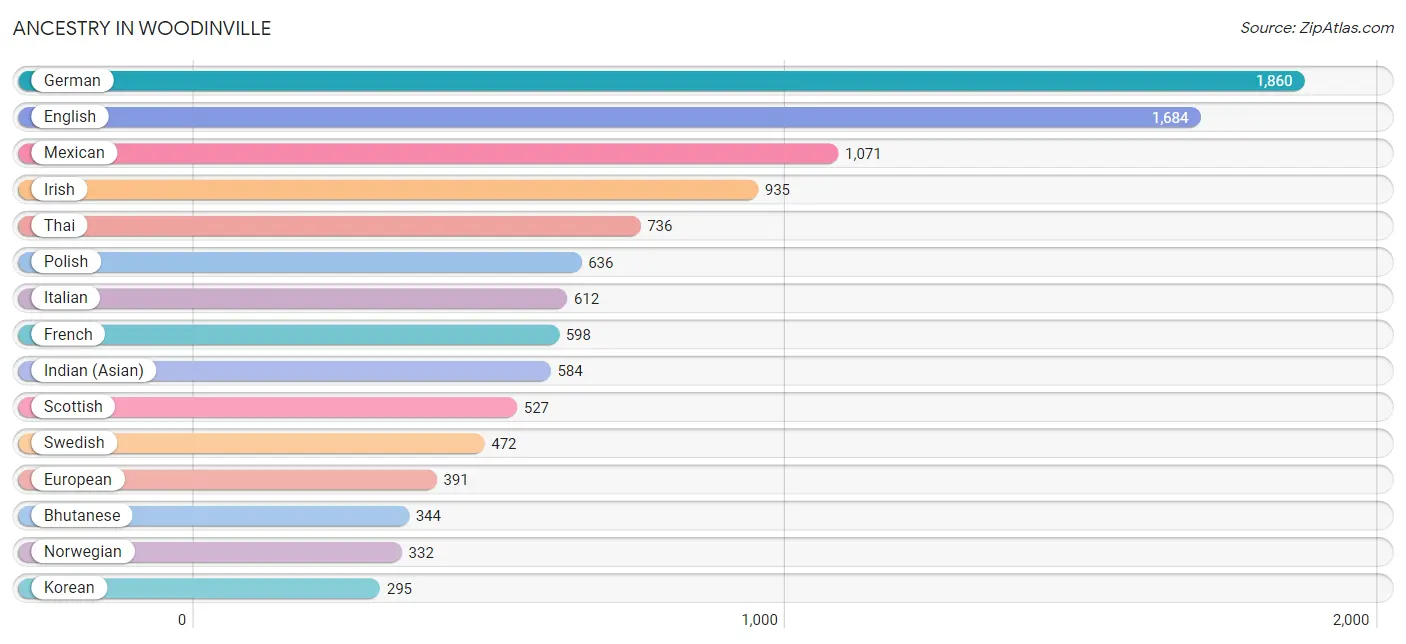
Ancestry in Woodinville
The most populous ancestries reported in Woodinville are German (1,860 | 14.0%), English (1,684 | 12.7%), Mexican (1,071 | 8.1%), Irish (935 | 7.0%), and Thai (736 | 5.5%), together accounting for 47.3% of all Woodinville residents.
| Ancestry | # Population | % Population |
| American | 278 | 2.1% |
| Apache | 23 | 0.2% |
| Arab | 84 | 0.6% |
| Armenian | 36 | 0.3% |
| Austrian | 17 | 0.1% |
| Belgian | 20 | 0.2% |
| Bhutanese | 344 | 2.6% |
| Brazilian | 93 | 0.7% |
| British | 275 | 2.1% |
| British West Indian | 22 | 0.2% |
| Bulgarian | 55 | 0.4% |
| Burmese | 216 | 1.6% |
| Canadian | 26 | 0.2% |
| Celtic | 17 | 0.1% |
| Cherokee | 23 | 0.2% |
| Colombian | 44 | 0.3% |
| Croatian | 27 | 0.2% |
| Cuban | 11 | 0.1% |
| Czech | 23 | 0.2% |
| Czechoslovakian | 19 | 0.1% |
| Danish | 104 | 0.8% |
| Dominican | 25 | 0.2% |
| Dutch | 162 | 1.2% |
| Eastern European | 42 | 0.3% |
| English | 1,684 | 12.7% |
| European | 391 | 2.9% |
| Filipino | 212 | 1.6% |
| Finnish | 97 | 0.7% |
| French | 598 | 4.5% |
| French Canadian | 50 | 0.4% |
| German | 1,860 | 14.0% |
| Greek | 72 | 0.5% |
| Haitian | 15 | 0.1% |
| Indian (Asian) | 584 | 4.4% |
| Iranian | 160 | 1.2% |
| Irish | 935 | 7.0% |
| Italian | 612 | 4.6% |
| Korean | 295 | 2.2% |
| Laotian | 15 | 0.1% |
| Lebanese | 66 | 0.5% |
| Luxembourger | 11 | 0.1% |
| Mexican | 1,071 | 8.1% |
| Mongolian | 17 | 0.1% |
| Native Hawaiian | 62 | 0.5% |
| Northern European | 123 | 0.9% |
| Norwegian | 332 | 2.5% |
| Pakistani | 103 | 0.8% |
| Pennsylvania German | 13 | 0.1% |
| Polish | 636 | 4.8% |
| Portuguese | 138 | 1.0% |
| Puerto Rican | 59 | 0.4% |
| Romanian | 64 | 0.5% |
| Russian | 282 | 2.1% |
| Samoan | 20 | 0.2% |
| Scandinavian | 62 | 0.5% |
| Scotch-Irish | 84 | 0.6% |
| Scottish | 527 | 4.0% |
| South American | 61 | 0.5% |
| Sri Lankan | 35 | 0.3% |
| Swedish | 472 | 3.5% |
| Swiss | 49 | 0.4% |
| Thai | 736 | 5.5% |
| Trinidadian and Tobagonian | 10 | 0.1% |
| Ukrainian | 242 | 1.8% |
| Venezuelan | 17 | 0.1% |
| Vietnamese | 5 | 0.0% |
| Welsh | 76 | 0.6% |
| Yakama | 9 | 0.1% |
| Yugoslavian | 19 | 0.1% | View All 69 Rows |
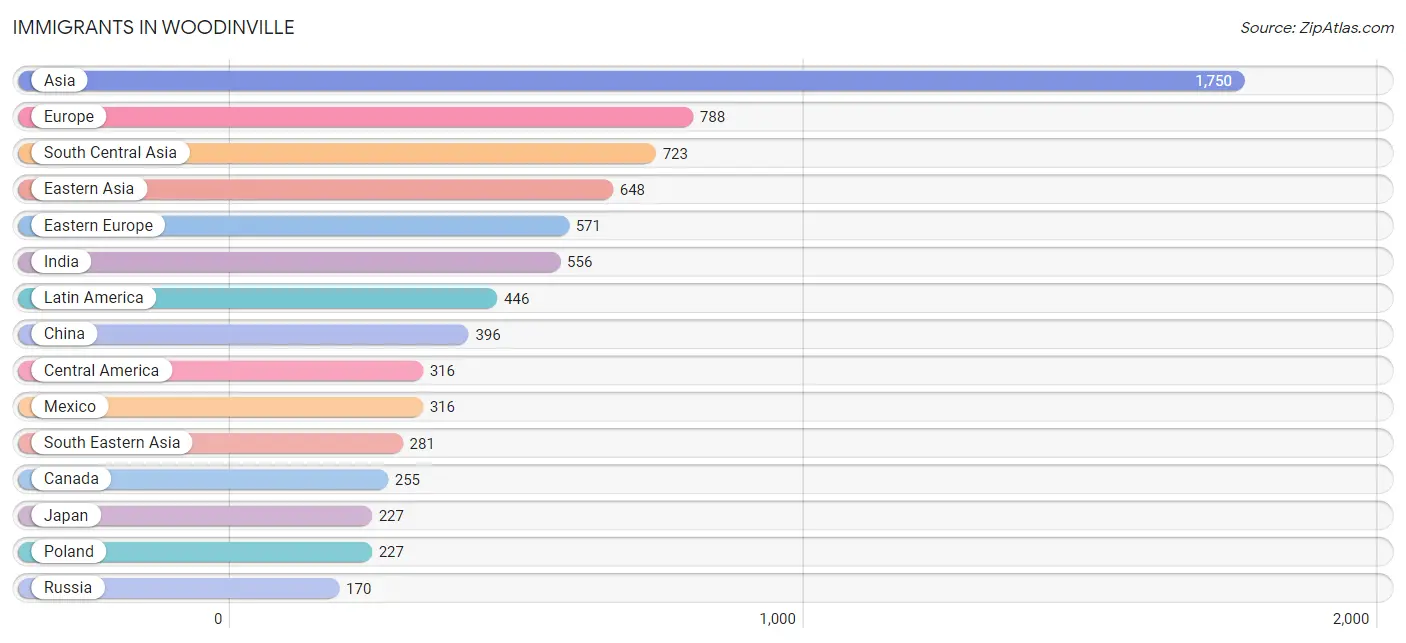
Immigrants in Woodinville
The most numerous immigrant groups reported in Woodinville came from Asia (1,750 | 13.2%), Europe (788 | 5.9%), South Central Asia (723 | 5.4%), Eastern Asia (648 | 4.9%), and Eastern Europe (571 | 4.3%), together accounting for 33.7% of all Woodinville residents.
| Immigration Origin | # Population | % Population |
| Africa | 29 | 0.2% |
| Asia | 1,750 | 13.2% |
| Bangladesh | 5 | 0.0% |
| Belarus | 21 | 0.2% |
| Brazil | 46 | 0.4% |
| Bulgaria | 29 | 0.2% |
| Canada | 255 | 1.9% |
| Caribbean | 40 | 0.3% |
| Central America | 316 | 2.4% |
| China | 396 | 3.0% |
| Colombia | 44 | 0.3% |
| Eastern Africa | 18 | 0.1% |
| Eastern Asia | 648 | 4.9% |
| Eastern Europe | 571 | 4.3% |
| England | 14 | 0.1% |
| Europe | 788 | 5.9% |
| France | 23 | 0.2% |
| Germany | 77 | 0.6% |
| Haiti | 15 | 0.1% |
| Hong Kong | 37 | 0.3% |
| India | 556 | 4.2% |
| Indonesia | 15 | 0.1% |
| Iran | 94 | 0.7% |
| Ireland | 9 | 0.1% |
| Italy | 16 | 0.1% |
| Japan | 227 | 1.7% |
| Korea | 25 | 0.2% |
| Latin America | 446 | 3.4% |
| Lebanon | 88 | 0.7% |
| Lithuania | 14 | 0.1% |
| Malaysia | 8 | 0.1% |
| Mexico | 316 | 2.4% |
| Moldova | 14 | 0.1% |
| Northern Europe | 101 | 0.8% |
| Philippines | 120 | 0.9% |
| Poland | 227 | 1.7% |
| Russia | 170 | 1.3% |
| Saudi Arabia | 10 | 0.1% |
| Scotland | 21 | 0.2% |
| Serbia | 52 | 0.4% |
| South Africa | 11 | 0.1% |
| South America | 90 | 0.7% |
| South Central Asia | 723 | 5.4% |
| South Eastern Asia | 281 | 2.1% |
| Southern Europe | 16 | 0.1% |
| Sweden | 20 | 0.2% |
| Taiwan | 58 | 0.4% |
| Thailand | 103 | 0.8% |
| Trinidad and Tobago | 10 | 0.1% |
| Ukraine | 44 | 0.3% |
| Vietnam | 35 | 0.3% |
| Western Asia | 98 | 0.7% |
| Western Europe | 100 | 0.7% | View All 53 Rows |
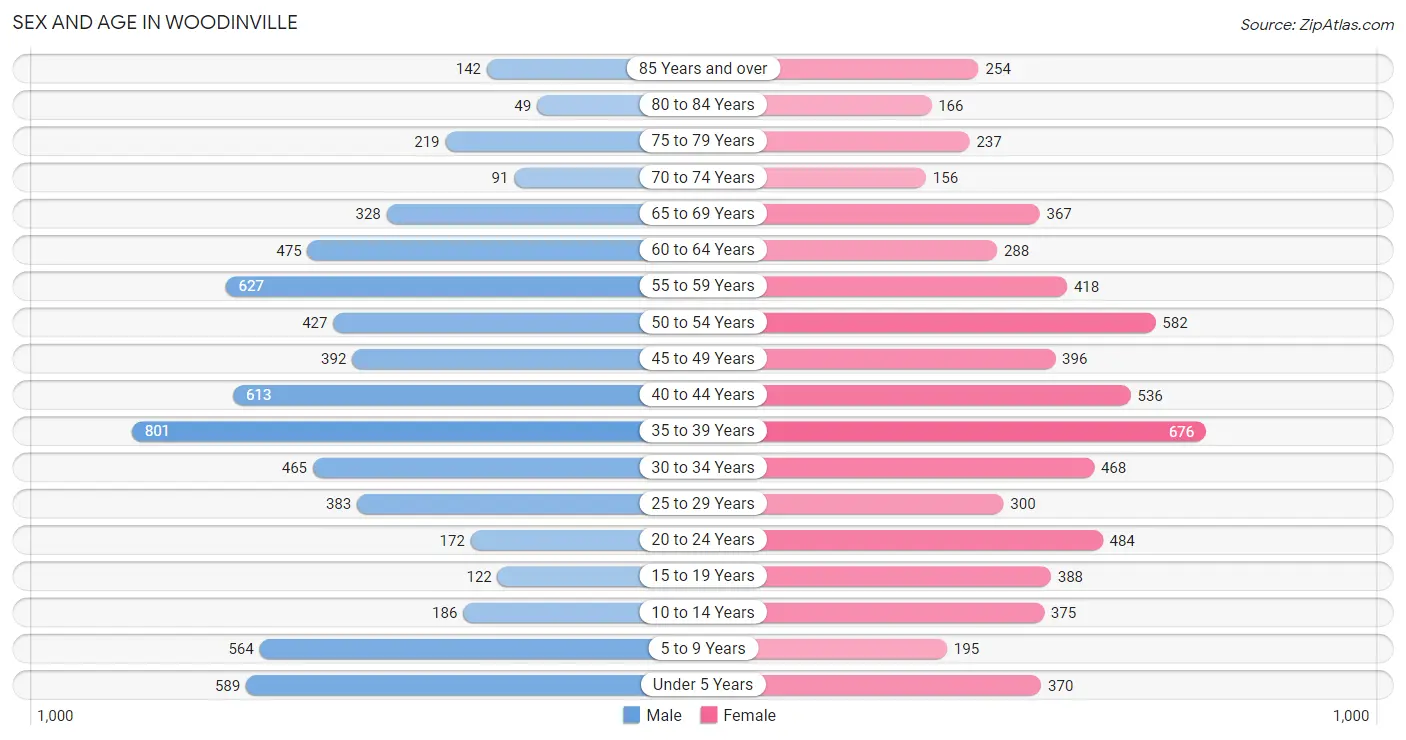
Sex and Age in Woodinville
Sex and Age in Woodinville
The most populous age groups in Woodinville are 35 to 39 Years (801 | 12.0%) for men and 35 to 39 Years (676 | 10.2%) for women.
| Age Bracket | Male | Female |
| Under 5 Years | 589 (8.9%) | 370 (5.6%) |
| 5 to 9 Years | 564 (8.5%) | 195 (2.9%) |
| 10 to 14 Years | 186 (2.8%) | 375 (5.6%) |
| 15 to 19 Years | 122 (1.8%) | 388 (5.8%) |
| 20 to 24 Years | 172 (2.6%) | 484 (7.3%) |
| 25 to 29 Years | 383 (5.8%) | 300 (4.5%) |
| 30 to 34 Years | 465 (7.0%) | 468 (7.0%) |
| 35 to 39 Years | 801 (12.0%) | 676 (10.2%) |
| 40 to 44 Years | 613 (9.2%) | 536 (8.1%) |
| 45 to 49 Years | 392 (5.9%) | 396 (5.9%) |
| 50 to 54 Years | 427 (6.4%) | 582 (8.7%) |
| 55 to 59 Years | 627 (9.4%) | 418 (6.3%) |
| 60 to 64 Years | 475 (7.1%) | 288 (4.3%) |
| 65 to 69 Years | 328 (4.9%) | 367 (5.5%) |
| 70 to 74 Years | 91 (1.4%) | 156 (2.3%) |
| 75 to 79 Years | 219 (3.3%) | 237 (3.6%) |
| 80 to 84 Years | 49 (0.7%) | 166 (2.5%) |
| 85 Years and over | 142 (2.1%) | 254 (3.8%) |
| Total | 6,645 (100.0%) | 6,656 (100.0%) |
Families and Households in Woodinville
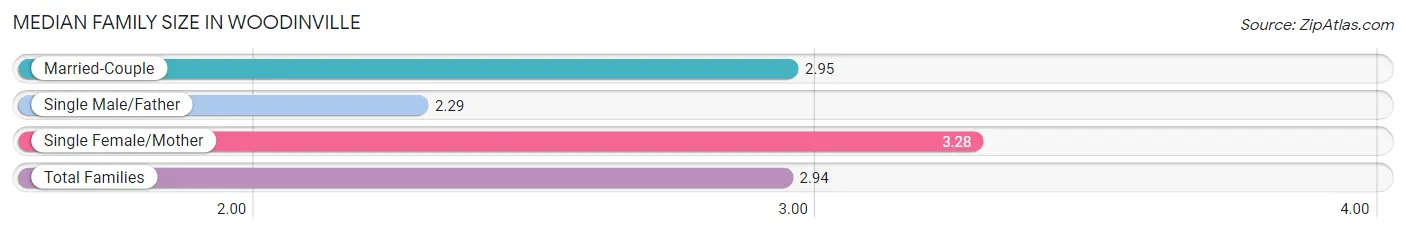
Median Family Size in Woodinville
The median family size in Woodinville is 2.94 persons per family, with single female/mother families (273 | 7.7%) accounting for the largest median family size of 3.28 persons per family. On the other hand, single male/father families (197 | 5.6%) represent the smallest median family size with 2.29 persons per family.
| Family Type | # Families | Family Size |
| Married-Couple | 3,054 (86.7%) | 2.95 |
| Single Male/Father | 197 (5.6%) | 2.29 |
| Single Female/Mother | 273 (7.7%) | 3.28 |
| Total Families | 3,524 (100.0%) | 2.94 |
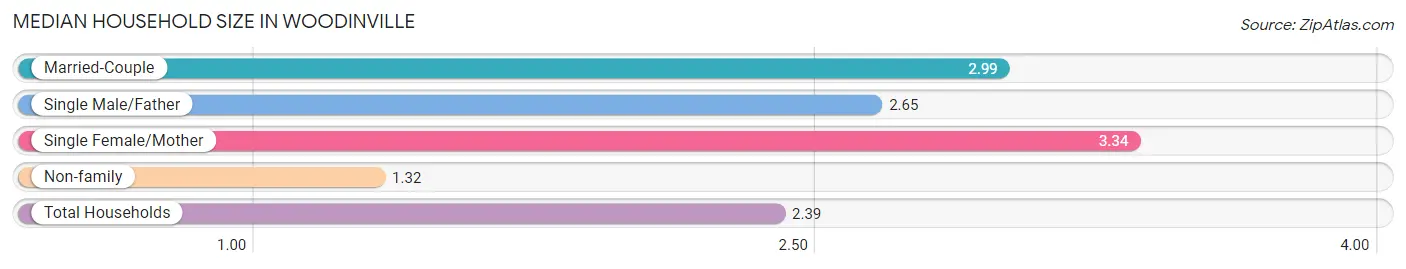
Median Household Size in Woodinville
The median household size in Woodinville is 2.39 persons per household, with single female/mother households (273 | 4.9%) accounting for the largest median household size of 3.34 persons per household. non-family households (2,026 | 36.5%) represent the smallest median household size with 1.32 persons per household.
| Household Type | # Households | Household Size |
| Married-Couple | 3,054 (55.0%) | 2.99 |
| Single Male/Father | 197 (3.5%) | 2.65 |
| Single Female/Mother | 273 (4.9%) | 3.34 |
| Non-family | 2,026 (36.5%) | 1.32 |
| Total Households | 5,550 (100.0%) | 2.39 |
Household Size by Marriage Status in Woodinville
Out of a total of 5,550 households in Woodinville, 3,524 (63.5%) are family households, while 2,026 (36.5%) are nonfamily households. The most numerous type of family households are 2-person households, comprising 1,496, and the most common type of nonfamily households are 1-person households, comprising 1,583.
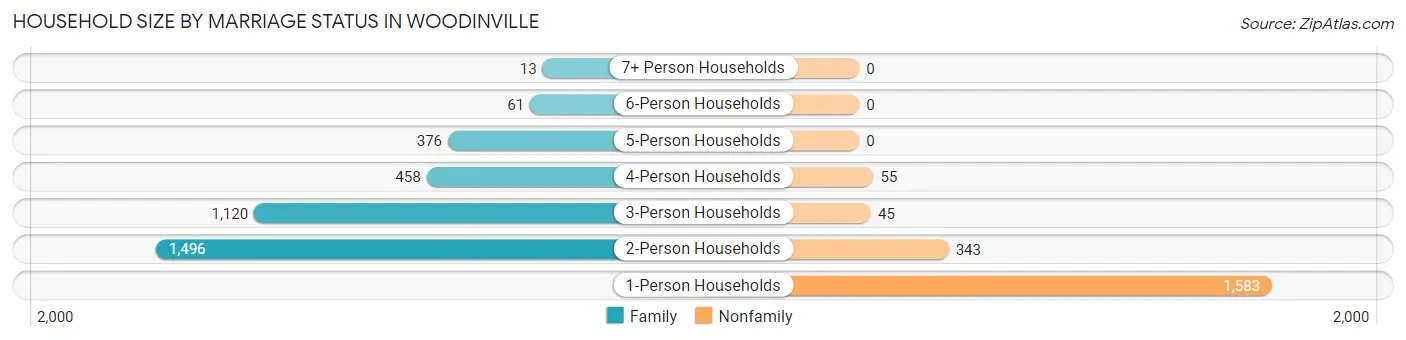
| Household Size | Family Households | Nonfamily Households |
| 1-Person Households | - | 1,583 (28.5%) |
| 2-Person Households | 1,496 (27.0%) | 343 (6.2%) |
| 3-Person Households | 1,120 (20.2%) | 45 (0.8%) |
| 4-Person Households | 458 (8.3%) | 55 (1.0%) |
| 5-Person Households | 376 (6.8%) | 0 (0.0%) |
| 6-Person Households | 61 (1.1%) | 0 (0.0%) |
| 7+ Person Households | 13 (0.2%) | 0 (0.0%) |
| Total | 3,524 (63.5%) | 2,026 (36.5%) |
Female Fertility in Woodinville
Fertility by Age in Woodinville
Average fertility rate in Woodinville is 43.0 births per 1,000 women. Women in the age bracket of 20 to 34 years have the highest fertility rate with 59.0 births per 1,000 women. Women in the age bracket of 20 to 34 years acount for 50.7% of all women with births.
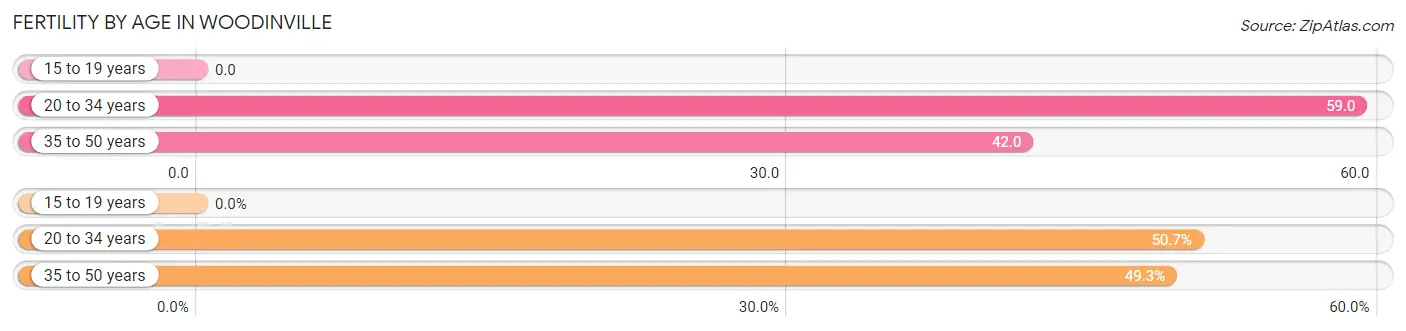
| Age Bracket | Women with Births | Births / 1,000 Women |
| 15 to 19 years | 0 (0.0%) | 0.0 |
| 20 to 34 years | 74 (50.7%) | 59.0 |
| 35 to 50 years | 72 (49.3%) | 42.0 |
| Total | 146 (100.0%) | 43.0 |
Fertility by Age by Marriage Status in Woodinville
97.9% of women with births (146) in Woodinville are married. The highest percentage of unmarried women with births falls into 20 to 34 years age bracket with 4.1% of them unmarried at the time of birth, while the lowest percentage of unmarried women with births belong to 35 to 50 years age bracket with 0.0% of them unmarried.
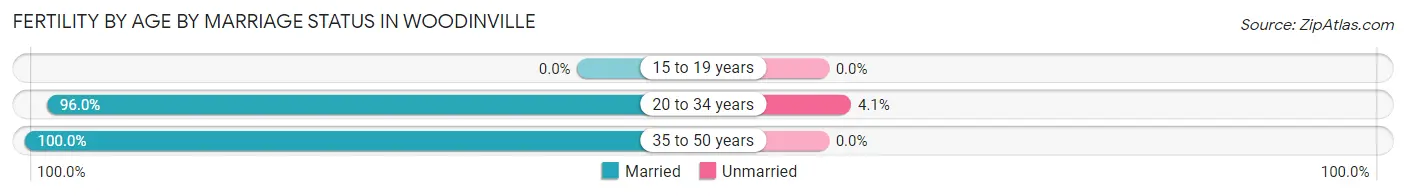
| Age Bracket | Married | Unmarried |
| 15 to 19 years | 0 (0.0%) | 0 (0.0%) |
| 20 to 34 years | 71 (96.0%) | 3 (4.1%) |
| 35 to 50 years | 72 (100.0%) | 0 (0.0%) |
| Total | 143 (98.0%) | 3 (2.1%) |
Fertility by Education in Woodinville
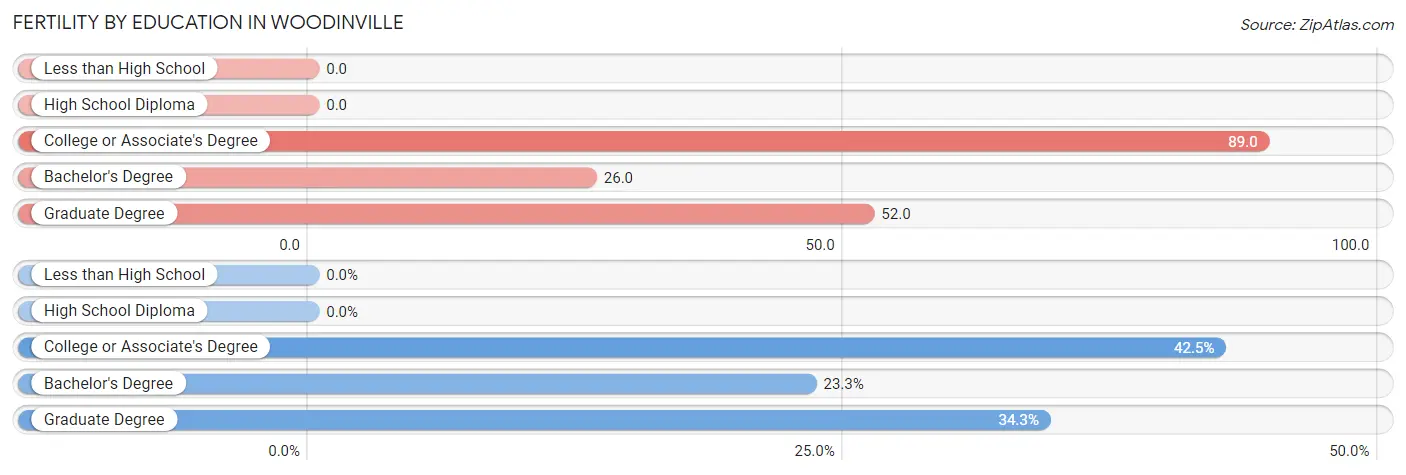
| Educational Attainment | Women with Births | Births / 1,000 Women |
| Less than High School | 0 (0.0%) | 0.0 |
| High School Diploma | 0 (0.0%) | 0.0 |
| College or Associate's Degree | 62 (42.5%) | 89.0 |
| Bachelor's Degree | 34 (23.3%) | 26.0 |
| Graduate Degree | 50 (34.3%) | 52.0 |
| Total | 146 (100.0%) | 43.0 |
Fertility by Education by Marriage Status in Woodinville
2.1% of women with births in Woodinville are unmarried. Women with the educational attainment of college or associate's degree are most likely to be married with 100.0% of them married at childbirth, while women with the educational attainment of graduate degree are least likely to be married with 6.0% of them unmarried at childbirth.
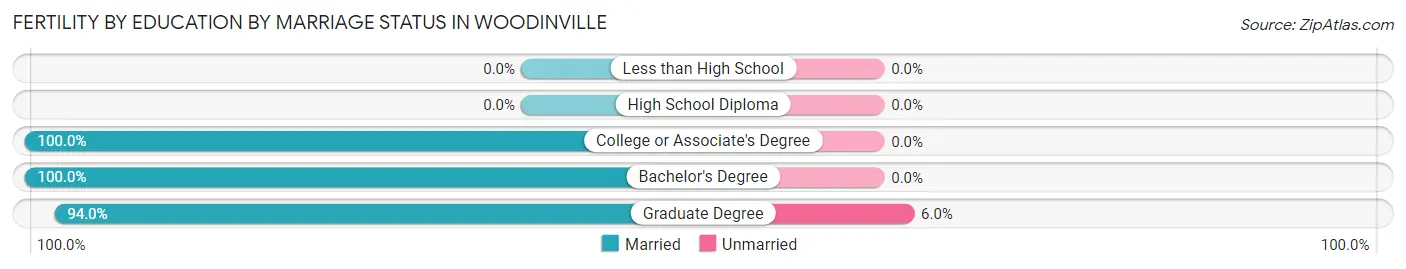
| Educational Attainment | Married | Unmarried |
| Less than High School | 0 (0.0%) | 0 (0.0%) |
| High School Diploma | 0 (0.0%) | 0 (0.0%) |
| College or Associate's Degree | 62 (100.0%) | 0 (0.0%) |
| Bachelor's Degree | 34 (100.0%) | 0 (0.0%) |
| Graduate Degree | 47 (94.0%) | 3 (6.0%) |
| Total | 143 (98.0%) | 3 (2.1%) |
Employment Characteristics in Woodinville
Employment by Class of Employer in Woodinville
Among the 7,325 employed individuals in Woodinville, private company employees (5,792 | 79.1%), not-for-profit organizations (486 | 6.6%), and local government employees (359 | 4.9%) make up the most common classes of employment.
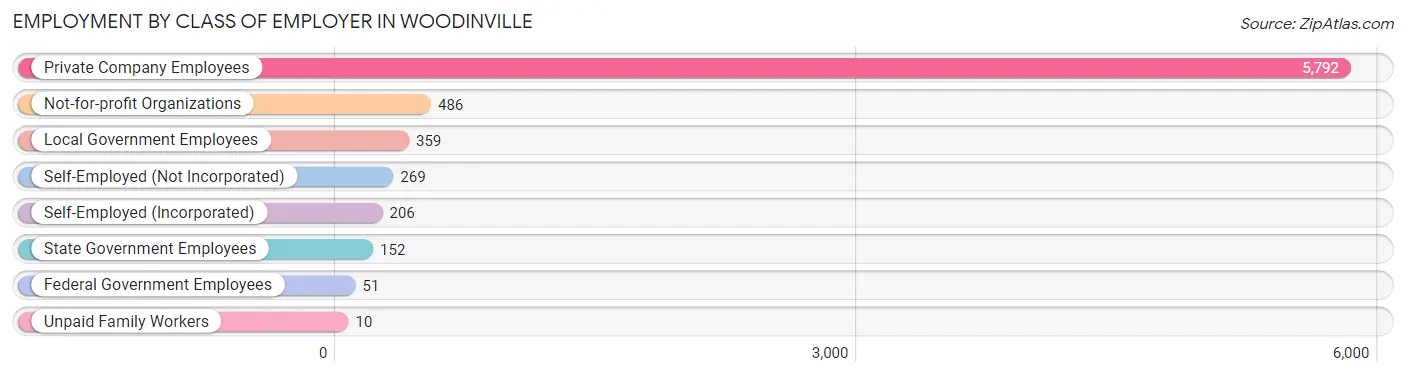
| Employer Class | # Employees | % Employees |
| Private Company Employees | 5,792 | 79.1% |
| Self-Employed (Incorporated) | 206 | 2.8% |
| Self-Employed (Not Incorporated) | 269 | 3.7% |
| Not-for-profit Organizations | 486 | 6.6% |
| Local Government Employees | 359 | 4.9% |
| State Government Employees | 152 | 2.1% |
| Federal Government Employees | 51 | 0.7% |
| Unpaid Family Workers | 10 | 0.1% |
| Total | 7,325 | 100.0% |
Employment Status by Age in Woodinville
According to the labor force statistics for Woodinville, out of the total population over 16 years of age (10,942), 70.2% or 7,681 individuals are in the labor force, with 3.8% or 292 of them unemployed. The age group with the highest labor force participation rate is 30 to 34 years, with 91.5% or 854 individuals in the labor force. Within the labor force, the 20 to 24 years age range has the highest percentage of unemployed individuals, with 18.3% or 86 of them being unemployed.
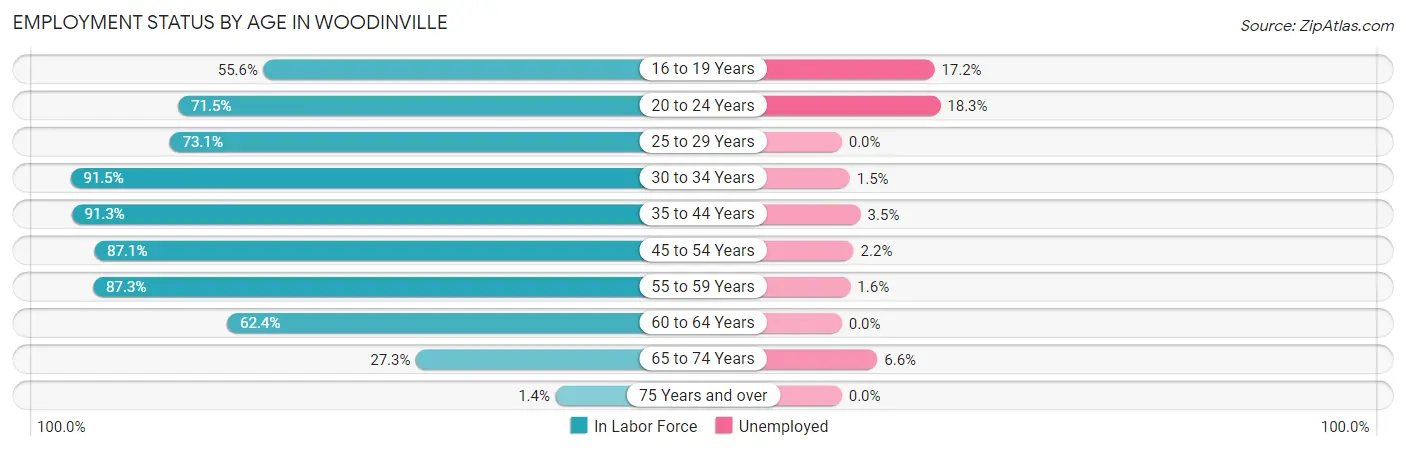
| Age Bracket | In Labor Force | Unemployed |
| 16 to 19 Years | 239 (55.6%) | 41 (17.2%) |
| 20 to 24 Years | 469 (71.5%) | 86 (18.3%) |
| 25 to 29 Years | 499 (73.1%) | 0 (0.0%) |
| 30 to 34 Years | 854 (91.5%) | 13 (1.5%) |
| 35 to 44 Years | 2,398 (91.3%) | 84 (3.5%) |
| 45 to 54 Years | 1,565 (87.1%) | 34 (2.2%) |
| 55 to 59 Years | 912 (87.3%) | 15 (1.6%) |
| 60 to 64 Years | 476 (62.4%) | 0 (0.0%) |
| 65 to 74 Years | 257 (27.3%) | 17 (6.6%) |
| 75 Years and over | 15 (1.4%) | 0 (0.0%) |
| Total | 7,681 (70.2%) | 292 (3.8%) |
Employment Status by Educational Attainment in Woodinville
According to labor force statistics for Woodinville, 85.4% of individuals (6,701) out of the total population between 25 and 64 years of age (7,847) are in the labor force, with 2.2% or 147 of them being unemployed. The group with the highest labor force participation rate are those with the educational attainment of bachelor's degree or higher, with 88.0% or 4,733 individuals in the labor force. Within the labor force, individuals with less than high school education have the highest percentage of unemployment, with 19.1% or 25 of them being unemployed.
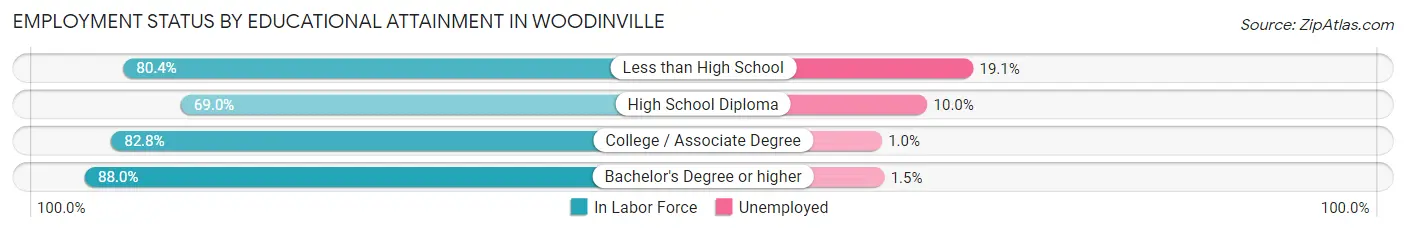
| Educational Attainment | In Labor Force | Unemployed |
| Less than High School | 131 (80.4%) | 31 (19.1%) |
| High School Diploma | 350 (69.0%) | 51 (10.0%) |
| College / Associate Degree | 1,490 (82.8%) | 18 (1.0%) |
| Bachelor's Degree or higher | 4,733 (88.0%) | 81 (1.5%) |
| Total | 6,701 (85.4%) | 173 (2.2%) |
Employment Occupations by Sex in Woodinville
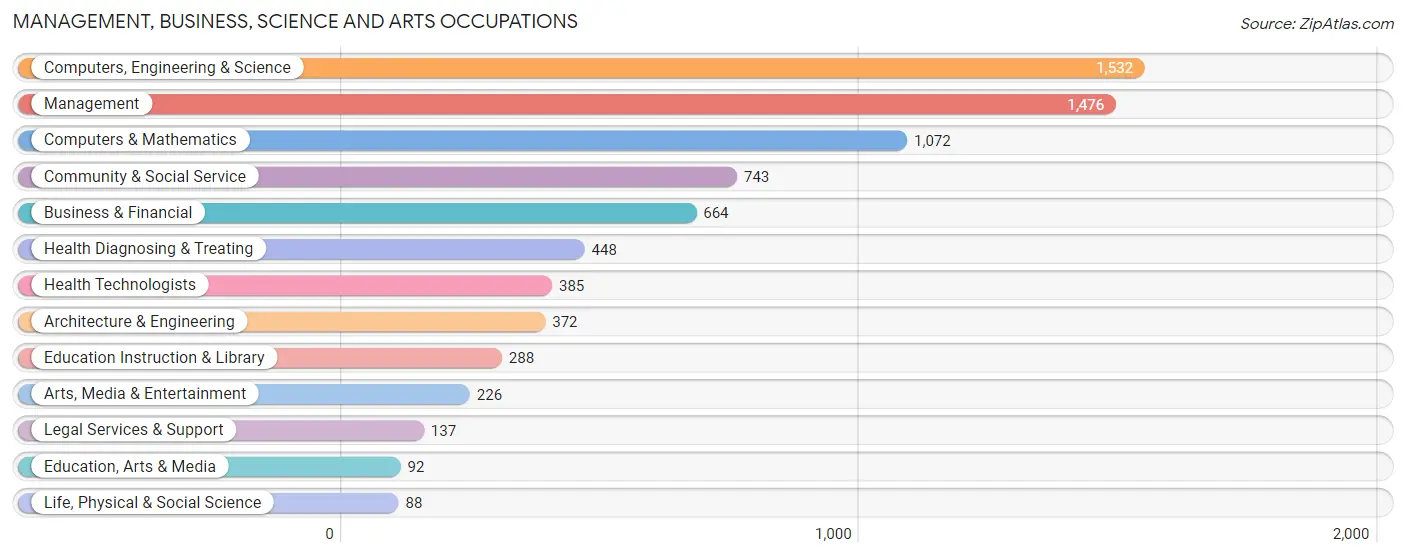
Management, Business, Science and Arts Occupations
The most common Management, Business, Science and Arts occupations in Woodinville are Computers, Engineering & Science (1,532 | 20.7%), Management (1,476 | 20.0%), Computers & Mathematics (1,072 | 14.5%), Community & Social Service (743 | 10.1%), and Business & Financial (664 | 9.0%).
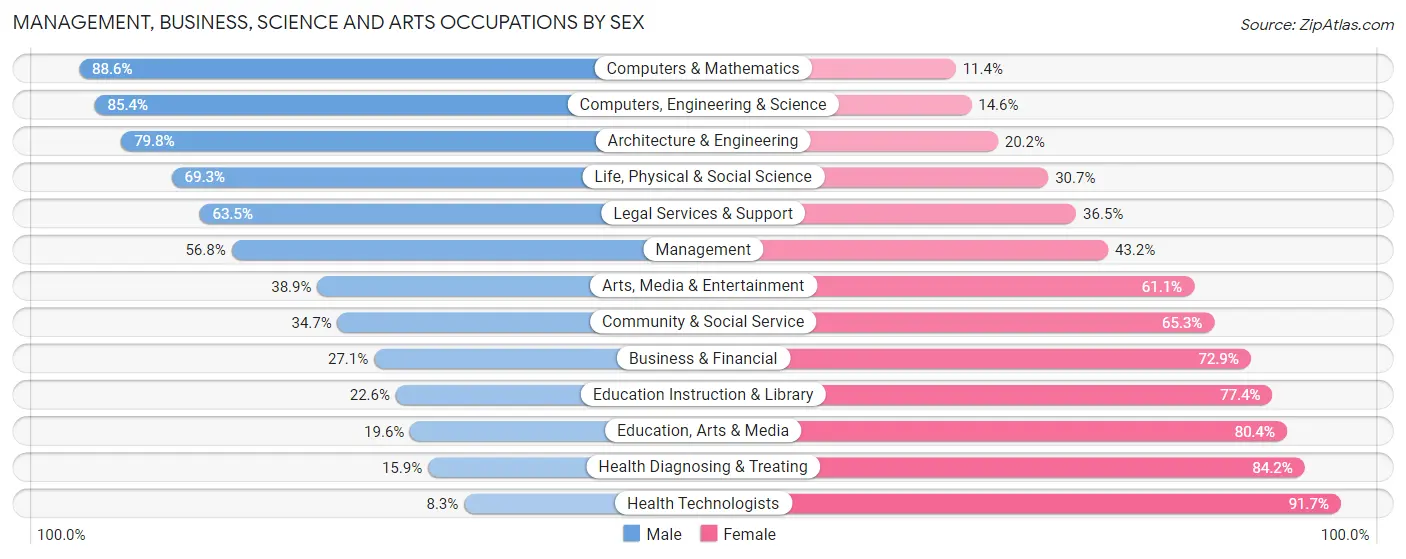
Management, Business, Science and Arts Occupations by Sex
Within the Management, Business, Science and Arts occupations in Woodinville, the most male-oriented occupations are Computers & Mathematics (88.6%), Computers, Engineering & Science (85.4%), and Architecture & Engineering (79.8%), while the most female-oriented occupations are Health Technologists (91.7%), Health Diagnosing & Treating (84.2%), and Education, Arts & Media (80.4%).
| Occupation | Male | Female |
| Management | 839 (56.8%) | 637 (43.2%) |
| Business & Financial | 180 (27.1%) | 484 (72.9%) |
| Computers, Engineering & Science | 1,308 (85.4%) | 224 (14.6%) |
| Computers & Mathematics | 950 (88.6%) | 122 (11.4%) |
| Architecture & Engineering | 297 (79.8%) | 75 (20.2%) |
| Life, Physical & Social Science | 61 (69.3%) | 27 (30.7%) |
| Community & Social Service | 258 (34.7%) | 485 (65.3%) |
| Education, Arts & Media | 18 (19.6%) | 74 (80.4%) |
| Legal Services & Support | 87 (63.5%) | 50 (36.5%) |
| Education Instruction & Library | 65 (22.6%) | 223 (77.4%) |
| Arts, Media & Entertainment | 88 (38.9%) | 138 (61.1%) |
| Health Diagnosing & Treating | 71 (15.9%) | 377 (84.2%) |
| Health Technologists | 32 (8.3%) | 353 (91.7%) |
| Total (Category) | 2,656 (54.6%) | 2,207 (45.4%) |
| Total (Overall) | 3,990 (54.0%) | 3,404 (46.0%) |
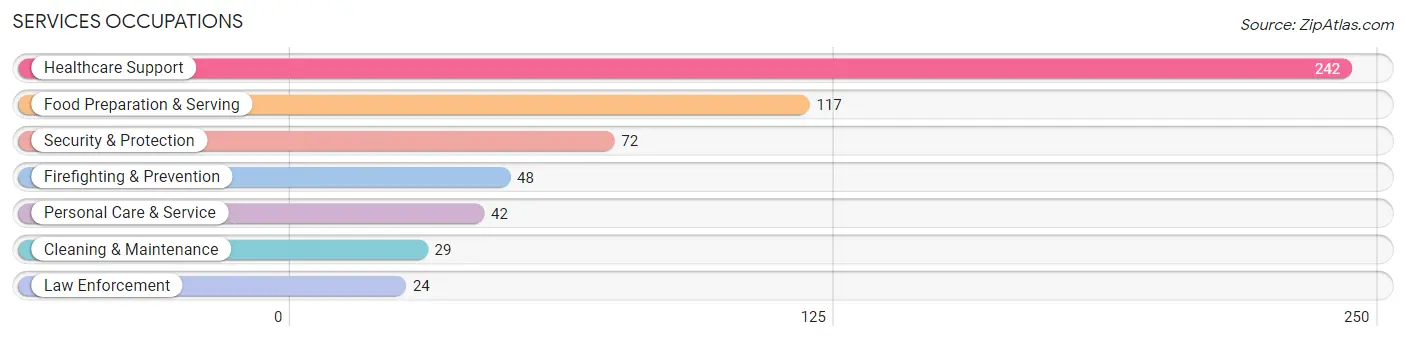
Services Occupations
The most common Services occupations in Woodinville are Healthcare Support (242 | 3.3%), Food Preparation & Serving (117 | 1.6%), Security & Protection (72 | 1.0%), Firefighting & Prevention (48 | 0.6%), and Personal Care & Service (42 | 0.6%).
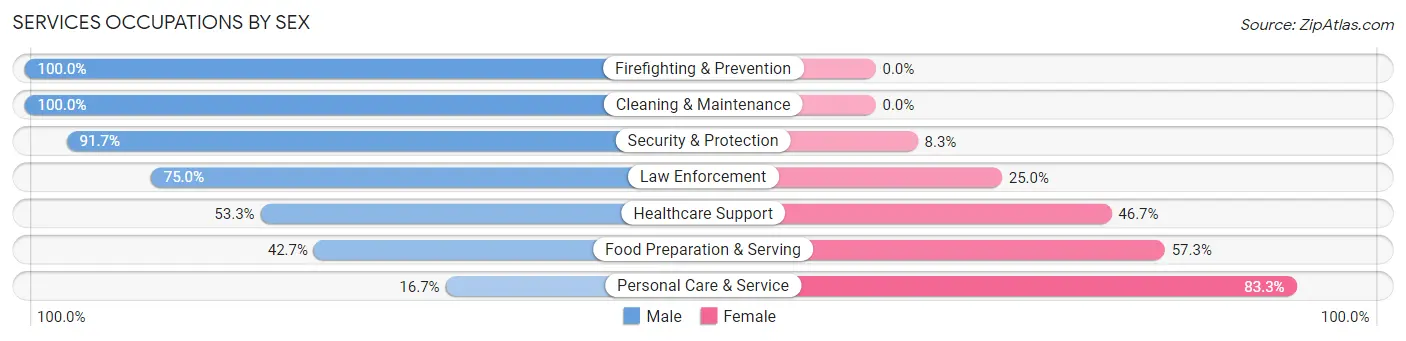
Services Occupations by Sex
Within the Services occupations in Woodinville, the most male-oriented occupations are Firefighting & Prevention (100.0%), Cleaning & Maintenance (100.0%), and Security & Protection (91.7%), while the most female-oriented occupations are Personal Care & Service (83.3%), Food Preparation & Serving (57.3%), and Healthcare Support (46.7%).
| Occupation | Male | Female |
| Healthcare Support | 129 (53.3%) | 113 (46.7%) |
| Security & Protection | 66 (91.7%) | 6 (8.3%) |
| Firefighting & Prevention | 48 (100.0%) | 0 (0.0%) |
| Law Enforcement | 18 (75.0%) | 6 (25.0%) |
| Food Preparation & Serving | 50 (42.7%) | 67 (57.3%) |
| Cleaning & Maintenance | 29 (100.0%) | 0 (0.0%) |
| Personal Care & Service | 7 (16.7%) | 35 (83.3%) |
| Total (Category) | 281 (56.0%) | 221 (44.0%) |
| Total (Overall) | 3,990 (54.0%) | 3,404 (46.0%) |
Sales and Office Occupations
The most common Sales and Office occupations in Woodinville are Sales & Related (744 | 10.1%), and Office & Administration (680 | 9.2%).
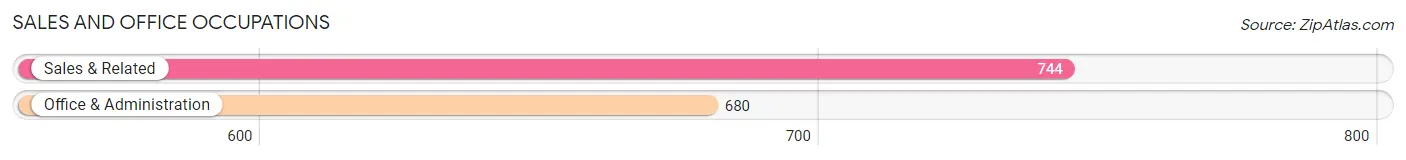
Sales and Office Occupations by Sex
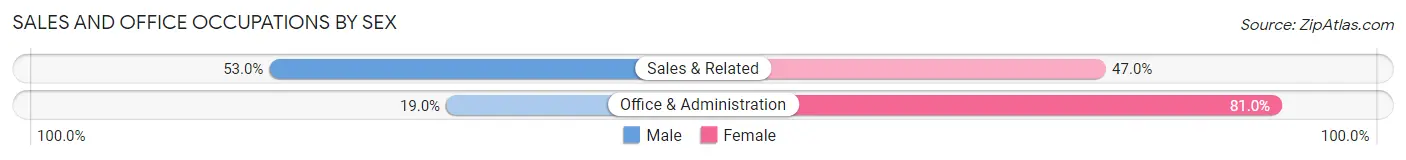
| Occupation | Male | Female |
| Sales & Related | 394 (53.0%) | 350 (47.0%) |
| Office & Administration | 129 (19.0%) | 551 (81.0%) |
| Total (Category) | 523 (36.7%) | 901 (63.3%) |
| Total (Overall) | 3,990 (54.0%) | 3,404 (46.0%) |
Natural Resources, Construction and Maintenance Occupations
The most common Natural Resources, Construction and Maintenance occupations in Woodinville are Construction & Extraction (96 | 1.3%), and Installation, Maintenance & Repair (63 | 0.9%).
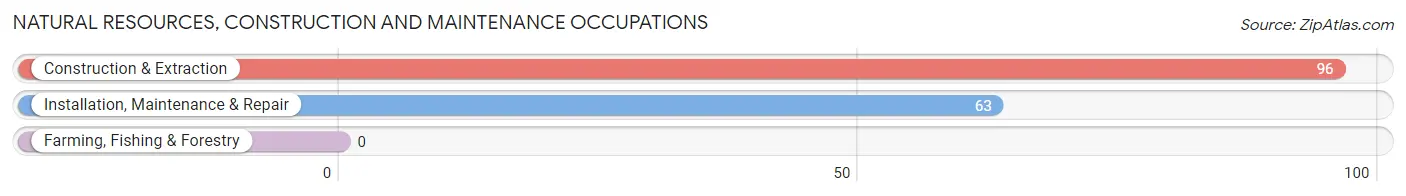
Natural Resources, Construction and Maintenance Occupations by Sex
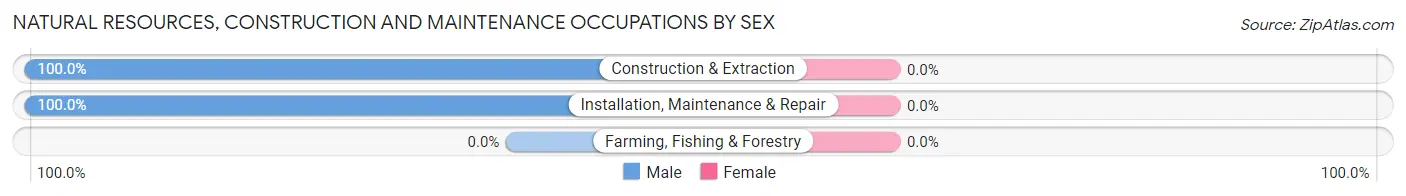
| Occupation | Male | Female |
| Farming, Fishing & Forestry | 0 (0.0%) | 0 (0.0%) |
| Construction & Extraction | 96 (100.0%) | 0 (0.0%) |
| Installation, Maintenance & Repair | 63 (100.0%) | 0 (0.0%) |
| Total (Category) | 159 (100.0%) | 0 (0.0%) |
| Total (Overall) | 3,990 (54.0%) | 3,404 (46.0%) |
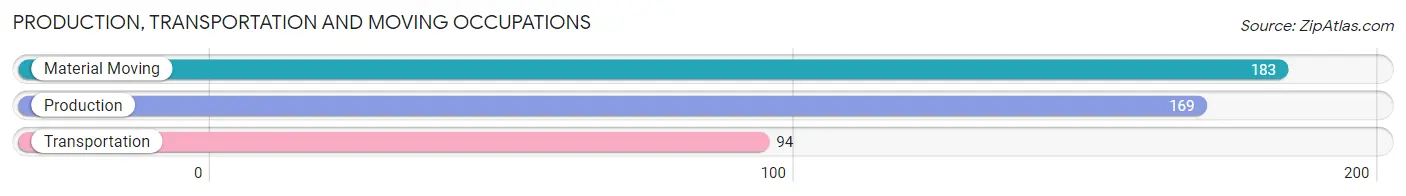
Production, Transportation and Moving Occupations
The most common Production, Transportation and Moving occupations in Woodinville are Material Moving (183 | 2.5%), Production (169 | 2.3%), and Transportation (94 | 1.3%).
Production, Transportation and Moving Occupations by Sex
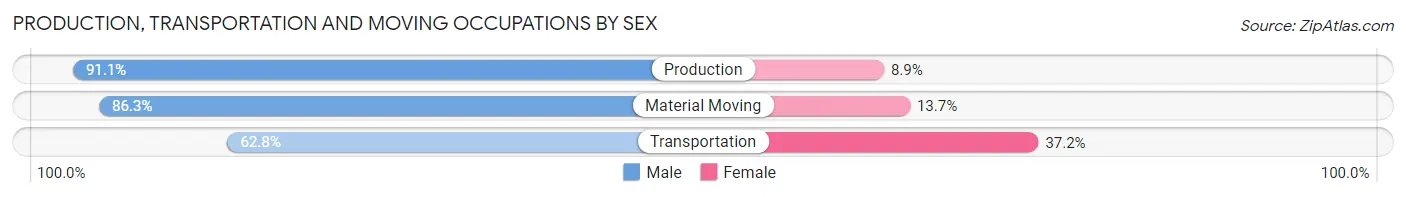
| Occupation | Male | Female |
| Production | 154 (91.1%) | 15 (8.9%) |
| Transportation | 59 (62.8%) | 35 (37.2%) |
| Material Moving | 158 (86.3%) | 25 (13.7%) |
| Total (Category) | 371 (83.2%) | 75 (16.8%) |
| Total (Overall) | 3,990 (54.0%) | 3,404 (46.0%) |
Employment Industries by Sex in Woodinville
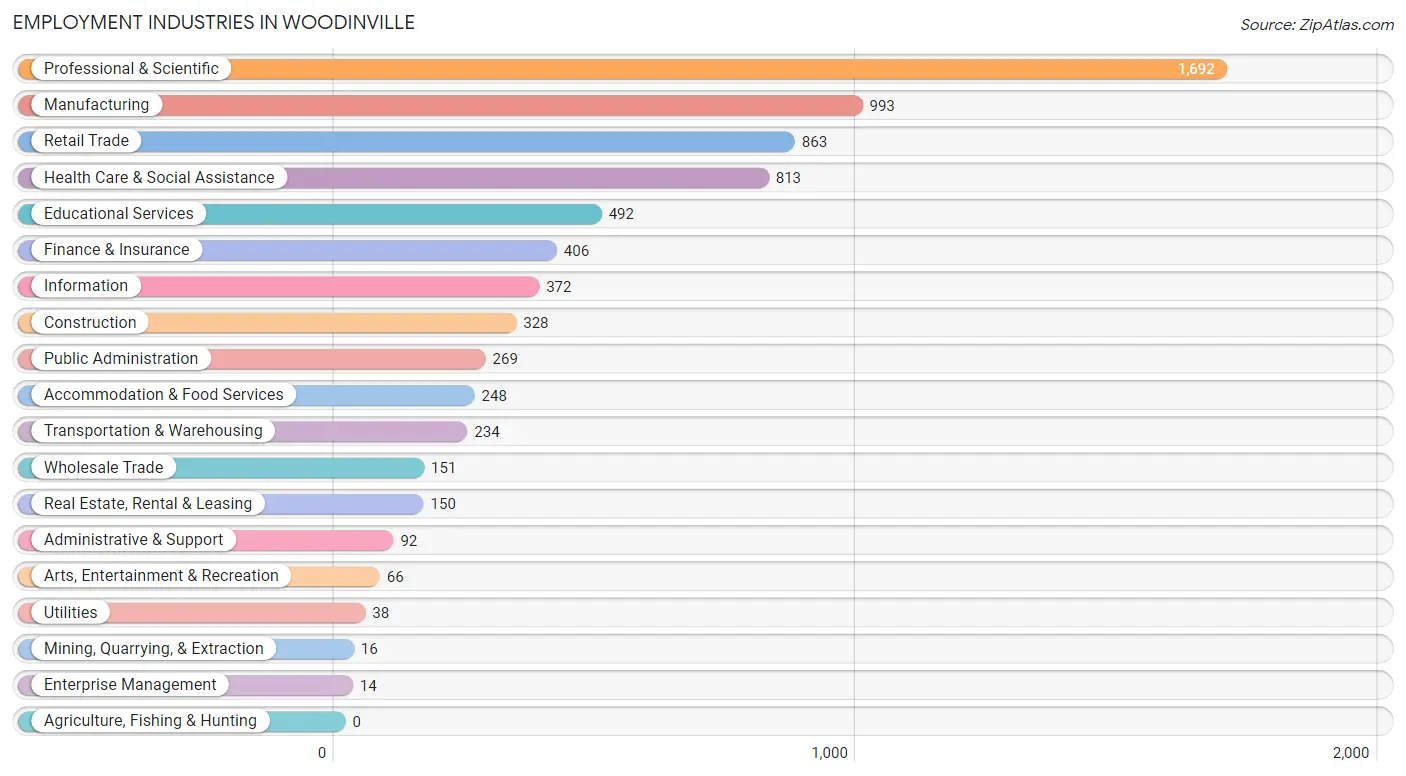
Employment Industries in Woodinville
The major employment industries in Woodinville include Professional & Scientific (1,692 | 22.9%), Manufacturing (993 | 13.4%), Retail Trade (863 | 11.7%), Health Care & Social Assistance (813 | 11.0%), and Educational Services (492 | 6.7%).
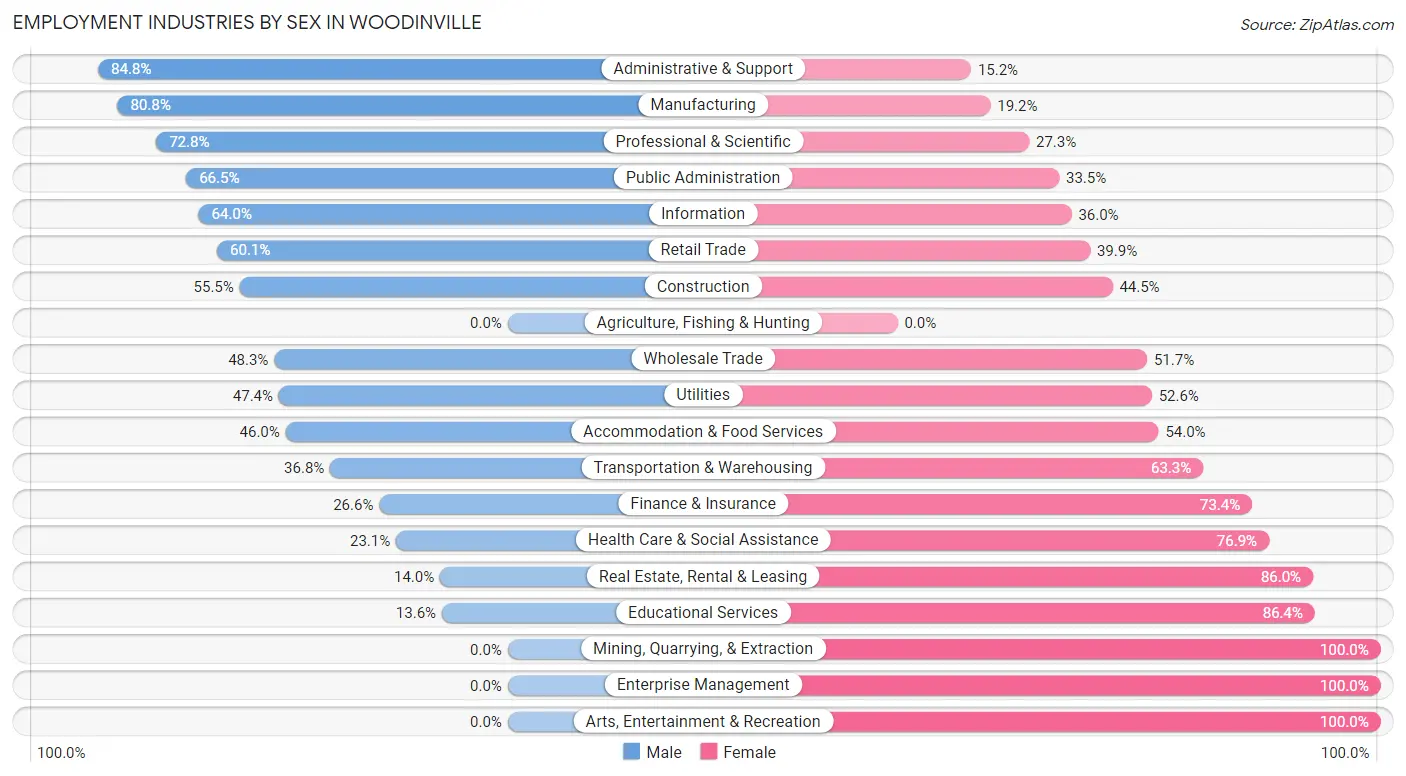
Employment Industries by Sex in Woodinville
The Woodinville industries that see more men than women are Administrative & Support (84.8%), Manufacturing (80.8%), and Professional & Scientific (72.8%), whereas the industries that tend to have a higher number of women are Mining, Quarrying, & Extraction (100.0%), Enterprise Management (100.0%), and Arts, Entertainment & Recreation (100.0%).
| Industry | Male | Female |
| Agriculture, Fishing & Hunting | 0 (0.0%) | 0 (0.0%) |
| Mining, Quarrying, & Extraction | 0 (0.0%) | 16 (100.0%) |
| Construction | 182 (55.5%) | 146 (44.5%) |
| Manufacturing | 802 (80.8%) | 191 (19.2%) |
| Wholesale Trade | 73 (48.3%) | 78 (51.7%) |
| Retail Trade | 519 (60.1%) | 344 (39.9%) |
| Transportation & Warehousing | 86 (36.7%) | 148 (63.2%) |
| Utilities | 18 (47.4%) | 20 (52.6%) |
| Information | 238 (64.0%) | 134 (36.0%) |
| Finance & Insurance | 108 (26.6%) | 298 (73.4%) |
| Real Estate, Rental & Leasing | 21 (14.0%) | 129 (86.0%) |
| Professional & Scientific | 1,231 (72.8%) | 461 (27.3%) |
| Enterprise Management | 0 (0.0%) | 14 (100.0%) |
| Administrative & Support | 78 (84.8%) | 14 (15.2%) |
| Educational Services | 67 (13.6%) | 425 (86.4%) |
| Health Care & Social Assistance | 188 (23.1%) | 625 (76.9%) |
| Arts, Entertainment & Recreation | 0 (0.0%) | 66 (100.0%) |
| Accommodation & Food Services | 114 (46.0%) | 134 (54.0%) |
| Public Administration | 179 (66.5%) | 90 (33.5%) |
| Total | 3,990 (54.0%) | 3,404 (46.0%) |
Education in Woodinville
School Enrollment in Woodinville
The most common levels of schooling among the 2,905 students in Woodinville are college / undergraduate (673 | 23.2%), elementary school (593 | 20.4%), and nursery / preschool (459 | 15.8%).
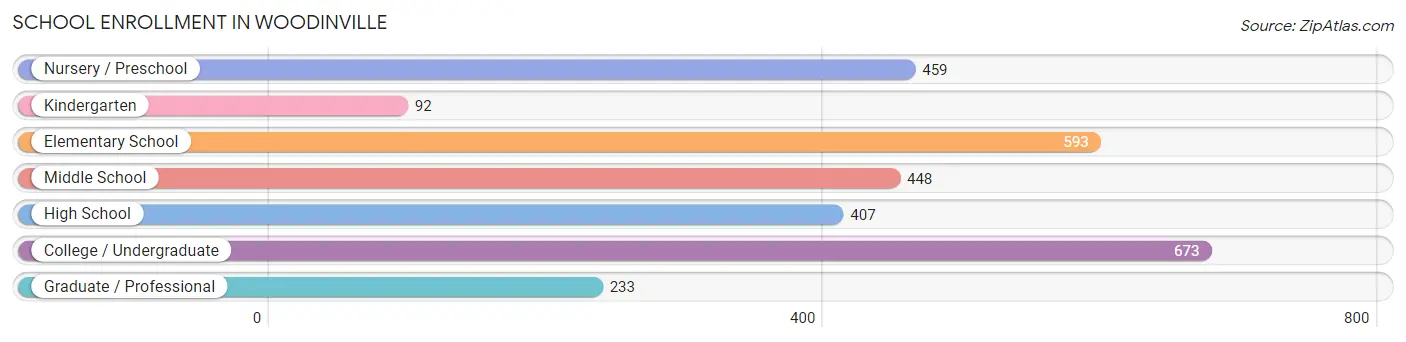
| School Level | # Students | % Students |
| Nursery / Preschool | 459 | 15.8% |
| Kindergarten | 92 | 3.2% |
| Elementary School | 593 | 20.4% |
| Middle School | 448 | 15.4% |
| High School | 407 | 14.0% |
| College / Undergraduate | 673 | 23.2% |
| Graduate / Professional | 233 | 8.0% |
| Total | 2,905 | 100.0% |
School Enrollment by Age by Funding Source in Woodinville
Out of a total of 2,905 students who are enrolled in schools in Woodinville, 694 (23.9%) attend a private institution, while the remaining 2,211 (76.1%) are enrolled in public schools. The age group of 3 to 4 year olds has the highest likelihood of being enrolled in private schools, with 237 (65.1% in the age bracket) enrolled. Conversely, the age group of 18 to 19 year olds has the lowest likelihood of being enrolled in a private school, with 219 (96.1% in the age bracket) attending a public institution.
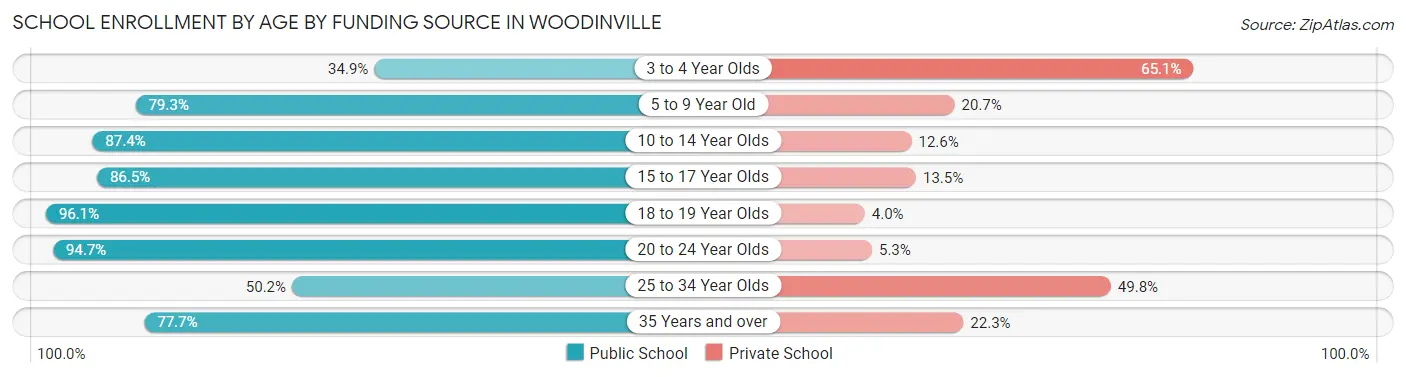
| Age Bracket | Public School | Private School |
| 3 to 4 Year Olds | 127 (34.9%) | 237 (65.1%) |
| 5 to 9 Year Old | 580 (79.3%) | 151 (20.7%) |
| 10 to 14 Year Olds | 484 (87.4%) | 70 (12.6%) |
| 15 to 17 Year Olds | 244 (86.5%) | 38 (13.5%) |
| 18 to 19 Year Olds | 219 (96.1%) | 9 (4.0%) |
| 20 to 24 Year Olds | 233 (94.7%) | 13 (5.3%) |
| 25 to 34 Year Olds | 116 (50.2%) | 115 (49.8%) |
| 35 Years and over | 209 (77.7%) | 60 (22.3%) |
| Total | 2,211 (76.1%) | 694 (23.9%) |
Educational Attainment by Field of Study in Woodinville
Business (1,402 | 20.2%), engineering (1,103 | 15.9%), computers & mathematics (839 | 12.1%), social sciences (732 | 10.5%), and psychology (458 | 6.6%) are the most common fields of study among 6,950 individuals in Woodinville who have obtained a bachelor's degree or higher.
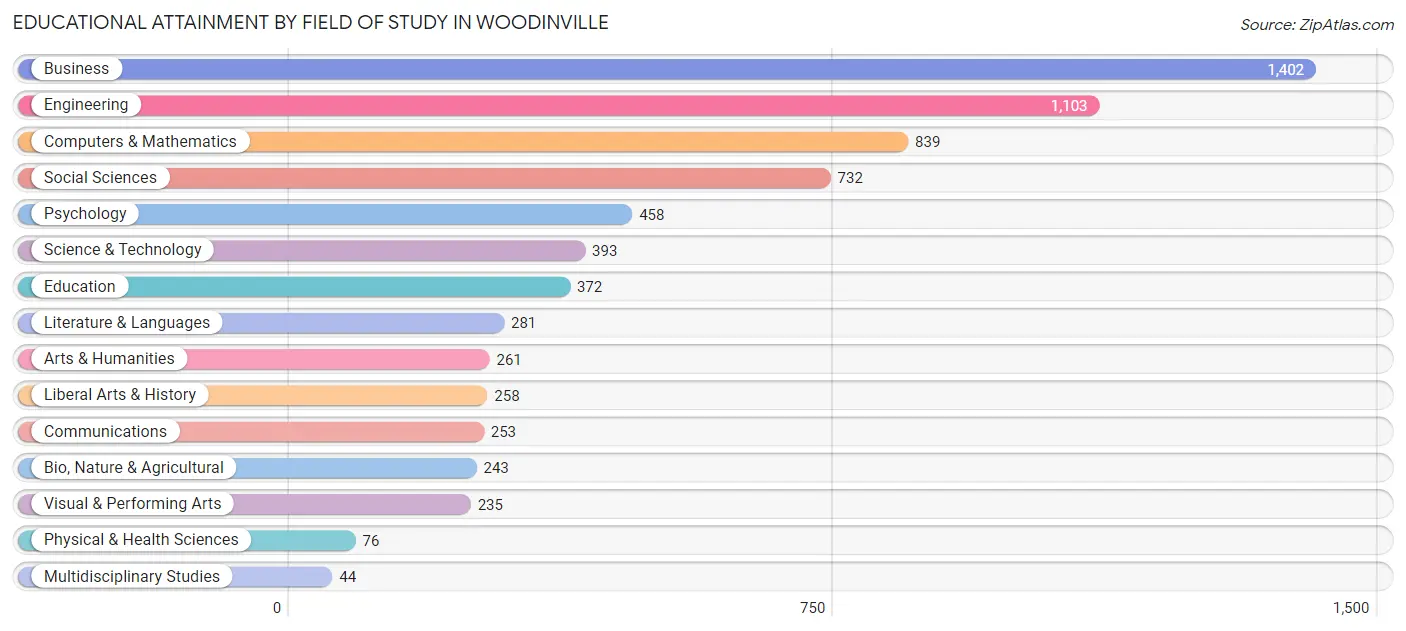
| Field of Study | # Graduates | % Graduates |
| Computers & Mathematics | 839 | 12.1% |
| Bio, Nature & Agricultural | 243 | 3.5% |
| Physical & Health Sciences | 76 | 1.1% |
| Psychology | 458 | 6.6% |
| Social Sciences | 732 | 10.5% |
| Engineering | 1,103 | 15.9% |
| Multidisciplinary Studies | 44 | 0.6% |
| Science & Technology | 393 | 5.7% |
| Business | 1,402 | 20.2% |
| Education | 372 | 5.3% |
| Literature & Languages | 281 | 4.0% |
| Liberal Arts & History | 258 | 3.7% |
| Visual & Performing Arts | 235 | 3.4% |
| Communications | 253 | 3.6% |
| Arts & Humanities | 261 | 3.8% |
| Total | 6,950 | 100.0% |
Transportation & Commute in Woodinville
Vehicle Availability by Sex in Woodinville
The most prevalent vehicle ownership categories in Woodinville are males with 2 vehicles (1,941, accounting for 48.7%) and females with 2 vehicles (1,530, making up 58.2%).
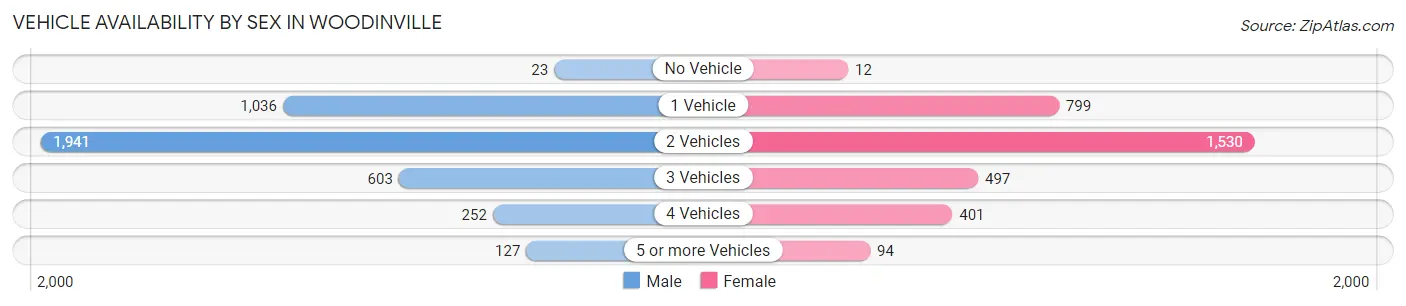
| Vehicles Available | Male | Female |
| No Vehicle | 23 (0.6%) | 12 (0.4%) |
| 1 Vehicle | 1,036 (26.0%) | 799 (24.0%) |
| 2 Vehicles | 1,941 (48.7%) | 1,530 (45.9%) |
| 3 Vehicles | 603 (15.1%) | 497 (14.9%) |
| 4 Vehicles | 252 (6.3%) | 401 (12.0%) |
| 5 or more Vehicles | 127 (3.2%) | 94 (2.8%) |
| Total | 3,982 (100.0%) | 3,333 (100.0%) |
Commute Time in Woodinville
The most frequently occuring commute durations in Woodinville are 20 to 24 minutes (932 commuters, 17.5%), 30 to 34 minutes (682 commuters, 12.8%), and 25 to 29 minutes (677 commuters, 12.7%).
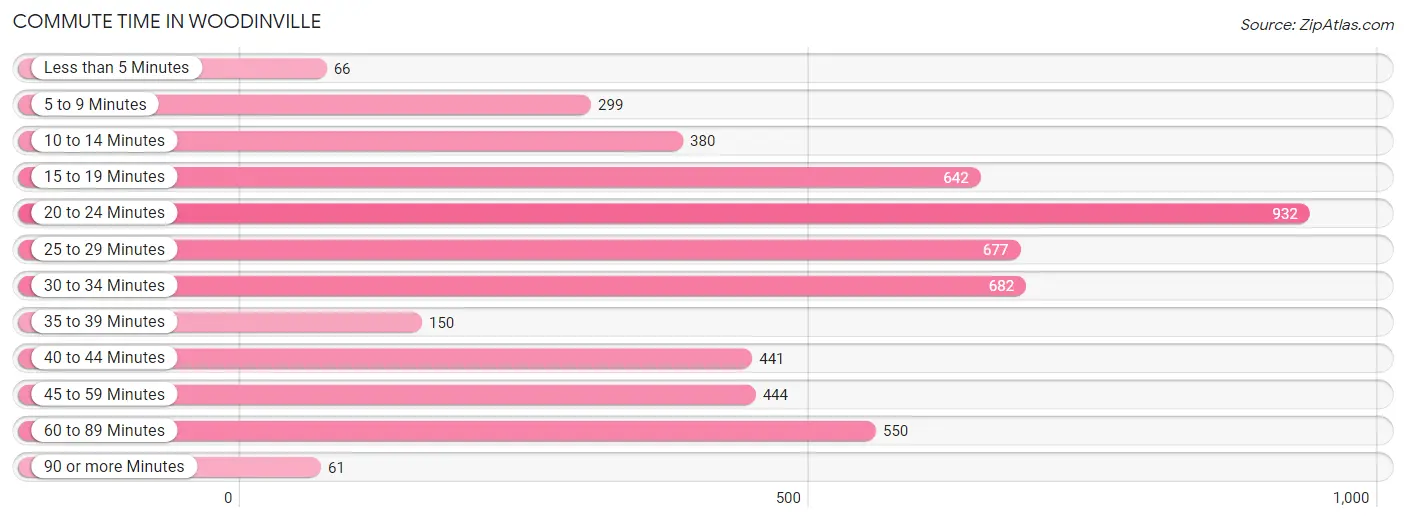
| Commute Time | # Commuters | % Commuters |
| Less than 5 Minutes | 66 | 1.2% |
| 5 to 9 Minutes | 299 | 5.6% |
| 10 to 14 Minutes | 380 | 7.1% |
| 15 to 19 Minutes | 642 | 12.1% |
| 20 to 24 Minutes | 932 | 17.5% |
| 25 to 29 Minutes | 677 | 12.7% |
| 30 to 34 Minutes | 682 | 12.8% |
| 35 to 39 Minutes | 150 | 2.8% |
| 40 to 44 Minutes | 441 | 8.3% |
| 45 to 59 Minutes | 444 | 8.3% |
| 60 to 89 Minutes | 550 | 10.3% |
| 90 or more Minutes | 61 | 1.1% |
Commute Time by Sex in Woodinville
The most common commute times in Woodinville are 25 to 29 minutes (472 commuters, 16.4%) for males and 20 to 24 minutes (492 commuters, 20.2%) for females.
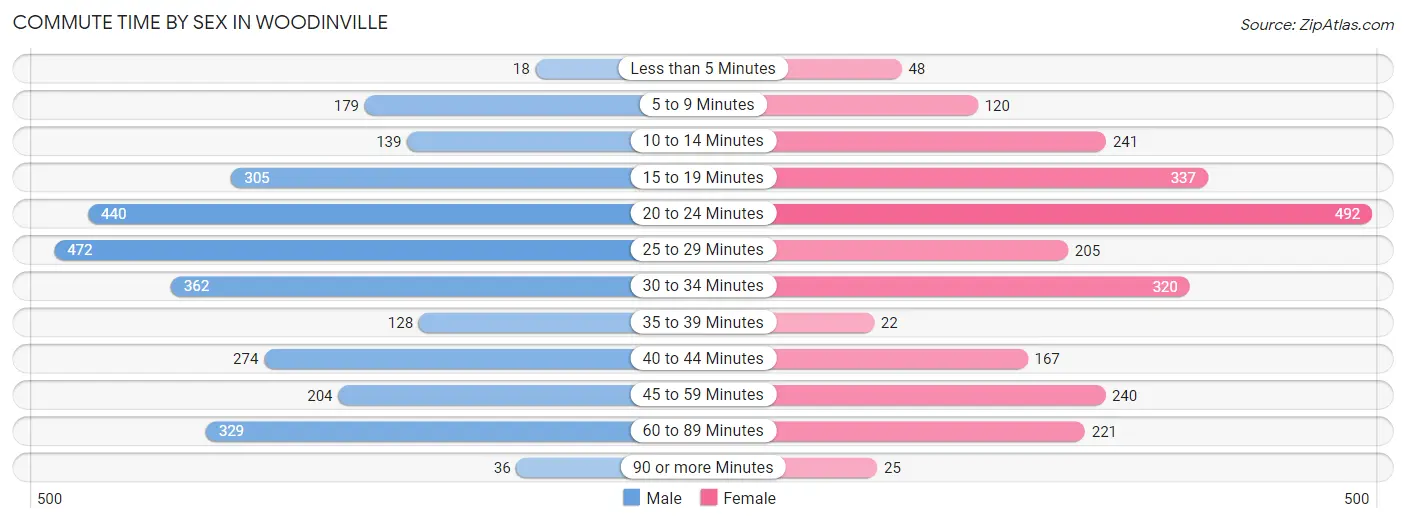
| Commute Time | Male | Female |
| Less than 5 Minutes | 18 (0.6%) | 48 (2.0%) |
| 5 to 9 Minutes | 179 (6.2%) | 120 (4.9%) |
| 10 to 14 Minutes | 139 (4.8%) | 241 (9.9%) |
| 15 to 19 Minutes | 305 (10.6%) | 337 (13.8%) |
| 20 to 24 Minutes | 440 (15.2%) | 492 (20.2%) |
| 25 to 29 Minutes | 472 (16.4%) | 205 (8.4%) |
| 30 to 34 Minutes | 362 (12.5%) | 320 (13.1%) |
| 35 to 39 Minutes | 128 (4.4%) | 22 (0.9%) |
| 40 to 44 Minutes | 274 (9.5%) | 167 (6.9%) |
| 45 to 59 Minutes | 204 (7.1%) | 240 (9.8%) |
| 60 to 89 Minutes | 329 (11.4%) | 221 (9.1%) |
| 90 or more Minutes | 36 (1.3%) | 25 (1.0%) |
Time of Departure to Work by Sex in Woodinville
The most frequent times of departure to work in Woodinville are 6:30 AM to 6:59 AM (410, 14.2%) for males and 7:00 AM to 7:29 AM (447, 18.3%) for females.
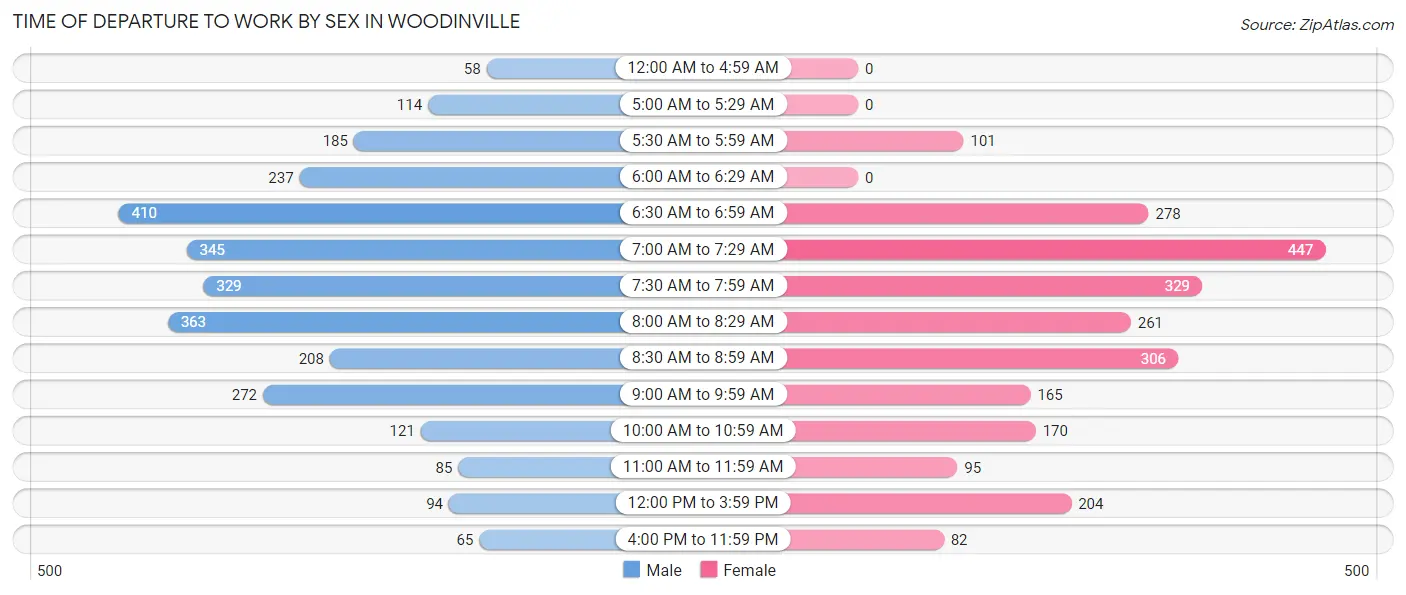
| Time of Departure | Male | Female |
| 12:00 AM to 4:59 AM | 58 (2.0%) | 0 (0.0%) |
| 5:00 AM to 5:29 AM | 114 (4.0%) | 0 (0.0%) |
| 5:30 AM to 5:59 AM | 185 (6.4%) | 101 (4.1%) |
| 6:00 AM to 6:29 AM | 237 (8.2%) | 0 (0.0%) |
| 6:30 AM to 6:59 AM | 410 (14.2%) | 278 (11.4%) |
| 7:00 AM to 7:29 AM | 345 (11.9%) | 447 (18.3%) |
| 7:30 AM to 7:59 AM | 329 (11.4%) | 329 (13.5%) |
| 8:00 AM to 8:29 AM | 363 (12.6%) | 261 (10.7%) |
| 8:30 AM to 8:59 AM | 208 (7.2%) | 306 (12.6%) |
| 9:00 AM to 9:59 AM | 272 (9.4%) | 165 (6.8%) |
| 10:00 AM to 10:59 AM | 121 (4.2%) | 170 (7.0%) |
| 11:00 AM to 11:59 AM | 85 (2.9%) | 95 (3.9%) |
| 12:00 PM to 3:59 PM | 94 (3.3%) | 204 (8.4%) |
| 4:00 PM to 11:59 PM | 65 (2.2%) | 82 (3.4%) |
| Total | 2,886 (100.0%) | 2,438 (100.0%) |
Housing Occupancy in Woodinville
Occupancy by Ownership in Woodinville
Of the total 5,550 dwellings in Woodinville, owner-occupied units account for 3,427 (61.8%), while renter-occupied units make up 2,123 (38.3%).
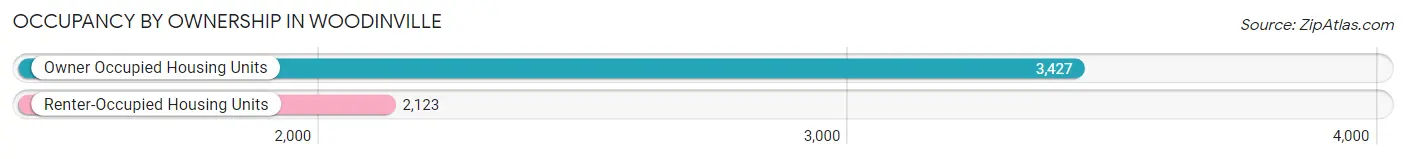
| Occupancy | # Housing Units | % Housing Units |
| Owner Occupied Housing Units | 3,427 | 61.8% |
| Renter-Occupied Housing Units | 2,123 | 38.3% |
| Total Occupied Housing Units | 5,550 | 100.0% |
Occupancy by Household Size in Woodinville
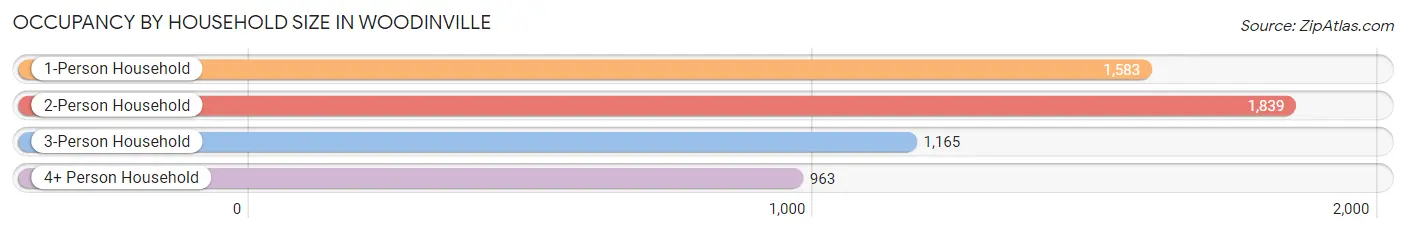
| Household Size | # Housing Units | % Housing Units |
| 1-Person Household | 1,583 | 28.5% |
| 2-Person Household | 1,839 | 33.1% |
| 3-Person Household | 1,165 | 21.0% |
| 4+ Person Household | 963 | 17.3% |
| Total Housing Units | 5,550 | 100.0% |
Occupancy by Ownership by Household Size in Woodinville
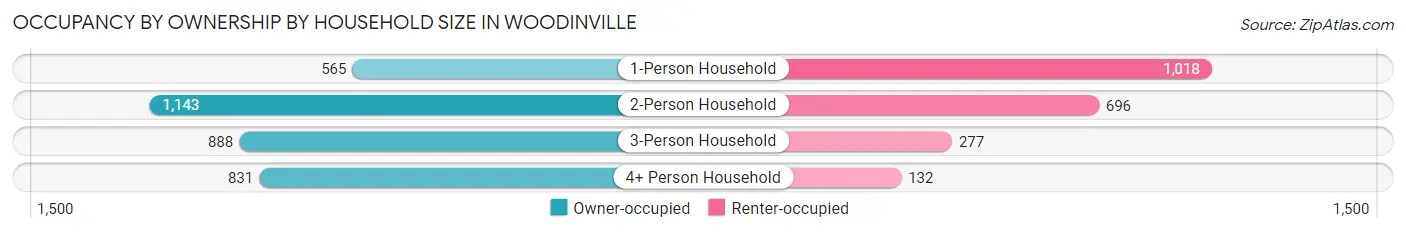
| Household Size | Owner-occupied | Renter-occupied |
| 1-Person Household | 565 (35.7%) | 1,018 (64.3%) |
| 2-Person Household | 1,143 (62.2%) | 696 (37.9%) |
| 3-Person Household | 888 (76.2%) | 277 (23.8%) |
| 4+ Person Household | 831 (86.3%) | 132 (13.7%) |
| Total Housing Units | 3,427 (61.8%) | 2,123 (38.3%) |
Occupancy by Educational Attainment in Woodinville
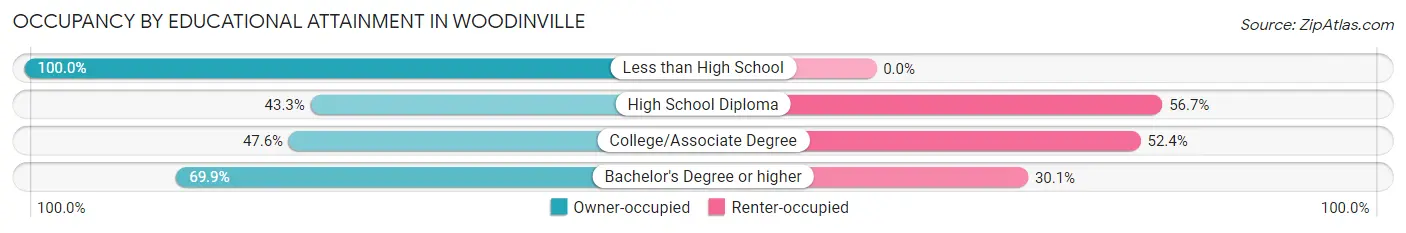
| Household Size | Owner-occupied | Renter-occupied |
| Less than High School | 7 (100.0%) | 0 (0.0%) |
| High School Diploma | 213 (43.3%) | 279 (56.7%) |
| College/Associate Degree | 691 (47.6%) | 761 (52.4%) |
| Bachelor's Degree or higher | 2,516 (69.9%) | 1,083 (30.1%) |
Occupancy by Age of Householder in Woodinville
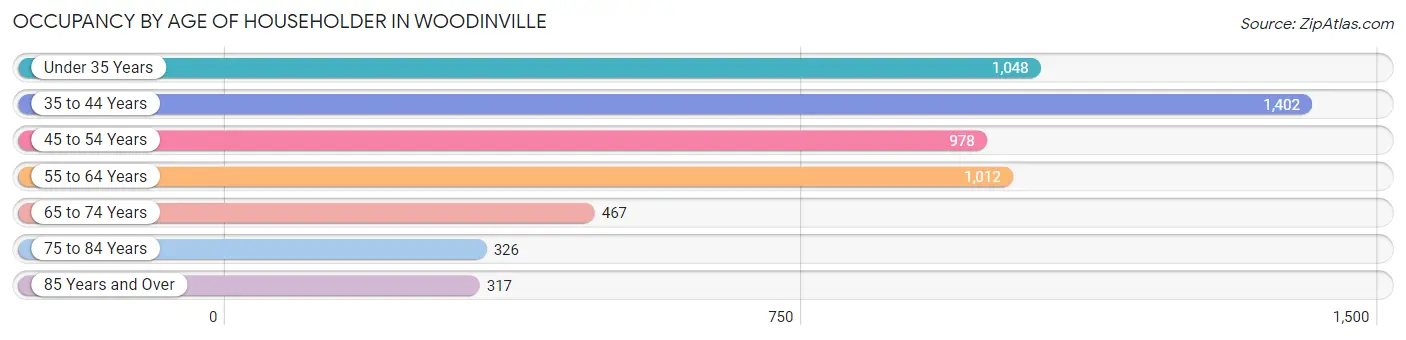
| Age Bracket | # Households | % Households |
| Under 35 Years | 1,048 | 18.9% |
| 35 to 44 Years | 1,402 | 25.3% |
| 45 to 54 Years | 978 | 17.6% |
| 55 to 64 Years | 1,012 | 18.2% |
| 65 to 74 Years | 467 | 8.4% |
| 75 to 84 Years | 326 | 5.9% |
| 85 Years and Over | 317 | 5.7% |
| Total | 5,550 | 100.0% |
Housing Finances in Woodinville
Median Income by Occupancy in Woodinville
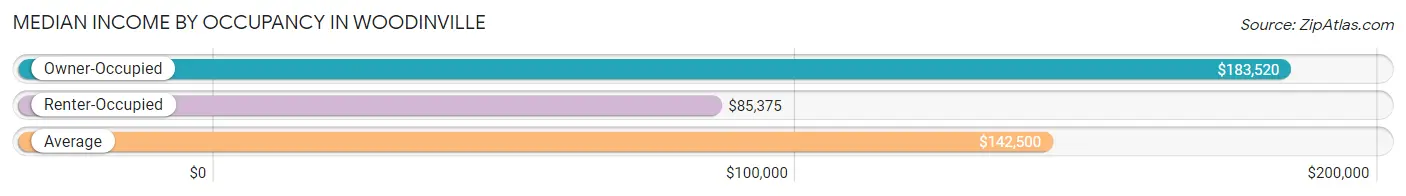
| Occupancy Type | # Households | Median Income |
| Owner-Occupied | 3,427 (61.8%) | $183,520 |
| Renter-Occupied | 2,123 (38.3%) | $85,375 |
| Average | 5,550 (100.0%) | $142,500 |
Occupancy by Householder Income Bracket in Woodinville
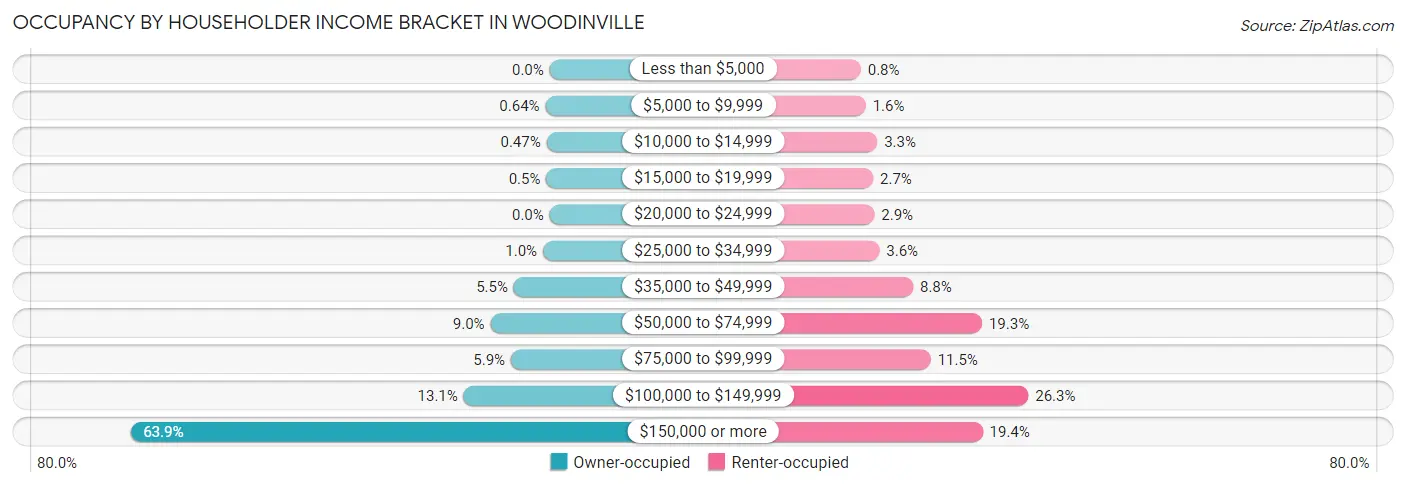
| Income Bracket | Owner-occupied | Renter-occupied |
| Less than $5,000 | 0 (0.0%) | 17 (0.8%) |
| $5,000 to $9,999 | 22 (0.6%) | 33 (1.5%) |
| $10,000 to $14,999 | 16 (0.5%) | 70 (3.3%) |
| $15,000 to $19,999 | 17 (0.5%) | 57 (2.7%) |
| $20,000 to $24,999 | 0 (0.0%) | 61 (2.9%) |
| $25,000 to $34,999 | 35 (1.0%) | 77 (3.6%) |
| $35,000 to $49,999 | 187 (5.5%) | 186 (8.8%) |
| $50,000 to $74,999 | 309 (9.0%) | 409 (19.3%) |
| $75,000 to $99,999 | 202 (5.9%) | 243 (11.5%) |
| $100,000 to $149,999 | 449 (13.1%) | 559 (26.3%) |
| $150,000 or more | 2,190 (63.9%) | 411 (19.4%) |
| Total | 3,427 (100.0%) | 2,123 (100.0%) |
Monthly Housing Cost Tiers in Woodinville
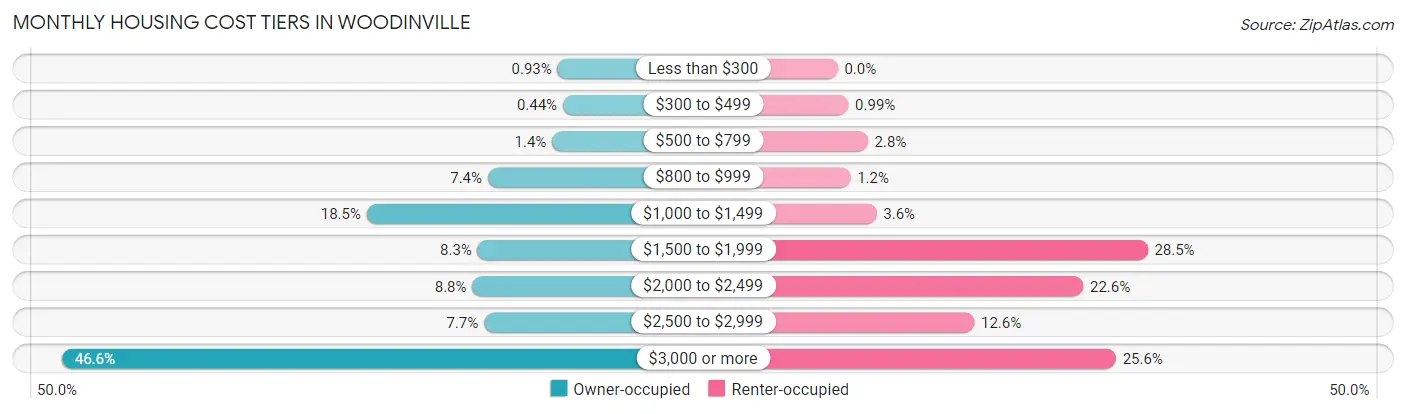
| Monthly Cost | Owner-occupied | Renter-occupied |
| Less than $300 | 32 (0.9%) | 0 (0.0%) |
| $300 to $499 | 15 (0.4%) | 21 (1.0%) |
| $500 to $799 | 49 (1.4%) | 59 (2.8%) |
| $800 to $999 | 252 (7.3%) | 25 (1.2%) |
| $1,000 to $1,499 | 634 (18.5%) | 76 (3.6%) |
| $1,500 to $1,999 | 284 (8.3%) | 606 (28.5%) |
| $2,000 to $2,499 | 301 (8.8%) | 480 (22.6%) |
| $2,500 to $2,999 | 264 (7.7%) | 267 (12.6%) |
| $3,000 or more | 1,596 (46.6%) | 544 (25.6%) |
| Total | 3,427 (100.0%) | 2,123 (100.0%) |
Physical Housing Characteristics in Woodinville
Housing Structures in Woodinville
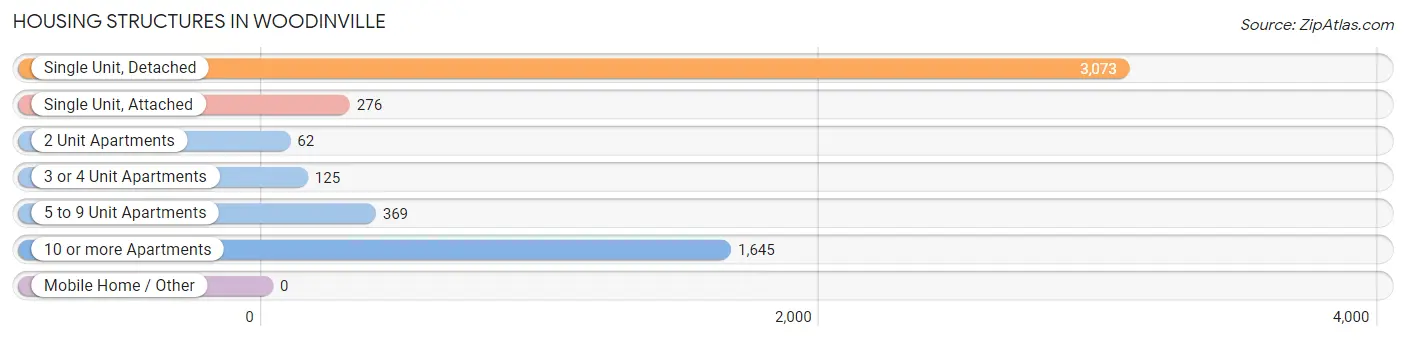
| Structure Type | # Housing Units | % Housing Units |
| Single Unit, Detached | 3,073 | 55.4% |
| Single Unit, Attached | 276 | 5.0% |
| 2 Unit Apartments | 62 | 1.1% |
| 3 or 4 Unit Apartments | 125 | 2.2% |
| 5 to 9 Unit Apartments | 369 | 6.7% |
| 10 or more Apartments | 1,645 | 29.6% |
| Mobile Home / Other | 0 | 0.0% |
| Total | 5,550 | 100.0% |
Housing Structures by Occupancy in Woodinville
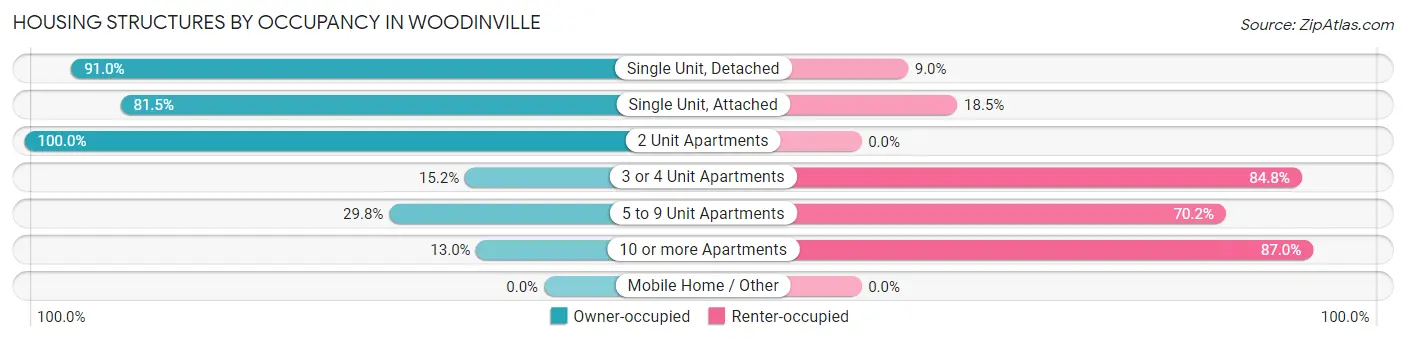
| Structure Type | Owner-occupied | Renter-occupied |
| Single Unit, Detached | 2,797 (91.0%) | 276 (9.0%) |
| Single Unit, Attached | 225 (81.5%) | 51 (18.5%) |
| 2 Unit Apartments | 62 (100.0%) | 0 (0.0%) |
| 3 or 4 Unit Apartments | 19 (15.2%) | 106 (84.8%) |
| 5 to 9 Unit Apartments | 110 (29.8%) | 259 (70.2%) |
| 10 or more Apartments | 214 (13.0%) | 1,431 (87.0%) |
| Mobile Home / Other | 0 (0.0%) | 0 (0.0%) |
| Total | 3,427 (61.8%) | 2,123 (38.3%) |
Housing Structures by Number of Rooms in Woodinville
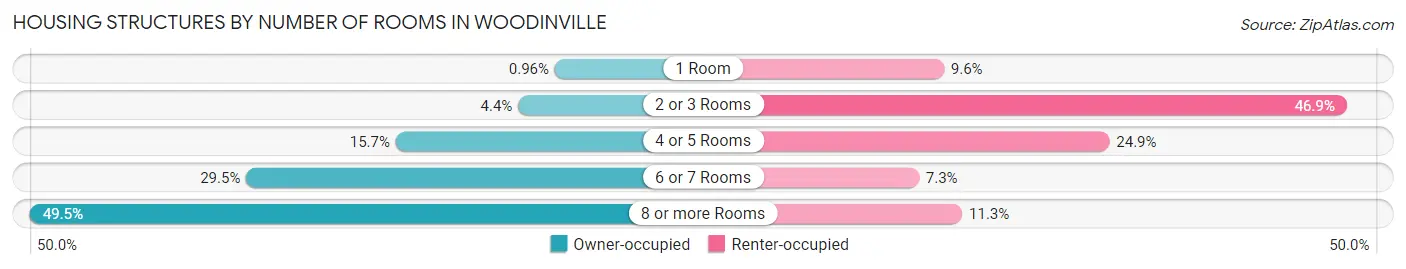
| Number of Rooms | Owner-occupied | Renter-occupied |
| 1 Room | 33 (1.0%) | 204 (9.6%) |
| 2 or 3 Rooms | 149 (4.3%) | 995 (46.9%) |
| 4 or 5 Rooms | 537 (15.7%) | 529 (24.9%) |
| 6 or 7 Rooms | 1,011 (29.5%) | 155 (7.3%) |
| 8 or more Rooms | 1,697 (49.5%) | 240 (11.3%) |
| Total | 3,427 (100.0%) | 2,123 (100.0%) |
Housing Structure by Heating Type in Woodinville
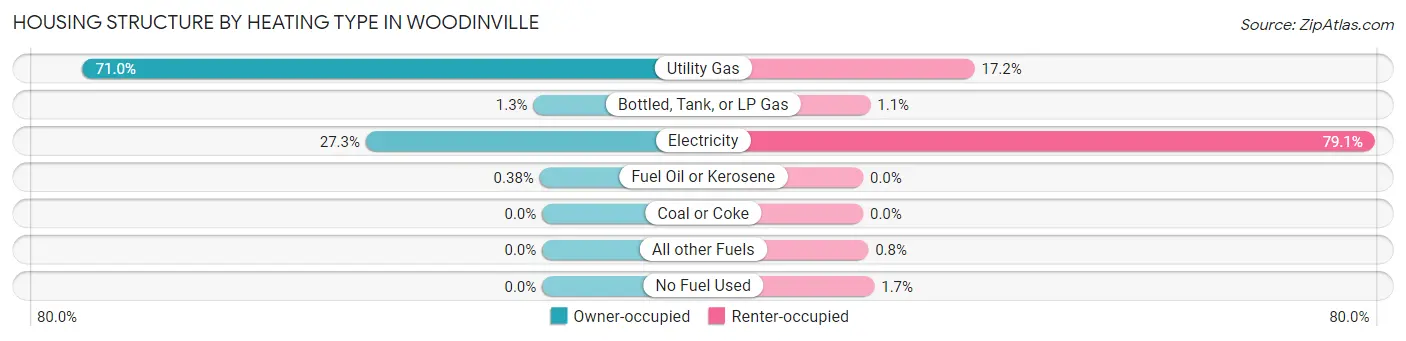
| Heating Type | Owner-occupied | Renter-occupied |
| Utility Gas | 2,434 (71.0%) | 366 (17.2%) |
| Bottled, Tank, or LP Gas | 46 (1.3%) | 24 (1.1%) |
| Electricity | 934 (27.3%) | 1,679 (79.1%) |
| Fuel Oil or Kerosene | 13 (0.4%) | 0 (0.0%) |
| Coal or Coke | 0 (0.0%) | 0 (0.0%) |
| All other Fuels | 0 (0.0%) | 17 (0.8%) |
| No Fuel Used | 0 (0.0%) | 37 (1.7%) |
| Total | 3,427 (100.0%) | 2,123 (100.0%) |
Household Vehicle Usage in Woodinville
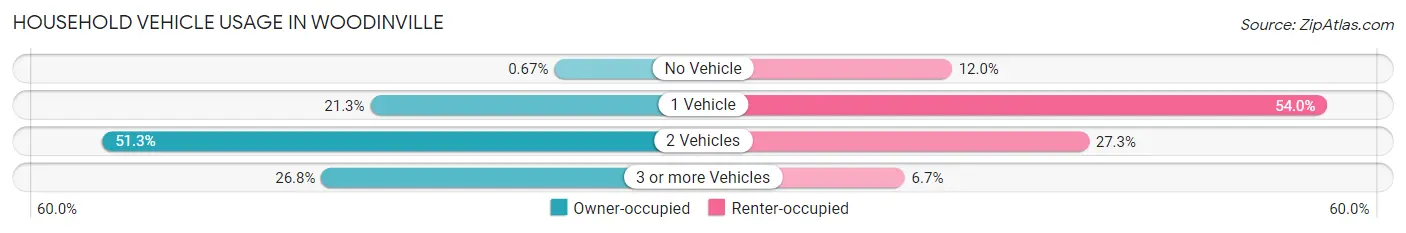
| Vehicles per Household | Owner-occupied | Renter-occupied |
| No Vehicle | 23 (0.7%) | 254 (12.0%) |
| 1 Vehicle | 729 (21.3%) | 1,147 (54.0%) |
| 2 Vehicles | 1,758 (51.3%) | 580 (27.3%) |
| 3 or more Vehicles | 917 (26.8%) | 142 (6.7%) |
| Total | 3,427 (100.0%) | 2,123 (100.0%) |
Real Estate & Mortgages in Woodinville
Real Estate and Mortgage Overview in Woodinville
| Characteristic | Without Mortgage | With Mortgage |
| Housing Units | 885 | 2,542 |
| Median Property Value | $890,800 | $925,900 |
| Median Household Income | $146,726 | $1,754 |
| Monthly Housing Costs | $1,091 | $1,596 |
| Real Estate Taxes | $8,079 | $46 |
Property Value by Mortgage Status in Woodinville
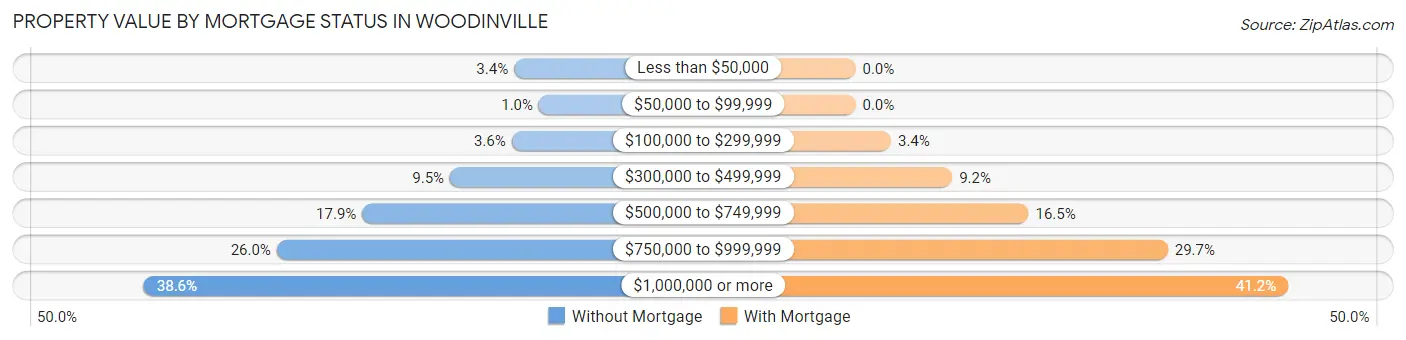
| Property Value | Without Mortgage | With Mortgage |
| Less than $50,000 | 30 (3.4%) | 0 (0.0%) |
| $50,000 to $99,999 | 9 (1.0%) | 0 (0.0%) |
| $100,000 to $299,999 | 32 (3.6%) | 86 (3.4%) |
| $300,000 to $499,999 | 84 (9.5%) | 234 (9.2%) |
| $500,000 to $749,999 | 158 (17.8%) | 419 (16.5%) |
| $750,000 to $999,999 | 230 (26.0%) | 756 (29.7%) |
| $1,000,000 or more | 342 (38.6%) | 1,047 (41.2%) |
| Total | 885 (100.0%) | 2,542 (100.0%) |
Household Income by Mortgage Status in Woodinville
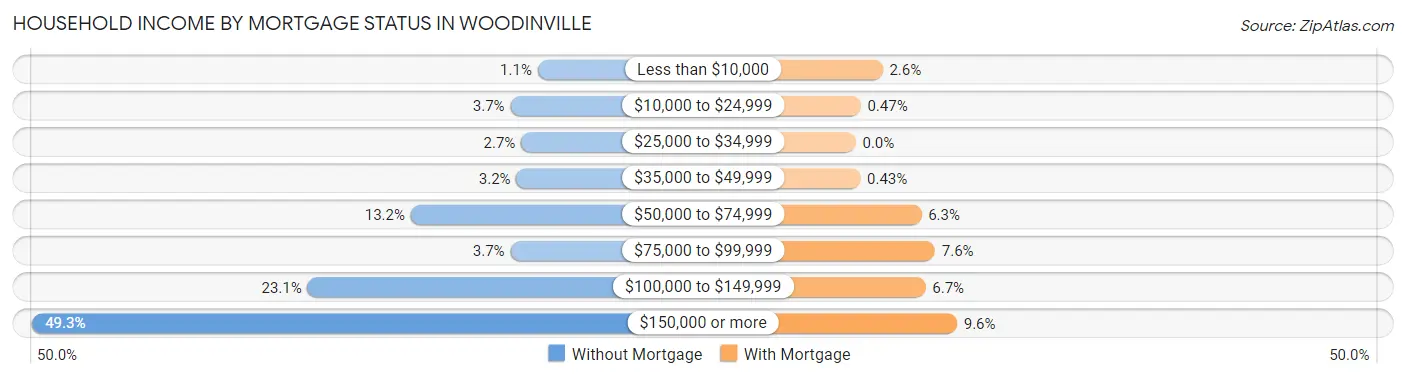
| Household Income | Without Mortgage | With Mortgage |
| Less than $10,000 | 10 (1.1%) | 65 (2.6%) |
| $10,000 to $24,999 | 33 (3.7%) | 12 (0.5%) |
| $25,000 to $34,999 | 24 (2.7%) | 0 (0.0%) |
| $35,000 to $49,999 | 28 (3.2%) | 11 (0.4%) |
| $50,000 to $74,999 | 117 (13.2%) | 159 (6.2%) |
| $75,000 to $99,999 | 33 (3.7%) | 192 (7.5%) |
| $100,000 to $149,999 | 204 (23.1%) | 169 (6.7%) |
| $150,000 or more | 436 (49.3%) | 245 (9.6%) |
| Total | 885 (100.0%) | 2,542 (100.0%) |
Property Value to Household Income Ratio in Woodinville
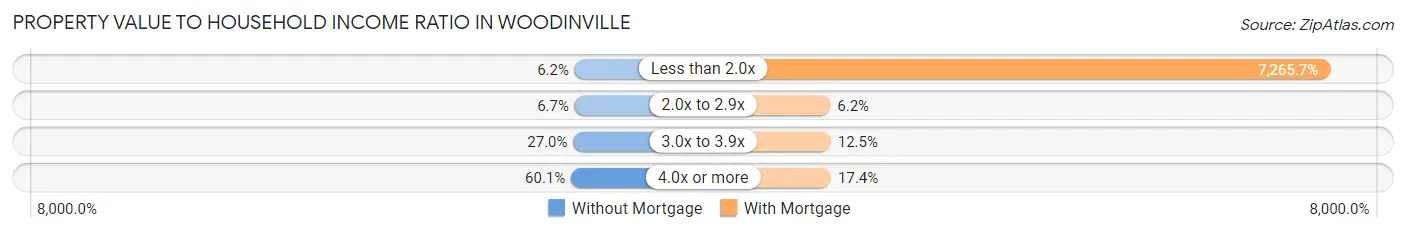
| Value-to-Income Ratio | Without Mortgage | With Mortgage |
| Less than 2.0x | 55 (6.2%) | 184,693 (7,265.7%) |
| 2.0x to 2.9x | 59 (6.7%) | 157 (6.2%) |
| 3.0x to 3.9x | 239 (27.0%) | 317 (12.5%) |
| 4.0x or more | 532 (60.1%) | 441 (17.3%) |
| Total | 885 (100.0%) | 2,542 (100.0%) |
Real Estate Taxes by Mortgage Status in Woodinville
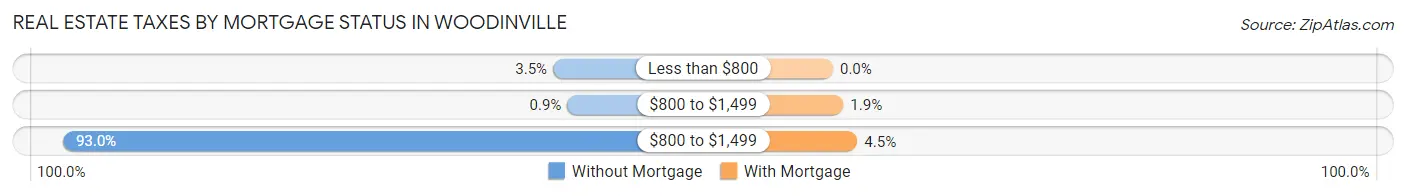
| Property Taxes | Without Mortgage | With Mortgage |
| Less than $800 | 31 (3.5%) | 0 (0.0%) |
| $800 to $1,499 | 8 (0.9%) | 48 (1.9%) |
| $800 to $1,499 | 823 (93.0%) | 113 (4.4%) |
| Total | 885 (100.0%) | 2,542 (100.0%) |
Health & Disability in Woodinville
Health Insurance Coverage by Age in Woodinville
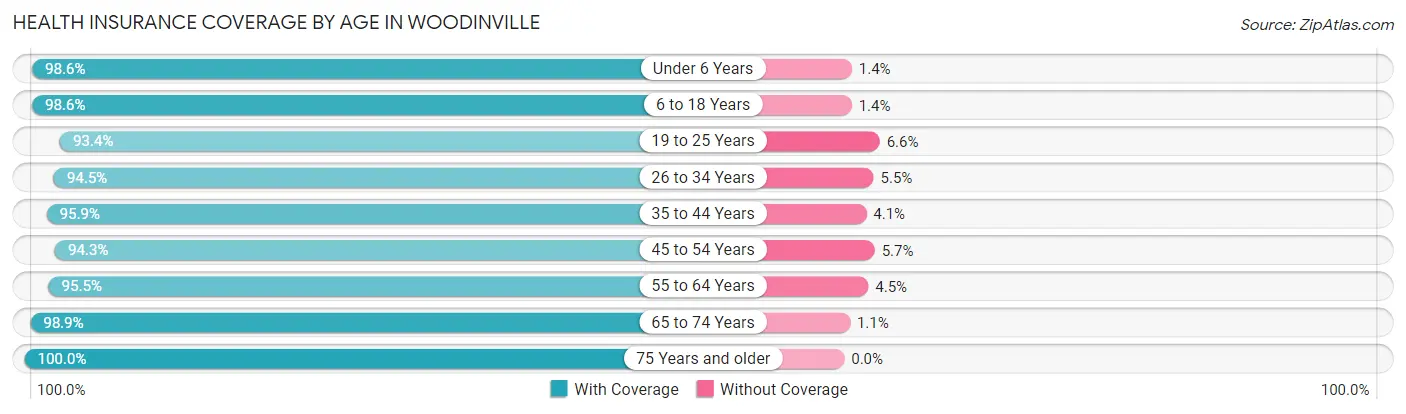
| Age Bracket | With Coverage | Without Coverage |
| Under 6 Years | 1,050 (98.6%) | 15 (1.4%) |
| 6 to 18 Years | 1,556 (98.6%) | 22 (1.4%) |
| 19 to 25 Years | 806 (93.4%) | 57 (6.6%) |
| 26 to 34 Years | 1,469 (94.5%) | 85 (5.5%) |
| 35 to 44 Years | 2,517 (95.9%) | 108 (4.1%) |
| 45 to 54 Years | 1,695 (94.3%) | 102 (5.7%) |
| 55 to 64 Years | 1,724 (95.5%) | 81 (4.5%) |
| 65 to 74 Years | 932 (98.9%) | 10 (1.1%) |
| 75 Years and older | 1,067 (100.0%) | 0 (0.0%) |
| Total | 12,816 (96.4%) | 480 (3.6%) |
Health Insurance Coverage by Citizenship Status in Woodinville
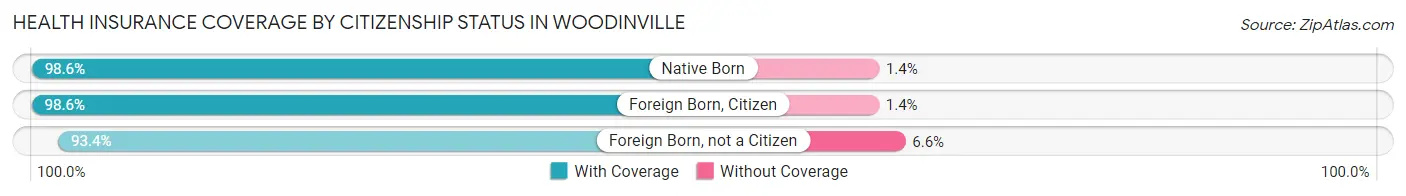
| Citizenship Status | With Coverage | Without Coverage |
| Native Born | 1,050 (98.6%) | 15 (1.4%) |
| Foreign Born, Citizen | 1,556 (98.6%) | 22 (1.4%) |
| Foreign Born, not a Citizen | 806 (93.4%) | 57 (6.6%) |
Health Insurance Coverage by Household Income in Woodinville
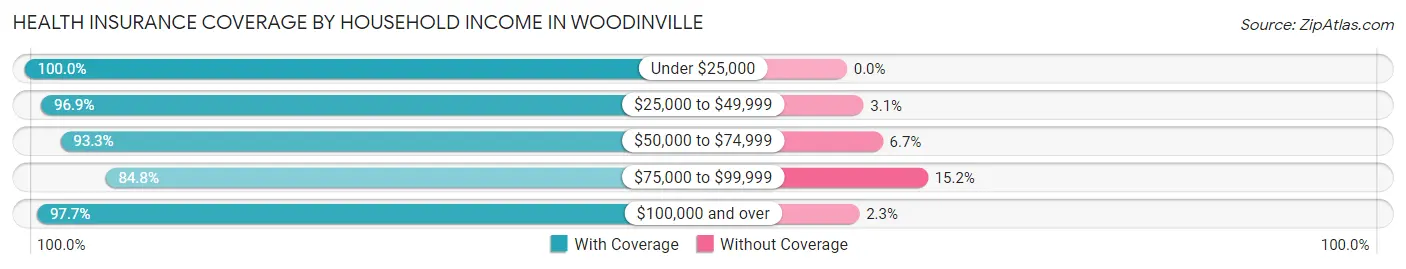
| Household Income | With Coverage | Without Coverage |
| Under $25,000 | 421 (100.0%) | 0 (0.0%) |
| $25,000 to $49,999 | 688 (96.9%) | 22 (3.1%) |
| $50,000 to $74,999 | 1,237 (93.3%) | 89 (6.7%) |
| $75,000 to $99,999 | 778 (84.8%) | 139 (15.2%) |
| $100,000 and over | 9,646 (97.7%) | 230 (2.3%) |
Public vs Private Health Insurance Coverage by Age in Woodinville
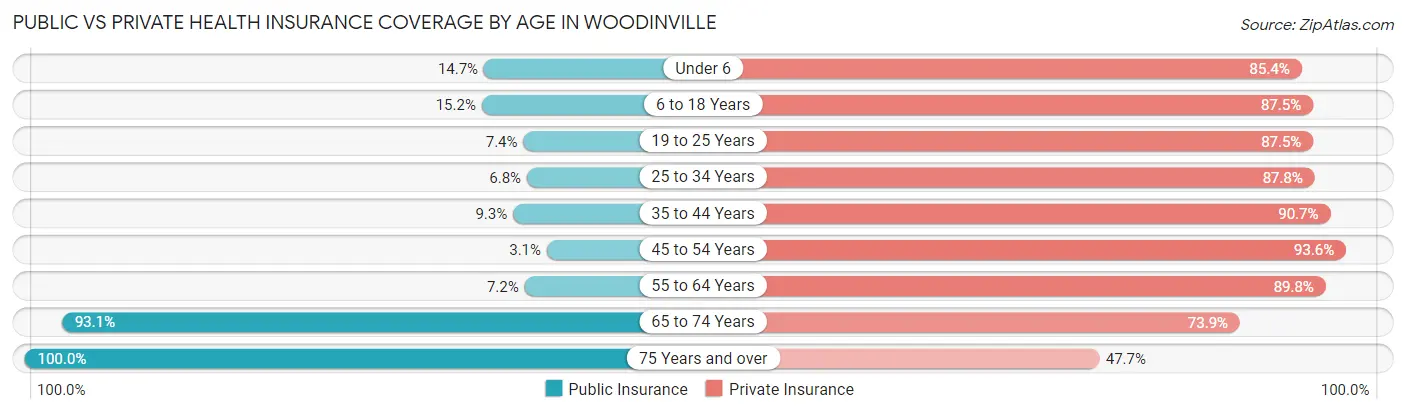
| Age Bracket | Public Insurance | Private Insurance |
| Under 6 | 157 (14.7%) | 909 (85.4%) |
| 6 to 18 Years | 239 (15.1%) | 1,380 (87.5%) |
| 19 to 25 Years | 64 (7.4%) | 755 (87.5%) |
| 25 to 34 Years | 105 (6.8%) | 1,364 (87.8%) |
| 35 to 44 Years | 245 (9.3%) | 2,380 (90.7%) |
| 45 to 54 Years | 55 (3.1%) | 1,682 (93.6%) |
| 55 to 64 Years | 130 (7.2%) | 1,621 (89.8%) |
| 65 to 74 Years | 877 (93.1%) | 696 (73.9%) |
| 75 Years and over | 1,067 (100.0%) | 509 (47.7%) |
| Total | 2,939 (22.1%) | 11,296 (85.0%) |
Disability Status by Sex by Age in Woodinville
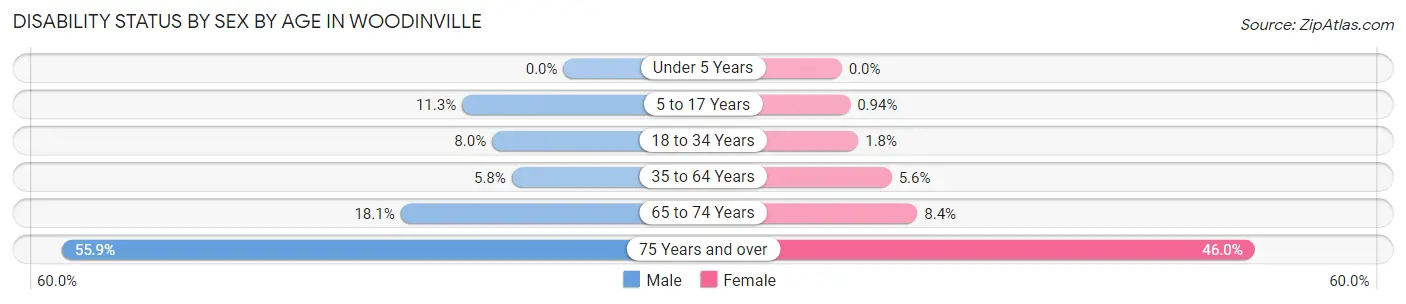
| Age Bracket | Male | Female |
| Under 5 Years | 0 (0.0%) | 0 (0.0%) |
| 5 to 17 Years | 97 (11.3%) | 7 (0.9%) |
| 18 to 34 Years | 82 (8.0%) | 27 (1.8%) |
| 35 to 64 Years | 192 (5.8%) | 161 (5.6%) |
| 65 to 74 Years | 76 (18.1%) | 44 (8.4%) |
| 75 Years and over | 229 (55.8%) | 302 (46.0%) |
Disability Class by Sex by Age in Woodinville
Disability Class: Hearing Difficulty

| Age Bracket | Male | Female |
| Under 5 Years | 0 (0.0%) | 0 (0.0%) |
| 5 to 17 Years | 76 (8.8%) | 0 (0.0%) |
| 18 to 34 Years | 0 (0.0%) | 0 (0.0%) |
| 35 to 64 Years | 36 (1.1%) | 62 (2.1%) |
| 65 to 74 Years | 26 (6.2%) | 22 (4.2%) |
| 75 Years and over | 72 (17.6%) | 137 (20.8%) |
Disability Class: Vision Difficulty
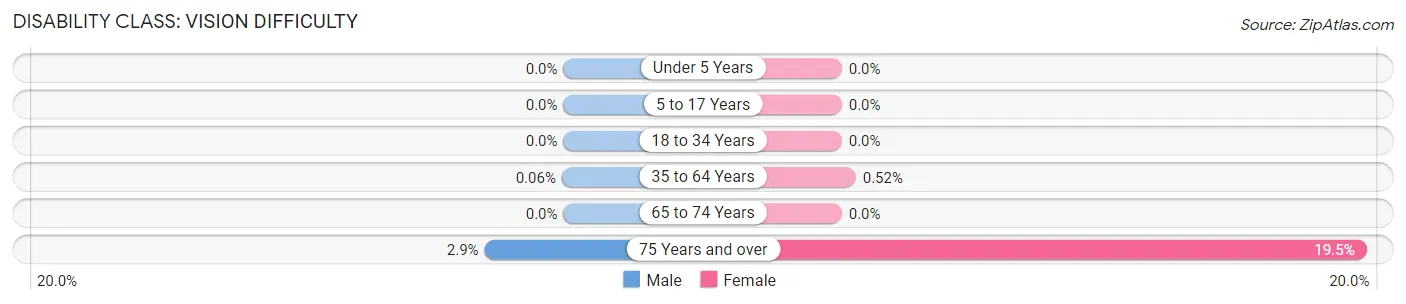
| Age Bracket | Male | Female |
| Under 5 Years | 0 (0.0%) | 0 (0.0%) |
| 5 to 17 Years | 0 (0.0%) | 0 (0.0%) |
| 18 to 34 Years | 0 (0.0%) | 0 (0.0%) |
| 35 to 64 Years | 2 (0.1%) | 15 (0.5%) |
| 65 to 74 Years | 0 (0.0%) | 0 (0.0%) |
| 75 Years and over | 12 (2.9%) | 128 (19.5%) |
Disability Class: Cognitive Difficulty
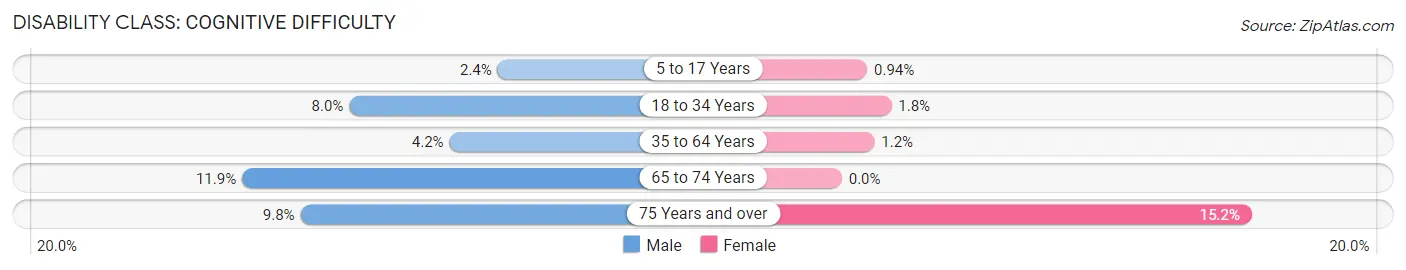
| Age Bracket | Male | Female |
| 5 to 17 Years | 21 (2.4%) | 7 (0.9%) |
| 18 to 34 Years | 82 (8.0%) | 27 (1.8%) |
| 35 to 64 Years | 141 (4.2%) | 35 (1.2%) |
| 65 to 74 Years | 50 (11.9%) | 0 (0.0%) |
| 75 Years and over | 40 (9.8%) | 100 (15.2%) |
Disability Class: Ambulatory Difficulty
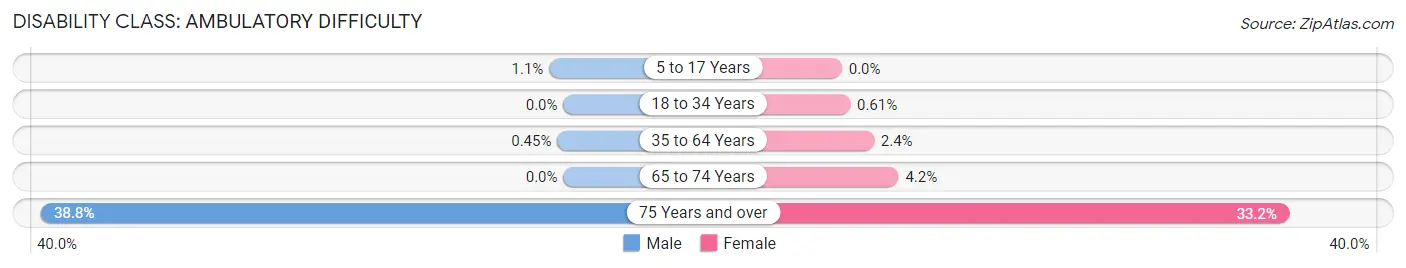
| Age Bracket | Male | Female |
| 5 to 17 Years | 9 (1.1%) | 0 (0.0%) |
| 18 to 34 Years | 0 (0.0%) | 9 (0.6%) |
| 35 to 64 Years | 15 (0.4%) | 69 (2.4%) |
| 65 to 74 Years | 0 (0.0%) | 22 (4.2%) |
| 75 Years and over | 159 (38.8%) | 218 (33.2%) |
Disability Class: Self-Care Difficulty
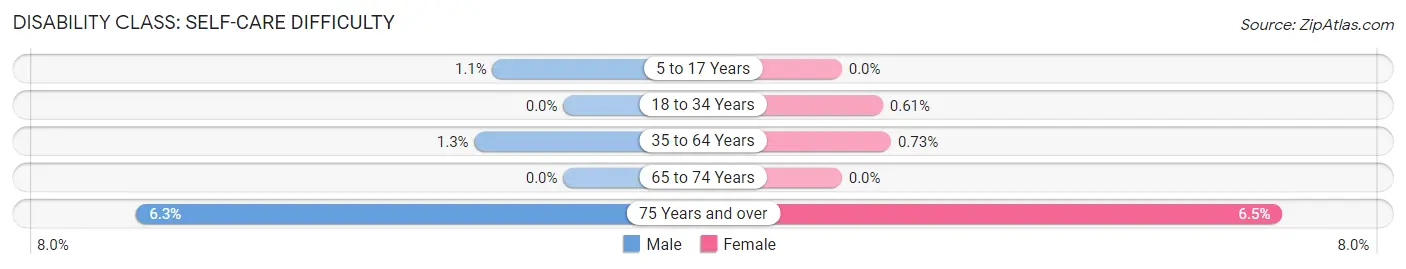
| Age Bracket | Male | Female |
| 5 to 17 Years | 9 (1.1%) | 0 (0.0%) |
| 18 to 34 Years | 0 (0.0%) | 9 (0.6%) |
| 35 to 64 Years | 44 (1.3%) | 21 (0.7%) |
| 65 to 74 Years | 0 (0.0%) | 0 (0.0%) |
| 75 Years and over | 26 (6.3%) | 43 (6.5%) |
Technology Access in Woodinville
Computing Device Access in Woodinville
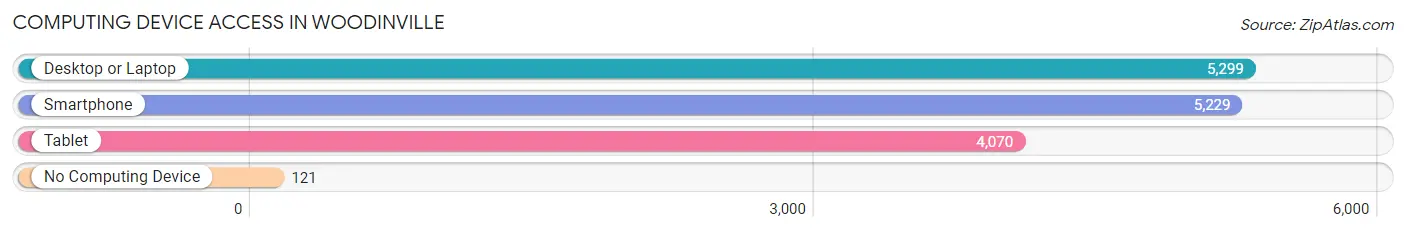
| Device Type | # Households | % Households |
| Desktop or Laptop | 5,299 | 95.5% |
| Smartphone | 5,229 | 94.2% |
| Tablet | 4,070 | 73.3% |
| No Computing Device | 121 | 2.2% |
| Total | 5,550 | 100.0% |
Internet Access in Woodinville
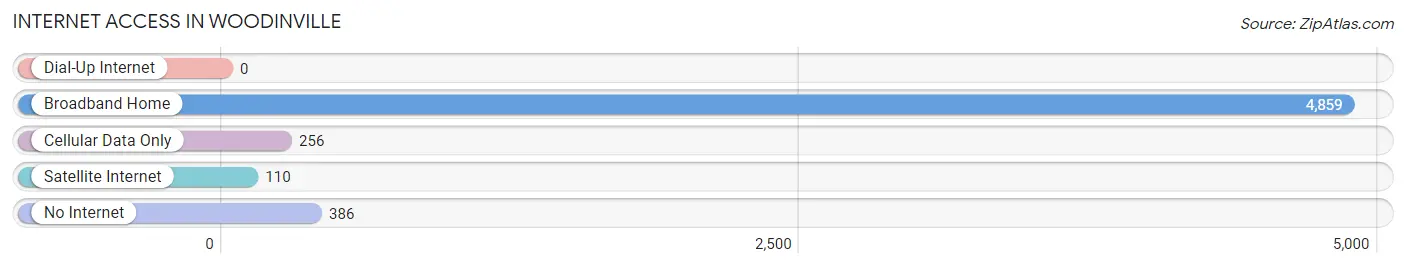
| Internet Type | # Households | % Households |
| Dial-Up Internet | 0 | 0.0% |
| Broadband Home | 4,859 | 87.5% |
| Cellular Data Only | 256 | 4.6% |
| Satellite Internet | 110 | 2.0% |
| No Internet | 386 | 7.0% |
| Total | 5,550 | 100.0% |
Woodinville Summary
Woodinville, Washington is a city located in King County, Washington, United States. It is located about 20 miles northeast of Seattle and is part of the Seattle metropolitan area. The population was 10,938 at the 2010 census.
History
The area that is now Woodinville was originally inhabited by the Snoqualmie and Duwamish Native American tribes. The first European settlers arrived in the area in the late 1800s, and the area was officially incorporated as a city in 1993.
The city was named after Ira Woodin, who was one of the first settlers in the area. He arrived in the area in 1871 and established a homestead. He also built a sawmill and a store, which helped to attract other settlers to the area.
Geography
Woodinville is located at 47°45'25" North, 122°9'45" West (47.7569, -122.1625). It is situated in the Sammamish River Valley, which is part of the Puget Sound lowlands. The city is bordered by the cities of Redmond to the west, Bothell to the north, and Kirkland to the east.
The city has a total area of 8.7 square miles, of which 8.6 square miles is land and 0.1 square miles is water. The city is located at an elevation of approximately 200 feet above sea level.
Economy
Woodinville is home to a variety of businesses, including wineries, breweries, distilleries, and retail stores. The city is also home to several corporate headquarters, including Microsoft, T-Mobile, and Nintendo of America.
The city is also home to several large employers, including the Woodinville Wine Country, which is the largest winery in the state of Washington. Other major employers in the city include the Woodinville Water District, the Woodinville Fire & Rescue, and the Woodinville School District.
Demographics
As of the 2010 census, there were 10,938 people, 4,093 households, and 2,845 families residing in the city. The population density was 1,265.3 people per square mile. The racial makeup of the city was 79.2% White, 5.2% African American, 0.7% Native American, 8.3% Asian, 0.2% Pacific Islander, 2.3% from other races, and 4.3% from two or more races. Hispanic or Latino of any race were 6.2% of the population.
The median income for a household in the city was $87,945, and the median income for a family was $102,945. The per capita income for the city was $41,945. About 4.2% of families and 5.7% of the population were below the poverty line, including 6.3% of those under age 18 and 4.2% of those age 65 or over.
Common Questions
What is Per Capita Income in Woodinville?
Per Capita income in Woodinville is $74,866.
What is the Median Family Income in Woodinville?
Median Family Income in Woodinville is $180,385.
What is the Median Household income in Woodinville?
Median Household Income in Woodinville is $142,500.
What is Income or Wage Gap in Woodinville?
Income or Wage Gap in Woodinville is 50.3%.
Women in Woodinville earn 49.7 cents for every dollar earned by a man.
What is Inequality or Gini Index in Woodinville?
Inequality or Gini Index in Woodinville is 0.42.
What is the Total Population of Woodinville?
Total Population of Woodinville is 13,301.
What is the Total Male Population of Woodinville?
Total Male Population of Woodinville is 6,645.
What is the Total Female Population of Woodinville?
Total Female Population of Woodinville is 6,656.
What is the Ratio of Males per 100 Females in Woodinville?
There are 99.83 Males per 100 Females in Woodinville.
What is the Ratio of Females per 100 Males in Woodinville?
There are 100.17 Females per 100 Males in Woodinville.
What is the Median Population Age in Woodinville?
Median Population Age in Woodinville is 40.6 Years.
What is the Average Family Size in Woodinville
Average Family Size in Woodinville is 2.9 People.
What is the Average Household Size in Woodinville
Average Household Size in Woodinville is 2.4 People.
How Large is the Labor Force in Woodinville?
There are 7,681 People in the Labor Forcein in Woodinville.
What is the Percentage of People in the Labor Force in Woodinville?
70.2% of People are in the Labor Force in Woodinville.
What is the Unemployment Rate in Woodinville?
Unemployment Rate in Woodinville is 3.8%.