Kirkland, WA Map & Demographics
Kirkland Map
Kirkland Overview
$79,941
PER CAPITA INCOME
$169,471
AVG FAMILY INCOME
$135,608
AVG HOUSEHOLD INCOME
38.0%
WAGE / INCOME GAP [ % ]
62.0¢/ $1
WAGE / INCOME GAP [ $ ]
$12,057
FAMILY INCOME DEFICIT
0.48
INEQUALITY / GINI INDEX
92,015
TOTAL POPULATION
46,407
MALE POPULATION
45,608
FEMALE POPULATION
101.75
MALES / 100 FEMALES
98.28
FEMALES / 100 MALES
38.0
MEDIAN AGE
3.0
AVG FAMILY SIZE
2.4
AVG HOUSEHOLD SIZE
53,198
LABOR FORCE [ PEOPLE ]
70.6%
PERCENT IN LABOR FORCE
4.7%
UNEMPLOYMENT RATE
Income in Kirkland
Income Overview in Kirkland
Per Capita Income in Kirkland is $79,941, while median incomes of families and households are $169,471 and $135,608 respectively.
| Characteristic | Number | Measure |
| Per Capita Income | 92,015 | $79,941 |
| Median Family Income | 23,345 | $169,471 |
| Mean Family Income | 23,345 | $229,110 |
| Median Household Income | 37,546 | $135,608 |
| Mean Household Income | 37,546 | $193,452 |
| Income Deficit | 23,345 | $12,057 |
| Wage / Income Gap (%) | 92,015 | 38.02% |
| Wage / Income Gap ($) | 92,015 | 61.98¢ per $1 |
| Gini / Inequality Index | 92,015 | 0.48 |
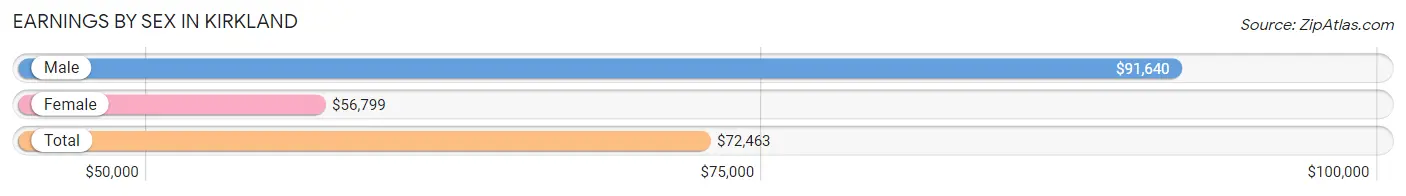
Earnings by Sex in Kirkland
Average Earnings in Kirkland are $72,463, $91,640 for men and $56,799 for women, a difference of 38.0%.
| Sex | Number | Average Earnings |
| Male | 30,217 (54.6%) | $91,640 |
| Female | 25,089 (45.4%) | $56,799 |
| Total | 55,306 (100.0%) | $72,463 |
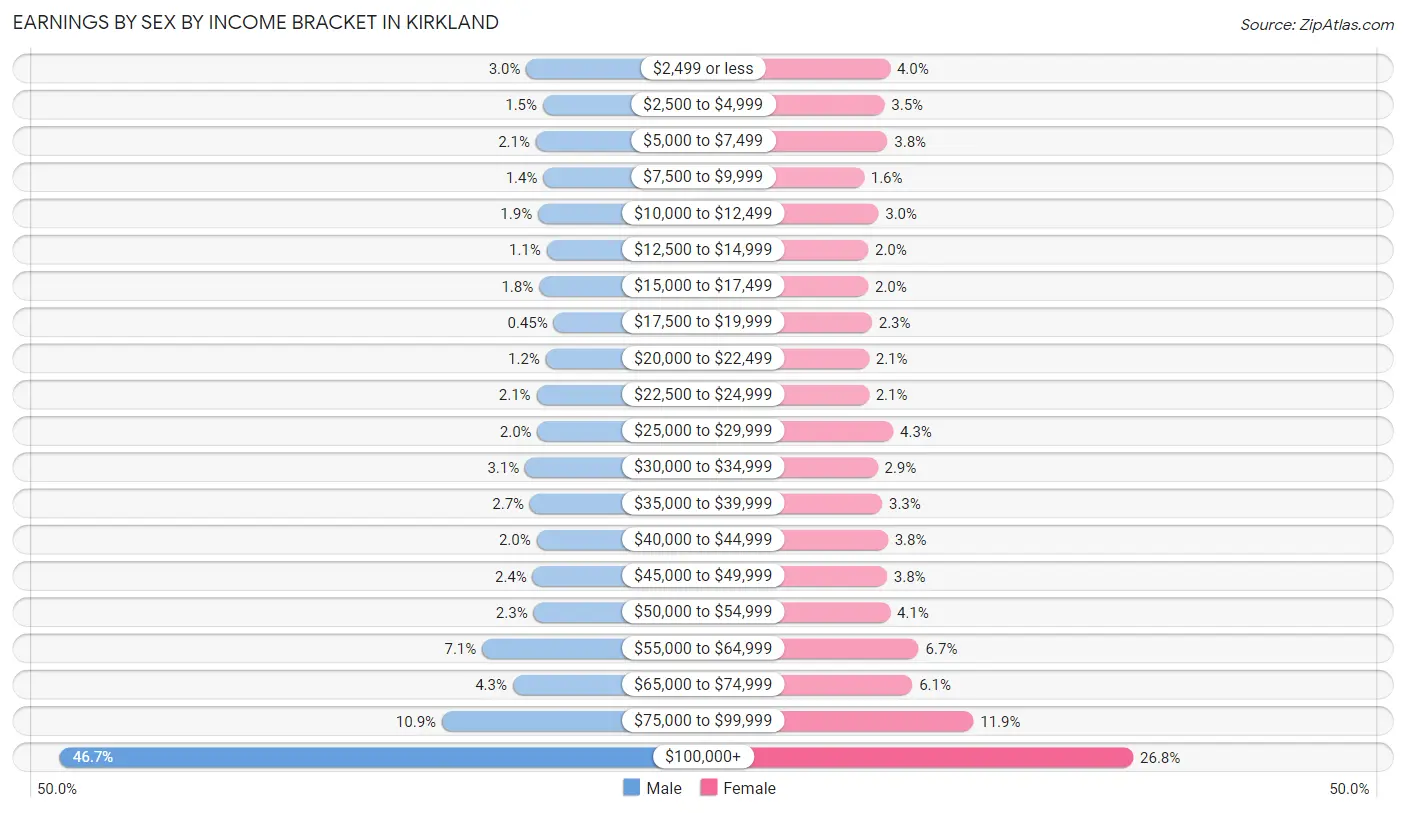
Earnings by Sex by Income Bracket in Kirkland
The most common earnings brackets in Kirkland are $100,000+ for men (14,107 | 46.7%) and $100,000+ for women (6,729 | 26.8%).
| Income | Male | Female |
| $2,499 or less | 905 (3.0%) | 1,013 (4.0%) |
| $2,500 to $4,999 | 437 (1.5%) | 882 (3.5%) |
| $5,000 to $7,499 | 639 (2.1%) | 953 (3.8%) |
| $7,500 to $9,999 | 426 (1.4%) | 400 (1.6%) |
| $10,000 to $12,499 | 577 (1.9%) | 740 (2.9%) |
| $12,500 to $14,999 | 332 (1.1%) | 499 (2.0%) |
| $15,000 to $17,499 | 547 (1.8%) | 500 (2.0%) |
| $17,500 to $19,999 | 137 (0.4%) | 586 (2.3%) |
| $20,000 to $22,499 | 361 (1.2%) | 517 (2.1%) |
| $22,500 to $24,999 | 618 (2.1%) | 514 (2.1%) |
| $25,000 to $29,999 | 592 (2.0%) | 1,088 (4.3%) |
| $30,000 to $34,999 | 943 (3.1%) | 722 (2.9%) |
| $35,000 to $39,999 | 803 (2.7%) | 828 (3.3%) |
| $40,000 to $44,999 | 615 (2.0%) | 962 (3.8%) |
| $45,000 to $49,999 | 727 (2.4%) | 941 (3.7%) |
| $50,000 to $54,999 | 705 (2.3%) | 1,016 (4.1%) |
| $55,000 to $64,999 | 2,159 (7.1%) | 1,688 (6.7%) |
| $65,000 to $74,999 | 1,291 (4.3%) | 1,538 (6.1%) |
| $75,000 to $99,999 | 3,296 (10.9%) | 2,973 (11.8%) |
| $100,000+ | 14,107 (46.7%) | 6,729 (26.8%) |
| Total | 30,217 (100.0%) | 25,089 (100.0%) |
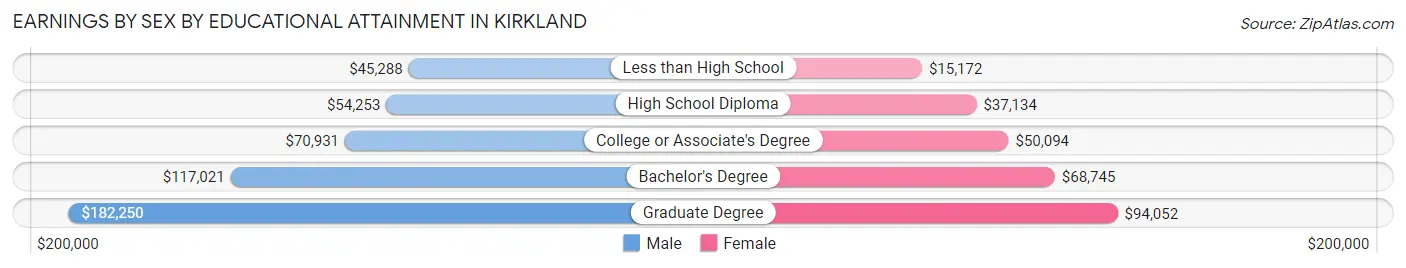
Earnings by Sex by Educational Attainment in Kirkland
Average earnings in Kirkland are $104,357 for men and $65,145 for women, a difference of 37.6%. Men with an educational attainment of graduate degree enjoy the highest average annual earnings of $182,250, while those with less than high school education earn the least with $45,288. Women with an educational attainment of graduate degree earn the most with the average annual earnings of $94,052, while those with less than high school education have the smallest earnings of $15,172.
| Educational Attainment | Male Income | Female Income |
| Less than High School | $45,288 | $15,172 |
| High School Diploma | $54,253 | $37,134 |
| College or Associate's Degree | $70,931 | $50,094 |
| Bachelor's Degree | $117,021 | $68,745 |
| Graduate Degree | $182,250 | $94,052 |
| Total | $104,357 | $65,145 |
Family Income in Kirkland
Family Income Brackets in Kirkland
According to the Kirkland family income data, there are 9,315 families falling into the $200,000+ income range, which is the most common income bracket and makes up 39.9% of all families. Conversely, the $10,000 to $14,999 income bracket is the least frequent group with only 257 families (1.1%) belonging to this category.
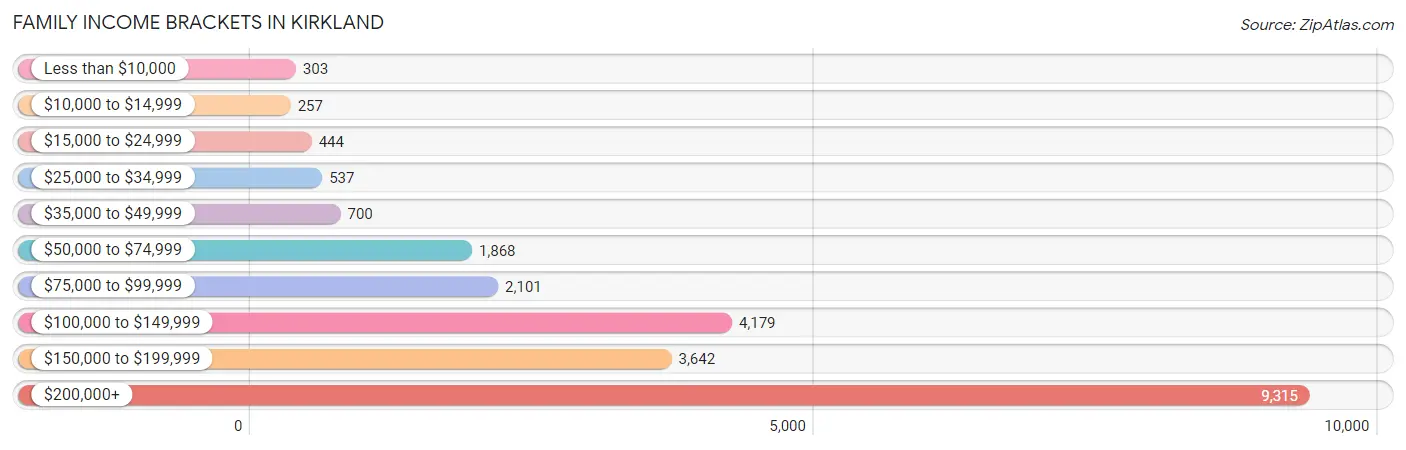
| Income Bracket | # Families | % Families |
| Less than $10,000 | 303 | 1.3% |
| $10,000 to $14,999 | 257 | 1.1% |
| $15,000 to $24,999 | 444 | 1.9% |
| $25,000 to $34,999 | 537 | 2.3% |
| $35,000 to $49,999 | 700 | 3.0% |
| $50,000 to $74,999 | 1,868 | 8.0% |
| $75,000 to $99,999 | 2,101 | 9.0% |
| $100,000 to $149,999 | 4,179 | 17.9% |
| $150,000 to $199,999 | 3,642 | 15.6% |
| $200,000+ | 9,315 | 39.9% |
Family Income by Famaliy Size in Kirkland
6-person families (427 | 1.8%) account for the highest median family income in Kirkland with $235,163 per family, while 2-person families (10,792 | 46.2%) have the highest median income of $68,492 per family member.
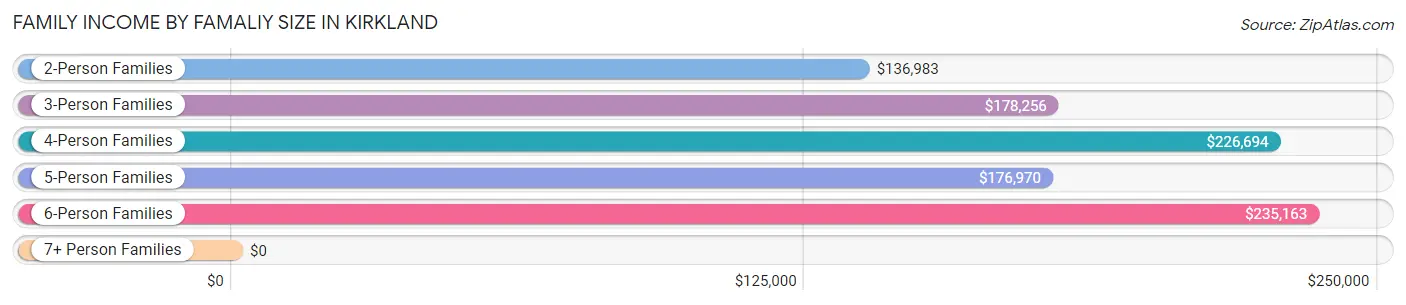
| Income Bracket | # Families | Median Income |
| 2-Person Families | 10,792 (46.2%) | $136,983 |
| 3-Person Families | 5,700 (24.4%) | $178,256 |
| 4-Person Families | 4,700 (20.1%) | $226,694 |
| 5-Person Families | 1,596 (6.8%) | $176,970 |
| 6-Person Families | 427 (1.8%) | $235,163 |
| 7+ Person Families | 130 (0.6%) | $0 |
| Total | 23,345 (100.0%) | $169,471 |
Family Income by Number of Earners in Kirkland
The median family income in Kirkland is $169,471, with families comprising 2 earners (11,908) having the highest median family income of $195,558, while families with no earners (2,370) have the lowest median family income of $71,316, accounting for 51.0% and 10.2% of families, respectively.
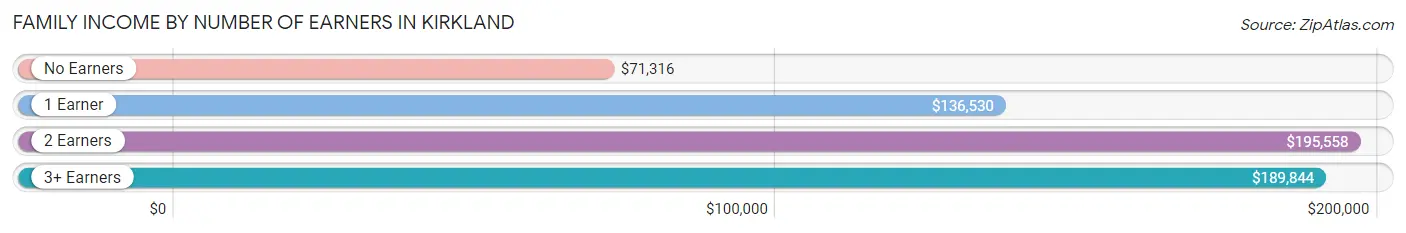
| Number of Earners | # Families | Median Income |
| No Earners | 2,370 (10.2%) | $71,316 |
| 1 Earner | 6,917 (29.6%) | $136,530 |
| 2 Earners | 11,908 (51.0%) | $195,558 |
| 3+ Earners | 2,150 (9.2%) | $189,844 |
| Total | 23,345 (100.0%) | $169,471 |
Household Income in Kirkland
Household Income Brackets in Kirkland
With 11,977 households falling in the category, the $200,000+ income range is the most frequent in Kirkland, accounting for 31.9% of all households. In contrast, only 601 households (1.6%) fall into the $10,000 to $14,999 income bracket, making it the least populous group.
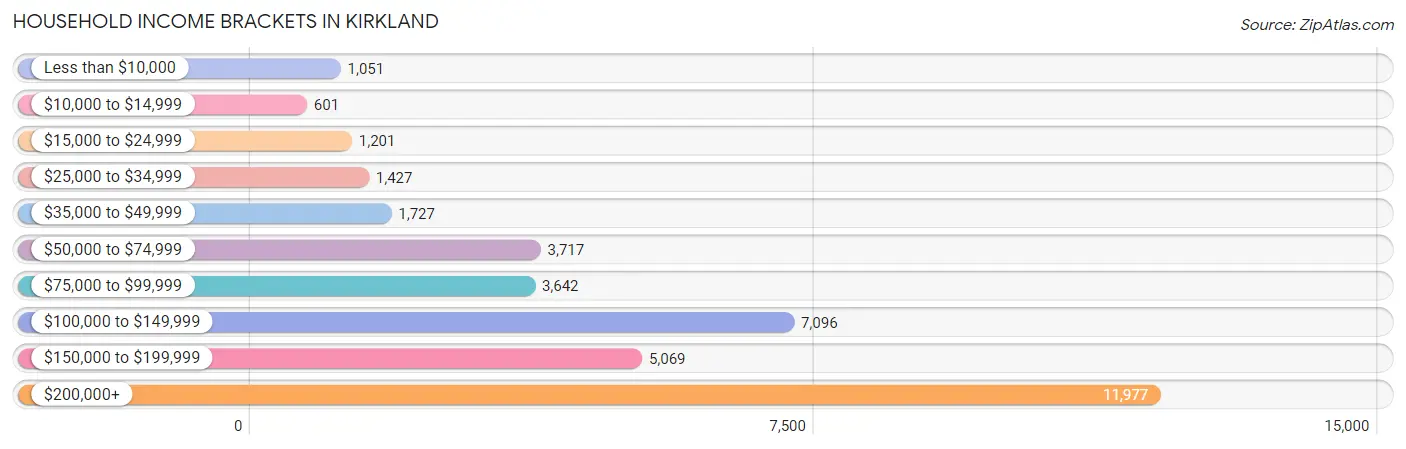
| Income Bracket | # Households | % Households |
| Less than $10,000 | 1,051 | 2.8% |
| $10,000 to $14,999 | 601 | 1.6% |
| $15,000 to $24,999 | 1,201 | 3.2% |
| $25,000 to $34,999 | 1,427 | 3.8% |
| $35,000 to $49,999 | 1,727 | 4.6% |
| $50,000 to $74,999 | 3,717 | 9.9% |
| $75,000 to $99,999 | 3,642 | 9.7% |
| $100,000 to $149,999 | 7,096 | 18.9% |
| $150,000 to $199,999 | 5,069 | 13.5% |
| $200,000+ | 11,977 | 31.9% |
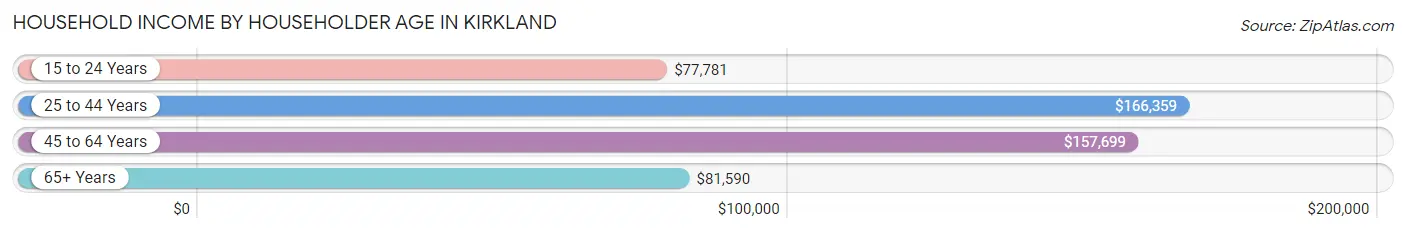
Household Income by Householder Age in Kirkland
The median household income in Kirkland is $135,608, with the highest median household income of $166,359 found in the 25 to 44 years age bracket for the primary householder. A total of 15,510 households (41.3%) fall into this category. Meanwhile, the 15 to 24 years age bracket for the primary householder has the lowest median household income of $77,781, with 1,185 households (3.2%) in this group.
| Income Bracket | # Households | Median Income |
| 15 to 24 Years | 1,185 (3.2%) | $77,781 |
| 25 to 44 Years | 15,510 (41.3%) | $166,359 |
| 45 to 64 Years | 12,798 (34.1%) | $157,699 |
| 65+ Years | 8,053 (21.4%) | $81,590 |
| Total | 37,546 (100.0%) | $135,608 |
Poverty in Kirkland
Income Below Poverty by Sex and Age in Kirkland
With 5.9% poverty level for males and 7.3% for females among the residents of Kirkland, 18 to 24 year old males and 18 to 24 year old females are the most vulnerable to poverty, with 552 males (15.4%) and 407 females (15.1%) in their respective age groups living below the poverty level.
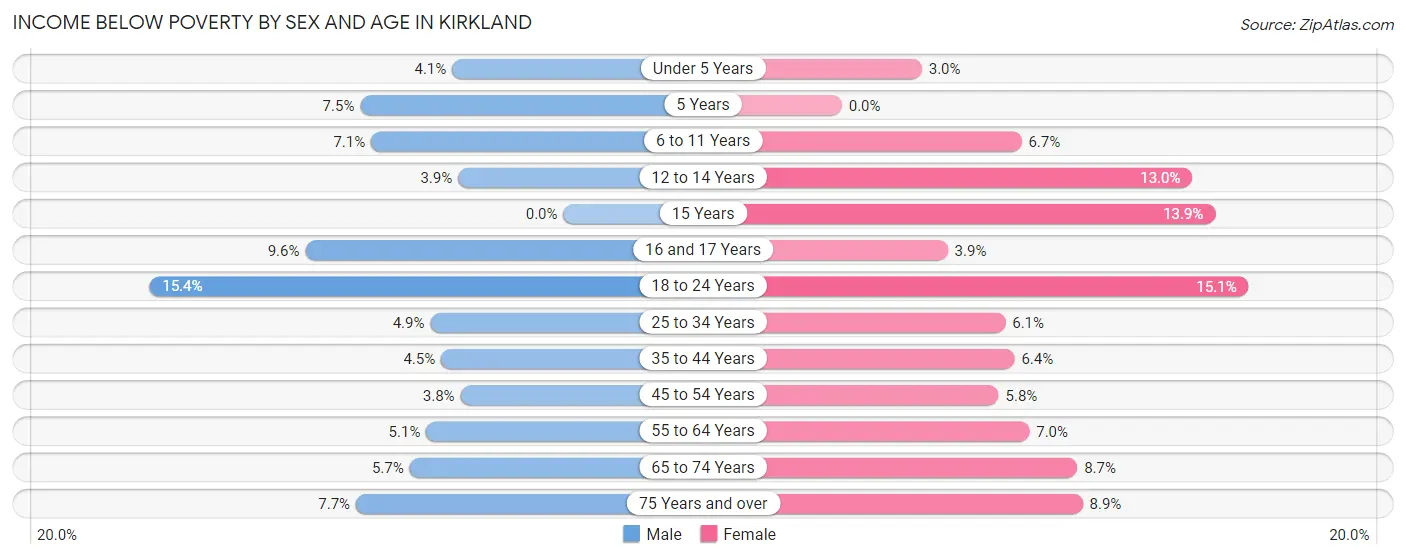
| Age Bracket | Male | Female |
| Under 5 Years | 101 (4.1%) | 83 (3.0%) |
| 5 Years | 46 (7.5%) | 0 (0.0%) |
| 6 to 11 Years | 254 (7.1%) | 174 (6.7%) |
| 12 to 14 Years | 56 (3.9%) | 231 (13.0%) |
| 15 Years | 0 (0.0%) | 47 (13.9%) |
| 16 and 17 Years | 85 (9.6%) | 33 (3.9%) |
| 18 to 24 Years | 552 (15.4%) | 407 (15.1%) |
| 25 to 34 Years | 411 (4.9%) | 440 (6.1%) |
| 35 to 44 Years | 346 (4.5%) | 505 (6.4%) |
| 45 to 54 Years | 232 (3.8%) | 333 (5.8%) |
| 55 to 64 Years | 268 (5.1%) | 384 (7.0%) |
| 65 to 74 Years | 221 (5.7%) | 376 (8.7%) |
| 75 Years and over | 137 (7.7%) | 250 (8.9%) |
| Total | 2,709 (5.9%) | 3,263 (7.3%) |
Income Above Poverty by Sex and Age in Kirkland
According to the poverty statistics in Kirkland, males aged 15 years and females aged 5 years are the age groups that are most secure financially, with 100.0% of males and 100.0% of females in these age groups living above the poverty line.
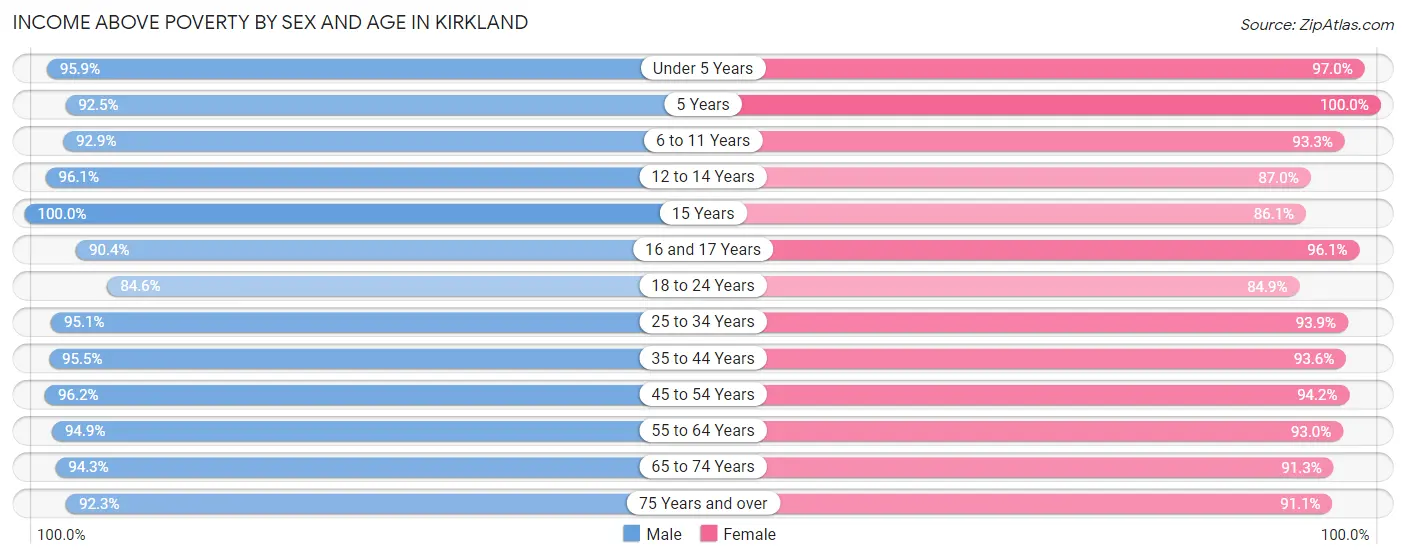
| Age Bracket | Male | Female |
| Under 5 Years | 2,343 (95.9%) | 2,711 (97.0%) |
| 5 Years | 564 (92.5%) | 411 (100.0%) |
| 6 to 11 Years | 3,305 (92.9%) | 2,436 (93.3%) |
| 12 to 14 Years | 1,378 (96.1%) | 1,544 (87.0%) |
| 15 Years | 584 (100.0%) | 292 (86.1%) |
| 16 and 17 Years | 802 (90.4%) | 807 (96.1%) |
| 18 to 24 Years | 3,040 (84.6%) | 2,289 (84.9%) |
| 25 to 34 Years | 7,911 (95.1%) | 6,809 (93.9%) |
| 35 to 44 Years | 7,275 (95.5%) | 7,377 (93.6%) |
| 45 to 54 Years | 5,840 (96.2%) | 5,389 (94.2%) |
| 55 to 64 Years | 4,994 (94.9%) | 5,130 (93.0%) |
| 65 to 74 Years | 3,647 (94.3%) | 3,925 (91.3%) |
| 75 Years and over | 1,643 (92.3%) | 2,545 (91.1%) |
| Total | 43,326 (94.1%) | 41,665 (92.7%) |
Income Below Poverty Among Married-Couple Families in Kirkland
The poverty statistics for married-couple families in Kirkland show that 2.5% or 493 of the total 19,309 families live below the poverty line. Families with 3 or 4 children have the highest poverty rate of 7.0%, comprising of 76 families. On the other hand, families with 5 or more children have the lowest poverty rate of 0.0%, which includes 0 families.
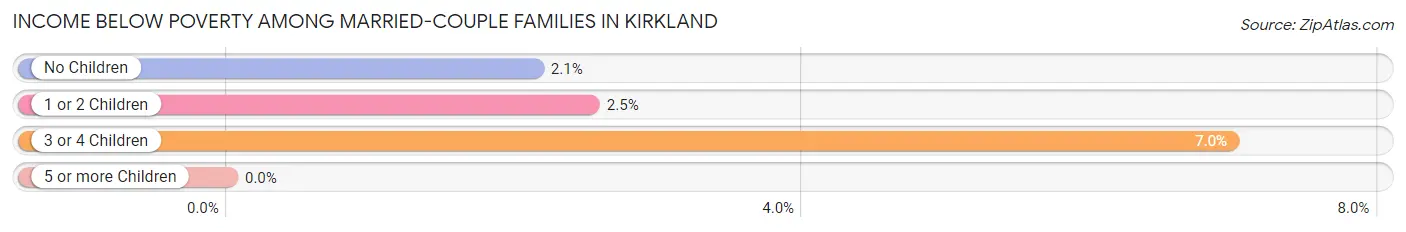
| Children | Above Poverty | Below Poverty |
| No Children | 10,303 (97.9%) | 224 (2.1%) |
| 1 or 2 Children | 7,460 (97.5%) | 193 (2.5%) |
| 3 or 4 Children | 1,015 (93.0%) | 76 (7.0%) |
| 5 or more Children | 38 (100.0%) | 0 (0.0%) |
| Total | 18,816 (97.5%) | 493 (2.5%) |
Income Below Poverty Among Single-Parent Households in Kirkland
According to the poverty data in Kirkland, 3.6% or 51 single-father households and 9.3% or 245 single-mother households are living below the poverty line. Among single-father households, those with 5 or more children have the highest poverty rate, with 16 households (100.0%) experiencing poverty. Likewise, among single-mother households, those with 3 or 4 children have the highest poverty rate, with 62 households (63.9%) falling below the poverty line.
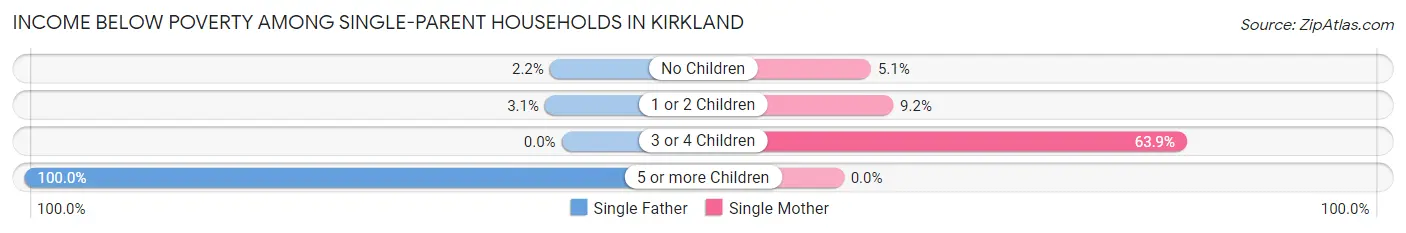
| Children | Single Father | Single Mother |
| No Children | 15 (2.2%) | 62 (5.1%) |
| 1 or 2 Children | 20 (3.1%) | 121 (9.2%) |
| 3 or 4 Children | 0 (0.0%) | 62 (63.9%) |
| 5 or more Children | 16 (100.0%) | 0 (0.0%) |
| Total | 51 (3.6%) | 245 (9.3%) |
Income Below Poverty Among Married-Couple vs Single-Parent Households in Kirkland
The poverty data for Kirkland shows that 493 of the married-couple family households (2.5%) and 296 of the single-parent households (7.3%) are living below the poverty level. Within the married-couple family households, those with 3 or 4 children have the highest poverty rate, with 76 households (7.0%) falling below the poverty line. Among the single-parent households, those with 5 or more children have the highest poverty rate, with 16 household (100.0%) living below poverty.
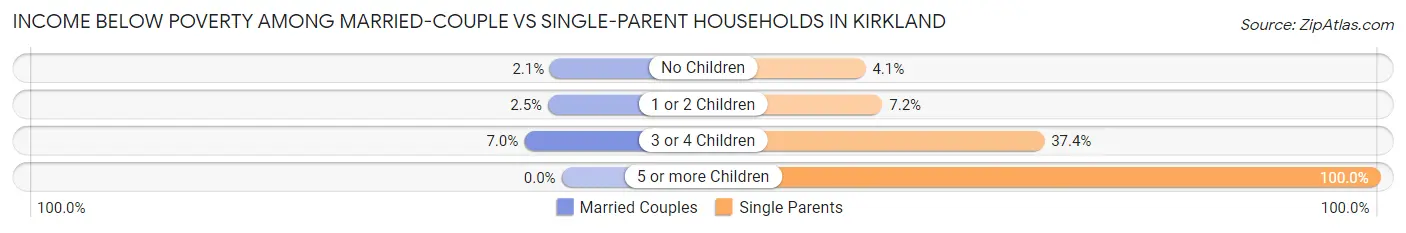
| Children | Married-Couple Families | Single-Parent Households |
| No Children | 224 (2.1%) | 77 (4.1%) |
| 1 or 2 Children | 193 (2.5%) | 141 (7.2%) |
| 3 or 4 Children | 76 (7.0%) | 62 (37.3%) |
| 5 or more Children | 0 (0.0%) | 16 (100.0%) |
| Total | 493 (2.5%) | 296 (7.3%) |
Race in Kirkland
The most populous races in Kirkland are White / Caucasian (63,789 | 69.3%), Asian (15,802 | 17.2%), and Two or more Races (7,506 | 8.2%).
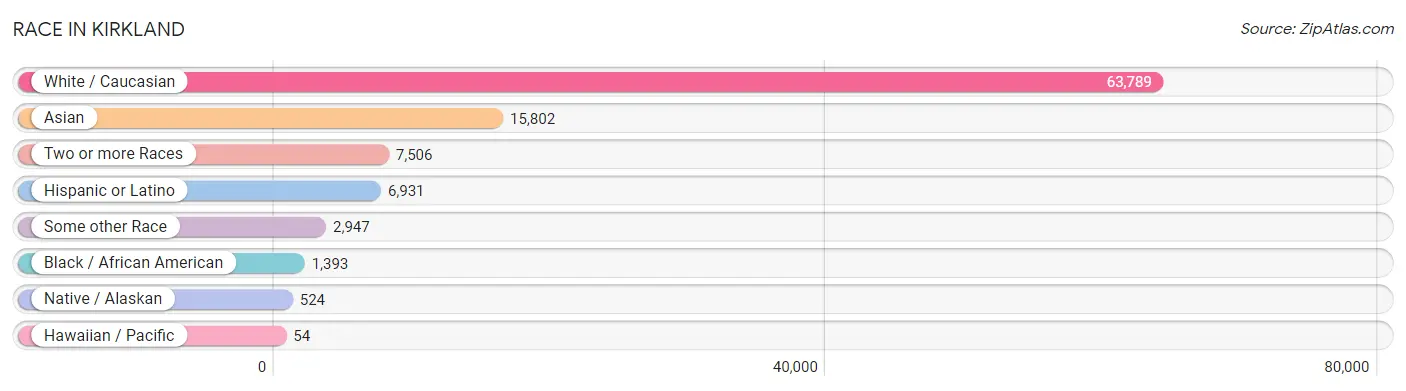
| Race | # Population | % Population |
| Asian | 15,802 | 17.2% |
| Black / African American | 1,393 | 1.5% |
| Hawaiian / Pacific | 54 | 0.1% |
| Hispanic or Latino | 6,931 | 7.5% |
| Native / Alaskan | 524 | 0.6% |
| White / Caucasian | 63,789 | 69.3% |
| Two or more Races | 7,506 | 8.2% |
| Some other Race | 2,947 | 3.2% |
| Total | 92,015 | 100.0% |
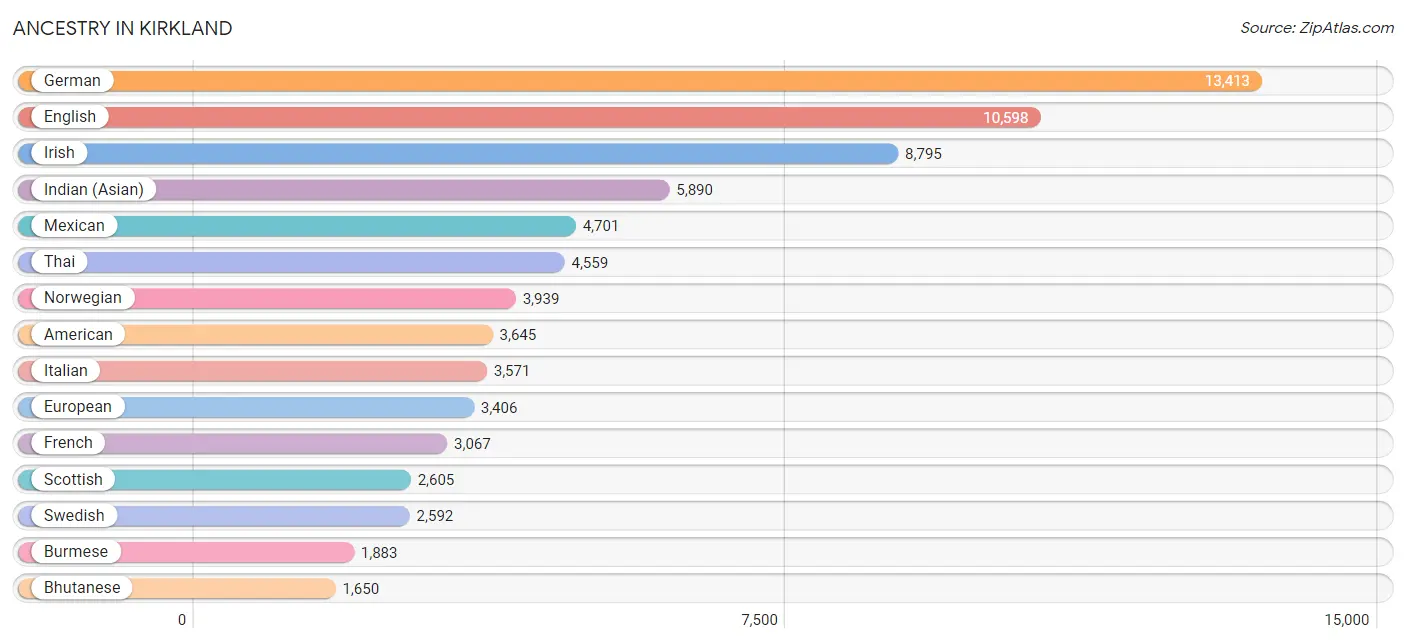
Ancestry in Kirkland
The most populous ancestries reported in Kirkland are German (13,413 | 14.6%), English (10,598 | 11.5%), Irish (8,795 | 9.6%), Indian (Asian) (5,890 | 6.4%), and Mexican (4,701 | 5.1%), together accounting for 47.2% of all Kirkland residents.
| Ancestry | # Population | % Population |
| Afghan | 11 | 0.0% |
| African | 112 | 0.1% |
| Alaska Native | 1 | 0.0% |
| Alaskan Athabascan | 45 | 0.1% |
| Aleut | 37 | 0.0% |
| Alsatian | 35 | 0.0% |
| American | 3,645 | 4.0% |
| Arab | 880 | 1.0% |
| Argentinean | 63 | 0.1% |
| Armenian | 196 | 0.2% |
| Assyrian / Chaldean / Syriac | 13 | 0.0% |
| Australian | 297 | 0.3% |
| Austrian | 248 | 0.3% |
| Bangladeshi | 677 | 0.7% |
| Basque | 33 | 0.0% |
| Belgian | 126 | 0.1% |
| Bhutanese | 1,650 | 1.8% |
| Blackfeet | 105 | 0.1% |
| Bolivian | 100 | 0.1% |
| Brazilian | 834 | 0.9% |
| British | 1,455 | 1.6% |
| Bulgarian | 90 | 0.1% |
| Burmese | 1,883 | 2.1% |
| Canadian | 557 | 0.6% |
| Celtic | 10 | 0.0% |
| Central American | 595 | 0.6% |
| Central American Indian | 6 | 0.0% |
| Cherokee | 473 | 0.5% |
| Chilean | 57 | 0.1% |
| Chinese | 19 | 0.0% |
| Chippewa | 51 | 0.1% |
| Choctaw | 11 | 0.0% |
| Colombian | 165 | 0.2% |
| Creek | 1 | 0.0% |
| Croatian | 241 | 0.3% |
| Cuban | 93 | 0.1% |
| Czech | 519 | 0.6% |
| Czechoslovakian | 136 | 0.2% |
| Danish | 665 | 0.7% |
| Delaware | 42 | 0.1% |
| Dominican | 13 | 0.0% |
| Dutch | 1,067 | 1.2% |
| Eastern European | 629 | 0.7% |
| Ecuadorian | 59 | 0.1% |
| Egyptian | 97 | 0.1% |
| English | 10,598 | 11.5% |
| Estonian | 20 | 0.0% |
| Ethiopian | 24 | 0.0% |
| European | 3,406 | 3.7% |
| Filipino | 563 | 0.6% |
| Finnish | 675 | 0.7% |
| French | 3,067 | 3.3% |
| French American Indian | 9 | 0.0% |
| French Canadian | 306 | 0.3% |
| German | 13,413 | 14.6% |
| Ghanaian | 2 | 0.0% |
| Greek | 473 | 0.5% |
| Guamanian / Chamorro | 90 | 0.1% |
| Guatemalan | 379 | 0.4% |
| Guyanese | 40 | 0.0% |
| Haitian | 1 | 0.0% |
| Honduran | 13 | 0.0% |
| Hungarian | 325 | 0.4% |
| Icelander | 138 | 0.2% |
| Indian (Asian) | 5,890 | 6.4% |
| Indonesian | 10 | 0.0% |
| Inupiat | 33 | 0.0% |
| Iranian | 1,412 | 1.5% |
| Iraqi | 95 | 0.1% |
| Irish | 8,795 | 9.6% |
| Iroquois | 55 | 0.1% |
| Israeli | 106 | 0.1% |
| Italian | 3,571 | 3.9% |
| Jamaican | 156 | 0.2% |
| Japanese | 436 | 0.5% |
| Jordanian | 28 | 0.0% |
| Kenyan | 24 | 0.0% |
| Korean | 1,230 | 1.3% |
| Laotian | 97 | 0.1% |
| Latvian | 86 | 0.1% |
| Lebanese | 400 | 0.4% |
| Lithuanian | 204 | 0.2% |
| Luxembourger | 15 | 0.0% |
| Macedonian | 3 | 0.0% |
| Malaysian | 119 | 0.1% |
| Mexican | 4,701 | 5.1% |
| Mexican American Indian | 167 | 0.2% |
| Mongolian | 36 | 0.0% |
| Moroccan | 14 | 0.0% |
| Native Hawaiian | 246 | 0.3% |
| Navajo | 33 | 0.0% |
| New Zealander | 22 | 0.0% |
| Nigerian | 91 | 0.1% |
| Northern European | 676 | 0.7% |
| Norwegian | 3,939 | 4.3% |
| Okinawan | 79 | 0.1% |
| Osage | 49 | 0.1% |
| Pakistani | 230 | 0.3% |
| Palestinian | 30 | 0.0% |
| Panamanian | 9 | 0.0% |
| Pennsylvania German | 23 | 0.0% |
| Peruvian | 164 | 0.2% |
| Polish | 1,356 | 1.5% |
| Portuguese | 672 | 0.7% |
| Puerto Rican | 403 | 0.4% |
| Puget Sound Salish | 93 | 0.1% |
| Romanian | 858 | 0.9% |
| Russian | 1,528 | 1.7% |
| Salvadoran | 194 | 0.2% |
| Samoan | 15 | 0.0% |
| Scandinavian | 880 | 1.0% |
| Scotch-Irish | 716 | 0.8% |
| Scottish | 2,605 | 2.8% |
| Seminole | 34 | 0.0% |
| Serbian | 181 | 0.2% |
| Sioux | 33 | 0.0% |
| Slavic | 63 | 0.1% |
| Slovak | 103 | 0.1% |
| Slovene | 17 | 0.0% |
| South African | 70 | 0.1% |
| South American | 749 | 0.8% |
| South American Indian | 65 | 0.1% |
| Spaniard | 235 | 0.3% |
| Spanish | 54 | 0.1% |
| Sri Lankan | 946 | 1.0% |
| Subsaharan African | 334 | 0.4% |
| Swedish | 2,592 | 2.8% |
| Swiss | 160 | 0.2% |
| Thai | 4,559 | 5.0% |
| Tlingit-Haida | 18 | 0.0% |
| Tsimshian | 12 | 0.0% |
| Turkish | 422 | 0.5% |
| Ukrainian | 706 | 0.8% |
| Venezuelan | 141 | 0.2% |
| Vietnamese | 125 | 0.1% |
| Welsh | 975 | 1.1% |
| West Indian | 8 | 0.0% |
| Yaqui | 30 | 0.0% |
| Yugoslavian | 242 | 0.3% | View All 139 Rows |
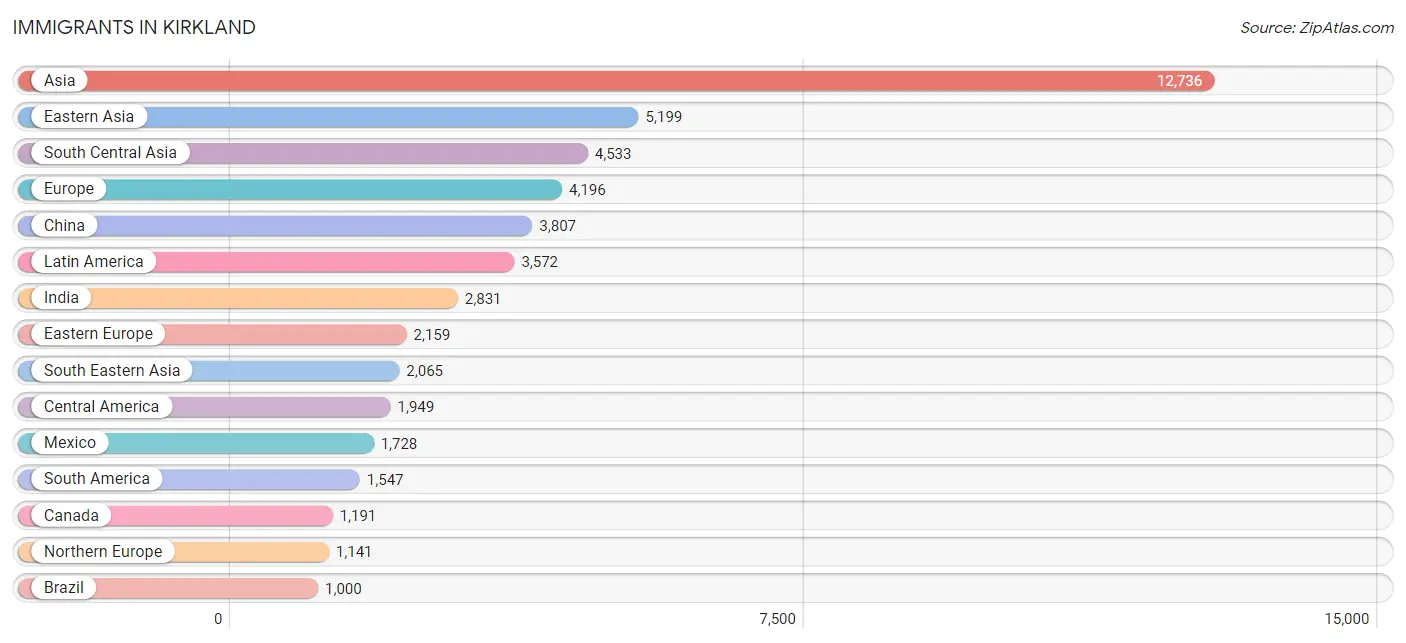
Immigrants in Kirkland
The most numerous immigrant groups reported in Kirkland came from Asia (12,736 | 13.8%), Eastern Asia (5,199 | 5.7%), South Central Asia (4,533 | 4.9%), Europe (4,196 | 4.6%), and China (3,807 | 4.1%), together accounting for 33.1% of all Kirkland residents.
| Immigration Origin | # Population | % Population |
| Afghanistan | 8 | 0.0% |
| Africa | 432 | 0.5% |
| Argentina | 12 | 0.0% |
| Armenia | 37 | 0.0% |
| Asia | 12,736 | 13.8% |
| Australia | 231 | 0.3% |
| Bangladesh | 76 | 0.1% |
| Belarus | 19 | 0.0% |
| Belgium | 14 | 0.0% |
| Bolivia | 65 | 0.1% |
| Bosnia and Herzegovina | 134 | 0.2% |
| Brazil | 1,000 | 1.1% |
| Bulgaria | 83 | 0.1% |
| Cambodia | 213 | 0.2% |
| Canada | 1,191 | 1.3% |
| Caribbean | 76 | 0.1% |
| Central America | 1,949 | 2.1% |
| Chile | 34 | 0.0% |
| China | 3,807 | 4.1% |
| Colombia | 71 | 0.1% |
| Cuba | 28 | 0.0% |
| Czechoslovakia | 59 | 0.1% |
| Denmark | 13 | 0.0% |
| Eastern Africa | 157 | 0.2% |
| Eastern Asia | 5,199 | 5.7% |
| Eastern Europe | 2,159 | 2.4% |
| Ecuador | 44 | 0.1% |
| Egypt | 68 | 0.1% |
| El Salvador | 26 | 0.0% |
| England | 250 | 0.3% |
| Eritrea | 75 | 0.1% |
| Ethiopia | 23 | 0.0% |
| Europe | 4,196 | 4.6% |
| Fiji | 7 | 0.0% |
| France | 198 | 0.2% |
| Germany | 428 | 0.5% |
| Greece | 44 | 0.1% |
| Guatemala | 157 | 0.2% |
| Guyana | 20 | 0.0% |
| Hong Kong | 318 | 0.4% |
| Hungary | 23 | 0.0% |
| India | 2,831 | 3.1% |
| Indonesia | 42 | 0.1% |
| Iran | 986 | 1.1% |
| Iraq | 291 | 0.3% |
| Ireland | 82 | 0.1% |
| Israel | 55 | 0.1% |
| Italy | 76 | 0.1% |
| Jamaica | 26 | 0.0% |
| Japan | 566 | 0.6% |
| Jordan | 50 | 0.1% |
| Kazakhstan | 70 | 0.1% |
| Kenya | 41 | 0.0% |
| Korea | 826 | 0.9% |
| Kuwait | 38 | 0.0% |
| Laos | 189 | 0.2% |
| Latin America | 3,572 | 3.9% |
| Latvia | 75 | 0.1% |
| Lebanon | 50 | 0.1% |
| Malaysia | 23 | 0.0% |
| Mexico | 1,728 | 1.9% |
| Middle Africa | 9 | 0.0% |
| Moldova | 91 | 0.1% |
| Nepal | 190 | 0.2% |
| Netherlands | 63 | 0.1% |
| Nigeria | 9 | 0.0% |
| Northern Africa | 69 | 0.1% |
| Northern Europe | 1,141 | 1.2% |
| Norway | 5 | 0.0% |
| Oceania | 277 | 0.3% |
| Pakistan | 291 | 0.3% |
| Panama | 38 | 0.0% |
| Peru | 160 | 0.2% |
| Philippines | 395 | 0.4% |
| Poland | 97 | 0.1% |
| Romania | 526 | 0.6% |
| Russia | 563 | 0.6% |
| Saudi Arabia | 71 | 0.1% |
| Scotland | 46 | 0.1% |
| Serbia | 27 | 0.0% |
| Sierra Leone | 3 | 0.0% |
| Singapore | 97 | 0.1% |
| South Africa | 143 | 0.2% |
| South America | 1,547 | 1.7% |
| South Central Asia | 4,533 | 4.9% |
| South Eastern Asia | 2,065 | 2.2% |
| Southern Europe | 176 | 0.2% |
| Spain | 56 | 0.1% |
| Sweden | 189 | 0.2% |
| Switzerland | 17 | 0.0% |
| Syria | 21 | 0.0% |
| Taiwan | 650 | 0.7% |
| Thailand | 452 | 0.5% |
| Trinidad and Tobago | 14 | 0.0% |
| Turkey | 243 | 0.3% |
| Ukraine | 295 | 0.3% |
| Uzbekistan | 38 | 0.0% |
| Venezuela | 141 | 0.2% |
| Vietnam | 644 | 0.7% |
| Western Africa | 29 | 0.0% |
| Western Asia | 929 | 1.0% |
| Western Europe | 720 | 0.8% |
| Zaire | 9 | 0.0% | View All 103 Rows |
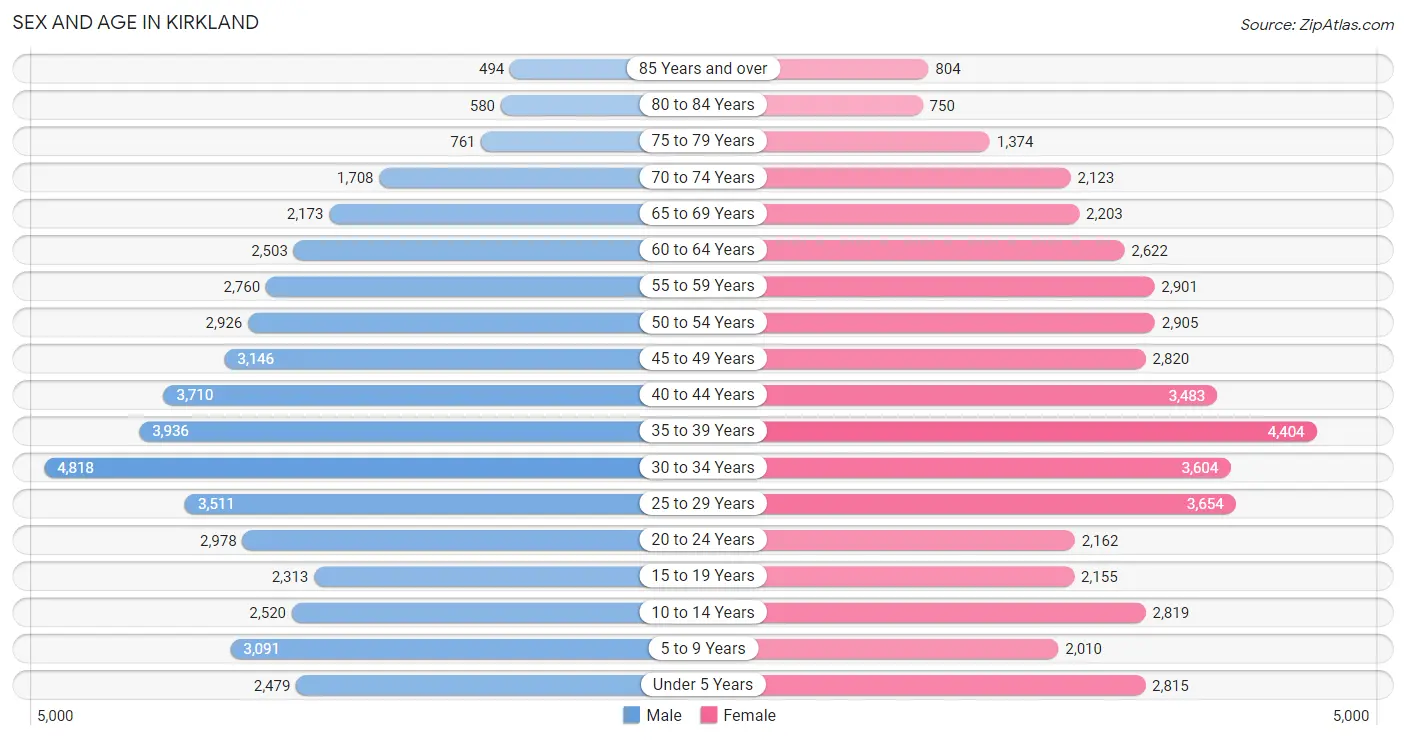
Sex and Age in Kirkland
Sex and Age in Kirkland
The most populous age groups in Kirkland are 30 to 34 Years (4,818 | 10.4%) for men and 35 to 39 Years (4,404 | 9.7%) for women.
| Age Bracket | Male | Female |
| Under 5 Years | 2,479 (5.3%) | 2,815 (6.2%) |
| 5 to 9 Years | 3,091 (6.7%) | 2,010 (4.4%) |
| 10 to 14 Years | 2,520 (5.4%) | 2,819 (6.2%) |
| 15 to 19 Years | 2,313 (5.0%) | 2,155 (4.7%) |
| 20 to 24 Years | 2,978 (6.4%) | 2,162 (4.7%) |
| 25 to 29 Years | 3,511 (7.6%) | 3,654 (8.0%) |
| 30 to 34 Years | 4,818 (10.4%) | 3,604 (7.9%) |
| 35 to 39 Years | 3,936 (8.5%) | 4,404 (9.7%) |
| 40 to 44 Years | 3,710 (8.0%) | 3,483 (7.6%) |
| 45 to 49 Years | 3,146 (6.8%) | 2,820 (6.2%) |
| 50 to 54 Years | 2,926 (6.3%) | 2,905 (6.4%) |
| 55 to 59 Years | 2,760 (5.9%) | 2,901 (6.4%) |
| 60 to 64 Years | 2,503 (5.4%) | 2,622 (5.8%) |
| 65 to 69 Years | 2,173 (4.7%) | 2,203 (4.8%) |
| 70 to 74 Years | 1,708 (3.7%) | 2,123 (4.6%) |
| 75 to 79 Years | 761 (1.6%) | 1,374 (3.0%) |
| 80 to 84 Years | 580 (1.3%) | 750 (1.6%) |
| 85 Years and over | 494 (1.1%) | 804 (1.8%) |
| Total | 46,407 (100.0%) | 45,608 (100.0%) |
Families and Households in Kirkland
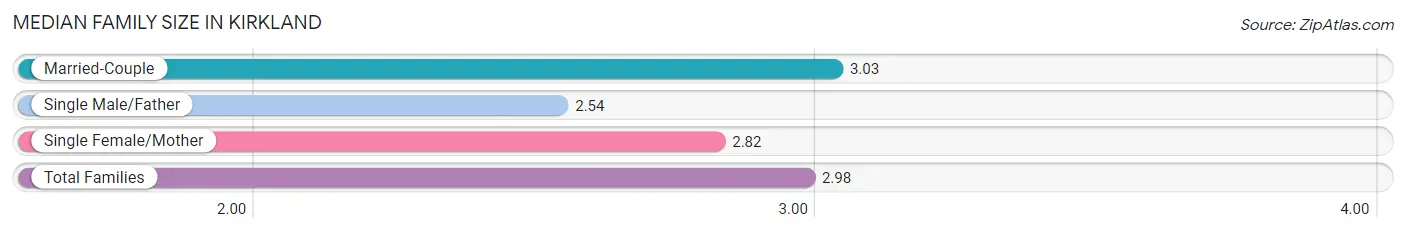
Median Family Size in Kirkland
The median family size in Kirkland is 2.98 persons per family, with married-couple families (19,309 | 82.7%) accounting for the largest median family size of 3.03 persons per family. On the other hand, single male/father families (1,407 | 6.0%) represent the smallest median family size with 2.54 persons per family.
| Family Type | # Families | Family Size |
| Married-Couple | 19,309 (82.7%) | 3.03 |
| Single Male/Father | 1,407 (6.0%) | 2.54 |
| Single Female/Mother | 2,629 (11.3%) | 2.82 |
| Total Families | 23,345 (100.0%) | 2.98 |
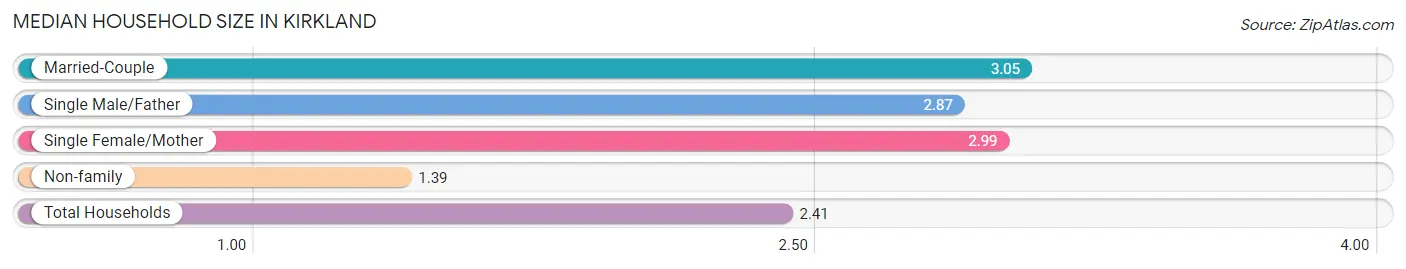
Median Household Size in Kirkland
The median household size in Kirkland is 2.41 persons per household, with married-couple households (19,309 | 51.4%) accounting for the largest median household size of 3.05 persons per household. non-family households (14,201 | 37.8%) represent the smallest median household size with 1.39 persons per household.
| Household Type | # Households | Household Size |
| Married-Couple | 19,309 (51.4%) | 3.05 |
| Single Male/Father | 1,407 (3.7%) | 2.87 |
| Single Female/Mother | 2,629 (7.0%) | 2.99 |
| Non-family | 14,201 (37.8%) | 1.39 |
| Total Households | 37,546 (100.0%) | 2.41 |
Household Size by Marriage Status in Kirkland
Out of a total of 37,546 households in Kirkland, 23,345 (62.2%) are family households, while 14,201 (37.8%) are nonfamily households. The most numerous type of family households are 2-person households, comprising 10,213, and the most common type of nonfamily households are 1-person households, comprising 10,220.
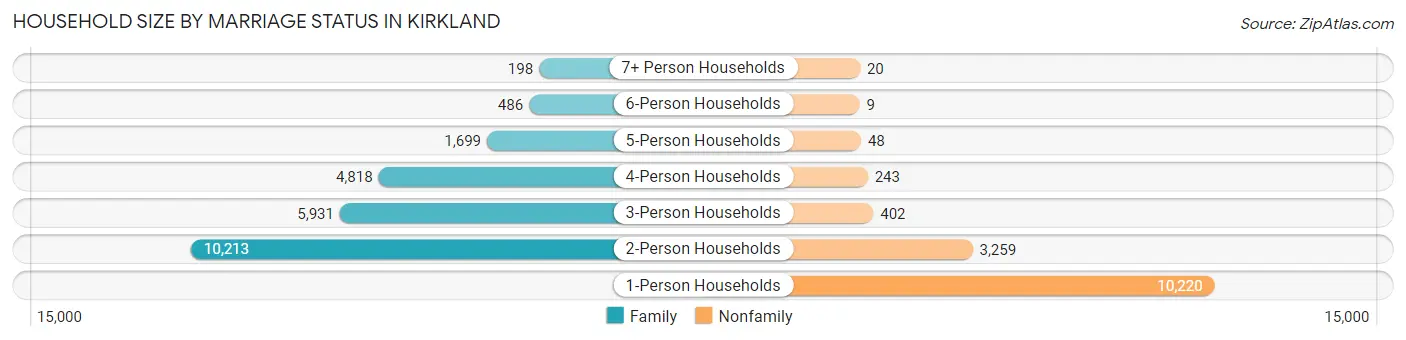
| Household Size | Family Households | Nonfamily Households |
| 1-Person Households | - | 10,220 (27.2%) |
| 2-Person Households | 10,213 (27.2%) | 3,259 (8.7%) |
| 3-Person Households | 5,931 (15.8%) | 402 (1.1%) |
| 4-Person Households | 4,818 (12.8%) | 243 (0.6%) |
| 5-Person Households | 1,699 (4.5%) | 48 (0.1%) |
| 6-Person Households | 486 (1.3%) | 9 (0.0%) |
| 7+ Person Households | 198 (0.5%) | 20 (0.1%) |
| Total | 23,345 (62.2%) | 14,201 (37.8%) |
Female Fertility in Kirkland
Fertility by Age in Kirkland
Average fertility rate in Kirkland is 48.0 births per 1,000 women. Women in the age bracket of 35 to 50 years have the highest fertility rate with 56.0 births per 1,000 women. Women in the age bracket of 35 to 50 years acount for 57.0% of all women with births.
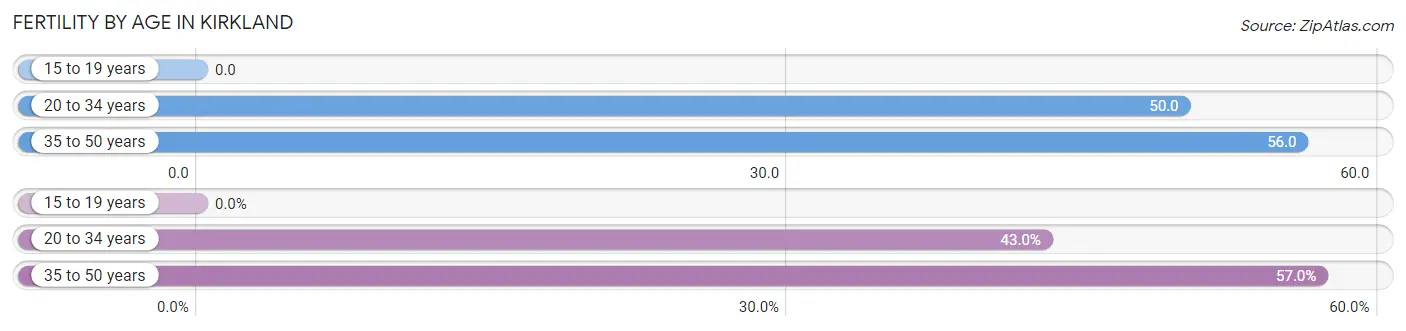
| Age Bracket | Women with Births | Births / 1,000 Women |
| 15 to 19 years | 0 (0.0%) | 0.0 |
| 20 to 34 years | 469 (43.0%) | 50.0 |
| 35 to 50 years | 622 (57.0%) | 56.0 |
| Total | 1,091 (100.0%) | 48.0 |
Fertility by Age by Marriage Status in Kirkland
91.7% of women with births (1,091) in Kirkland are married. The highest percentage of unmarried women with births falls into 35 to 50 years age bracket with 13.8% of them unmarried at the time of birth, while the lowest percentage of unmarried women with births belong to 20 to 34 years age bracket with 1.1% of them unmarried.
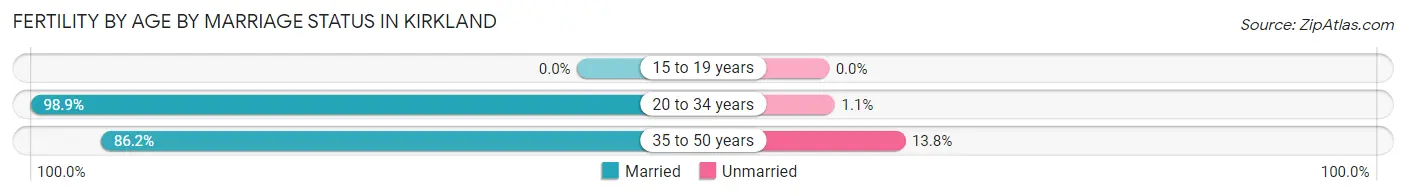
| Age Bracket | Married | Unmarried |
| 15 to 19 years | 0 (0.0%) | 0 (0.0%) |
| 20 to 34 years | 464 (98.9%) | 5 (1.1%) |
| 35 to 50 years | 536 (86.2%) | 86 (13.8%) |
| Total | 1,000 (91.7%) | 91 (8.3%) |
Fertility by Education in Kirkland
Average fertility rate in Kirkland is 48.0 births per 1,000 women. Women with the education attainment of graduate degree have the highest fertility rate of 71.0 births per 1,000 women, while women with the education attainment of less than high school have the lowest fertility at 9.0 births per 1,000 women. Women with the education attainment of bachelor's degree represent 48.1% of all women with births.
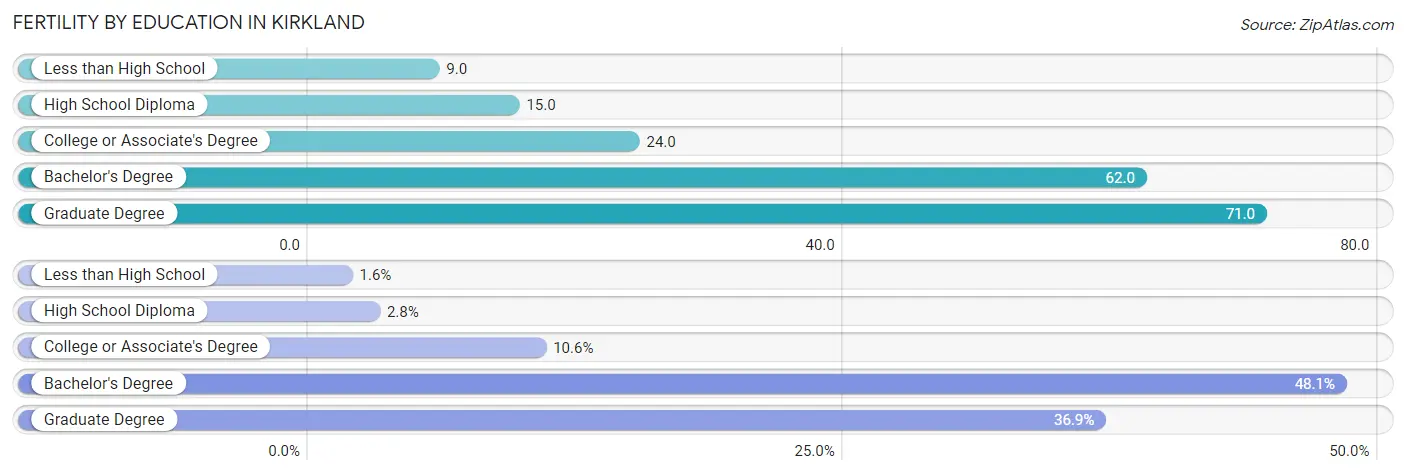
| Educational Attainment | Women with Births | Births / 1,000 Women |
| Less than High School | 17 (1.6%) | 9.0 |
| High School Diploma | 31 (2.8%) | 15.0 |
| College or Associate's Degree | 116 (10.6%) | 24.0 |
| Bachelor's Degree | 525 (48.1%) | 62.0 |
| Graduate Degree | 402 (36.8%) | 71.0 |
| Total | 1,091 (100.0%) | 48.0 |
Fertility by Education by Marriage Status in Kirkland
8.3% of women with births in Kirkland are unmarried. Women with the educational attainment of college or associate's degree are most likely to be married with 99.1% of them married at childbirth, while women with the educational attainment of high school diploma are least likely to be married with 64.5% of them unmarried at childbirth.
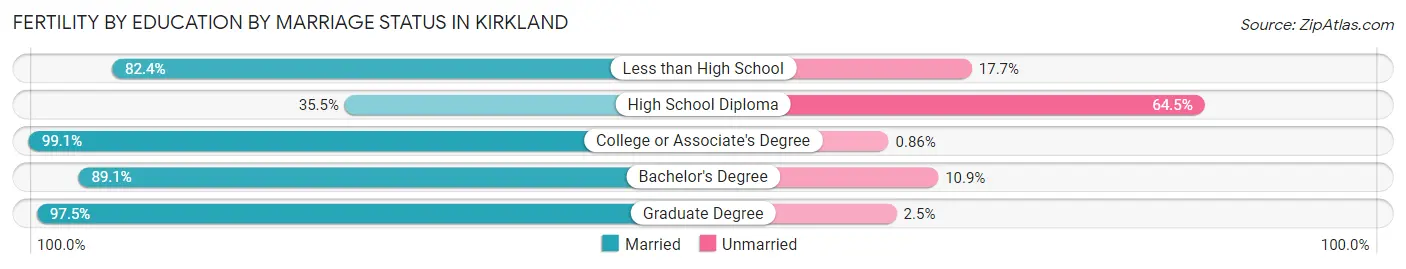
| Educational Attainment | Married | Unmarried |
| Less than High School | 14 (82.4%) | 3 (17.6%) |
| High School Diploma | 11 (35.5%) | 20 (64.5%) |
| College or Associate's Degree | 115 (99.1%) | 1 (0.9%) |
| Bachelor's Degree | 468 (89.1%) | 57 (10.9%) |
| Graduate Degree | 392 (97.5%) | 10 (2.5%) |
| Total | 1,000 (91.7%) | 91 (8.3%) |
Employment Characteristics in Kirkland
Employment by Class of Employer in Kirkland
Among the 49,560 employed individuals in Kirkland, private company employees (37,994 | 76.7%), self-employed (not incorporated) (2,937 | 5.9%), and not-for-profit organizations (2,868 | 5.8%) make up the most common classes of employment.
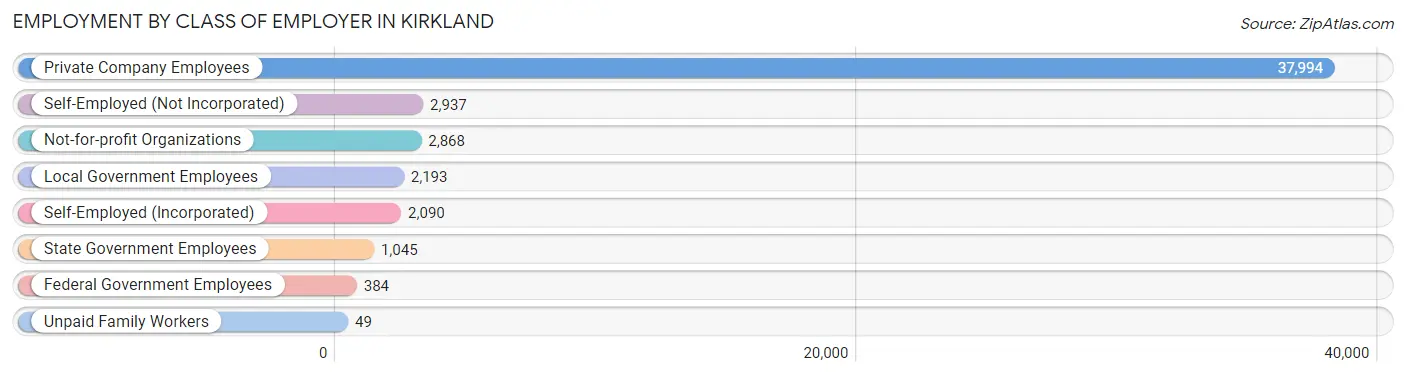
| Employer Class | # Employees | % Employees |
| Private Company Employees | 37,994 | 76.7% |
| Self-Employed (Incorporated) | 2,090 | 4.2% |
| Self-Employed (Not Incorporated) | 2,937 | 5.9% |
| Not-for-profit Organizations | 2,868 | 5.8% |
| Local Government Employees | 2,193 | 4.4% |
| State Government Employees | 1,045 | 2.1% |
| Federal Government Employees | 384 | 0.8% |
| Unpaid Family Workers | 49 | 0.1% |
| Total | 49,560 | 100.0% |
Employment Status by Age in Kirkland
According to the labor force statistics for Kirkland, out of the total population over 16 years of age (75,351), 70.6% or 53,198 individuals are in the labor force, with 4.7% or 2,500 of them unemployed. The age group with the highest labor force participation rate is 25 to 29 years, with 90.3% or 6,470 individuals in the labor force. Within the labor force, the 16 to 19 years age range has the highest percentage of unemployed individuals, with 19.8% or 280 of them being unemployed.
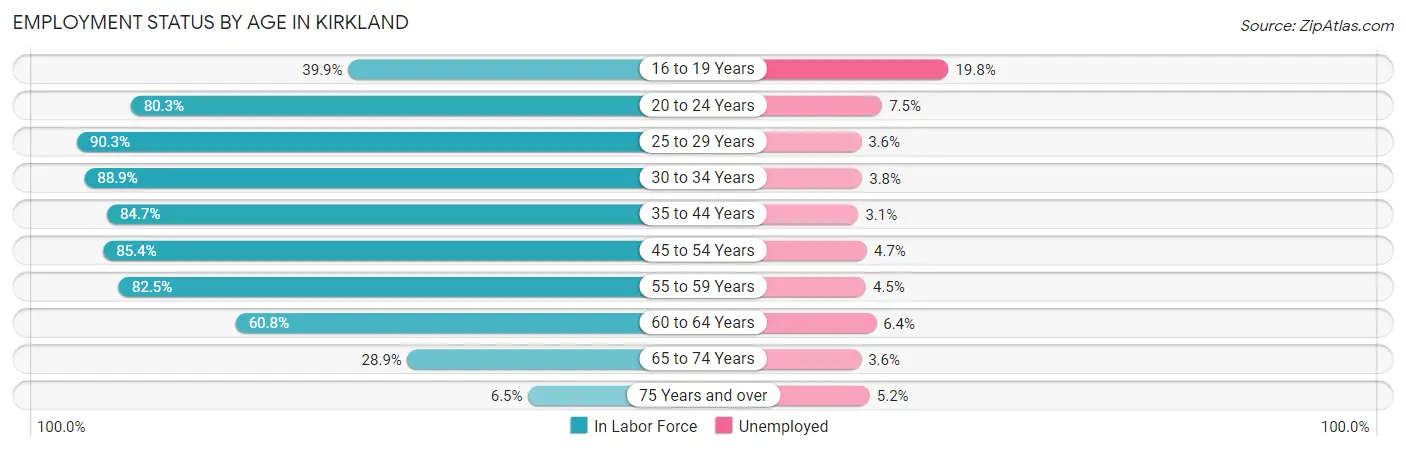
| Age Bracket | In Labor Force | Unemployed |
| 16 to 19 Years | 1,412 (39.9%) | 280 (19.8%) |
| 20 to 24 Years | 4,127 (80.3%) | 310 (7.5%) |
| 25 to 29 Years | 6,470 (90.3%) | 233 (3.6%) |
| 30 to 34 Years | 7,487 (88.9%) | 285 (3.8%) |
| 35 to 44 Years | 13,156 (84.7%) | 408 (3.1%) |
| 45 to 54 Years | 10,075 (85.4%) | 474 (4.7%) |
| 55 to 59 Years | 4,670 (82.5%) | 210 (4.5%) |
| 60 to 64 Years | 3,116 (60.8%) | 199 (6.4%) |
| 65 to 74 Years | 2,372 (28.9%) | 85 (3.6%) |
| 75 Years and over | 310 (6.5%) | 16 (5.2%) |
| Total | 53,198 (70.6%) | 2,500 (4.7%) |
Employment Status by Educational Attainment in Kirkland
According to labor force statistics for Kirkland, 83.8% of individuals (45,003) out of the total population between 25 and 64 years of age (53,703) are in the labor force, with 4.0% or 1,800 of them being unemployed. The group with the highest labor force participation rate are those with the educational attainment of bachelor's degree or higher, with 86.2% or 30,818 individuals in the labor force. Within the labor force, individuals with less than high school education have the highest percentage of unemployment, with 12.3% or 117 of them being unemployed.
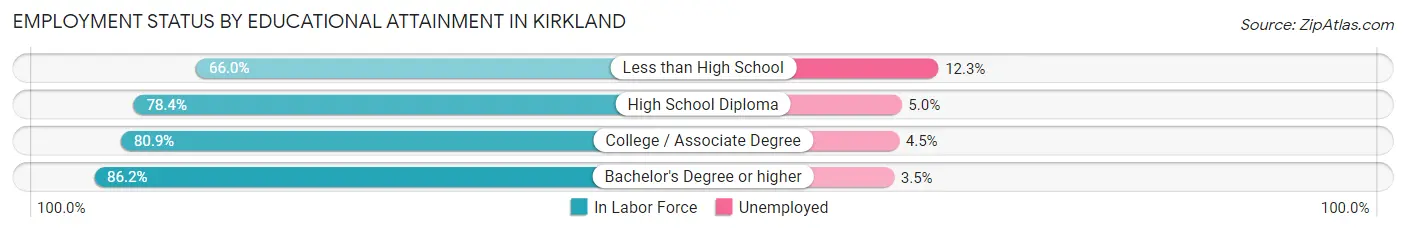
| Educational Attainment | In Labor Force | Unemployed |
| Less than High School | 952 (66.0%) | 177 (12.3%) |
| High School Diploma | 4,362 (78.4%) | 278 (5.0%) |
| College / Associate Degree | 8,855 (80.9%) | 493 (4.5%) |
| Bachelor's Degree or higher | 30,818 (86.2%) | 1,251 (3.5%) |
| Total | 45,003 (83.8%) | 2,148 (4.0%) |
Employment Occupations by Sex in Kirkland
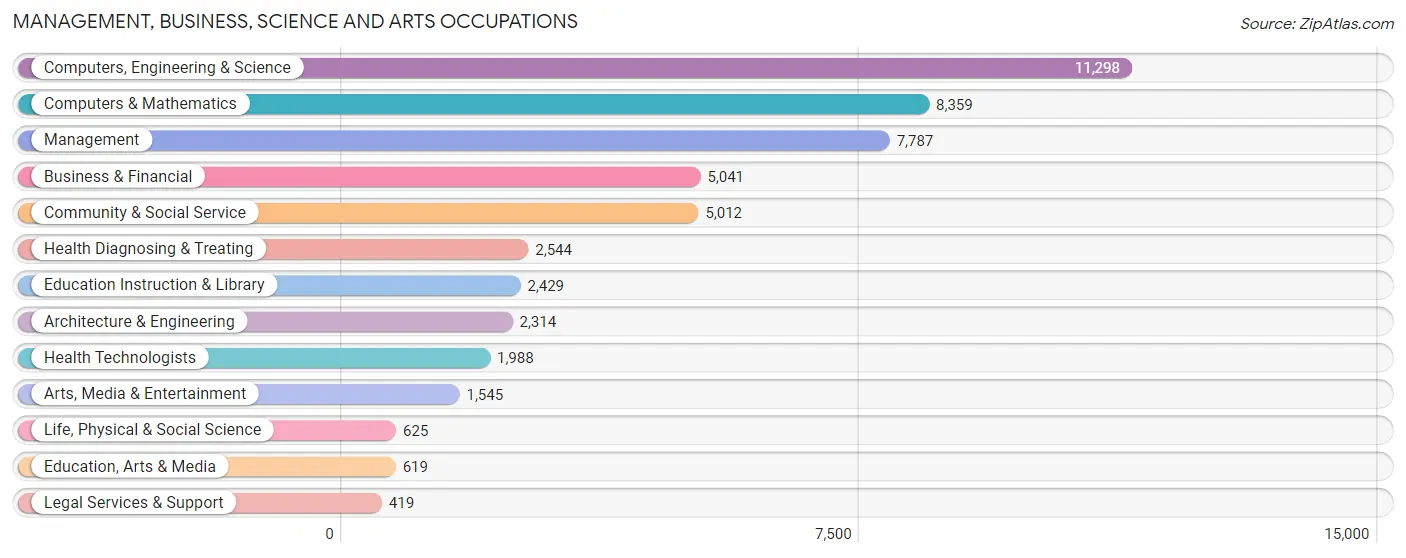
Management, Business, Science and Arts Occupations
The most common Management, Business, Science and Arts occupations in Kirkland are Computers, Engineering & Science (11,298 | 22.3%), Computers & Mathematics (8,359 | 16.5%), Management (7,787 | 15.4%), Business & Financial (5,041 | 9.9%), and Community & Social Service (5,012 | 9.9%).
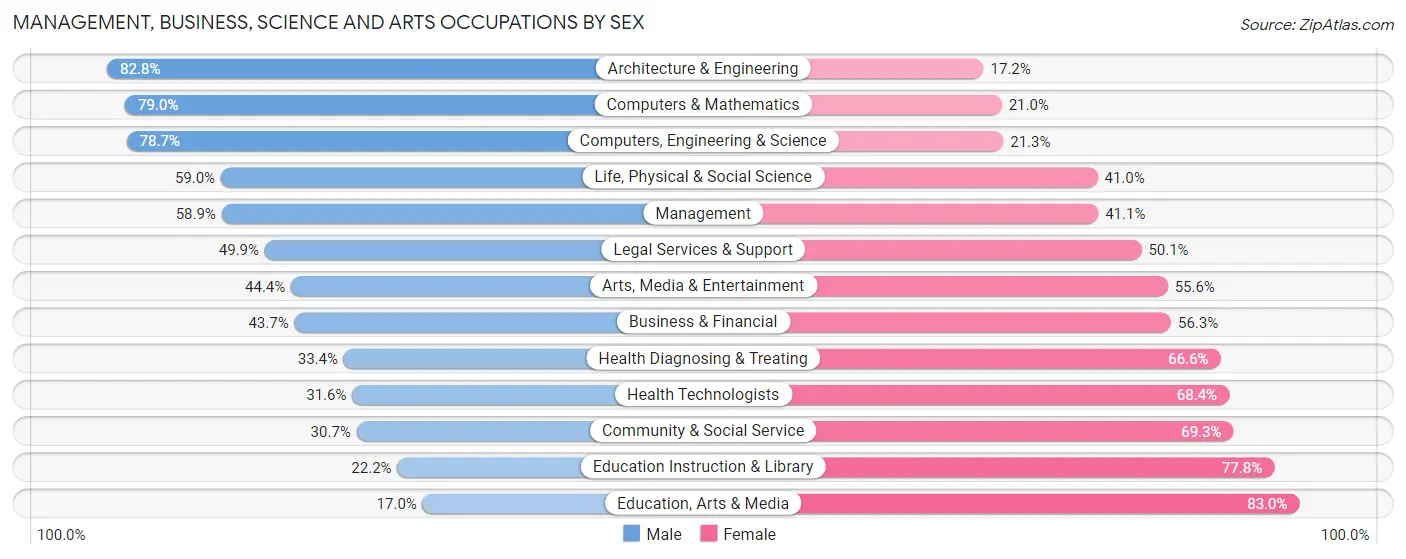
Management, Business, Science and Arts Occupations by Sex
Within the Management, Business, Science and Arts occupations in Kirkland, the most male-oriented occupations are Architecture & Engineering (82.8%), Computers & Mathematics (79.0%), and Computers, Engineering & Science (78.7%), while the most female-oriented occupations are Education, Arts & Media (83.0%), Education Instruction & Library (77.8%), and Community & Social Service (69.3%).
| Occupation | Male | Female |
| Management | 4,586 (58.9%) | 3,201 (41.1%) |
| Business & Financial | 2,203 (43.7%) | 2,838 (56.3%) |
| Computers, Engineering & Science | 8,891 (78.7%) | 2,407 (21.3%) |
| Computers & Mathematics | 6,606 (79.0%) | 1,753 (21.0%) |
| Architecture & Engineering | 1,916 (82.8%) | 398 (17.2%) |
| Life, Physical & Social Science | 369 (59.0%) | 256 (41.0%) |
| Community & Social Service | 1,540 (30.7%) | 3,472 (69.3%) |
| Education, Arts & Media | 105 (17.0%) | 514 (83.0%) |
| Legal Services & Support | 209 (49.9%) | 210 (50.1%) |
| Education Instruction & Library | 540 (22.2%) | 1,889 (77.8%) |
| Arts, Media & Entertainment | 686 (44.4%) | 859 (55.6%) |
| Health Diagnosing & Treating | 850 (33.4%) | 1,694 (66.6%) |
| Health Technologists | 629 (31.6%) | 1,359 (68.4%) |
| Total (Category) | 18,070 (57.0%) | 13,612 (43.0%) |
| Total (Overall) | 28,121 (55.5%) | 22,573 (44.5%) |
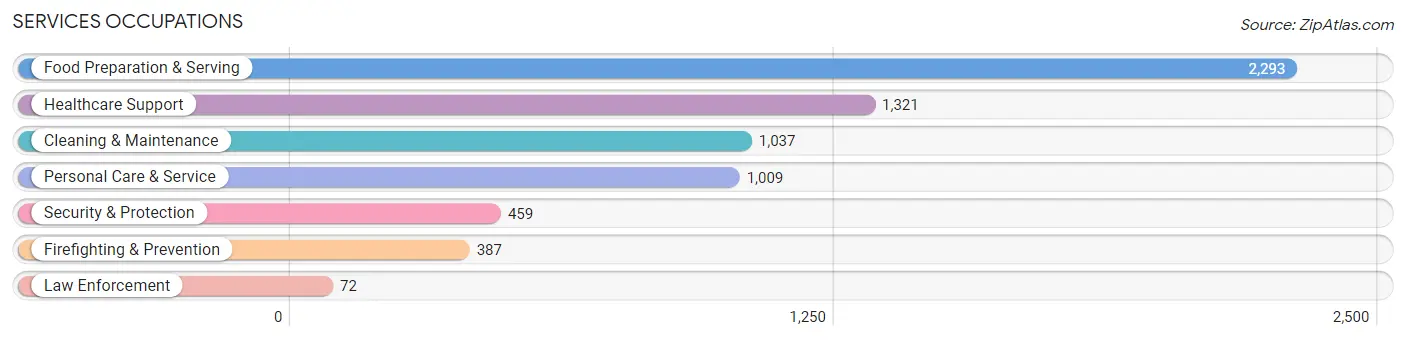
Services Occupations
The most common Services occupations in Kirkland are Food Preparation & Serving (2,293 | 4.5%), Healthcare Support (1,321 | 2.6%), Cleaning & Maintenance (1,037 | 2.1%), Personal Care & Service (1,009 | 2.0%), and Security & Protection (459 | 0.9%).
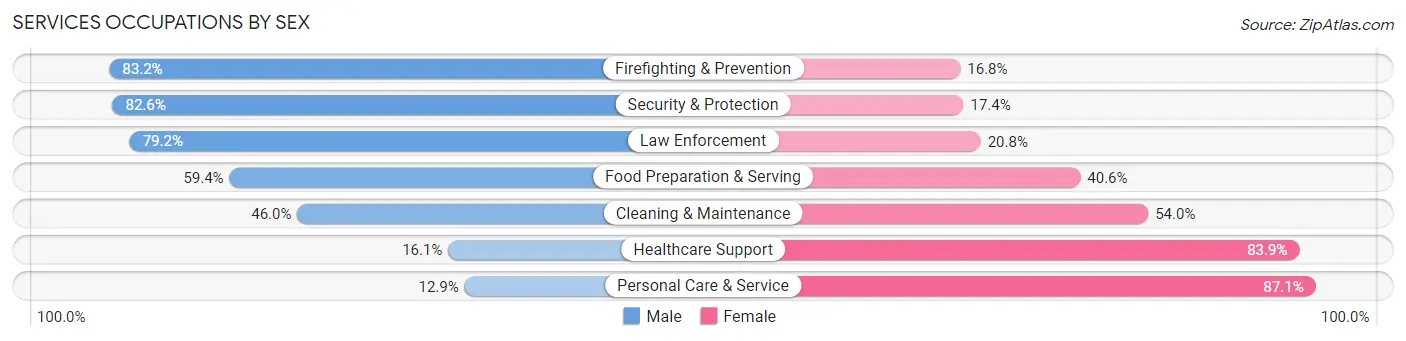
Services Occupations by Sex
Within the Services occupations in Kirkland, the most male-oriented occupations are Firefighting & Prevention (83.2%), Security & Protection (82.6%), and Law Enforcement (79.2%), while the most female-oriented occupations are Personal Care & Service (87.1%), Healthcare Support (83.9%), and Cleaning & Maintenance (54.0%).
| Occupation | Male | Female |
| Healthcare Support | 213 (16.1%) | 1,108 (83.9%) |
| Security & Protection | 379 (82.6%) | 80 (17.4%) |
| Firefighting & Prevention | 322 (83.2%) | 65 (16.8%) |
| Law Enforcement | 57 (79.2%) | 15 (20.8%) |
| Food Preparation & Serving | 1,363 (59.4%) | 930 (40.6%) |
| Cleaning & Maintenance | 477 (46.0%) | 560 (54.0%) |
| Personal Care & Service | 130 (12.9%) | 879 (87.1%) |
| Total (Category) | 2,562 (41.9%) | 3,557 (58.1%) |
| Total (Overall) | 28,121 (55.5%) | 22,573 (44.5%) |
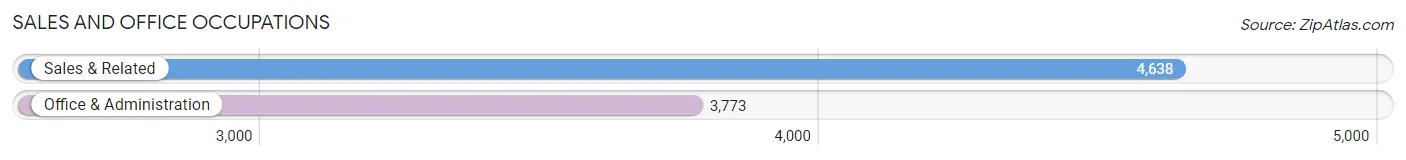
Sales and Office Occupations
The most common Sales and Office occupations in Kirkland are Sales & Related (4,638 | 9.1%), and Office & Administration (3,773 | 7.4%).
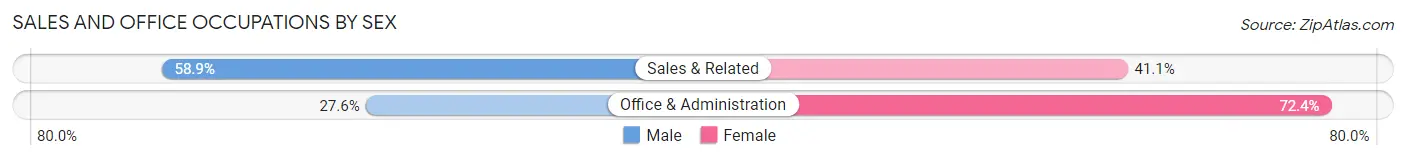
Sales and Office Occupations by Sex
| Occupation | Male | Female |
| Sales & Related | 2,733 (58.9%) | 1,905 (41.1%) |
| Office & Administration | 1,040 (27.6%) | 2,733 (72.4%) |
| Total (Category) | 3,773 (44.9%) | 4,638 (55.1%) |
| Total (Overall) | 28,121 (55.5%) | 22,573 (44.5%) |
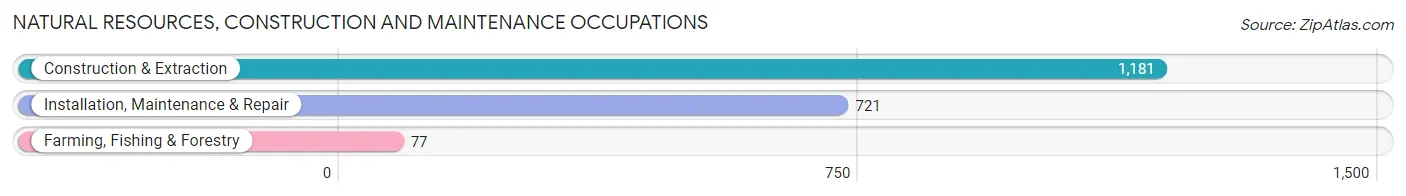
Natural Resources, Construction and Maintenance Occupations
The most common Natural Resources, Construction and Maintenance occupations in Kirkland are Construction & Extraction (1,181 | 2.3%), Installation, Maintenance & Repair (721 | 1.4%), and Farming, Fishing & Forestry (77 | 0.2%).
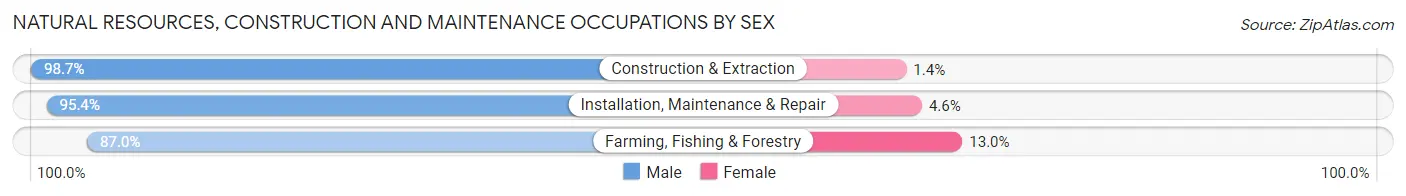
Natural Resources, Construction and Maintenance Occupations by Sex
| Occupation | Male | Female |
| Farming, Fishing & Forestry | 67 (87.0%) | 10 (13.0%) |
| Construction & Extraction | 1,165 (98.7%) | 16 (1.3%) |
| Installation, Maintenance & Repair | 688 (95.4%) | 33 (4.6%) |
| Total (Category) | 1,920 (97.0%) | 59 (3.0%) |
| Total (Overall) | 28,121 (55.5%) | 22,573 (44.5%) |
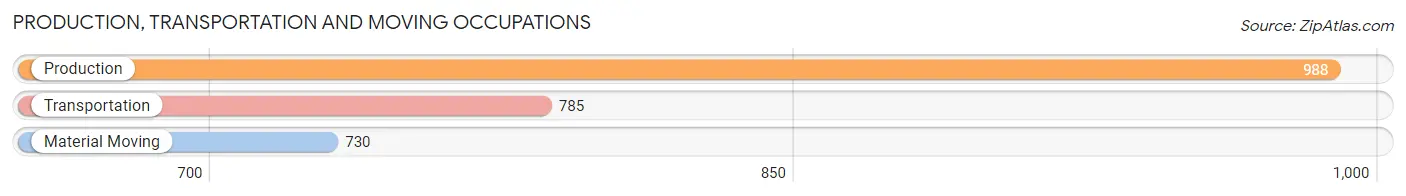
Production, Transportation and Moving Occupations
The most common Production, Transportation and Moving occupations in Kirkland are Production (988 | 1.9%), Transportation (785 | 1.5%), and Material Moving (730 | 1.4%).
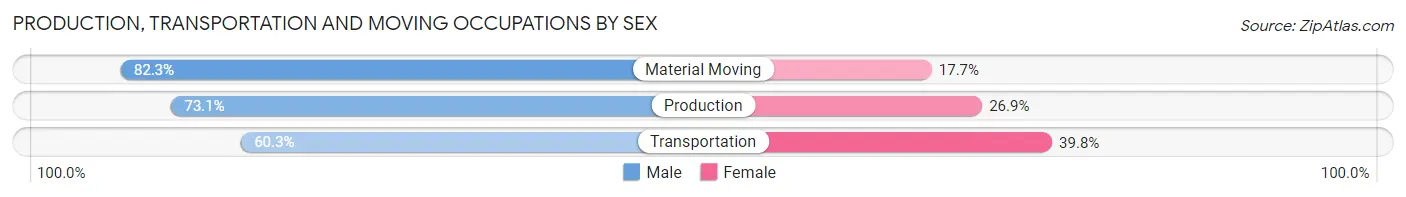
Production, Transportation and Moving Occupations by Sex
| Occupation | Male | Female |
| Production | 722 (73.1%) | 266 (26.9%) |
| Transportation | 473 (60.3%) | 312 (39.8%) |
| Material Moving | 601 (82.3%) | 129 (17.7%) |
| Total (Category) | 1,796 (71.8%) | 707 (28.2%) |
| Total (Overall) | 28,121 (55.5%) | 22,573 (44.5%) |
Employment Industries by Sex in Kirkland
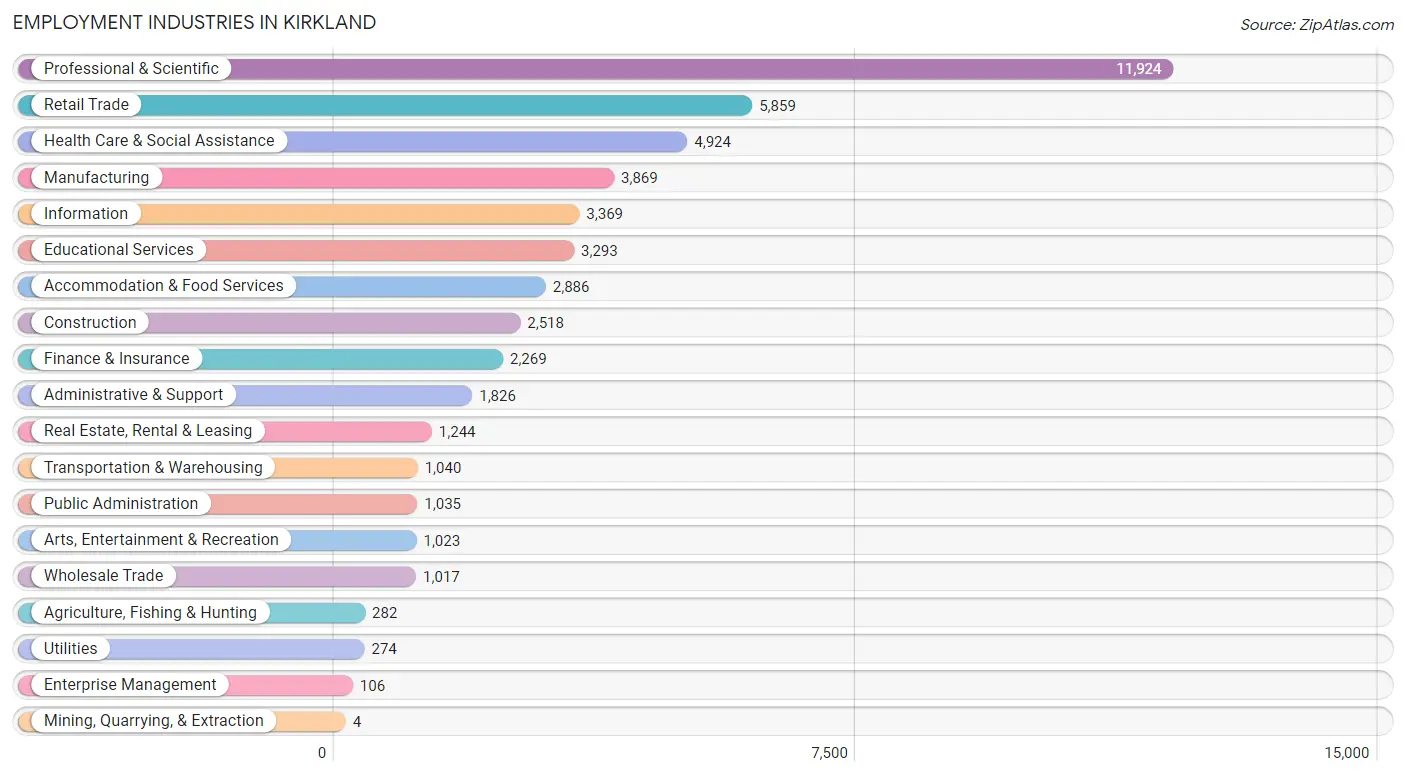
Employment Industries in Kirkland
The major employment industries in Kirkland include Professional & Scientific (11,924 | 23.5%), Retail Trade (5,859 | 11.6%), Health Care & Social Assistance (4,924 | 9.7%), Manufacturing (3,869 | 7.6%), and Information (3,369 | 6.7%).
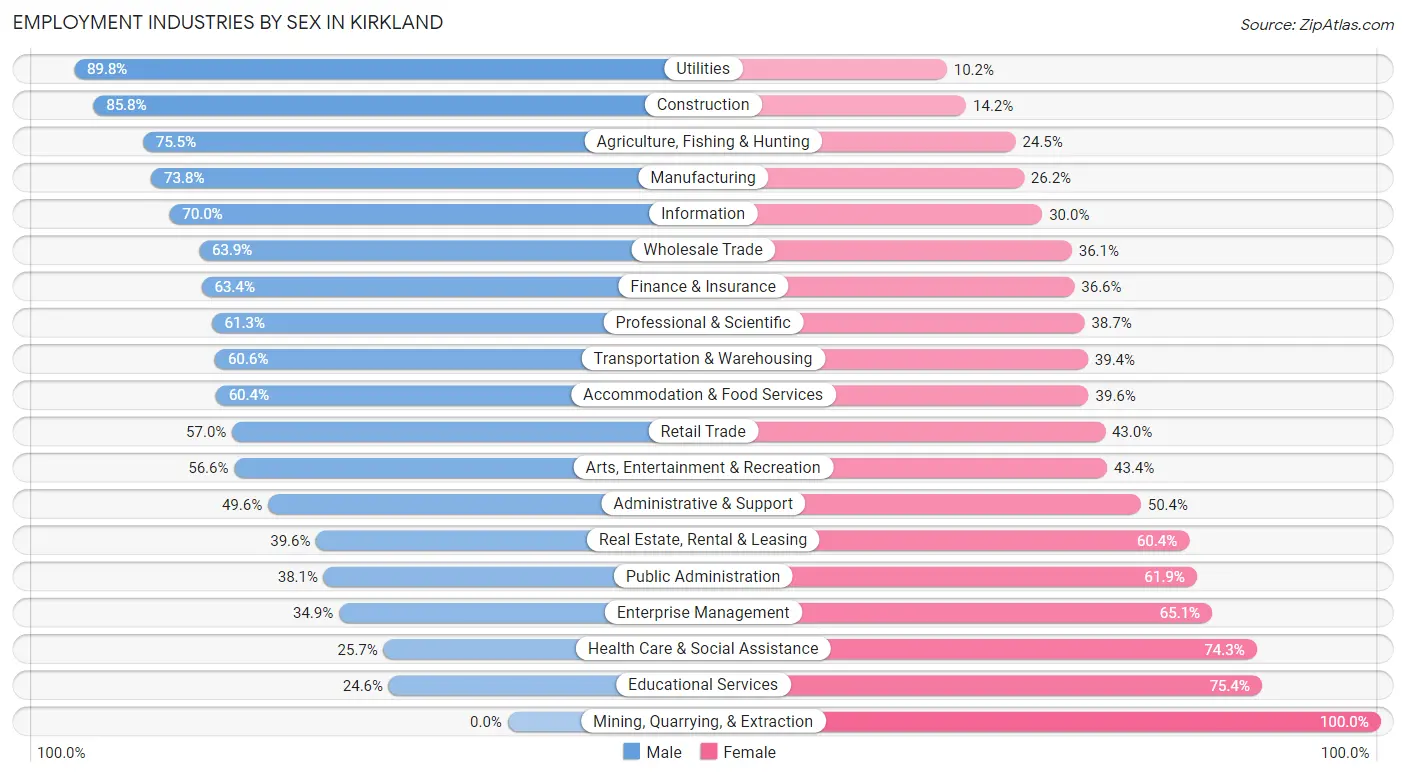
Employment Industries by Sex in Kirkland
The Kirkland industries that see more men than women are Utilities (89.8%), Construction (85.8%), and Agriculture, Fishing & Hunting (75.5%), whereas the industries that tend to have a higher number of women are Mining, Quarrying, & Extraction (100.0%), Educational Services (75.4%), and Health Care & Social Assistance (74.3%).
| Industry | Male | Female |
| Agriculture, Fishing & Hunting | 213 (75.5%) | 69 (24.5%) |
| Mining, Quarrying, & Extraction | 0 (0.0%) | 4 (100.0%) |
| Construction | 2,160 (85.8%) | 358 (14.2%) |
| Manufacturing | 2,856 (73.8%) | 1,013 (26.2%) |
| Wholesale Trade | 650 (63.9%) | 367 (36.1%) |
| Retail Trade | 3,342 (57.0%) | 2,517 (43.0%) |
| Transportation & Warehousing | 630 (60.6%) | 410 (39.4%) |
| Utilities | 246 (89.8%) | 28 (10.2%) |
| Information | 2,359 (70.0%) | 1,010 (30.0%) |
| Finance & Insurance | 1,438 (63.4%) | 831 (36.6%) |
| Real Estate, Rental & Leasing | 493 (39.6%) | 751 (60.4%) |
| Professional & Scientific | 7,307 (61.3%) | 4,617 (38.7%) |
| Enterprise Management | 37 (34.9%) | 69 (65.1%) |
| Administrative & Support | 906 (49.6%) | 920 (50.4%) |
| Educational Services | 810 (24.6%) | 2,483 (75.4%) |
| Health Care & Social Assistance | 1,265 (25.7%) | 3,659 (74.3%) |
| Arts, Entertainment & Recreation | 579 (56.6%) | 444 (43.4%) |
| Accommodation & Food Services | 1,744 (60.4%) | 1,142 (39.6%) |
| Public Administration | 394 (38.1%) | 641 (61.9%) |
| Total | 28,121 (55.5%) | 22,573 (44.5%) |
Education in Kirkland
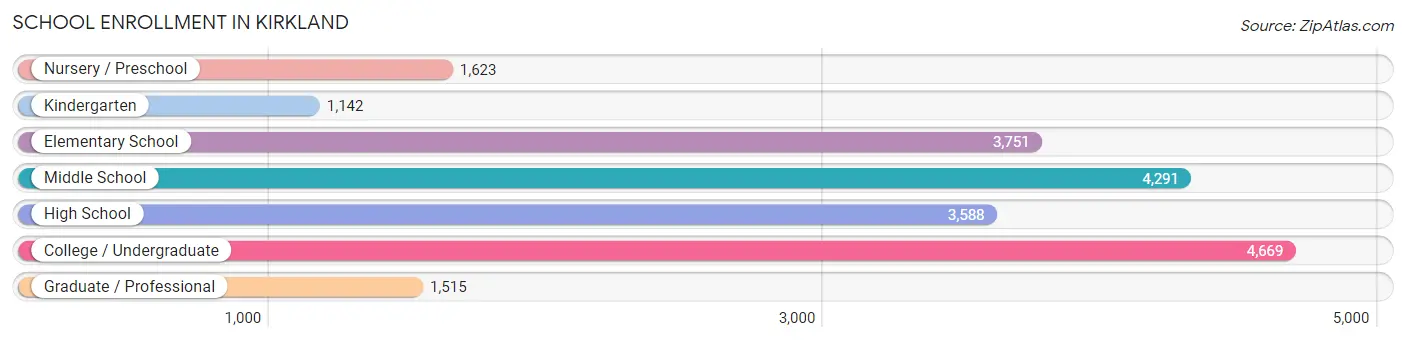
School Enrollment in Kirkland
The most common levels of schooling among the 20,579 students in Kirkland are college / undergraduate (4,669 | 22.7%), middle school (4,291 | 20.8%), and elementary school (3,751 | 18.2%).
| School Level | # Students | % Students |
| Nursery / Preschool | 1,623 | 7.9% |
| Kindergarten | 1,142 | 5.6% |
| Elementary School | 3,751 | 18.2% |
| Middle School | 4,291 | 20.8% |
| High School | 3,588 | 17.4% |
| College / Undergraduate | 4,669 | 22.7% |
| Graduate / Professional | 1,515 | 7.4% |
| Total | 20,579 | 100.0% |
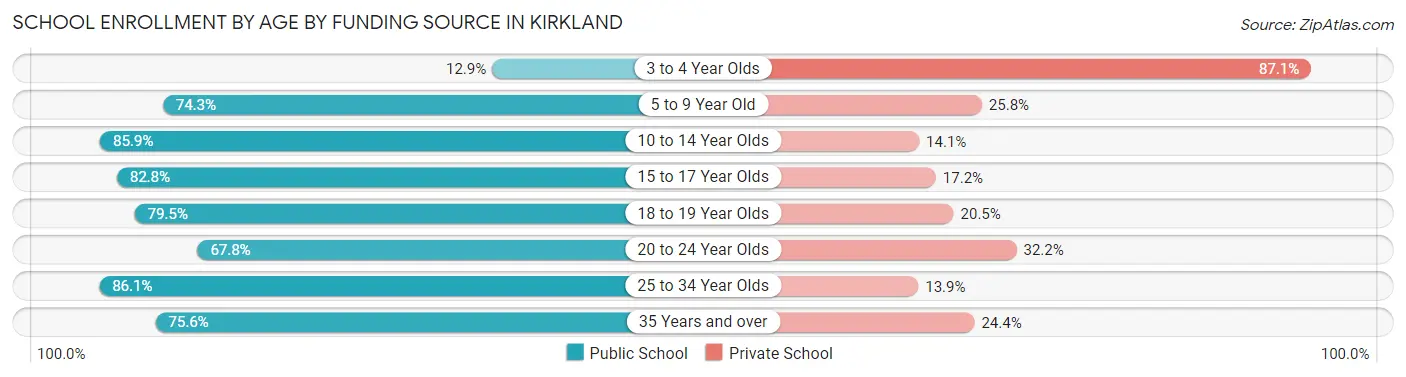
School Enrollment by Age by Funding Source in Kirkland
Out of a total of 20,579 students who are enrolled in schools in Kirkland, 5,104 (24.8%) attend a private institution, while the remaining 15,475 (75.2%) are enrolled in public schools. The age group of 3 to 4 year olds has the highest likelihood of being enrolled in private schools, with 1,130 (87.1% in the age bracket) enrolled. Conversely, the age group of 25 to 34 year olds has the lowest likelihood of being enrolled in a private school, with 1,381 (86.1% in the age bracket) attending a public institution.
| Age Bracket | Public School | Private School |
| 3 to 4 Year Olds | 168 (12.9%) | 1,130 (87.1%) |
| 5 to 9 Year Old | 3,510 (74.3%) | 1,217 (25.8%) |
| 10 to 14 Year Olds | 4,517 (85.9%) | 739 (14.1%) |
| 15 to 17 Year Olds | 2,194 (82.8%) | 455 (17.2%) |
| 18 to 19 Year Olds | 1,196 (79.5%) | 308 (20.5%) |
| 20 to 24 Year Olds | 1,480 (67.8%) | 703 (32.2%) |
| 25 to 34 Year Olds | 1,381 (86.1%) | 223 (13.9%) |
| 35 Years and over | 1,027 (75.6%) | 331 (24.4%) |
| Total | 15,475 (75.2%) | 5,104 (24.8%) |
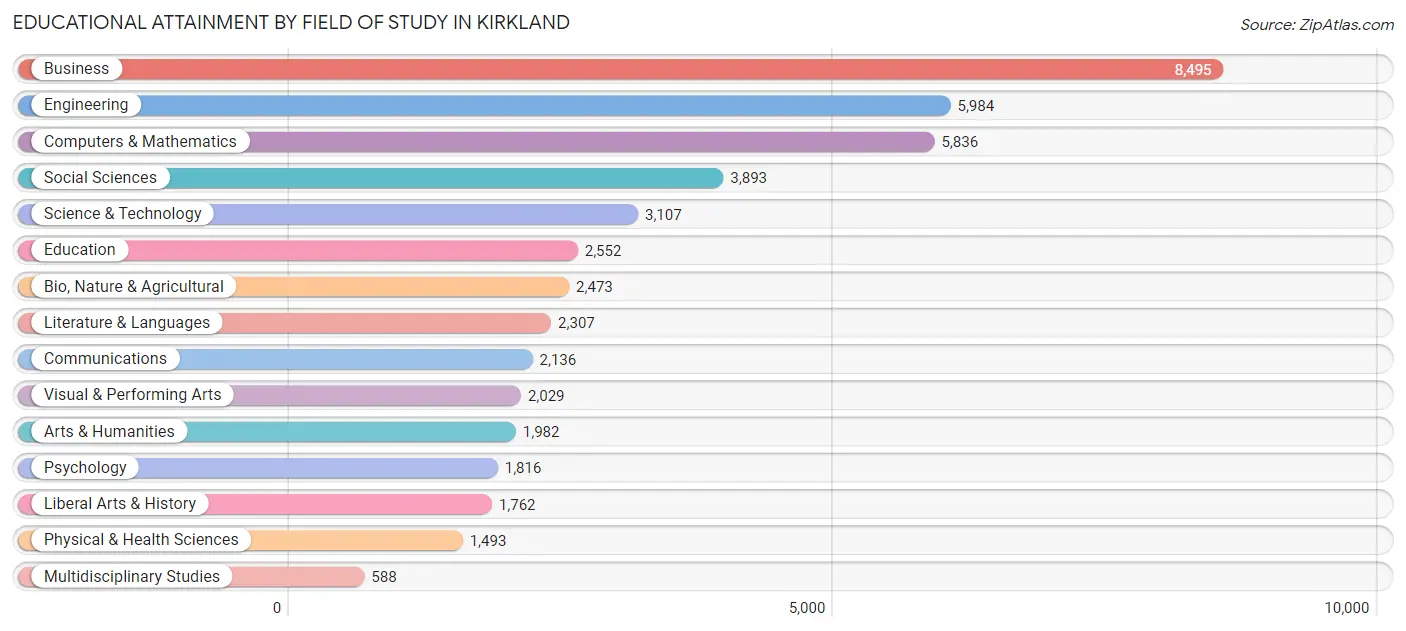
Educational Attainment by Field of Study in Kirkland
Business (8,495 | 18.3%), engineering (5,984 | 12.9%), computers & mathematics (5,836 | 12.6%), social sciences (3,893 | 8.4%), and science & technology (3,107 | 6.7%) are the most common fields of study among 46,453 individuals in Kirkland who have obtained a bachelor's degree or higher.
| Field of Study | # Graduates | % Graduates |
| Computers & Mathematics | 5,836 | 12.6% |
| Bio, Nature & Agricultural | 2,473 | 5.3% |
| Physical & Health Sciences | 1,493 | 3.2% |
| Psychology | 1,816 | 3.9% |
| Social Sciences | 3,893 | 8.4% |
| Engineering | 5,984 | 12.9% |
| Multidisciplinary Studies | 588 | 1.3% |
| Science & Technology | 3,107 | 6.7% |
| Business | 8,495 | 18.3% |
| Education | 2,552 | 5.5% |
| Literature & Languages | 2,307 | 5.0% |
| Liberal Arts & History | 1,762 | 3.8% |
| Visual & Performing Arts | 2,029 | 4.4% |
| Communications | 2,136 | 4.6% |
| Arts & Humanities | 1,982 | 4.3% |
| Total | 46,453 | 100.0% |
Transportation & Commute in Kirkland
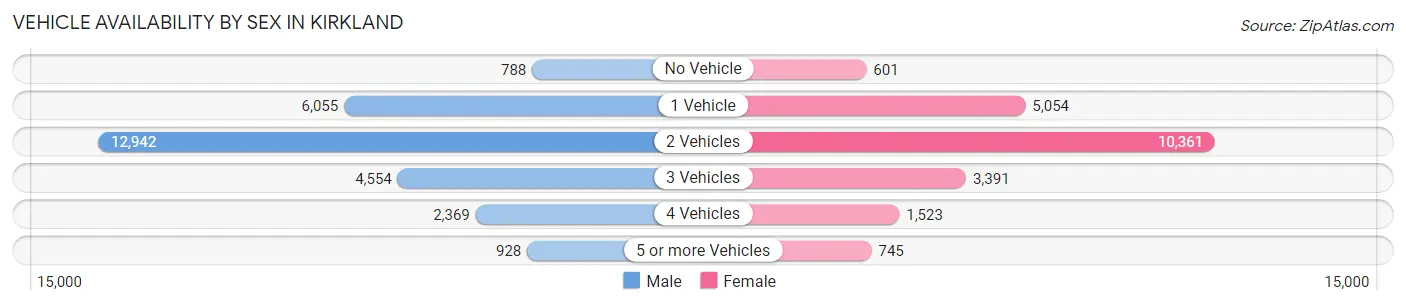
Vehicle Availability by Sex in Kirkland
The most prevalent vehicle ownership categories in Kirkland are males with 2 vehicles (12,942, accounting for 46.8%) and females with 2 vehicles (10,361, making up 59.7%).
| Vehicles Available | Male | Female |
| No Vehicle | 788 (2.9%) | 601 (2.8%) |
| 1 Vehicle | 6,055 (21.9%) | 5,054 (23.3%) |
| 2 Vehicles | 12,942 (46.8%) | 10,361 (47.8%) |
| 3 Vehicles | 4,554 (16.5%) | 3,391 (15.6%) |
| 4 Vehicles | 2,369 (8.6%) | 1,523 (7.0%) |
| 5 or more Vehicles | 928 (3.4%) | 745 (3.4%) |
| Total | 27,636 (100.0%) | 21,675 (100.0%) |
Commute Time in Kirkland
The most frequently occuring commute durations in Kirkland are 30 to 34 minutes (6,886 commuters, 18.5%), 20 to 24 minutes (6,304 commuters, 16.9%), and 15 to 19 minutes (5,588 commuters, 15.0%).
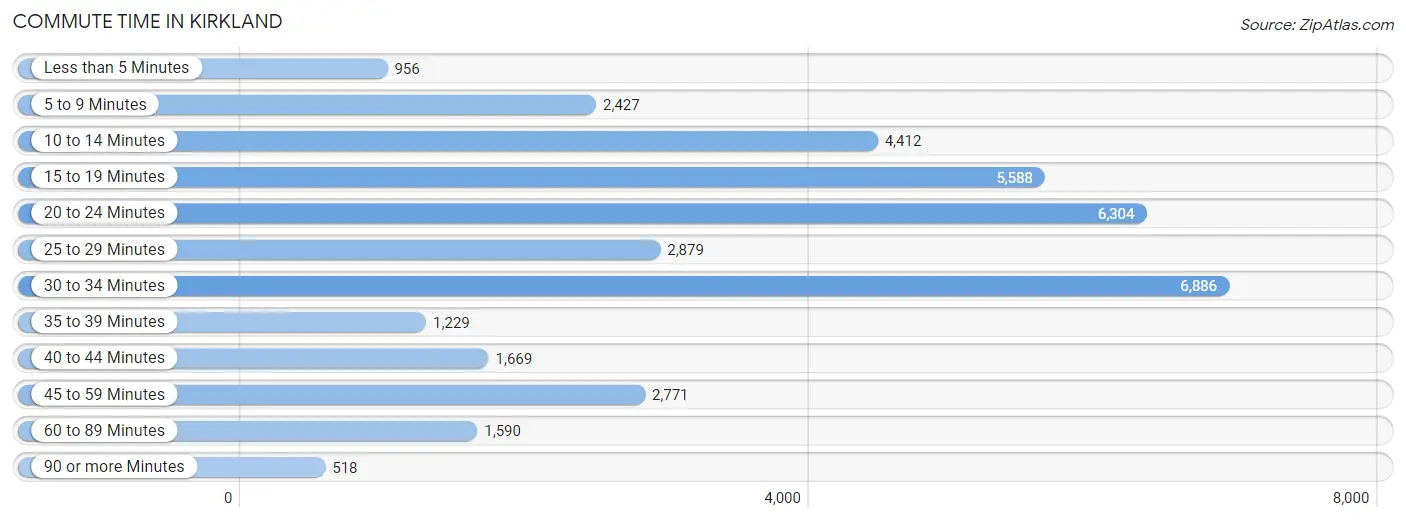
| Commute Time | # Commuters | % Commuters |
| Less than 5 Minutes | 956 | 2.6% |
| 5 to 9 Minutes | 2,427 | 6.5% |
| 10 to 14 Minutes | 4,412 | 11.8% |
| 15 to 19 Minutes | 5,588 | 15.0% |
| 20 to 24 Minutes | 6,304 | 16.9% |
| 25 to 29 Minutes | 2,879 | 7.7% |
| 30 to 34 Minutes | 6,886 | 18.5% |
| 35 to 39 Minutes | 1,229 | 3.3% |
| 40 to 44 Minutes | 1,669 | 4.5% |
| 45 to 59 Minutes | 2,771 | 7.4% |
| 60 to 89 Minutes | 1,590 | 4.3% |
| 90 or more Minutes | 518 | 1.4% |
Commute Time by Sex in Kirkland
The most common commute times in Kirkland are 30 to 34 minutes (3,956 commuters, 19.1%) for males and 20 to 24 minutes (2,968 commuters, 18.0%) for females.
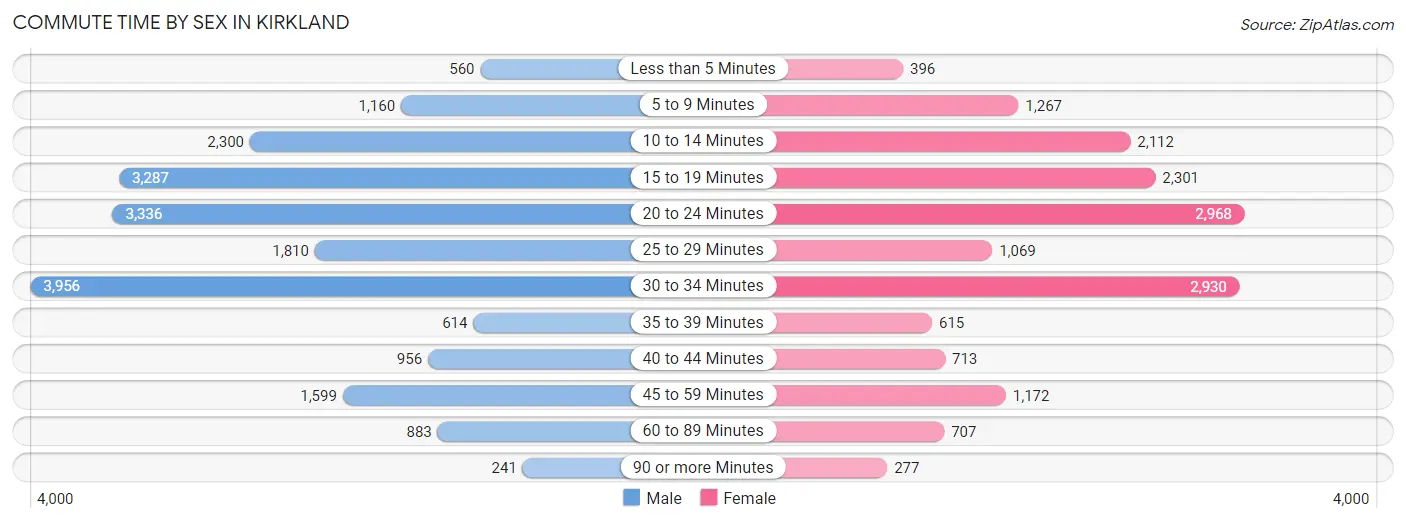
| Commute Time | Male | Female |
| Less than 5 Minutes | 560 (2.7%) | 396 (2.4%) |
| 5 to 9 Minutes | 1,160 (5.6%) | 1,267 (7.7%) |
| 10 to 14 Minutes | 2,300 (11.1%) | 2,112 (12.8%) |
| 15 to 19 Minutes | 3,287 (15.9%) | 2,301 (13.9%) |
| 20 to 24 Minutes | 3,336 (16.1%) | 2,968 (18.0%) |
| 25 to 29 Minutes | 1,810 (8.7%) | 1,069 (6.5%) |
| 30 to 34 Minutes | 3,956 (19.1%) | 2,930 (17.7%) |
| 35 to 39 Minutes | 614 (3.0%) | 615 (3.7%) |
| 40 to 44 Minutes | 956 (4.6%) | 713 (4.3%) |
| 45 to 59 Minutes | 1,599 (7.7%) | 1,172 (7.1%) |
| 60 to 89 Minutes | 883 (4.3%) | 707 (4.3%) |
| 90 or more Minutes | 241 (1.2%) | 277 (1.7%) |
Time of Departure to Work by Sex in Kirkland
The most frequent times of departure to work in Kirkland are 9:00 AM to 9:59 AM (2,945, 14.2%) for males and 9:00 AM to 9:59 AM (2,445, 14.8%) for females.
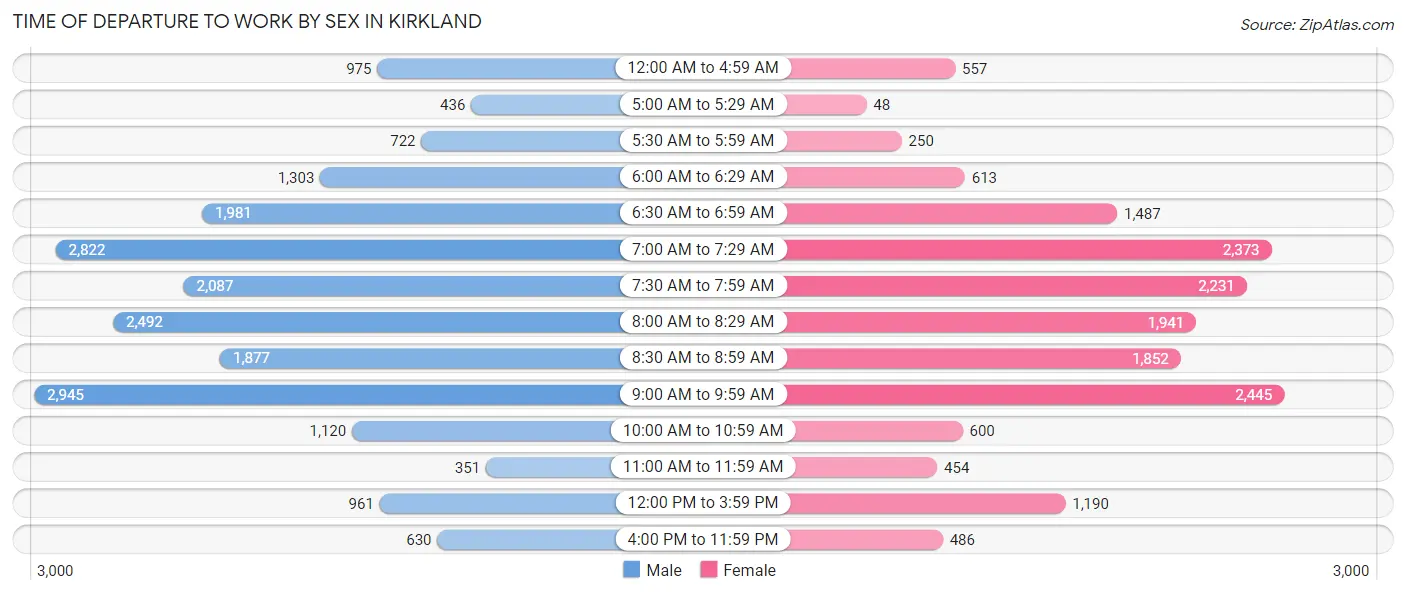
| Time of Departure | Male | Female |
| 12:00 AM to 4:59 AM | 975 (4.7%) | 557 (3.4%) |
| 5:00 AM to 5:29 AM | 436 (2.1%) | 48 (0.3%) |
| 5:30 AM to 5:59 AM | 722 (3.5%) | 250 (1.5%) |
| 6:00 AM to 6:29 AM | 1,303 (6.3%) | 613 (3.7%) |
| 6:30 AM to 6:59 AM | 1,981 (9.6%) | 1,487 (9.0%) |
| 7:00 AM to 7:29 AM | 2,822 (13.6%) | 2,373 (14.4%) |
| 7:30 AM to 7:59 AM | 2,087 (10.1%) | 2,231 (13.5%) |
| 8:00 AM to 8:29 AM | 2,492 (12.0%) | 1,941 (11.7%) |
| 8:30 AM to 8:59 AM | 1,877 (9.1%) | 1,852 (11.2%) |
| 9:00 AM to 9:59 AM | 2,945 (14.2%) | 2,445 (14.8%) |
| 10:00 AM to 10:59 AM | 1,120 (5.4%) | 600 (3.6%) |
| 11:00 AM to 11:59 AM | 351 (1.7%) | 454 (2.8%) |
| 12:00 PM to 3:59 PM | 961 (4.6%) | 1,190 (7.2%) |
| 4:00 PM to 11:59 PM | 630 (3.0%) | 486 (2.9%) |
| Total | 20,702 (100.0%) | 16,527 (100.0%) |
Housing Occupancy in Kirkland
Occupancy by Ownership in Kirkland
Of the total 37,546 dwellings in Kirkland, owner-occupied units account for 23,320 (62.1%), while renter-occupied units make up 14,226 (37.9%).
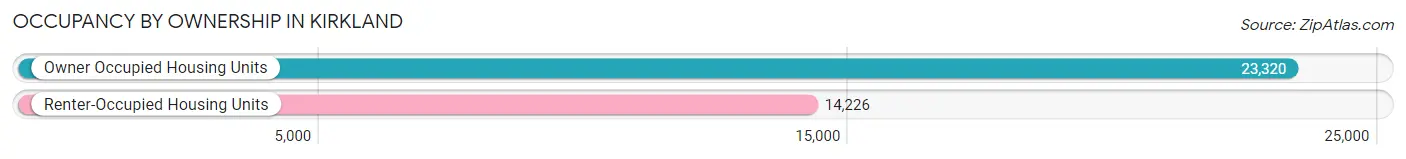
| Occupancy | # Housing Units | % Housing Units |
| Owner Occupied Housing Units | 23,320 | 62.1% |
| Renter-Occupied Housing Units | 14,226 | 37.9% |
| Total Occupied Housing Units | 37,546 | 100.0% |
Occupancy by Household Size in Kirkland
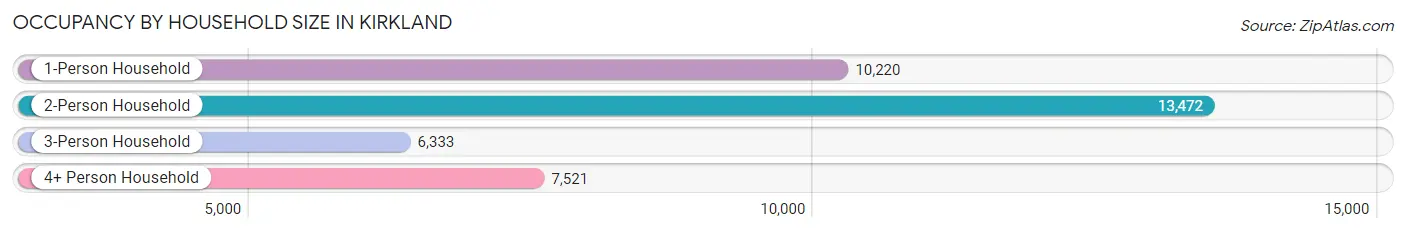
| Household Size | # Housing Units | % Housing Units |
| 1-Person Household | 10,220 | 27.2% |
| 2-Person Household | 13,472 | 35.9% |
| 3-Person Household | 6,333 | 16.9% |
| 4+ Person Household | 7,521 | 20.0% |
| Total Housing Units | 37,546 | 100.0% |
Occupancy by Ownership by Household Size in Kirkland
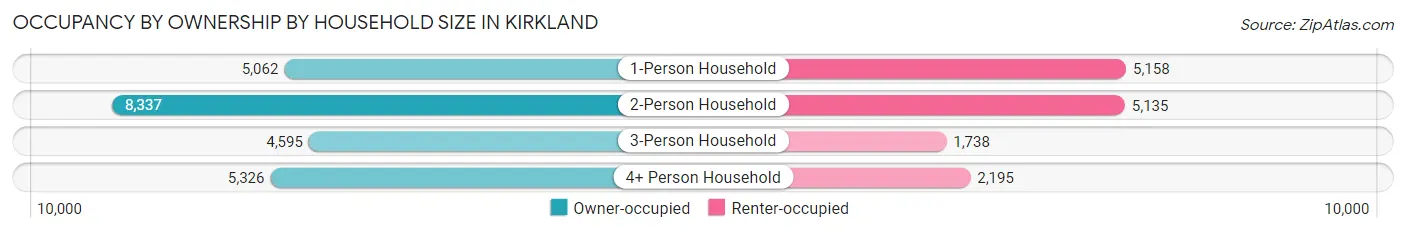
| Household Size | Owner-occupied | Renter-occupied |
| 1-Person Household | 5,062 (49.5%) | 5,158 (50.5%) |
| 2-Person Household | 8,337 (61.9%) | 5,135 (38.1%) |
| 3-Person Household | 4,595 (72.6%) | 1,738 (27.4%) |
| 4+ Person Household | 5,326 (70.8%) | 2,195 (29.2%) |
| Total Housing Units | 23,320 (62.1%) | 14,226 (37.9%) |
Occupancy by Educational Attainment in Kirkland
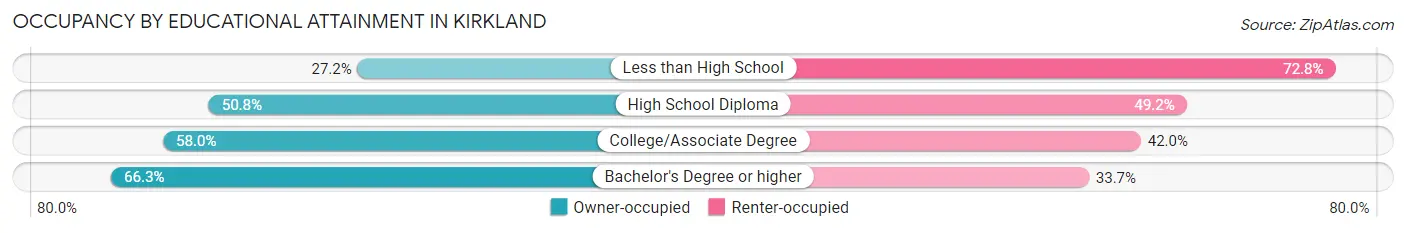
| Household Size | Owner-occupied | Renter-occupied |
| Less than High School | 239 (27.2%) | 640 (72.8%) |
| High School Diploma | 1,688 (50.8%) | 1,636 (49.2%) |
| College/Associate Degree | 4,949 (58.0%) | 3,579 (42.0%) |
| Bachelor's Degree or higher | 16,444 (66.3%) | 8,371 (33.7%) |
Occupancy by Age of Householder in Kirkland
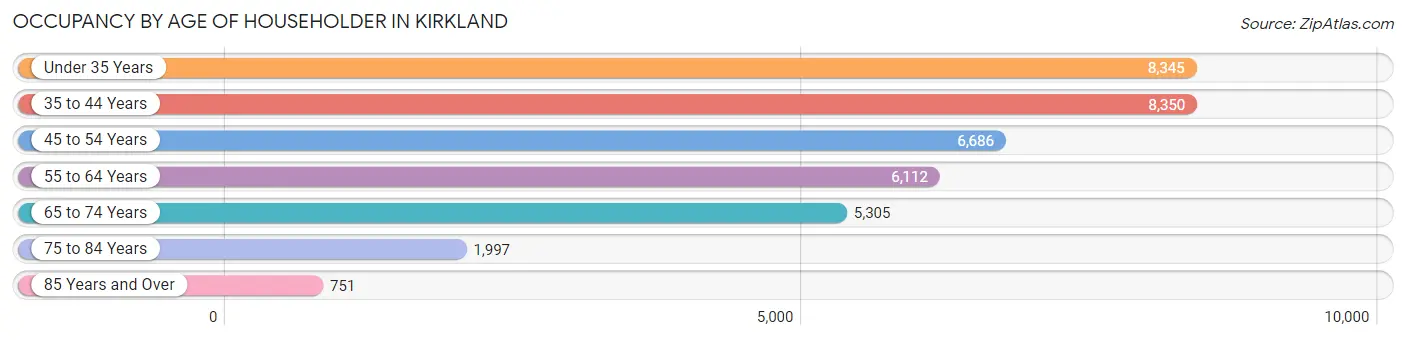
| Age Bracket | # Households | % Households |
| Under 35 Years | 8,345 | 22.2% |
| 35 to 44 Years | 8,350 | 22.2% |
| 45 to 54 Years | 6,686 | 17.8% |
| 55 to 64 Years | 6,112 | 16.3% |
| 65 to 74 Years | 5,305 | 14.1% |
| 75 to 84 Years | 1,997 | 5.3% |
| 85 Years and Over | 751 | 2.0% |
| Total | 37,546 | 100.0% |
Housing Finances in Kirkland
Median Income by Occupancy in Kirkland
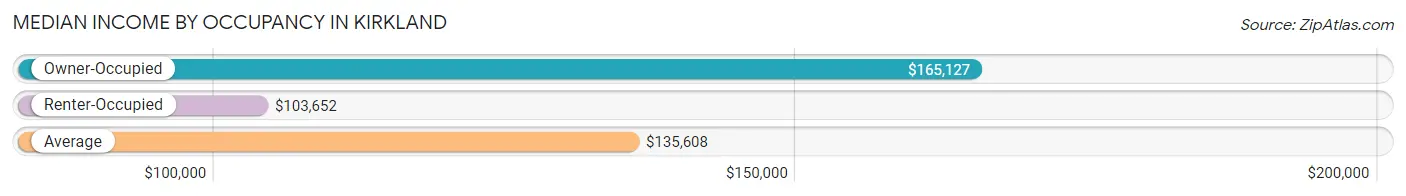
| Occupancy Type | # Households | Median Income |
| Owner-Occupied | 23,320 (62.1%) | $165,127 |
| Renter-Occupied | 14,226 (37.9%) | $103,652 |
| Average | 37,546 (100.0%) | $135,608 |
Occupancy by Householder Income Bracket in Kirkland
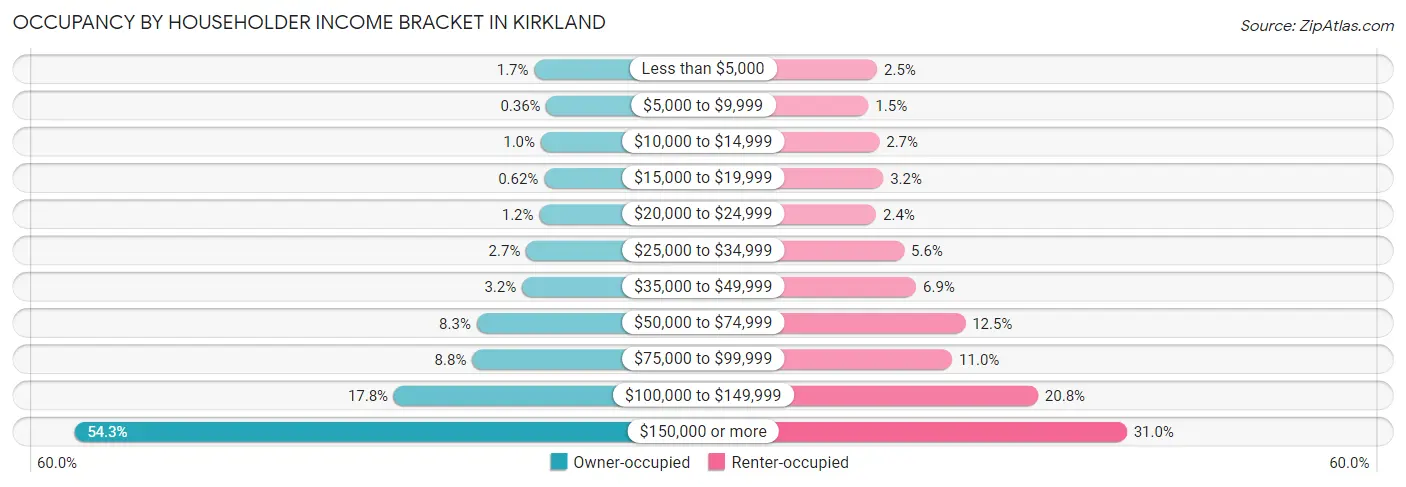
| Income Bracket | Owner-occupied | Renter-occupied |
| Less than $5,000 | 406 (1.7%) | 350 (2.5%) |
| $5,000 to $9,999 | 84 (0.4%) | 209 (1.5%) |
| $10,000 to $14,999 | 233 (1.0%) | 385 (2.7%) |
| $15,000 to $19,999 | 144 (0.6%) | 450 (3.2%) |
| $20,000 to $24,999 | 274 (1.2%) | 334 (2.4%) |
| $25,000 to $34,999 | 623 (2.7%) | 789 (5.6%) |
| $35,000 to $49,999 | 734 (3.2%) | 984 (6.9%) |
| $50,000 to $74,999 | 1,942 (8.3%) | 1,782 (12.5%) |
| $75,000 to $99,999 | 2,062 (8.8%) | 1,570 (11.0%) |
| $100,000 to $149,999 | 4,149 (17.8%) | 2,965 (20.8%) |
| $150,000 or more | 12,669 (54.3%) | 4,408 (31.0%) |
| Total | 23,320 (100.0%) | 14,226 (100.0%) |
Monthly Housing Cost Tiers in Kirkland
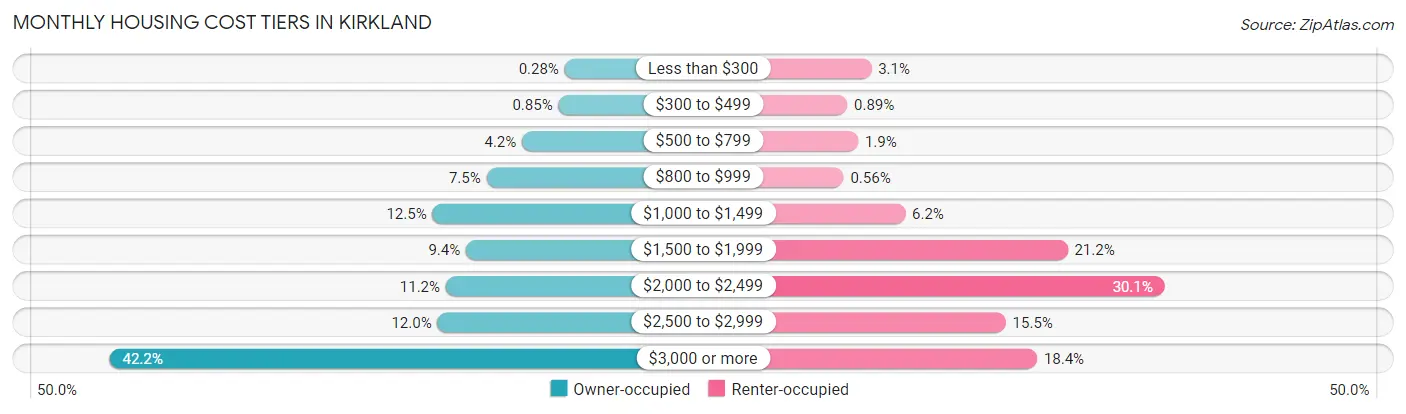
| Monthly Cost | Owner-occupied | Renter-occupied |
| Less than $300 | 66 (0.3%) | 442 (3.1%) |
| $300 to $499 | 198 (0.9%) | 127 (0.9%) |
| $500 to $799 | 979 (4.2%) | 269 (1.9%) |
| $800 to $999 | 1,741 (7.5%) | 80 (0.6%) |
| $1,000 to $1,499 | 2,904 (12.4%) | 886 (6.2%) |
| $1,500 to $1,999 | 2,182 (9.4%) | 3,013 (21.2%) |
| $2,000 to $2,499 | 2,616 (11.2%) | 4,286 (30.1%) |
| $2,500 to $2,999 | 2,797 (12.0%) | 2,204 (15.5%) |
| $3,000 or more | 9,837 (42.2%) | 2,613 (18.4%) |
| Total | 23,320 (100.0%) | 14,226 (100.0%) |
Physical Housing Characteristics in Kirkland
Housing Structures in Kirkland
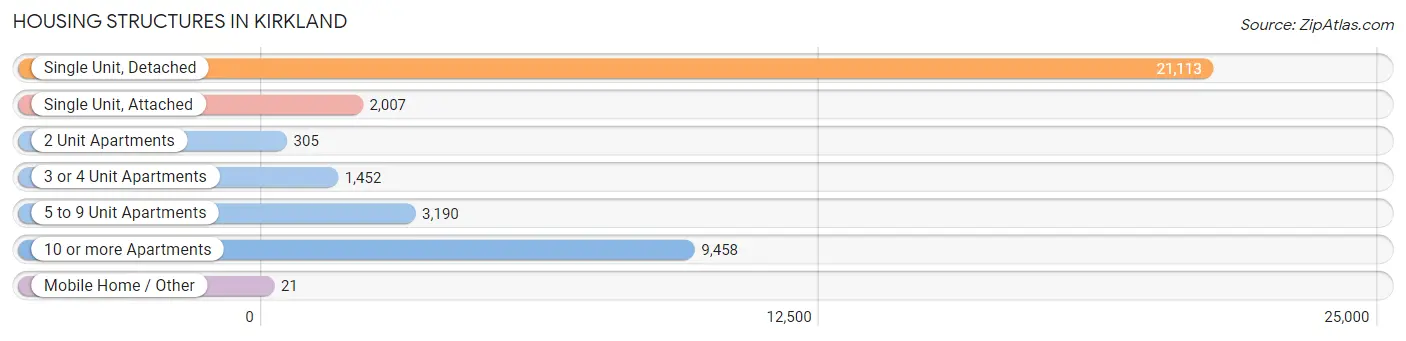
| Structure Type | # Housing Units | % Housing Units |
| Single Unit, Detached | 21,113 | 56.2% |
| Single Unit, Attached | 2,007 | 5.3% |
| 2 Unit Apartments | 305 | 0.8% |
| 3 or 4 Unit Apartments | 1,452 | 3.9% |
| 5 to 9 Unit Apartments | 3,190 | 8.5% |
| 10 or more Apartments | 9,458 | 25.2% |
| Mobile Home / Other | 21 | 0.1% |
| Total | 37,546 | 100.0% |
Housing Structures by Occupancy in Kirkland
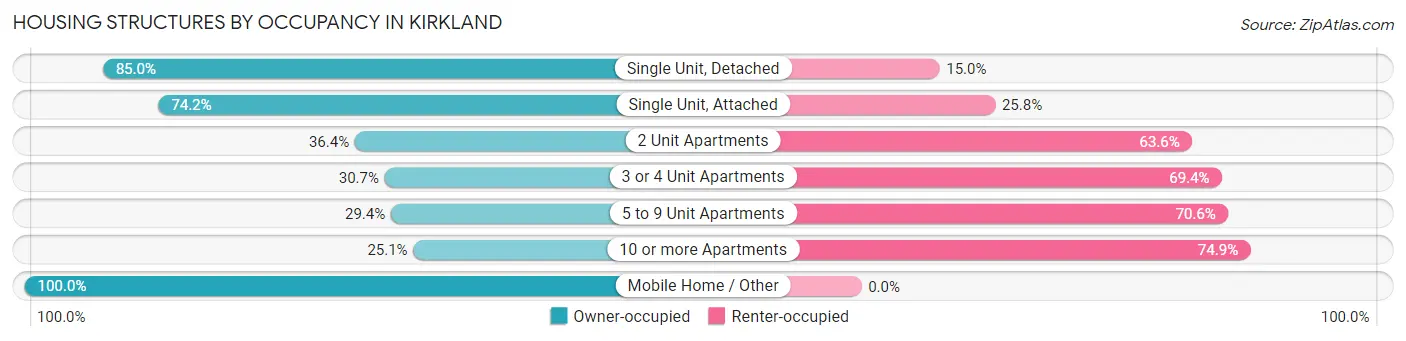
| Structure Type | Owner-occupied | Renter-occupied |
| Single Unit, Detached | 17,937 (85.0%) | 3,176 (15.0%) |
| Single Unit, Attached | 1,490 (74.2%) | 517 (25.8%) |
| 2 Unit Apartments | 111 (36.4%) | 194 (63.6%) |
| 3 or 4 Unit Apartments | 445 (30.6%) | 1,007 (69.4%) |
| 5 to 9 Unit Apartments | 939 (29.4%) | 2,251 (70.6%) |
| 10 or more Apartments | 2,377 (25.1%) | 7,081 (74.9%) |
| Mobile Home / Other | 21 (100.0%) | 0 (0.0%) |
| Total | 23,320 (62.1%) | 14,226 (37.9%) |
Housing Structures by Number of Rooms in Kirkland
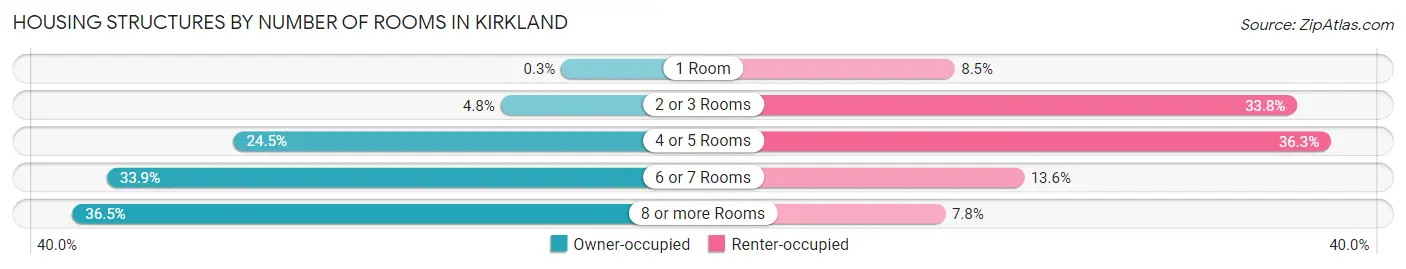
| Number of Rooms | Owner-occupied | Renter-occupied |
| 1 Room | 71 (0.3%) | 1,204 (8.5%) |
| 2 or 3 Rooms | 1,118 (4.8%) | 4,813 (33.8%) |
| 4 or 5 Rooms | 5,720 (24.5%) | 5,169 (36.3%) |
| 6 or 7 Rooms | 7,908 (33.9%) | 1,935 (13.6%) |
| 8 or more Rooms | 8,503 (36.5%) | 1,105 (7.8%) |
| Total | 23,320 (100.0%) | 14,226 (100.0%) |
Housing Structure by Heating Type in Kirkland
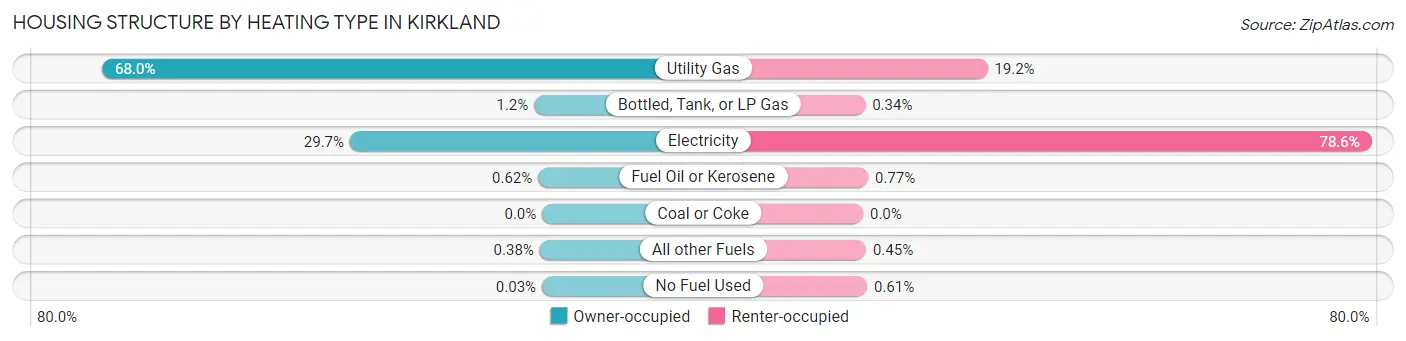
| Heating Type | Owner-occupied | Renter-occupied |
| Utility Gas | 15,863 (68.0%) | 2,735 (19.2%) |
| Bottled, Tank, or LP Gas | 287 (1.2%) | 49 (0.3%) |
| Electricity | 6,931 (29.7%) | 11,182 (78.6%) |
| Fuel Oil or Kerosene | 145 (0.6%) | 109 (0.8%) |
| Coal or Coke | 0 (0.0%) | 0 (0.0%) |
| All other Fuels | 88 (0.4%) | 64 (0.4%) |
| No Fuel Used | 6 (0.0%) | 87 (0.6%) |
| Total | 23,320 (100.0%) | 14,226 (100.0%) |
Household Vehicle Usage in Kirkland
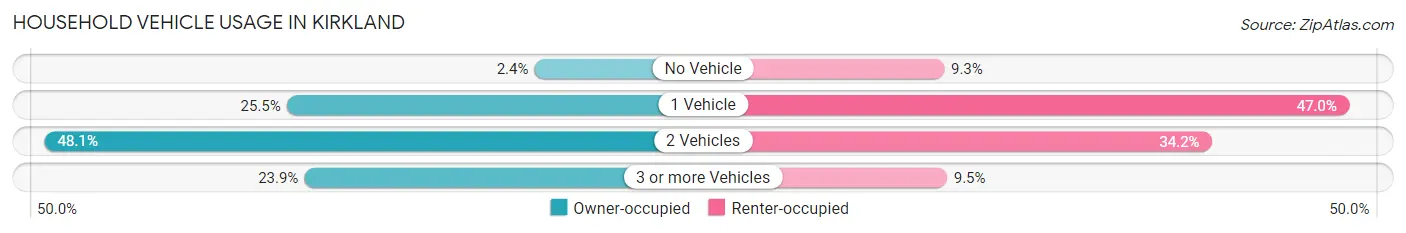
| Vehicles per Household | Owner-occupied | Renter-occupied |
| No Vehicle | 564 (2.4%) | 1,316 (9.2%) |
| 1 Vehicle | 5,956 (25.5%) | 6,690 (47.0%) |
| 2 Vehicles | 11,226 (48.1%) | 4,867 (34.2%) |
| 3 or more Vehicles | 5,574 (23.9%) | 1,353 (9.5%) |
| Total | 23,320 (100.0%) | 14,226 (100.0%) |
Real Estate & Mortgages in Kirkland
Real Estate and Mortgage Overview in Kirkland
| Characteristic | Without Mortgage | With Mortgage |
| Housing Units | 6,565 | 16,755 |
| Median Property Value | $960,700 | $929,600 |
| Median Household Income | $118,569 | $10,095 |
| Monthly Housing Costs | $1,083 | $9,663 |
| Real Estate Taxes | $7,387 | $181 |
Property Value by Mortgage Status in Kirkland
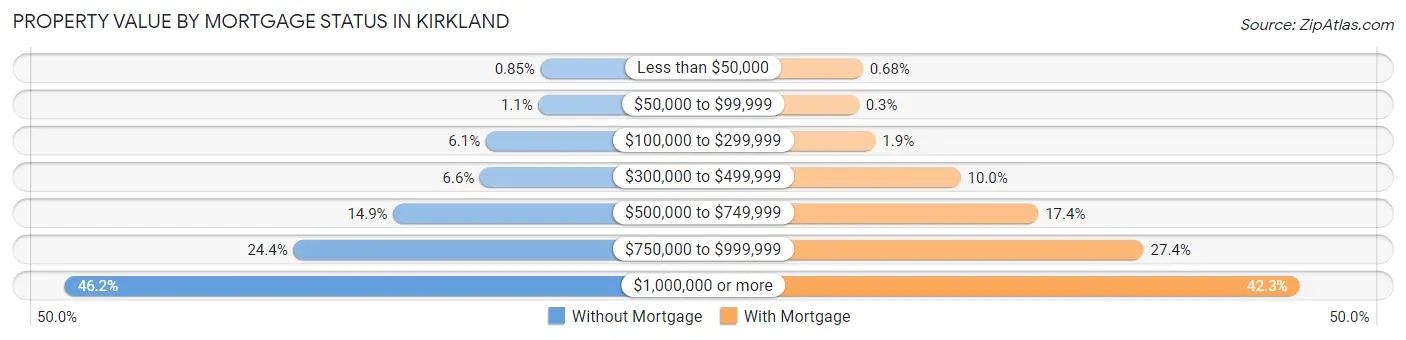
| Property Value | Without Mortgage | With Mortgage |
| Less than $50,000 | 56 (0.9%) | 114 (0.7%) |
| $50,000 to $99,999 | 69 (1.1%) | 51 (0.3%) |
| $100,000 to $299,999 | 398 (6.1%) | 317 (1.9%) |
| $300,000 to $499,999 | 434 (6.6%) | 1,676 (10.0%) |
| $500,000 to $749,999 | 976 (14.9%) | 2,916 (17.4%) |
| $750,000 to $999,999 | 1,601 (24.4%) | 4,598 (27.4%) |
| $1,000,000 or more | 3,031 (46.2%) | 7,083 (42.3%) |
| Total | 6,565 (100.0%) | 16,755 (100.0%) |
Household Income by Mortgage Status in Kirkland
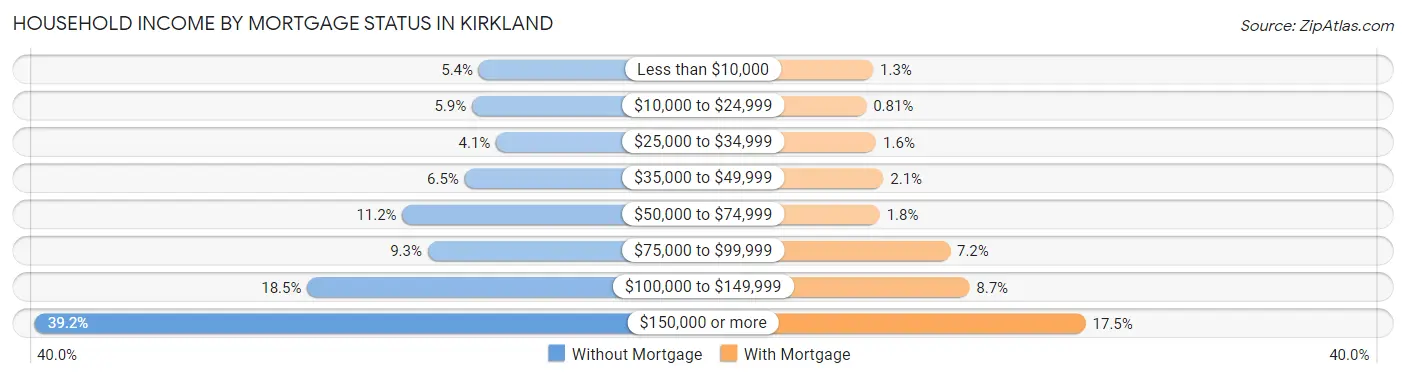
| Household Income | Without Mortgage | With Mortgage |
| Less than $10,000 | 354 (5.4%) | 224 (1.3%) |
| $10,000 to $24,999 | 388 (5.9%) | 136 (0.8%) |
| $25,000 to $34,999 | 267 (4.1%) | 263 (1.6%) |
| $35,000 to $49,999 | 425 (6.5%) | 356 (2.1%) |
| $50,000 to $74,999 | 736 (11.2%) | 309 (1.8%) |
| $75,000 to $99,999 | 609 (9.3%) | 1,206 (7.2%) |
| $100,000 to $149,999 | 1,212 (18.5%) | 1,453 (8.7%) |
| $150,000 or more | 2,574 (39.2%) | 2,937 (17.5%) |
| Total | 6,565 (100.0%) | 16,755 (100.0%) |
Property Value to Household Income Ratio in Kirkland
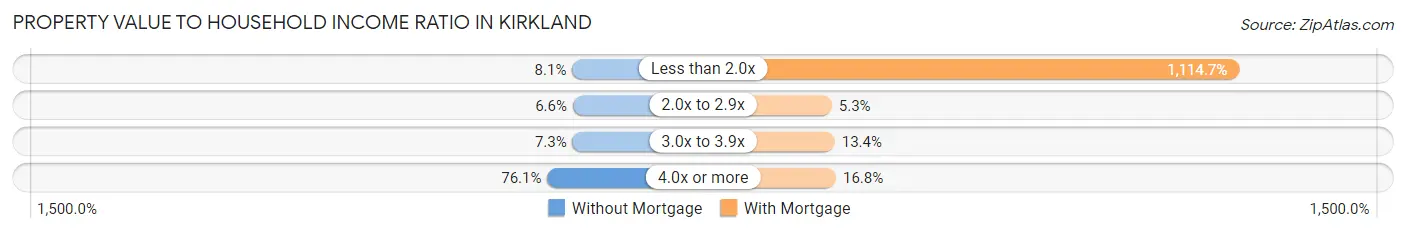
| Value-to-Income Ratio | Without Mortgage | With Mortgage |
| Less than 2.0x | 531 (8.1%) | 186,769 (1,114.7%) |
| 2.0x to 2.9x | 436 (6.6%) | 894 (5.3%) |
| 3.0x to 3.9x | 482 (7.3%) | 2,240 (13.4%) |
| 4.0x or more | 4,993 (76.0%) | 2,810 (16.8%) |
| Total | 6,565 (100.0%) | 16,755 (100.0%) |
Real Estate Taxes by Mortgage Status in Kirkland
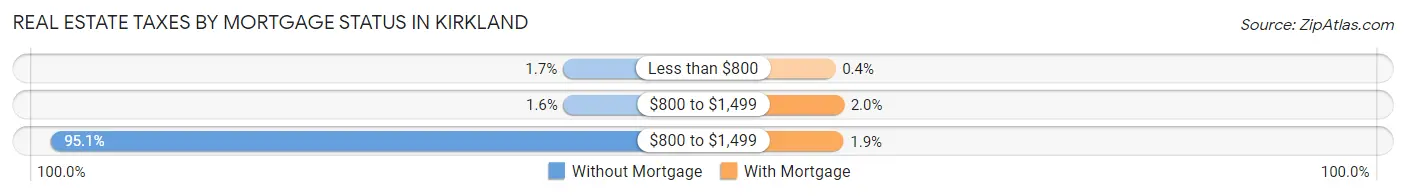
| Property Taxes | Without Mortgage | With Mortgage |
| Less than $800 | 109 (1.7%) | 67 (0.4%) |
| $800 to $1,499 | 102 (1.5%) | 326 (1.9%) |
| $800 to $1,499 | 6,245 (95.1%) | 315 (1.9%) |
| Total | 6,565 (100.0%) | 16,755 (100.0%) |
Health & Disability in Kirkland
Health Insurance Coverage by Age in Kirkland
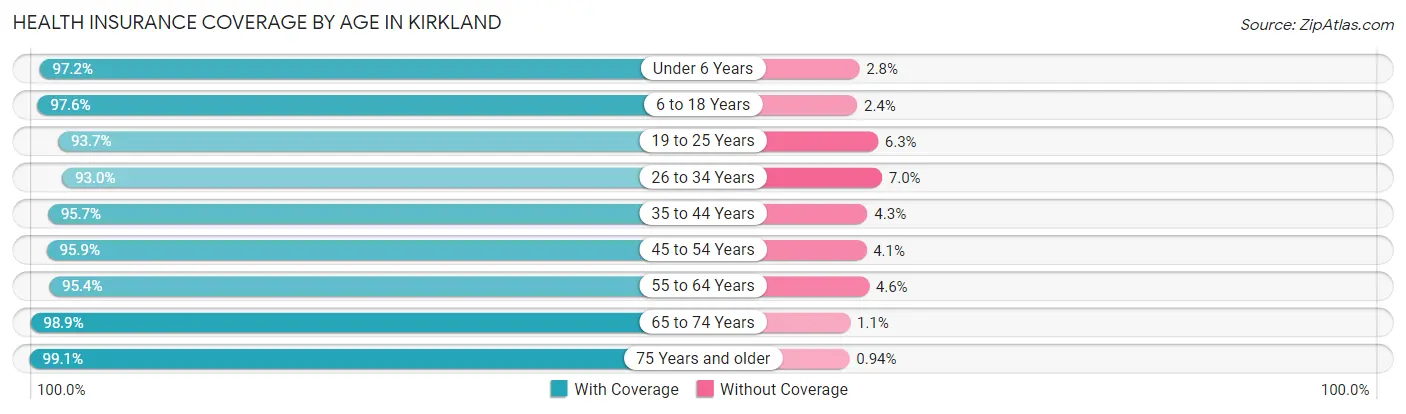
| Age Bracket | With Coverage | Without Coverage |
| Under 6 Years | 6,146 (97.2%) | 177 (2.8%) |
| 6 to 18 Years | 12,615 (97.6%) | 307 (2.4%) |
| 19 to 25 Years | 7,057 (93.7%) | 471 (6.3%) |
| 26 to 34 Years | 13,133 (93.0%) | 988 (7.0%) |
| 35 to 44 Years | 14,846 (95.7%) | 669 (4.3%) |
| 45 to 54 Years | 11,313 (95.9%) | 483 (4.1%) |
| 55 to 64 Years | 10,284 (95.4%) | 494 (4.6%) |
| 65 to 74 Years | 8,082 (98.9%) | 87 (1.1%) |
| 75 Years and older | 4,532 (99.1%) | 43 (0.9%) |
| Total | 88,008 (96.0%) | 3,719 (4.1%) |
Health Insurance Coverage by Citizenship Status in Kirkland
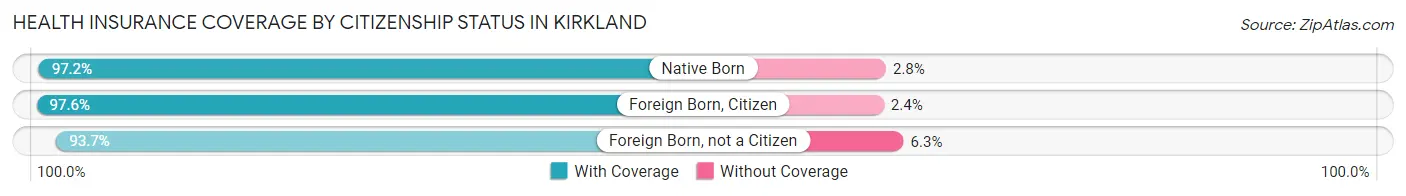
| Citizenship Status | With Coverage | Without Coverage |
| Native Born | 6,146 (97.2%) | 177 (2.8%) |
| Foreign Born, Citizen | 12,615 (97.6%) | 307 (2.4%) |
| Foreign Born, not a Citizen | 7,057 (93.7%) | 471 (6.3%) |
Health Insurance Coverage by Household Income in Kirkland
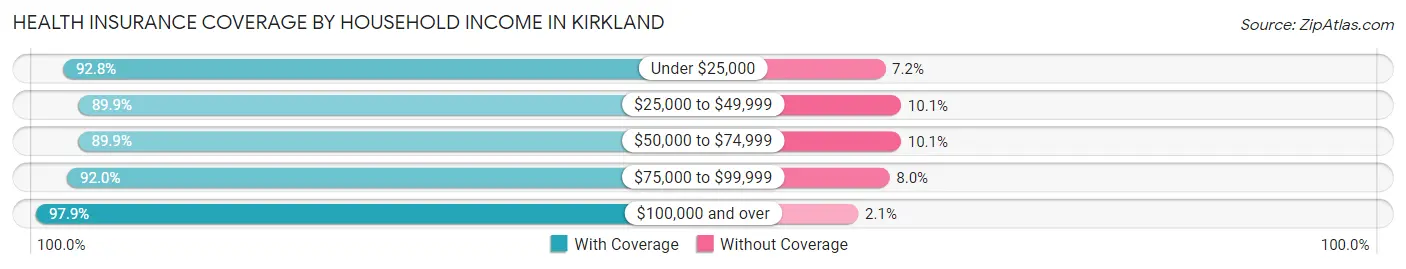
| Household Income | With Coverage | Without Coverage |
| Under $25,000 | 4,286 (92.8%) | 332 (7.2%) |
| $25,000 to $49,999 | 5,159 (89.9%) | 582 (10.1%) |
| $50,000 to $74,999 | 6,806 (89.9%) | 766 (10.1%) |
| $75,000 to $99,999 | 7,152 (92.0%) | 619 (8.0%) |
| $100,000 and over | 63,476 (97.9%) | 1,383 (2.1%) |
Public vs Private Health Insurance Coverage by Age in Kirkland
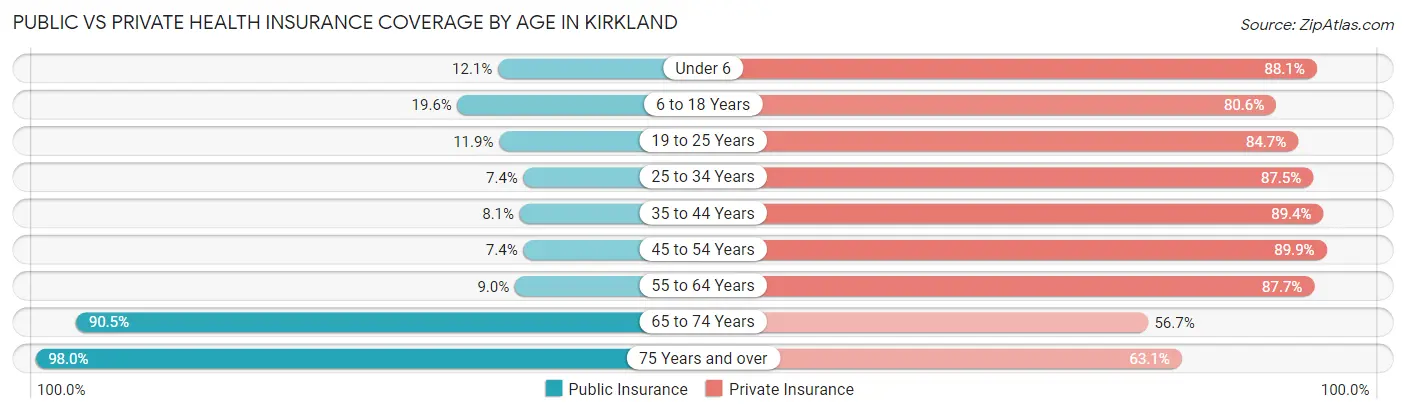
| Age Bracket | Public Insurance | Private Insurance |
| Under 6 | 766 (12.1%) | 5,572 (88.1%) |
| 6 to 18 Years | 2,535 (19.6%) | 10,415 (80.6%) |
| 19 to 25 Years | 896 (11.9%) | 6,375 (84.7%) |
| 25 to 34 Years | 1,039 (7.4%) | 12,352 (87.5%) |
| 35 to 44 Years | 1,252 (8.1%) | 13,869 (89.4%) |
| 45 to 54 Years | 873 (7.4%) | 10,609 (89.9%) |
| 55 to 64 Years | 967 (9.0%) | 9,449 (87.7%) |
| 65 to 74 Years | 7,392 (90.5%) | 4,635 (56.7%) |
| 75 Years and over | 4,485 (98.0%) | 2,886 (63.1%) |
| Total | 20,205 (22.0%) | 76,162 (83.0%) |
Disability Status by Sex by Age in Kirkland
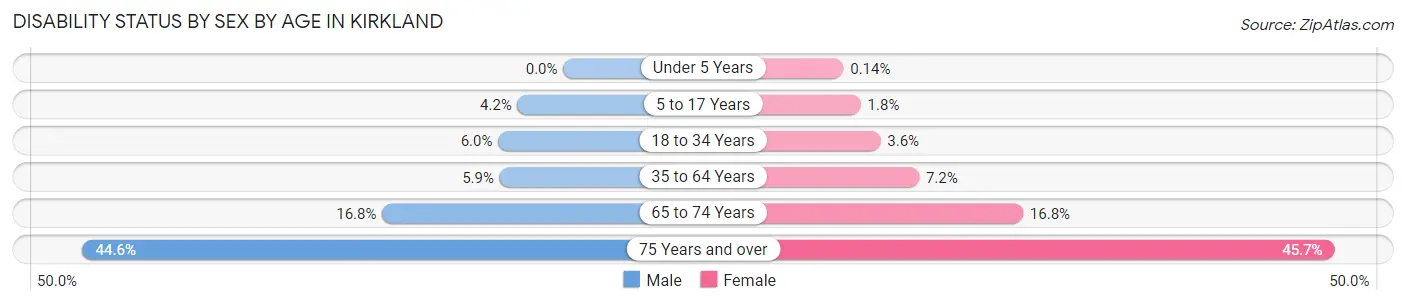
| Age Bracket | Male | Female |
| Under 5 Years | 0 (0.0%) | 4 (0.1%) |
| 5 to 17 Years | 300 (4.2%) | 105 (1.8%) |
| 18 to 34 Years | 733 (6.0%) | 371 (3.6%) |
| 35 to 64 Years | 1,118 (5.9%) | 1,369 (7.2%) |
| 65 to 74 Years | 650 (16.8%) | 723 (16.8%) |
| 75 Years and over | 794 (44.6%) | 1,278 (45.7%) |
Disability Class by Sex by Age in Kirkland
Disability Class: Hearing Difficulty
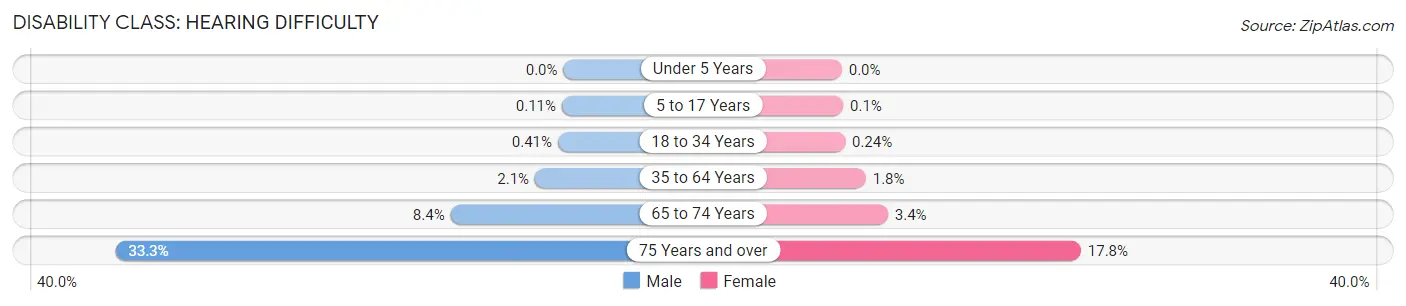
| Age Bracket | Male | Female |
| Under 5 Years | 0 (0.0%) | 0 (0.0%) |
| 5 to 17 Years | 8 (0.1%) | 6 (0.1%) |
| 18 to 34 Years | 50 (0.4%) | 25 (0.2%) |
| 35 to 64 Years | 401 (2.1%) | 340 (1.8%) |
| 65 to 74 Years | 324 (8.4%) | 147 (3.4%) |
| 75 Years and over | 592 (33.3%) | 496 (17.7%) |
Disability Class: Vision Difficulty
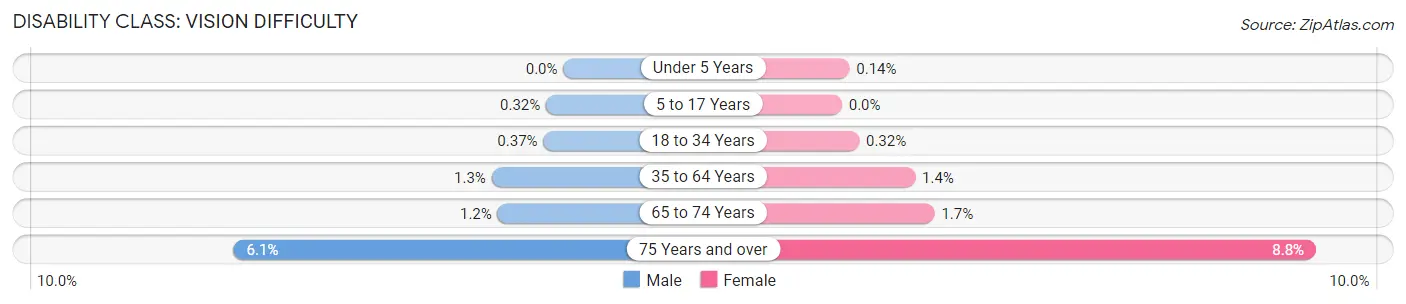
| Age Bracket | Male | Female |
| Under 5 Years | 0 (0.0%) | 4 (0.1%) |
| 5 to 17 Years | 23 (0.3%) | 0 (0.0%) |
| 18 to 34 Years | 45 (0.4%) | 33 (0.3%) |
| 35 to 64 Years | 252 (1.3%) | 261 (1.4%) |
| 65 to 74 Years | 47 (1.2%) | 74 (1.7%) |
| 75 Years and over | 109 (6.1%) | 246 (8.8%) |
Disability Class: Cognitive Difficulty
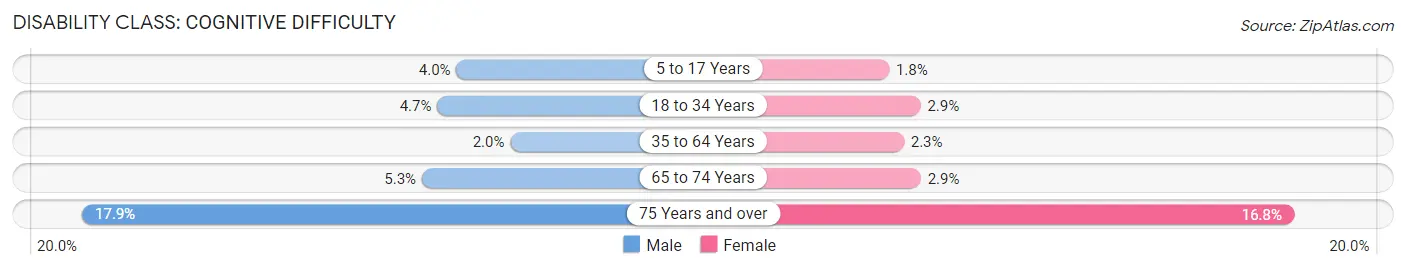
| Age Bracket | Male | Female |
| 5 to 17 Years | 281 (4.0%) | 105 (1.8%) |
| 18 to 34 Years | 568 (4.7%) | 303 (2.9%) |
| 35 to 64 Years | 374 (2.0%) | 439 (2.3%) |
| 65 to 74 Years | 203 (5.2%) | 126 (2.9%) |
| 75 Years and over | 318 (17.9%) | 469 (16.8%) |
Disability Class: Ambulatory Difficulty
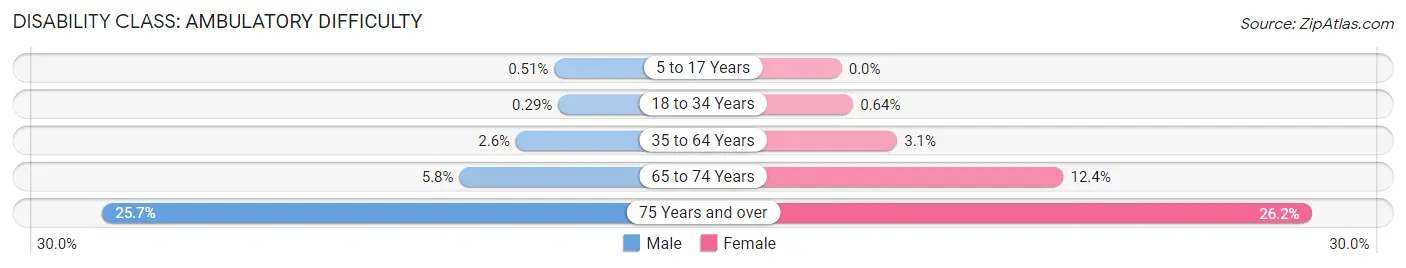
| Age Bracket | Male | Female |
| 5 to 17 Years | 36 (0.5%) | 0 (0.0%) |
| 18 to 34 Years | 35 (0.3%) | 66 (0.6%) |
| 35 to 64 Years | 500 (2.6%) | 591 (3.1%) |
| 65 to 74 Years | 224 (5.8%) | 531 (12.3%) |
| 75 Years and over | 457 (25.7%) | 731 (26.2%) |
Disability Class: Self-Care Difficulty
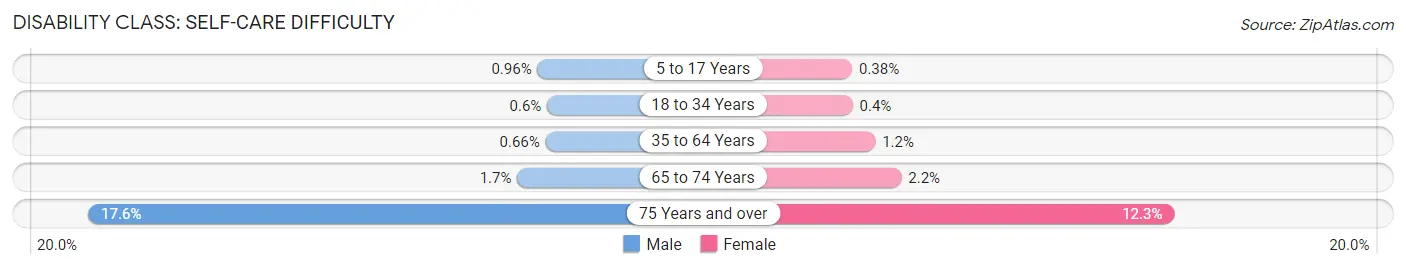
| Age Bracket | Male | Female |
| 5 to 17 Years | 68 (1.0%) | 23 (0.4%) |
| 18 to 34 Years | 73 (0.6%) | 41 (0.4%) |
| 35 to 64 Years | 126 (0.7%) | 238 (1.2%) |
| 65 to 74 Years | 66 (1.7%) | 95 (2.2%) |
| 75 Years and over | 314 (17.6%) | 345 (12.3%) |
Technology Access in Kirkland
Computing Device Access in Kirkland
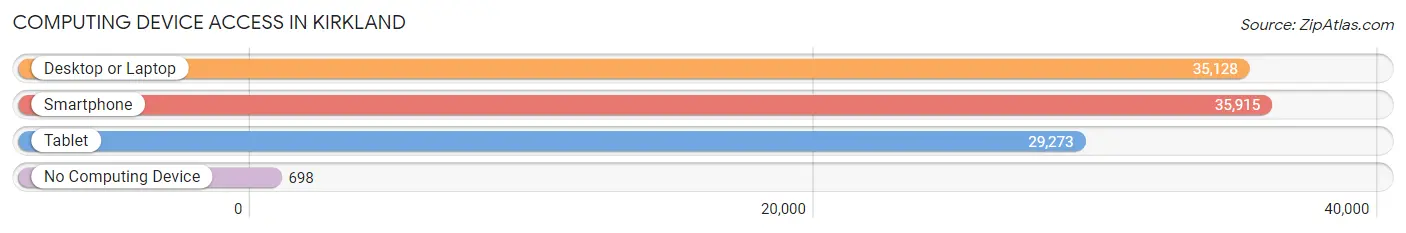
| Device Type | # Households | % Households |
| Desktop or Laptop | 35,128 | 93.6% |
| Smartphone | 35,915 | 95.7% |
| Tablet | 29,273 | 78.0% |
| No Computing Device | 698 | 1.9% |
| Total | 37,546 | 100.0% |
Internet Access in Kirkland
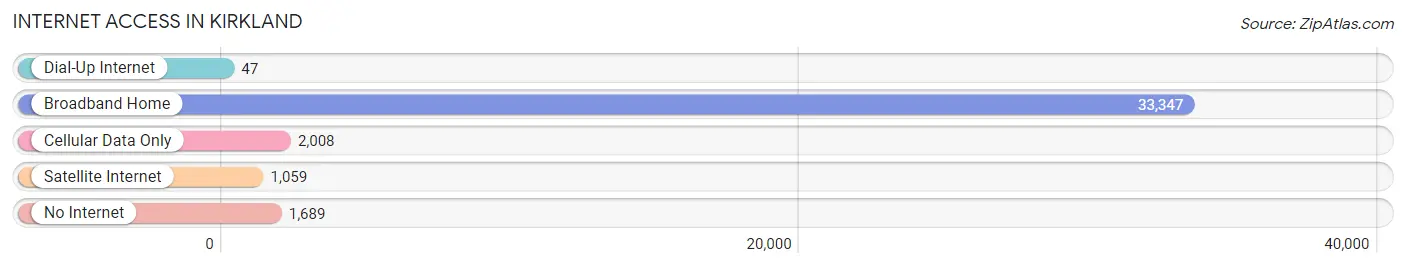
| Internet Type | # Households | % Households |
| Dial-Up Internet | 47 | 0.1% |
| Broadband Home | 33,347 | 88.8% |
| Cellular Data Only | 2,008 | 5.3% |
| Satellite Internet | 1,059 | 2.8% |
| No Internet | 1,689 | 4.5% |
| Total | 37,546 | 100.0% |
Kirkland Summary
Kirkland, Washington is a city located in King County, Washington, United States. It is situated on the eastern shore of Lake Washington, about 10 miles northeast of Seattle. The city has a population of approximately 87,281 as of 2019, making it the sixth-largest city in the county.
History
Kirkland was first settled in the late 19th century by settlers from the East Coast. The first settlers were mostly farmers and loggers, who were attracted to the area by its abundant natural resources. The first post office was established in 1891, and the city was officially incorporated in 1905.
The city was named after Peter Kirk, a Scottish-born businessman who had purchased land in the area in the late 1800s. Kirk was a successful entrepreneur who owned a number of businesses in the area, including a sawmill, a brickyard, and a general store.
Geography
Kirkland is located in King County, Washington, on the eastern shore of Lake Washington. The city is bordered by the cities of Redmond to the north, Bellevue to the south, and Woodinville to the east. The city covers an area of approximately 11.5 square miles, with a population density of approximately 7,500 people per square mile.
The city is situated at the base of the Cascade Mountains, and is surrounded by several lakes, including Lake Washington, Lake Sammamish, and Lake Union. The city is also home to several parks, including Juanita Bay Park, Bridle Trails State Park, and Saint Edward State Park.
Economy
Kirkland is home to a diverse economy, with a variety of industries represented. The city is home to several large employers, including Microsoft, Google, and Amazon. The city is also home to a number of smaller businesses, including restaurants, retail stores, and professional services.
The city is also home to a number of technology companies, including Expedia, Tableau Software, and Apptio. The city is also home to a number of medical and healthcare providers, including EvergreenHealth and Overlake Medical Center.
Demographics
As of 2019, the population of Kirkland was estimated to be 87,281. The city has a median age of 38.7 years, with a gender ratio of 50.3% female and 49.7% male. The racial makeup of the city is 73.2% White, 8.2% Asian, 6.3% Hispanic or Latino, 5.2% African American, and 4.3% other.
The median household income in Kirkland is $95,845, and the median home value is $717,400. The city has a high rate of homeownership, with approximately 70% of residents owning their own homes. The city also has a high rate of educational attainment, with approximately 90% of residents having at least a high school diploma.
Common Questions
What is Per Capita Income in Kirkland?
Per Capita income in Kirkland is $79,941.
What is the Median Family Income in Kirkland?
Median Family Income in Kirkland is $169,471.
What is the Median Household income in Kirkland?
Median Household Income in Kirkland is $135,608.
What is Income or Wage Gap in Kirkland?
Income or Wage Gap in Kirkland is 38.0%.
Women in Kirkland earn 62.0 cents for every dollar earned by a man.
What is Family Income Deficit in Kirkland?
Family Income Deficit in Kirkland is $12,057.
Families that are below poverty line in Kirkland earn $12,057 less on average than the poverty threshold level.
What is Inequality or Gini Index in Kirkland?
Inequality or Gini Index in Kirkland is 0.48.
What is the Total Population of Kirkland?
Total Population of Kirkland is 92,015.
What is the Total Male Population of Kirkland?
Total Male Population of Kirkland is 46,407.
What is the Total Female Population of Kirkland?
Total Female Population of Kirkland is 45,608.
What is the Ratio of Males per 100 Females in Kirkland?
There are 101.75 Males per 100 Females in Kirkland.
What is the Ratio of Females per 100 Males in Kirkland?
There are 98.28 Females per 100 Males in Kirkland.
What is the Median Population Age in Kirkland?
Median Population Age in Kirkland is 38.0 Years.
What is the Average Family Size in Kirkland
Average Family Size in Kirkland is 3.0 People.
What is the Average Household Size in Kirkland
Average Household Size in Kirkland is 2.4 People.
How Large is the Labor Force in Kirkland?
There are 53,198 People in the Labor Forcein in Kirkland.
What is the Percentage of People in the Labor Force in Kirkland?
70.6% of People are in the Labor Force in Kirkland.
What is the Unemployment Rate in Kirkland?
Unemployment Rate in Kirkland is 4.7%.