Zip Codes with the Highest Percentage of Population Employed in Architecture & Engineering in Kennewick, WA
RELATED REPORTS & OPTIONS
Architecture & Engineering
Kennewick
Compare Zip Codes
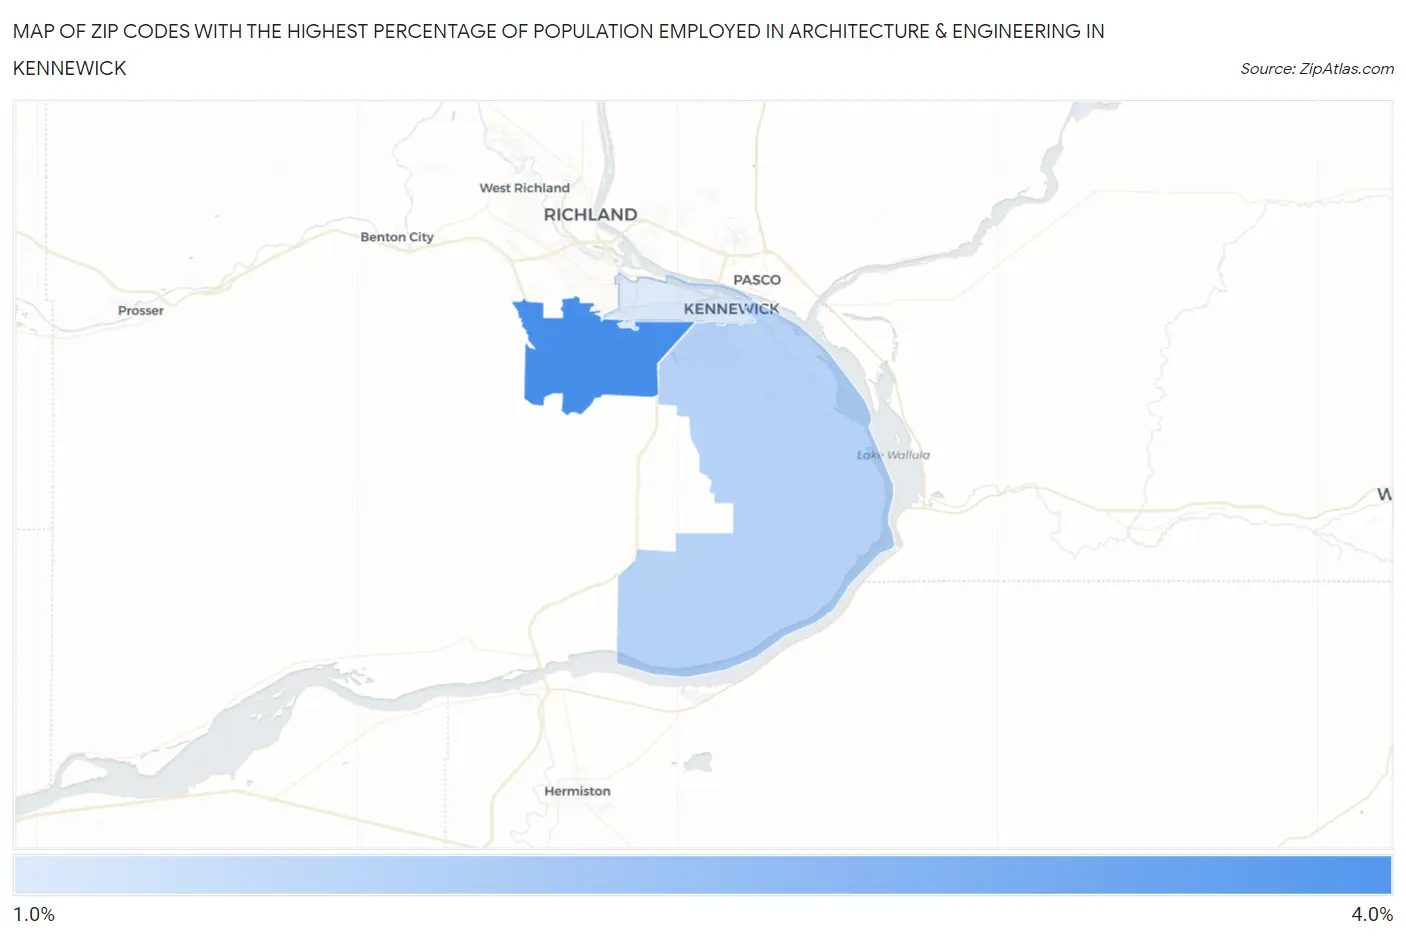
Map of Zip Codes with the Highest Percentage of Population Employed in Architecture & Engineering in Kennewick
1.7%
3.6%
Zip Codes with the Highest Percentage of Population Employed in Architecture & Engineering in Kennewick, WA
| Zip Code | % Employed | vs State | vs National | |
| 1. | 99338 | 3.6% | 2.8%(+0.768)#104 | 2.1%(+1.41)#3,593 |
| 2. | 99337 | 2.2% | 2.8%(-0.563)#209 | 2.1%(+0.079)#8,319 |
| 3. | 99336 | 1.7% | 2.8%(-1.05)#257 | 2.1%(-0.406)#11,211 |
1
Common Questions
What are the Top Zip Codes with the Highest Percentage of Population Employed in Architecture & Engineering in Kennewick, WA?
Top Zip Codes with the Highest Percentage of Population Employed in Architecture & Engineering in Kennewick, WA are:
What zip code has the Highest Percentage of Population Employed in Architecture & Engineering in Kennewick, WA?
99338 has the Highest Percentage of Population Employed in Architecture & Engineering in Kennewick, WA with 3.6%.
What is the Percentage of Population Employed in Architecture & Engineering in Kennewick, WA?
Percentage of Population Employed in Architecture & Engineering in Kennewick is 2.1%.
What is the Percentage of Population Employed in Architecture & Engineering in Washington?
Percentage of Population Employed in Architecture & Engineering in Washington is 2.8%.
What is the Percentage of Population Employed in Architecture & Engineering in the United States?
Percentage of Population Employed in Architecture & Engineering in the United States is 2.1%.