Riverbend, WA Map & Demographics
Riverbend Map
Riverbend Overview
$63,213
PER CAPITA INCOME
$139,583
AVG FAMILY INCOME
$145,764
AVG HOUSEHOLD INCOME
31.5%
WAGE / INCOME GAP [ % ]
68.5¢/ $1
WAGE / INCOME GAP [ $ ]
0.40
INEQUALITY / GINI INDEX
2,041
TOTAL POPULATION
1,082
MALE POPULATION
959
FEMALE POPULATION
112.83
MALES / 100 FEMALES
88.63
FEMALES / 100 MALES
40.3
MEDIAN AGE
3.0
AVG FAMILY SIZE
2.9
AVG HOUSEHOLD SIZE
1,204
LABOR FORCE [ PEOPLE ]
73.0%
PERCENT IN LABOR FORCE
1.6%
UNEMPLOYMENT RATE
Income in Riverbend
Income Overview in Riverbend
Per Capita Income in Riverbend is $63,213, while median incomes of families and households are $139,583 and $145,764 respectively.
| Characteristic | Number | Measure |
| Per Capita Income | 2,041 | $63,213 |
| Median Family Income | 610 | $139,583 |
| Mean Family Income | 610 | $166,998 |
| Median Household Income | 717 | $145,764 |
| Mean Household Income | 717 | $175,881 |
| Income Deficit | 610 | $0 |
| Wage / Income Gap (%) | 2,041 | 31.47% |
| Wage / Income Gap ($) | 2,041 | 68.53¢ per $1 |
| Gini / Inequality Index | 2,041 | 0.40 |
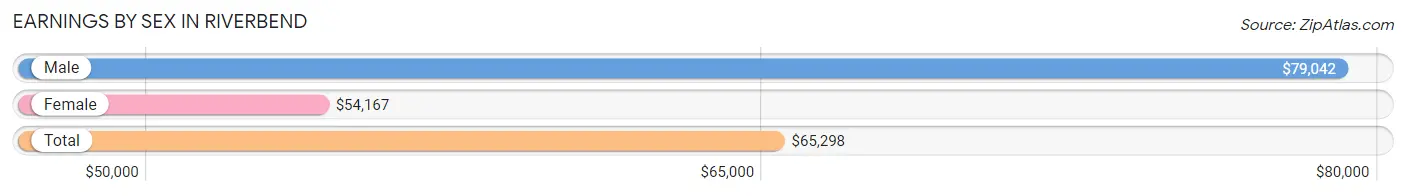
Earnings by Sex in Riverbend
Average Earnings in Riverbend are $65,298, $79,042 for men and $54,167 for women, a difference of 31.5%.
| Sex | Number | Average Earnings |
| Male | 717 (57.1%) | $79,042 |
| Female | 538 (42.9%) | $54,167 |
| Total | 1,255 (100.0%) | $65,298 |
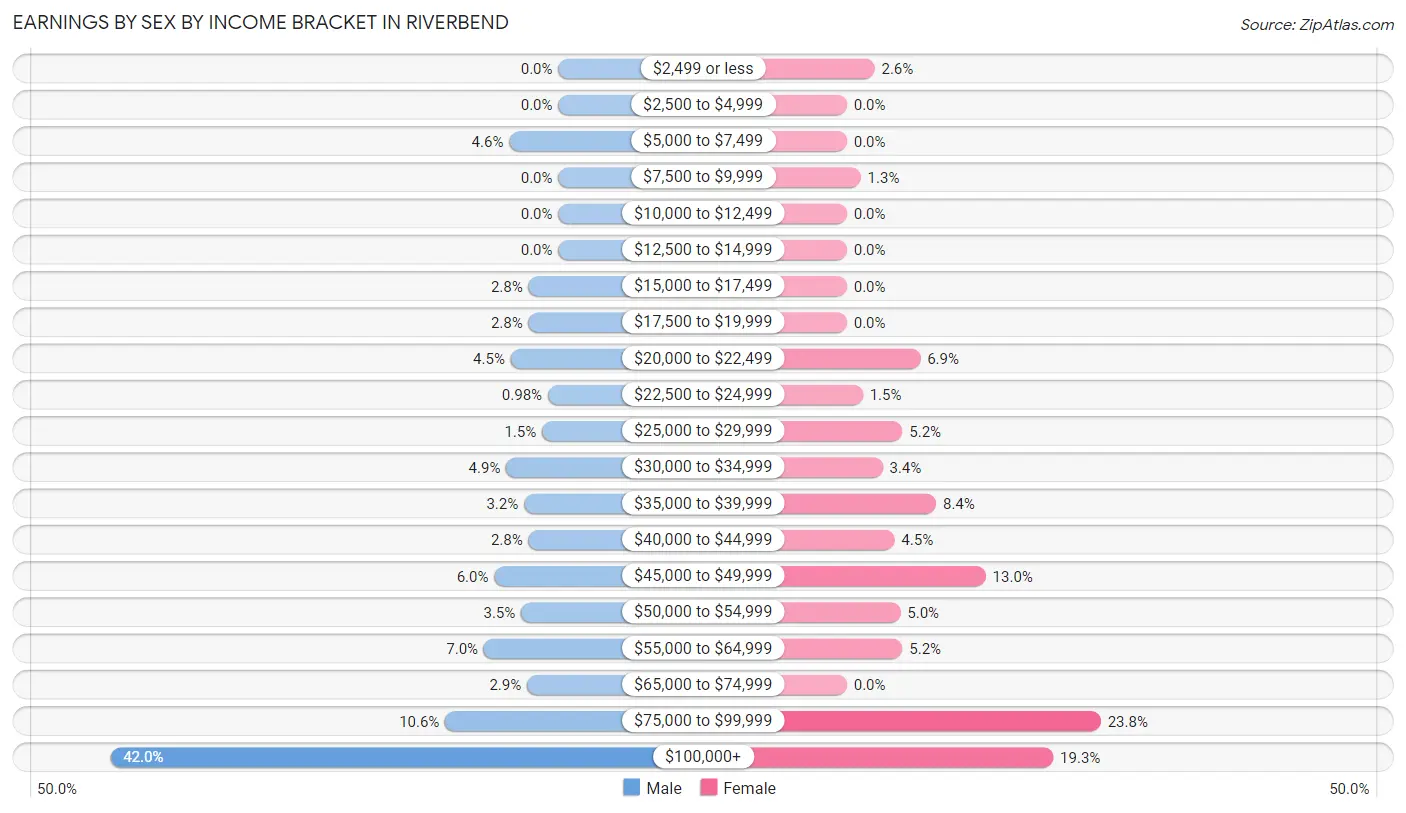
Earnings by Sex by Income Bracket in Riverbend
The most common earnings brackets in Riverbend are $100,000+ for men (301 | 42.0%) and $75,000 to $99,999 for women (128 | 23.8%).
| Income | Male | Female |
| $2,499 or less | 0 (0.0%) | 14 (2.6%) |
| $2,500 to $4,999 | 0 (0.0%) | 0 (0.0%) |
| $5,000 to $7,499 | 33 (4.6%) | 0 (0.0%) |
| $7,500 to $9,999 | 0 (0.0%) | 7 (1.3%) |
| $10,000 to $12,499 | 0 (0.0%) | 0 (0.0%) |
| $12,500 to $14,999 | 0 (0.0%) | 0 (0.0%) |
| $15,000 to $17,499 | 20 (2.8%) | 0 (0.0%) |
| $17,500 to $19,999 | 20 (2.8%) | 0 (0.0%) |
| $20,000 to $22,499 | 32 (4.5%) | 37 (6.9%) |
| $22,500 to $24,999 | 7 (1.0%) | 8 (1.5%) |
| $25,000 to $29,999 | 11 (1.5%) | 28 (5.2%) |
| $30,000 to $34,999 | 35 (4.9%) | 18 (3.4%) |
| $35,000 to $39,999 | 23 (3.2%) | 45 (8.4%) |
| $40,000 to $44,999 | 20 (2.8%) | 24 (4.5%) |
| $45,000 to $49,999 | 43 (6.0%) | 70 (13.0%) |
| $50,000 to $54,999 | 25 (3.5%) | 27 (5.0%) |
| $55,000 to $64,999 | 50 (7.0%) | 28 (5.2%) |
| $65,000 to $74,999 | 21 (2.9%) | 0 (0.0%) |
| $75,000 to $99,999 | 76 (10.6%) | 128 (23.8%) |
| $100,000+ | 301 (42.0%) | 104 (19.3%) |
| Total | 717 (100.0%) | 538 (100.0%) |
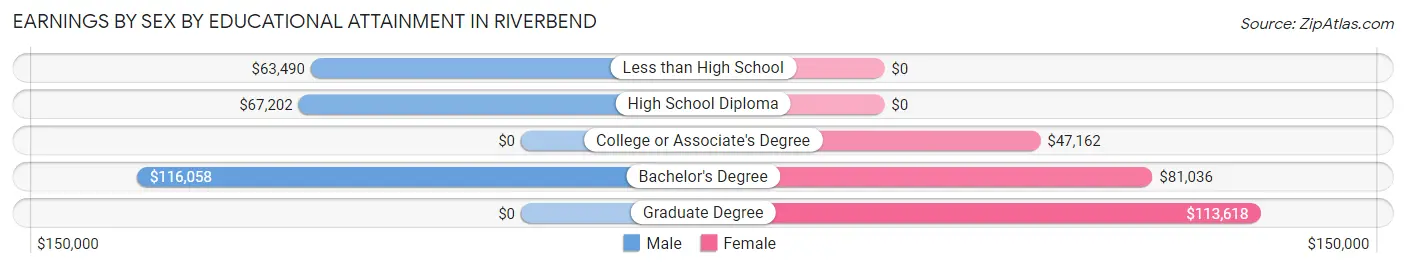
Earnings by Sex by Educational Attainment in Riverbend
Average earnings in Riverbend are $90,000 for men and $58,705 for women, a difference of 34.8%. Men with an educational attainment of bachelor's degree enjoy the highest average annual earnings of $116,058, while those with less than high school education earn the least with $63,490. Women with an educational attainment of graduate degree earn the most with the average annual earnings of $113,618, while those with college or associate's degree education have the smallest earnings of $47,162.
| Educational Attainment | Male Income | Female Income |
| Less than High School | $63,490 | $0 |
| High School Diploma | $67,202 | $0 |
| College or Associate's Degree | - | - |
| Bachelor's Degree | $116,058 | $81,036 |
| Graduate Degree | - | - |
| Total | $90,000 | $58,705 |
Family Income in Riverbend
Family Income Brackets in Riverbend
According to the Riverbend family income data, there are 210 families falling into the $200,000+ income range, which is the most common income bracket and makes up 34.4% of all families.
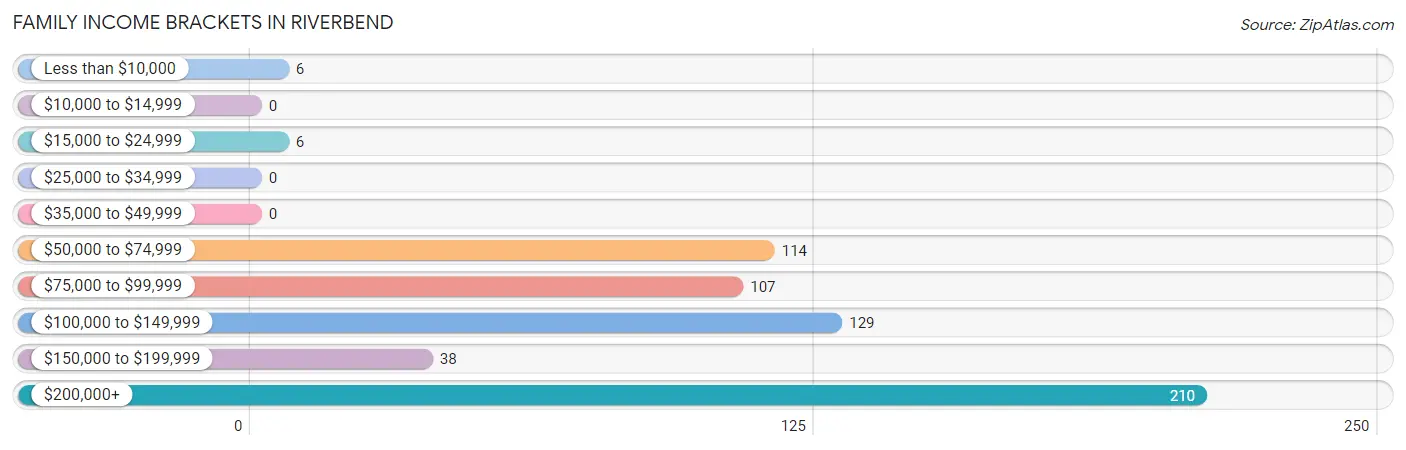
| Income Bracket | # Families | % Families |
| Less than $10,000 | 6 | 1.0% |
| $10,000 to $14,999 | 0 | 0.0% |
| $15,000 to $24,999 | 6 | 1.0% |
| $25,000 to $34,999 | 0 | 0.0% |
| $35,000 to $49,999 | 0 | 0.0% |
| $50,000 to $74,999 | 114 | 18.7% |
| $75,000 to $99,999 | 107 | 17.5% |
| $100,000 to $149,999 | 129 | 21.1% |
| $150,000 to $199,999 | 38 | 6.2% |
| $200,000+ | 210 | 34.4% |
Family Income by Famaliy Size in Riverbend
4-person families (159 | 26.1%) account for the highest median family income in Riverbend with $196,042 per family, while 2-person families (247 | 40.5%) have the highest median income of $59,336 per family member.
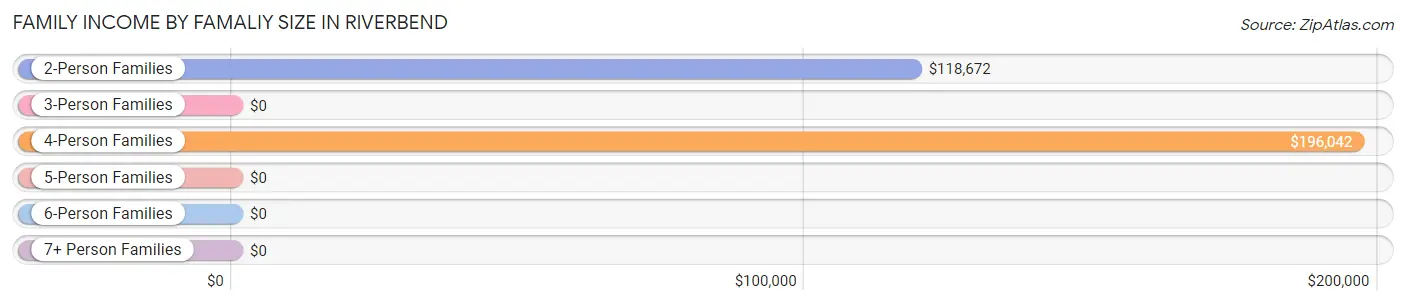
| Income Bracket | # Families | Median Income |
| 2-Person Families | 247 (40.5%) | $118,672 |
| 3-Person Families | 179 (29.3%) | $0 |
| 4-Person Families | 159 (26.1%) | $196,042 |
| 5-Person Families | 25 (4.1%) | $0 |
| 6-Person Families | 0 (0.0%) | $0 |
| 7+ Person Families | 0 (0.0%) | $0 |
| Total | 610 (100.0%) | $139,583 |
Family Income by Number of Earners in Riverbend
The median family income in Riverbend is $139,583, with families comprising 3+ earners (107) having the highest median family income of $250,001, while families with no earners (71) have the lowest median family income of $87,132, accounting for 17.5% and 11.6% of families, respectively.
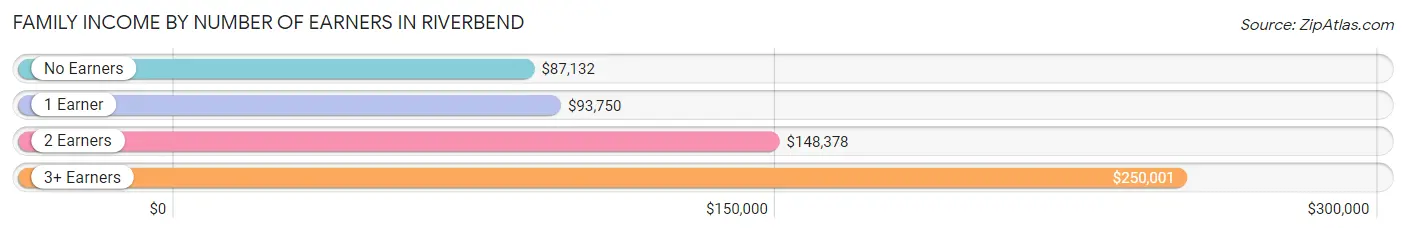
| Number of Earners | # Families | Median Income |
| No Earners | 71 (11.6%) | $87,132 |
| 1 Earner | 160 (26.2%) | $93,750 |
| 2 Earners | 272 (44.6%) | $148,378 |
| 3+ Earners | 107 (17.5%) | $250,001 |
| Total | 610 (100.0%) | $139,583 |
Household Income in Riverbend
Household Income Brackets in Riverbend
With 254 households falling in the category, the $200,000+ income range is the most frequent in Riverbend, accounting for 35.4% of all households.
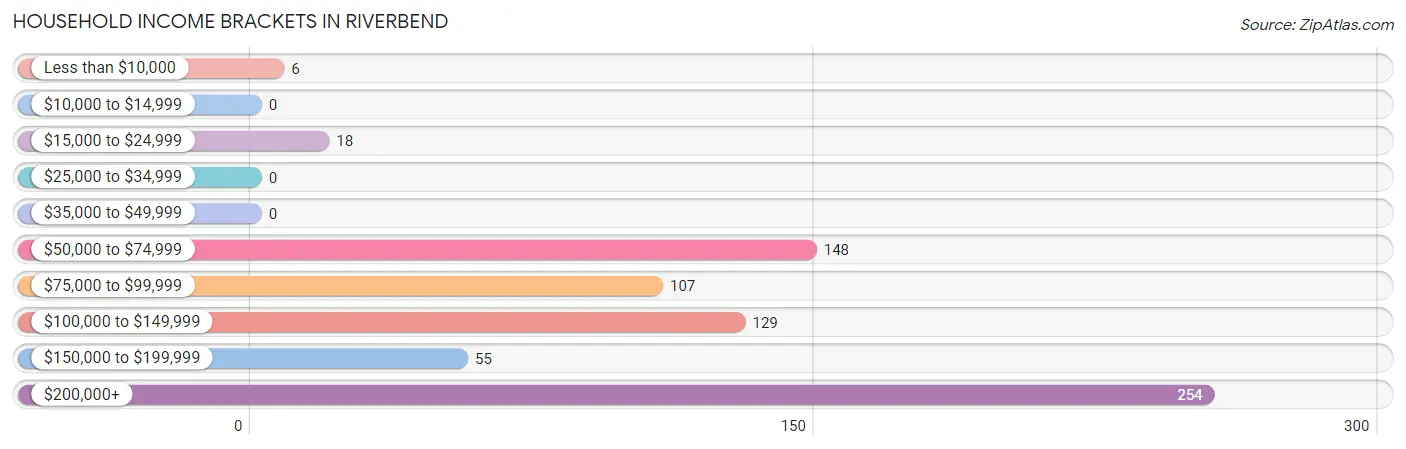
| Income Bracket | # Households | % Households |
| Less than $10,000 | 6 | 0.8% |
| $10,000 to $14,999 | 0 | 0.0% |
| $15,000 to $24,999 | 18 | 2.5% |
| $25,000 to $34,999 | 0 | 0.0% |
| $35,000 to $49,999 | 0 | 0.0% |
| $50,000 to $74,999 | 148 | 20.6% |
| $75,000 to $99,999 | 107 | 14.9% |
| $100,000 to $149,999 | 129 | 18.0% |
| $150,000 to $199,999 | 55 | 7.7% |
| $200,000+ | 254 | 35.4% |
Household Income by Householder Age in Riverbend
The median household income in Riverbend is $145,764, with the highest median household income of $205,156 found in the 25 to 44 years age bracket for the primary householder. A total of 214 households (29.8%) fall into this category.
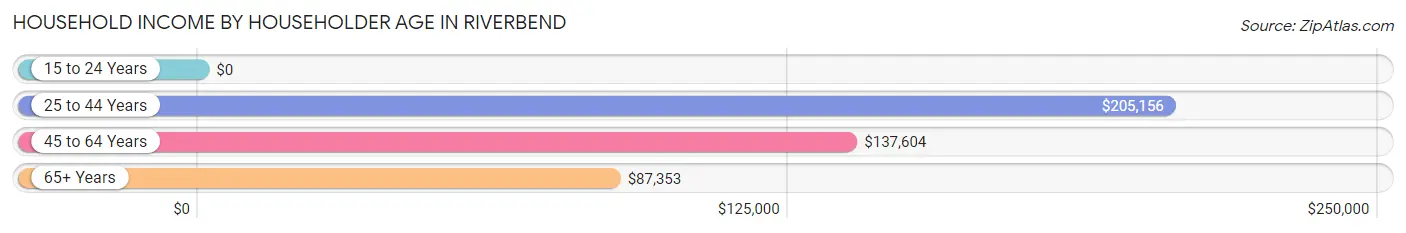
| Income Bracket | # Households | Median Income |
| 15 to 24 Years | 0 (0.0%) | $0 |
| 25 to 44 Years | 214 (29.8%) | $205,156 |
| 45 to 64 Years | 391 (54.5%) | $137,604 |
| 65+ Years | 112 (15.6%) | $87,353 |
| Total | 717 (100.0%) | $145,764 |
Poverty in Riverbend
Income Below Poverty by Sex and Age in Riverbend
With 2.4% poverty level for males and 3.6% for females among the residents of Riverbend, 65 to 74 year old males and 15 year old females are the most vulnerable to poverty, with 6 males (14.6%) and 7 females (100.0%) in their respective age groups living below the poverty level.
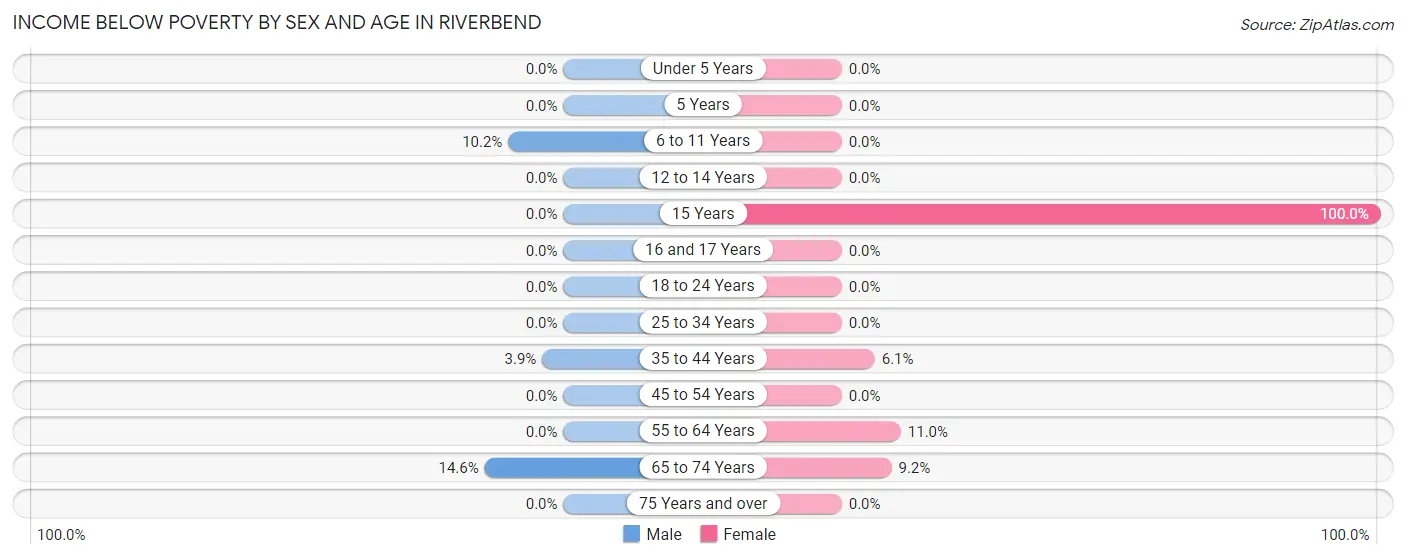
| Age Bracket | Male | Female |
| Under 5 Years | 0 (0.0%) | 0 (0.0%) |
| 5 Years | 0 (0.0%) | 0 (0.0%) |
| 6 to 11 Years | 13 (10.2%) | 0 (0.0%) |
| 12 to 14 Years | 0 (0.0%) | 0 (0.0%) |
| 15 Years | 0 (0.0%) | 7 (100.0%) |
| 16 and 17 Years | 0 (0.0%) | 0 (0.0%) |
| 18 to 24 Years | 0 (0.0%) | 0 (0.0%) |
| 25 to 34 Years | 0 (0.0%) | 0 (0.0%) |
| 35 to 44 Years | 7 (3.9%) | 6 (6.1%) |
| 45 to 54 Years | 0 (0.0%) | 0 (0.0%) |
| 55 to 64 Years | 0 (0.0%) | 16 (11.0%) |
| 65 to 74 Years | 6 (14.6%) | 6 (9.2%) |
| 75 Years and over | 0 (0.0%) | 0 (0.0%) |
| Total | 26 (2.4%) | 35 (3.6%) |
Income Above Poverty by Sex and Age in Riverbend
According to the poverty statistics in Riverbend, males aged under 5 years and females aged under 5 years are the age groups that are most secure financially, with 100.0% of males and 100.0% of females in these age groups living above the poverty line.
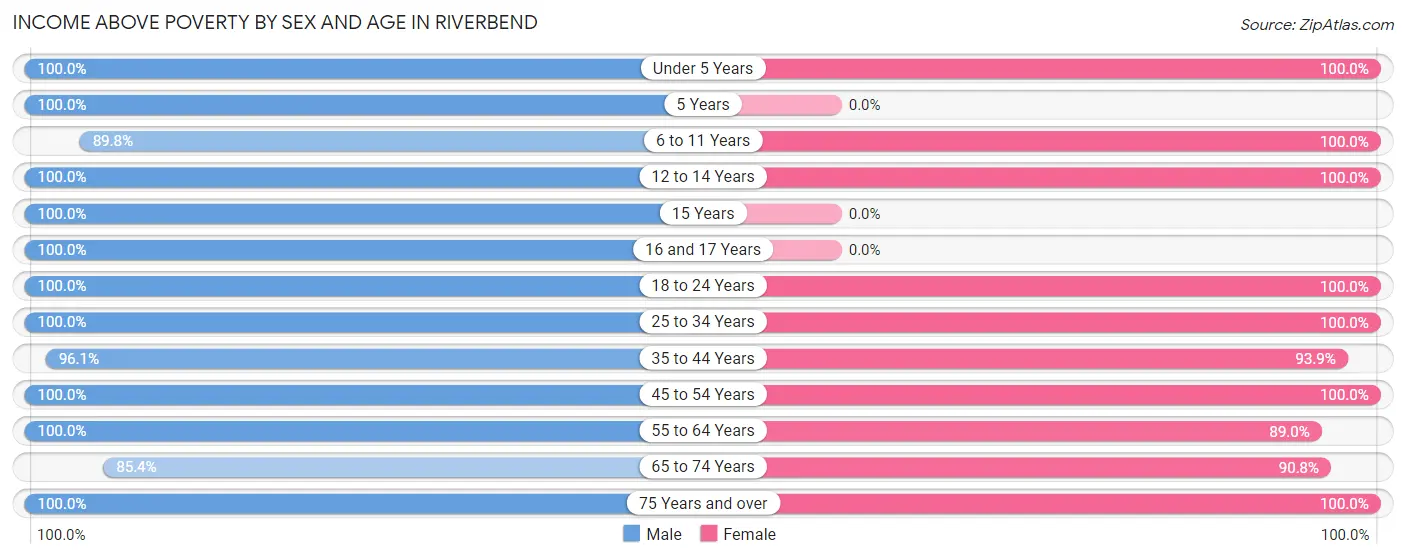
| Age Bracket | Male | Female |
| Under 5 Years | 11 (100.0%) | 23 (100.0%) |
| 5 Years | 12 (100.0%) | 0 (0.0%) |
| 6 to 11 Years | 114 (89.8%) | 58 (100.0%) |
| 12 to 14 Years | 36 (100.0%) | 102 (100.0%) |
| 15 Years | 16 (100.0%) | 0 (0.0%) |
| 16 and 17 Years | 62 (100.0%) | 0 (0.0%) |
| 18 to 24 Years | 20 (100.0%) | 45 (100.0%) |
| 25 to 34 Years | 197 (100.0%) | 121 (100.0%) |
| 35 to 44 Years | 171 (96.1%) | 92 (93.9%) |
| 45 to 54 Years | 171 (100.0%) | 231 (100.0%) |
| 55 to 64 Years | 163 (100.0%) | 130 (89.0%) |
| 65 to 74 Years | 35 (85.4%) | 59 (90.8%) |
| 75 Years and over | 48 (100.0%) | 63 (100.0%) |
| Total | 1,056 (97.6%) | 924 (96.4%) |
Income Below Poverty Among Married-Couple Families in Riverbend
The poverty statistics for married-couple families in Riverbend show that 2.7% or 12 of the total 446 families live below the poverty line. Families with 3 or 4 children have the highest poverty rate of 100.0%, comprising of 6 families. On the other hand, families with 1 or 2 children have the lowest poverty rate of 0.0%, which includes 0 families.
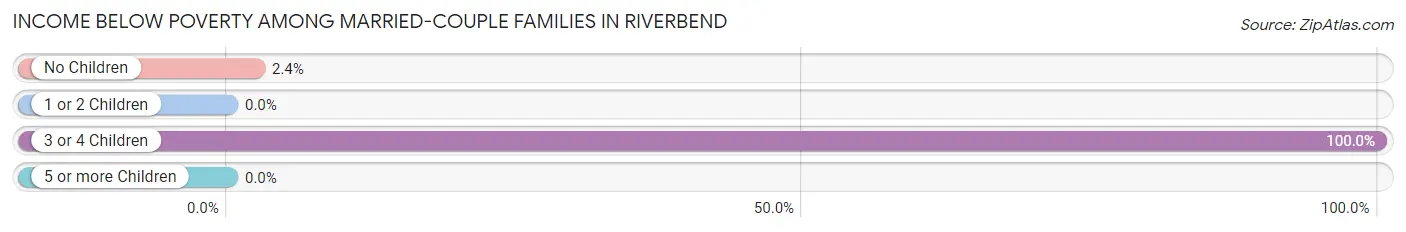
| Children | Above Poverty | Below Poverty |
| No Children | 249 (97.7%) | 6 (2.4%) |
| 1 or 2 Children | 185 (100.0%) | 0 (0.0%) |
| 3 or 4 Children | 0 (0.0%) | 6 (100.0%) |
| 5 or more Children | 0 (0.0%) | 0 (0.0%) |
| Total | 434 (97.3%) | 12 (2.7%) |
Income Below Poverty Among Single-Parent Households in Riverbend
| Children | Single Father | Single Mother |
| No Children | 0 (0.0%) | 0 (0.0%) |
| 1 or 2 Children | 0 (0.0%) | 0 (0.0%) |
| 3 or 4 Children | 0 (0.0%) | 0 (0.0%) |
| 5 or more Children | 0 (0.0%) | 0 (0.0%) |
| Total | 0 (0.0%) | 0 (0.0%) |
Income Below Poverty Among Married-Couple vs Single-Parent Households in Riverbend
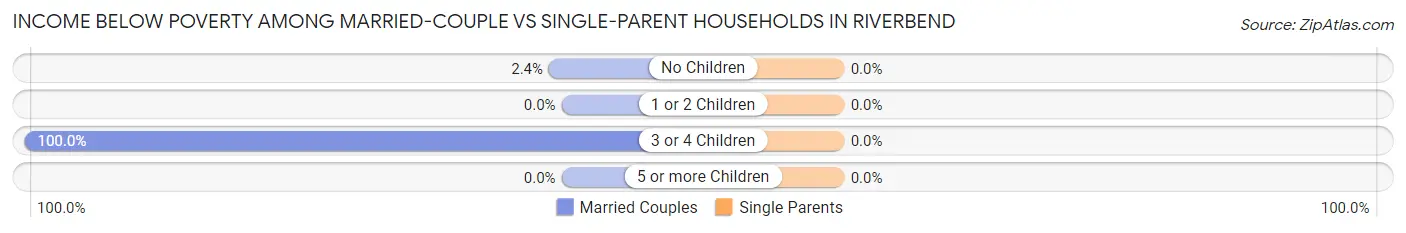
| Children | Married-Couple Families | Single-Parent Households |
| No Children | 6 (2.4%) | 0 (0.0%) |
| 1 or 2 Children | 0 (0.0%) | 0 (0.0%) |
| 3 or 4 Children | 6 (100.0%) | 0 (0.0%) |
| 5 or more Children | 0 (0.0%) | 0 (0.0%) |
| Total | 12 (2.7%) | 0 (0.0%) |
Race in Riverbend
The most populous races in Riverbend are White / Caucasian (1,772 | 86.8%), Hispanic or Latino (105 | 5.1%), and Native / Alaskan (105 | 5.1%).
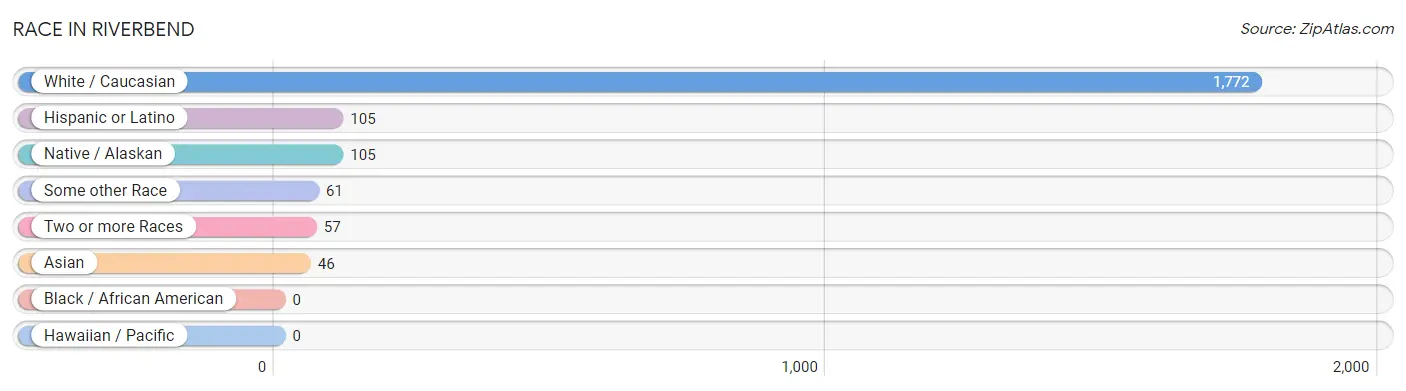
| Race | # Population | % Population |
| Asian | 46 | 2.2% |
| Black / African American | 0 | 0.0% |
| Hawaiian / Pacific | 0 | 0.0% |
| Hispanic or Latino | 105 | 5.1% |
| Native / Alaskan | 105 | 5.1% |
| White / Caucasian | 1,772 | 86.8% |
| Two or more Races | 57 | 2.8% |
| Some other Race | 61 | 3.0% |
| Total | 2,041 | 100.0% |
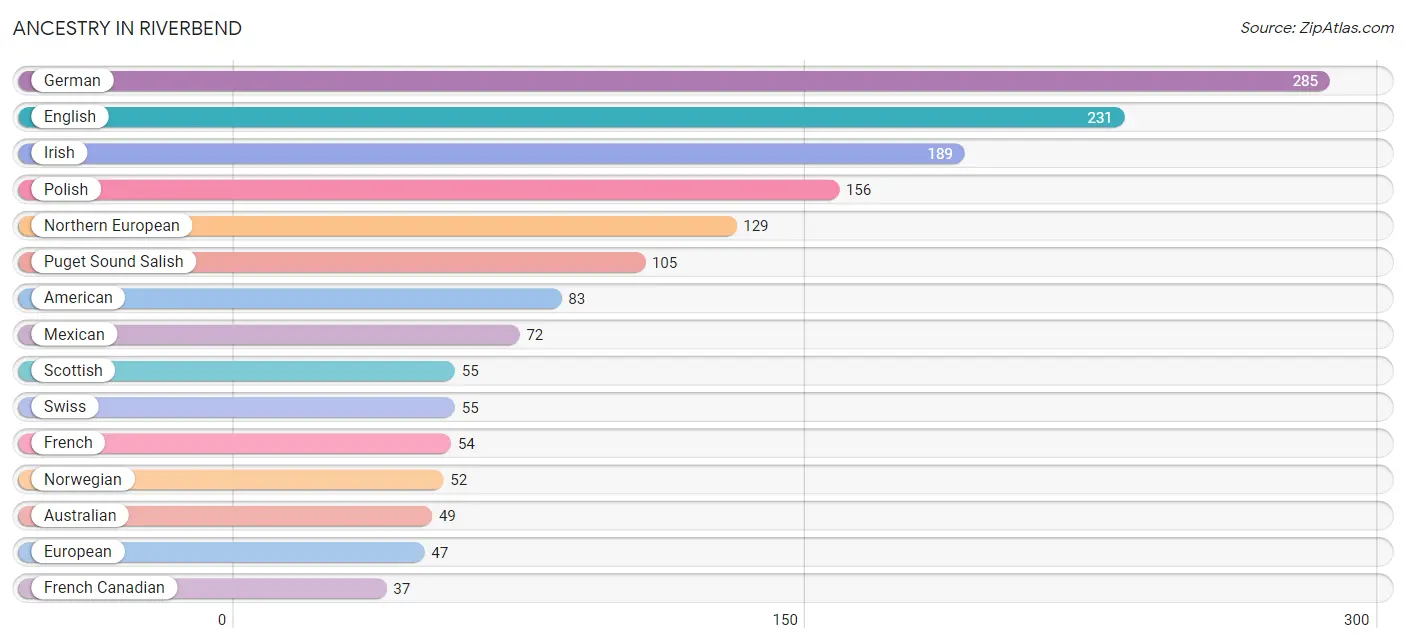
Ancestry in Riverbend
The most populous ancestries reported in Riverbend are German (285 | 14.0%), English (231 | 11.3%), Irish (189 | 9.3%), Polish (156 | 7.6%), and Northern European (129 | 6.3%), together accounting for 48.5% of all Riverbend residents.
| Ancestry | # Population | % Population |
| American | 83 | 4.1% |
| Australian | 49 | 2.4% |
| Brazilian | 29 | 1.4% |
| British | 27 | 1.3% |
| Cherokee | 27 | 1.3% |
| Croatian | 27 | 1.3% |
| English | 231 | 11.3% |
| European | 47 | 2.3% |
| French | 54 | 2.6% |
| French Canadian | 37 | 1.8% |
| German | 285 | 14.0% |
| Indian (Asian) | 19 | 0.9% |
| Irish | 189 | 9.3% |
| Mexican | 72 | 3.5% |
| Northern European | 129 | 6.3% |
| Norwegian | 52 | 2.5% |
| Pakistani | 27 | 1.3% |
| Polish | 156 | 7.6% |
| Puget Sound Salish | 105 | 5.1% |
| Scandinavian | 14 | 0.7% |
| Scottish | 55 | 2.7% |
| Spaniard | 21 | 1.0% |
| Spanish | 12 | 0.6% |
| Swedish | 32 | 1.6% |
| Swiss | 55 | 2.7% |
| Yugoslavian | 10 | 0.5% | View All 26 Rows |
Immigrants in Riverbend
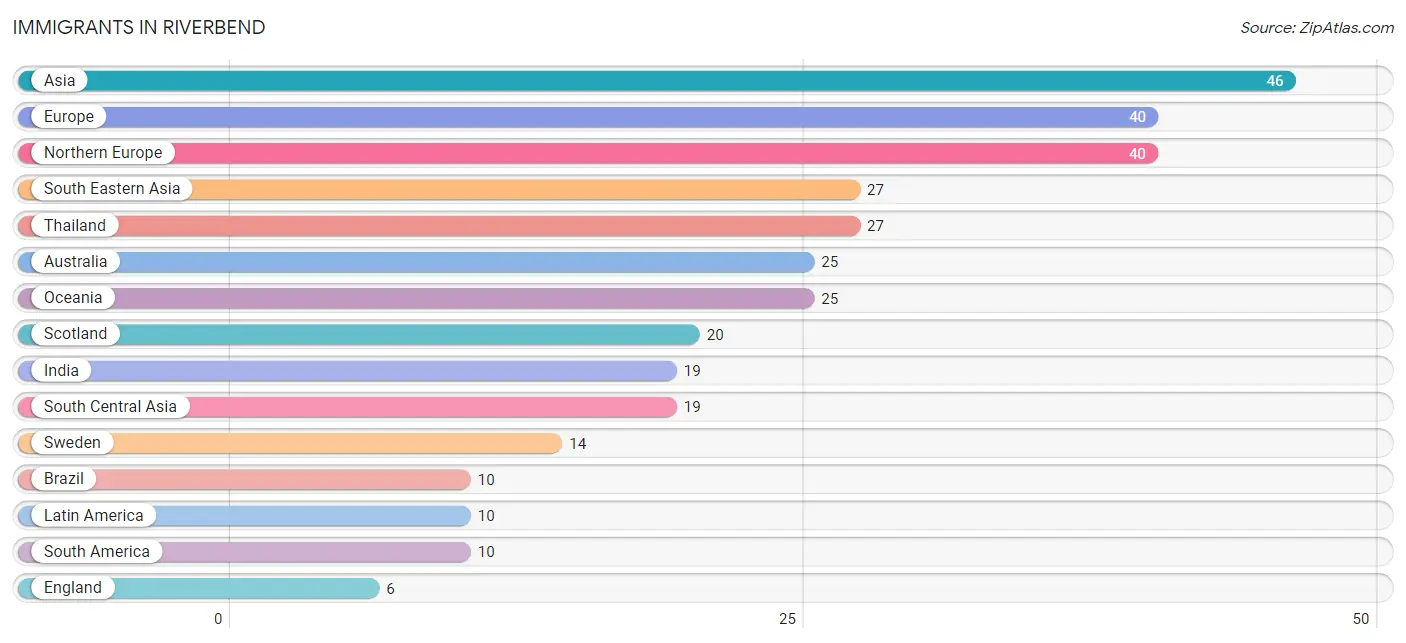
The most numerous immigrant groups reported in Riverbend came from Asia (46 | 2.2%), Europe (40 | 2.0%), Northern Europe (40 | 2.0%), South Eastern Asia (27 | 1.3%), and Thailand (27 | 1.3%), together accounting for 8.8% of all Riverbend residents.
| Immigration Origin | # Population | % Population |
| Asia | 46 | 2.2% |
| Australia | 25 | 1.2% |
| Brazil | 10 | 0.5% |
| England | 6 | 0.3% |
| Europe | 40 | 2.0% |
| India | 19 | 0.9% |
| Latin America | 10 | 0.5% |
| Northern Europe | 40 | 2.0% |
| Oceania | 25 | 1.2% |
| Scotland | 20 | 1.0% |
| South America | 10 | 0.5% |
| South Central Asia | 19 | 0.9% |
| South Eastern Asia | 27 | 1.3% |
| Sweden | 14 | 0.7% |
| Thailand | 27 | 1.3% | View All 15 Rows |
Sex and Age in Riverbend
Sex and Age in Riverbend
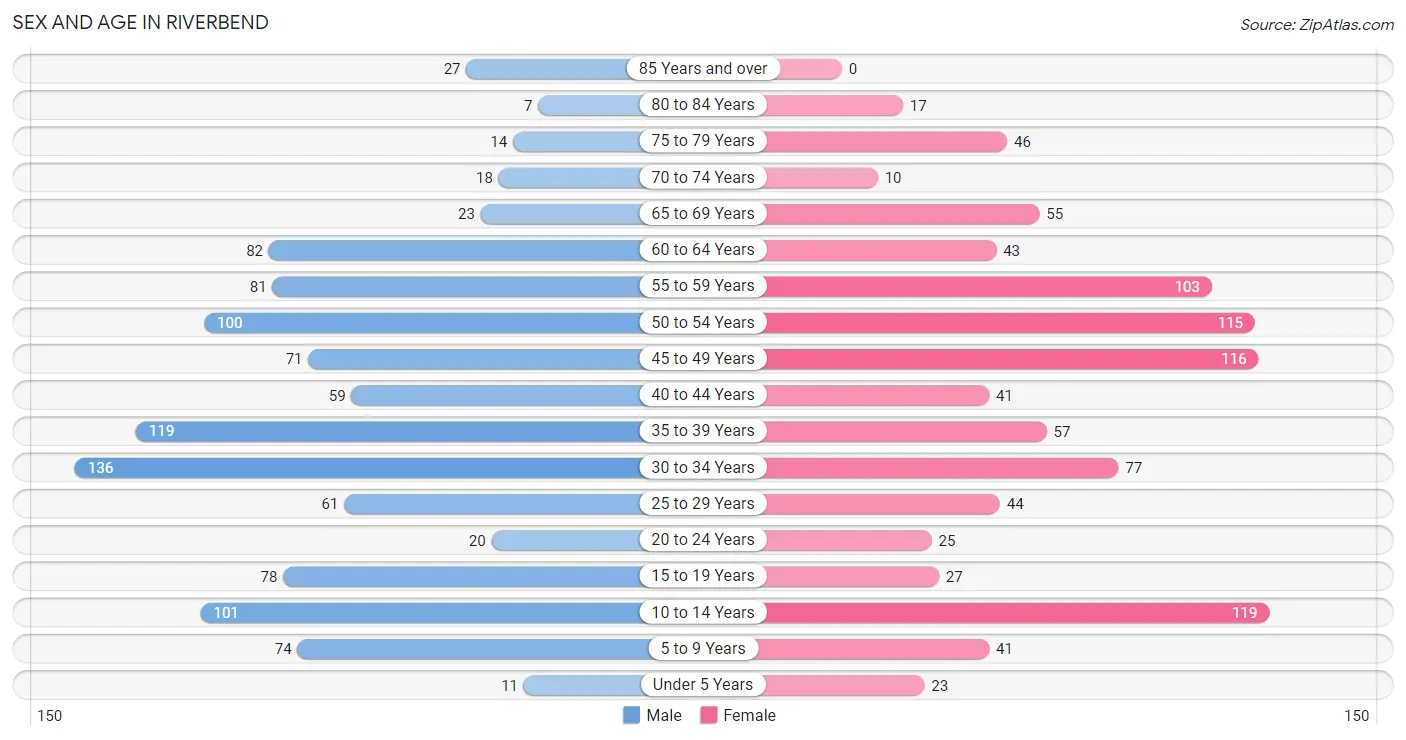
The most populous age groups in Riverbend are 30 to 34 Years (136 | 12.6%) for men and 10 to 14 Years (119 | 12.4%) for women.
| Age Bracket | Male | Female |
| Under 5 Years | 11 (1.0%) | 23 (2.4%) |
| 5 to 9 Years | 74 (6.8%) | 41 (4.3%) |
| 10 to 14 Years | 101 (9.3%) | 119 (12.4%) |
| 15 to 19 Years | 78 (7.2%) | 27 (2.8%) |
| 20 to 24 Years | 20 (1.8%) | 25 (2.6%) |
| 25 to 29 Years | 61 (5.6%) | 44 (4.6%) |
| 30 to 34 Years | 136 (12.6%) | 77 (8.0%) |
| 35 to 39 Years | 119 (11.0%) | 57 (5.9%) |
| 40 to 44 Years | 59 (5.4%) | 41 (4.3%) |
| 45 to 49 Years | 71 (6.6%) | 116 (12.1%) |
| 50 to 54 Years | 100 (9.2%) | 115 (12.0%) |
| 55 to 59 Years | 81 (7.5%) | 103 (10.7%) |
| 60 to 64 Years | 82 (7.6%) | 43 (4.5%) |
| 65 to 69 Years | 23 (2.1%) | 55 (5.7%) |
| 70 to 74 Years | 18 (1.7%) | 10 (1.0%) |
| 75 to 79 Years | 14 (1.3%) | 46 (4.8%) |
| 80 to 84 Years | 7 (0.6%) | 17 (1.8%) |
| 85 Years and over | 27 (2.5%) | 0 (0.0%) |
| Total | 1,082 (100.0%) | 959 (100.0%) |
Families and Households in Riverbend
Median Family Size in Riverbend
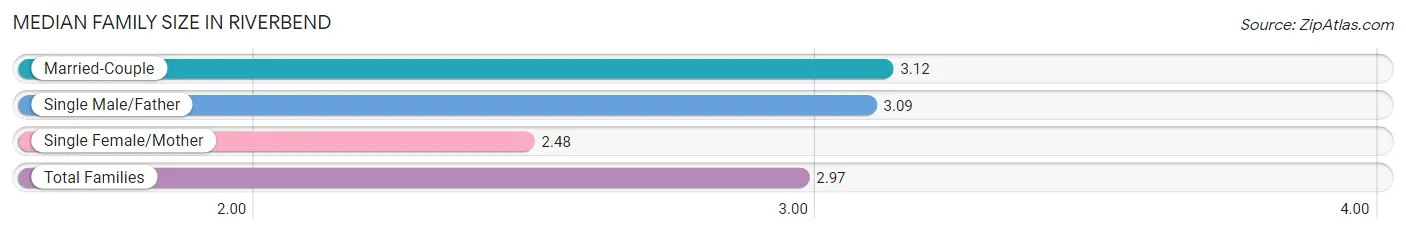
The median family size in Riverbend is 2.97 persons per family, with married-couple families (446 | 73.1%) accounting for the largest median family size of 3.12 persons per family. On the other hand, single female/mother families (141 | 23.1%) represent the smallest median family size with 2.48 persons per family.
| Family Type | # Families | Family Size |
| Married-Couple | 446 (73.1%) | 3.12 |
| Single Male/Father | 23 (3.8%) | 3.09 |
| Single Female/Mother | 141 (23.1%) | 2.48 |
| Total Families | 610 (100.0%) | 2.97 |
Median Household Size in Riverbend
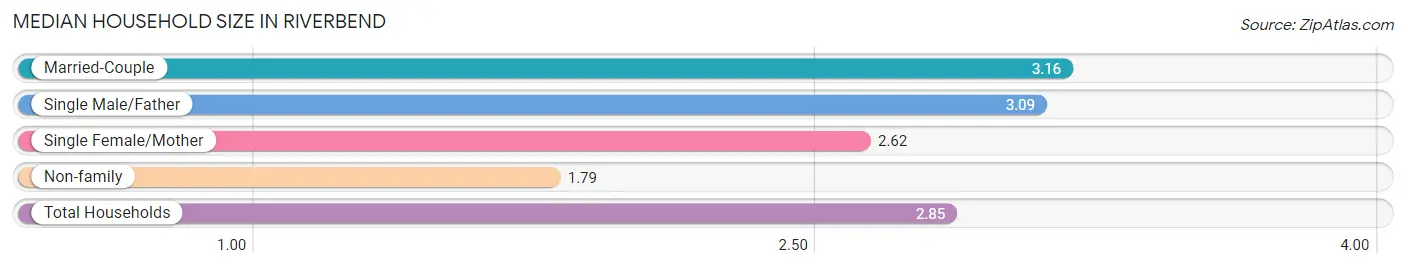
The median household size in Riverbend is 2.85 persons per household, with married-couple households (446 | 62.2%) accounting for the largest median household size of 3.16 persons per household. non-family households (107 | 14.9%) represent the smallest median household size with 1.79 persons per household.
| Household Type | # Households | Household Size |
| Married-Couple | 446 (62.2%) | 3.16 |
| Single Male/Father | 23 (3.2%) | 3.09 |
| Single Female/Mother | 141 (19.7%) | 2.62 |
| Non-family | 107 (14.9%) | 1.79 |
| Total Households | 717 (100.0%) | 2.85 |
Household Size by Marriage Status in Riverbend
Out of a total of 717 households in Riverbend, 610 (85.1%) are family households, while 107 (14.9%) are nonfamily households. The most numerous type of family households are 2-person households, comprising 247, and the most common type of nonfamily households are 1-person households, comprising 61.
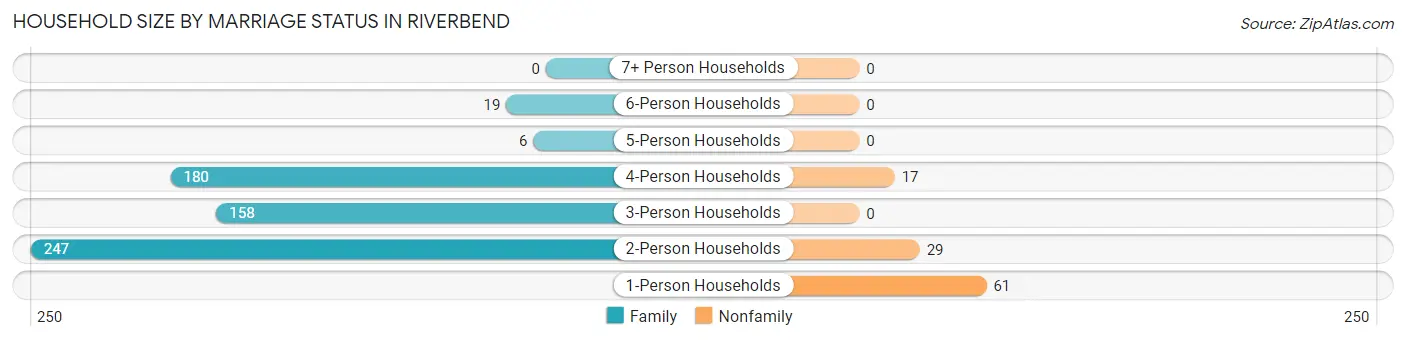
| Household Size | Family Households | Nonfamily Households |
| 1-Person Households | - | 61 (8.5%) |
| 2-Person Households | 247 (34.4%) | 29 (4.0%) |
| 3-Person Households | 158 (22.0%) | 0 (0.0%) |
| 4-Person Households | 180 (25.1%) | 17 (2.4%) |
| 5-Person Households | 6 (0.8%) | 0 (0.0%) |
| 6-Person Households | 19 (2.6%) | 0 (0.0%) |
| 7+ Person Households | 0 (0.0%) | 0 (0.0%) |
| Total | 610 (85.1%) | 107 (14.9%) |
Female Fertility in Riverbend
Fertility by Age in Riverbend
Average fertility rate in Riverbend is 17.0 births per 1,000 women. Women in the age bracket of 20 to 34 years have the highest fertility rate with 48.0 births per 1,000 women. Women in the age bracket of 20 to 34 years acount for 100.0% of all women with births.
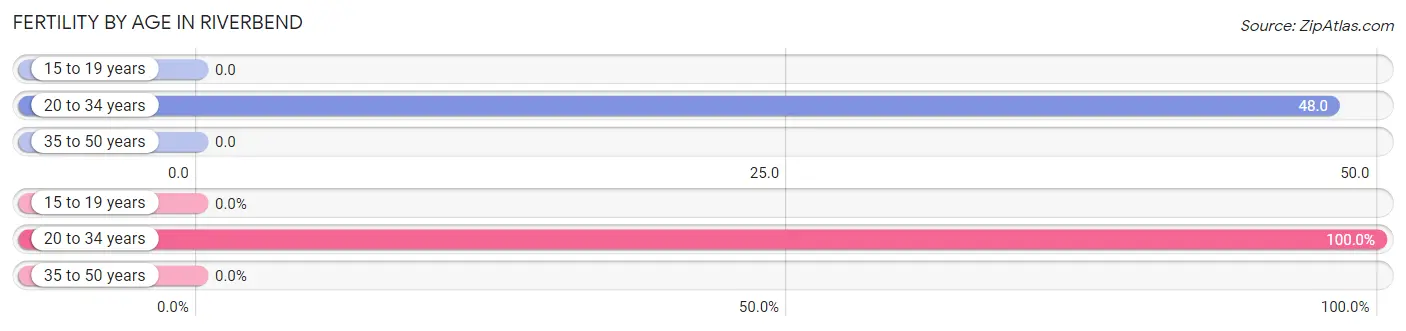
| Age Bracket | Women with Births | Births / 1,000 Women |
| 15 to 19 years | 0 (0.0%) | 0.0 |
| 20 to 34 years | 7 (100.0%) | 48.0 |
| 35 to 50 years | 0 (0.0%) | 0.0 |
| Total | 7 (100.0%) | 17.0 |
Fertility by Age by Marriage Status in Riverbend
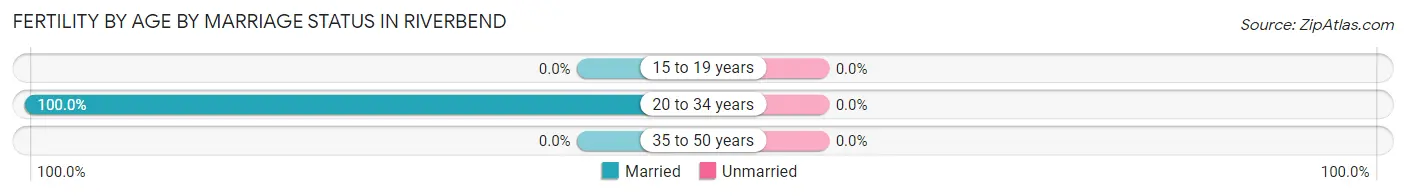
| Age Bracket | Married | Unmarried |
| 15 to 19 years | 0 (0.0%) | 0 (0.0%) |
| 20 to 34 years | 7 (100.0%) | 0 (0.0%) |
| 35 to 50 years | 0 (0.0%) | 0 (0.0%) |
| Total | 7 (100.0%) | 0 (0.0%) |
Fertility by Education in Riverbend
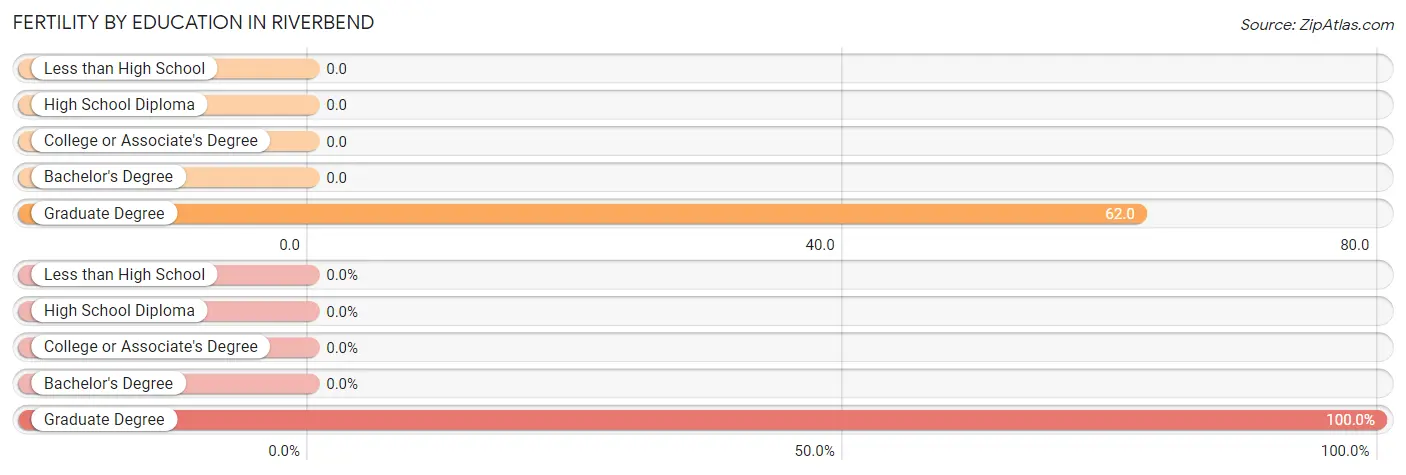
| Educational Attainment | Women with Births | Births / 1,000 Women |
| Less than High School | 0 (0.0%) | 0.0 |
| High School Diploma | 0 (0.0%) | 0.0 |
| College or Associate's Degree | 0 (0.0%) | 0.0 |
| Bachelor's Degree | 0 (0.0%) | 0.0 |
| Graduate Degree | 7 (100.0%) | 62.0 |
| Total | 7 (100.0%) | 17.0 |
Fertility by Education by Marriage Status in Riverbend
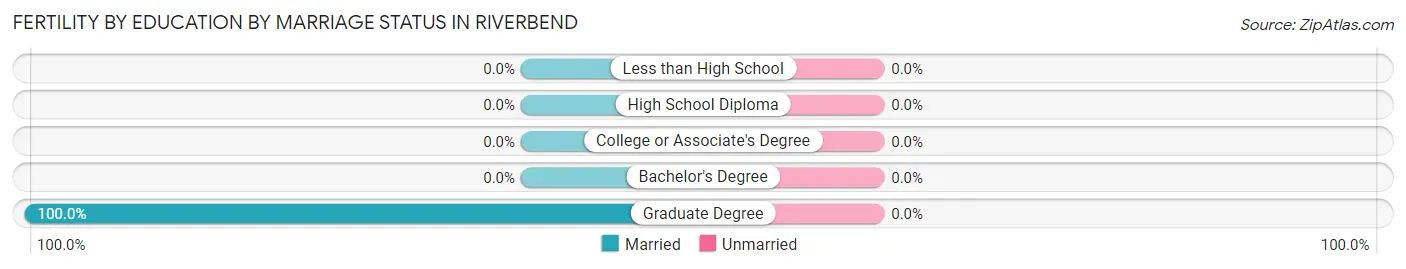
| Educational Attainment | Married | Unmarried |
| Less than High School | 0 (0.0%) | 0 (0.0%) |
| High School Diploma | 0 (0.0%) | 0 (0.0%) |
| College or Associate's Degree | 0 (0.0%) | 0 (0.0%) |
| Bachelor's Degree | 0 (0.0%) | 0 (0.0%) |
| Graduate Degree | 7 (100.0%) | 0 (0.0%) |
| Total | 7 (100.0%) | 0 (0.0%) |
Employment Characteristics in Riverbend
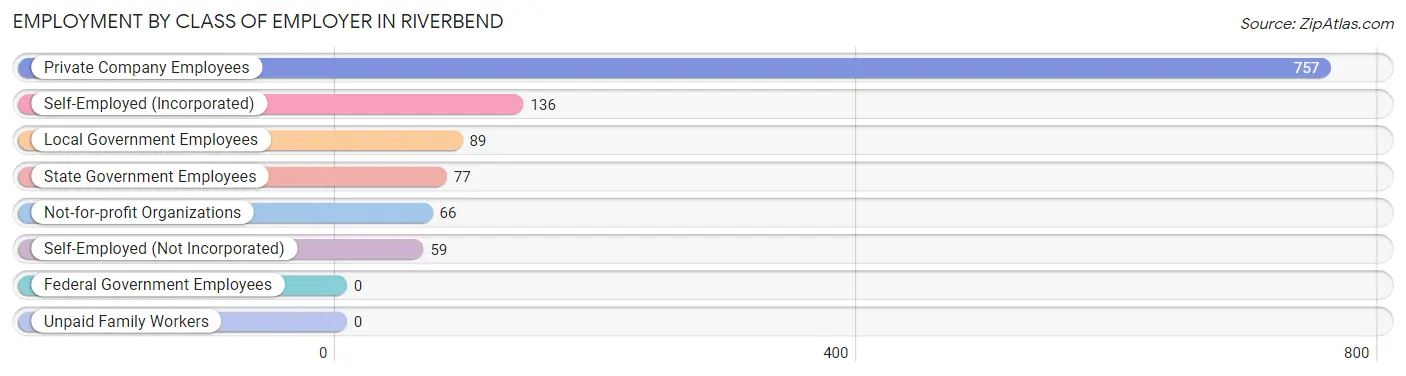
Employment by Class of Employer in Riverbend
Among the 1,184 employed individuals in Riverbend, private company employees (757 | 63.9%), self-employed (incorporated) (136 | 11.5%), and local government employees (89 | 7.5%) make up the most common classes of employment.
| Employer Class | # Employees | % Employees |
| Private Company Employees | 757 | 63.9% |
| Self-Employed (Incorporated) | 136 | 11.5% |
| Self-Employed (Not Incorporated) | 59 | 5.0% |
| Not-for-profit Organizations | 66 | 5.6% |
| Local Government Employees | 89 | 7.5% |
| State Government Employees | 77 | 6.5% |
| Federal Government Employees | 0 | 0.0% |
| Unpaid Family Workers | 0 | 0.0% |
| Total | 1,184 | 100.0% |
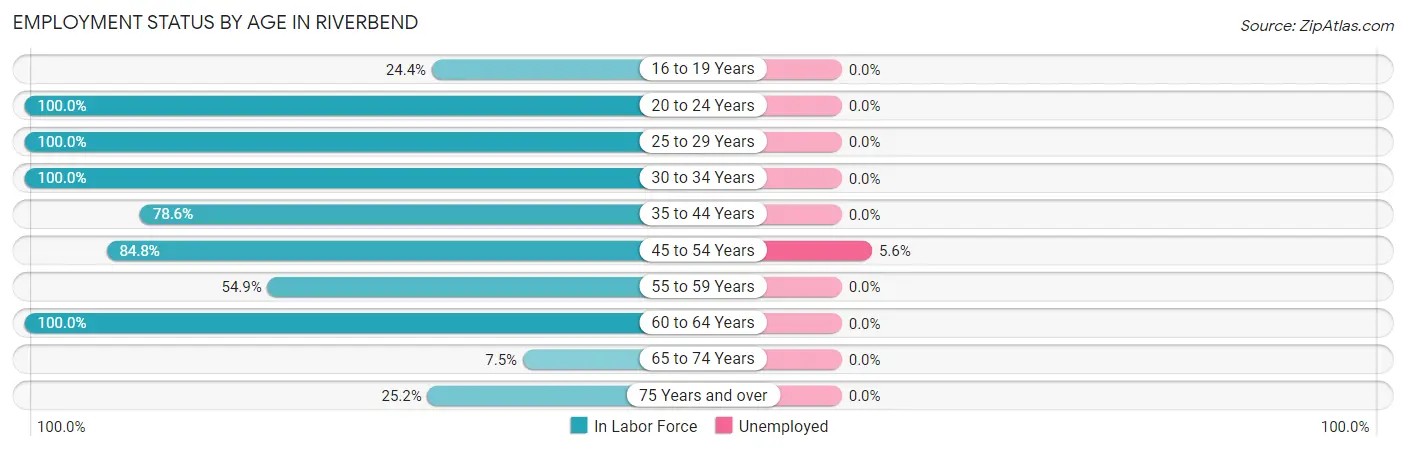
Employment Status by Age in Riverbend
According to the labor force statistics for Riverbend, out of the total population over 16 years of age (1,649), 73.0% or 1,204 individuals are in the labor force, with 1.6% or 19 of them unemployed. The age group with the highest labor force participation rate is 20 to 24 years, with 100.0% or 45 individuals in the labor force. Within the labor force, the 45 to 54 years age range has the highest percentage of unemployed individuals, with 5.6% or 19 of them being unemployed.
| Age Bracket | In Labor Force | Unemployed |
| 16 to 19 Years | 20 (24.4%) | 0 (0.0%) |
| 20 to 24 Years | 45 (100.0%) | 0 (0.0%) |
| 25 to 29 Years | 105 (100.0%) | 0 (0.0%) |
| 30 to 34 Years | 213 (100.0%) | 0 (0.0%) |
| 35 to 44 Years | 217 (78.6%) | 0 (0.0%) |
| 45 to 54 Years | 341 (84.8%) | 19 (5.6%) |
| 55 to 59 Years | 101 (54.9%) | 0 (0.0%) |
| 60 to 64 Years | 125 (100.0%) | 0 (0.0%) |
| 65 to 74 Years | 8 (7.5%) | 0 (0.0%) |
| 75 Years and over | 28 (25.2%) | 0 (0.0%) |
| Total | 1,204 (73.0%) | 19 (1.6%) |
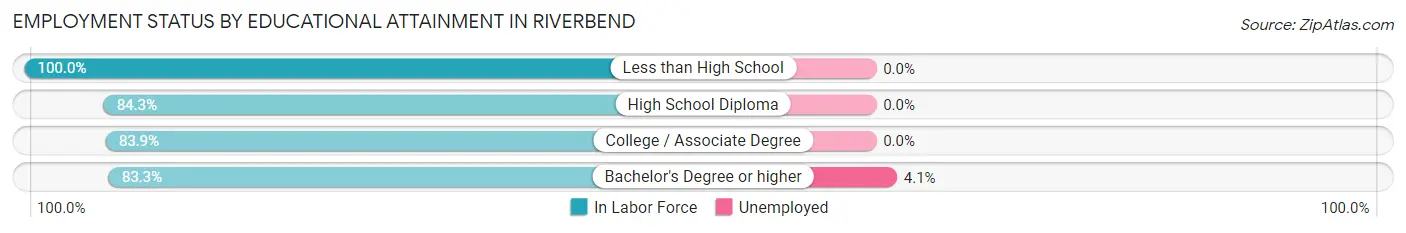
Employment Status by Educational Attainment in Riverbend
According to labor force statistics for Riverbend, 84.4% of individuals (1,101) out of the total population between 25 and 64 years of age (1,305) are in the labor force, with 1.7% or 19 of them being unemployed. The group with the highest labor force participation rate are those with the educational attainment of less than high school, with 100.0% or 59 individuals in the labor force. Within the labor force, individuals with bachelor's degree or higher education have the highest percentage of unemployment, with 4.1% or 19 of them being unemployed.
| Educational Attainment | In Labor Force | Unemployed |
| Less than High School | 59 (100.0%) | 0 (0.0%) |
| High School Diploma | 188 (84.3%) | 0 (0.0%) |
| College / Associate Degree | 397 (83.9%) | 0 (0.0%) |
| Bachelor's Degree or higher | 458 (83.3%) | 23 (4.1%) |
| Total | 1,101 (84.4%) | 22 (1.7%) |
Employment Occupations by Sex in Riverbend
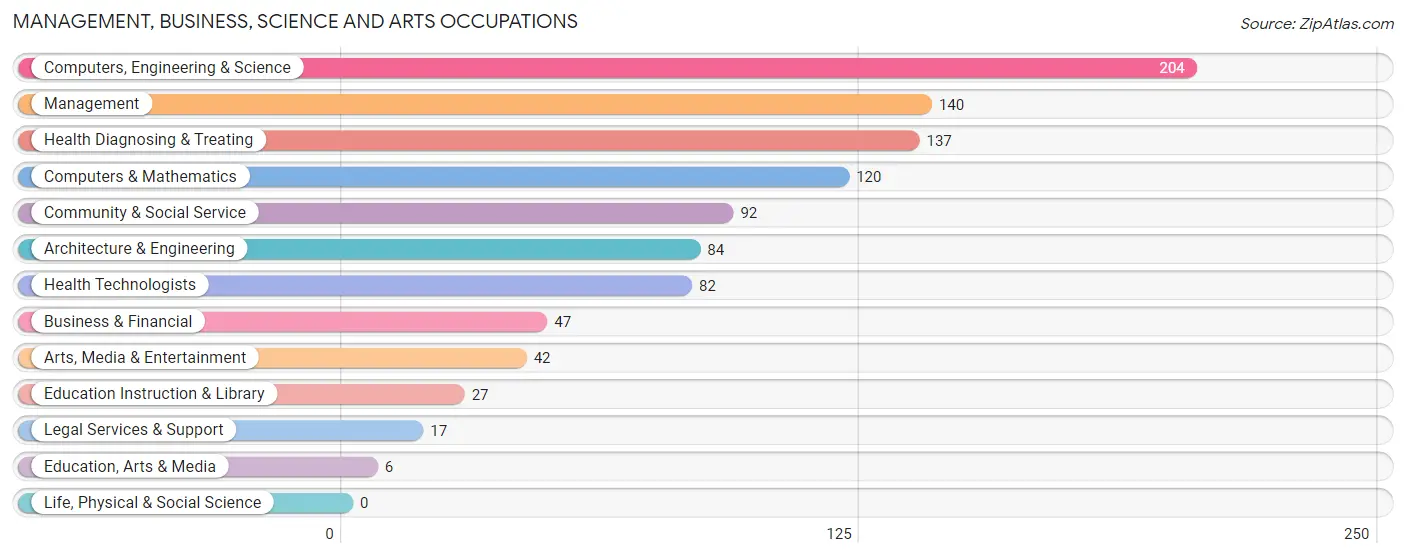
Management, Business, Science and Arts Occupations
The most common Management, Business, Science and Arts occupations in Riverbend are Computers, Engineering & Science (204 | 17.2%), Management (140 | 11.8%), Health Diagnosing & Treating (137 | 11.6%), Computers & Mathematics (120 | 10.1%), and Community & Social Service (92 | 7.8%).
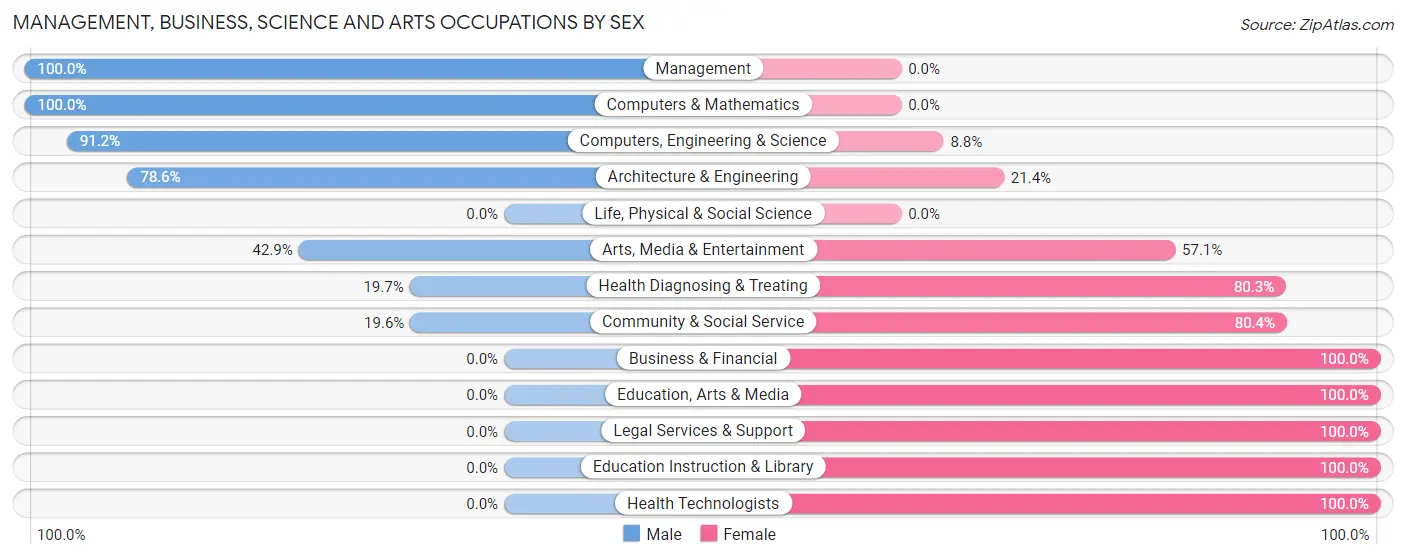
Management, Business, Science and Arts Occupations by Sex
Within the Management, Business, Science and Arts occupations in Riverbend, the most male-oriented occupations are Management (100.0%), Computers & Mathematics (100.0%), and Computers, Engineering & Science (91.2%), while the most female-oriented occupations are Business & Financial (100.0%), Education, Arts & Media (100.0%), and Legal Services & Support (100.0%).
| Occupation | Male | Female |
| Management | 140 (100.0%) | 0 (0.0%) |
| Business & Financial | 0 (0.0%) | 47 (100.0%) |
| Computers, Engineering & Science | 186 (91.2%) | 18 (8.8%) |
| Computers & Mathematics | 120 (100.0%) | 0 (0.0%) |
| Architecture & Engineering | 66 (78.6%) | 18 (21.4%) |
| Life, Physical & Social Science | 0 (0.0%) | 0 (0.0%) |
| Community & Social Service | 18 (19.6%) | 74 (80.4%) |
| Education, Arts & Media | 0 (0.0%) | 6 (100.0%) |
| Legal Services & Support | 0 (0.0%) | 17 (100.0%) |
| Education Instruction & Library | 0 (0.0%) | 27 (100.0%) |
| Arts, Media & Entertainment | 18 (42.9%) | 24 (57.1%) |
| Health Diagnosing & Treating | 27 (19.7%) | 110 (80.3%) |
| Health Technologists | 0 (0.0%) | 82 (100.0%) |
| Total (Category) | 371 (59.8%) | 249 (40.2%) |
| Total (Overall) | 670 (56.6%) | 514 (43.4%) |
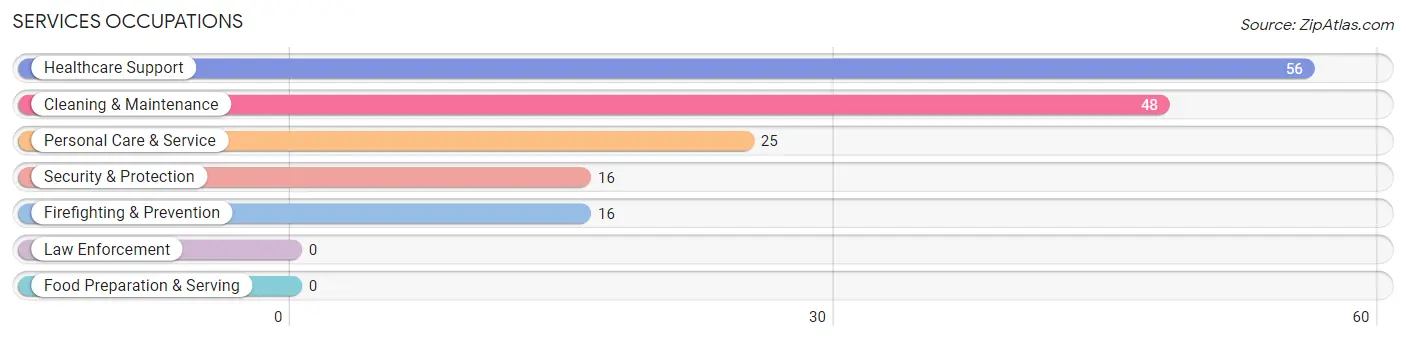
Services Occupations
The most common Services occupations in Riverbend are Healthcare Support (56 | 4.7%), Cleaning & Maintenance (48 | 4.1%), Personal Care & Service (25 | 2.1%), Security & Protection (16 | 1.3%), and Firefighting & Prevention (16 | 1.3%).
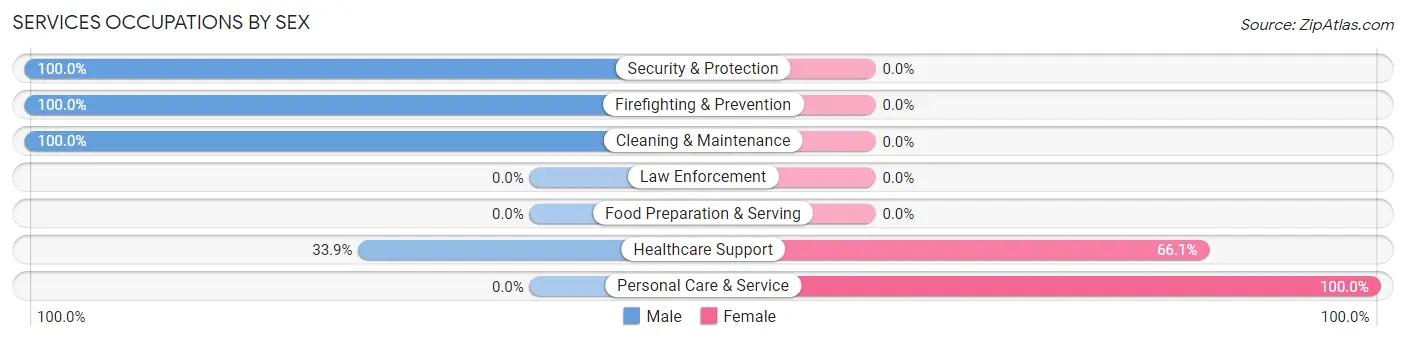
Services Occupations by Sex
Within the Services occupations in Riverbend, the most male-oriented occupations are Security & Protection (100.0%), Firefighting & Prevention (100.0%), and Cleaning & Maintenance (100.0%), while the most female-oriented occupations are Personal Care & Service (100.0%), and Healthcare Support (66.1%).
| Occupation | Male | Female |
| Healthcare Support | 19 (33.9%) | 37 (66.1%) |
| Security & Protection | 16 (100.0%) | 0 (0.0%) |
| Firefighting & Prevention | 16 (100.0%) | 0 (0.0%) |
| Law Enforcement | 0 (0.0%) | 0 (0.0%) |
| Food Preparation & Serving | 0 (0.0%) | 0 (0.0%) |
| Cleaning & Maintenance | 48 (100.0%) | 0 (0.0%) |
| Personal Care & Service | 0 (0.0%) | 25 (100.0%) |
| Total (Category) | 83 (57.2%) | 62 (42.8%) |
| Total (Overall) | 670 (56.6%) | 514 (43.4%) |
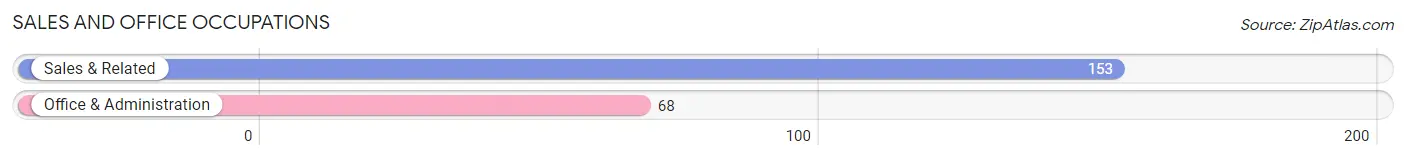
Sales and Office Occupations
The most common Sales and Office occupations in Riverbend are Sales & Related (153 | 12.9%), and Office & Administration (68 | 5.7%).
Sales and Office Occupations by Sex
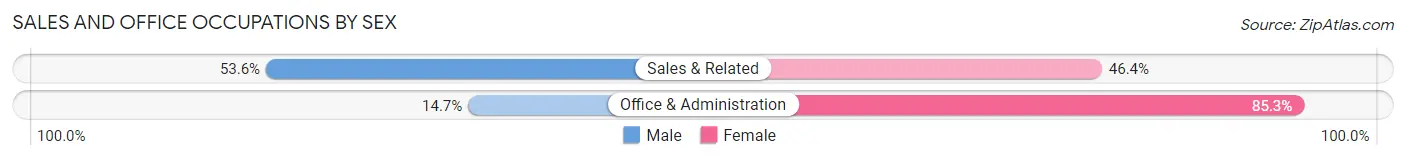
| Occupation | Male | Female |
| Sales & Related | 82 (53.6%) | 71 (46.4%) |
| Office & Administration | 10 (14.7%) | 58 (85.3%) |
| Total (Category) | 92 (41.6%) | 129 (58.4%) |
| Total (Overall) | 670 (56.6%) | 514 (43.4%) |
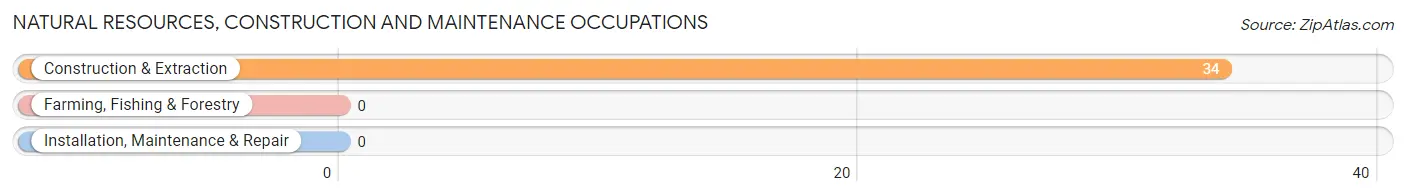
Natural Resources, Construction and Maintenance Occupations
The most common Natural Resources, Construction and Maintenance occupations in Riverbend are , and Construction & Extraction (34 | 2.9%).
Natural Resources, Construction and Maintenance Occupations by Sex
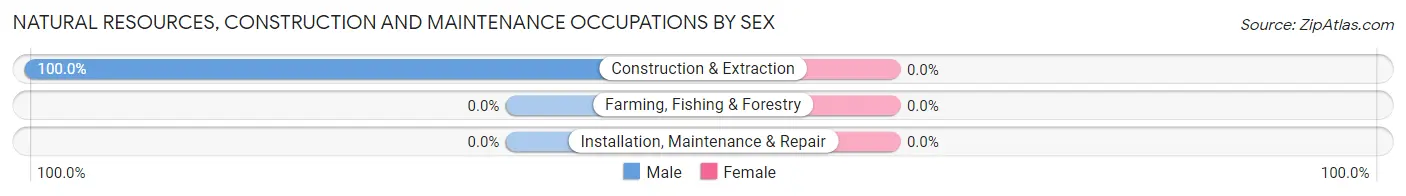
| Occupation | Male | Female |
| Farming, Fishing & Forestry | 0 (0.0%) | 0 (0.0%) |
| Construction & Extraction | 34 (100.0%) | 0 (0.0%) |
| Installation, Maintenance & Repair | 0 (0.0%) | 0 (0.0%) |
| Total (Category) | 34 (100.0%) | 0 (0.0%) |
| Total (Overall) | 670 (56.6%) | 514 (43.4%) |
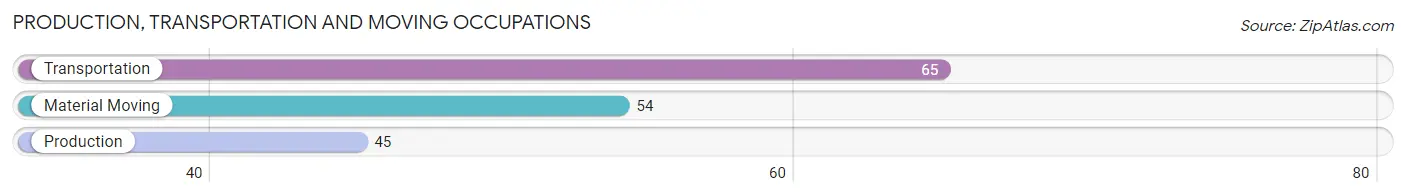
Production, Transportation and Moving Occupations
The most common Production, Transportation and Moving occupations in Riverbend are Transportation (65 | 5.5%), Material Moving (54 | 4.6%), and Production (45 | 3.8%).
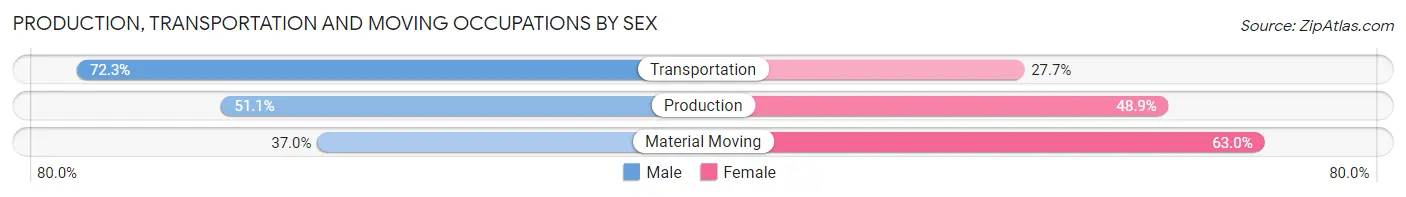
Production, Transportation and Moving Occupations by Sex
| Occupation | Male | Female |
| Production | 23 (51.1%) | 22 (48.9%) |
| Transportation | 47 (72.3%) | 18 (27.7%) |
| Material Moving | 20 (37.0%) | 34 (63.0%) |
| Total (Category) | 90 (54.9%) | 74 (45.1%) |
| Total (Overall) | 670 (56.6%) | 514 (43.4%) |
Employment Industries by Sex in Riverbend
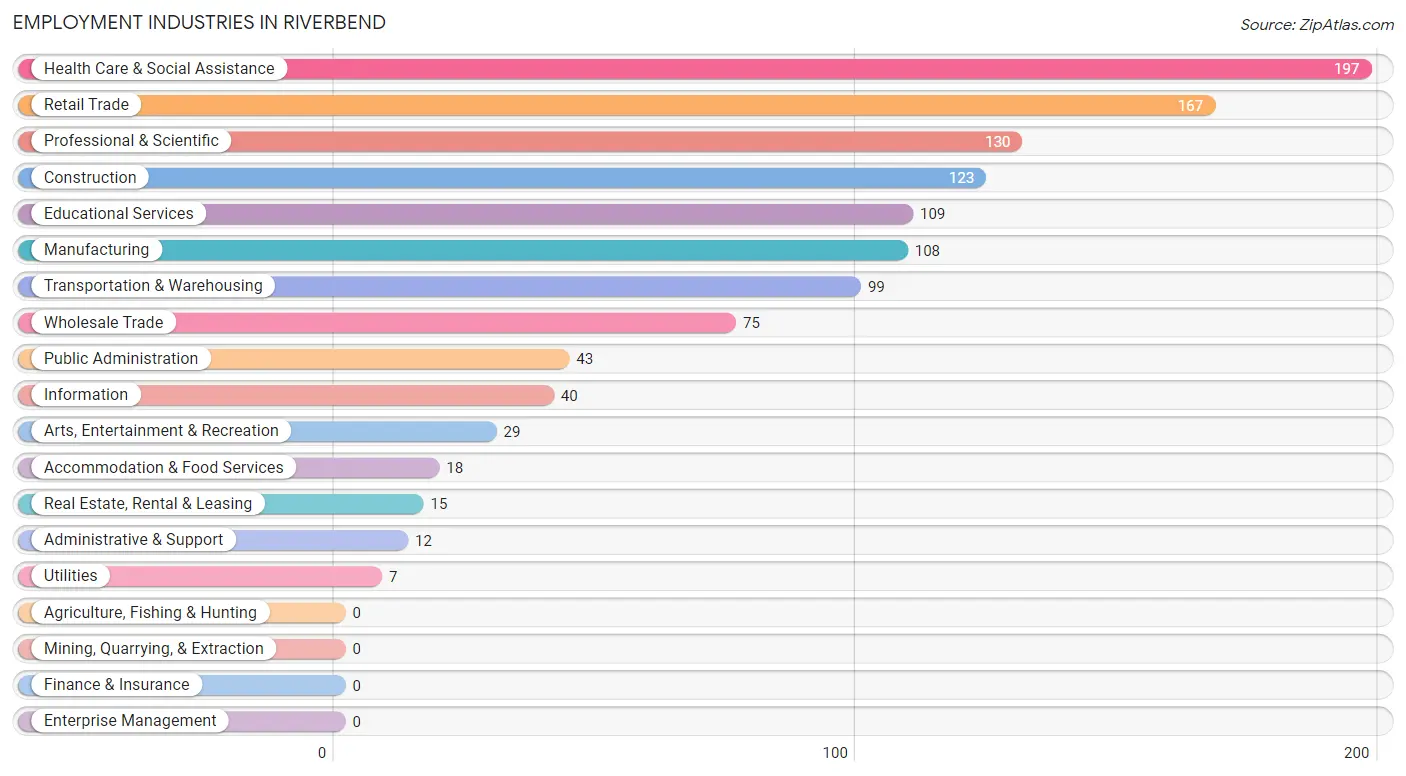
Employment Industries in Riverbend
The major employment industries in Riverbend include Health Care & Social Assistance (197 | 16.6%), Retail Trade (167 | 14.1%), Professional & Scientific (130 | 11.0%), Construction (123 | 10.4%), and Educational Services (109 | 9.2%).
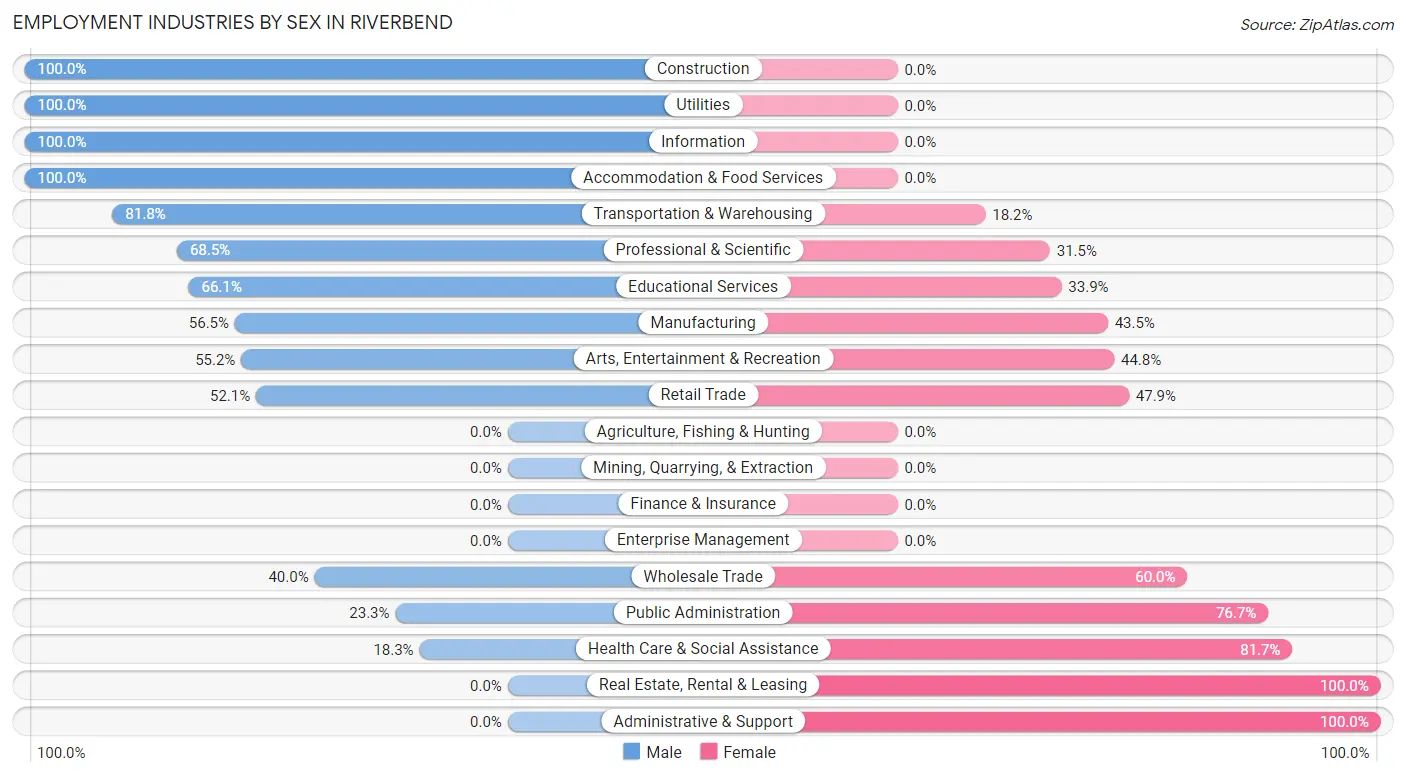
Employment Industries by Sex in Riverbend
The Riverbend industries that see more men than women are Construction (100.0%), Utilities (100.0%), and Information (100.0%), whereas the industries that tend to have a higher number of women are Real Estate, Rental & Leasing (100.0%), Administrative & Support (100.0%), and Health Care & Social Assistance (81.7%).
| Industry | Male | Female |
| Agriculture, Fishing & Hunting | 0 (0.0%) | 0 (0.0%) |
| Mining, Quarrying, & Extraction | 0 (0.0%) | 0 (0.0%) |
| Construction | 123 (100.0%) | 0 (0.0%) |
| Manufacturing | 61 (56.5%) | 47 (43.5%) |
| Wholesale Trade | 30 (40.0%) | 45 (60.0%) |
| Retail Trade | 87 (52.1%) | 80 (47.9%) |
| Transportation & Warehousing | 81 (81.8%) | 18 (18.2%) |
| Utilities | 7 (100.0%) | 0 (0.0%) |
| Information | 40 (100.0%) | 0 (0.0%) |
| Finance & Insurance | 0 (0.0%) | 0 (0.0%) |
| Real Estate, Rental & Leasing | 0 (0.0%) | 15 (100.0%) |
| Professional & Scientific | 89 (68.5%) | 41 (31.5%) |
| Enterprise Management | 0 (0.0%) | 0 (0.0%) |
| Administrative & Support | 0 (0.0%) | 12 (100.0%) |
| Educational Services | 72 (66.1%) | 37 (33.9%) |
| Health Care & Social Assistance | 36 (18.3%) | 161 (81.7%) |
| Arts, Entertainment & Recreation | 16 (55.2%) | 13 (44.8%) |
| Accommodation & Food Services | 18 (100.0%) | 0 (0.0%) |
| Public Administration | 10 (23.3%) | 33 (76.7%) |
| Total | 670 (56.6%) | 514 (43.4%) |
Education in Riverbend
School Enrollment in Riverbend
The most common levels of schooling among the 531 students in Riverbend are middle school (162 | 30.5%), elementary school (136 | 25.6%), and high school (97 | 18.3%).
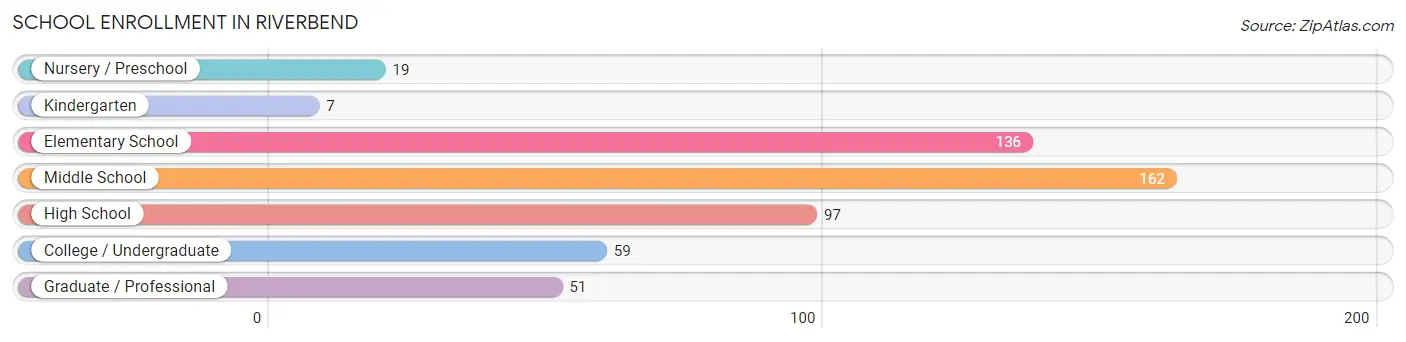
| School Level | # Students | % Students |
| Nursery / Preschool | 19 | 3.6% |
| Kindergarten | 7 | 1.3% |
| Elementary School | 136 | 25.6% |
| Middle School | 162 | 30.5% |
| High School | 97 | 18.3% |
| College / Undergraduate | 59 | 11.1% |
| Graduate / Professional | 51 | 9.6% |
| Total | 531 | 100.0% |
School Enrollment by Age by Funding Source in Riverbend
Out of a total of 531 students who are enrolled in schools in Riverbend, 100 (18.8%) attend a private institution, while the remaining 431 (81.2%) are enrolled in public schools. The age group of 15 to 17 year olds has the highest likelihood of being enrolled in private schools, with 33 (38.8% in the age bracket) enrolled. Conversely, the age group of 3 to 4 year olds has the lowest likelihood of being enrolled in a private school, with 7 (100.0% in the age bracket) attending a public institution.
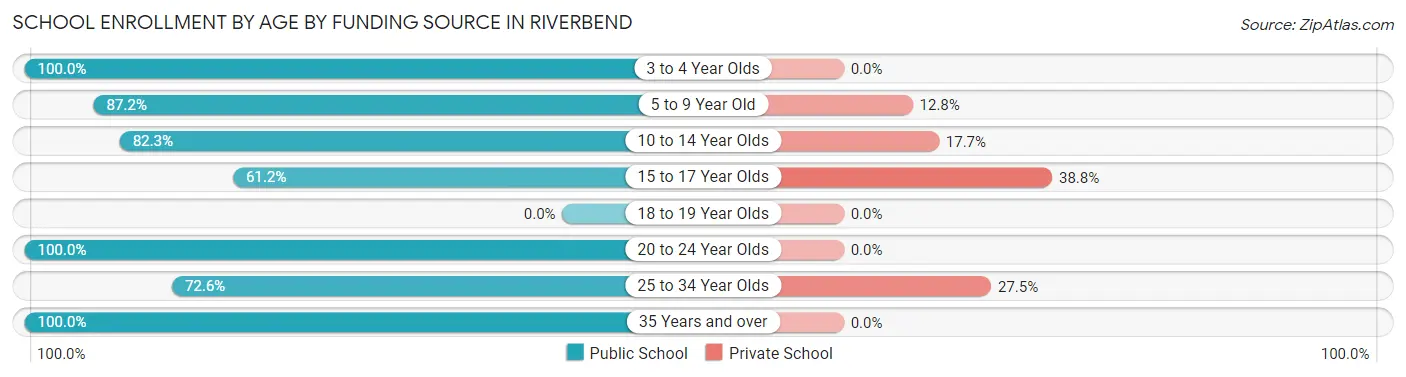
| Age Bracket | Public School | Private School |
| 3 to 4 Year Olds | 7 (100.0%) | 0 (0.0%) |
| 5 to 9 Year Old | 95 (87.2%) | 14 (12.8%) |
| 10 to 14 Year Olds | 181 (82.3%) | 39 (17.7%) |
| 15 to 17 Year Olds | 52 (61.2%) | 33 (38.8%) |
| 18 to 19 Year Olds | 0 (0.0%) | 0 (0.0%) |
| 20 to 24 Year Olds | 45 (100.0%) | 0 (0.0%) |
| 25 to 34 Year Olds | 37 (72.6%) | 14 (27.5%) |
| 35 Years and over | 14 (100.0%) | 0 (0.0%) |
| Total | 431 (81.2%) | 100 (18.8%) |
Educational Attainment by Field of Study in Riverbend
Business (174 | 25.3%), social sciences (101 | 14.7%), computers & mathematics (80 | 11.6%), communications (66 | 9.6%), and education (56 | 8.2%) are the most common fields of study among 687 individuals in Riverbend who have obtained a bachelor's degree or higher.
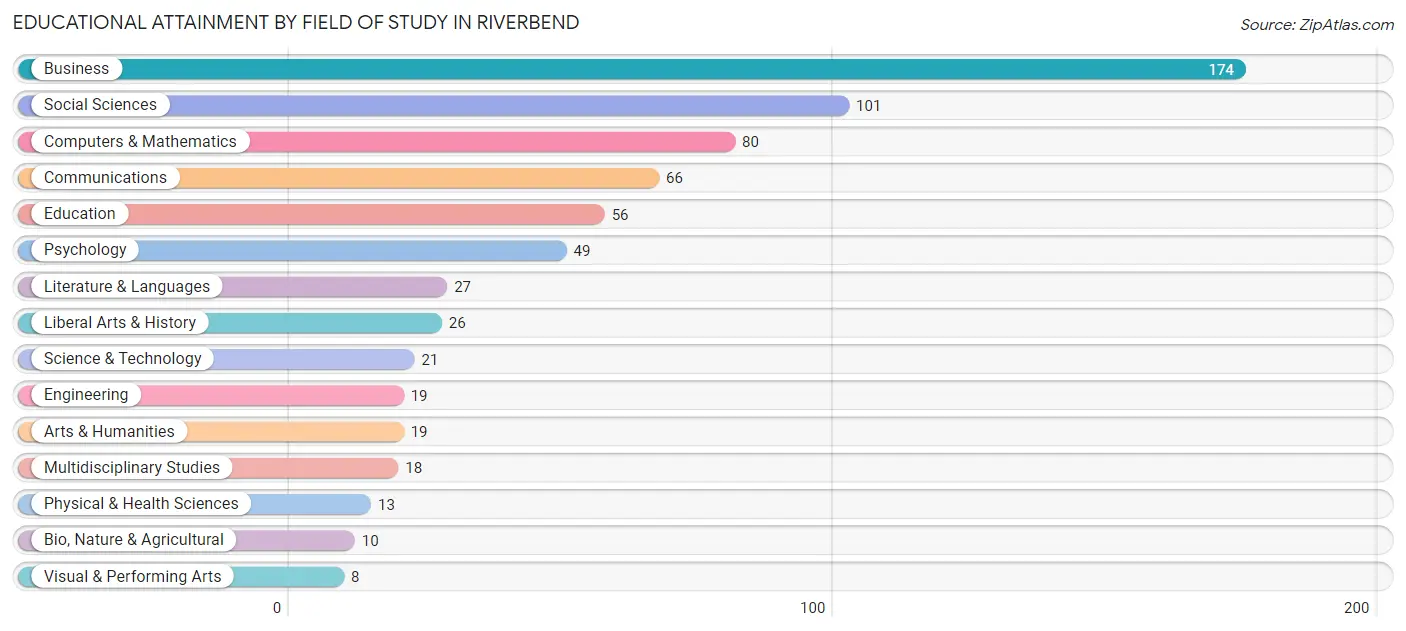
| Field of Study | # Graduates | % Graduates |
| Computers & Mathematics | 80 | 11.6% |
| Bio, Nature & Agricultural | 10 | 1.5% |
| Physical & Health Sciences | 13 | 1.9% |
| Psychology | 49 | 7.1% |
| Social Sciences | 101 | 14.7% |
| Engineering | 19 | 2.8% |
| Multidisciplinary Studies | 18 | 2.6% |
| Science & Technology | 21 | 3.1% |
| Business | 174 | 25.3% |
| Education | 56 | 8.2% |
| Literature & Languages | 27 | 3.9% |
| Liberal Arts & History | 26 | 3.8% |
| Visual & Performing Arts | 8 | 1.2% |
| Communications | 66 | 9.6% |
| Arts & Humanities | 19 | 2.8% |
| Total | 687 | 100.0% |
Transportation & Commute in Riverbend
Vehicle Availability by Sex in Riverbend
The most prevalent vehicle ownership categories in Riverbend are males with 2 vehicles (188, accounting for 28.1%) and females with 2 vehicles (165, making up 36.6%).
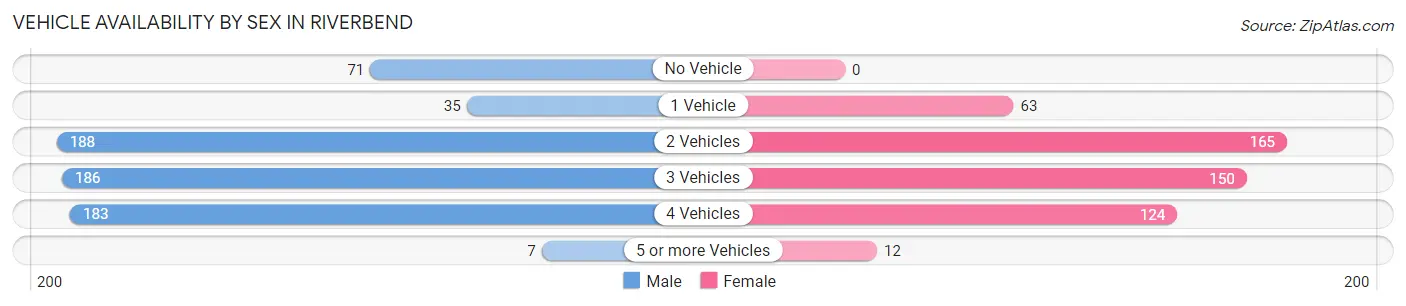
| Vehicles Available | Male | Female |
| No Vehicle | 71 (10.6%) | 0 (0.0%) |
| 1 Vehicle | 35 (5.2%) | 63 (12.3%) |
| 2 Vehicles | 188 (28.1%) | 165 (32.1%) |
| 3 Vehicles | 186 (27.8%) | 150 (29.2%) |
| 4 Vehicles | 183 (27.3%) | 124 (24.1%) |
| 5 or more Vehicles | 7 (1.0%) | 12 (2.3%) |
| Total | 670 (100.0%) | 514 (100.0%) |
Commute Time in Riverbend
The most frequently occuring commute durations in Riverbend are 15 to 19 minutes (239 commuters, 22.9%), 20 to 24 minutes (123 commuters, 11.8%), and 30 to 34 minutes (107 commuters, 10.2%).
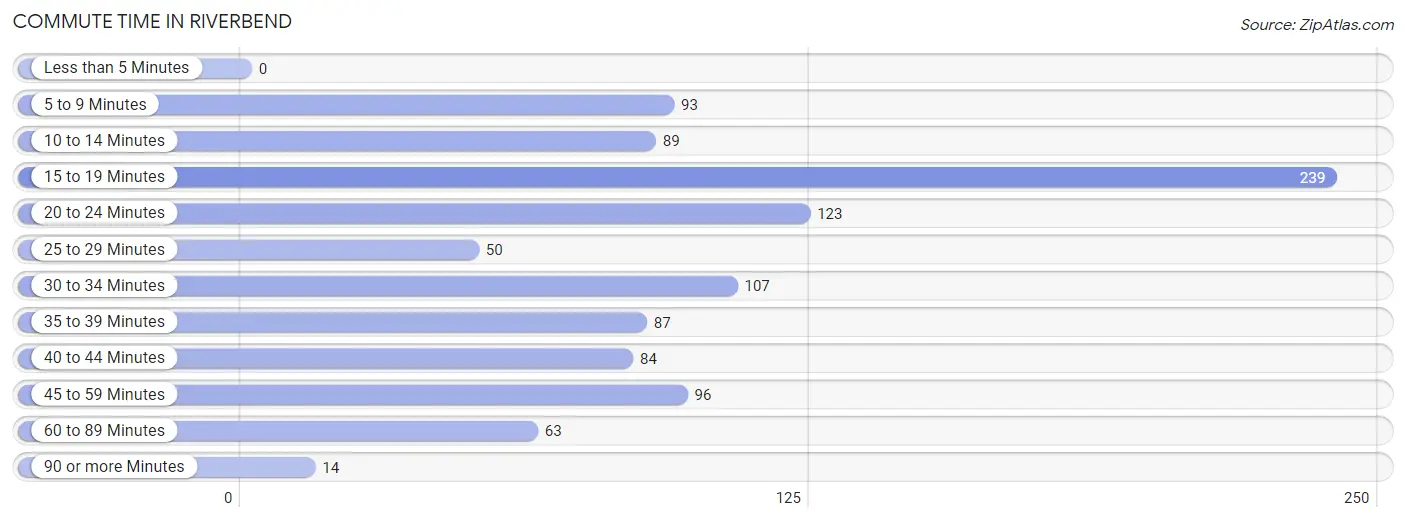
| Commute Time | # Commuters | % Commuters |
| Less than 5 Minutes | 0 | 0.0% |
| 5 to 9 Minutes | 93 | 8.9% |
| 10 to 14 Minutes | 89 | 8.5% |
| 15 to 19 Minutes | 239 | 22.9% |
| 20 to 24 Minutes | 123 | 11.8% |
| 25 to 29 Minutes | 50 | 4.8% |
| 30 to 34 Minutes | 107 | 10.2% |
| 35 to 39 Minutes | 87 | 8.3% |
| 40 to 44 Minutes | 84 | 8.0% |
| 45 to 59 Minutes | 96 | 9.2% |
| 60 to 89 Minutes | 63 | 6.0% |
| 90 or more Minutes | 14 | 1.3% |
Commute Time by Sex in Riverbend
The most common commute times in Riverbend are 15 to 19 minutes (135 commuters, 22.1%) for males and 15 to 19 minutes (104 commuters, 24.0%) for females.
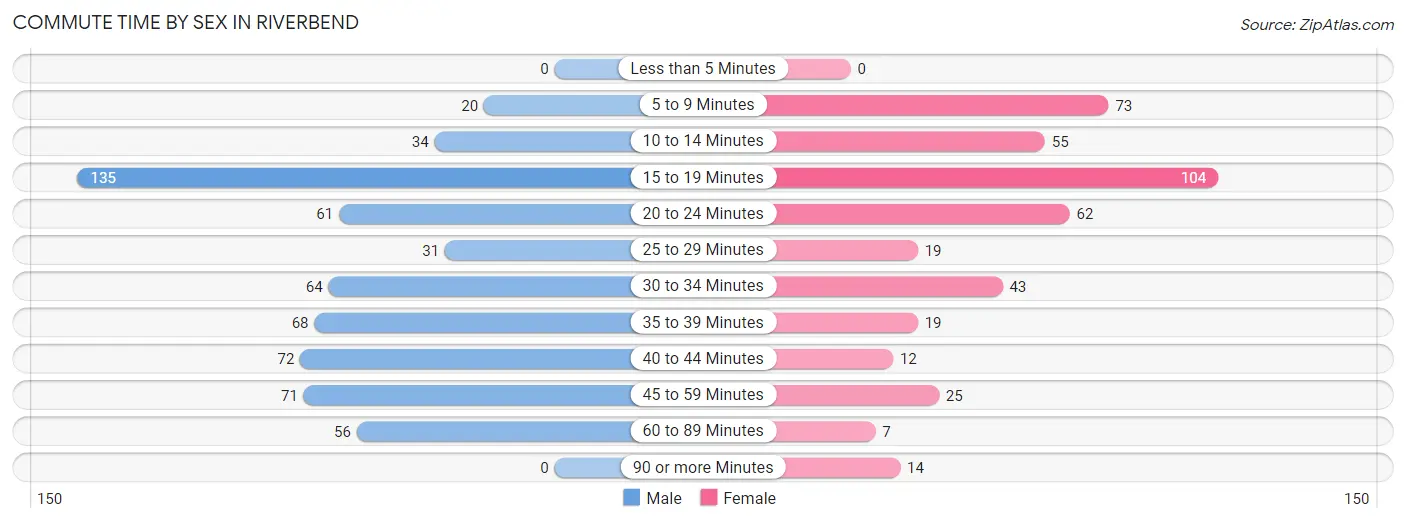
| Commute Time | Male | Female |
| Less than 5 Minutes | 0 (0.0%) | 0 (0.0%) |
| 5 to 9 Minutes | 20 (3.3%) | 73 (16.9%) |
| 10 to 14 Minutes | 34 (5.6%) | 55 (12.7%) |
| 15 to 19 Minutes | 135 (22.1%) | 104 (24.0%) |
| 20 to 24 Minutes | 61 (10.0%) | 62 (14.3%) |
| 25 to 29 Minutes | 31 (5.1%) | 19 (4.4%) |
| 30 to 34 Minutes | 64 (10.5%) | 43 (9.9%) |
| 35 to 39 Minutes | 68 (11.1%) | 19 (4.4%) |
| 40 to 44 Minutes | 72 (11.8%) | 12 (2.8%) |
| 45 to 59 Minutes | 71 (11.6%) | 25 (5.8%) |
| 60 to 89 Minutes | 56 (9.1%) | 7 (1.6%) |
| 90 or more Minutes | 0 (0.0%) | 14 (3.2%) |
Time of Departure to Work by Sex in Riverbend
The most frequent times of departure to work in Riverbend are 6:00 AM to 6:29 AM (159, 26.0%) for males and 5:30 AM to 5:59 AM (69, 15.9%) for females.
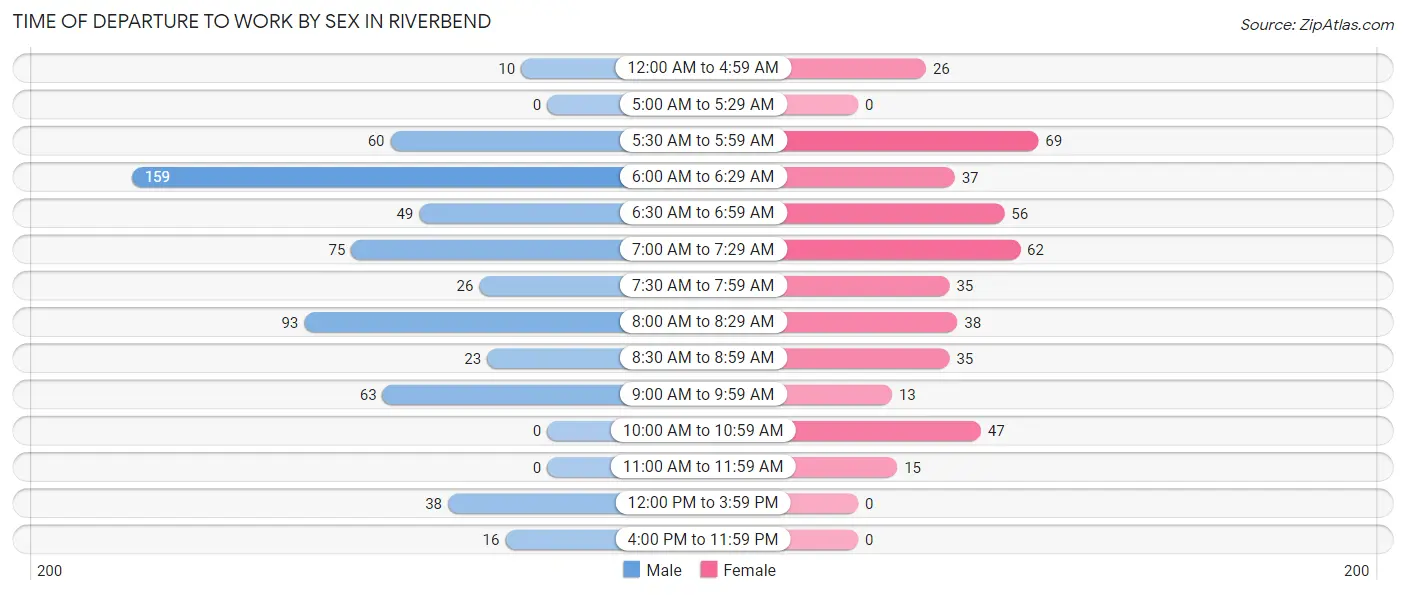
| Time of Departure | Male | Female |
| 12:00 AM to 4:59 AM | 10 (1.6%) | 26 (6.0%) |
| 5:00 AM to 5:29 AM | 0 (0.0%) | 0 (0.0%) |
| 5:30 AM to 5:59 AM | 60 (9.8%) | 69 (15.9%) |
| 6:00 AM to 6:29 AM | 159 (26.0%) | 37 (8.6%) |
| 6:30 AM to 6:59 AM | 49 (8.0%) | 56 (12.9%) |
| 7:00 AM to 7:29 AM | 75 (12.2%) | 62 (14.3%) |
| 7:30 AM to 7:59 AM | 26 (4.3%) | 35 (8.1%) |
| 8:00 AM to 8:29 AM | 93 (15.2%) | 38 (8.8%) |
| 8:30 AM to 8:59 AM | 23 (3.8%) | 35 (8.1%) |
| 9:00 AM to 9:59 AM | 63 (10.3%) | 13 (3.0%) |
| 10:00 AM to 10:59 AM | 0 (0.0%) | 47 (10.8%) |
| 11:00 AM to 11:59 AM | 0 (0.0%) | 15 (3.5%) |
| 12:00 PM to 3:59 PM | 38 (6.2%) | 0 (0.0%) |
| 4:00 PM to 11:59 PM | 16 (2.6%) | 0 (0.0%) |
| Total | 612 (100.0%) | 433 (100.0%) |
Housing Occupancy in Riverbend
Occupancy by Ownership in Riverbend
Of the total 717 dwellings in Riverbend, owner-occupied units account for 662 (92.3%), while renter-occupied units make up 55 (7.7%).
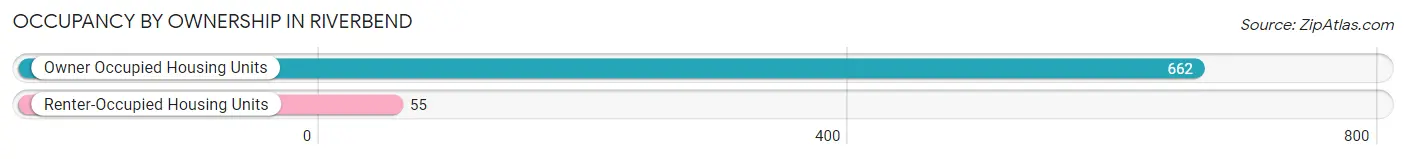
| Occupancy | # Housing Units | % Housing Units |
| Owner Occupied Housing Units | 662 | 92.3% |
| Renter-Occupied Housing Units | 55 | 7.7% |
| Total Occupied Housing Units | 717 | 100.0% |
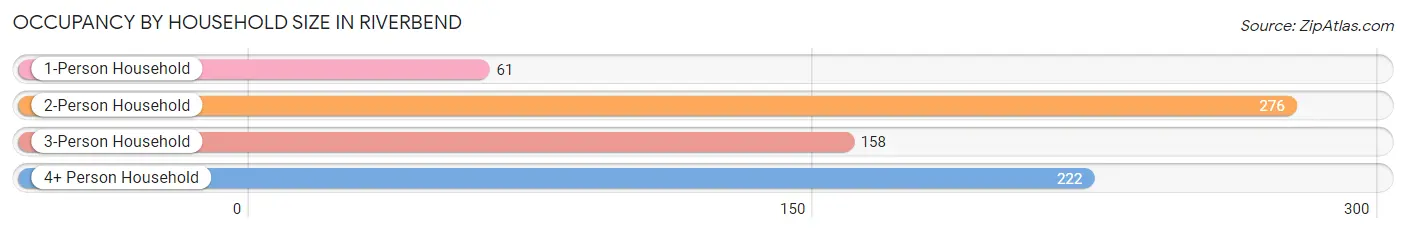
Occupancy by Household Size in Riverbend
| Household Size | # Housing Units | % Housing Units |
| 1-Person Household | 61 | 8.5% |
| 2-Person Household | 276 | 38.5% |
| 3-Person Household | 158 | 22.0% |
| 4+ Person Household | 222 | 31.0% |
| Total Housing Units | 717 | 100.0% |
Occupancy by Ownership by Household Size in Riverbend
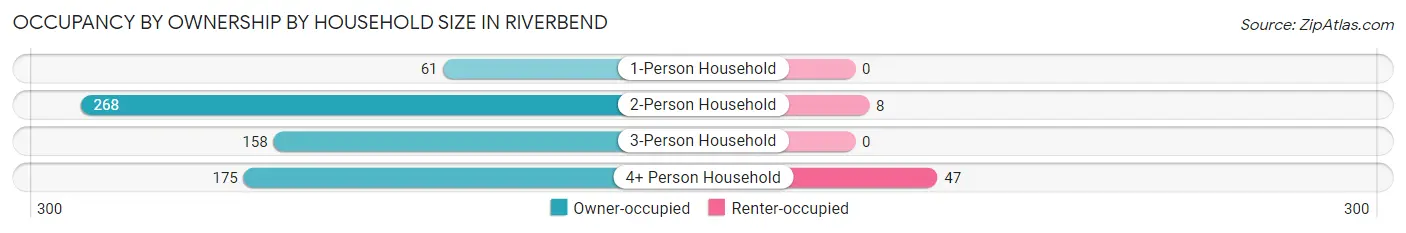
| Household Size | Owner-occupied | Renter-occupied |
| 1-Person Household | 61 (100.0%) | 0 (0.0%) |
| 2-Person Household | 268 (97.1%) | 8 (2.9%) |
| 3-Person Household | 158 (100.0%) | 0 (0.0%) |
| 4+ Person Household | 175 (78.8%) | 47 (21.2%) |
| Total Housing Units | 662 (92.3%) | 55 (7.7%) |
Occupancy by Educational Attainment in Riverbend
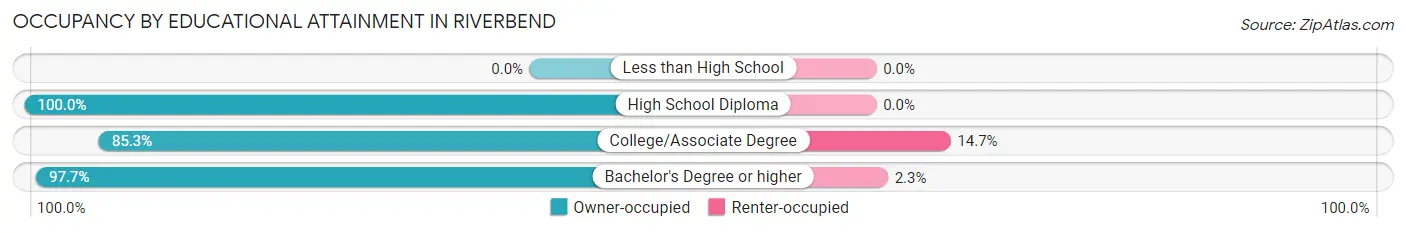
| Household Size | Owner-occupied | Renter-occupied |
| Less than High School | 0 (0.0%) | 0 (0.0%) |
| High School Diploma | 49 (100.0%) | 0 (0.0%) |
| College/Associate Degree | 272 (85.3%) | 47 (14.7%) |
| Bachelor's Degree or higher | 341 (97.7%) | 8 (2.3%) |
Occupancy by Age of Householder in Riverbend
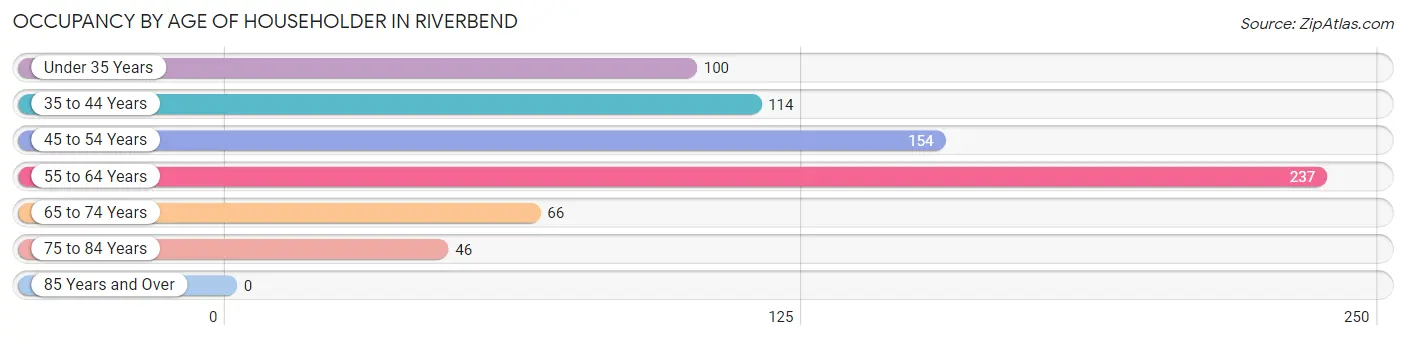
| Age Bracket | # Households | % Households |
| Under 35 Years | 100 | 14.0% |
| 35 to 44 Years | 114 | 15.9% |
| 45 to 54 Years | 154 | 21.5% |
| 55 to 64 Years | 237 | 33.1% |
| 65 to 74 Years | 66 | 9.2% |
| 75 to 84 Years | 46 | 6.4% |
| 85 Years and Over | 0 | 0.0% |
| Total | 717 | 100.0% |
Housing Finances in Riverbend
Median Income by Occupancy in Riverbend
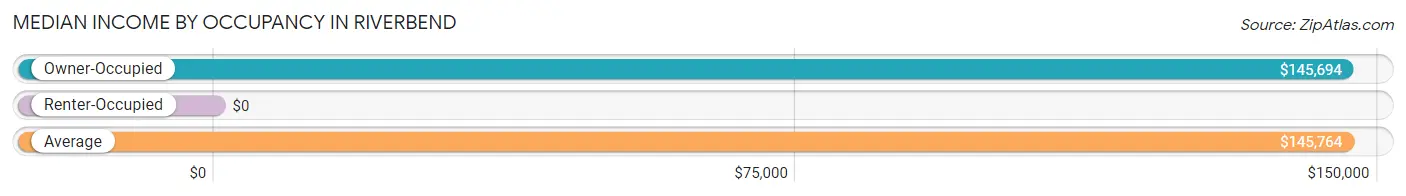
| Occupancy Type | # Households | Median Income |
| Owner-Occupied | 662 (92.3%) | $145,694 |
| Renter-Occupied | 55 (7.7%) | $0 |
| Average | 717 (100.0%) | $145,764 |
Occupancy by Householder Income Bracket in Riverbend
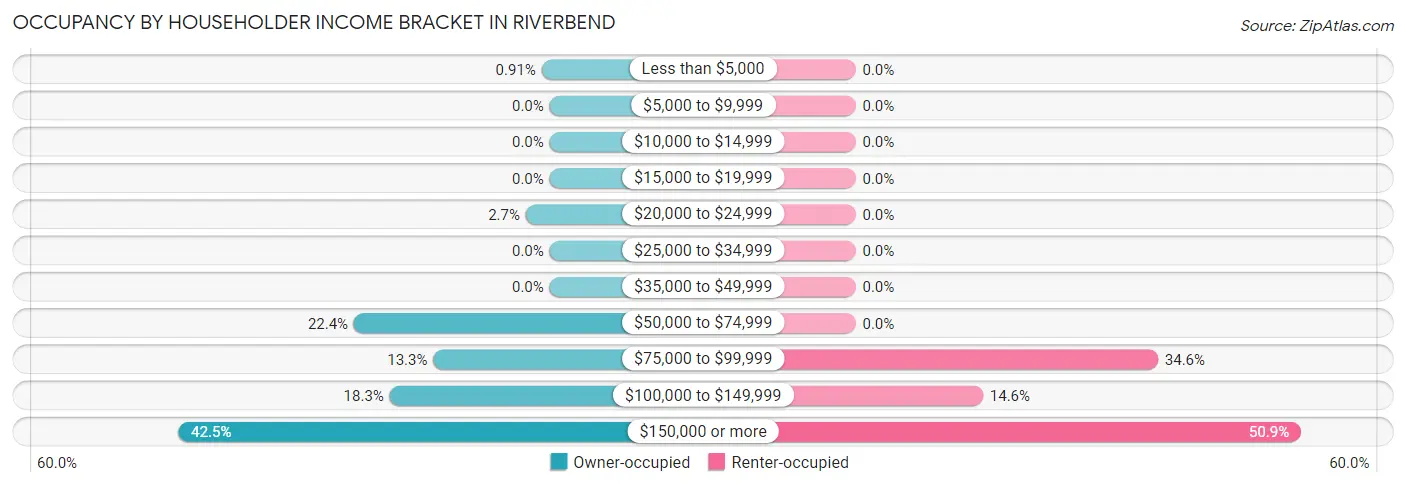
| Income Bracket | Owner-occupied | Renter-occupied |
| Less than $5,000 | 6 (0.9%) | 0 (0.0%) |
| $5,000 to $9,999 | 0 (0.0%) | 0 (0.0%) |
| $10,000 to $14,999 | 0 (0.0%) | 0 (0.0%) |
| $15,000 to $19,999 | 0 (0.0%) | 0 (0.0%) |
| $20,000 to $24,999 | 18 (2.7%) | 0 (0.0%) |
| $25,000 to $34,999 | 0 (0.0%) | 0 (0.0%) |
| $35,000 to $49,999 | 0 (0.0%) | 0 (0.0%) |
| $50,000 to $74,999 | 148 (22.4%) | 0 (0.0%) |
| $75,000 to $99,999 | 88 (13.3%) | 19 (34.5%) |
| $100,000 to $149,999 | 121 (18.3%) | 8 (14.5%) |
| $150,000 or more | 281 (42.4%) | 28 (50.9%) |
| Total | 662 (100.0%) | 55 (100.0%) |
Monthly Housing Cost Tiers in Riverbend
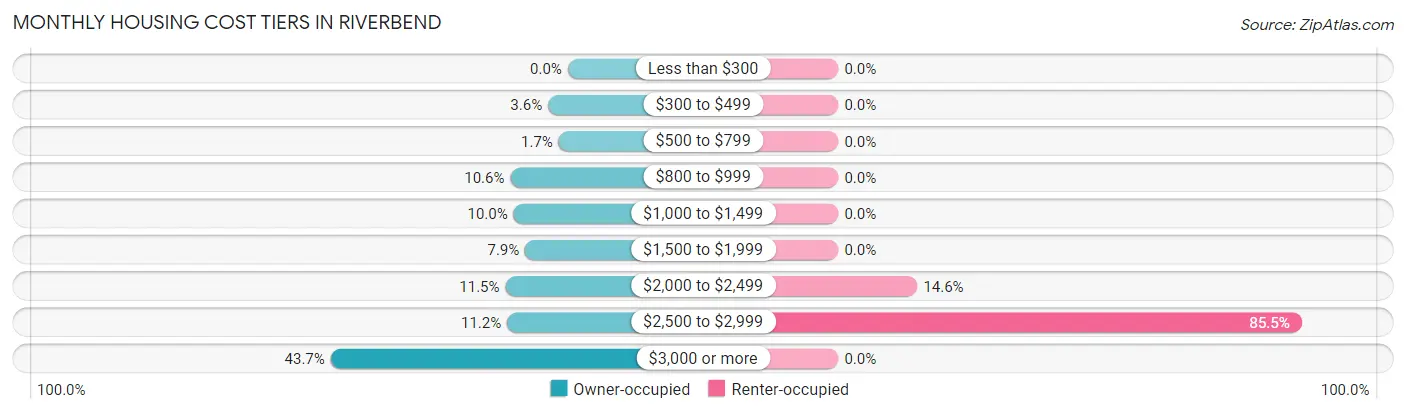
| Monthly Cost | Owner-occupied | Renter-occupied |
| Less than $300 | 0 (0.0%) | 0 (0.0%) |
| $300 to $499 | 24 (3.6%) | 0 (0.0%) |
| $500 to $799 | 11 (1.7%) | 0 (0.0%) |
| $800 to $999 | 70 (10.6%) | 0 (0.0%) |
| $1,000 to $1,499 | 66 (10.0%) | 0 (0.0%) |
| $1,500 to $1,999 | 52 (7.9%) | 0 (0.0%) |
| $2,000 to $2,499 | 76 (11.5%) | 8 (14.5%) |
| $2,500 to $2,999 | 74 (11.2%) | 47 (85.5%) |
| $3,000 or more | 289 (43.7%) | 0 (0.0%) |
| Total | 662 (100.0%) | 55 (100.0%) |
Physical Housing Characteristics in Riverbend
Housing Structures in Riverbend
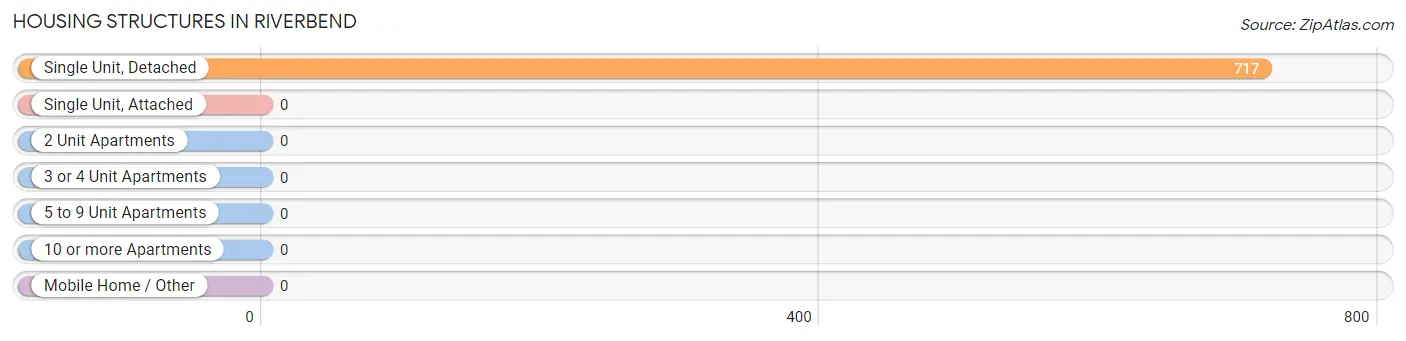
| Structure Type | # Housing Units | % Housing Units |
| Single Unit, Detached | 717 | 100.0% |
| Single Unit, Attached | 0 | 0.0% |
| 2 Unit Apartments | 0 | 0.0% |
| 3 or 4 Unit Apartments | 0 | 0.0% |
| 5 to 9 Unit Apartments | 0 | 0.0% |
| 10 or more Apartments | 0 | 0.0% |
| Mobile Home / Other | 0 | 0.0% |
| Total | 717 | 100.0% |
Housing Structures by Occupancy in Riverbend
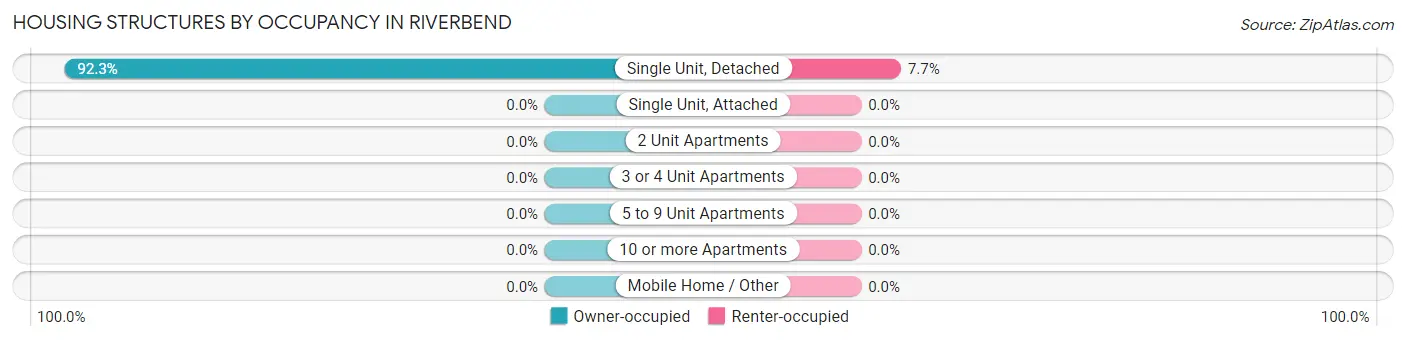
| Structure Type | Owner-occupied | Renter-occupied |
| Single Unit, Detached | 662 (92.3%) | 55 (7.7%) |
| Single Unit, Attached | 0 (0.0%) | 0 (0.0%) |
| 2 Unit Apartments | 0 (0.0%) | 0 (0.0%) |
| 3 or 4 Unit Apartments | 0 (0.0%) | 0 (0.0%) |
| 5 to 9 Unit Apartments | 0 (0.0%) | 0 (0.0%) |
| 10 or more Apartments | 0 (0.0%) | 0 (0.0%) |
| Mobile Home / Other | 0 (0.0%) | 0 (0.0%) |
| Total | 662 (92.3%) | 55 (7.7%) |
Housing Structures by Number of Rooms in Riverbend
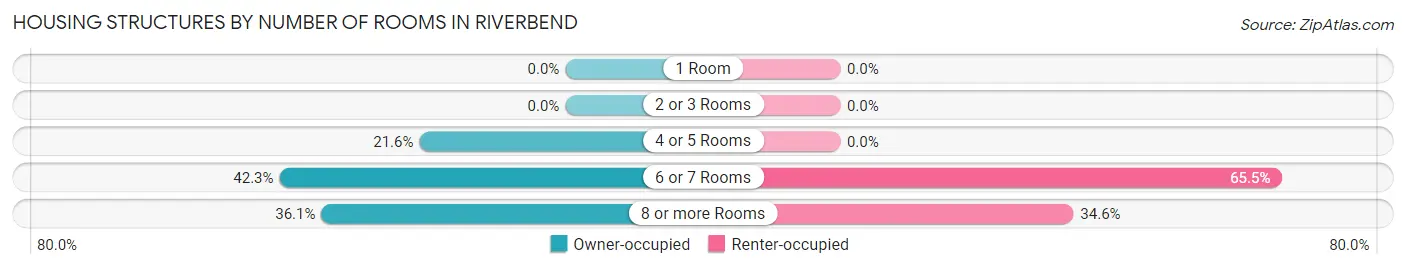
| Number of Rooms | Owner-occupied | Renter-occupied |
| 1 Room | 0 (0.0%) | 0 (0.0%) |
| 2 or 3 Rooms | 0 (0.0%) | 0 (0.0%) |
| 4 or 5 Rooms | 143 (21.6%) | 0 (0.0%) |
| 6 or 7 Rooms | 280 (42.3%) | 36 (65.4%) |
| 8 or more Rooms | 239 (36.1%) | 19 (34.5%) |
| Total | 662 (100.0%) | 55 (100.0%) |
Housing Structure by Heating Type in Riverbend
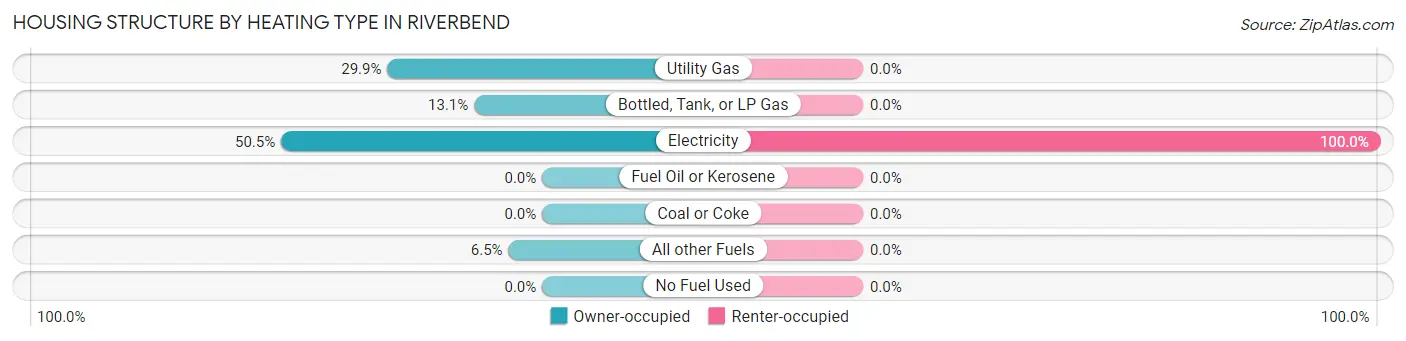
| Heating Type | Owner-occupied | Renter-occupied |
| Utility Gas | 198 (29.9%) | 0 (0.0%) |
| Bottled, Tank, or LP Gas | 87 (13.1%) | 0 (0.0%) |
| Electricity | 334 (50.4%) | 55 (100.0%) |
| Fuel Oil or Kerosene | 0 (0.0%) | 0 (0.0%) |
| Coal or Coke | 0 (0.0%) | 0 (0.0%) |
| All other Fuels | 43 (6.5%) | 0 (0.0%) |
| No Fuel Used | 0 (0.0%) | 0 (0.0%) |
| Total | 662 (100.0%) | 55 (100.0%) |
Household Vehicle Usage in Riverbend
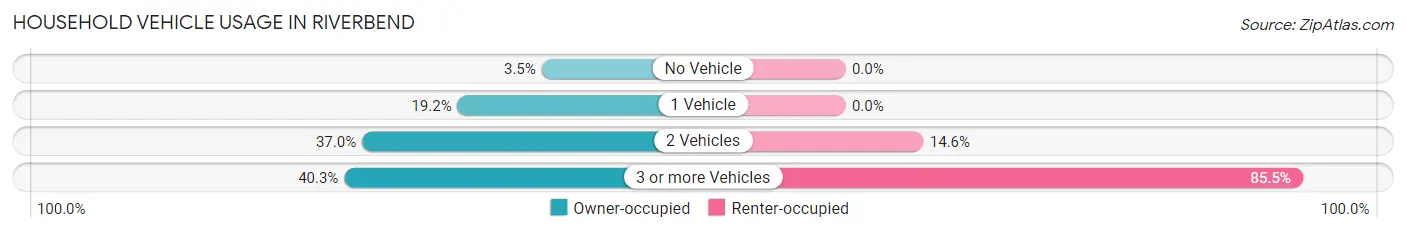
| Vehicles per Household | Owner-occupied | Renter-occupied |
| No Vehicle | 23 (3.5%) | 0 (0.0%) |
| 1 Vehicle | 127 (19.2%) | 0 (0.0%) |
| 2 Vehicles | 245 (37.0%) | 8 (14.5%) |
| 3 or more Vehicles | 267 (40.3%) | 47 (85.5%) |
| Total | 662 (100.0%) | 55 (100.0%) |
Real Estate & Mortgages in Riverbend
Real Estate and Mortgage Overview in Riverbend
| Characteristic | Without Mortgage | With Mortgage |
| Housing Units | 146 | 516 |
| Median Property Value | $758,900 | $605,600 |
| Median Household Income | $103,611 | $230 |
| Monthly Housing Costs | $907 | $283 |
| Real Estate Taxes | $7,667 | $0 |
Property Value by Mortgage Status in Riverbend
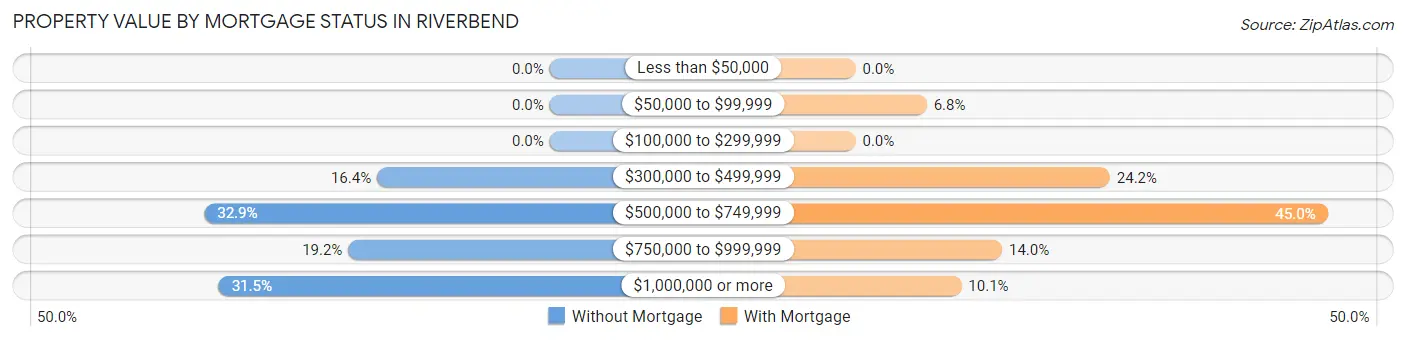
| Property Value | Without Mortgage | With Mortgage |
| Less than $50,000 | 0 (0.0%) | 0 (0.0%) |
| $50,000 to $99,999 | 0 (0.0%) | 35 (6.8%) |
| $100,000 to $299,999 | 0 (0.0%) | 0 (0.0%) |
| $300,000 to $499,999 | 24 (16.4%) | 125 (24.2%) |
| $500,000 to $749,999 | 48 (32.9%) | 232 (45.0%) |
| $750,000 to $999,999 | 28 (19.2%) | 72 (14.0%) |
| $1,000,000 or more | 46 (31.5%) | 52 (10.1%) |
| Total | 146 (100.0%) | 516 (100.0%) |
Household Income by Mortgage Status in Riverbend
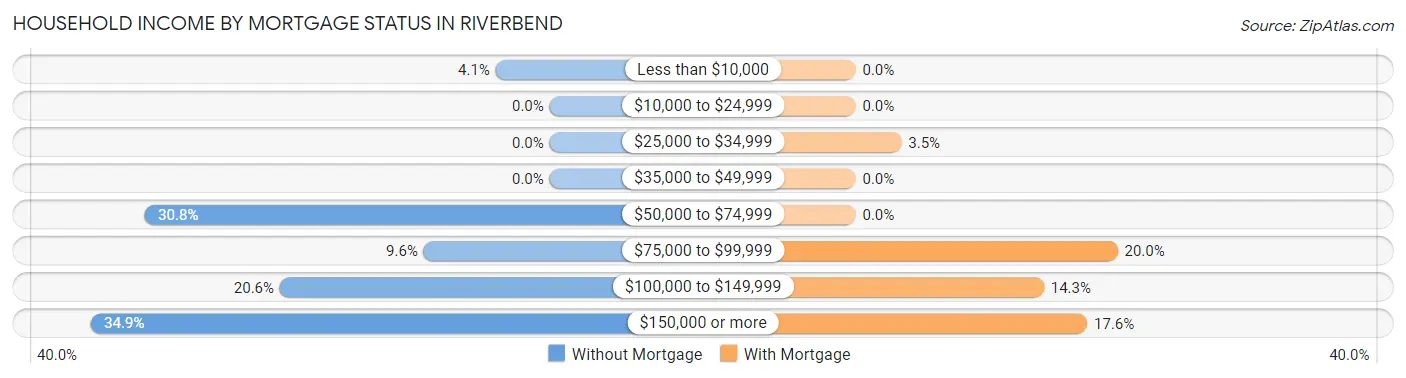
| Household Income | Without Mortgage | With Mortgage |
| Less than $10,000 | 6 (4.1%) | 0 (0.0%) |
| $10,000 to $24,999 | 0 (0.0%) | 0 (0.0%) |
| $25,000 to $34,999 | 0 (0.0%) | 18 (3.5%) |
| $35,000 to $49,999 | 0 (0.0%) | 0 (0.0%) |
| $50,000 to $74,999 | 45 (30.8%) | 0 (0.0%) |
| $75,000 to $99,999 | 14 (9.6%) | 103 (20.0%) |
| $100,000 to $149,999 | 30 (20.5%) | 74 (14.3%) |
| $150,000 or more | 51 (34.9%) | 91 (17.6%) |
| Total | 146 (100.0%) | 516 (100.0%) |
Property Value to Household Income Ratio in Riverbend
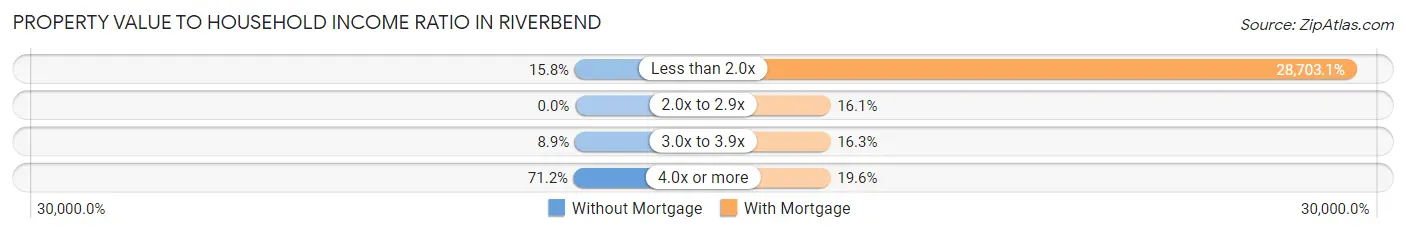
| Value-to-Income Ratio | Without Mortgage | With Mortgage |
| Less than 2.0x | 23 (15.8%) | 148,108 (28,703.1%) |
| 2.0x to 2.9x | 0 (0.0%) | 83 (16.1%) |
| 3.0x to 3.9x | 13 (8.9%) | 84 (16.3%) |
| 4.0x or more | 104 (71.2%) | 101 (19.6%) |
| Total | 146 (100.0%) | 516 (100.0%) |
Real Estate Taxes by Mortgage Status in Riverbend
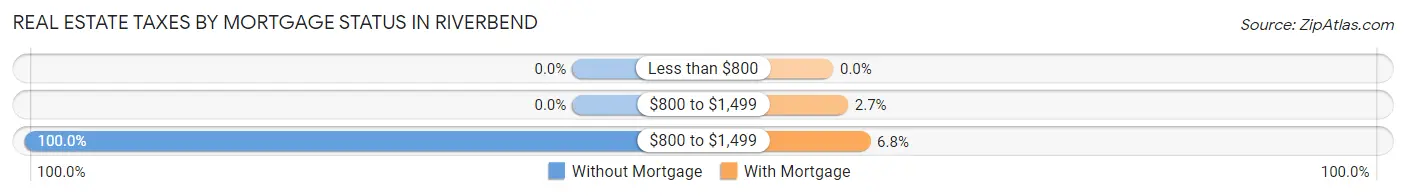
| Property Taxes | Without Mortgage | With Mortgage |
| Less than $800 | 0 (0.0%) | 0 (0.0%) |
| $800 to $1,499 | 0 (0.0%) | 14 (2.7%) |
| $800 to $1,499 | 146 (100.0%) | 35 (6.8%) |
| Total | 146 (100.0%) | 516 (100.0%) |
Health & Disability in Riverbend
Health Insurance Coverage by Age in Riverbend
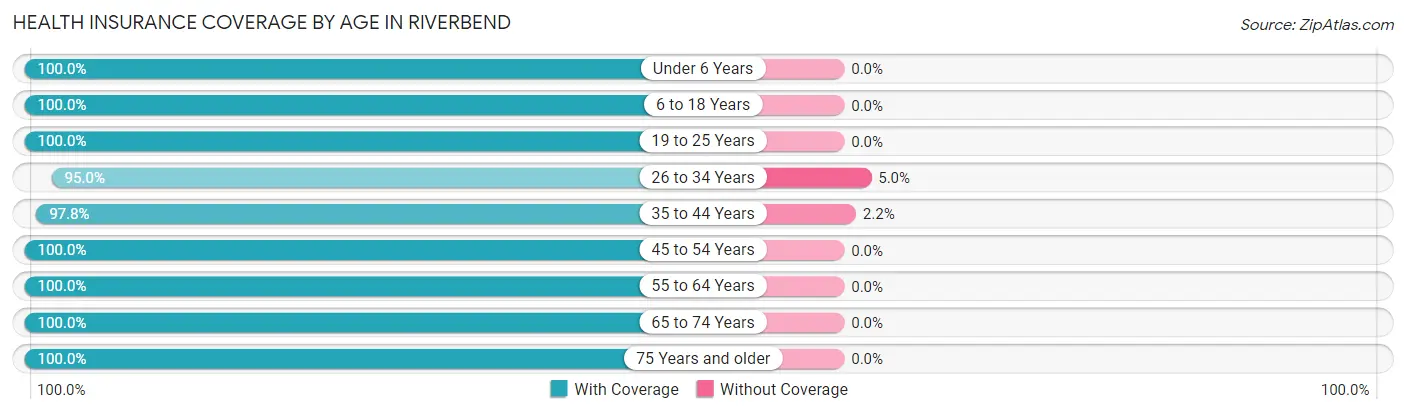
| Age Bracket | With Coverage | Without Coverage |
| Under 6 Years | 46 (100.0%) | 0 (0.0%) |
| 6 to 18 Years | 428 (100.0%) | 0 (0.0%) |
| 19 to 25 Years | 45 (100.0%) | 0 (0.0%) |
| 26 to 34 Years | 302 (95.0%) | 16 (5.0%) |
| 35 to 44 Years | 270 (97.8%) | 6 (2.2%) |
| 45 to 54 Years | 402 (100.0%) | 0 (0.0%) |
| 55 to 64 Years | 309 (100.0%) | 0 (0.0%) |
| 65 to 74 Years | 106 (100.0%) | 0 (0.0%) |
| 75 Years and older | 111 (100.0%) | 0 (0.0%) |
| Total | 2,019 (98.9%) | 22 (1.1%) |
Health Insurance Coverage by Citizenship Status in Riverbend
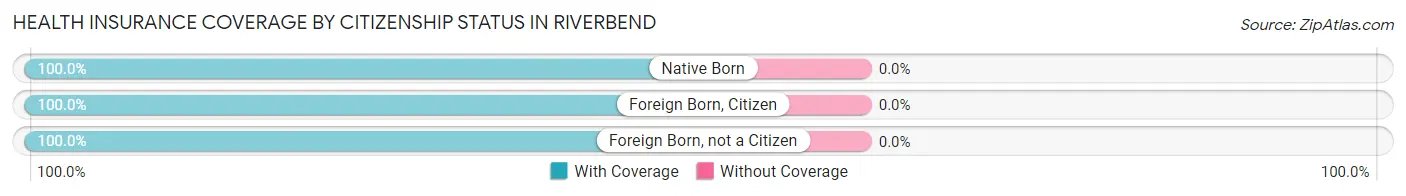
| Citizenship Status | With Coverage | Without Coverage |
| Native Born | 46 (100.0%) | 0 (0.0%) |
| Foreign Born, Citizen | 428 (100.0%) | 0 (0.0%) |
| Foreign Born, not a Citizen | 45 (100.0%) | 0 (0.0%) |
Health Insurance Coverage by Household Income in Riverbend
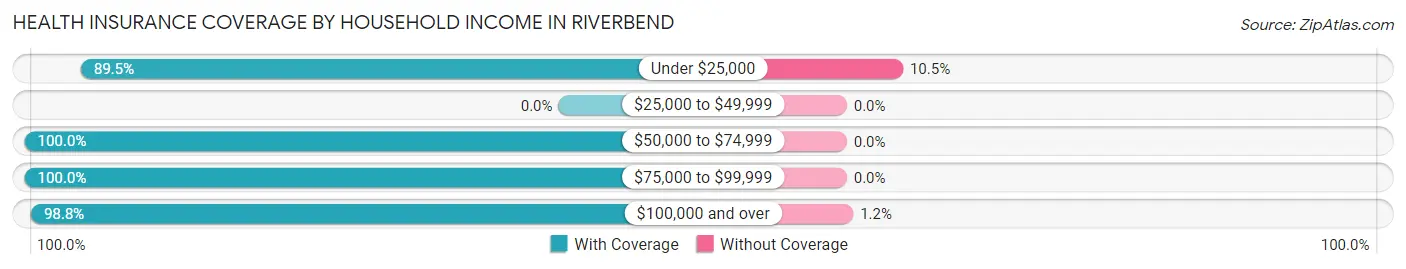
| Household Income | With Coverage | Without Coverage |
| Under $25,000 | 51 (89.5%) | 6 (10.5%) |
| $25,000 to $49,999 | 0 (0.0%) | 0 (0.0%) |
| $50,000 to $74,999 | 342 (100.0%) | 0 (0.0%) |
| $75,000 to $99,999 | 314 (100.0%) | 0 (0.0%) |
| $100,000 and over | 1,312 (98.8%) | 16 (1.2%) |
Public vs Private Health Insurance Coverage by Age in Riverbend
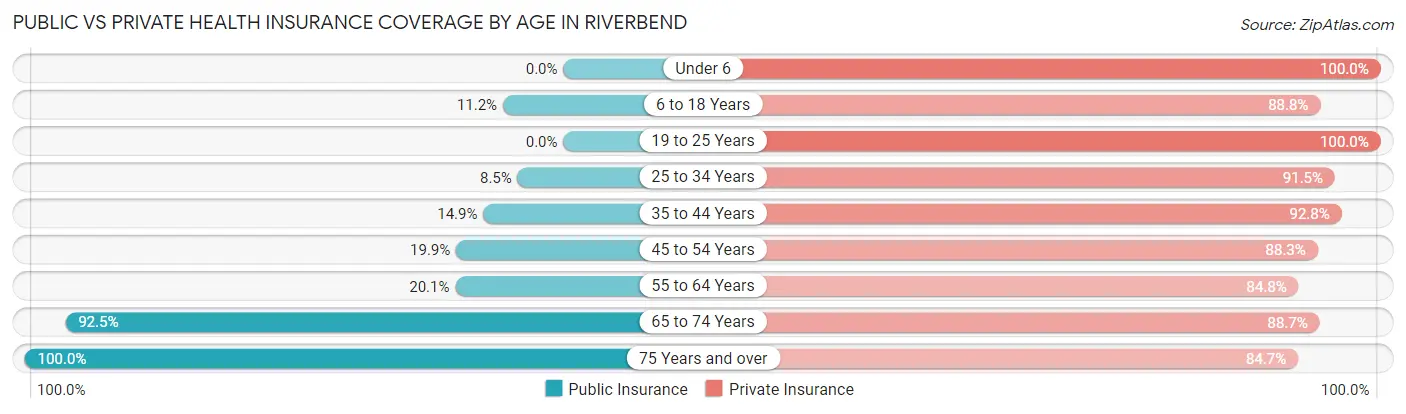
| Age Bracket | Public Insurance | Private Insurance |
| Under 6 | 0 (0.0%) | 46 (100.0%) |
| 6 to 18 Years | 48 (11.2%) | 380 (88.8%) |
| 19 to 25 Years | 0 (0.0%) | 45 (100.0%) |
| 25 to 34 Years | 27 (8.5%) | 291 (91.5%) |
| 35 to 44 Years | 41 (14.9%) | 256 (92.7%) |
| 45 to 54 Years | 80 (19.9%) | 355 (88.3%) |
| 55 to 64 Years | 62 (20.1%) | 262 (84.8%) |
| 65 to 74 Years | 98 (92.4%) | 94 (88.7%) |
| 75 Years and over | 111 (100.0%) | 94 (84.7%) |
| Total | 467 (22.9%) | 1,823 (89.3%) |
Disability Status by Sex by Age in Riverbend
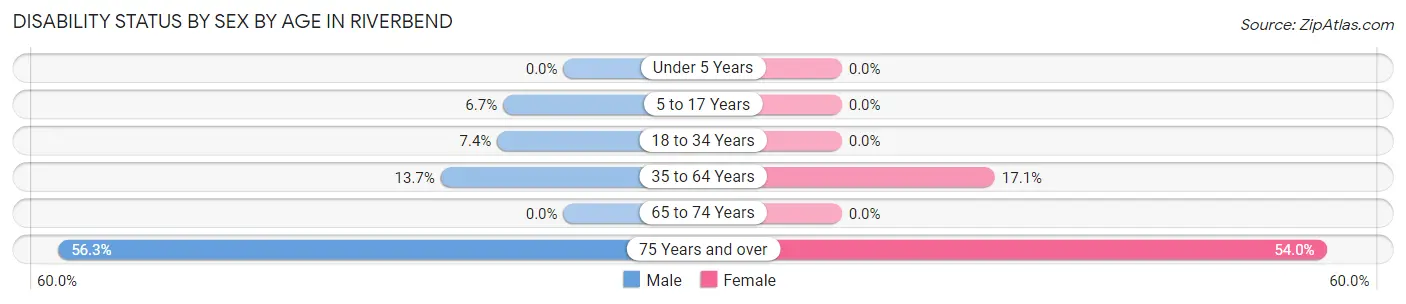
| Age Bracket | Male | Female |
| Under 5 Years | 0 (0.0%) | 0 (0.0%) |
| 5 to 17 Years | 17 (6.7%) | 0 (0.0%) |
| 18 to 34 Years | 16 (7.4%) | 0 (0.0%) |
| 35 to 64 Years | 70 (13.7%) | 81 (17.1%) |
| 65 to 74 Years | 0 (0.0%) | 0 (0.0%) |
| 75 Years and over | 27 (56.2%) | 34 (54.0%) |
Disability Class by Sex by Age in Riverbend
Disability Class: Hearing Difficulty
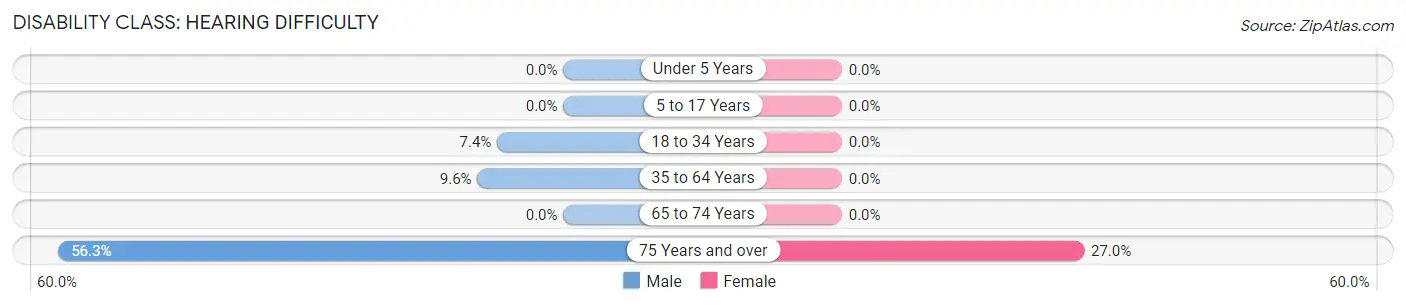
| Age Bracket | Male | Female |
| Under 5 Years | 0 (0.0%) | 0 (0.0%) |
| 5 to 17 Years | 0 (0.0%) | 0 (0.0%) |
| 18 to 34 Years | 16 (7.4%) | 0 (0.0%) |
| 35 to 64 Years | 49 (9.6%) | 0 (0.0%) |
| 65 to 74 Years | 0 (0.0%) | 0 (0.0%) |
| 75 Years and over | 27 (56.2%) | 17 (27.0%) |
Disability Class: Vision Difficulty
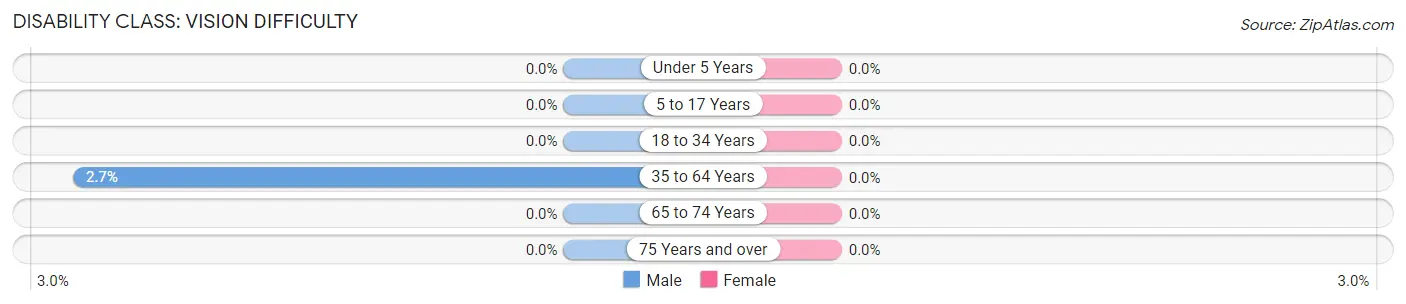
| Age Bracket | Male | Female |
| Under 5 Years | 0 (0.0%) | 0 (0.0%) |
| 5 to 17 Years | 0 (0.0%) | 0 (0.0%) |
| 18 to 34 Years | 0 (0.0%) | 0 (0.0%) |
| 35 to 64 Years | 14 (2.7%) | 0 (0.0%) |
| 65 to 74 Years | 0 (0.0%) | 0 (0.0%) |
| 75 Years and over | 0 (0.0%) | 0 (0.0%) |
Disability Class: Cognitive Difficulty
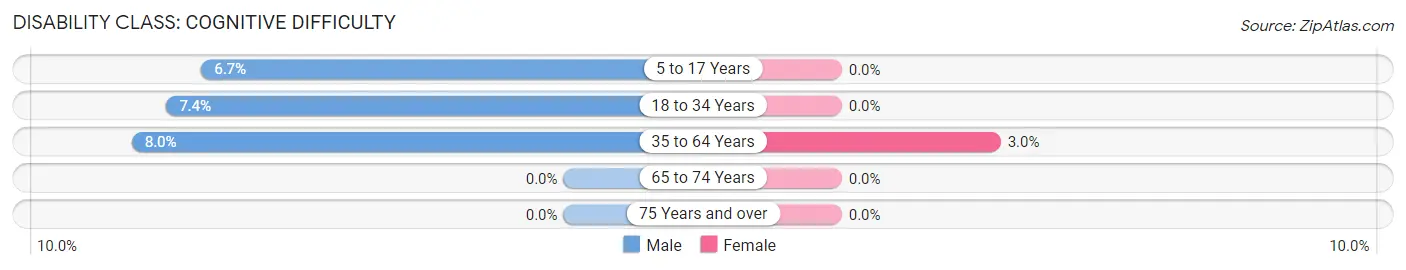
| Age Bracket | Male | Female |
| 5 to 17 Years | 17 (6.7%) | 0 (0.0%) |
| 18 to 34 Years | 16 (7.4%) | 0 (0.0%) |
| 35 to 64 Years | 41 (8.0%) | 14 (2.9%) |
| 65 to 74 Years | 0 (0.0%) | 0 (0.0%) |
| 75 Years and over | 0 (0.0%) | 0 (0.0%) |
Disability Class: Ambulatory Difficulty
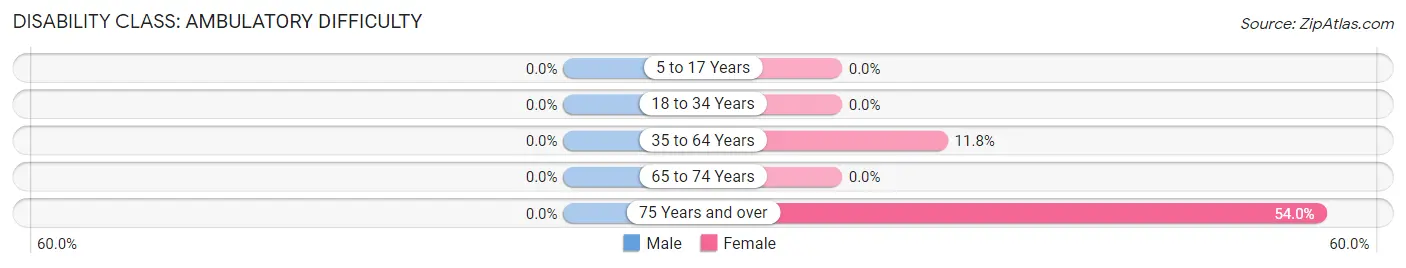
| Age Bracket | Male | Female |
| 5 to 17 Years | 0 (0.0%) | 0 (0.0%) |
| 18 to 34 Years | 0 (0.0%) | 0 (0.0%) |
| 35 to 64 Years | 0 (0.0%) | 56 (11.8%) |
| 65 to 74 Years | 0 (0.0%) | 0 (0.0%) |
| 75 Years and over | 0 (0.0%) | 34 (54.0%) |
Disability Class: Self-Care Difficulty
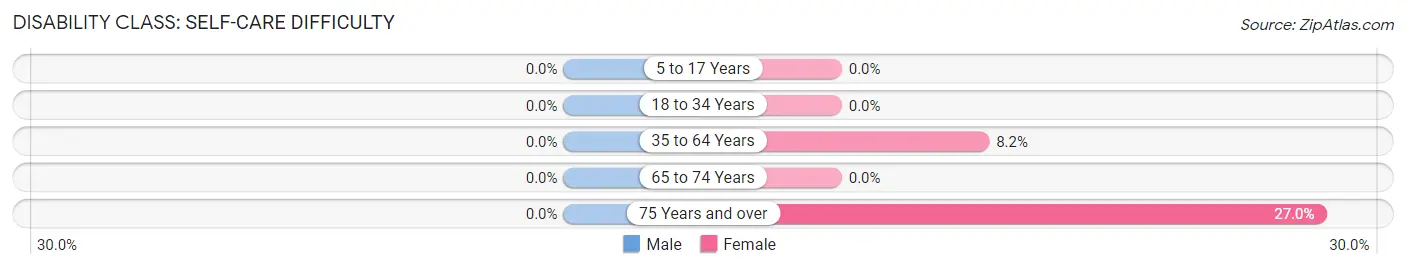
| Age Bracket | Male | Female |
| 5 to 17 Years | 0 (0.0%) | 0 (0.0%) |
| 18 to 34 Years | 0 (0.0%) | 0 (0.0%) |
| 35 to 64 Years | 0 (0.0%) | 39 (8.2%) |
| 65 to 74 Years | 0 (0.0%) | 0 (0.0%) |
| 75 Years and over | 0 (0.0%) | 17 (27.0%) |
Technology Access in Riverbend
Computing Device Access in Riverbend
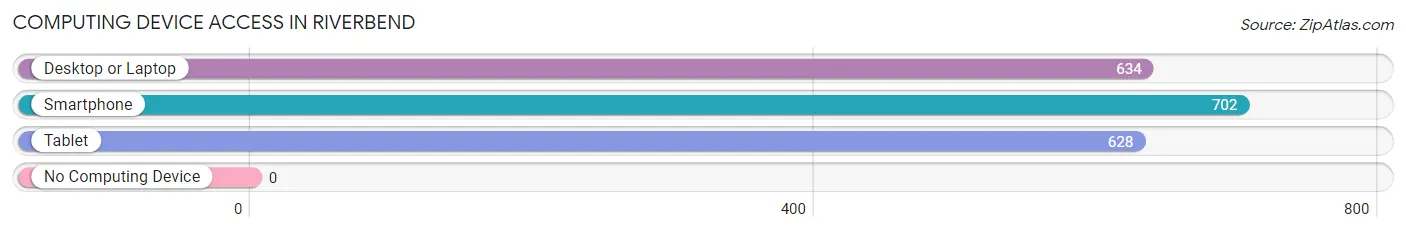
| Device Type | # Households | % Households |
| Desktop or Laptop | 634 | 88.4% |
| Smartphone | 702 | 97.9% |
| Tablet | 628 | 87.6% |
| No Computing Device | 0 | 0.0% |
| Total | 717 | 100.0% |
Internet Access in Riverbend
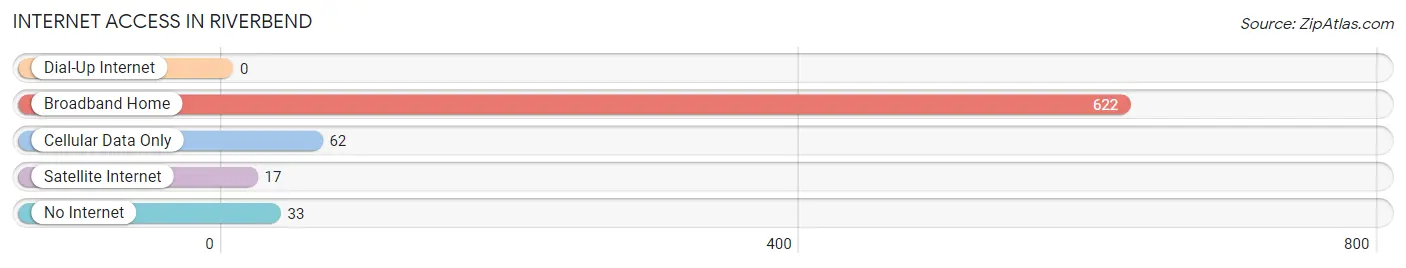
| Internet Type | # Households | % Households |
| Dial-Up Internet | 0 | 0.0% |
| Broadband Home | 622 | 86.8% |
| Cellular Data Only | 62 | 8.6% |
| Satellite Internet | 17 | 2.4% |
| No Internet | 33 | 4.6% |
| Total | 717 | 100.0% |
Riverbend Summary
Riverbend, Washington is a small town located in the Cascade Mountains of Washington State. It is situated in the foothills of the Cascades, about an hour east of Seattle. The town is home to about 1,500 people and is known for its picturesque views of the surrounding mountains and its small-town charm.
History
The area that is now Riverbend was first settled in the late 1800s by homesteaders who were drawn to the area by its abundant natural resources. The town was officially founded in 1891 and was named after the nearby river. The town quickly grew and by the early 1900s, it had become a popular destination for tourists and outdoor enthusiasts.
In the 1920s, the town began to experience a decline in population as people moved away to larger cities. However, in the 1950s, the town experienced a resurgence in popularity as people began to move back to the area. This trend continued into the 1960s and 1970s, and by the 1980s, the town had become a popular destination for outdoor recreation and tourism.
Geography
Riverbend is located in the foothills of the Cascade Mountains in Washington State. The town is situated at an elevation of 1,200 feet and is surrounded by mountains and forests. The nearby river provides a picturesque backdrop to the town and is a popular spot for fishing and other outdoor activities.
The climate in Riverbend is mild and temperate, with warm summers and cool winters. The average temperature in the summer is around 70 degrees Fahrenheit, while the average temperature in the winter is around 40 degrees Fahrenheit.
Economy
The economy of Riverbend is largely based on tourism and outdoor recreation. The town is home to several popular tourist attractions, including a ski resort, a golf course, and several hiking trails. The town also has several restaurants, cafes, and shops that cater to tourists and locals alike.
In addition to tourism, the town is also home to several small businesses, including a lumber mill, a sawmill, and a few small farms. These businesses provide employment for many of the town’s residents.
Demographics
As of the 2010 census, the population of Riverbend was 1,500. The town is predominantly white, with about 90% of the population being Caucasian. The remaining 10% of the population is made up of African Americans, Asians, and Native Americans.
The median household income in Riverbend is $45,000, which is slightly lower than the national average. The town has a low unemployment rate, with only about 4% of the population being unemployed.
Riverbend is a small town with a rich history and a vibrant economy. It is a popular destination for tourists and outdoor enthusiasts, and its picturesque views of the surrounding mountains make it a great place to live and visit.
Common Questions
What is Per Capita Income in Riverbend?
Per Capita income in Riverbend is $63,213.
What is the Median Family Income in Riverbend?
Median Family Income in Riverbend is $139,583.
What is the Median Household income in Riverbend?
Median Household Income in Riverbend is $145,764.
What is Income or Wage Gap in Riverbend?
Income or Wage Gap in Riverbend is 31.5%.
Women in Riverbend earn 68.5 cents for every dollar earned by a man.
What is Inequality or Gini Index in Riverbend?
Inequality or Gini Index in Riverbend is 0.40.
What is the Total Population of Riverbend?
Total Population of Riverbend is 2,041.
What is the Total Male Population of Riverbend?
Total Male Population of Riverbend is 1,082.
What is the Total Female Population of Riverbend?
Total Female Population of Riverbend is 959.
What is the Ratio of Males per 100 Females in Riverbend?
There are 112.83 Males per 100 Females in Riverbend.
What is the Ratio of Females per 100 Males in Riverbend?
There are 88.63 Females per 100 Males in Riverbend.
What is the Median Population Age in Riverbend?
Median Population Age in Riverbend is 40.3 Years.
What is the Average Family Size in Riverbend
Average Family Size in Riverbend is 3.0 People.
What is the Average Household Size in Riverbend
Average Household Size in Riverbend is 2.9 People.
How Large is the Labor Force in Riverbend?
There are 1,204 People in the Labor Forcein in Riverbend.
What is the Percentage of People in the Labor Force in Riverbend?
73.0% of People are in the Labor Force in Riverbend.
What is the Unemployment Rate in Riverbend?
Unemployment Rate in Riverbend is 1.6%.