Eastmont, WA Map & Demographics
Eastmont Map
Eastmont Overview
$49,611
PER CAPITA INCOME
$137,402
AVG FAMILY INCOME
$130,602
AVG HOUSEHOLD INCOME
39.5%
WAGE / INCOME GAP [ % ]
60.5¢/ $1
WAGE / INCOME GAP [ $ ]
0.36
INEQUALITY / GINI INDEX
23,173
TOTAL POPULATION
12,219
MALE POPULATION
10,954
FEMALE POPULATION
111.55
MALES / 100 FEMALES
89.65
FEMALES / 100 MALES
39.2
MEDIAN AGE
3.1
AVG FAMILY SIZE
2.9
AVG HOUSEHOLD SIZE
11,864
LABOR FORCE [ PEOPLE ]
65.8%
PERCENT IN LABOR FORCE
5.9%
UNEMPLOYMENT RATE
Income in Eastmont
Income Overview in Eastmont
Per Capita Income in Eastmont is $49,611, while median incomes of families and households are $137,402 and $130,602 respectively.
| Characteristic | Number | Measure |
| Per Capita Income | 23,173 | $49,611 |
| Median Family Income | 6,222 | $137,402 |
| Mean Family Income | 6,222 | $152,023 |
| Median Household Income | 7,897 | $130,602 |
| Mean Household Income | 7,897 | $145,249 |
| Income Deficit | 6,222 | $0 |
| Wage / Income Gap (%) | 23,173 | 39.50% |
| Wage / Income Gap ($) | 23,173 | 60.50¢ per $1 |
| Gini / Inequality Index | 23,173 | 0.36 |
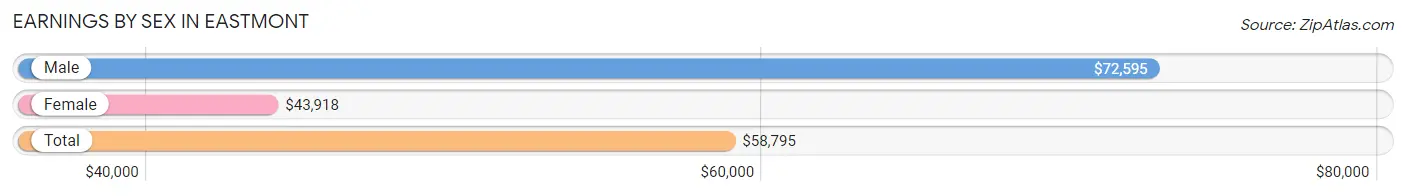
Earnings by Sex in Eastmont
Average Earnings in Eastmont are $58,795, $72,595 for men and $43,918 for women, a difference of 39.5%.
| Sex | Number | Average Earnings |
| Male | 7,530 (59.5%) | $72,595 |
| Female | 5,116 (40.5%) | $43,918 |
| Total | 12,646 (100.0%) | $58,795 |
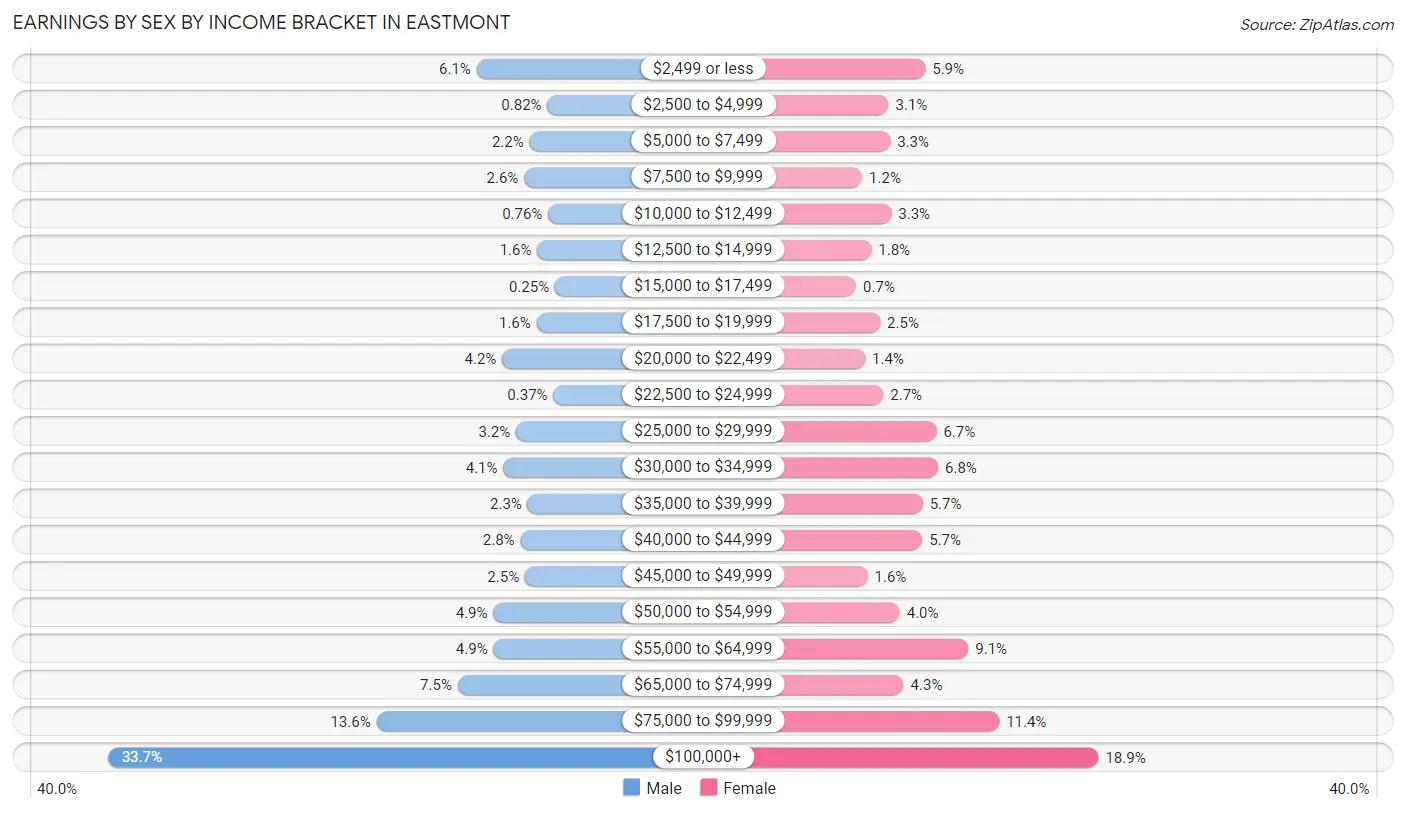
Earnings by Sex by Income Bracket in Eastmont
The most common earnings brackets in Eastmont are $100,000+ for men (2,537 | 33.7%) and $100,000+ for women (965 | 18.9%).
| Income | Male | Female |
| $2,499 or less | 461 (6.1%) | 301 (5.9%) |
| $2,500 to $4,999 | 62 (0.8%) | 160 (3.1%) |
| $5,000 to $7,499 | 163 (2.2%) | 167 (3.3%) |
| $7,500 to $9,999 | 193 (2.6%) | 59 (1.1%) |
| $10,000 to $12,499 | 57 (0.8%) | 171 (3.3%) |
| $12,500 to $14,999 | 119 (1.6%) | 94 (1.8%) |
| $15,000 to $17,499 | 19 (0.3%) | 36 (0.7%) |
| $17,500 to $19,999 | 123 (1.6%) | 128 (2.5%) |
| $20,000 to $22,499 | 317 (4.2%) | 70 (1.4%) |
| $22,500 to $24,999 | 28 (0.4%) | 140 (2.7%) |
| $25,000 to $29,999 | 239 (3.2%) | 344 (6.7%) |
| $30,000 to $34,999 | 310 (4.1%) | 350 (6.8%) |
| $35,000 to $39,999 | 173 (2.3%) | 291 (5.7%) |
| $40,000 to $44,999 | 214 (2.8%) | 289 (5.7%) |
| $45,000 to $49,999 | 188 (2.5%) | 80 (1.6%) |
| $50,000 to $54,999 | 367 (4.9%) | 203 (4.0%) |
| $55,000 to $64,999 | 366 (4.9%) | 466 (9.1%) |
| $65,000 to $74,999 | 568 (7.5%) | 218 (4.3%) |
| $75,000 to $99,999 | 1,026 (13.6%) | 584 (11.4%) |
| $100,000+ | 2,537 (33.7%) | 965 (18.9%) |
| Total | 7,530 (100.0%) | 5,116 (100.0%) |
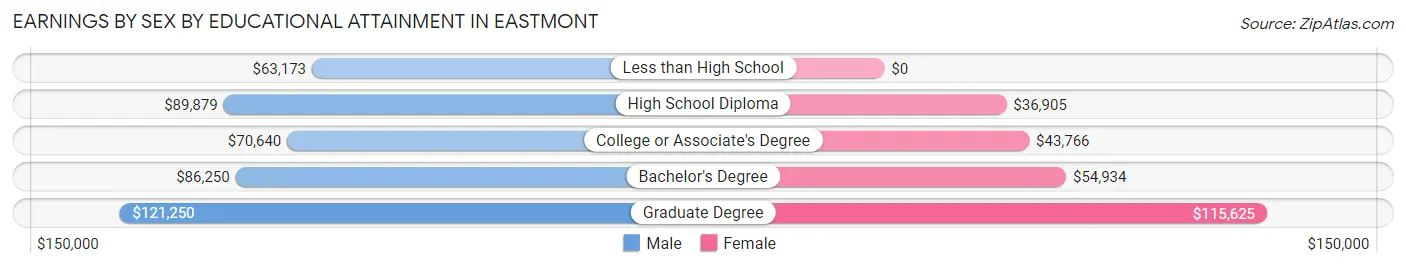
Earnings by Sex by Educational Attainment in Eastmont
Average earnings in Eastmont are $85,827 for men and $51,771 for women, a difference of 39.7%. Men with an educational attainment of graduate degree enjoy the highest average annual earnings of $121,250, while those with less than high school education earn the least with $63,173. Women with an educational attainment of graduate degree earn the most with the average annual earnings of $115,625, while those with high school diploma education have the smallest earnings of $36,905.
| Educational Attainment | Male Income | Female Income |
| Less than High School | $63,173 | $0 |
| High School Diploma | $89,879 | $36,905 |
| College or Associate's Degree | $70,640 | $43,766 |
| Bachelor's Degree | $86,250 | $54,934 |
| Graduate Degree | $121,250 | $115,625 |
| Total | $85,827 | $51,771 |
Family Income in Eastmont
Family Income Brackets in Eastmont
According to the Eastmont family income data, there are 1,661 families falling into the $100,000 to $149,999 income range, which is the most common income bracket and makes up 26.7% of all families.
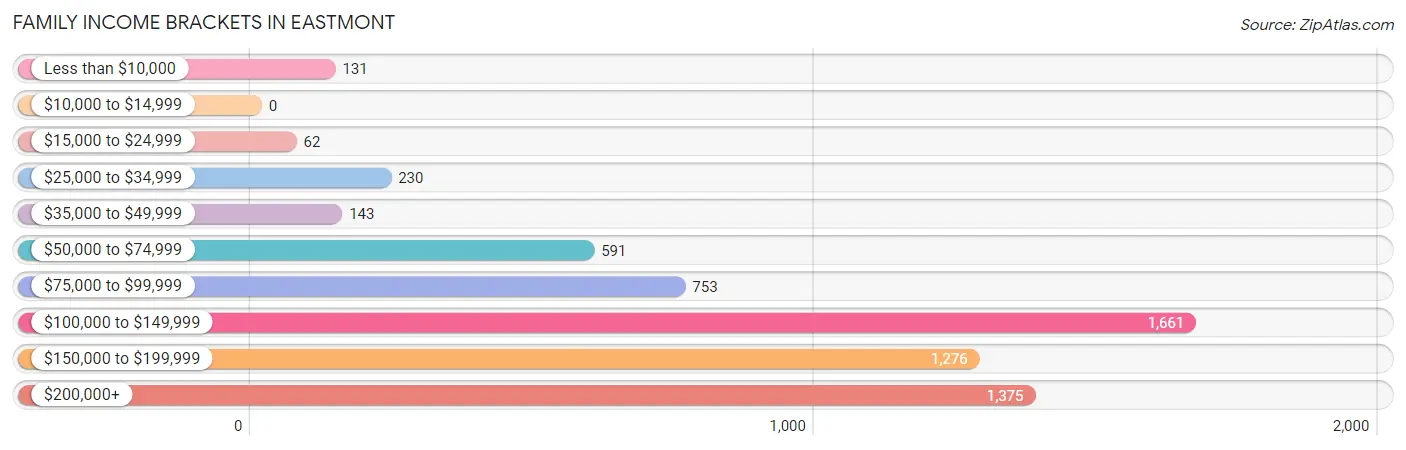
| Income Bracket | # Families | % Families |
| Less than $10,000 | 131 | 2.1% |
| $10,000 to $14,999 | 0 | 0.0% |
| $15,000 to $24,999 | 62 | 1.0% |
| $25,000 to $34,999 | 230 | 3.7% |
| $35,000 to $49,999 | 143 | 2.3% |
| $50,000 to $74,999 | 591 | 9.5% |
| $75,000 to $99,999 | 753 | 12.1% |
| $100,000 to $149,999 | 1,661 | 26.7% |
| $150,000 to $199,999 | 1,276 | 20.5% |
| $200,000+ | 1,375 | 22.1% |
Family Income by Famaliy Size in Eastmont
3-person families (1,337 | 21.5%) account for the highest median family income in Eastmont with $160,750 per family, while 2-person families (2,615 | 42.0%) have the highest median income of $60,390 per family member.

| Income Bracket | # Families | Median Income |
| 2-Person Families | 2,615 (42.0%) | $120,781 |
| 3-Person Families | 1,337 (21.5%) | $160,750 |
| 4-Person Families | 1,534 (24.6%) | $148,000 |
| 5-Person Families | 545 (8.8%) | $91,534 |
| 6-Person Families | 163 (2.6%) | $152,188 |
| 7+ Person Families | 28 (0.4%) | $0 |
| Total | 6,222 (100.0%) | $137,402 |
Family Income by Number of Earners in Eastmont
The median family income in Eastmont is $137,402, with families comprising 3+ earners (884) having the highest median family income of $168,438, while families with no earners (808) have the lowest median family income of $72,315, accounting for 14.2% and 13.0% of families, respectively.
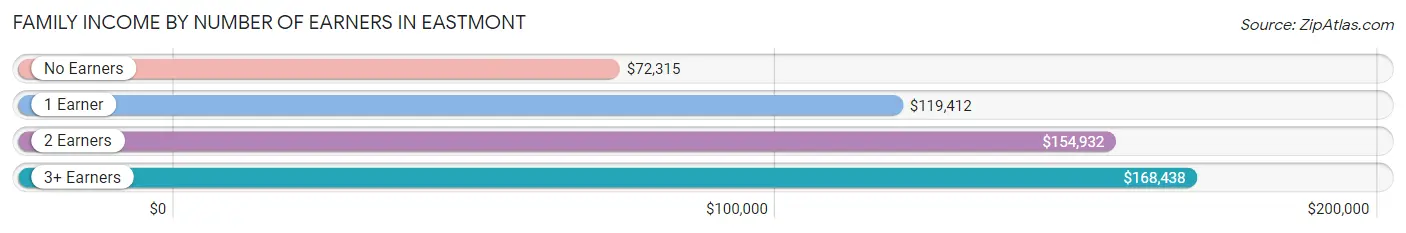
| Number of Earners | # Families | Median Income |
| No Earners | 808 (13.0%) | $72,315 |
| 1 Earner | 1,812 (29.1%) | $119,412 |
| 2 Earners | 2,718 (43.7%) | $154,932 |
| 3+ Earners | 884 (14.2%) | $168,438 |
| Total | 6,222 (100.0%) | $137,402 |
Household Income in Eastmont
Household Income Brackets in Eastmont
With 1,974 households falling in the category, the $100,000 to $149,999 income range is the most frequent in Eastmont, accounting for 25.0% of all households. In contrast, only 39 households (0.5%) fall into the $10,000 to $14,999 income bracket, making it the least populous group.
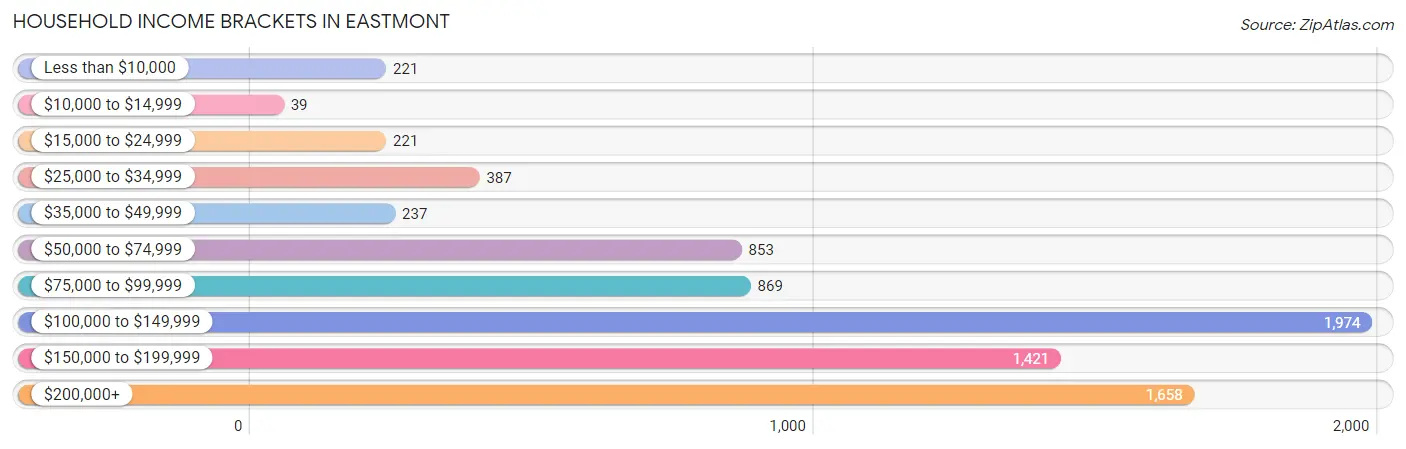
| Income Bracket | # Households | % Households |
| Less than $10,000 | 221 | 2.8% |
| $10,000 to $14,999 | 39 | 0.5% |
| $15,000 to $24,999 | 221 | 2.8% |
| $25,000 to $34,999 | 387 | 4.9% |
| $35,000 to $49,999 | 237 | 3.0% |
| $50,000 to $74,999 | 853 | 10.8% |
| $75,000 to $99,999 | 869 | 11.0% |
| $100,000 to $149,999 | 1,974 | 25.0% |
| $150,000 to $199,999 | 1,421 | 18.0% |
| $200,000+ | 1,658 | 21.0% |
Household Income by Householder Age in Eastmont
The median household income in Eastmont is $130,602, with the highest median household income of $144,115 found in the 25 to 44 years age bracket for the primary householder. A total of 2,691 households (34.1%) fall into this category. Meanwhile, the 15 to 24 years age bracket for the primary householder has the lowest median household income of $0, with 43 households (0.5%) in this group.
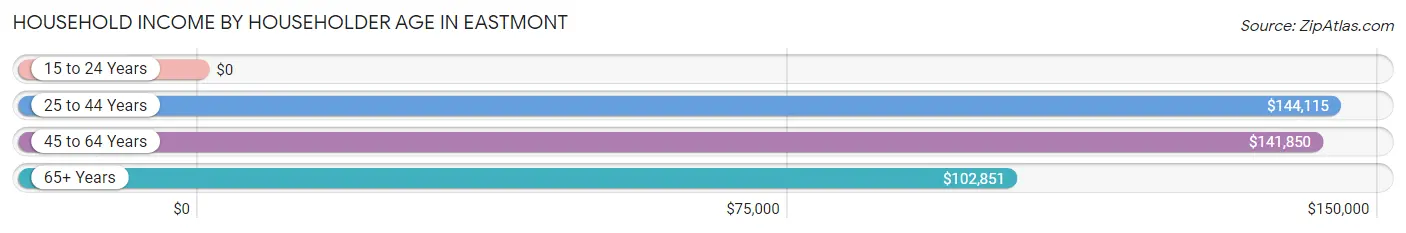
| Income Bracket | # Households | Median Income |
| 15 to 24 Years | 43 (0.5%) | $0 |
| 25 to 44 Years | 2,691 (34.1%) | $144,115 |
| 45 to 64 Years | 3,365 (42.6%) | $141,850 |
| 65+ Years | 1,798 (22.8%) | $102,851 |
| Total | 7,897 (100.0%) | $130,602 |
Poverty in Eastmont
Income Below Poverty by Sex and Age in Eastmont
With 6.7% poverty level for males and 7.3% for females among the residents of Eastmont, 18 to 24 year old males and 18 to 24 year old females are the most vulnerable to poverty, with 296 males (28.8%) and 119 females (20.8%) in their respective age groups living below the poverty level.
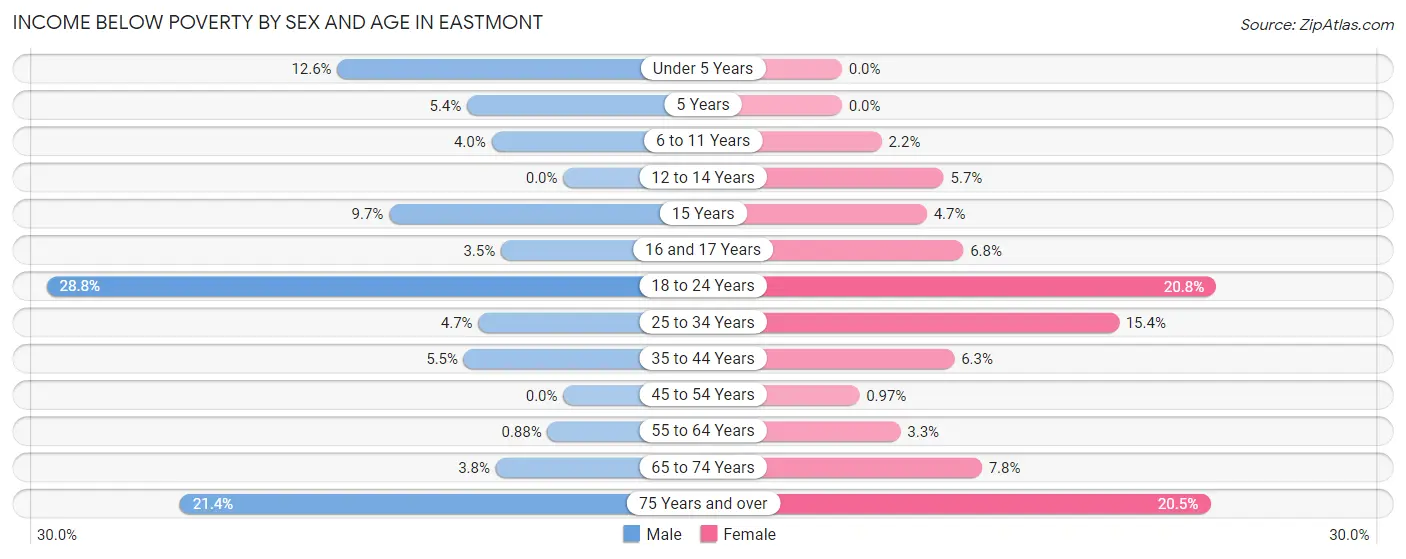
| Age Bracket | Male | Female |
| Under 5 Years | 117 (12.6%) | 0 (0.0%) |
| 5 Years | 6 (5.4%) | 0 (0.0%) |
| 6 to 11 Years | 38 (4.0%) | 16 (2.2%) |
| 12 to 14 Years | 0 (0.0%) | 40 (5.7%) |
| 15 Years | 13 (9.7%) | 13 (4.7%) |
| 16 and 17 Years | 6 (3.5%) | 15 (6.8%) |
| 18 to 24 Years | 296 (28.8%) | 119 (20.8%) |
| 25 to 34 Years | 65 (4.7%) | 190 (15.4%) |
| 35 to 44 Years | 113 (5.5%) | 116 (6.3%) |
| 45 to 54 Years | 0 (0.0%) | 14 (1.0%) |
| 55 to 64 Years | 16 (0.9%) | 41 (3.3%) |
| 65 to 74 Years | 37 (3.8%) | 101 (7.8%) |
| 75 Years and over | 101 (21.3%) | 130 (20.5%) |
| Total | 808 (6.7%) | 795 (7.3%) |
Income Above Poverty by Sex and Age in Eastmont
According to the poverty statistics in Eastmont, males aged 12 to 14 years and females aged under 5 years are the age groups that are most secure financially, with 100.0% of males and 100.0% of females in these age groups living above the poverty line.
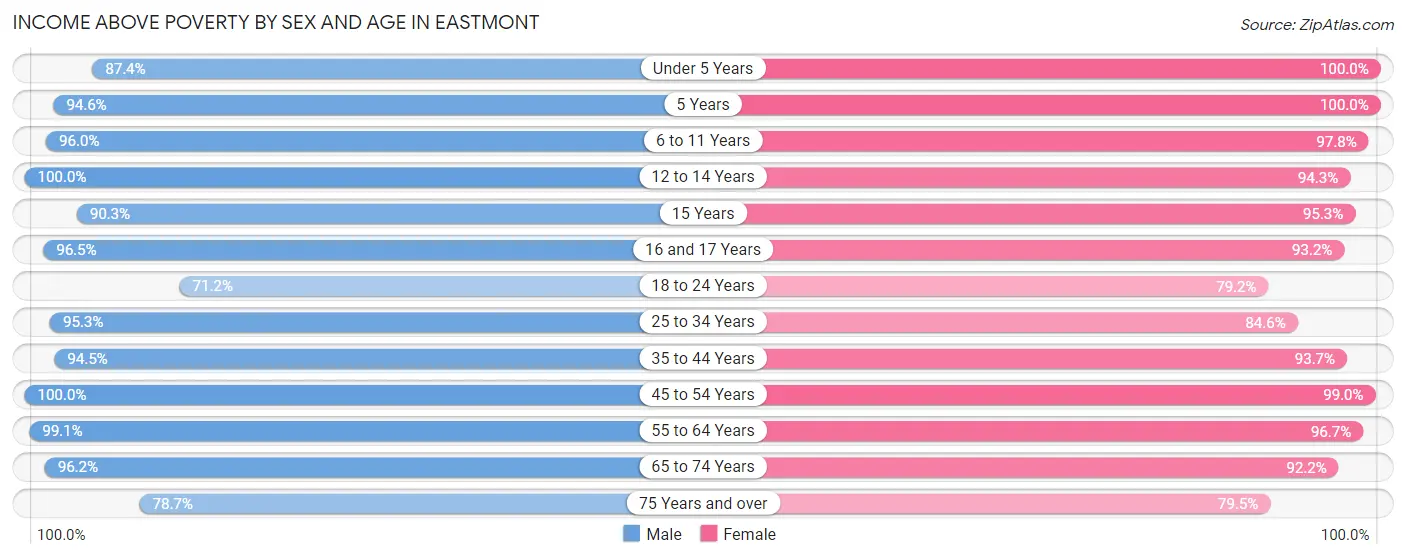
| Age Bracket | Male | Female |
| Under 5 Years | 813 (87.4%) | 581 (100.0%) |
| 5 Years | 106 (94.6%) | 71 (100.0%) |
| 6 to 11 Years | 913 (96.0%) | 706 (97.8%) |
| 12 to 14 Years | 553 (100.0%) | 666 (94.3%) |
| 15 Years | 121 (90.3%) | 262 (95.3%) |
| 16 and 17 Years | 167 (96.5%) | 207 (93.2%) |
| 18 to 24 Years | 733 (71.2%) | 452 (79.2%) |
| 25 to 34 Years | 1,309 (95.3%) | 1,042 (84.6%) |
| 35 to 44 Years | 1,928 (94.5%) | 1,737 (93.7%) |
| 45 to 54 Years | 1,598 (100.0%) | 1,435 (99.0%) |
| 55 to 64 Years | 1,792 (99.1%) | 1,218 (96.7%) |
| 65 to 74 Years | 946 (96.2%) | 1,196 (92.2%) |
| 75 Years and over | 372 (78.6%) | 504 (79.5%) |
| Total | 11,351 (93.3%) | 10,077 (92.7%) |
Income Below Poverty Among Married-Couple Families in Eastmont
The poverty statistics for married-couple families in Eastmont show that 1.2% or 61 of the total 5,178 families live below the poverty line. Families with 3 or 4 children have the highest poverty rate of 3.4%, comprising of 17 families. On the other hand, families with 5 or more children have the lowest poverty rate of 0.0%, which includes 0 families.
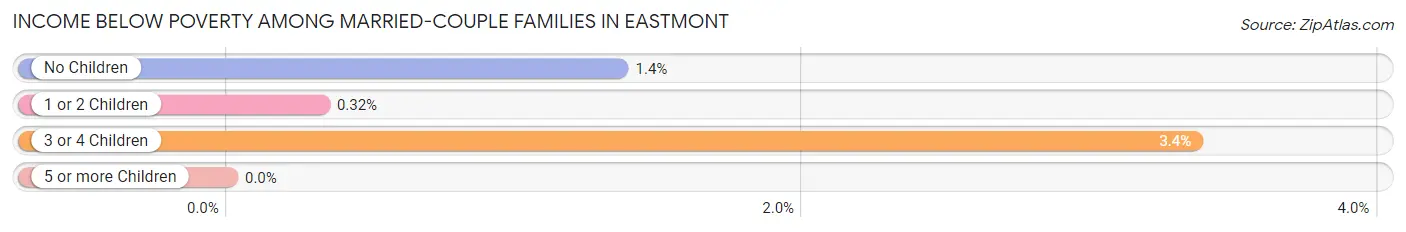
| Children | Above Poverty | Below Poverty |
| No Children | 2,758 (98.6%) | 38 (1.4%) |
| 1 or 2 Children | 1,842 (99.7%) | 6 (0.3%) |
| 3 or 4 Children | 489 (96.6%) | 17 (3.4%) |
| 5 or more Children | 28 (100.0%) | 0 (0.0%) |
| Total | 5,117 (98.8%) | 61 (1.2%) |
Income Below Poverty Among Single-Parent Households in Eastmont
According to the poverty data in Eastmont, 2.5% or 14 single-father households and 25.8% or 124 single-mother households are living below the poverty line. Among single-father households, those with 1 or 2 children have the highest poverty rate, with 14 households (4.8%) experiencing poverty. Likewise, among single-mother households, those with 1 or 2 children have the highest poverty rate, with 102 households (38.9%) falling below the poverty line.
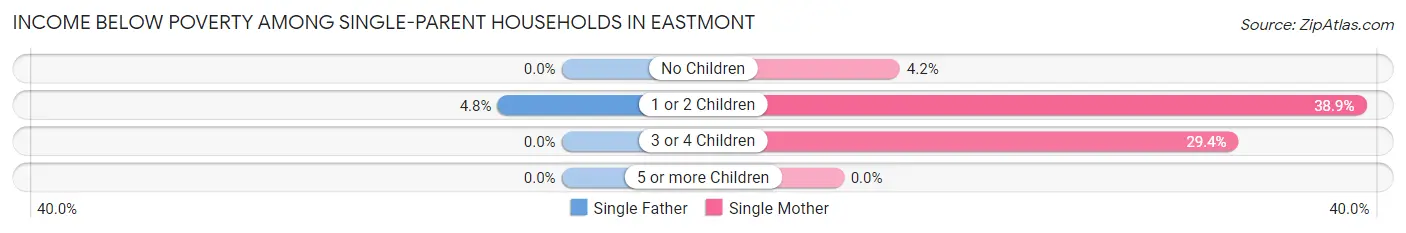
| Children | Single Father | Single Mother |
| No Children | 0 (0.0%) | 7 (4.2%) |
| 1 or 2 Children | 14 (4.8%) | 102 (38.9%) |
| 3 or 4 Children | 0 (0.0%) | 15 (29.4%) |
| 5 or more Children | 0 (0.0%) | 0 (0.0%) |
| Total | 14 (2.5%) | 124 (25.8%) |
Income Below Poverty Among Married-Couple vs Single-Parent Households in Eastmont
The poverty data for Eastmont shows that 61 of the married-couple family households (1.2%) and 138 of the single-parent households (13.2%) are living below the poverty level. Within the married-couple family households, those with 3 or 4 children have the highest poverty rate, with 17 households (3.4%) falling below the poverty line. Among the single-parent households, those with 3 or 4 children have the highest poverty rate, with 15 household (25.9%) living below poverty.
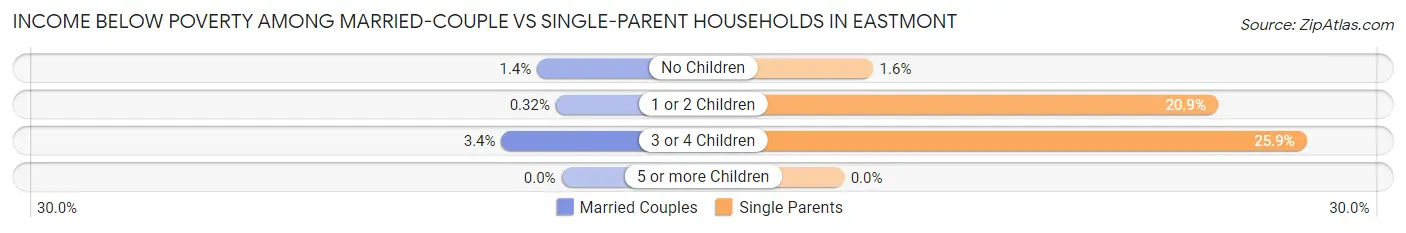
| Children | Married-Couple Families | Single-Parent Households |
| No Children | 38 (1.4%) | 7 (1.6%) |
| 1 or 2 Children | 6 (0.3%) | 116 (20.9%) |
| 3 or 4 Children | 17 (3.4%) | 15 (25.9%) |
| 5 or more Children | 0 (0.0%) | 0 (0.0%) |
| Total | 61 (1.2%) | 138 (13.2%) |
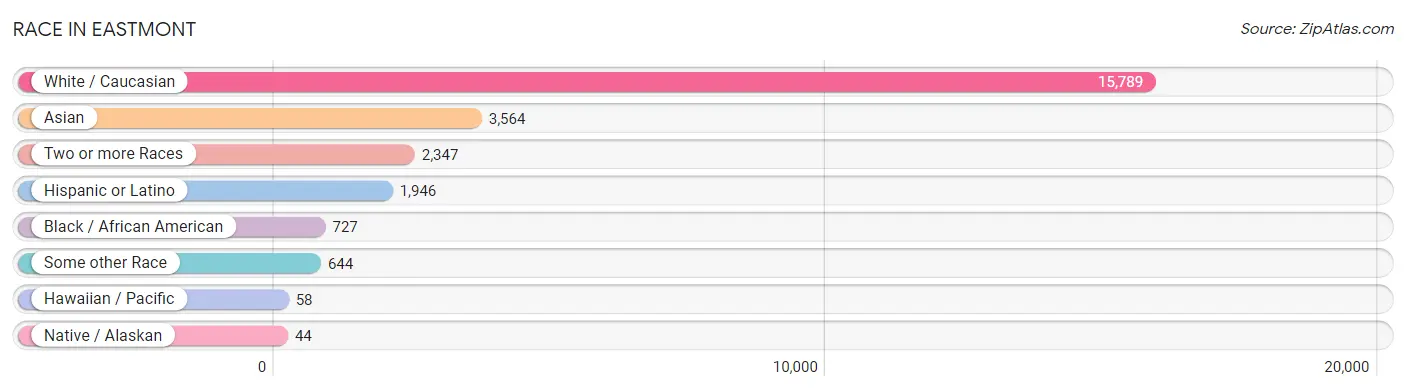
Race in Eastmont
The most populous races in Eastmont are White / Caucasian (15,789 | 68.1%), Asian (3,564 | 15.4%), and Two or more Races (2,347 | 10.1%).
| Race | # Population | % Population |
| Asian | 3,564 | 15.4% |
| Black / African American | 727 | 3.1% |
| Hawaiian / Pacific | 58 | 0.3% |
| Hispanic or Latino | 1,946 | 8.4% |
| Native / Alaskan | 44 | 0.2% |
| White / Caucasian | 15,789 | 68.1% |
| Two or more Races | 2,347 | 10.1% |
| Some other Race | 644 | 2.8% |
| Total | 23,173 | 100.0% |
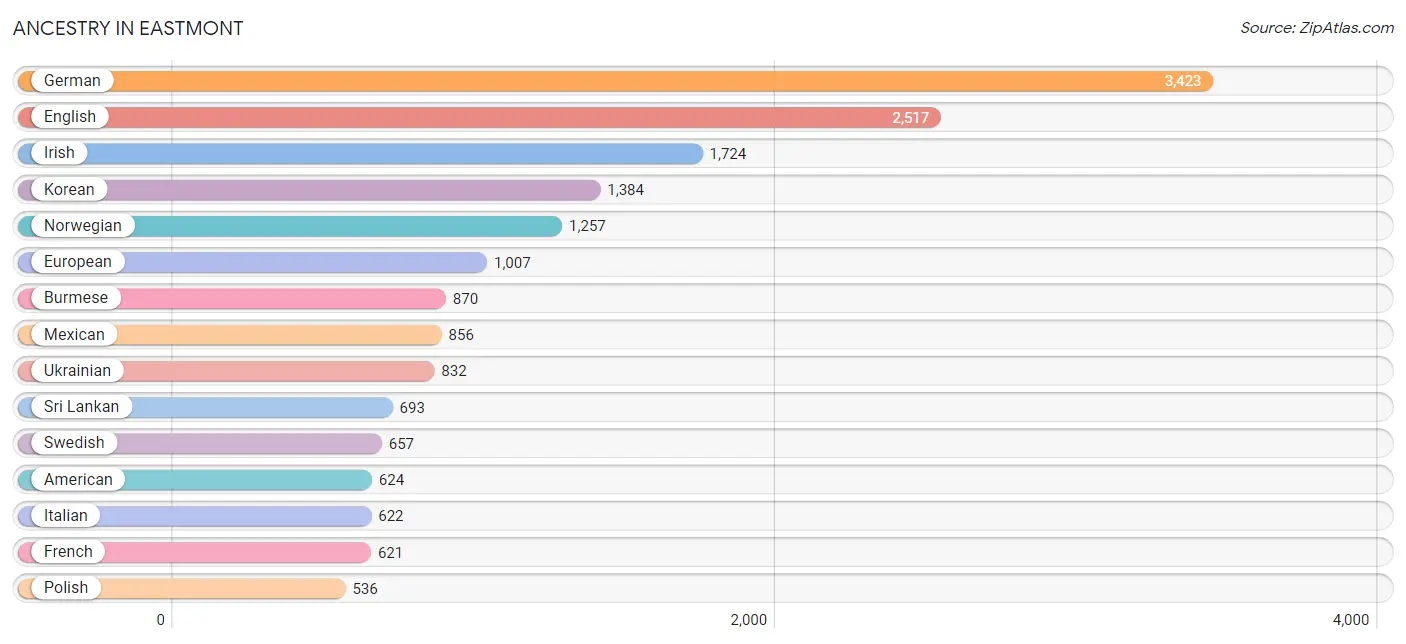
Ancestry in Eastmont
The most populous ancestries reported in Eastmont are German (3,423 | 14.8%), English (2,517 | 10.9%), Irish (1,724 | 7.4%), Korean (1,384 | 6.0%), and Norwegian (1,257 | 5.4%), together accounting for 44.5% of all Eastmont residents.
| Ancestry | # Population | % Population |
| African | 34 | 0.2% |
| American | 624 | 2.7% |
| Arab | 370 | 1.6% |
| Argentinean | 10 | 0.0% |
| Bhutanese | 355 | 1.5% |
| Blackfeet | 114 | 0.5% |
| Brazilian | 151 | 0.6% |
| British | 236 | 1.0% |
| British West Indian | 24 | 0.1% |
| Burmese | 870 | 3.7% |
| Canadian | 41 | 0.2% |
| Celtic | 74 | 0.3% |
| Central American | 235 | 1.0% |
| Cherokee | 26 | 0.1% |
| Chippewa | 26 | 0.1% |
| Choctaw | 18 | 0.1% |
| Costa Rican | 25 | 0.1% |
| Czech | 164 | 0.7% |
| Czechoslovakian | 33 | 0.1% |
| Danish | 113 | 0.5% |
| Dutch | 356 | 1.5% |
| Eastern European | 17 | 0.1% |
| Egyptian | 225 | 1.0% |
| English | 2,517 | 10.9% |
| Ethiopian | 84 | 0.4% |
| European | 1,007 | 4.3% |
| Filipino | 37 | 0.2% |
| Finnish | 87 | 0.4% |
| French | 621 | 2.7% |
| French American Indian | 18 | 0.1% |
| French Canadian | 89 | 0.4% |
| German | 3,423 | 14.8% |
| Greek | 43 | 0.2% |
| Guamanian / Chamorro | 20 | 0.1% |
| Guatemalan | 28 | 0.1% |
| Hopi | 97 | 0.4% |
| Hungarian | 75 | 0.3% |
| Icelander | 18 | 0.1% |
| Indian (Asian) | 459 | 2.0% |
| Inupiat | 3 | 0.0% |
| Iranian | 33 | 0.1% |
| Irish | 1,724 | 7.4% |
| Iroquois | 63 | 0.3% |
| Italian | 622 | 2.7% |
| Japanese | 297 | 1.3% |
| Jordanian | 88 | 0.4% |
| Korean | 1,384 | 6.0% |
| Laotian | 244 | 1.1% |
| Lebanese | 57 | 0.3% |
| Lithuanian | 96 | 0.4% |
| Malaysian | 9 | 0.0% |
| Mexican | 856 | 3.7% |
| Native Hawaiian | 5 | 0.0% |
| Nigerian | 32 | 0.1% |
| Northern European | 96 | 0.4% |
| Norwegian | 1,257 | 5.4% |
| Panamanian | 127 | 0.5% |
| Pennsylvania German | 16 | 0.1% |
| Polish | 536 | 2.3% |
| Portuguese | 19 | 0.1% |
| Puerto Rican | 389 | 1.7% |
| Russian | 156 | 0.7% |
| Salvadoran | 55 | 0.2% |
| Samoan | 42 | 0.2% |
| Scandinavian | 295 | 1.3% |
| Scotch-Irish | 148 | 0.6% |
| Scottish | 498 | 2.1% |
| Serbian | 52 | 0.2% |
| South African | 20 | 0.1% |
| South American | 10 | 0.0% |
| Spaniard | 289 | 1.3% |
| Spanish | 17 | 0.1% |
| Sri Lankan | 693 | 3.0% |
| Subsaharan African | 234 | 1.0% |
| Swedish | 657 | 2.8% |
| Swiss | 137 | 0.6% |
| Thai | 476 | 2.1% |
| Tlingit-Haida | 2 | 0.0% |
| Ukrainian | 832 | 3.6% |
| Welsh | 25 | 0.1% | View All 80 Rows |
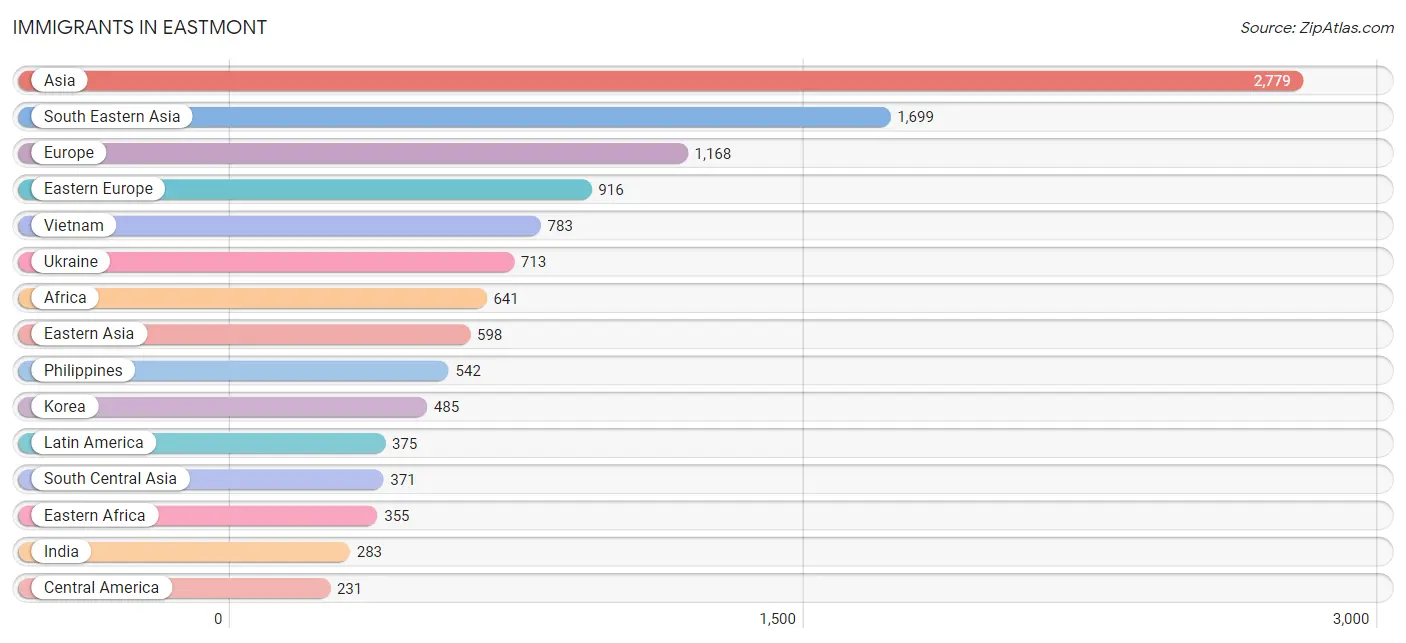
Immigrants in Eastmont
The most numerous immigrant groups reported in Eastmont came from Asia (2,779 | 12.0%), South Eastern Asia (1,699 | 7.3%), Europe (1,168 | 5.0%), Eastern Europe (916 | 4.0%), and Vietnam (783 | 3.4%), together accounting for 31.7% of all Eastmont residents.
| Immigration Origin | # Population | % Population |
| Africa | 641 | 2.8% |
| Albania | 18 | 0.1% |
| Argentina | 10 | 0.0% |
| Asia | 2,779 | 12.0% |
| Brazil | 79 | 0.3% |
| Cambodia | 85 | 0.4% |
| Canada | 88 | 0.4% |
| Caribbean | 55 | 0.2% |
| Central America | 231 | 1.0% |
| China | 100 | 0.4% |
| Czechoslovakia | 25 | 0.1% |
| Eastern Africa | 355 | 1.5% |
| Eastern Asia | 598 | 2.6% |
| Eastern Europe | 916 | 4.0% |
| Egypt | 225 | 1.0% |
| El Salvador | 14 | 0.1% |
| England | 29 | 0.1% |
| Eritrea | 11 | 0.1% |
| Ethiopia | 192 | 0.8% |
| Europe | 1,168 | 5.0% |
| Fiji | 11 | 0.1% |
| Germany | 35 | 0.2% |
| Greece | 3 | 0.0% |
| Guatemala | 25 | 0.1% |
| India | 283 | 1.2% |
| Indonesia | 223 | 1.0% |
| Jamaica | 55 | 0.2% |
| Japan | 13 | 0.1% |
| Jordan | 88 | 0.4% |
| Kenya | 99 | 0.4% |
| Korea | 485 | 2.1% |
| Laos | 23 | 0.1% |
| Latin America | 375 | 1.6% |
| Lebanon | 23 | 0.1% |
| Lithuania | 72 | 0.3% |
| Malaysia | 4 | 0.0% |
| Mexico | 65 | 0.3% |
| Netherlands | 11 | 0.1% |
| Northern Africa | 225 | 1.0% |
| Northern Europe | 145 | 0.6% |
| Oceania | 53 | 0.2% |
| Pakistan | 62 | 0.3% |
| Panama | 127 | 0.5% |
| Philippines | 542 | 2.3% |
| Russia | 25 | 0.1% |
| Serbia | 52 | 0.2% |
| South Africa | 61 | 0.3% |
| South America | 89 | 0.4% |
| South Central Asia | 371 | 1.6% |
| South Eastern Asia | 1,699 | 7.3% |
| Southern Europe | 61 | 0.3% |
| Spain | 58 | 0.3% |
| Taiwan | 40 | 0.2% |
| Thailand | 39 | 0.2% |
| Ukraine | 713 | 3.1% |
| Vietnam | 783 | 3.4% |
| Western Asia | 111 | 0.5% |
| Western Europe | 46 | 0.2% | View All 58 Rows |
Sex and Age in Eastmont
Sex and Age in Eastmont
The most populous age groups in Eastmont are 35 to 39 Years (1,203 | 9.9%) for men and 35 to 39 Years (1,101 | 10.1%) for women.
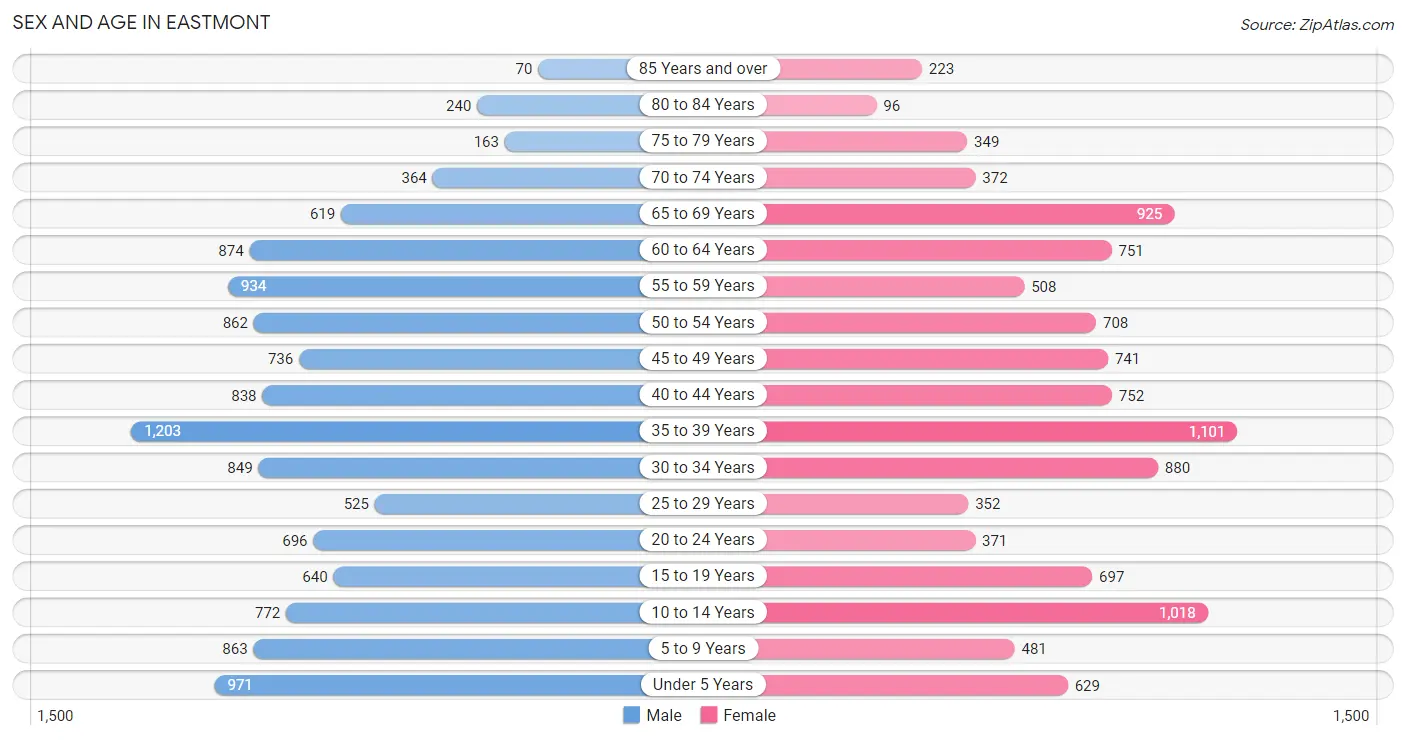
| Age Bracket | Male | Female |
| Under 5 Years | 971 (8.0%) | 629 (5.7%) |
| 5 to 9 Years | 863 (7.1%) | 481 (4.4%) |
| 10 to 14 Years | 772 (6.3%) | 1,018 (9.3%) |
| 15 to 19 Years | 640 (5.2%) | 697 (6.4%) |
| 20 to 24 Years | 696 (5.7%) | 371 (3.4%) |
| 25 to 29 Years | 525 (4.3%) | 352 (3.2%) |
| 30 to 34 Years | 849 (7.0%) | 880 (8.0%) |
| 35 to 39 Years | 1,203 (9.9%) | 1,101 (10.1%) |
| 40 to 44 Years | 838 (6.9%) | 752 (6.9%) |
| 45 to 49 Years | 736 (6.0%) | 741 (6.8%) |
| 50 to 54 Years | 862 (7.0%) | 708 (6.5%) |
| 55 to 59 Years | 934 (7.6%) | 508 (4.6%) |
| 60 to 64 Years | 874 (7.1%) | 751 (6.9%) |
| 65 to 69 Years | 619 (5.1%) | 925 (8.4%) |
| 70 to 74 Years | 364 (3.0%) | 372 (3.4%) |
| 75 to 79 Years | 163 (1.3%) | 349 (3.2%) |
| 80 to 84 Years | 240 (2.0%) | 96 (0.9%) |
| 85 Years and over | 70 (0.6%) | 223 (2.0%) |
| Total | 12,219 (100.0%) | 10,954 (100.0%) |
Families and Households in Eastmont
Median Family Size in Eastmont
The median family size in Eastmont is 3.12 persons per family, with married-couple families (5,178 | 83.2%) accounting for the largest median family size of 3.15 persons per family. On the other hand, single male/father families (564 | 9.1%) represent the smallest median family size with 2.84 persons per family.
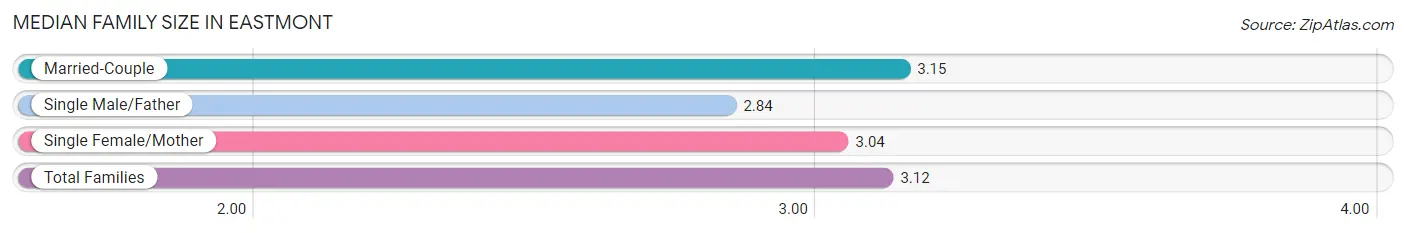
| Family Type | # Families | Family Size |
| Married-Couple | 5,178 (83.2%) | 3.15 |
| Single Male/Father | 564 (9.1%) | 2.84 |
| Single Female/Mother | 480 (7.7%) | 3.04 |
| Total Families | 6,222 (100.0%) | 3.12 |
Median Household Size in Eastmont
The median household size in Eastmont is 2.92 persons per household, with single female/mother households (480 | 6.1%) accounting for the largest median household size of 3.78 persons per household. non-family households (1,675 | 21.2%) represent the smallest median household size with 1.63 persons per household.
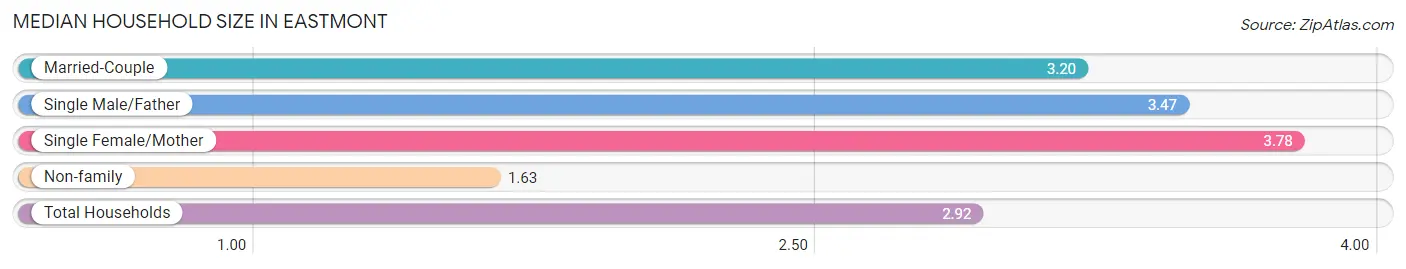
| Household Type | # Households | Household Size |
| Married-Couple | 5,178 (65.6%) | 3.20 |
| Single Male/Father | 564 (7.1%) | 3.47 |
| Single Female/Mother | 480 (6.1%) | 3.78 |
| Non-family | 1,675 (21.2%) | 1.63 |
| Total Households | 7,897 (100.0%) | 2.92 |
Household Size by Marriage Status in Eastmont
Out of a total of 7,897 households in Eastmont, 6,222 (78.8%) are family households, while 1,675 (21.2%) are nonfamily households. The most numerous type of family households are 2-person households, comprising 2,243, and the most common type of nonfamily households are 1-person households, comprising 979.
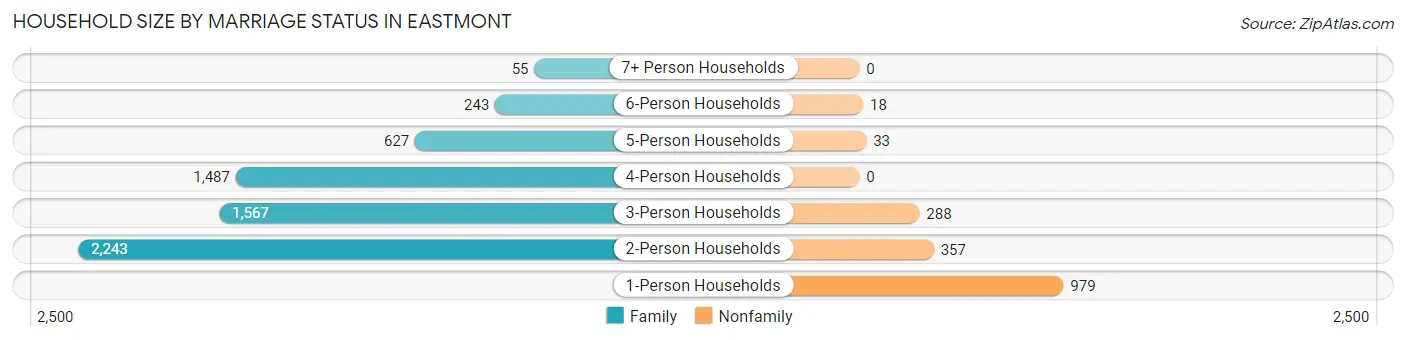
| Household Size | Family Households | Nonfamily Households |
| 1-Person Households | - | 979 (12.4%) |
| 2-Person Households | 2,243 (28.4%) | 357 (4.5%) |
| 3-Person Households | 1,567 (19.8%) | 288 (3.6%) |
| 4-Person Households | 1,487 (18.8%) | 0 (0.0%) |
| 5-Person Households | 627 (7.9%) | 33 (0.4%) |
| 6-Person Households | 243 (3.1%) | 18 (0.2%) |
| 7+ Person Households | 55 (0.7%) | 0 (0.0%) |
| Total | 6,222 (78.8%) | 1,675 (21.2%) |
Female Fertility in Eastmont
Fertility by Age in Eastmont
Average fertility rate in Eastmont is 61.0 births per 1,000 women. Women in the age bracket of 20 to 34 years have the highest fertility rate with 128.0 births per 1,000 women. Women in the age bracket of 20 to 34 years acount for 65.5% of all women with births.
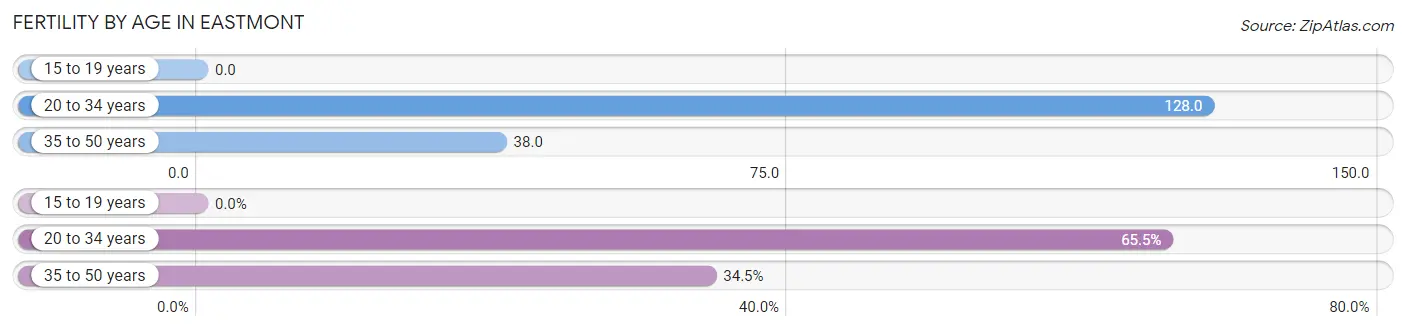
| Age Bracket | Women with Births | Births / 1,000 Women |
| 15 to 19 years | 0 (0.0%) | 0.0 |
| 20 to 34 years | 205 (65.5%) | 128.0 |
| 35 to 50 years | 108 (34.5%) | 38.0 |
| Total | 313 (100.0%) | 61.0 |
Fertility by Age by Marriage Status in Eastmont
89.5% of women with births (313) in Eastmont are married. The highest percentage of unmarried women with births falls into 35 to 50 years age bracket with 24.1% of them unmarried at the time of birth, while the lowest percentage of unmarried women with births belong to 20 to 34 years age bracket with 3.4% of them unmarried.
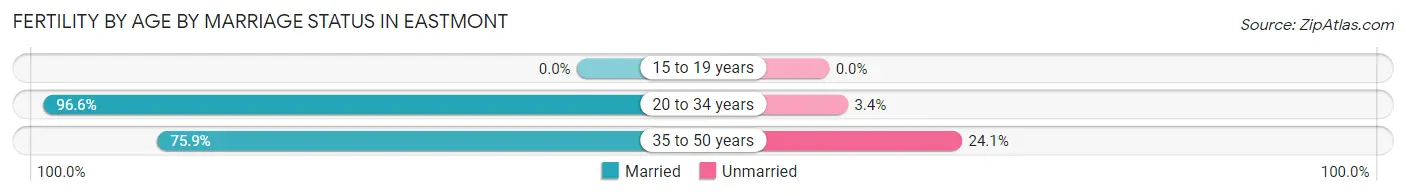
| Age Bracket | Married | Unmarried |
| 15 to 19 years | 0 (0.0%) | 0 (0.0%) |
| 20 to 34 years | 198 (96.6%) | 7 (3.4%) |
| 35 to 50 years | 82 (75.9%) | 26 (24.1%) |
| Total | 280 (89.5%) | 33 (10.5%) |
Fertility by Education in Eastmont
Average fertility rate in Eastmont is 61.0 births per 1,000 women. Women with the education attainment of bachelor's degree have the highest fertility rate of 89.0 births per 1,000 women, while women with the education attainment of less than high school have the lowest fertility at 10.0 births per 1,000 women. Women with the education attainment of bachelor's degree represent 41.5% of all women with births.
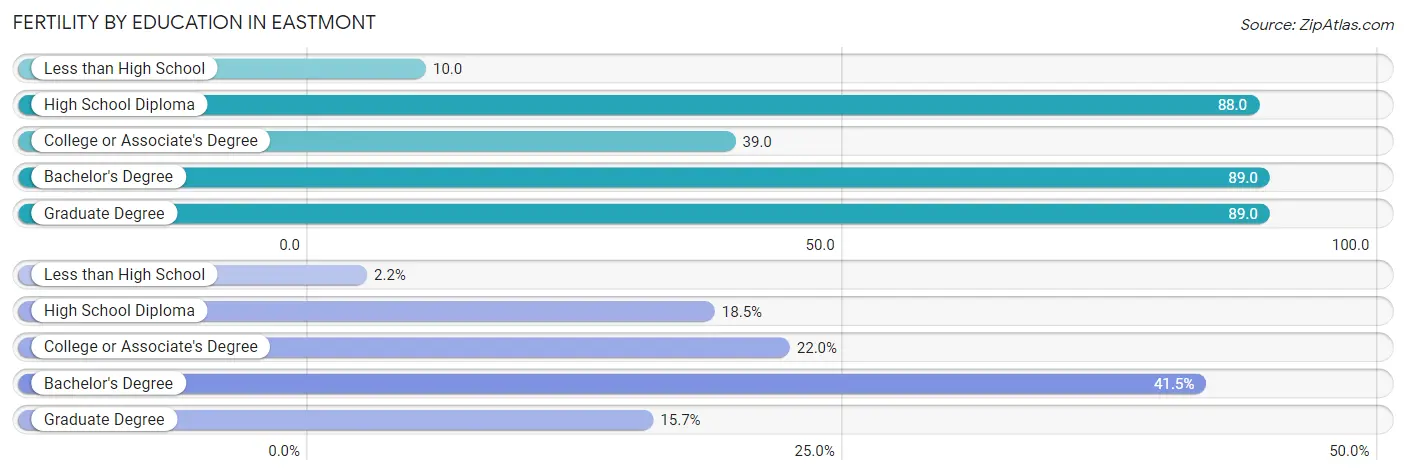
| Educational Attainment | Women with Births | Births / 1,000 Women |
| Less than High School | 7 (2.2%) | 10.0 |
| High School Diploma | 58 (18.5%) | 88.0 |
| College or Associate's Degree | 69 (22.0%) | 39.0 |
| Bachelor's Degree | 130 (41.5%) | 89.0 |
| Graduate Degree | 49 (15.7%) | 89.0 |
| Total | 313 (100.0%) | 61.0 |
Fertility by Education by Marriage Status in Eastmont
10.5% of women with births in Eastmont are unmarried. Women with the educational attainment of college or associate's degree are most likely to be married with 100.0% of them married at childbirth, while women with the educational attainment of less than high school are least likely to be married with 100.0% of them unmarried at childbirth.
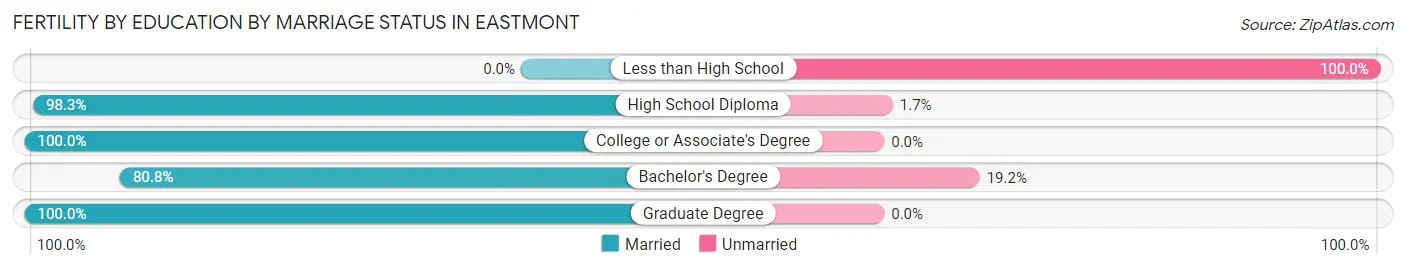
| Educational Attainment | Married | Unmarried |
| Less than High School | 0 (0.0%) | 7 (100.0%) |
| High School Diploma | 57 (98.3%) | 1 (1.7%) |
| College or Associate's Degree | 69 (100.0%) | 0 (0.0%) |
| Bachelor's Degree | 105 (80.8%) | 25 (19.2%) |
| Graduate Degree | 49 (100.0%) | 0 (0.0%) |
| Total | 280 (89.5%) | 33 (10.5%) |
Employment Characteristics in Eastmont
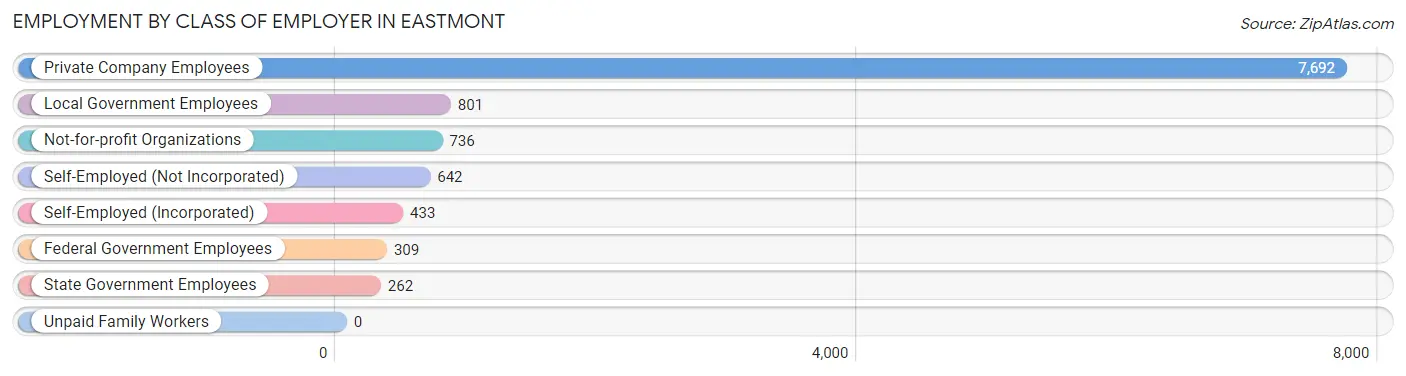
Employment by Class of Employer in Eastmont
Among the 10,875 employed individuals in Eastmont, private company employees (7,692 | 70.7%), local government employees (801 | 7.4%), and not-for-profit organizations (736 | 6.8%) make up the most common classes of employment.
| Employer Class | # Employees | % Employees |
| Private Company Employees | 7,692 | 70.7% |
| Self-Employed (Incorporated) | 433 | 4.0% |
| Self-Employed (Not Incorporated) | 642 | 5.9% |
| Not-for-profit Organizations | 736 | 6.8% |
| Local Government Employees | 801 | 7.4% |
| State Government Employees | 262 | 2.4% |
| Federal Government Employees | 309 | 2.8% |
| Unpaid Family Workers | 0 | 0.0% |
| Total | 10,875 | 100.0% |
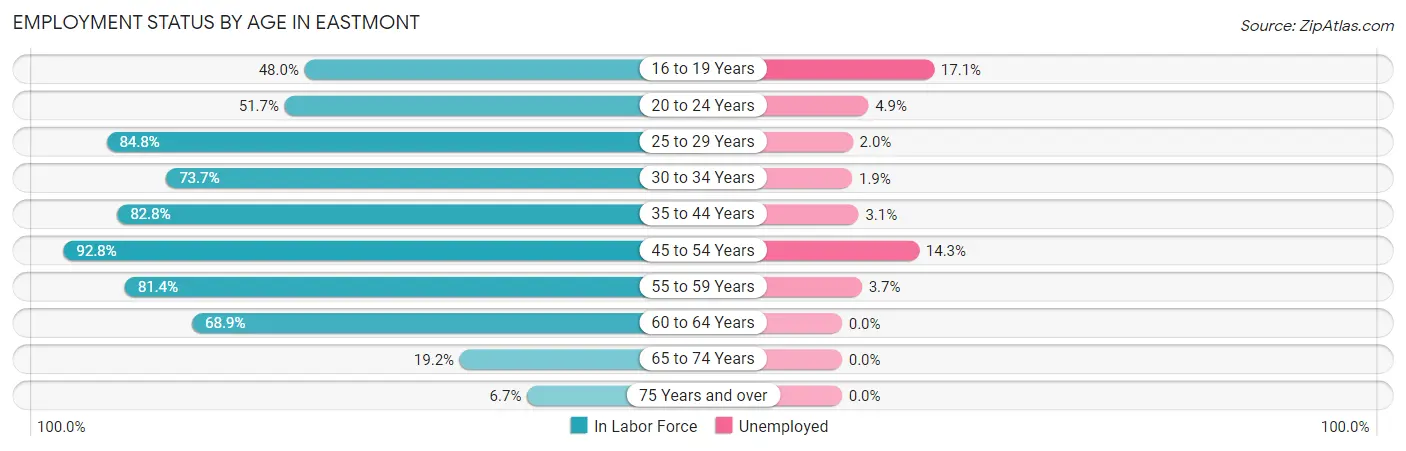
Employment Status by Age in Eastmont
According to the labor force statistics for Eastmont, out of the total population over 16 years of age (18,030), 65.8% or 11,864 individuals are in the labor force, with 5.9% or 700 of them unemployed. The age group with the highest labor force participation rate is 45 to 54 years, with 92.8% or 2,828 individuals in the labor force. Within the labor force, the 16 to 19 years age range has the highest percentage of unemployed individuals, with 17.1% or 76 of them being unemployed.
| Age Bracket | In Labor Force | Unemployed |
| 16 to 19 Years | 445 (48.0%) | 76 (17.1%) |
| 20 to 24 Years | 552 (51.7%) | 27 (4.9%) |
| 25 to 29 Years | 744 (84.8%) | 15 (2.0%) |
| 30 to 34 Years | 1,274 (73.7%) | 24 (1.9%) |
| 35 to 44 Years | 3,224 (82.8%) | 100 (3.1%) |
| 45 to 54 Years | 2,828 (92.8%) | 404 (14.3%) |
| 55 to 59 Years | 1,174 (81.4%) | 43 (3.7%) |
| 60 to 64 Years | 1,120 (68.9%) | 0 (0.0%) |
| 65 to 74 Years | 438 (19.2%) | 0 (0.0%) |
| 75 Years and over | 76 (6.7%) | 0 (0.0%) |
| Total | 11,864 (65.8%) | 700 (5.9%) |
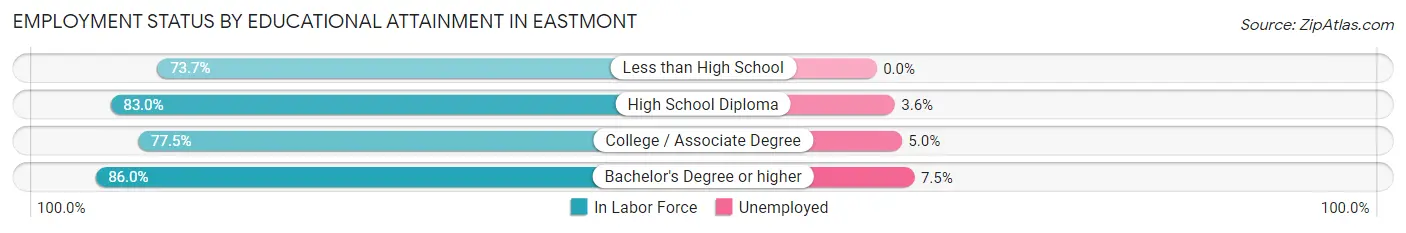
Employment Status by Educational Attainment in Eastmont
According to labor force statistics for Eastmont, 82.1% of individuals (10,356) out of the total population between 25 and 64 years of age (12,614) are in the labor force, with 5.7% or 590 of them being unemployed. The group with the highest labor force participation rate are those with the educational attainment of bachelor's degree or higher, with 86.0% or 4,598 individuals in the labor force. Within the labor force, individuals with bachelor's degree or higher education have the highest percentage of unemployment, with 7.5% or 345 of them being unemployed.
| Educational Attainment | In Labor Force | Unemployed |
| Less than High School | 207 (73.7%) | 0 (0.0%) |
| High School Diploma | 2,055 (83.0%) | 89 (3.6%) |
| College / Associate Degree | 3,495 (77.5%) | 226 (5.0%) |
| Bachelor's Degree or higher | 4,598 (86.0%) | 401 (7.5%) |
| Total | 10,356 (82.1%) | 719 (5.7%) |
Employment Occupations by Sex in Eastmont
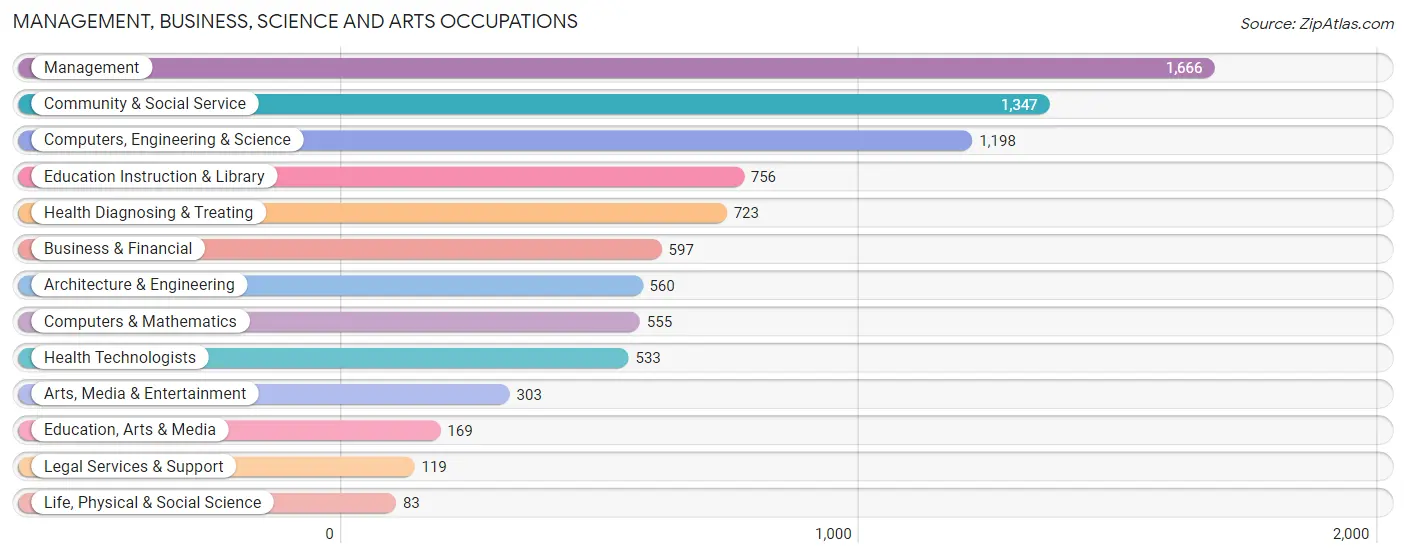
Management, Business, Science and Arts Occupations
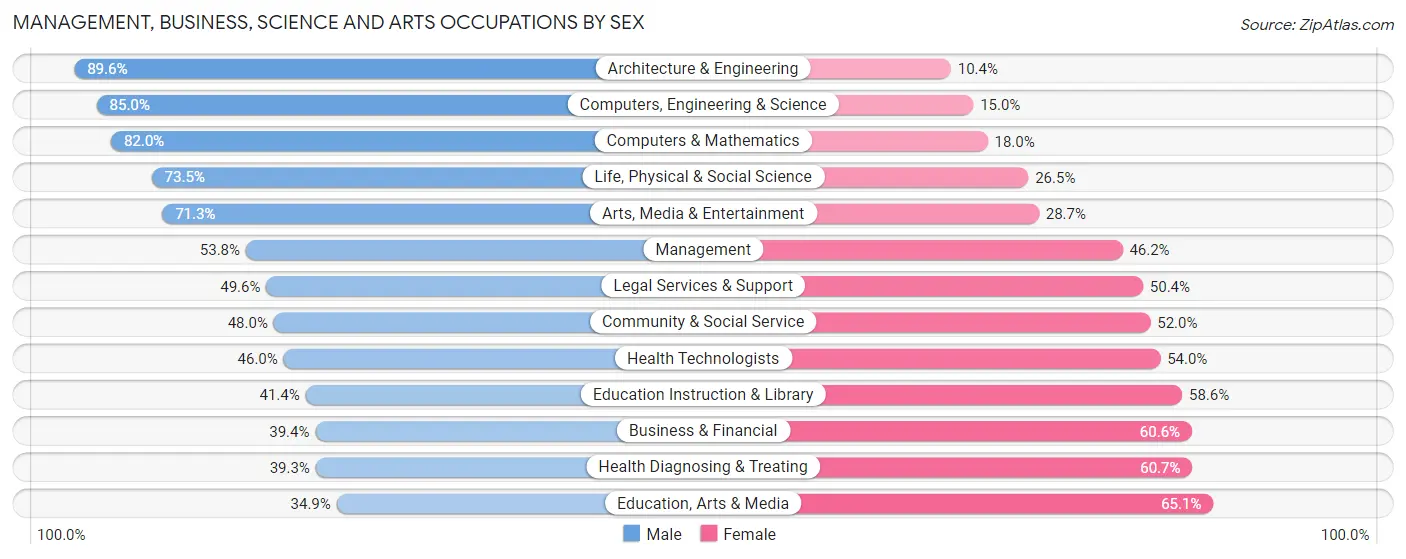
The most common Management, Business, Science and Arts occupations in Eastmont are Management (1,666 | 15.1%), Community & Social Service (1,347 | 12.2%), Computers, Engineering & Science (1,198 | 10.9%), Education Instruction & Library (756 | 6.9%), and Health Diagnosing & Treating (723 | 6.6%).
Management, Business, Science and Arts Occupations by Sex
Within the Management, Business, Science and Arts occupations in Eastmont, the most male-oriented occupations are Architecture & Engineering (89.6%), Computers, Engineering & Science (85.0%), and Computers & Mathematics (82.0%), while the most female-oriented occupations are Education, Arts & Media (65.1%), Health Diagnosing & Treating (60.7%), and Business & Financial (60.6%).
| Occupation | Male | Female |
| Management | 897 (53.8%) | 769 (46.2%) |
| Business & Financial | 235 (39.4%) | 362 (60.6%) |
| Computers, Engineering & Science | 1,018 (85.0%) | 180 (15.0%) |
| Computers & Mathematics | 455 (82.0%) | 100 (18.0%) |
| Architecture & Engineering | 502 (89.6%) | 58 (10.4%) |
| Life, Physical & Social Science | 61 (73.5%) | 22 (26.5%) |
| Community & Social Service | 647 (48.0%) | 700 (52.0%) |
| Education, Arts & Media | 59 (34.9%) | 110 (65.1%) |
| Legal Services & Support | 59 (49.6%) | 60 (50.4%) |
| Education Instruction & Library | 313 (41.4%) | 443 (58.6%) |
| Arts, Media & Entertainment | 216 (71.3%) | 87 (28.7%) |
| Health Diagnosing & Treating | 284 (39.3%) | 439 (60.7%) |
| Health Technologists | 245 (46.0%) | 288 (54.0%) |
| Total (Category) | 3,081 (55.7%) | 2,450 (44.3%) |
| Total (Overall) | 6,469 (58.7%) | 4,544 (41.3%) |
Services Occupations
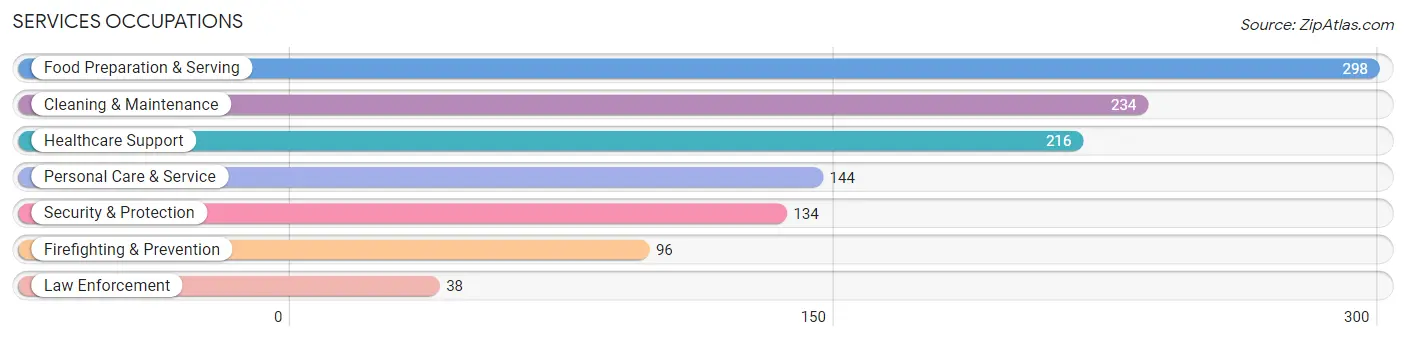
The most common Services occupations in Eastmont are Food Preparation & Serving (298 | 2.7%), Cleaning & Maintenance (234 | 2.1%), Healthcare Support (216 | 2.0%), Personal Care & Service (144 | 1.3%), and Security & Protection (134 | 1.2%).
Services Occupations by Sex
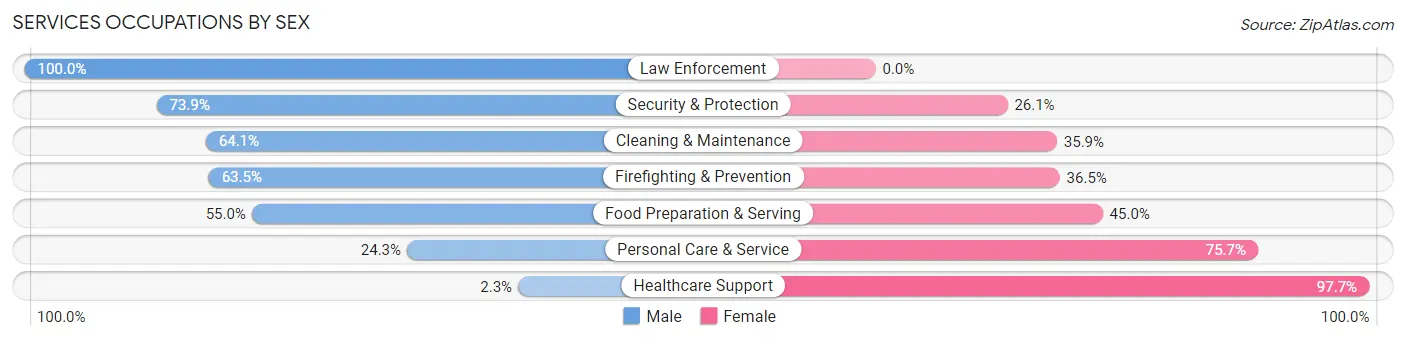
Within the Services occupations in Eastmont, the most male-oriented occupations are Law Enforcement (100.0%), Security & Protection (73.9%), and Cleaning & Maintenance (64.1%), while the most female-oriented occupations are Healthcare Support (97.7%), Personal Care & Service (75.7%), and Food Preparation & Serving (45.0%).
| Occupation | Male | Female |
| Healthcare Support | 5 (2.3%) | 211 (97.7%) |
| Security & Protection | 99 (73.9%) | 35 (26.1%) |
| Firefighting & Prevention | 61 (63.5%) | 35 (36.5%) |
| Law Enforcement | 38 (100.0%) | 0 (0.0%) |
| Food Preparation & Serving | 164 (55.0%) | 134 (45.0%) |
| Cleaning & Maintenance | 150 (64.1%) | 84 (35.9%) |
| Personal Care & Service | 35 (24.3%) | 109 (75.7%) |
| Total (Category) | 453 (44.2%) | 573 (55.8%) |
| Total (Overall) | 6,469 (58.7%) | 4,544 (41.3%) |
Sales and Office Occupations
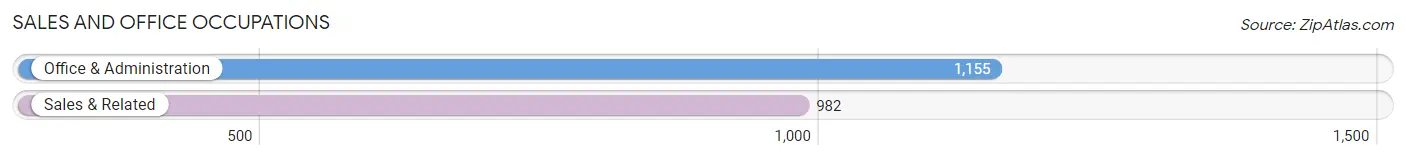
The most common Sales and Office occupations in Eastmont are Office & Administration (1,155 | 10.5%), and Sales & Related (982 | 8.9%).
Sales and Office Occupations by Sex
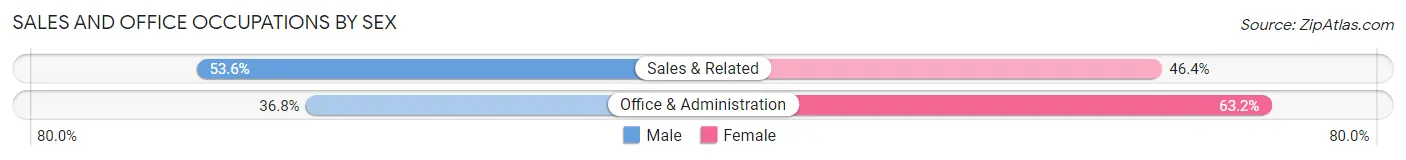
| Occupation | Male | Female |
| Sales & Related | 526 (53.6%) | 456 (46.4%) |
| Office & Administration | 425 (36.8%) | 730 (63.2%) |
| Total (Category) | 951 (44.5%) | 1,186 (55.5%) |
| Total (Overall) | 6,469 (58.7%) | 4,544 (41.3%) |
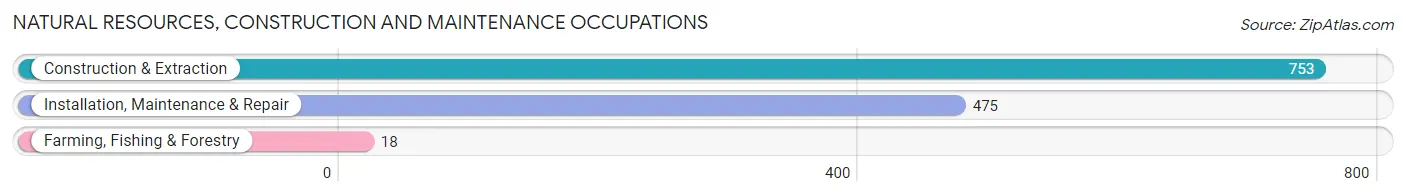
Natural Resources, Construction and Maintenance Occupations
The most common Natural Resources, Construction and Maintenance occupations in Eastmont are Construction & Extraction (753 | 6.8%), Installation, Maintenance & Repair (475 | 4.3%), and Farming, Fishing & Forestry (18 | 0.2%).
Natural Resources, Construction and Maintenance Occupations by Sex
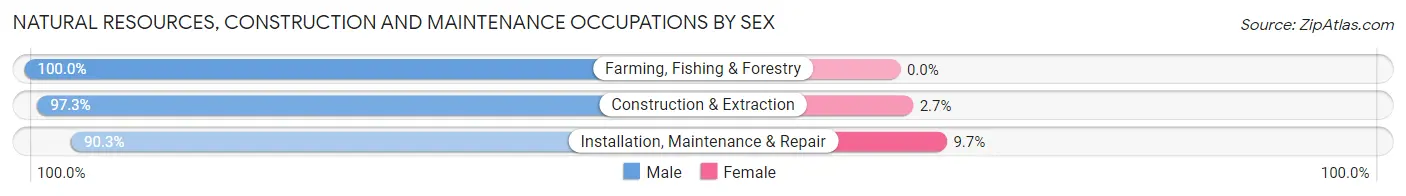
| Occupation | Male | Female |
| Farming, Fishing & Forestry | 18 (100.0%) | 0 (0.0%) |
| Construction & Extraction | 733 (97.3%) | 20 (2.7%) |
| Installation, Maintenance & Repair | 429 (90.3%) | 46 (9.7%) |
| Total (Category) | 1,180 (94.7%) | 66 (5.3%) |
| Total (Overall) | 6,469 (58.7%) | 4,544 (41.3%) |
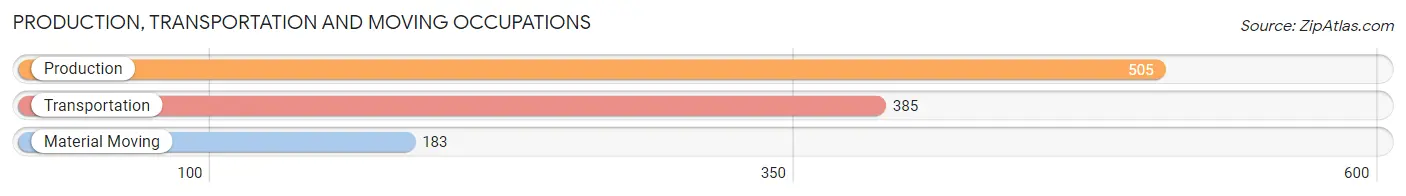
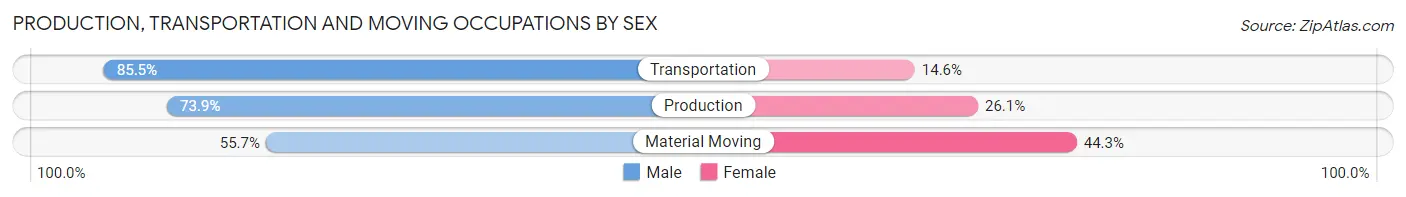
Production, Transportation and Moving Occupations
The most common Production, Transportation and Moving occupations in Eastmont are Production (505 | 4.6%), Transportation (385 | 3.5%), and Material Moving (183 | 1.7%).
Production, Transportation and Moving Occupations by Sex
| Occupation | Male | Female |
| Production | 373 (73.9%) | 132 (26.1%) |
| Transportation | 329 (85.5%) | 56 (14.5%) |
| Material Moving | 102 (55.7%) | 81 (44.3%) |
| Total (Category) | 804 (74.9%) | 269 (25.1%) |
| Total (Overall) | 6,469 (58.7%) | 4,544 (41.3%) |
Employment Industries by Sex in Eastmont
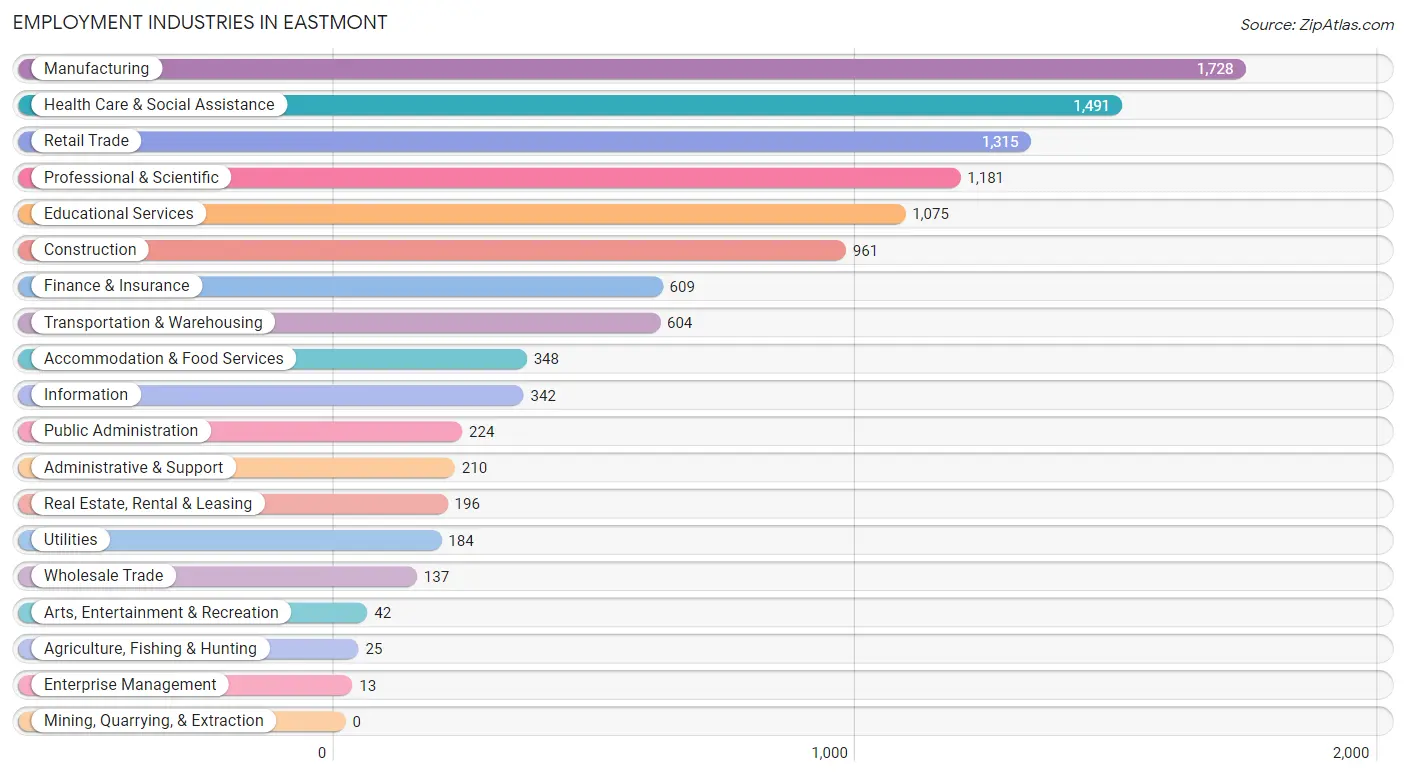
Employment Industries in Eastmont
The major employment industries in Eastmont include Manufacturing (1,728 | 15.7%), Health Care & Social Assistance (1,491 | 13.5%), Retail Trade (1,315 | 11.9%), Professional & Scientific (1,181 | 10.7%), and Educational Services (1,075 | 9.8%).
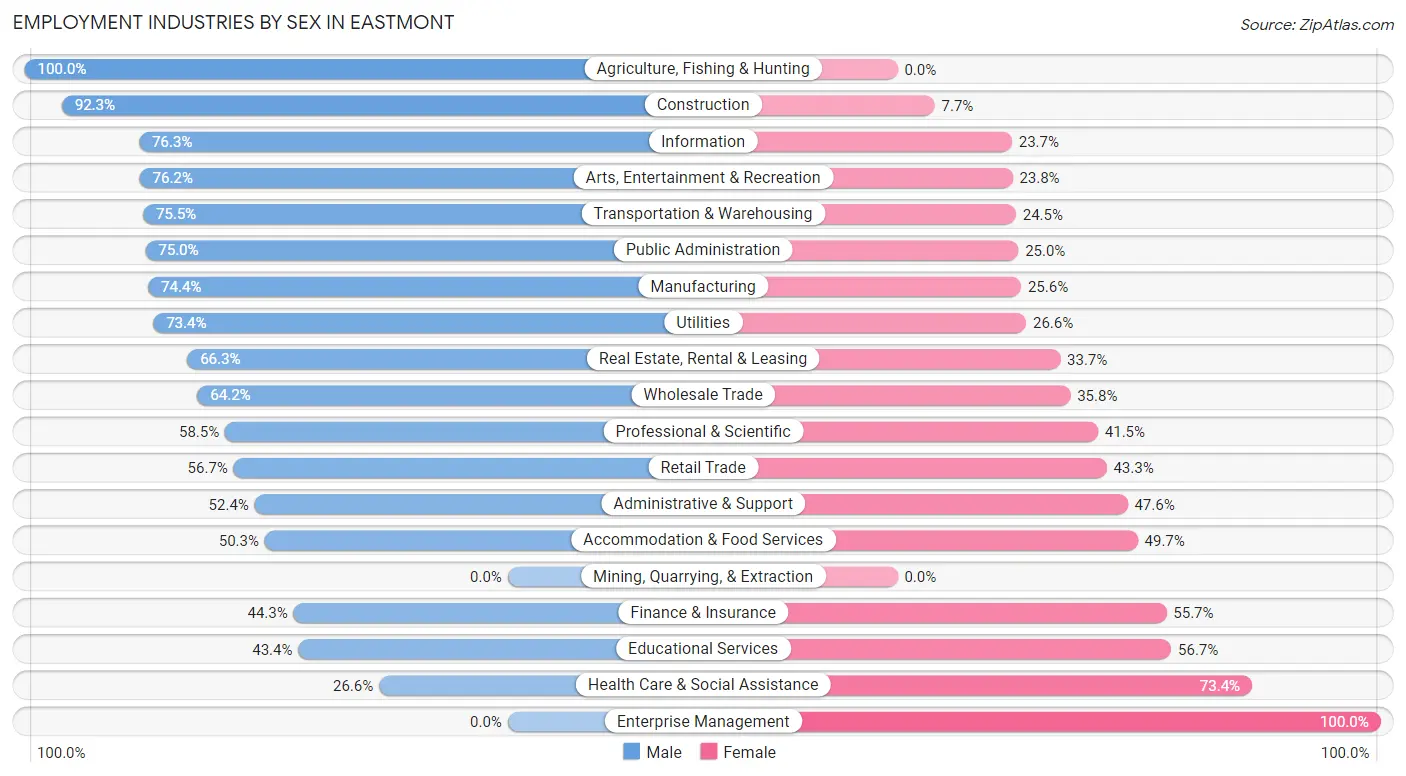
Employment Industries by Sex in Eastmont
The Eastmont industries that see more men than women are Agriculture, Fishing & Hunting (100.0%), Construction (92.3%), and Information (76.3%), whereas the industries that tend to have a higher number of women are Enterprise Management (100.0%), Health Care & Social Assistance (73.4%), and Educational Services (56.7%).
| Industry | Male | Female |
| Agriculture, Fishing & Hunting | 25 (100.0%) | 0 (0.0%) |
| Mining, Quarrying, & Extraction | 0 (0.0%) | 0 (0.0%) |
| Construction | 887 (92.3%) | 74 (7.7%) |
| Manufacturing | 1,286 (74.4%) | 442 (25.6%) |
| Wholesale Trade | 88 (64.2%) | 49 (35.8%) |
| Retail Trade | 746 (56.7%) | 569 (43.3%) |
| Transportation & Warehousing | 456 (75.5%) | 148 (24.5%) |
| Utilities | 135 (73.4%) | 49 (26.6%) |
| Information | 261 (76.3%) | 81 (23.7%) |
| Finance & Insurance | 270 (44.3%) | 339 (55.7%) |
| Real Estate, Rental & Leasing | 130 (66.3%) | 66 (33.7%) |
| Professional & Scientific | 691 (58.5%) | 490 (41.5%) |
| Enterprise Management | 0 (0.0%) | 13 (100.0%) |
| Administrative & Support | 110 (52.4%) | 100 (47.6%) |
| Educational Services | 466 (43.3%) | 609 (56.7%) |
| Health Care & Social Assistance | 397 (26.6%) | 1,094 (73.4%) |
| Arts, Entertainment & Recreation | 32 (76.2%) | 10 (23.8%) |
| Accommodation & Food Services | 175 (50.3%) | 173 (49.7%) |
| Public Administration | 168 (75.0%) | 56 (25.0%) |
| Total | 6,469 (58.7%) | 4,544 (41.3%) |
Education in Eastmont
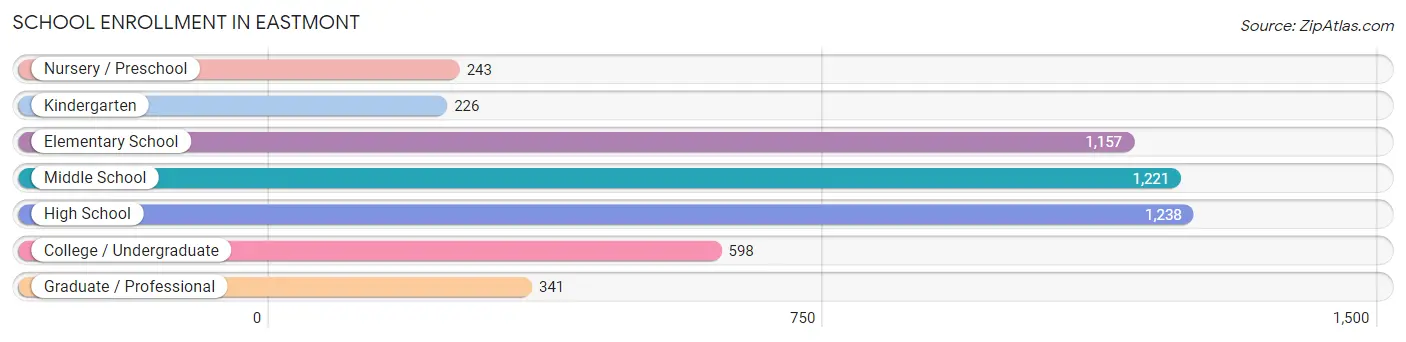
School Enrollment in Eastmont
The most common levels of schooling among the 5,024 students in Eastmont are high school (1,238 | 24.6%), middle school (1,221 | 24.3%), and elementary school (1,157 | 23.0%).
| School Level | # Students | % Students |
| Nursery / Preschool | 243 | 4.8% |
| Kindergarten | 226 | 4.5% |
| Elementary School | 1,157 | 23.0% |
| Middle School | 1,221 | 24.3% |
| High School | 1,238 | 24.6% |
| College / Undergraduate | 598 | 11.9% |
| Graduate / Professional | 341 | 6.8% |
| Total | 5,024 | 100.0% |
School Enrollment by Age by Funding Source in Eastmont
Out of a total of 5,024 students who are enrolled in schools in Eastmont, 844 (16.8%) attend a private institution, while the remaining 4,180 (83.2%) are enrolled in public schools. The age group of 3 to 4 year olds has the highest likelihood of being enrolled in private schools, with 149 (80.1% in the age bracket) enrolled. Conversely, the age group of 18 to 19 year olds has the lowest likelihood of being enrolled in a private school, with 369 (100.0% in the age bracket) attending a public institution.
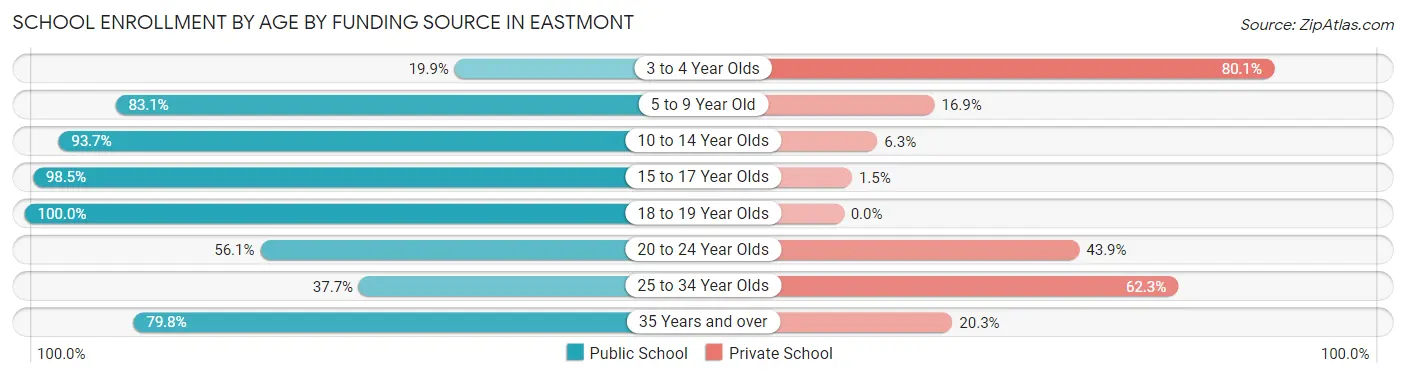
| Age Bracket | Public School | Private School |
| 3 to 4 Year Olds | 37 (19.9%) | 149 (80.1%) |
| 5 to 9 Year Old | 1,016 (83.1%) | 207 (16.9%) |
| 10 to 14 Year Olds | 1,567 (93.7%) | 105 (6.3%) |
| 15 to 17 Year Olds | 704 (98.5%) | 11 (1.5%) |
| 18 to 19 Year Olds | 369 (100.0%) | 0 (0.0%) |
| 20 to 24 Year Olds | 193 (56.1%) | 151 (43.9%) |
| 25 to 34 Year Olds | 103 (37.7%) | 170 (62.3%) |
| 35 Years and over | 193 (79.7%) | 49 (20.3%) |
| Total | 4,180 (83.2%) | 844 (16.8%) |
Educational Attainment by Field of Study in Eastmont
Business (1,230 | 17.7%), engineering (931 | 13.4%), education (778 | 11.2%), science & technology (704 | 10.1%), and computers & mathematics (453 | 6.5%) are the most common fields of study among 6,959 individuals in Eastmont who have obtained a bachelor's degree or higher.
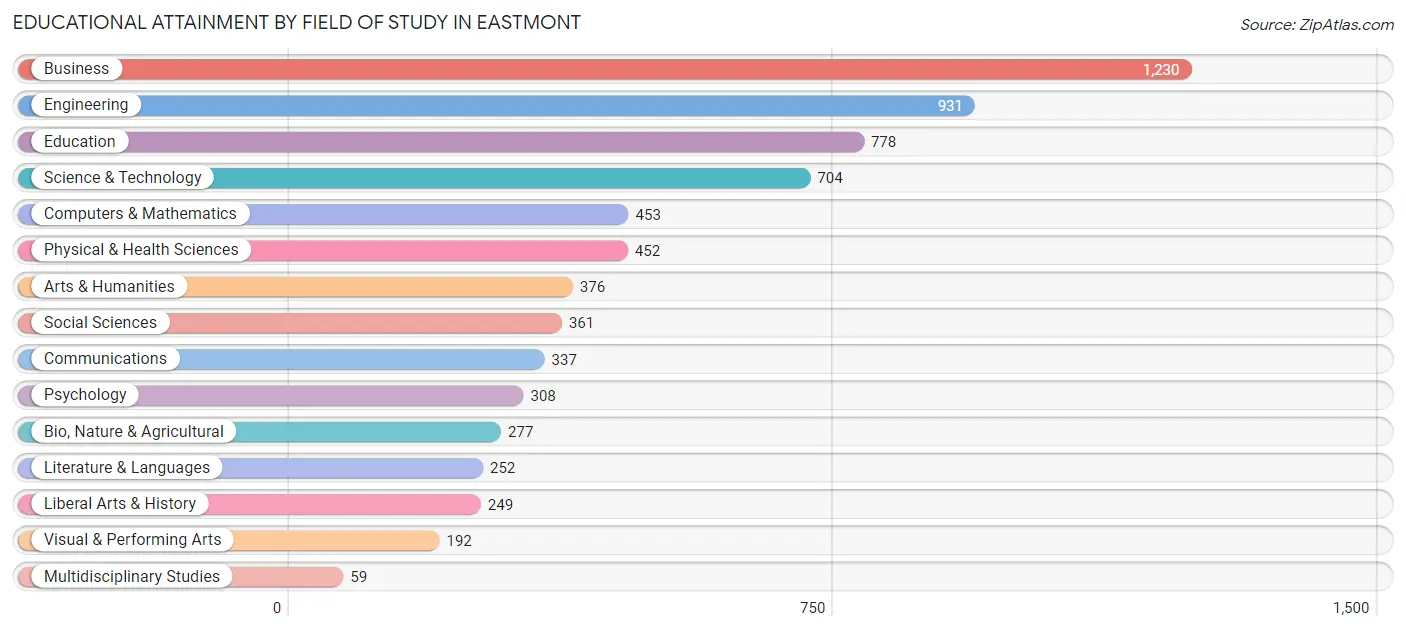
| Field of Study | # Graduates | % Graduates |
| Computers & Mathematics | 453 | 6.5% |
| Bio, Nature & Agricultural | 277 | 4.0% |
| Physical & Health Sciences | 452 | 6.5% |
| Psychology | 308 | 4.4% |
| Social Sciences | 361 | 5.2% |
| Engineering | 931 | 13.4% |
| Multidisciplinary Studies | 59 | 0.9% |
| Science & Technology | 704 | 10.1% |
| Business | 1,230 | 17.7% |
| Education | 778 | 11.2% |
| Literature & Languages | 252 | 3.6% |
| Liberal Arts & History | 249 | 3.6% |
| Visual & Performing Arts | 192 | 2.8% |
| Communications | 337 | 4.8% |
| Arts & Humanities | 376 | 5.4% |
| Total | 6,959 | 100.0% |
Transportation & Commute in Eastmont
Vehicle Availability by Sex in Eastmont
The most prevalent vehicle ownership categories in Eastmont are males with 3 vehicles (2,338, accounting for 36.6%) and females with 3 vehicles (1,366, making up 52.2%).
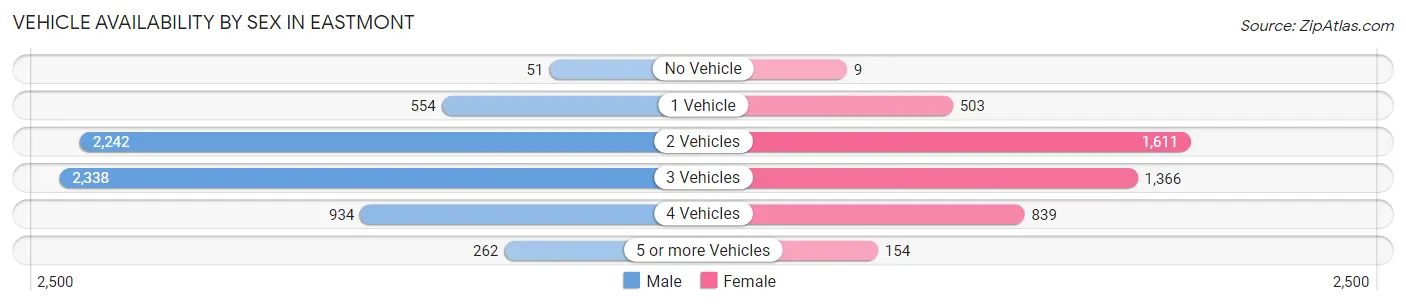
| Vehicles Available | Male | Female |
| No Vehicle | 51 (0.8%) | 9 (0.2%) |
| 1 Vehicle | 554 (8.7%) | 503 (11.2%) |
| 2 Vehicles | 2,242 (35.1%) | 1,611 (35.9%) |
| 3 Vehicles | 2,338 (36.6%) | 1,366 (30.5%) |
| 4 Vehicles | 934 (14.6%) | 839 (18.7%) |
| 5 or more Vehicles | 262 (4.1%) | 154 (3.4%) |
| Total | 6,381 (100.0%) | 4,482 (100.0%) |
Commute Time in Eastmont
The most frequently occuring commute durations in Eastmont are 15 to 19 minutes (1,727 commuters, 18.9%), 30 to 34 minutes (1,422 commuters, 15.6%), and 20 to 24 minutes (1,396 commuters, 15.3%).
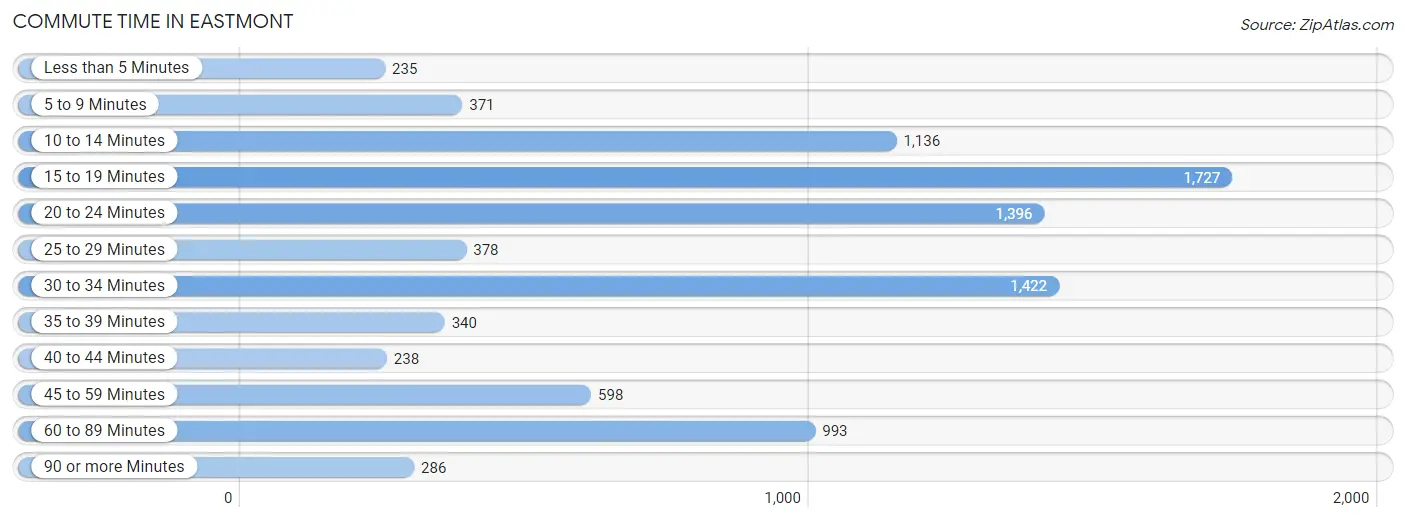
| Commute Time | # Commuters | % Commuters |
| Less than 5 Minutes | 235 | 2.6% |
| 5 to 9 Minutes | 371 | 4.1% |
| 10 to 14 Minutes | 1,136 | 12.5% |
| 15 to 19 Minutes | 1,727 | 18.9% |
| 20 to 24 Minutes | 1,396 | 15.3% |
| 25 to 29 Minutes | 378 | 4.1% |
| 30 to 34 Minutes | 1,422 | 15.6% |
| 35 to 39 Minutes | 340 | 3.7% |
| 40 to 44 Minutes | 238 | 2.6% |
| 45 to 59 Minutes | 598 | 6.6% |
| 60 to 89 Minutes | 993 | 10.9% |
| 90 or more Minutes | 286 | 3.1% |
Commute Time by Sex in Eastmont
The most common commute times in Eastmont are 15 to 19 minutes (1,049 commuters, 19.4%) for males and 15 to 19 minutes (678 commuters, 18.2%) for females.
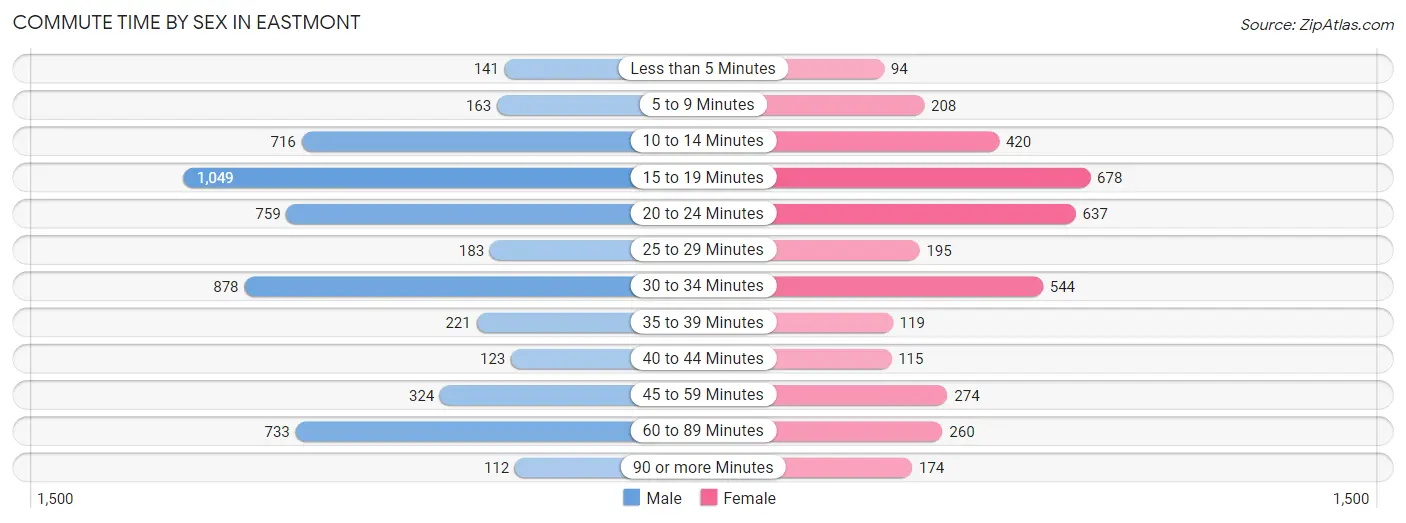
| Commute Time | Male | Female |
| Less than 5 Minutes | 141 (2.6%) | 94 (2.5%) |
| 5 to 9 Minutes | 163 (3.0%) | 208 (5.6%) |
| 10 to 14 Minutes | 716 (13.3%) | 420 (11.3%) |
| 15 to 19 Minutes | 1,049 (19.4%) | 678 (18.2%) |
| 20 to 24 Minutes | 759 (14.1%) | 637 (17.1%) |
| 25 to 29 Minutes | 183 (3.4%) | 195 (5.2%) |
| 30 to 34 Minutes | 878 (16.3%) | 544 (14.6%) |
| 35 to 39 Minutes | 221 (4.1%) | 119 (3.2%) |
| 40 to 44 Minutes | 123 (2.3%) | 115 (3.1%) |
| 45 to 59 Minutes | 324 (6.0%) | 274 (7.4%) |
| 60 to 89 Minutes | 733 (13.6%) | 260 (7.0%) |
| 90 or more Minutes | 112 (2.1%) | 174 (4.7%) |
Time of Departure to Work by Sex in Eastmont
The most frequent times of departure to work in Eastmont are 6:00 AM to 6:29 AM (723, 13.4%) for males and 7:00 AM to 7:29 AM (624, 16.8%) for females.
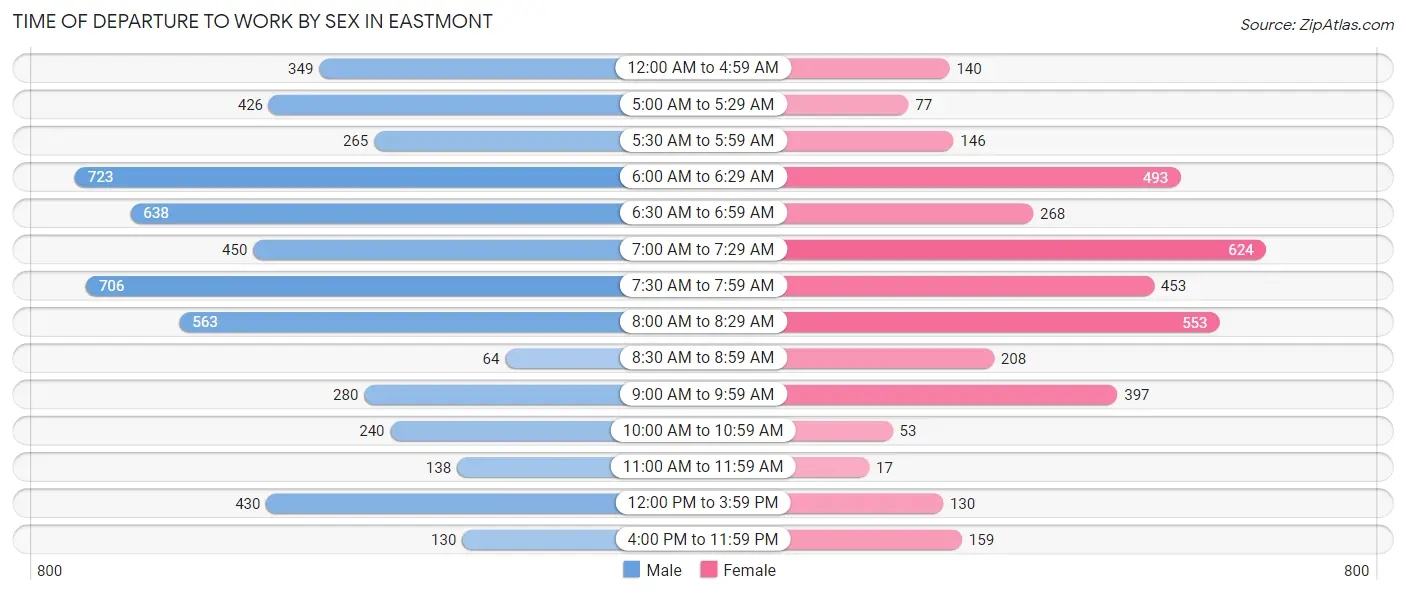
| Time of Departure | Male | Female |
| 12:00 AM to 4:59 AM | 349 (6.5%) | 140 (3.8%) |
| 5:00 AM to 5:29 AM | 426 (7.9%) | 77 (2.1%) |
| 5:30 AM to 5:59 AM | 265 (4.9%) | 146 (3.9%) |
| 6:00 AM to 6:29 AM | 723 (13.4%) | 493 (13.3%) |
| 6:30 AM to 6:59 AM | 638 (11.8%) | 268 (7.2%) |
| 7:00 AM to 7:29 AM | 450 (8.3%) | 624 (16.8%) |
| 7:30 AM to 7:59 AM | 706 (13.1%) | 453 (12.2%) |
| 8:00 AM to 8:29 AM | 563 (10.4%) | 553 (14.9%) |
| 8:30 AM to 8:59 AM | 64 (1.2%) | 208 (5.6%) |
| 9:00 AM to 9:59 AM | 280 (5.2%) | 397 (10.7%) |
| 10:00 AM to 10:59 AM | 240 (4.4%) | 53 (1.4%) |
| 11:00 AM to 11:59 AM | 138 (2.5%) | 17 (0.5%) |
| 12:00 PM to 3:59 PM | 430 (8.0%) | 130 (3.5%) |
| 4:00 PM to 11:59 PM | 130 (2.4%) | 159 (4.3%) |
| Total | 5,402 (100.0%) | 3,718 (100.0%) |
Housing Occupancy in Eastmont
Occupancy by Ownership in Eastmont
Of the total 7,897 dwellings in Eastmont, owner-occupied units account for 6,842 (86.6%), while renter-occupied units make up 1,055 (13.4%).
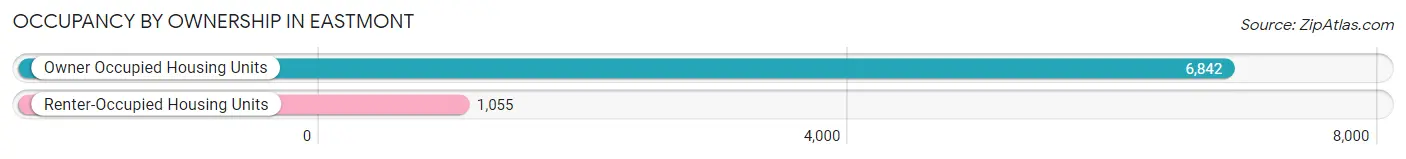
| Occupancy | # Housing Units | % Housing Units |
| Owner Occupied Housing Units | 6,842 | 86.6% |
| Renter-Occupied Housing Units | 1,055 | 13.4% |
| Total Occupied Housing Units | 7,897 | 100.0% |
Occupancy by Household Size in Eastmont
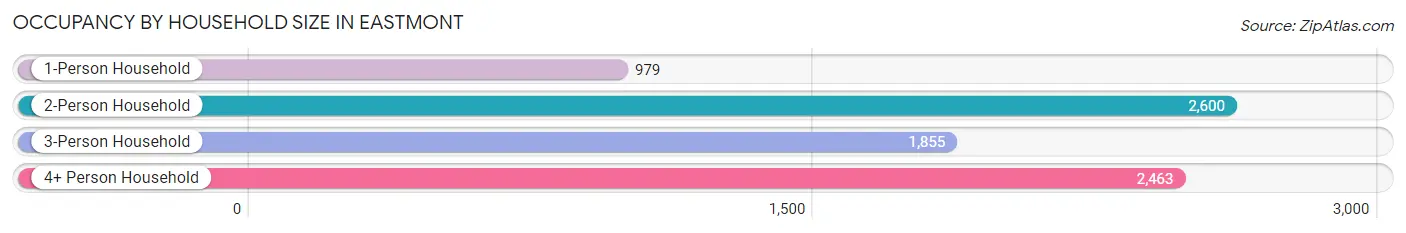
| Household Size | # Housing Units | % Housing Units |
| 1-Person Household | 979 | 12.4% |
| 2-Person Household | 2,600 | 32.9% |
| 3-Person Household | 1,855 | 23.5% |
| 4+ Person Household | 2,463 | 31.2% |
| Total Housing Units | 7,897 | 100.0% |
Occupancy by Ownership by Household Size in Eastmont
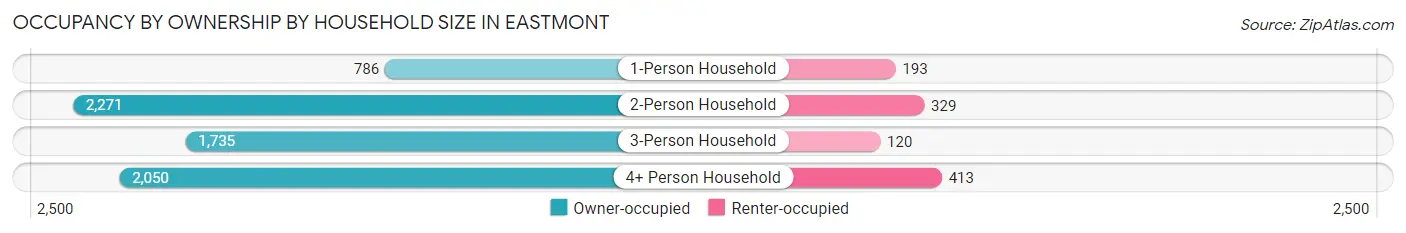
| Household Size | Owner-occupied | Renter-occupied |
| 1-Person Household | 786 (80.3%) | 193 (19.7%) |
| 2-Person Household | 2,271 (87.4%) | 329 (12.7%) |
| 3-Person Household | 1,735 (93.5%) | 120 (6.5%) |
| 4+ Person Household | 2,050 (83.2%) | 413 (16.8%) |
| Total Housing Units | 6,842 (86.6%) | 1,055 (13.4%) |
Occupancy by Educational Attainment in Eastmont
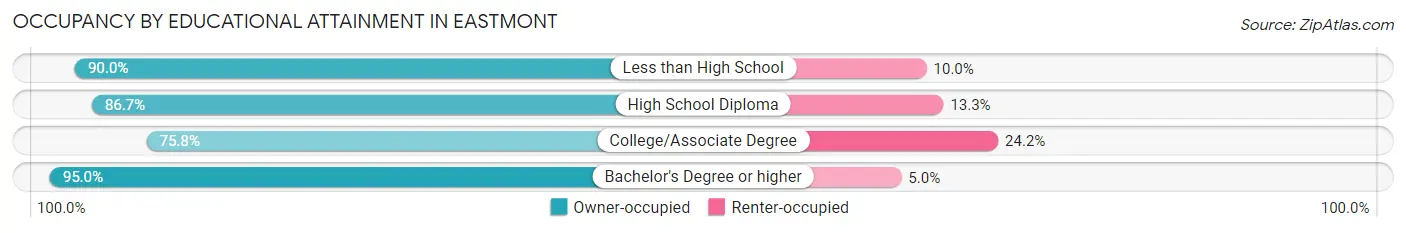
| Household Size | Owner-occupied | Renter-occupied |
| Less than High School | 45 (90.0%) | 5 (10.0%) |
| High School Diploma | 1,351 (86.7%) | 208 (13.3%) |
| College/Associate Degree | 2,084 (75.8%) | 665 (24.2%) |
| Bachelor's Degree or higher | 3,362 (95.0%) | 177 (5.0%) |
Occupancy by Age of Householder in Eastmont
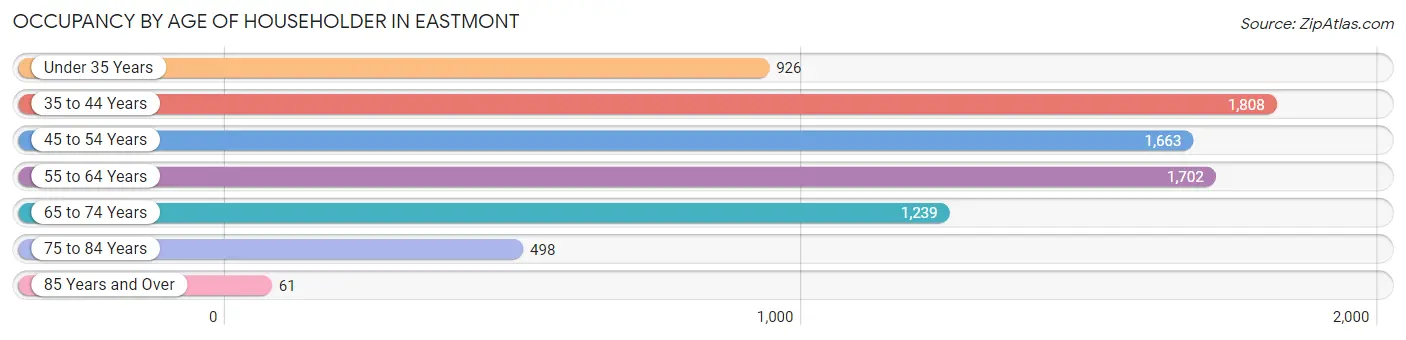
| Age Bracket | # Households | % Households |
| Under 35 Years | 926 | 11.7% |
| 35 to 44 Years | 1,808 | 22.9% |
| 45 to 54 Years | 1,663 | 21.1% |
| 55 to 64 Years | 1,702 | 21.5% |
| 65 to 74 Years | 1,239 | 15.7% |
| 75 to 84 Years | 498 | 6.3% |
| 85 Years and Over | 61 | 0.8% |
| Total | 7,897 | 100.0% |
Housing Finances in Eastmont
Median Income by Occupancy in Eastmont
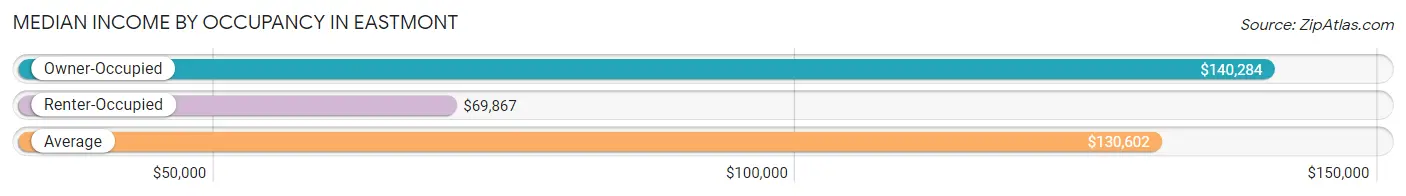
| Occupancy Type | # Households | Median Income |
| Owner-Occupied | 6,842 (86.6%) | $140,284 |
| Renter-Occupied | 1,055 (13.4%) | $69,867 |
| Average | 7,897 (100.0%) | $130,602 |
Occupancy by Householder Income Bracket in Eastmont
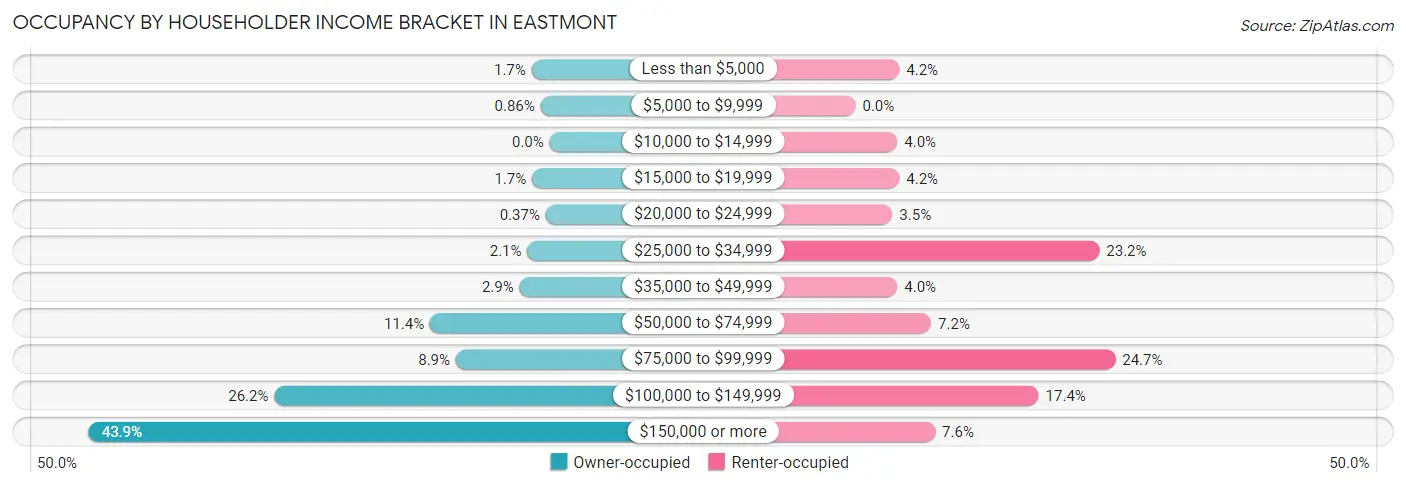
| Income Bracket | Owner-occupied | Renter-occupied |
| Less than $5,000 | 117 (1.7%) | 44 (4.2%) |
| $5,000 to $9,999 | 59 (0.9%) | 0 (0.0%) |
| $10,000 to $14,999 | 0 (0.0%) | 42 (4.0%) |
| $15,000 to $19,999 | 114 (1.7%) | 44 (4.2%) |
| $20,000 to $24,999 | 25 (0.4%) | 37 (3.5%) |
| $25,000 to $34,999 | 145 (2.1%) | 245 (23.2%) |
| $35,000 to $49,999 | 196 (2.9%) | 42 (4.0%) |
| $50,000 to $74,999 | 779 (11.4%) | 76 (7.2%) |
| $75,000 to $99,999 | 611 (8.9%) | 261 (24.7%) |
| $100,000 to $149,999 | 1,794 (26.2%) | 184 (17.4%) |
| $150,000 or more | 3,002 (43.9%) | 80 (7.6%) |
| Total | 6,842 (100.0%) | 1,055 (100.0%) |
Monthly Housing Cost Tiers in Eastmont
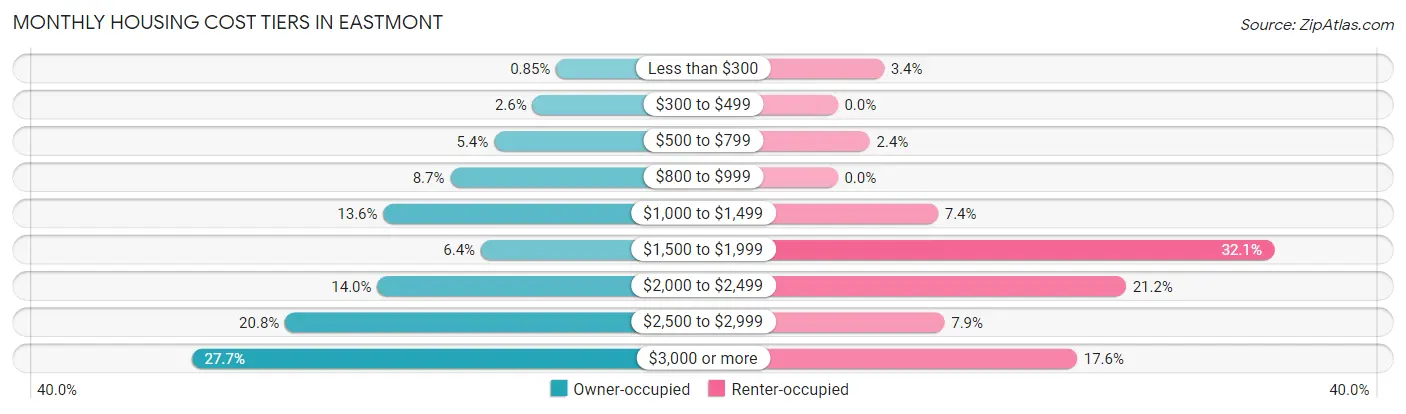
| Monthly Cost | Owner-occupied | Renter-occupied |
| Less than $300 | 58 (0.9%) | 36 (3.4%) |
| $300 to $499 | 177 (2.6%) | 0 (0.0%) |
| $500 to $799 | 371 (5.4%) | 25 (2.4%) |
| $800 to $999 | 592 (8.6%) | 0 (0.0%) |
| $1,000 to $1,499 | 929 (13.6%) | 78 (7.4%) |
| $1,500 to $1,999 | 437 (6.4%) | 339 (32.1%) |
| $2,000 to $2,499 | 959 (14.0%) | 224 (21.2%) |
| $2,500 to $2,999 | 1,424 (20.8%) | 83 (7.9%) |
| $3,000 or more | 1,895 (27.7%) | 186 (17.6%) |
| Total | 6,842 (100.0%) | 1,055 (100.0%) |
Physical Housing Characteristics in Eastmont
Housing Structures in Eastmont
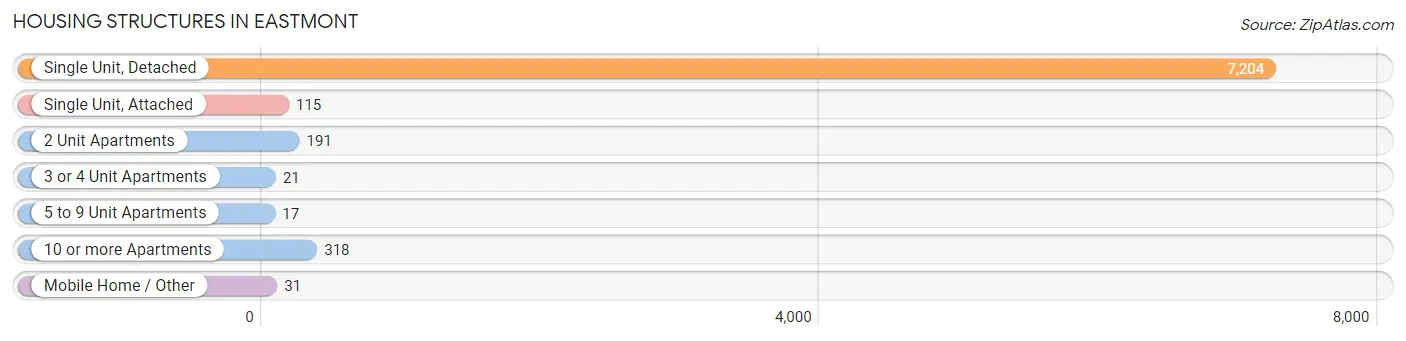
| Structure Type | # Housing Units | % Housing Units |
| Single Unit, Detached | 7,204 | 91.2% |
| Single Unit, Attached | 115 | 1.5% |
| 2 Unit Apartments | 191 | 2.4% |
| 3 or 4 Unit Apartments | 21 | 0.3% |
| 5 to 9 Unit Apartments | 17 | 0.2% |
| 10 or more Apartments | 318 | 4.0% |
| Mobile Home / Other | 31 | 0.4% |
| Total | 7,897 | 100.0% |
Housing Structures by Occupancy in Eastmont
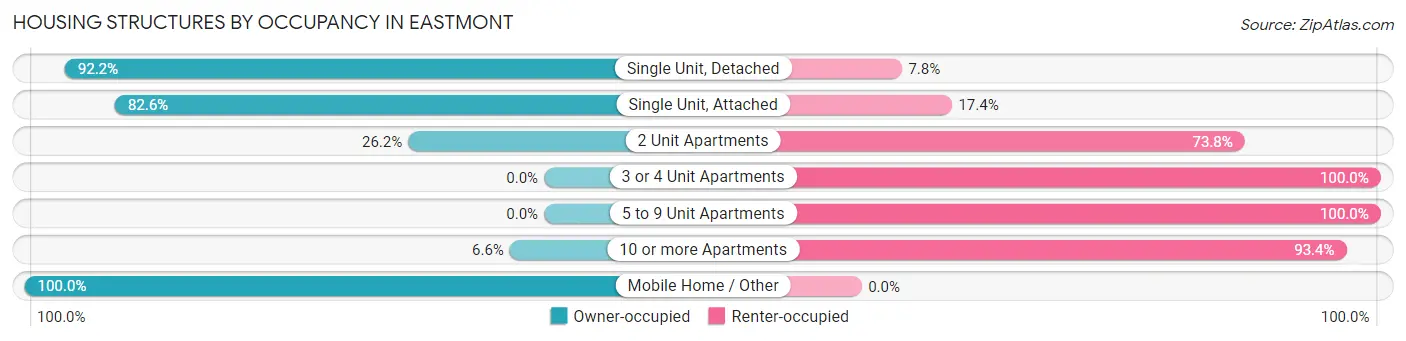
| Structure Type | Owner-occupied | Renter-occupied |
| Single Unit, Detached | 6,645 (92.2%) | 559 (7.8%) |
| Single Unit, Attached | 95 (82.6%) | 20 (17.4%) |
| 2 Unit Apartments | 50 (26.2%) | 141 (73.8%) |
| 3 or 4 Unit Apartments | 0 (0.0%) | 21 (100.0%) |
| 5 to 9 Unit Apartments | 0 (0.0%) | 17 (100.0%) |
| 10 or more Apartments | 21 (6.6%) | 297 (93.4%) |
| Mobile Home / Other | 31 (100.0%) | 0 (0.0%) |
| Total | 6,842 (86.6%) | 1,055 (13.4%) |
Housing Structures by Number of Rooms in Eastmont
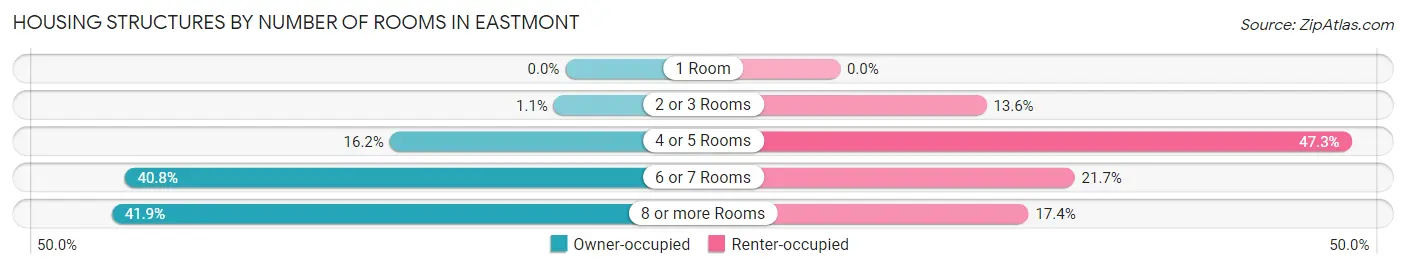
| Number of Rooms | Owner-occupied | Renter-occupied |
| 1 Room | 0 (0.0%) | 0 (0.0%) |
| 2 or 3 Rooms | 73 (1.1%) | 143 (13.6%) |
| 4 or 5 Rooms | 1,111 (16.2%) | 499 (47.3%) |
| 6 or 7 Rooms | 2,789 (40.8%) | 229 (21.7%) |
| 8 or more Rooms | 2,869 (41.9%) | 184 (17.4%) |
| Total | 6,842 (100.0%) | 1,055 (100.0%) |
Housing Structure by Heating Type in Eastmont
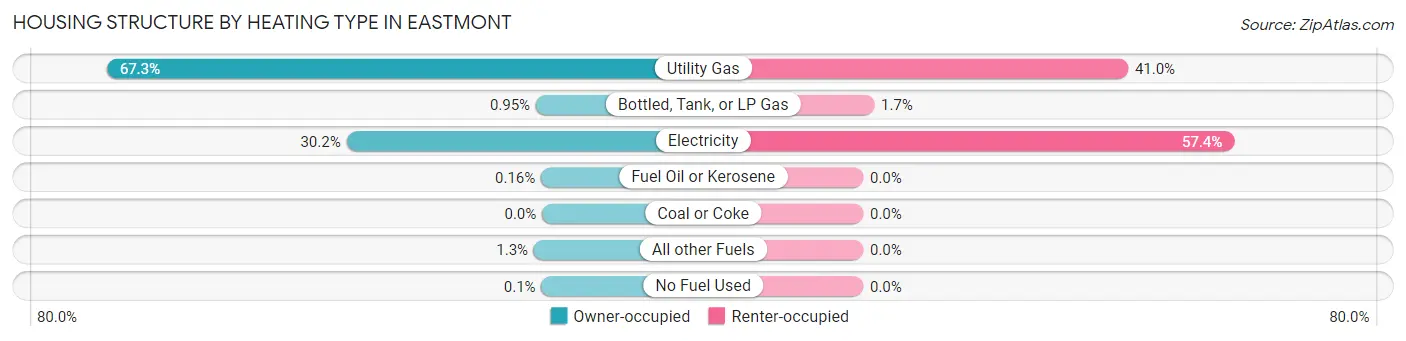
| Heating Type | Owner-occupied | Renter-occupied |
| Utility Gas | 4,604 (67.3%) | 432 (40.9%) |
| Bottled, Tank, or LP Gas | 65 (0.9%) | 18 (1.7%) |
| Electricity | 2,069 (30.2%) | 605 (57.4%) |
| Fuel Oil or Kerosene | 11 (0.2%) | 0 (0.0%) |
| Coal or Coke | 0 (0.0%) | 0 (0.0%) |
| All other Fuels | 86 (1.3%) | 0 (0.0%) |
| No Fuel Used | 7 (0.1%) | 0 (0.0%) |
| Total | 6,842 (100.0%) | 1,055 (100.0%) |
Household Vehicle Usage in Eastmont
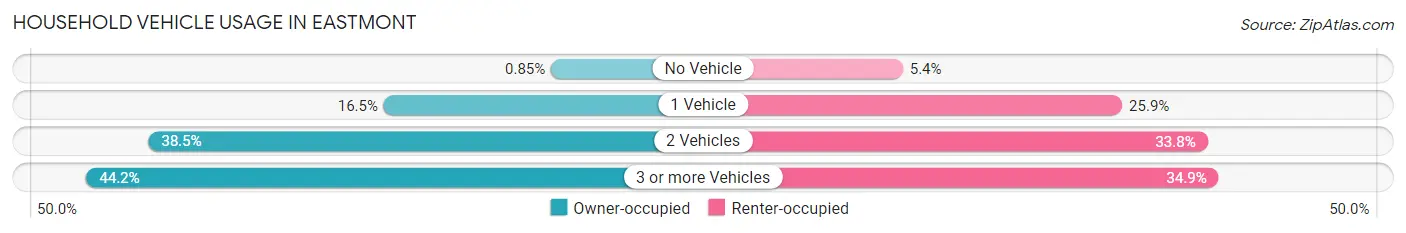
| Vehicles per Household | Owner-occupied | Renter-occupied |
| No Vehicle | 58 (0.9%) | 57 (5.4%) |
| 1 Vehicle | 1,127 (16.5%) | 273 (25.9%) |
| 2 Vehicles | 2,631 (38.5%) | 357 (33.8%) |
| 3 or more Vehicles | 3,026 (44.2%) | 368 (34.9%) |
| Total | 6,842 (100.0%) | 1,055 (100.0%) |
Real Estate & Mortgages in Eastmont
Real Estate and Mortgage Overview in Eastmont
| Characteristic | Without Mortgage | With Mortgage |
| Housing Units | 1,871 | 4,971 |
| Median Property Value | $626,200 | $651,300 |
| Median Household Income | $107,019 | $2,554 |
| Monthly Housing Costs | $939 | $1,895 |
| Real Estate Taxes | $6,041 | $15 |
Property Value by Mortgage Status in Eastmont
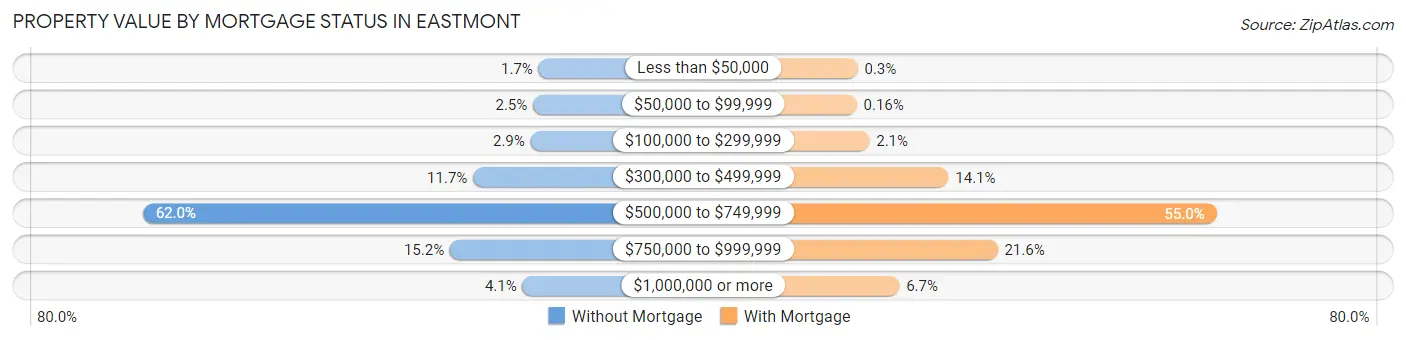
| Property Value | Without Mortgage | With Mortgage |
| Less than $50,000 | 31 (1.7%) | 15 (0.3%) |
| $50,000 to $99,999 | 47 (2.5%) | 8 (0.2%) |
| $100,000 to $299,999 | 54 (2.9%) | 104 (2.1%) |
| $300,000 to $499,999 | 218 (11.7%) | 703 (14.1%) |
| $500,000 to $749,999 | 1,160 (62.0%) | 2,735 (55.0%) |
| $750,000 to $999,999 | 284 (15.2%) | 1,075 (21.6%) |
| $1,000,000 or more | 77 (4.1%) | 331 (6.7%) |
| Total | 1,871 (100.0%) | 4,971 (100.0%) |
Household Income by Mortgage Status in Eastmont
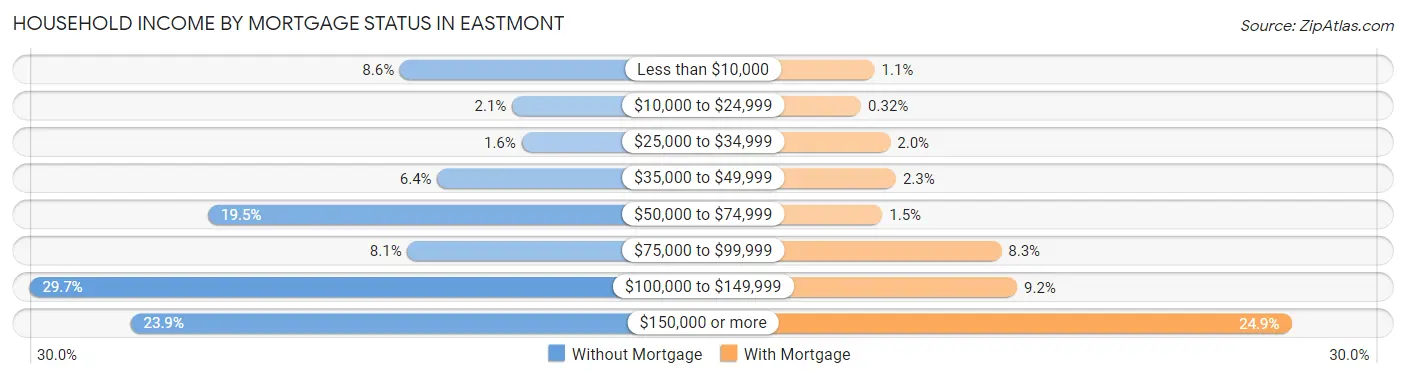
| Household Income | Without Mortgage | With Mortgage |
| Less than $10,000 | 160 (8.6%) | 54 (1.1%) |
| $10,000 to $24,999 | 40 (2.1%) | 16 (0.3%) |
| $25,000 to $34,999 | 30 (1.6%) | 99 (2.0%) |
| $35,000 to $49,999 | 120 (6.4%) | 115 (2.3%) |
| $50,000 to $74,999 | 365 (19.5%) | 76 (1.5%) |
| $75,000 to $99,999 | 152 (8.1%) | 414 (8.3%) |
| $100,000 to $149,999 | 556 (29.7%) | 459 (9.2%) |
| $150,000 or more | 448 (23.9%) | 1,238 (24.9%) |
| Total | 1,871 (100.0%) | 4,971 (100.0%) |
Property Value to Household Income Ratio in Eastmont
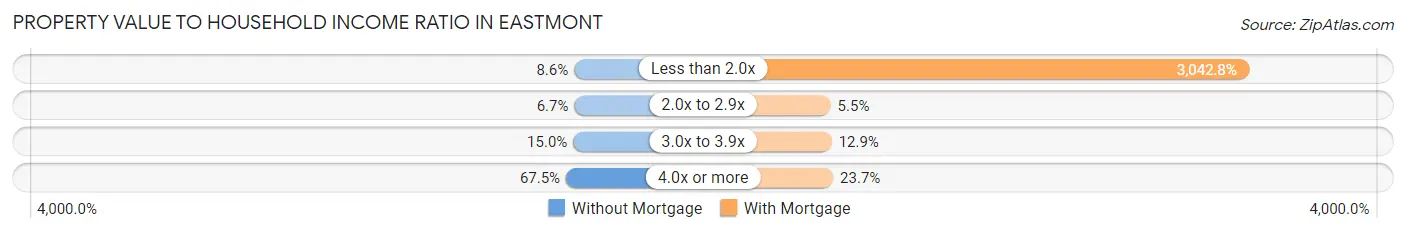
| Value-to-Income Ratio | Without Mortgage | With Mortgage |
| Less than 2.0x | 161 (8.6%) | 151,259 (3,042.8%) |
| 2.0x to 2.9x | 126 (6.7%) | 275 (5.5%) |
| 3.0x to 3.9x | 280 (15.0%) | 639 (12.9%) |
| 4.0x or more | 1,262 (67.4%) | 1,177 (23.7%) |
| Total | 1,871 (100.0%) | 4,971 (100.0%) |
Real Estate Taxes by Mortgage Status in Eastmont
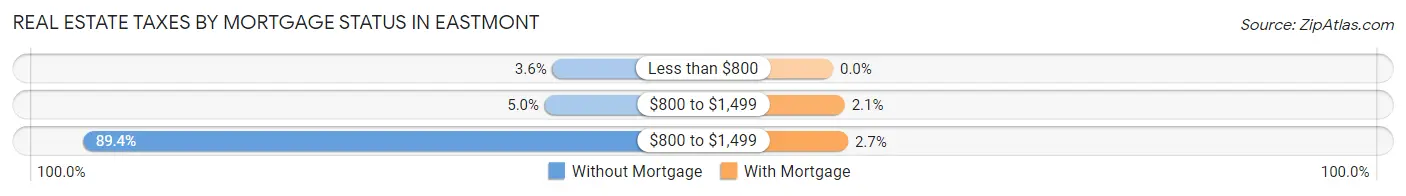
| Property Taxes | Without Mortgage | With Mortgage |
| Less than $800 | 67 (3.6%) | 0 (0.0%) |
| $800 to $1,499 | 93 (5.0%) | 106 (2.1%) |
| $800 to $1,499 | 1,672 (89.4%) | 135 (2.7%) |
| Total | 1,871 (100.0%) | 4,971 (100.0%) |
Health & Disability in Eastmont
Health Insurance Coverage by Age in Eastmont
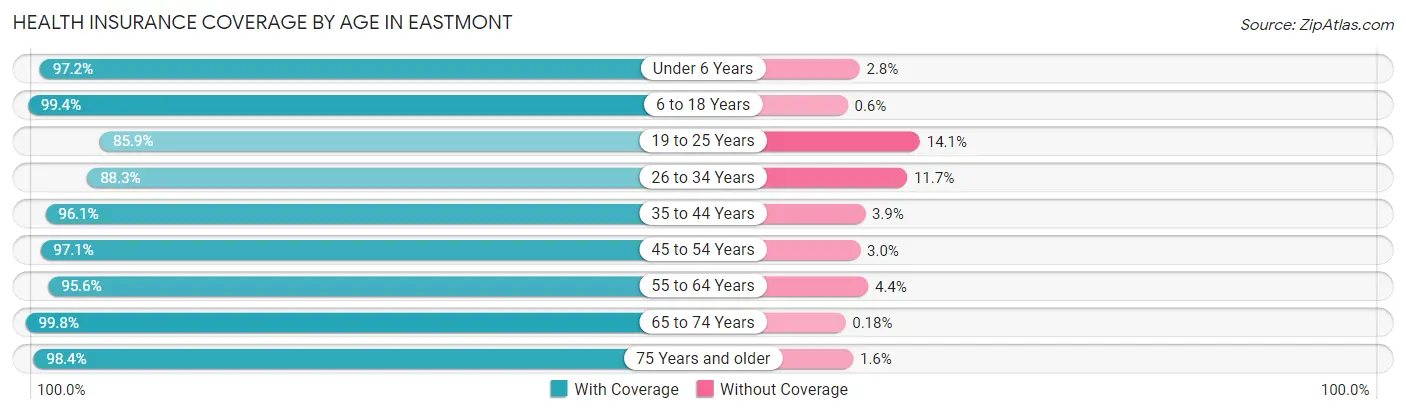
| Age Bracket | With Coverage | Without Coverage |
| Under 6 Years | 1,743 (97.2%) | 51 (2.8%) |
| 6 to 18 Years | 4,124 (99.4%) | 25 (0.6%) |
| 19 to 25 Years | 1,098 (85.9%) | 180 (14.1%) |
| 26 to 34 Years | 2,154 (88.3%) | 285 (11.7%) |
| 35 to 44 Years | 3,658 (96.1%) | 147 (3.9%) |
| 45 to 54 Years | 2,957 (97.1%) | 90 (2.9%) |
| 55 to 64 Years | 2,931 (95.6%) | 136 (4.4%) |
| 65 to 74 Years | 2,276 (99.8%) | 4 (0.2%) |
| 75 Years and older | 1,089 (98.4%) | 18 (1.6%) |
| Total | 22,030 (95.9%) | 936 (4.1%) |
Health Insurance Coverage by Citizenship Status in Eastmont
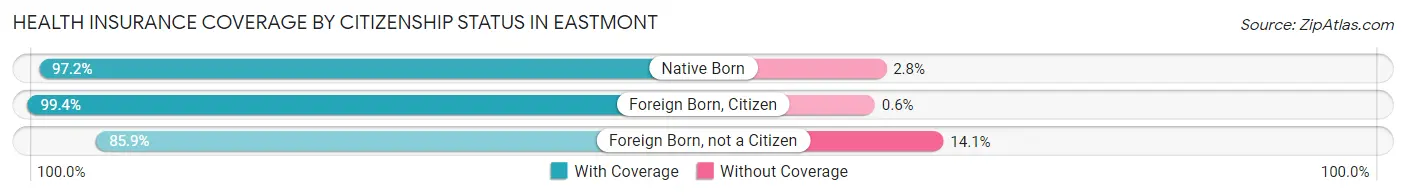
| Citizenship Status | With Coverage | Without Coverage |
| Native Born | 1,743 (97.2%) | 51 (2.8%) |
| Foreign Born, Citizen | 4,124 (99.4%) | 25 (0.6%) |
| Foreign Born, not a Citizen | 1,098 (85.9%) | 180 (14.1%) |
Health Insurance Coverage by Household Income in Eastmont
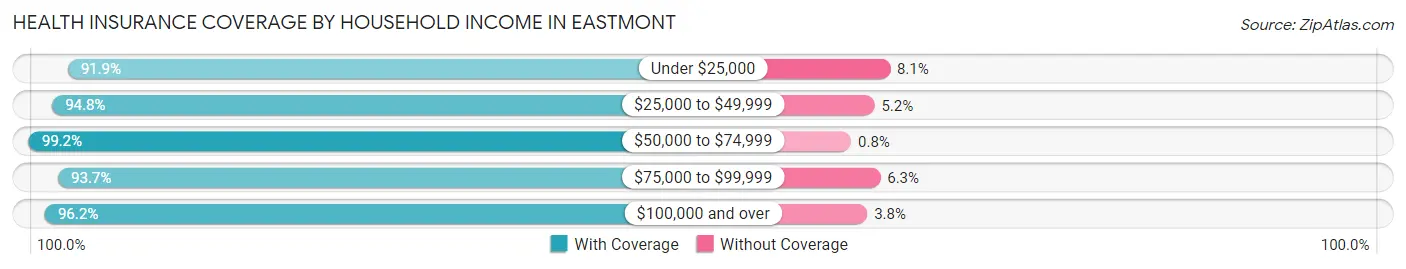
| Household Income | With Coverage | Without Coverage |
| Under $25,000 | 886 (91.9%) | 78 (8.1%) |
| $25,000 to $49,999 | 1,062 (94.8%) | 58 (5.2%) |
| $50,000 to $74,999 | 2,240 (99.2%) | 18 (0.8%) |
| $75,000 to $99,999 | 2,646 (93.7%) | 177 (6.3%) |
| $100,000 and over | 15,108 (96.2%) | 602 (3.8%) |
Public vs Private Health Insurance Coverage by Age in Eastmont
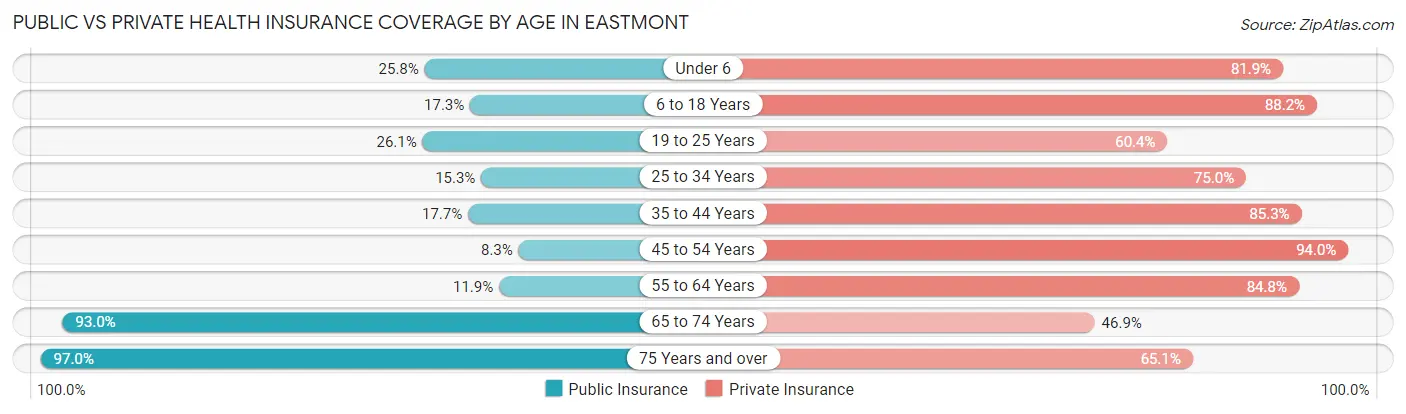
| Age Bracket | Public Insurance | Private Insurance |
| Under 6 | 462 (25.8%) | 1,469 (81.9%) |
| 6 to 18 Years | 718 (17.3%) | 3,659 (88.2%) |
| 19 to 25 Years | 334 (26.1%) | 772 (60.4%) |
| 25 to 34 Years | 372 (15.2%) | 1,830 (75.0%) |
| 35 to 44 Years | 673 (17.7%) | 3,246 (85.3%) |
| 45 to 54 Years | 253 (8.3%) | 2,864 (94.0%) |
| 55 to 64 Years | 366 (11.9%) | 2,601 (84.8%) |
| 65 to 74 Years | 2,120 (93.0%) | 1,070 (46.9%) |
| 75 Years and over | 1,074 (97.0%) | 721 (65.1%) |
| Total | 6,372 (27.8%) | 18,232 (79.4%) |
Disability Status by Sex by Age in Eastmont
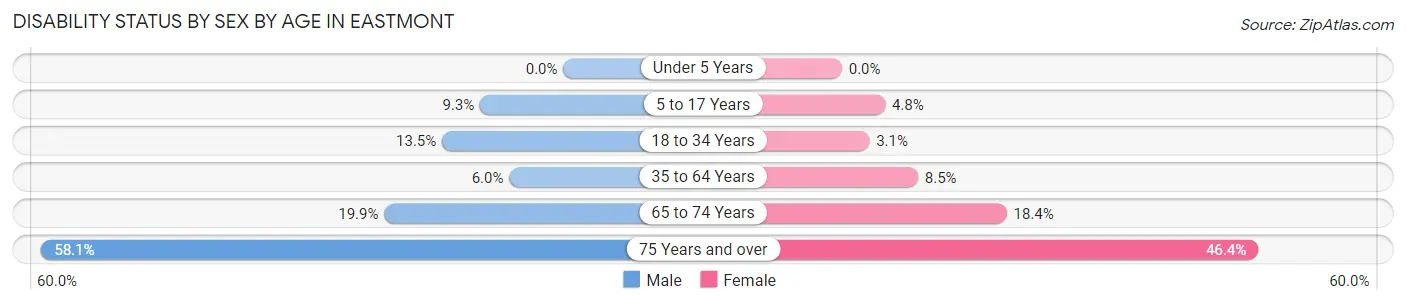
| Age Bracket | Male | Female |
| Under 5 Years | 0 (0.0%) | 0 (0.0%) |
| 5 to 17 Years | 180 (9.3%) | 96 (4.8%) |
| 18 to 34 Years | 313 (13.5%) | 55 (3.0%) |
| 35 to 64 Years | 327 (6.0%) | 380 (8.5%) |
| 65 to 74 Years | 196 (19.9%) | 238 (18.3%) |
| 75 Years and over | 275 (58.1%) | 294 (46.4%) |
Disability Class by Sex by Age in Eastmont
Disability Class: Hearing Difficulty
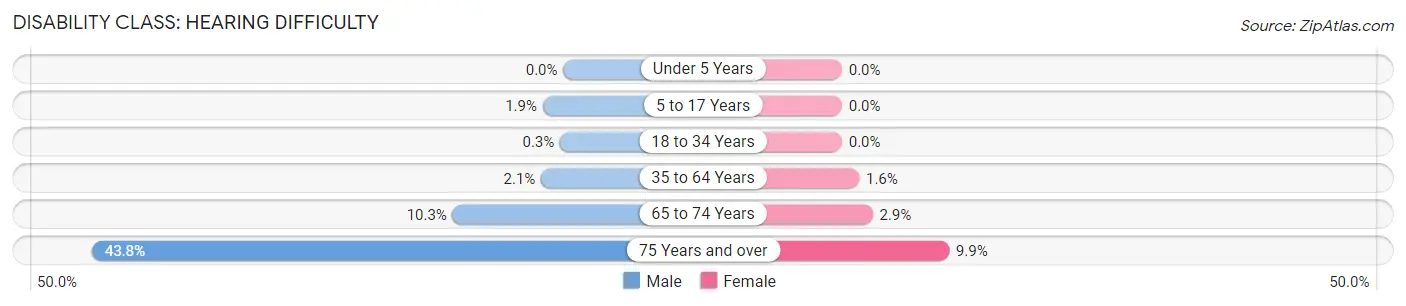
| Age Bracket | Male | Female |
| Under 5 Years | 0 (0.0%) | 0 (0.0%) |
| 5 to 17 Years | 37 (1.9%) | 0 (0.0%) |
| 18 to 34 Years | 7 (0.3%) | 0 (0.0%) |
| 35 to 64 Years | 112 (2.1%) | 72 (1.6%) |
| 65 to 74 Years | 101 (10.3%) | 37 (2.9%) |
| 75 Years and over | 207 (43.8%) | 63 (9.9%) |
Disability Class: Vision Difficulty
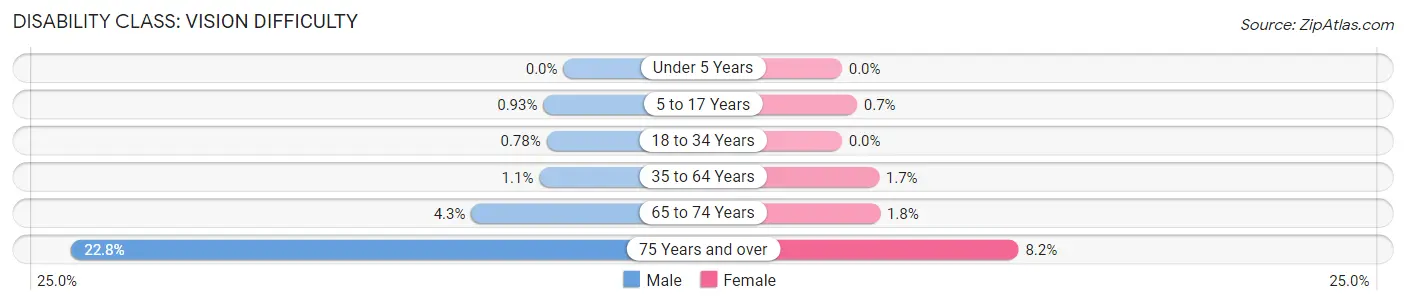
| Age Bracket | Male | Female |
| Under 5 Years | 0 (0.0%) | 0 (0.0%) |
| 5 to 17 Years | 18 (0.9%) | 14 (0.7%) |
| 18 to 34 Years | 18 (0.8%) | 0 (0.0%) |
| 35 to 64 Years | 61 (1.1%) | 77 (1.7%) |
| 65 to 74 Years | 42 (4.3%) | 23 (1.8%) |
| 75 Years and over | 108 (22.8%) | 52 (8.2%) |
Disability Class: Cognitive Difficulty
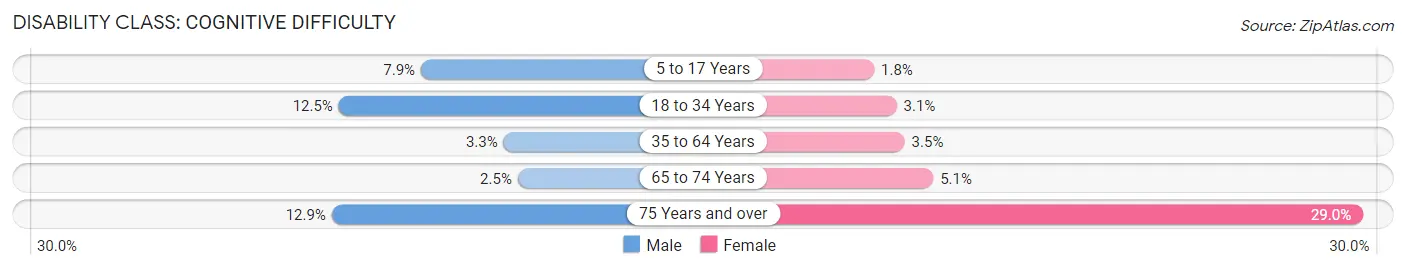
| Age Bracket | Male | Female |
| 5 to 17 Years | 154 (7.9%) | 36 (1.8%) |
| 18 to 34 Years | 290 (12.5%) | 55 (3.0%) |
| 35 to 64 Years | 181 (3.3%) | 157 (3.5%) |
| 65 to 74 Years | 25 (2.5%) | 66 (5.1%) |
| 75 Years and over | 61 (12.9%) | 184 (29.0%) |
Disability Class: Ambulatory Difficulty
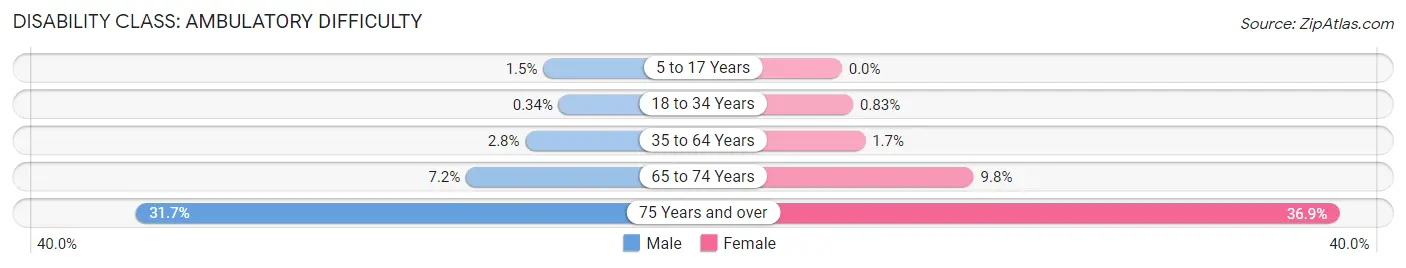
| Age Bracket | Male | Female |
| 5 to 17 Years | 29 (1.5%) | 0 (0.0%) |
| 18 to 34 Years | 8 (0.3%) | 15 (0.8%) |
| 35 to 64 Years | 153 (2.8%) | 78 (1.7%) |
| 65 to 74 Years | 71 (7.2%) | 127 (9.8%) |
| 75 Years and over | 150 (31.7%) | 234 (36.9%) |
Disability Class: Self-Care Difficulty
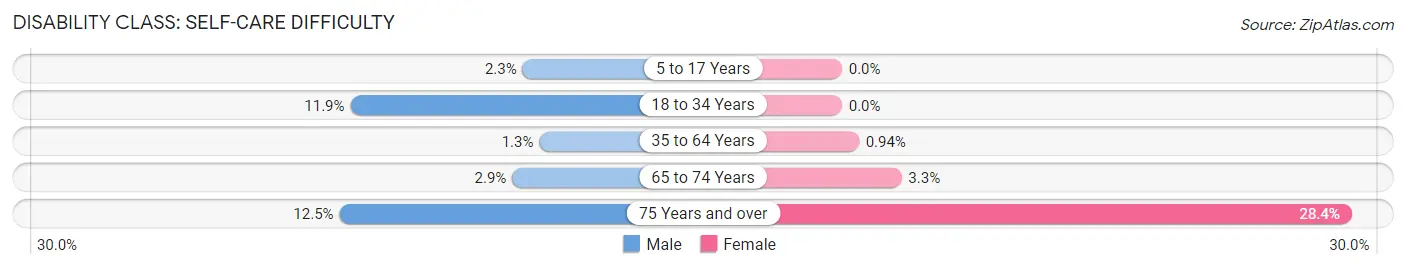
| Age Bracket | Male | Female |
| 5 to 17 Years | 44 (2.3%) | 0 (0.0%) |
| 18 to 34 Years | 275 (11.9%) | 0 (0.0%) |
| 35 to 64 Years | 73 (1.3%) | 42 (0.9%) |
| 65 to 74 Years | 28 (2.9%) | 43 (3.3%) |
| 75 Years and over | 59 (12.5%) | 180 (28.4%) |
Technology Access in Eastmont
Computing Device Access in Eastmont
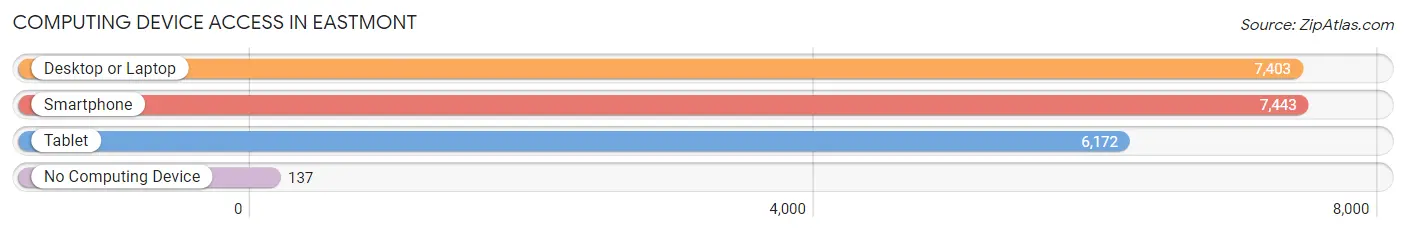
| Device Type | # Households | % Households |
| Desktop or Laptop | 7,403 | 93.7% |
| Smartphone | 7,443 | 94.3% |
| Tablet | 6,172 | 78.2% |
| No Computing Device | 137 | 1.7% |
| Total | 7,897 | 100.0% |
Internet Access in Eastmont
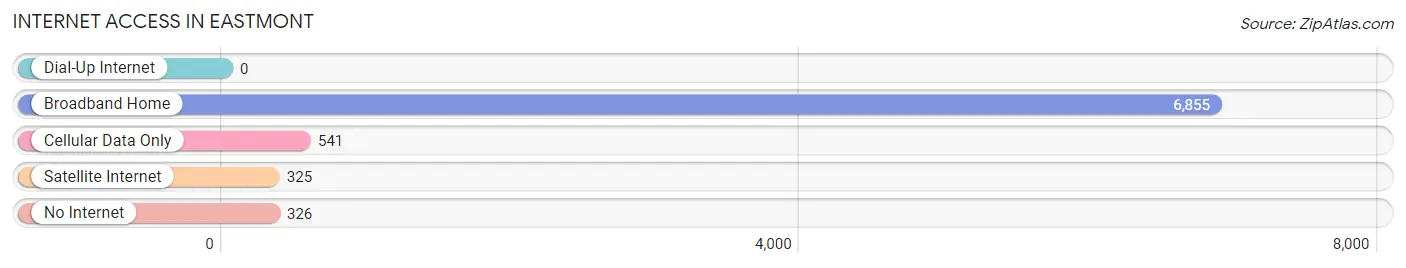
| Internet Type | # Households | % Households |
| Dial-Up Internet | 0 | 0.0% |
| Broadband Home | 6,855 | 86.8% |
| Cellular Data Only | 541 | 6.9% |
| Satellite Internet | 325 | 4.1% |
| No Internet | 326 | 4.1% |
| Total | 7,897 | 100.0% |
Eastmont Summary
Eastmont is a census-designated place located in Douglas County, Washington, United States. It is located on the east side of the Columbia River, just south of the city of Wenatchee. The population was 1,845 at the 2010 census.
Geography
Eastmont is located at 47°25'17" North, 120°19'45" West (47.4214, -120.3291). According to the United States Census Bureau, the CDP has a total area of 4.2 square miles (10.8 km2), all of it land.
History
Eastmont was first settled in the late 1800s by homesteaders who were attracted to the area by its fertile soil and abundant water. The area was originally known as East Wenatchee, but was later renamed Eastmont. The name was chosen to reflect the area's location on the east side of the Columbia River.
The first post office in Eastmont was established in 1891. The town was incorporated in 1909 and the first mayor was elected in 1910.
Eastmont was a thriving agricultural community for many years, with orchards, vineyards, and farms producing a variety of crops. The town also had a number of businesses, including a bank, a hotel, a movie theater, and a variety of stores.
In the 1950s, Eastmont began to experience a decline in population as people moved away from rural areas in search of better job opportunities. The town's population dropped from a peak of 2,000 in 1950 to 1,845 in 2010.
Economy
Eastmont's economy is largely based on agriculture and tourism. The area is home to several wineries and vineyards, as well as a number of orchards and farms. The town also has a number of businesses, including restaurants, retail stores, and service providers.
The town is also home to a number of light industrial businesses, including a plastics manufacturer and a metal fabrication shop.
Demographics
As of the 2010 census, there were 1,845 people, 745 households, and 486 families residing in Eastmont. The population density was 441.2 people per square mile (170.2/km2). There were 809 housing units at an average density of 193.3 per square mile (74.5/km2). The racial makeup of the CDP was 87.2% White, 0.7% African American, 1.2% Native American, 0.7% Asian, 0.1% Pacific Islander, 6.2% from other races, and 4.0% from two or more races. Hispanic or Latino of any race were 11.2% of the population.
There were 745 households, out of which 28.2% had children under the age of 18 living with them, 48.2% were married couples living together, 11.2% had a female householder with no husband present, and 34.7% were non-families. 28.2% of all households were made up of individuals, and 11.2% had someone living alone who was 65 years of age or older. The average household size was 2.48 and the average family size was 3.02.
In Eastmont, the population was spread out, with 24.7% under the age of 18, 8.2% from 18 to 24, 25.2% from 25 to 44, 27.2% from 45 to 64, and 14.7% who were 65 years of age or older. The median age was 38 years. For every 100 females, there were 97.2 males. For every 100 females age 18 and over, there were 94.2 males.
The median income for a household in Eastmont was $37,917, and the median income for a family was $45,000. Males had a median income of $35,000 versus $25,000 for females. The per capita income for the CDP was $18,945. About 8.2% of families and 11.2% of the population were below the poverty line, including 14.7% of those under age 18 and 8.2% of those age 65 or over.
Common Questions
What is Per Capita Income in Eastmont?
Per Capita income in Eastmont is $49,611.
What is the Median Family Income in Eastmont?
Median Family Income in Eastmont is $137,402.
What is the Median Household income in Eastmont?
Median Household Income in Eastmont is $130,602.
What is Income or Wage Gap in Eastmont?
Income or Wage Gap in Eastmont is 39.5%.
Women in Eastmont earn 60.5 cents for every dollar earned by a man.
What is Inequality or Gini Index in Eastmont?
Inequality or Gini Index in Eastmont is 0.36.
What is the Total Population of Eastmont?
Total Population of Eastmont is 23,173.
What is the Total Male Population of Eastmont?
Total Male Population of Eastmont is 12,219.
What is the Total Female Population of Eastmont?
Total Female Population of Eastmont is 10,954.
What is the Ratio of Males per 100 Females in Eastmont?
There are 111.55 Males per 100 Females in Eastmont.
What is the Ratio of Females per 100 Males in Eastmont?
There are 89.65 Females per 100 Males in Eastmont.
What is the Median Population Age in Eastmont?
Median Population Age in Eastmont is 39.2 Years.
What is the Average Family Size in Eastmont
Average Family Size in Eastmont is 3.1 People.
What is the Average Household Size in Eastmont
Average Household Size in Eastmont is 2.9 People.
How Large is the Labor Force in Eastmont?
There are 11,864 People in the Labor Forcein in Eastmont.
What is the Percentage of People in the Labor Force in Eastmont?
65.8% of People are in the Labor Force in Eastmont.
What is the Unemployment Rate in Eastmont?
Unemployment Rate in Eastmont is 5.9%.