Ilwaco, WA Map & Demographics
Ilwaco Map
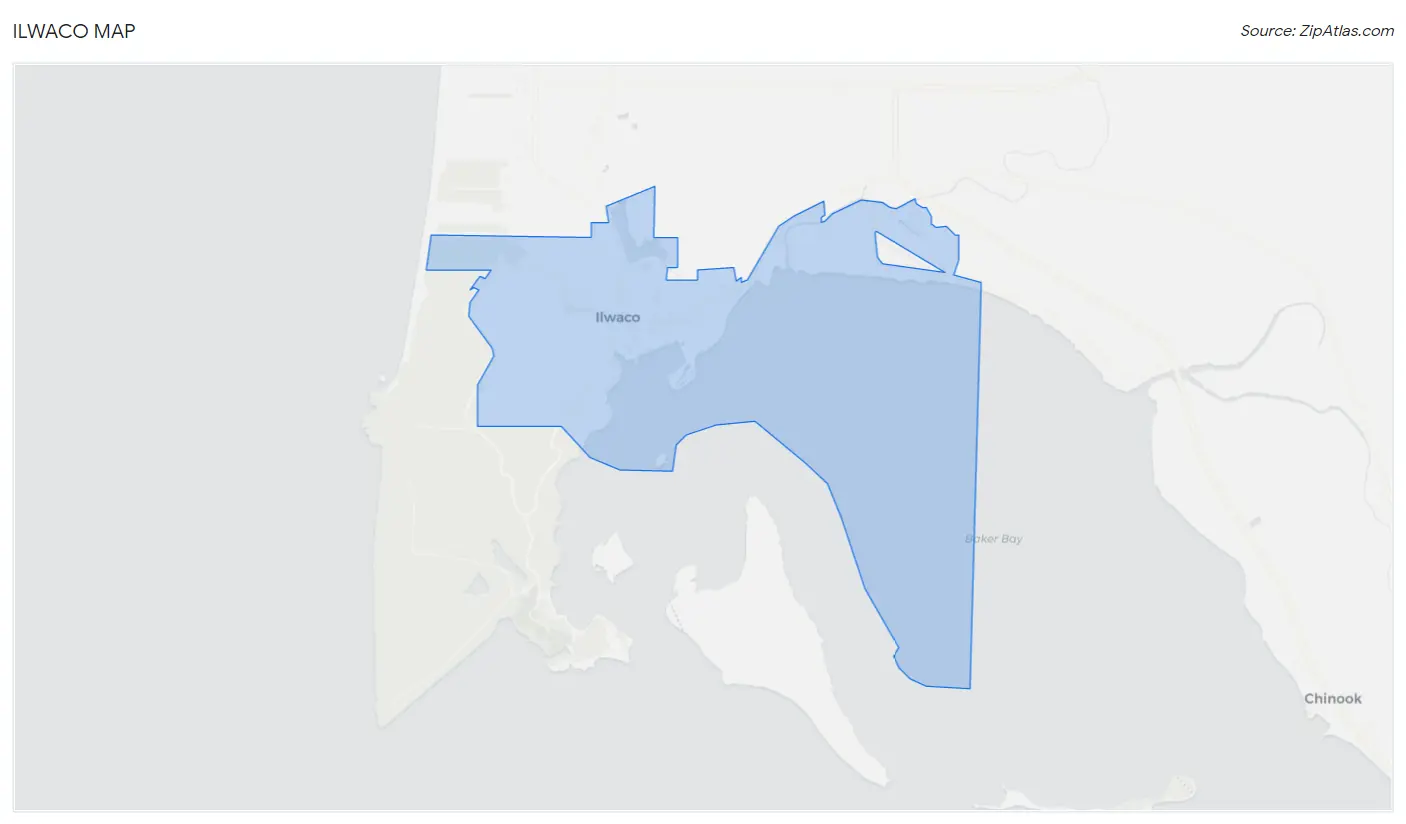
Ilwaco Overview
$39,386
PER CAPITA INCOME
$79,821
AVG FAMILY INCOME
$85,446
AVG HOUSEHOLD INCOME
10.3%
WAGE / INCOME GAP [ % ]
89.7¢/ $1
WAGE / INCOME GAP [ $ ]
0.42
INEQUALITY / GINI INDEX
1,433
TOTAL POPULATION
755
MALE POPULATION
678
FEMALE POPULATION
111.36
MALES / 100 FEMALES
89.80
FEMALES / 100 MALES
43.6
MEDIAN AGE
3.1
AVG FAMILY SIZE
3.0
AVG HOUSEHOLD SIZE
734
LABOR FORCE [ PEOPLE ]
60.1%
PERCENT IN LABOR FORCE
0.6%
UNEMPLOYMENT RATE
Ilwaco Zip Codes
Ilwaco Area Codes
Income in Ilwaco
Income Overview in Ilwaco
Per Capita Income in Ilwaco is $39,386, while median incomes of families and households are $79,821 and $85,446 respectively.
| Characteristic | Number | Measure |
| Per Capita Income | 1,433 | $39,386 |
| Median Family Income | 356 | $79,821 |
| Mean Family Income | 356 | $108,385 |
| Median Household Income | 469 | $85,446 |
| Mean Household Income | 469 | $106,728 |
| Income Deficit | 356 | $0 |
| Wage / Income Gap (%) | 1,433 | 10.29% |
| Wage / Income Gap ($) | 1,433 | 89.71¢ per $1 |
| Gini / Inequality Index | 1,433 | 0.42 |
Earnings by Sex in Ilwaco
Average Earnings in Ilwaco are $43,300, $44,153 for men and $39,609 for women, a difference of 10.3%.
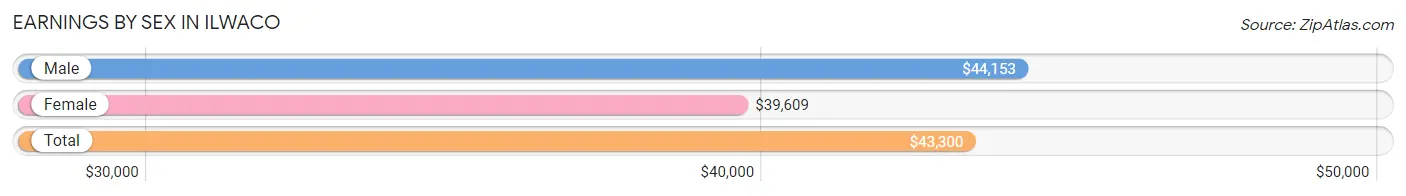
| Sex | Number | Average Earnings |
| Male | 430 (55.3%) | $44,153 |
| Female | 347 (44.7%) | $39,609 |
| Total | 777 (100.0%) | $43,300 |
Earnings by Sex by Income Bracket in Ilwaco
The most common earnings brackets in Ilwaco are $40,000 to $44,999 for men (59 | 13.7%) and $40,000 to $44,999 for women (55 | 15.9%).
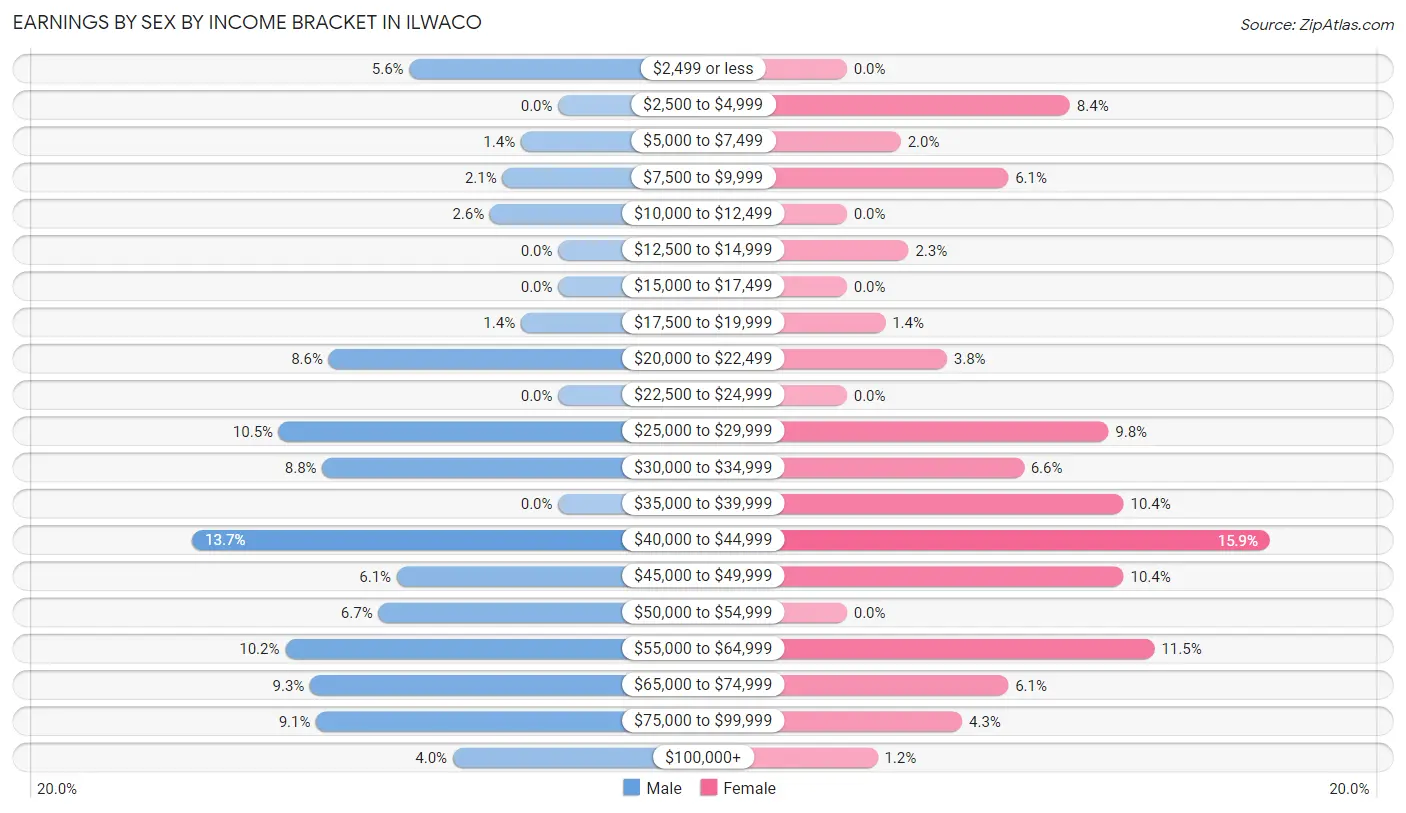
| Income | Male | Female |
| $2,499 or less | 24 (5.6%) | 0 (0.0%) |
| $2,500 to $4,999 | 0 (0.0%) | 29 (8.4%) |
| $5,000 to $7,499 | 6 (1.4%) | 7 (2.0%) |
| $7,500 to $9,999 | 9 (2.1%) | 21 (6.0%) |
| $10,000 to $12,499 | 11 (2.6%) | 0 (0.0%) |
| $12,500 to $14,999 | 0 (0.0%) | 8 (2.3%) |
| $15,000 to $17,499 | 0 (0.0%) | 0 (0.0%) |
| $17,500 to $19,999 | 6 (1.4%) | 5 (1.4%) |
| $20,000 to $22,499 | 37 (8.6%) | 13 (3.7%) |
| $22,500 to $24,999 | 0 (0.0%) | 0 (0.0%) |
| $25,000 to $29,999 | 45 (10.5%) | 34 (9.8%) |
| $30,000 to $34,999 | 38 (8.8%) | 23 (6.6%) |
| $35,000 to $39,999 | 0 (0.0%) | 36 (10.4%) |
| $40,000 to $44,999 | 59 (13.7%) | 55 (15.9%) |
| $45,000 to $49,999 | 26 (6.0%) | 36 (10.4%) |
| $50,000 to $54,999 | 29 (6.7%) | 0 (0.0%) |
| $55,000 to $64,999 | 44 (10.2%) | 40 (11.5%) |
| $65,000 to $74,999 | 40 (9.3%) | 21 (6.0%) |
| $75,000 to $99,999 | 39 (9.1%) | 15 (4.3%) |
| $100,000+ | 17 (4.0%) | 4 (1.1%) |
| Total | 430 (100.0%) | 347 (100.0%) |
Earnings by Sex by Educational Attainment in Ilwaco
Average earnings in Ilwaco are $44,746 for men and $37,813 for women, a difference of 15.5%. Men with an educational attainment of less than high school enjoy the highest average annual earnings of $68,167, while those with high school diploma education earn the least with $29,444. Women with an educational attainment of college or associate's degree earn the most with the average annual earnings of $47,083, while those with less than high school education have the smallest earnings of $29,792.
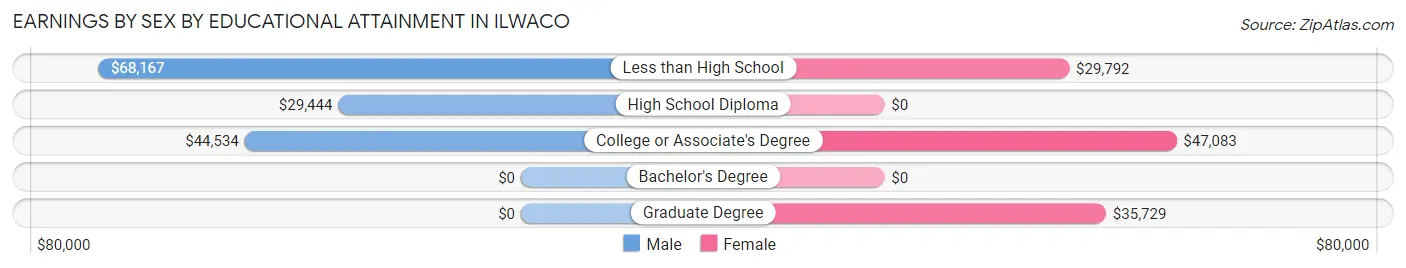
| Educational Attainment | Male Income | Female Income |
| Less than High School | $68,167 | $29,792 |
| High School Diploma | $29,444 | $0 |
| College or Associate's Degree | $44,534 | $47,083 |
| Bachelor's Degree | - | - |
| Graduate Degree | - | - |
| Total | $44,746 | $37,813 |
Family Income in Ilwaco
Family Income Brackets in Ilwaco
According to the Ilwaco family income data, there are 78 families falling into the $75,000 to $99,999 income range, which is the most common income bracket and makes up 21.9% of all families.
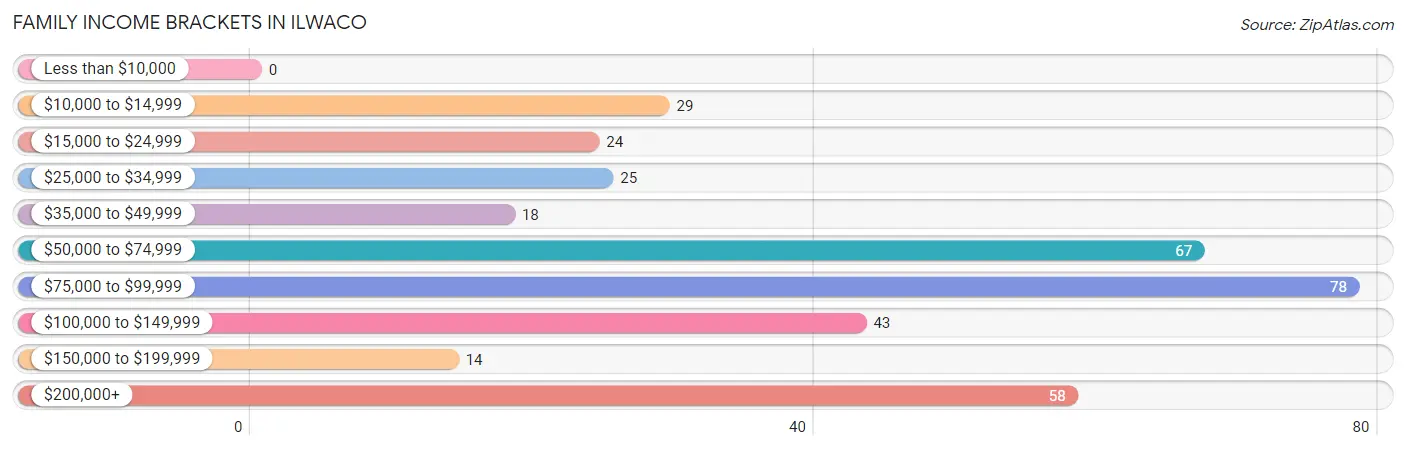
| Income Bracket | # Families | % Families |
| Less than $10,000 | 0 | 0.0% |
| $10,000 to $14,999 | 29 | 8.1% |
| $15,000 to $24,999 | 24 | 6.7% |
| $25,000 to $34,999 | 25 | 7.0% |
| $35,000 to $49,999 | 18 | 5.1% |
| $50,000 to $74,999 | 67 | 18.8% |
| $75,000 to $99,999 | 78 | 21.9% |
| $100,000 to $149,999 | 43 | 12.1% |
| $150,000 to $199,999 | 14 | 3.9% |
| $200,000+ | 58 | 16.3% |
Family Income by Famaliy Size in Ilwaco
6-person families (30 | 8.4%) account for the highest median family income in Ilwaco with $123,462 per family, while 2-person families (169 | 47.5%) have the highest median income of $38,973 per family member.
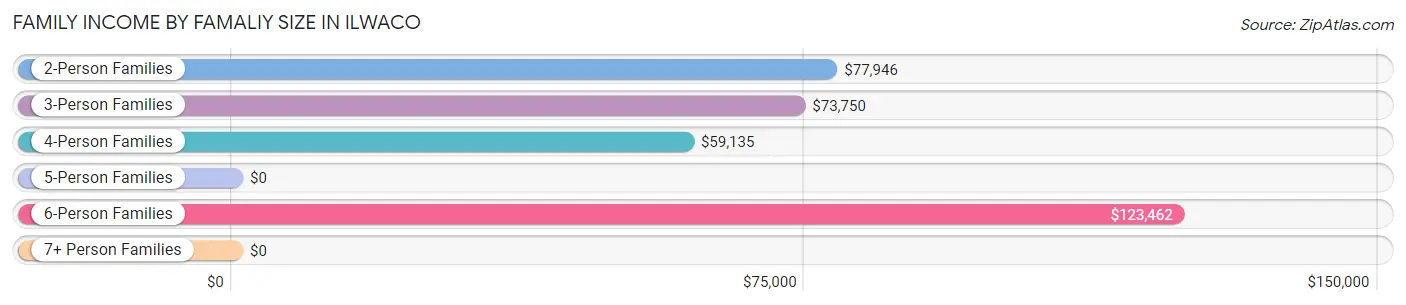
| Income Bracket | # Families | Median Income |
| 2-Person Families | 169 (47.5%) | $77,946 |
| 3-Person Families | 40 (11.2%) | $73,750 |
| 4-Person Families | 45 (12.6%) | $59,135 |
| 5-Person Families | 72 (20.2%) | $0 |
| 6-Person Families | 30 (8.4%) | $123,462 |
| 7+ Person Families | 0 (0.0%) | $0 |
| Total | 356 (100.0%) | $79,821 |
Family Income by Number of Earners in Ilwaco
The median family income in Ilwaco is $79,821, with families comprising 3+ earners (49) having the highest median family income of $250,001, while families with no earners (106) have the lowest median family income of $50,833, accounting for 13.8% and 29.8% of families, respectively.
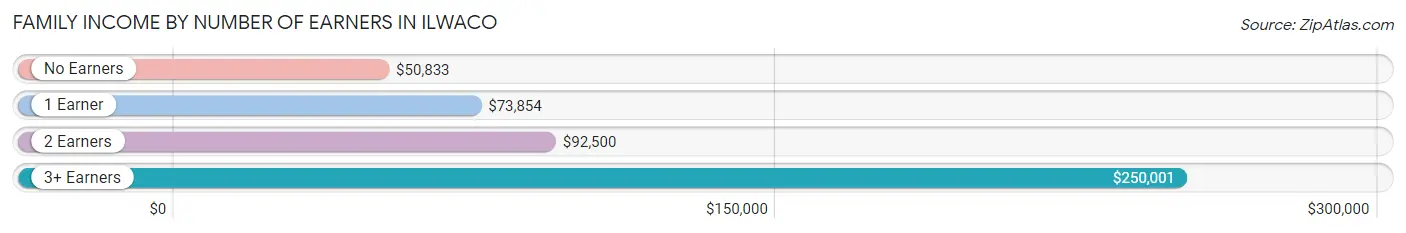
| Number of Earners | # Families | Median Income |
| No Earners | 106 (29.8%) | $50,833 |
| 1 Earner | 89 (25.0%) | $73,854 |
| 2 Earners | 112 (31.5%) | $92,500 |
| 3+ Earners | 49 (13.8%) | $250,001 |
| Total | 356 (100.0%) | $79,821 |
Household Income in Ilwaco
Household Income Brackets in Ilwaco
With 100 households falling in the category, the $75,000 to $99,999 income range is the most frequent in Ilwaco, accounting for 21.3% of all households.
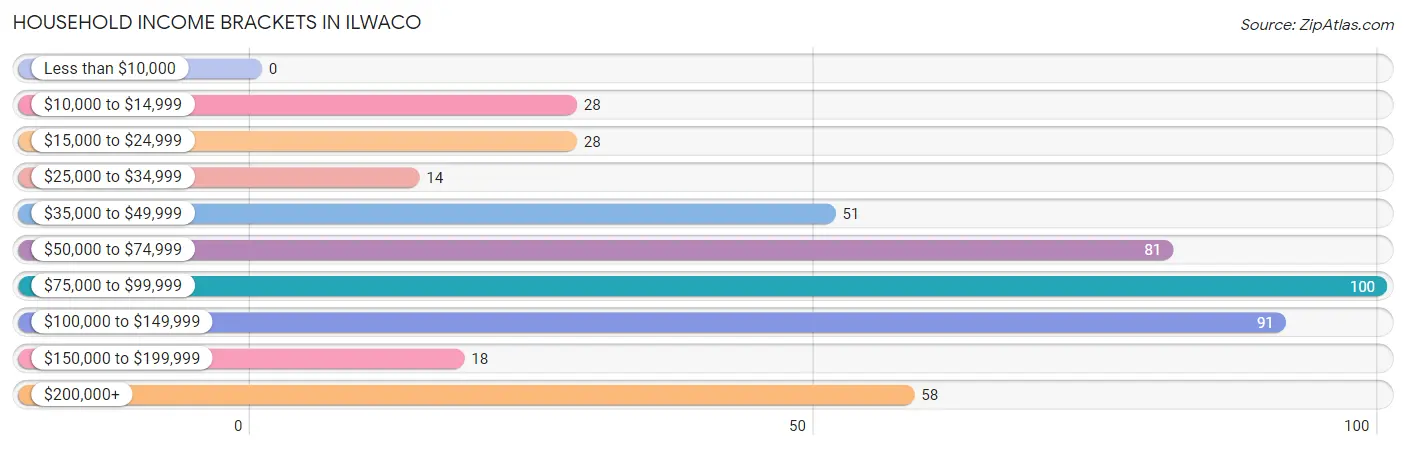
| Income Bracket | # Households | % Households |
| Less than $10,000 | 0 | 0.0% |
| $10,000 to $14,999 | 28 | 6.0% |
| $15,000 to $24,999 | 28 | 6.0% |
| $25,000 to $34,999 | 14 | 3.0% |
| $35,000 to $49,999 | 51 | 10.9% |
| $50,000 to $74,999 | 81 | 17.3% |
| $75,000 to $99,999 | 100 | 21.3% |
| $100,000 to $149,999 | 91 | 19.4% |
| $150,000 to $199,999 | 18 | 3.8% |
| $200,000+ | 58 | 12.4% |
Household Income by Householder Age in Ilwaco
The median household income in Ilwaco is $85,446, with the highest median household income of $113,393 found in the 45 to 64 years age bracket for the primary householder. A total of 142 households (30.3%) fall into this category. Meanwhile, the 15 to 24 years age bracket for the primary householder has the lowest median household income of $0, with 8 households (1.7%) in this group.
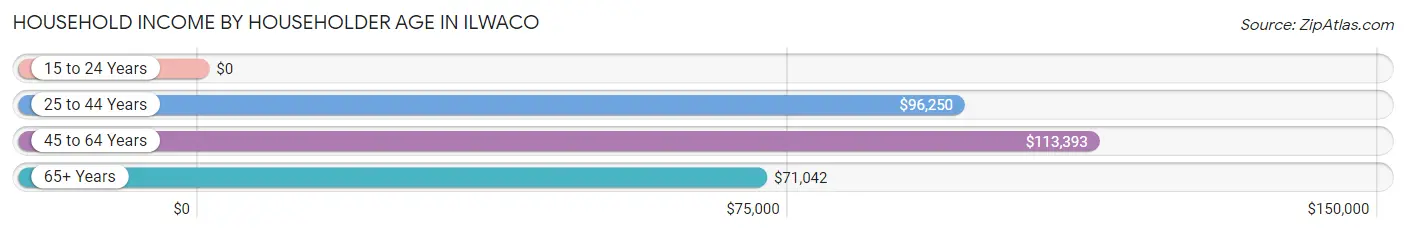
| Income Bracket | # Households | Median Income |
| 15 to 24 Years | 8 (1.7%) | $0 |
| 25 to 44 Years | 122 (26.0%) | $96,250 |
| 45 to 64 Years | 142 (30.3%) | $113,393 |
| 65+ Years | 197 (42.0%) | $71,042 |
| Total | 469 (100.0%) | $85,446 |
Poverty in Ilwaco
Income Below Poverty by Sex and Age in Ilwaco
With 13.0% poverty level for males and 16.5% for females among the residents of Ilwaco, 5 year old males and 25 to 34 year old females are the most vulnerable to poverty, with 6 males (85.7%) and 72 females (59.0%) in their respective age groups living below the poverty level.
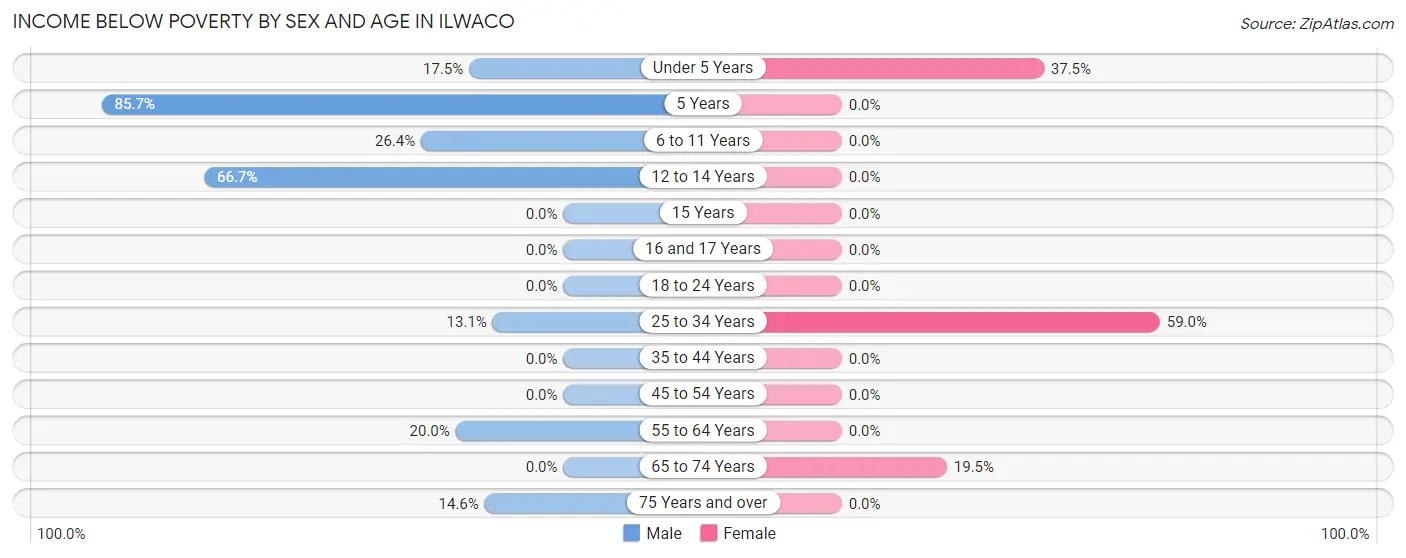
| Age Bracket | Male | Female |
| Under 5 Years | 7 (17.5%) | 9 (37.5%) |
| 5 Years | 6 (85.7%) | 0 (0.0%) |
| 6 to 11 Years | 14 (26.4%) | 0 (0.0%) |
| 12 to 14 Years | 16 (66.7%) | 0 (0.0%) |
| 15 Years | 0 (0.0%) | 0 (0.0%) |
| 16 and 17 Years | 0 (0.0%) | 0 (0.0%) |
| 18 to 24 Years | 0 (0.0%) | 0 (0.0%) |
| 25 to 34 Years | 21 (13.1%) | 72 (59.0%) |
| 35 to 44 Years | 0 (0.0%) | 0 (0.0%) |
| 45 to 54 Years | 0 (0.0%) | 0 (0.0%) |
| 55 to 64 Years | 14 (20.0%) | 0 (0.0%) |
| 65 to 74 Years | 0 (0.0%) | 31 (19.5%) |
| 75 Years and over | 19 (14.6%) | 0 (0.0%) |
| Total | 97 (13.0%) | 112 (16.5%) |
Income Above Poverty by Sex and Age in Ilwaco
According to the poverty statistics in Ilwaco, males aged 15 years and females aged 5 years are the age groups that are most secure financially, with 100.0% of males and 100.0% of females in these age groups living above the poverty line.
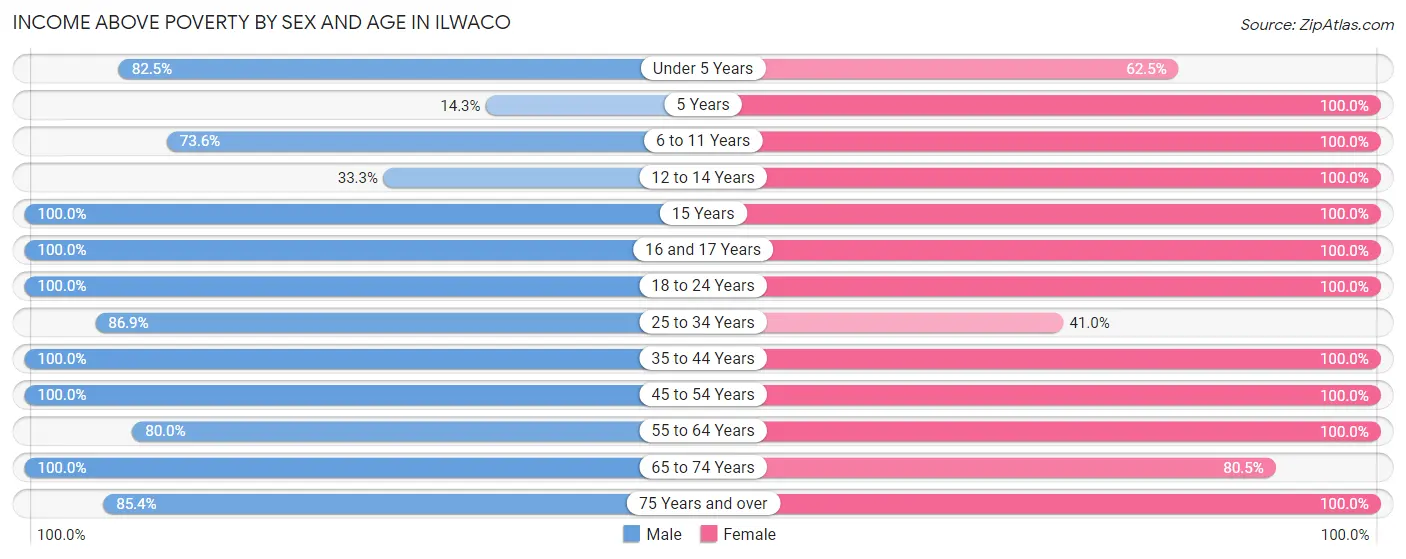
| Age Bracket | Male | Female |
| Under 5 Years | 33 (82.5%) | 15 (62.5%) |
| 5 Years | 1 (14.3%) | 10 (100.0%) |
| 6 to 11 Years | 39 (73.6%) | 11 (100.0%) |
| 12 to 14 Years | 8 (33.3%) | 20 (100.0%) |
| 15 Years | 12 (100.0%) | 3 (100.0%) |
| 16 and 17 Years | 28 (100.0%) | 21 (100.0%) |
| 18 to 24 Years | 4 (100.0%) | 68 (100.0%) |
| 25 to 34 Years | 139 (86.9%) | 50 (41.0%) |
| 35 to 44 Years | 53 (100.0%) | 58 (100.0%) |
| 45 to 54 Years | 81 (100.0%) | 57 (100.0%) |
| 55 to 64 Years | 56 (80.0%) | 74 (100.0%) |
| 65 to 74 Years | 82 (100.0%) | 128 (80.5%) |
| 75 Years and over | 111 (85.4%) | 51 (100.0%) |
| Total | 647 (87.0%) | 566 (83.5%) |
Income Below Poverty Among Married-Couple Families in Ilwaco
The poverty statistics for married-couple families in Ilwaco show that 8.3% or 18 of the total 217 families live below the poverty line. Families with 1 or 2 children have the highest poverty rate of 10.7%, comprising of 3 families. On the other hand, families with 3 or 4 children have the lowest poverty rate of 0.0%, which includes 0 families.
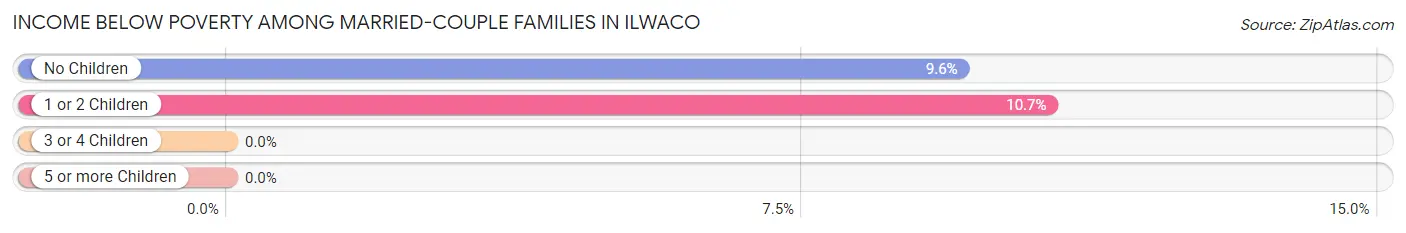
| Children | Above Poverty | Below Poverty |
| No Children | 142 (90.4%) | 15 (9.6%) |
| 1 or 2 Children | 25 (89.3%) | 3 (10.7%) |
| 3 or 4 Children | 32 (100.0%) | 0 (0.0%) |
| 5 or more Children | 0 (0.0%) | 0 (0.0%) |
| Total | 199 (91.7%) | 18 (8.3%) |
Income Below Poverty Among Single-Parent Households in Ilwaco
According to the poverty data in Ilwaco, 25.0% or 11 single-father households and 29.5% or 28 single-mother households are living below the poverty line. Among single-father households, those with 3 or 4 children have the highest poverty rate, with 11 households (100.0%) experiencing poverty. Likewise, among single-mother households, those with 3 or 4 children have the highest poverty rate, with 14 households (48.3%) falling below the poverty line.
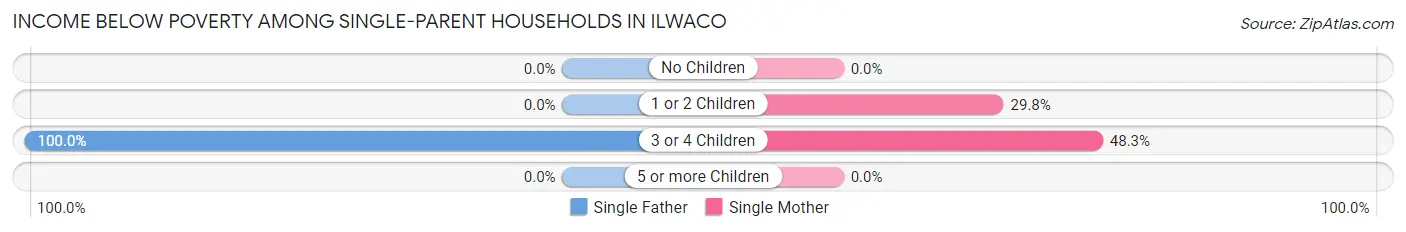
| Children | Single Father | Single Mother |
| No Children | 0 (0.0%) | 0 (0.0%) |
| 1 or 2 Children | 0 (0.0%) | 14 (29.8%) |
| 3 or 4 Children | 11 (100.0%) | 14 (48.3%) |
| 5 or more Children | 0 (0.0%) | 0 (0.0%) |
| Total | 11 (25.0%) | 28 (29.5%) |
Income Below Poverty Among Married-Couple vs Single-Parent Households in Ilwaco
The poverty data for Ilwaco shows that 18 of the married-couple family households (8.3%) and 39 of the single-parent households (28.1%) are living below the poverty level. Within the married-couple family households, those with 1 or 2 children have the highest poverty rate, with 3 households (10.7%) falling below the poverty line. Among the single-parent households, those with 3 or 4 children have the highest poverty rate, with 25 household (62.5%) living below poverty.
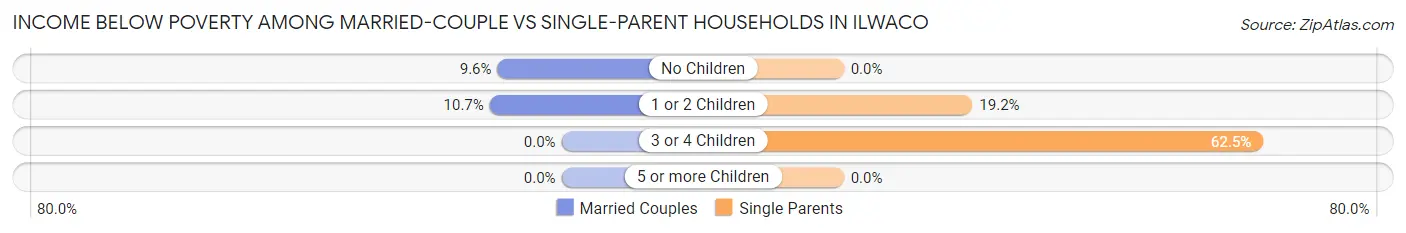
| Children | Married-Couple Families | Single-Parent Households |
| No Children | 15 (9.6%) | 0 (0.0%) |
| 1 or 2 Children | 3 (10.7%) | 14 (19.2%) |
| 3 or 4 Children | 0 (0.0%) | 25 (62.5%) |
| 5 or more Children | 0 (0.0%) | 0 (0.0%) |
| Total | 18 (8.3%) | 39 (28.1%) |
Race in Ilwaco
The most populous races in Ilwaco are White / Caucasian (1,231 | 85.9%), Two or more Races (159 | 11.1%), and Hispanic or Latino (150 | 10.5%).
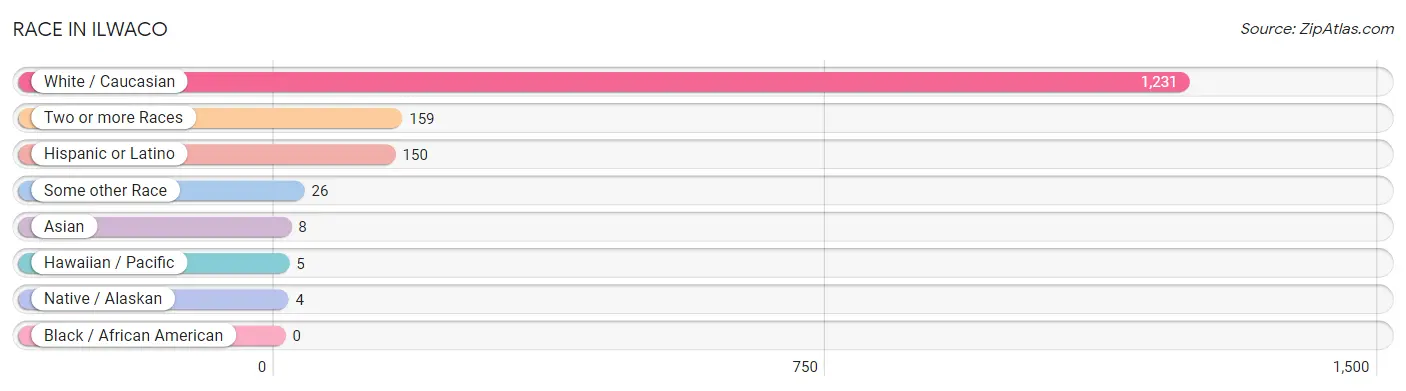
| Race | # Population | % Population |
| Asian | 8 | 0.6% |
| Black / African American | 0 | 0.0% |
| Hawaiian / Pacific | 5 | 0.4% |
| Hispanic or Latino | 150 | 10.5% |
| Native / Alaskan | 4 | 0.3% |
| White / Caucasian | 1,231 | 85.9% |
| Two or more Races | 159 | 11.1% |
| Some other Race | 26 | 1.8% |
| Total | 1,433 | 100.0% |
Ancestry in Ilwaco
The most populous ancestries reported in Ilwaco are German (180 | 12.6%), Irish (157 | 11.0%), Norwegian (140 | 9.8%), English (105 | 7.3%), and Mexican (86 | 6.0%), together accounting for 46.6% of all Ilwaco residents.
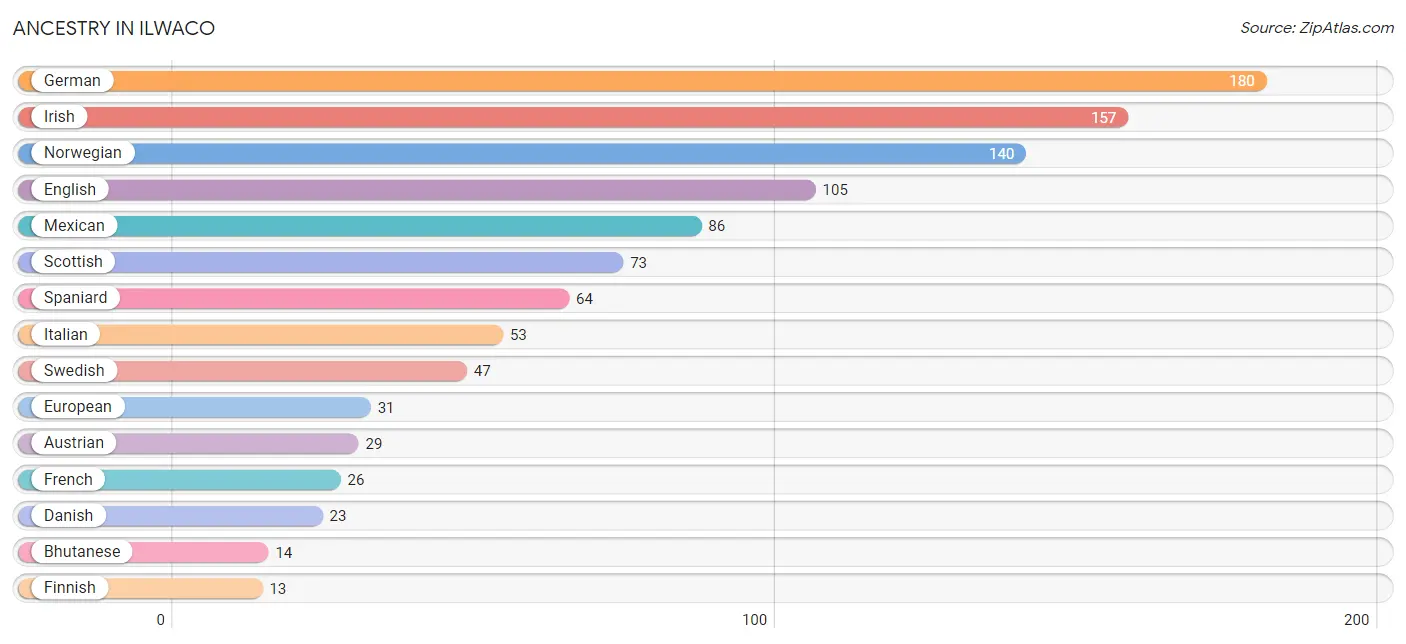
| Ancestry | # Population | % Population |
| Alaska Native | 6 | 0.4% |
| Albanian | 12 | 0.8% |
| American | 8 | 0.6% |
| Austrian | 29 | 2.0% |
| Bhutanese | 14 | 1.0% |
| British | 12 | 0.8% |
| Danish | 23 | 1.6% |
| Dutch | 12 | 0.8% |
| English | 105 | 7.3% |
| European | 31 | 2.2% |
| Finnish | 13 | 0.9% |
| French | 26 | 1.8% |
| French Canadian | 2 | 0.1% |
| German | 180 | 12.6% |
| Irish | 157 | 11.0% |
| Italian | 53 | 3.7% |
| Korean | 4 | 0.3% |
| Mexican | 86 | 6.0% |
| Norwegian | 140 | 9.8% |
| Polish | 2 | 0.1% |
| Portuguese | 11 | 0.8% |
| Russian | 9 | 0.6% |
| Samoan | 5 | 0.4% |
| Scotch-Irish | 7 | 0.5% |
| Scottish | 73 | 5.1% |
| Spaniard | 64 | 4.5% |
| Swedish | 47 | 3.3% |
| Tlingit-Haida | 4 | 0.3% |
| Tsimshian | 4 | 0.3% |
| Welsh | 2 | 0.1% | View All 30 Rows |
Immigrants in Ilwaco
The most numerous immigrant groups reported in Ilwaco came from Central America (46 | 3.2%), Latin America (46 | 3.2%), Mexico (46 | 3.2%), Europe (24 | 1.7%), and Eastern Europe (21 | 1.5%), together accounting for 12.8% of all Ilwaco residents.
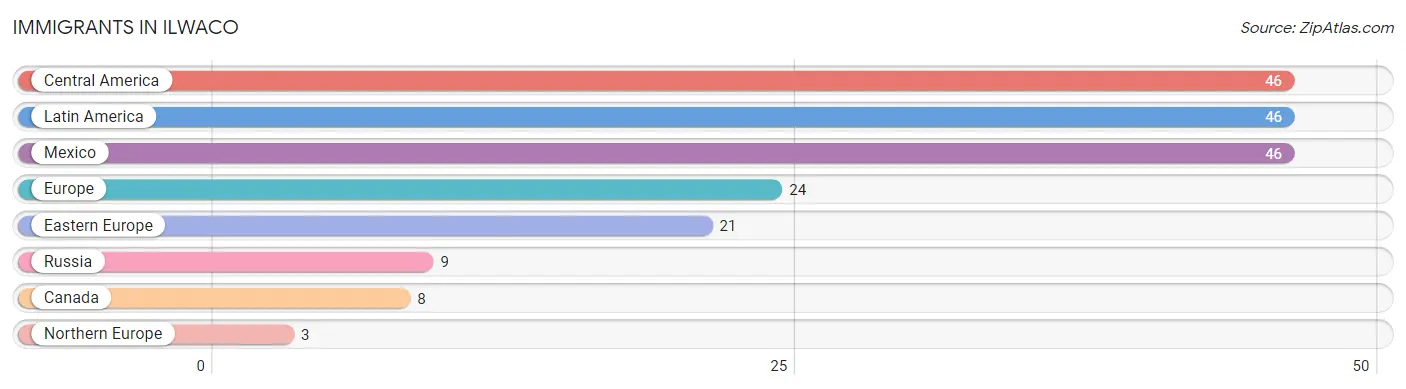
| Immigration Origin | # Population | % Population |
| Canada | 8 | 0.6% |
| Central America | 46 | 3.2% |
| Eastern Europe | 21 | 1.5% |
| Europe | 24 | 1.7% |
| Latin America | 46 | 3.2% |
| Mexico | 46 | 3.2% |
| Northern Europe | 3 | 0.2% |
| Russia | 9 | 0.6% | View All 8 Rows |
Sex and Age in Ilwaco
Sex and Age in Ilwaco
The most populous age groups in Ilwaco are 30 to 34 Years (86 | 11.4%) for men and 70 to 74 Years (131 | 19.3%) for women.
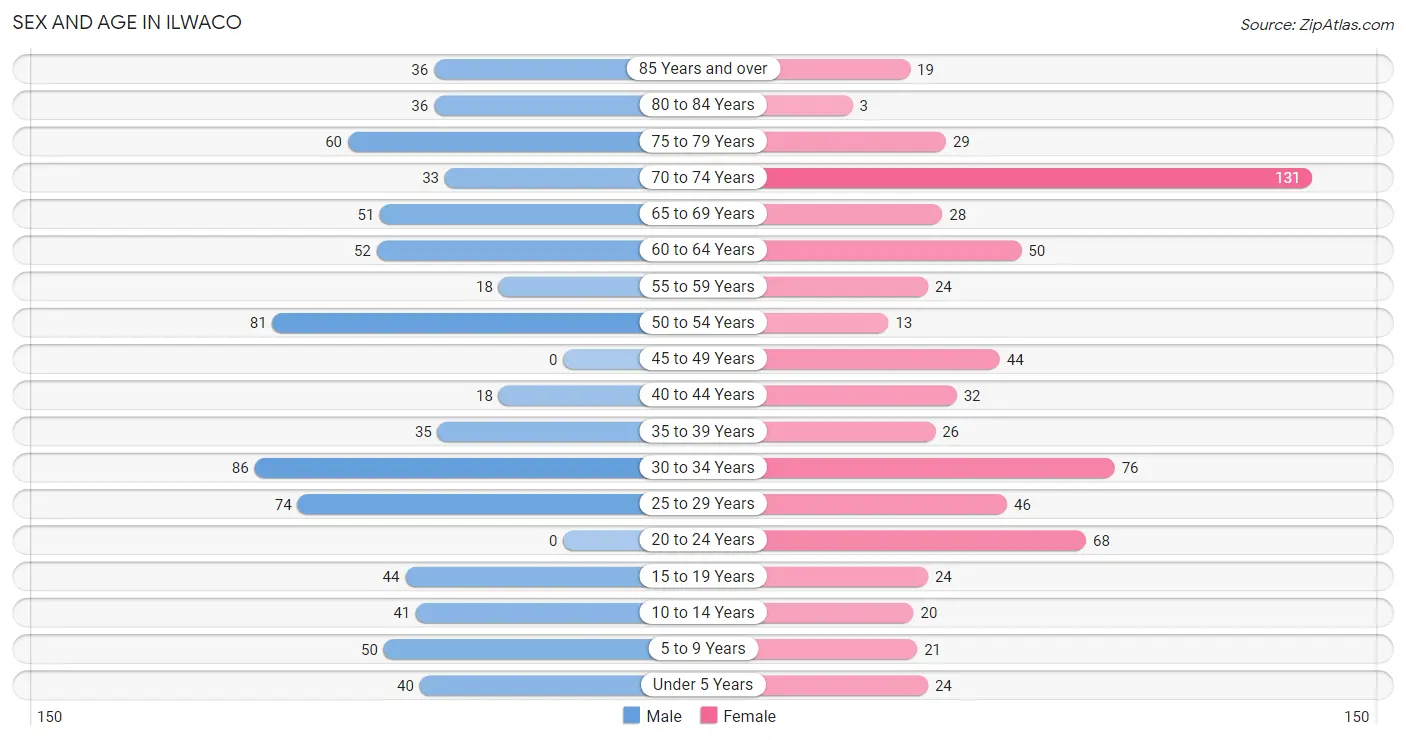
| Age Bracket | Male | Female |
| Under 5 Years | 40 (5.3%) | 24 (3.5%) |
| 5 to 9 Years | 50 (6.6%) | 21 (3.1%) |
| 10 to 14 Years | 41 (5.4%) | 20 (2.9%) |
| 15 to 19 Years | 44 (5.8%) | 24 (3.5%) |
| 20 to 24 Years | 0 (0.0%) | 68 (10.0%) |
| 25 to 29 Years | 74 (9.8%) | 46 (6.8%) |
| 30 to 34 Years | 86 (11.4%) | 76 (11.2%) |
| 35 to 39 Years | 35 (4.6%) | 26 (3.8%) |
| 40 to 44 Years | 18 (2.4%) | 32 (4.7%) |
| 45 to 49 Years | 0 (0.0%) | 44 (6.5%) |
| 50 to 54 Years | 81 (10.7%) | 13 (1.9%) |
| 55 to 59 Years | 18 (2.4%) | 24 (3.5%) |
| 60 to 64 Years | 52 (6.9%) | 50 (7.4%) |
| 65 to 69 Years | 51 (6.8%) | 28 (4.1%) |
| 70 to 74 Years | 33 (4.4%) | 131 (19.3%) |
| 75 to 79 Years | 60 (8.0%) | 29 (4.3%) |
| 80 to 84 Years | 36 (4.8%) | 3 (0.4%) |
| 85 Years and over | 36 (4.8%) | 19 (2.8%) |
| Total | 755 (100.0%) | 678 (100.0%) |
Families and Households in Ilwaco
Median Family Size in Ilwaco
The median family size in Ilwaco is 3.08 persons per family, with married-couple families (217 | 61.0%) accounting for the largest median family size of 3.42 persons per family. On the other hand, single male/father families (44 | 12.4%) represent the smallest median family size with 2.11 persons per family.
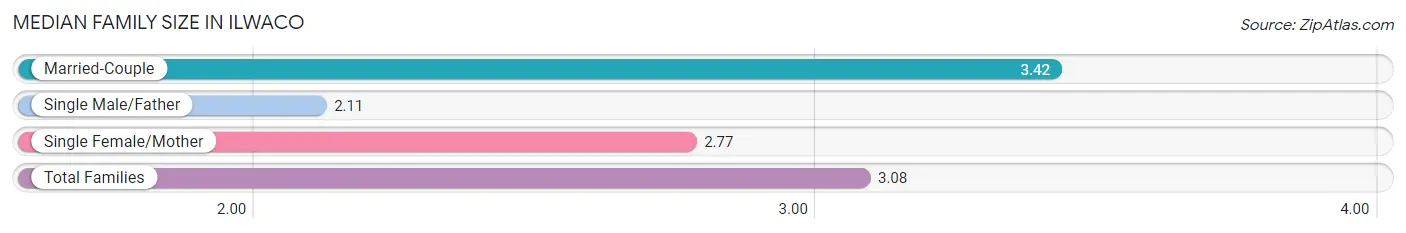
| Family Type | # Families | Family Size |
| Married-Couple | 217 (61.0%) | 3.42 |
| Single Male/Father | 44 (12.4%) | 2.11 |
| Single Female/Mother | 95 (26.7%) | 2.77 |
| Total Families | 356 (100.0%) | 3.08 |
Median Household Size in Ilwaco
The median household size in Ilwaco is 3.05 persons per household, with married-couple households (217 | 46.3%) accounting for the largest median household size of 3.66 persons per household. non-family households (113 | 24.1%) represent the smallest median household size with 1.46 persons per household.
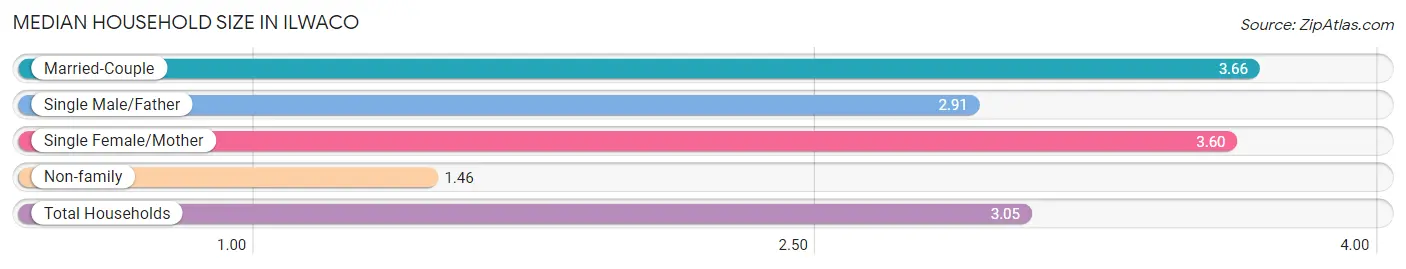
| Household Type | # Households | Household Size |
| Married-Couple | 217 (46.3%) | 3.66 |
| Single Male/Father | 44 (9.4%) | 2.91 |
| Single Female/Mother | 95 (20.3%) | 3.60 |
| Non-family | 113 (24.1%) | 1.46 |
| Total Households | 469 (100.0%) | 3.05 |
Household Size by Marriage Status in Ilwaco
Out of a total of 469 households in Ilwaco, 356 (75.9%) are family households, while 113 (24.1%) are nonfamily households. The most numerous type of family households are 2-person households, comprising 162, and the most common type of nonfamily households are 1-person households, comprising 93.
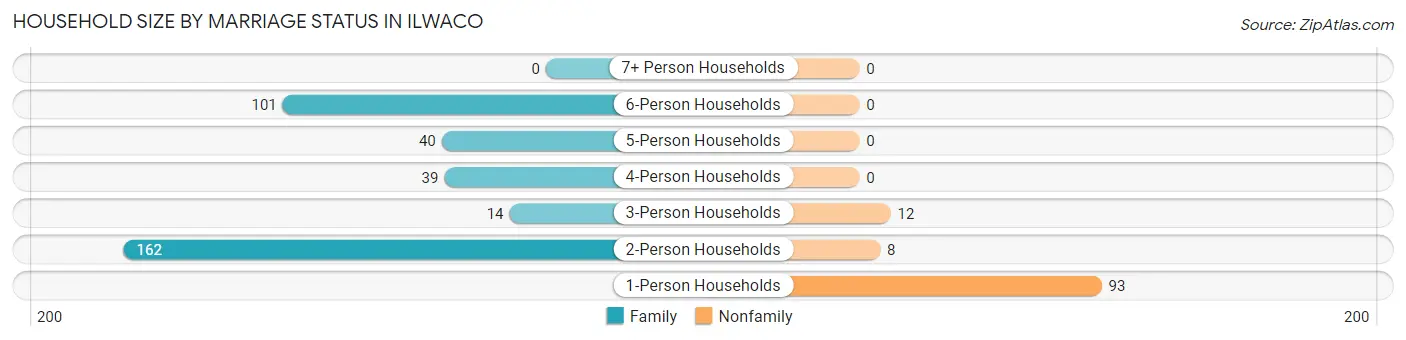
| Household Size | Family Households | Nonfamily Households |
| 1-Person Households | - | 93 (19.8%) |
| 2-Person Households | 162 (34.5%) | 8 (1.7%) |
| 3-Person Households | 14 (3.0%) | 12 (2.6%) |
| 4-Person Households | 39 (8.3%) | 0 (0.0%) |
| 5-Person Households | 40 (8.5%) | 0 (0.0%) |
| 6-Person Households | 101 (21.5%) | 0 (0.0%) |
| 7+ Person Households | 0 (0.0%) | 0 (0.0%) |
| Total | 356 (75.9%) | 113 (24.1%) |
Female Fertility in Ilwaco
Fertility by Age in Ilwaco
Average fertility rate in Ilwaco is 83.0 births per 1,000 women. Women in the age bracket of 20 to 34 years have the highest fertility rate with 100.0 births per 1,000 women. Women in the age bracket of 20 to 34 years acount for 70.4% of all women with births.
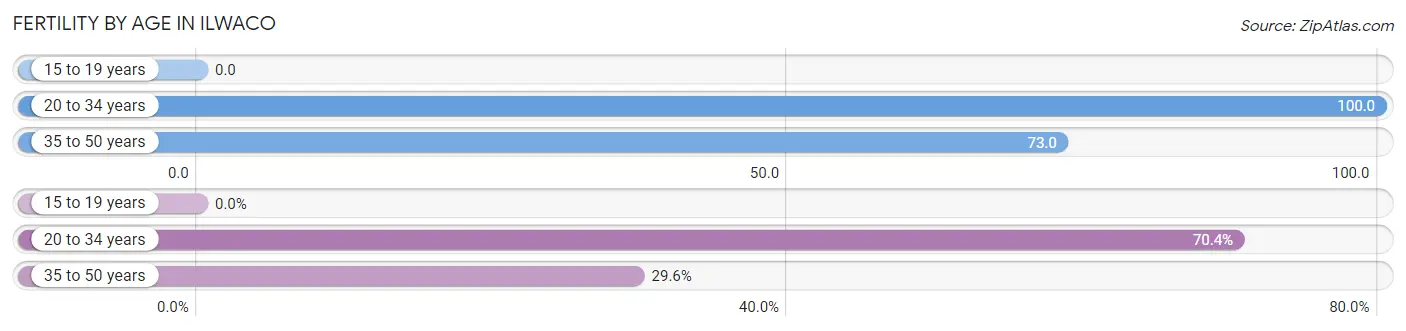
| Age Bracket | Women with Births | Births / 1,000 Women |
| 15 to 19 years | 0 (0.0%) | 0.0 |
| 20 to 34 years | 19 (70.4%) | 100.0 |
| 35 to 50 years | 8 (29.6%) | 73.0 |
| Total | 27 (100.0%) | 83.0 |
Fertility by Age by Marriage Status in Ilwaco
40.7% of women with births (27) in Ilwaco are married. The highest percentage of unmarried women with births falls into 35 to 50 years age bracket with 100.0% of them unmarried at the time of birth, while the lowest percentage of unmarried women with births belong to 20 to 34 years age bracket with 42.1% of them unmarried.
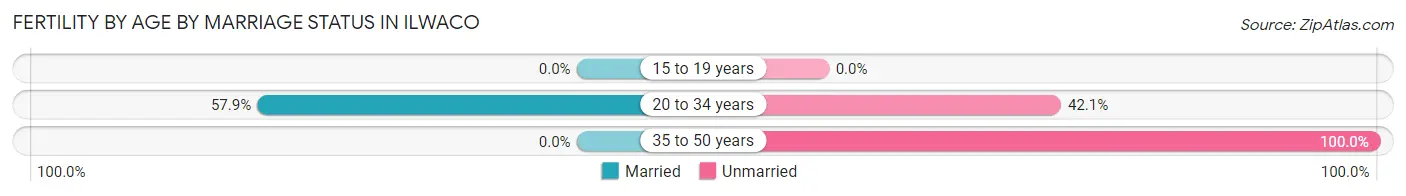
| Age Bracket | Married | Unmarried |
| 15 to 19 years | 0 (0.0%) | 0 (0.0%) |
| 20 to 34 years | 11 (57.9%) | 8 (42.1%) |
| 35 to 50 years | 0 (0.0%) | 8 (100.0%) |
| Total | 11 (40.7%) | 16 (59.3%) |
Fertility by Education in Ilwaco
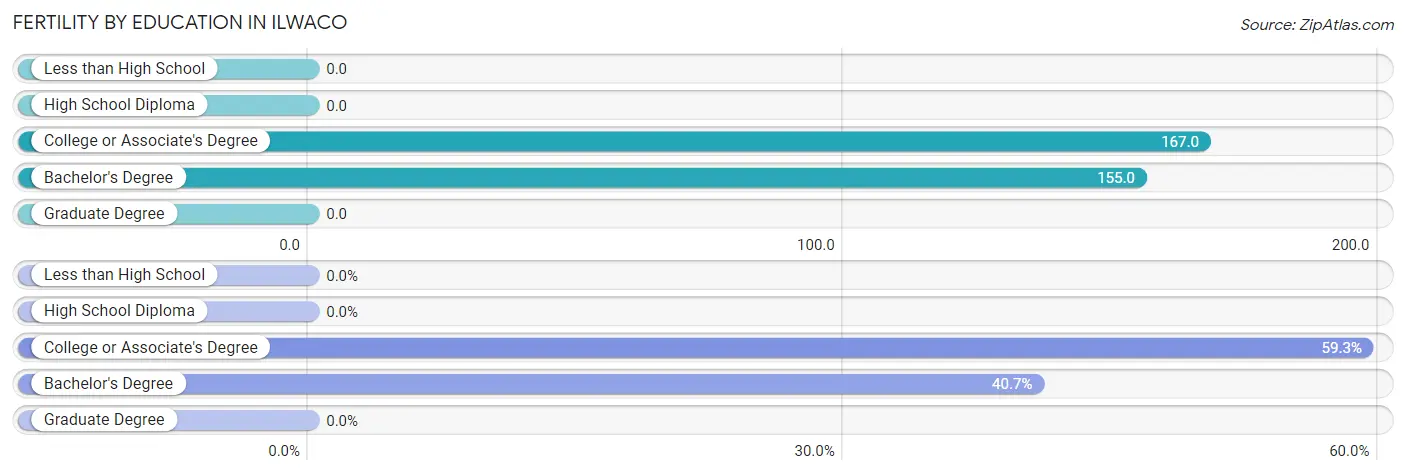
| Educational Attainment | Women with Births | Births / 1,000 Women |
| Less than High School | 0 (0.0%) | 0.0 |
| High School Diploma | 0 (0.0%) | 0.0 |
| College or Associate's Degree | 16 (59.3%) | 167.0 |
| Bachelor's Degree | 11 (40.7%) | 155.0 |
| Graduate Degree | 0 (0.0%) | 0.0 |
| Total | 27 (100.0%) | 83.0 |
Fertility by Education by Marriage Status in Ilwaco
59.3% of women with births in Ilwaco are unmarried. Women with the educational attainment of bachelor's degree are most likely to be married with 100.0% of them married at childbirth, while women with the educational attainment of college or associate's degree are least likely to be married with 100.0% of them unmarried at childbirth.
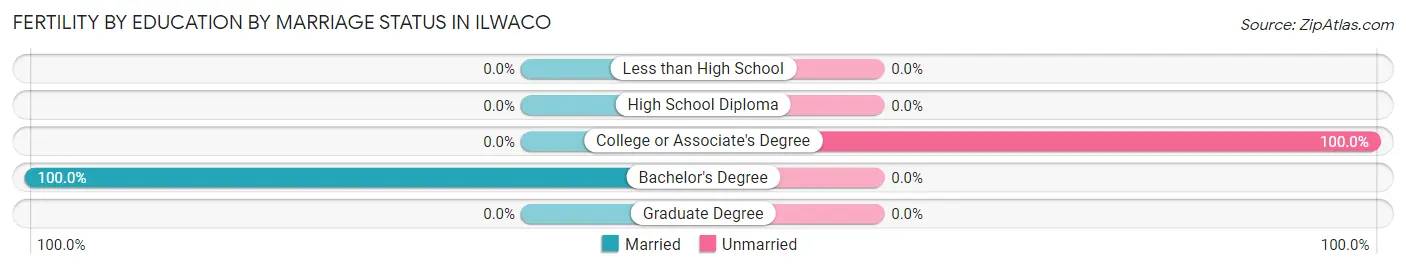
| Educational Attainment | Married | Unmarried |
| Less than High School | 0 (0.0%) | 0 (0.0%) |
| High School Diploma | 0 (0.0%) | 0 (0.0%) |
| College or Associate's Degree | 0 (0.0%) | 16 (100.0%) |
| Bachelor's Degree | 11 (100.0%) | 0 (0.0%) |
| Graduate Degree | 0 (0.0%) | 0 (0.0%) |
| Total | 11 (40.7%) | 16 (59.3%) |
Employment Characteristics in Ilwaco
Employment by Class of Employer in Ilwaco
Among the 695 employed individuals in Ilwaco, private company employees (405 | 58.3%), state government employees (68 | 9.8%), and not-for-profit organizations (65 | 9.3%) make up the most common classes of employment.
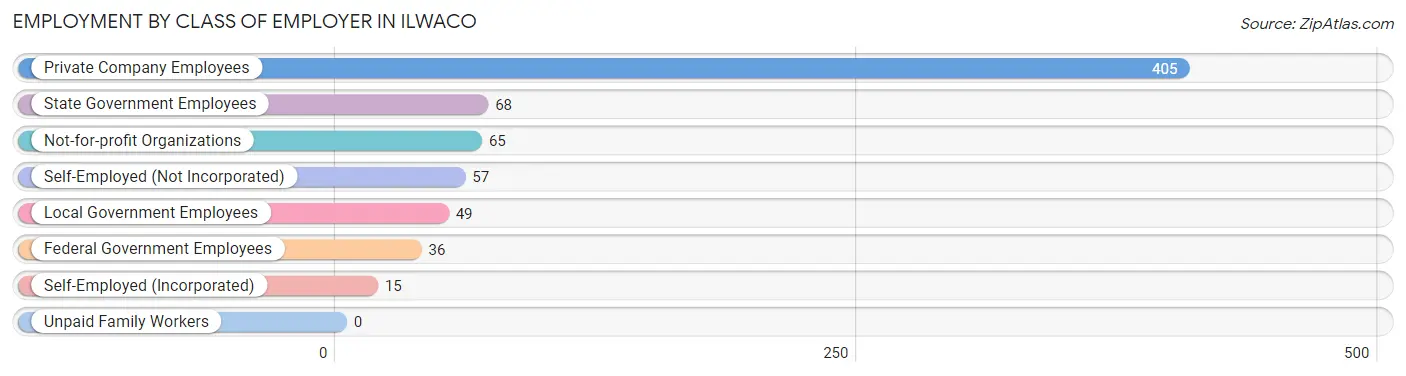
| Employer Class | # Employees | % Employees |
| Private Company Employees | 405 | 58.3% |
| Self-Employed (Incorporated) | 15 | 2.2% |
| Self-Employed (Not Incorporated) | 57 | 8.2% |
| Not-for-profit Organizations | 65 | 9.3% |
| Local Government Employees | 49 | 7.0% |
| State Government Employees | 68 | 9.8% |
| Federal Government Employees | 36 | 5.2% |
| Unpaid Family Workers | 0 | 0.0% |
| Total | 695 | 100.0% |
Employment Status by Age in Ilwaco
According to the labor force statistics for Ilwaco, out of the total population over 16 years of age (1,222), 60.1% or 734 individuals are in the labor force, with 0.6% or 4 of them unemployed. The age group with the highest labor force participation rate is 20 to 24 years, with 100.0% or 68 individuals in the labor force. Within the labor force, the 16 to 19 years age range has the highest percentage of unemployed individuals, with 12.5% or 4 of them being unemployed.
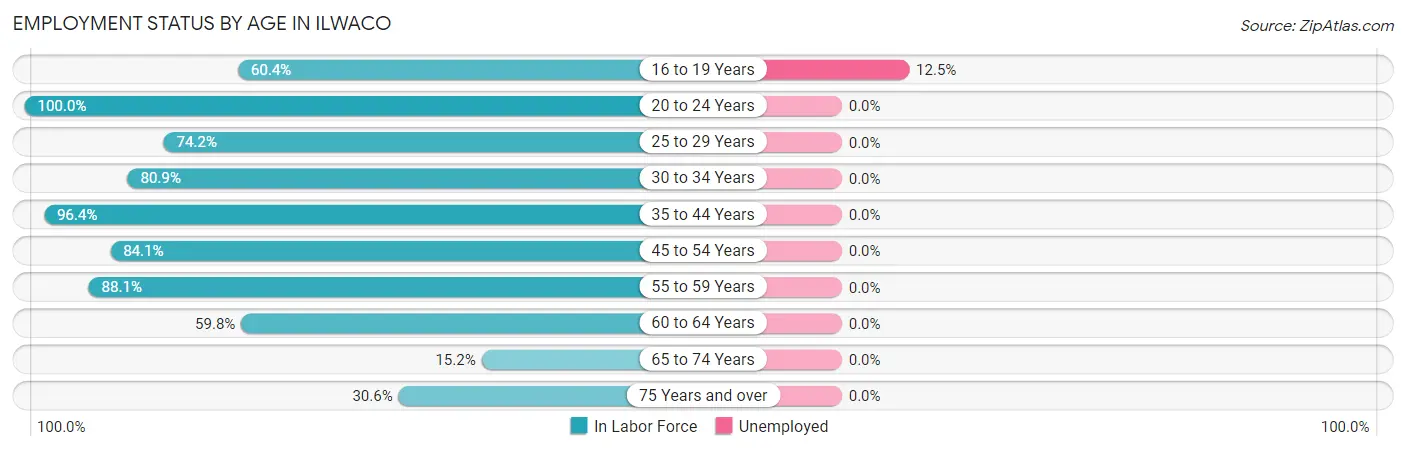
| Age Bracket | In Labor Force | Unemployed |
| 16 to 19 Years | 32 (60.4%) | 4 (12.5%) |
| 20 to 24 Years | 68 (100.0%) | 0 (0.0%) |
| 25 to 29 Years | 89 (74.2%) | 0 (0.0%) |
| 30 to 34 Years | 131 (80.9%) | 0 (0.0%) |
| 35 to 44 Years | 107 (96.4%) | 0 (0.0%) |
| 45 to 54 Years | 116 (84.1%) | 0 (0.0%) |
| 55 to 59 Years | 37 (88.1%) | 0 (0.0%) |
| 60 to 64 Years | 61 (59.8%) | 0 (0.0%) |
| 65 to 74 Years | 37 (15.2%) | 0 (0.0%) |
| 75 Years and over | 56 (30.6%) | 0 (0.0%) |
| Total | 734 (60.1%) | 4 (0.6%) |
Employment Status by Educational Attainment in Ilwaco
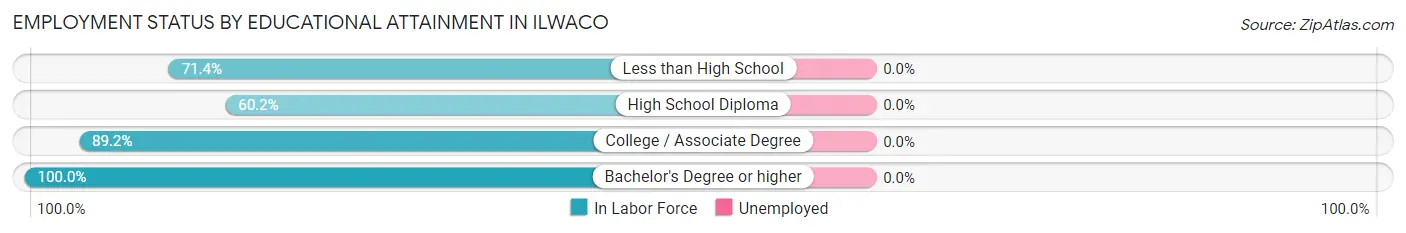
| Educational Attainment | In Labor Force | Unemployed |
| Less than High School | 60 (71.4%) | 0 (0.0%) |
| High School Diploma | 118 (60.2%) | 0 (0.0%) |
| College / Associate Degree | 265 (89.2%) | 0 (0.0%) |
| Bachelor's Degree or higher | 98 (100.0%) | 0 (0.0%) |
| Total | 541 (80.1%) | 0 (0.0%) |
Employment Occupations by Sex in Ilwaco
Management, Business, Science and Arts Occupations
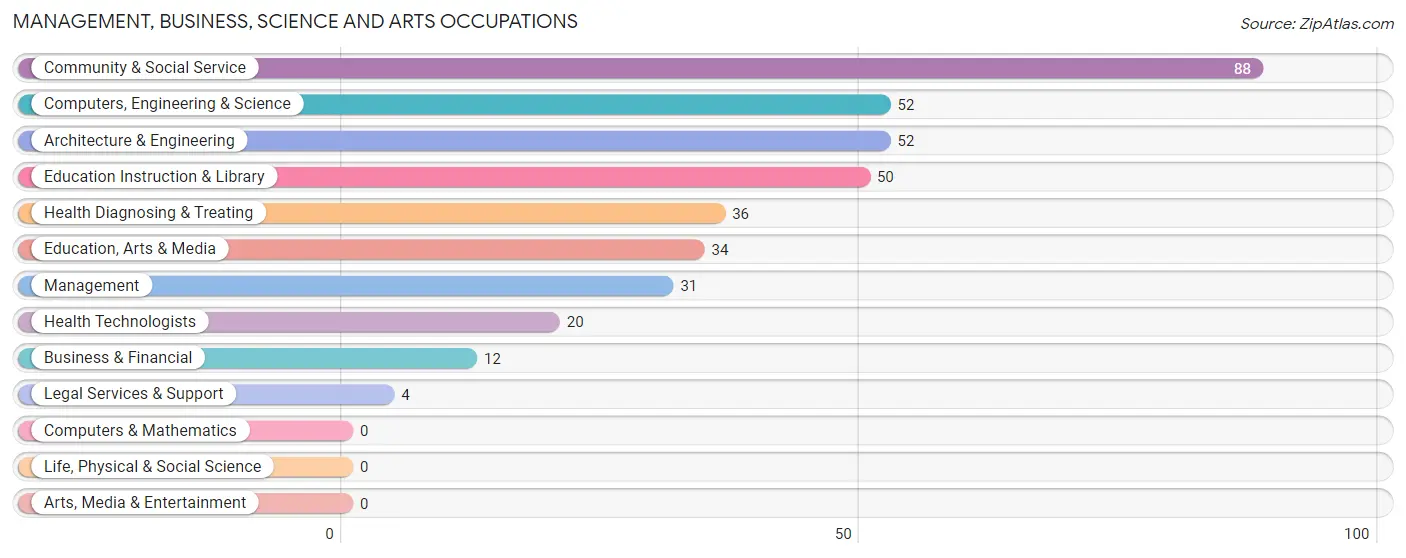
The most common Management, Business, Science and Arts occupations in Ilwaco are Community & Social Service (88 | 12.2%), Computers, Engineering & Science (52 | 7.2%), Architecture & Engineering (52 | 7.2%), Education Instruction & Library (50 | 6.9%), and Health Diagnosing & Treating (36 | 5.0%).
Management, Business, Science and Arts Occupations by Sex
Within the Management, Business, Science and Arts occupations in Ilwaco, the most male-oriented occupations are Business & Financial (100.0%), Computers, Engineering & Science (100.0%), and Architecture & Engineering (100.0%), while the most female-oriented occupations are Legal Services & Support (100.0%), Education Instruction & Library (100.0%), and Health Diagnosing & Treating (100.0%).
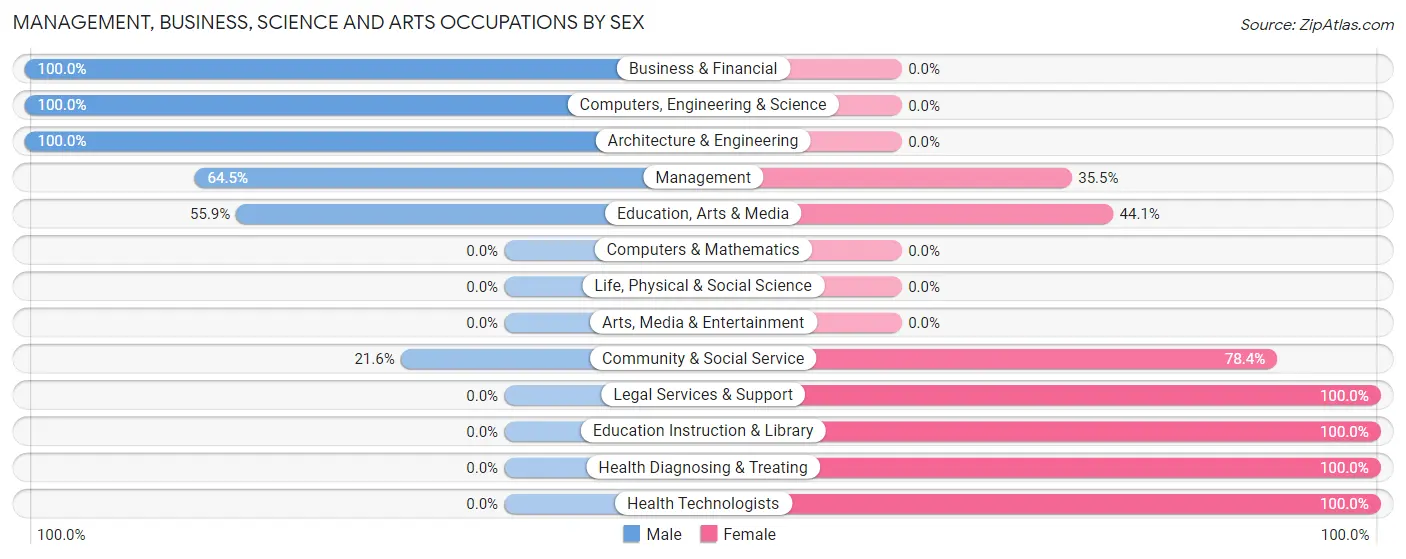
| Occupation | Male | Female |
| Management | 20 (64.5%) | 11 (35.5%) |
| Business & Financial | 12 (100.0%) | 0 (0.0%) |
| Computers, Engineering & Science | 52 (100.0%) | 0 (0.0%) |
| Computers & Mathematics | 0 (0.0%) | 0 (0.0%) |
| Architecture & Engineering | 52 (100.0%) | 0 (0.0%) |
| Life, Physical & Social Science | 0 (0.0%) | 0 (0.0%) |
| Community & Social Service | 19 (21.6%) | 69 (78.4%) |
| Education, Arts & Media | 19 (55.9%) | 15 (44.1%) |
| Legal Services & Support | 0 (0.0%) | 4 (100.0%) |
| Education Instruction & Library | 0 (0.0%) | 50 (100.0%) |
| Arts, Media & Entertainment | 0 (0.0%) | 0 (0.0%) |
| Health Diagnosing & Treating | 0 (0.0%) | 36 (100.0%) |
| Health Technologists | 0 (0.0%) | 20 (100.0%) |
| Total (Category) | 103 (47.0%) | 116 (53.0%) |
| Total (Overall) | 396 (54.8%) | 326 (45.2%) |
Services Occupations
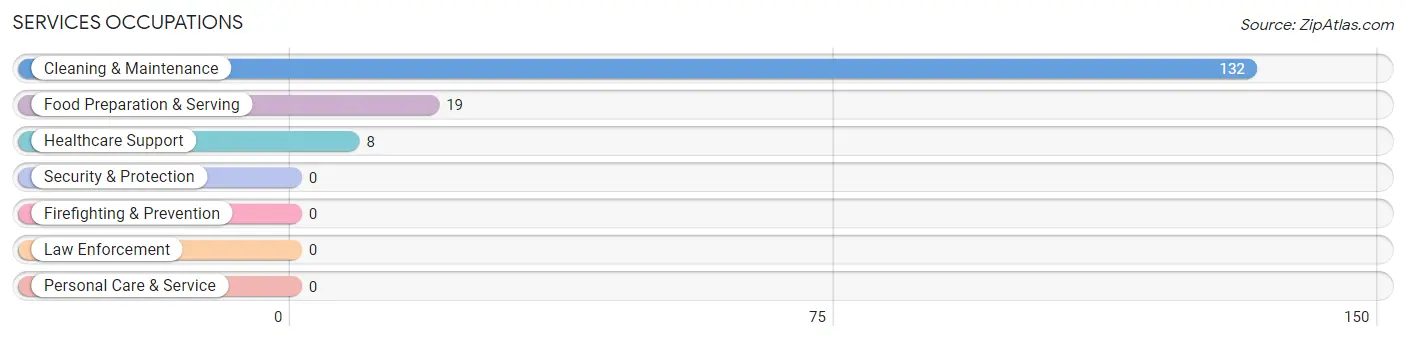
The most common Services occupations in Ilwaco are Cleaning & Maintenance (132 | 18.3%), Food Preparation & Serving (19 | 2.6%), and Healthcare Support (8 | 1.1%).
Services Occupations by Sex
Within the Services occupations in Ilwaco, the most male-oriented occupations are Food Preparation & Serving (100.0%), and Cleaning & Maintenance (24.2%), while the most female-oriented occupations are Healthcare Support (100.0%), and Cleaning & Maintenance (75.8%).
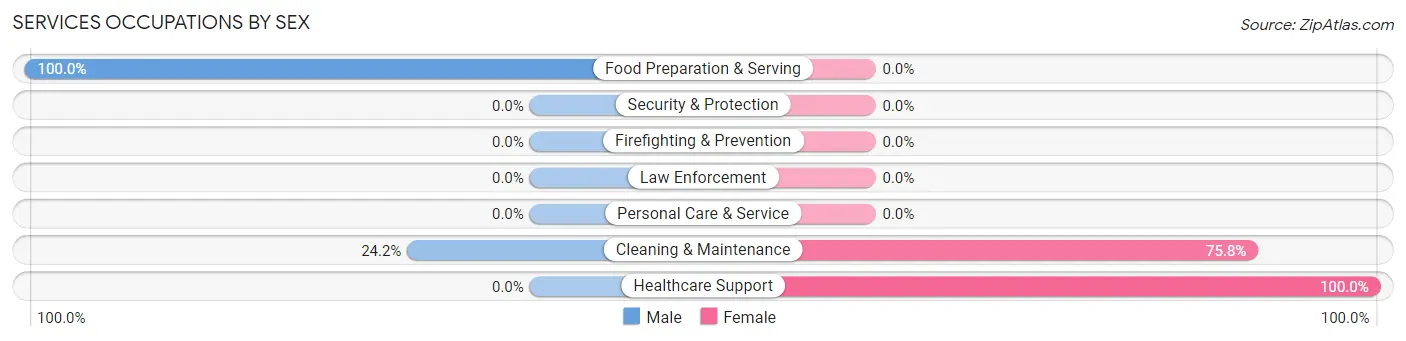
| Occupation | Male | Female |
| Healthcare Support | 0 (0.0%) | 8 (100.0%) |
| Security & Protection | 0 (0.0%) | 0 (0.0%) |
| Firefighting & Prevention | 0 (0.0%) | 0 (0.0%) |
| Law Enforcement | 0 (0.0%) | 0 (0.0%) |
| Food Preparation & Serving | 19 (100.0%) | 0 (0.0%) |
| Cleaning & Maintenance | 32 (24.2%) | 100 (75.8%) |
| Personal Care & Service | 0 (0.0%) | 0 (0.0%) |
| Total (Category) | 51 (32.1%) | 108 (67.9%) |
| Total (Overall) | 396 (54.8%) | 326 (45.2%) |
Sales and Office Occupations
The most common Sales and Office occupations in Ilwaco are Sales & Related (87 | 12.0%), and Office & Administration (72 | 10.0%).

Sales and Office Occupations by Sex

| Occupation | Male | Female |
| Sales & Related | 46 (52.9%) | 41 (47.1%) |
| Office & Administration | 11 (15.3%) | 61 (84.7%) |
| Total (Category) | 57 (35.8%) | 102 (64.1%) |
| Total (Overall) | 396 (54.8%) | 326 (45.2%) |
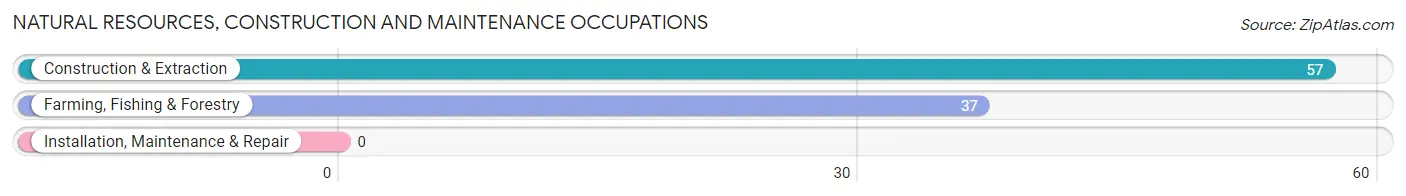
Natural Resources, Construction and Maintenance Occupations
The most common Natural Resources, Construction and Maintenance occupations in Ilwaco are Construction & Extraction (57 | 7.9%), and Farming, Fishing & Forestry (37 | 5.1%).
Natural Resources, Construction and Maintenance Occupations by Sex
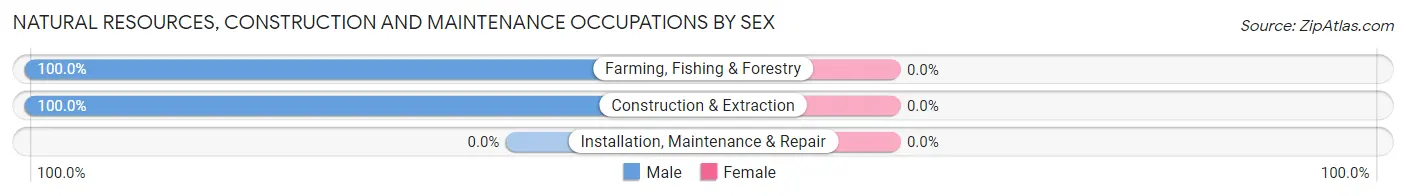
| Occupation | Male | Female |
| Farming, Fishing & Forestry | 37 (100.0%) | 0 (0.0%) |
| Construction & Extraction | 57 (100.0%) | 0 (0.0%) |
| Installation, Maintenance & Repair | 0 (0.0%) | 0 (0.0%) |
| Total (Category) | 94 (100.0%) | 0 (0.0%) |
| Total (Overall) | 396 (54.8%) | 326 (45.2%) |
Production, Transportation and Moving Occupations
The most common Production, Transportation and Moving occupations in Ilwaco are Transportation (38 | 5.3%), Production (30 | 4.2%), and Material Moving (23 | 3.2%).
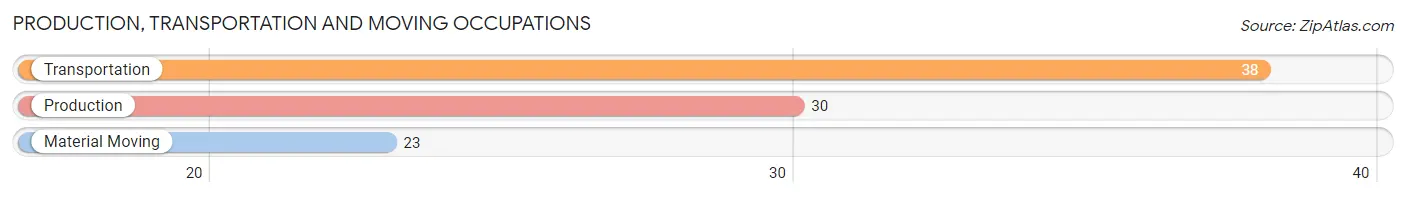
Production, Transportation and Moving Occupations by Sex
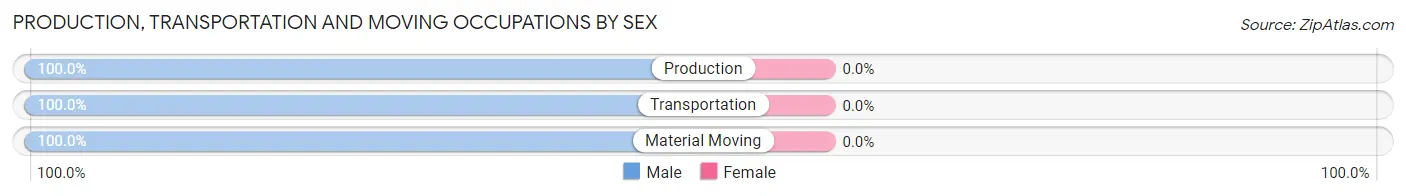
| Occupation | Male | Female |
| Production | 30 (100.0%) | 0 (0.0%) |
| Transportation | 38 (100.0%) | 0 (0.0%) |
| Material Moving | 23 (100.0%) | 0 (0.0%) |
| Total (Category) | 91 (100.0%) | 0 (0.0%) |
| Total (Overall) | 396 (54.8%) | 326 (45.2%) |
Employment Industries by Sex in Ilwaco
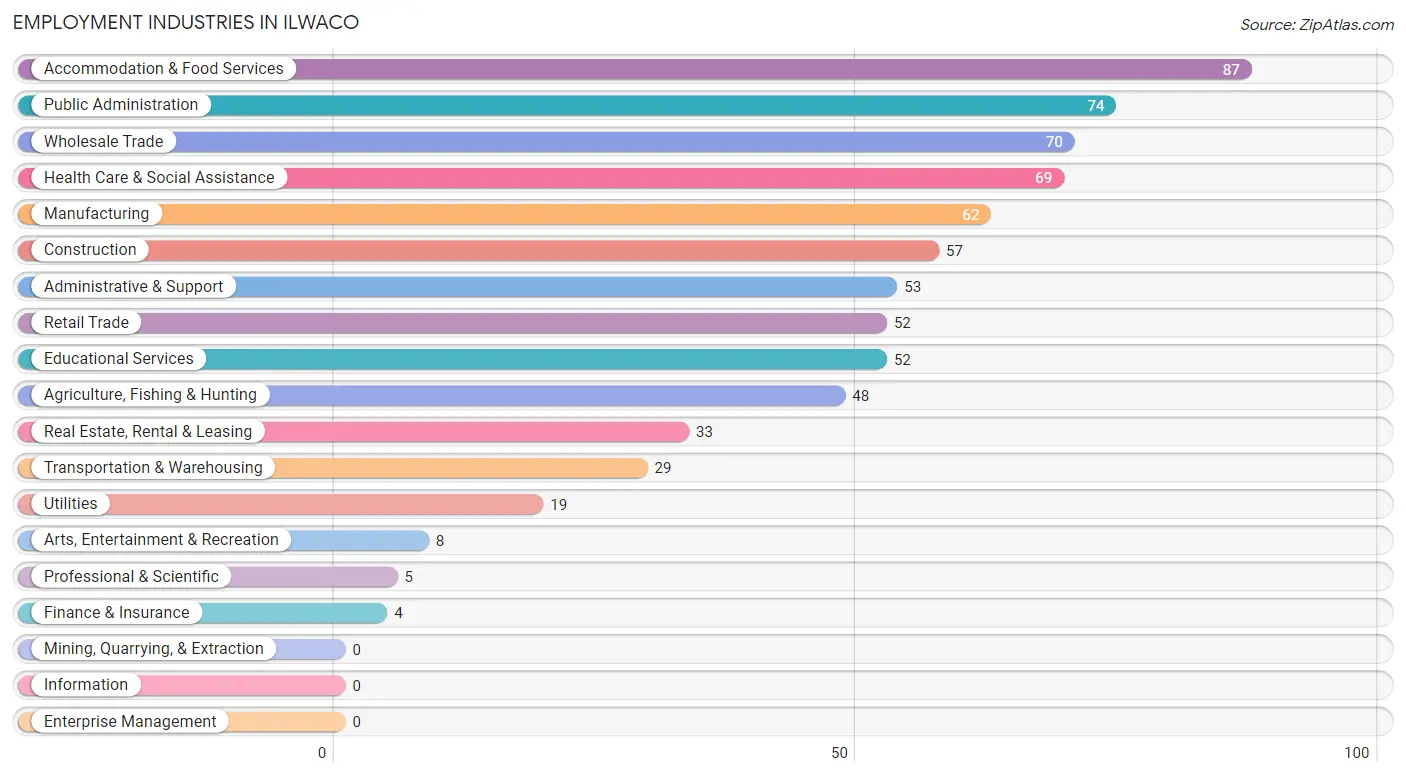
Employment Industries in Ilwaco
The major employment industries in Ilwaco include Accommodation & Food Services (87 | 12.0%), Public Administration (74 | 10.2%), Wholesale Trade (70 | 9.7%), Health Care & Social Assistance (69 | 9.6%), and Manufacturing (62 | 8.6%).
Employment Industries by Sex in Ilwaco
The Ilwaco industries that see more men than women are Agriculture, Fishing & Hunting (100.0%), Construction (100.0%), and Manufacturing (100.0%), whereas the industries that tend to have a higher number of women are Finance & Insurance (100.0%), Professional & Scientific (100.0%), and Arts, Entertainment & Recreation (100.0%).
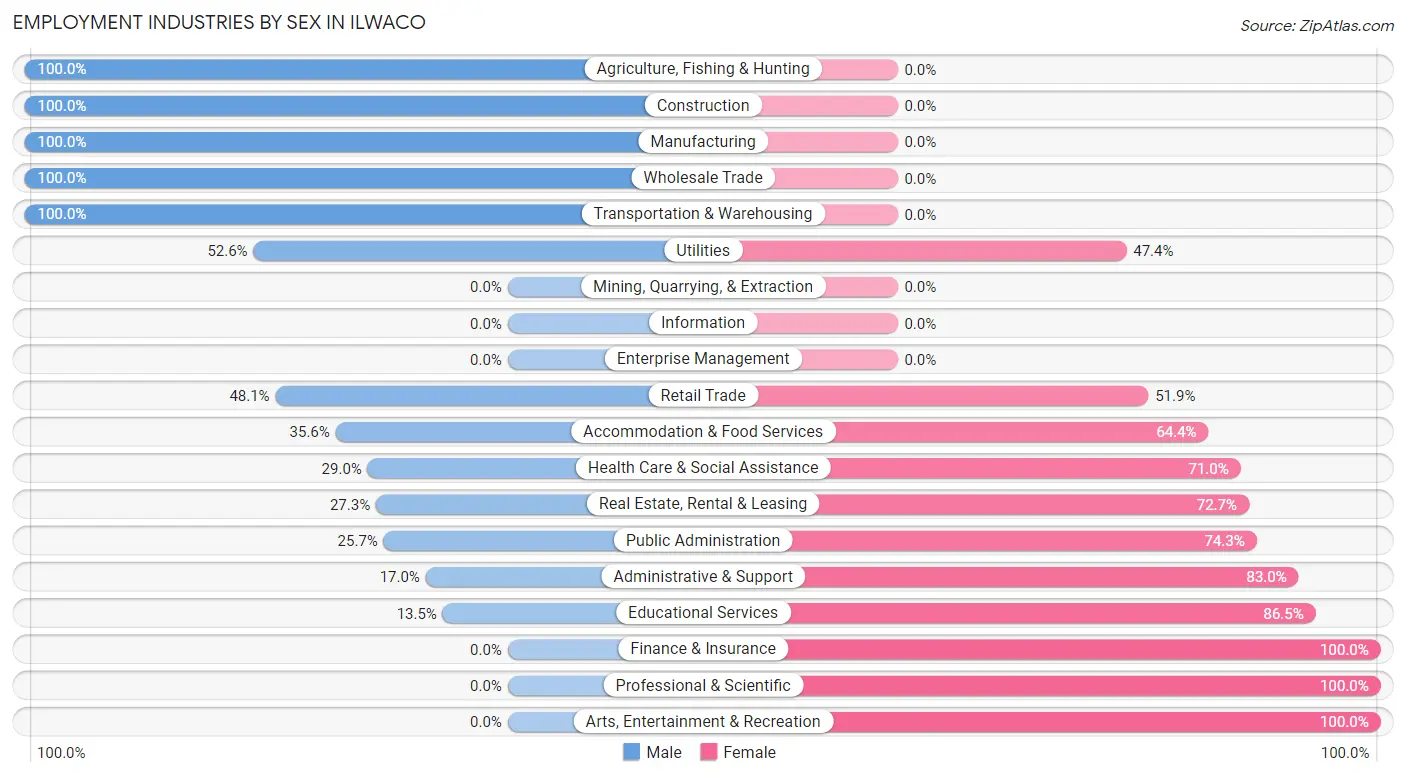
| Industry | Male | Female |
| Agriculture, Fishing & Hunting | 48 (100.0%) | 0 (0.0%) |
| Mining, Quarrying, & Extraction | 0 (0.0%) | 0 (0.0%) |
| Construction | 57 (100.0%) | 0 (0.0%) |
| Manufacturing | 62 (100.0%) | 0 (0.0%) |
| Wholesale Trade | 70 (100.0%) | 0 (0.0%) |
| Retail Trade | 25 (48.1%) | 27 (51.9%) |
| Transportation & Warehousing | 29 (100.0%) | 0 (0.0%) |
| Utilities | 10 (52.6%) | 9 (47.4%) |
| Information | 0 (0.0%) | 0 (0.0%) |
| Finance & Insurance | 0 (0.0%) | 4 (100.0%) |
| Real Estate, Rental & Leasing | 9 (27.3%) | 24 (72.7%) |
| Professional & Scientific | 0 (0.0%) | 5 (100.0%) |
| Enterprise Management | 0 (0.0%) | 0 (0.0%) |
| Administrative & Support | 9 (17.0%) | 44 (83.0%) |
| Educational Services | 7 (13.5%) | 45 (86.5%) |
| Health Care & Social Assistance | 20 (29.0%) | 49 (71.0%) |
| Arts, Entertainment & Recreation | 0 (0.0%) | 8 (100.0%) |
| Accommodation & Food Services | 31 (35.6%) | 56 (64.4%) |
| Public Administration | 19 (25.7%) | 55 (74.3%) |
| Total | 396 (54.8%) | 326 (45.2%) |
Education in Ilwaco
School Enrollment in Ilwaco
The most common levels of schooling among the 276 students in Ilwaco are college / undergraduate (93 | 33.7%), middle school (55 | 19.9%), and elementary school (53 | 19.2%).
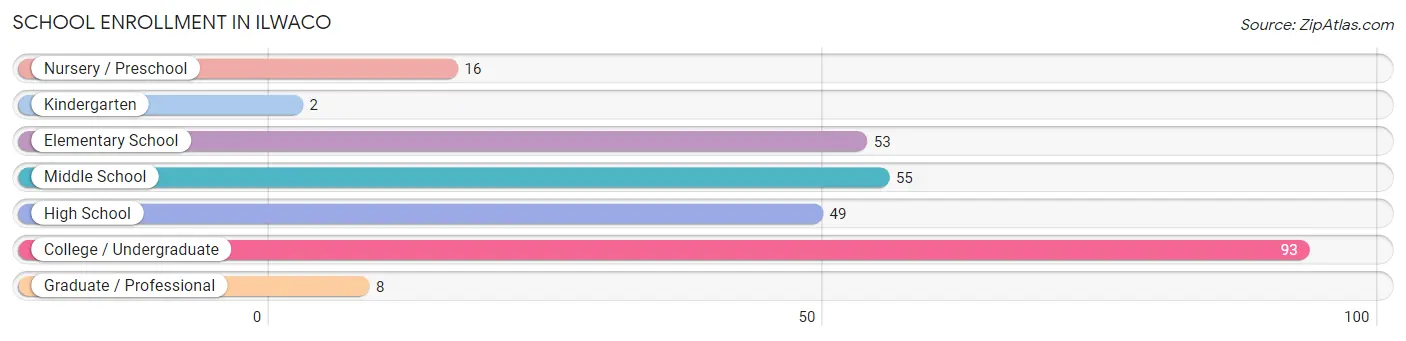
| School Level | # Students | % Students |
| Nursery / Preschool | 16 | 5.8% |
| Kindergarten | 2 | 0.7% |
| Elementary School | 53 | 19.2% |
| Middle School | 55 | 19.9% |
| High School | 49 | 17.7% |
| College / Undergraduate | 93 | 33.7% |
| Graduate / Professional | 8 | 2.9% |
| Total | 276 | 100.0% |
School Enrollment by Age by Funding Source in Ilwaco
Out of a total of 276 students who are enrolled in schools in Ilwaco, 9 (3.3%) attend a private institution, while the remaining 267 (96.7%) are enrolled in public schools. The age group of 25 to 34 year olds has the highest likelihood of being enrolled in private schools, with 4 (16.7% in the age bracket) enrolled. Conversely, the age group of 10 to 14 year olds has the lowest likelihood of being enrolled in a private school, with 55 (100.0% in the age bracket) attending a public institution.
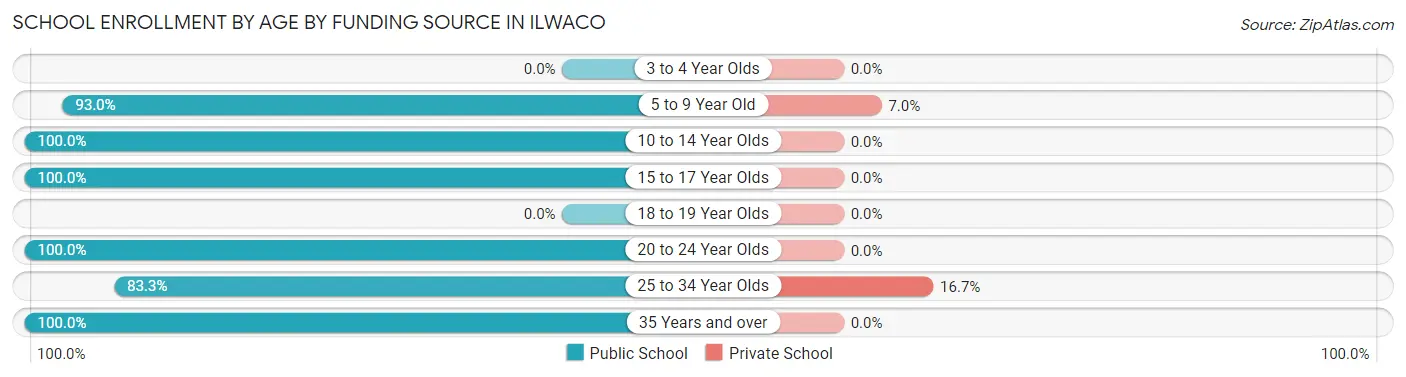
| Age Bracket | Public School | Private School |
| 3 to 4 Year Olds | 0 (0.0%) | 0 (0.0%) |
| 5 to 9 Year Old | 66 (93.0%) | 5 (7.0%) |
| 10 to 14 Year Olds | 55 (100.0%) | 0 (0.0%) |
| 15 to 17 Year Olds | 64 (100.0%) | 0 (0.0%) |
| 18 to 19 Year Olds | 0 (0.0%) | 0 (0.0%) |
| 20 to 24 Year Olds | 45 (100.0%) | 0 (0.0%) |
| 25 to 34 Year Olds | 20 (83.3%) | 4 (16.7%) |
| 35 Years and over | 17 (100.0%) | 0 (0.0%) |
| Total | 267 (96.7%) | 9 (3.3%) |
Educational Attainment by Field of Study in Ilwaco
Education (55 | 18.1%), bio, nature & agricultural (50 | 16.5%), liberal arts & history (43 | 14.2%), business (42 | 13.9%), and social sciences (39 | 12.9%) are the most common fields of study among 303 individuals in Ilwaco who have obtained a bachelor's degree or higher.
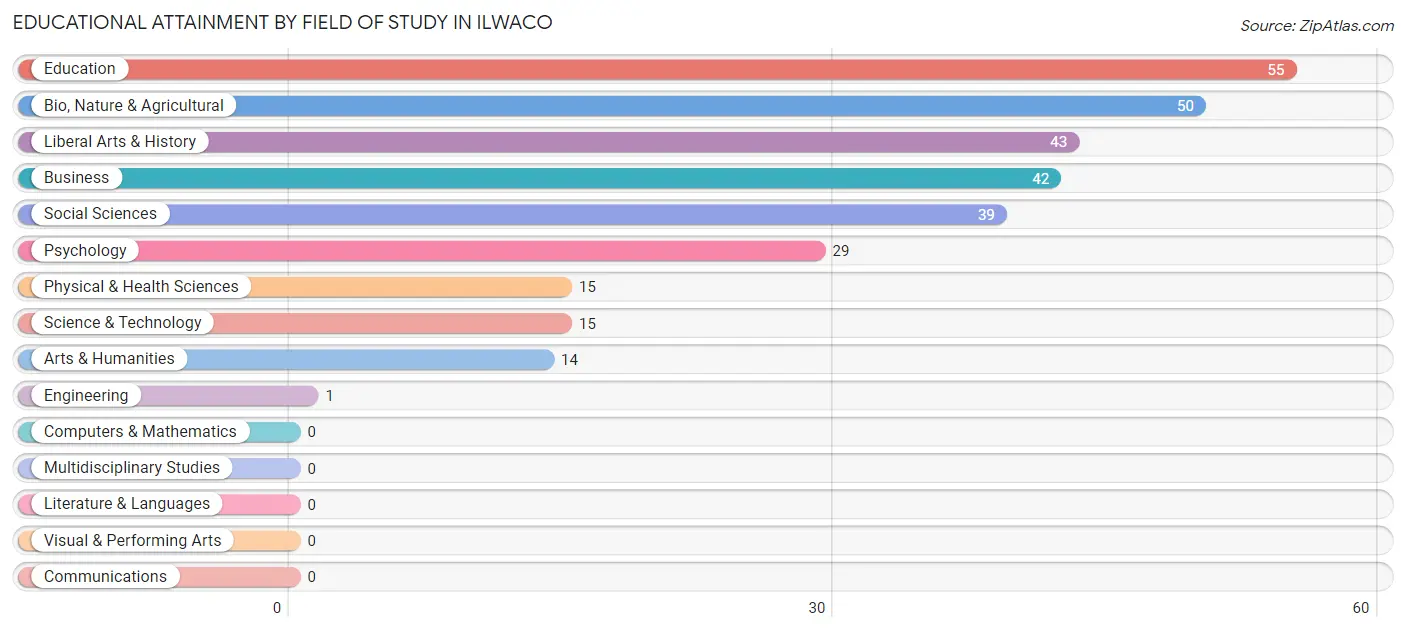
| Field of Study | # Graduates | % Graduates |
| Computers & Mathematics | 0 | 0.0% |
| Bio, Nature & Agricultural | 50 | 16.5% |
| Physical & Health Sciences | 15 | 5.0% |
| Psychology | 29 | 9.6% |
| Social Sciences | 39 | 12.9% |
| Engineering | 1 | 0.3% |
| Multidisciplinary Studies | 0 | 0.0% |
| Science & Technology | 15 | 5.0% |
| Business | 42 | 13.9% |
| Education | 55 | 18.1% |
| Literature & Languages | 0 | 0.0% |
| Liberal Arts & History | 43 | 14.2% |
| Visual & Performing Arts | 0 | 0.0% |
| Communications | 0 | 0.0% |
| Arts & Humanities | 14 | 4.6% |
| Total | 303 | 100.0% |
Transportation & Commute in Ilwaco
Vehicle Availability by Sex in Ilwaco
The most prevalent vehicle ownership categories in Ilwaco are males with 4 vehicles (130, accounting for 32.9%) and females with 4 vehicles (86, making up 43.3%).
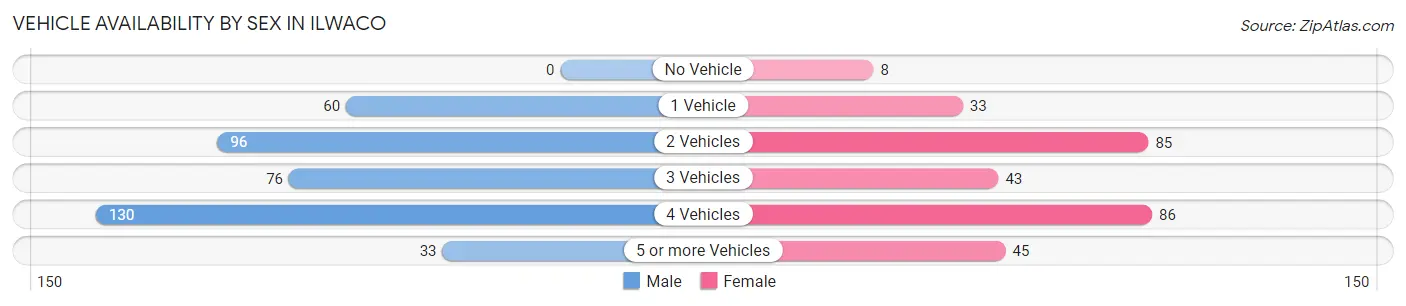
| Vehicles Available | Male | Female |
| No Vehicle | 0 (0.0%) | 8 (2.7%) |
| 1 Vehicle | 60 (15.2%) | 33 (11.0%) |
| 2 Vehicles | 96 (24.3%) | 85 (28.3%) |
| 3 Vehicles | 76 (19.2%) | 43 (14.3%) |
| 4 Vehicles | 130 (32.9%) | 86 (28.7%) |
| 5 or more Vehicles | 33 (8.4%) | 45 (15.0%) |
| Total | 395 (100.0%) | 300 (100.0%) |
Commute Time in Ilwaco
The most frequently occuring commute durations in Ilwaco are less than 5 minutes (150 commuters, 22.5%), 10 to 14 minutes (131 commuters, 19.6%), and 5 to 9 minutes (123 commuters, 18.4%).
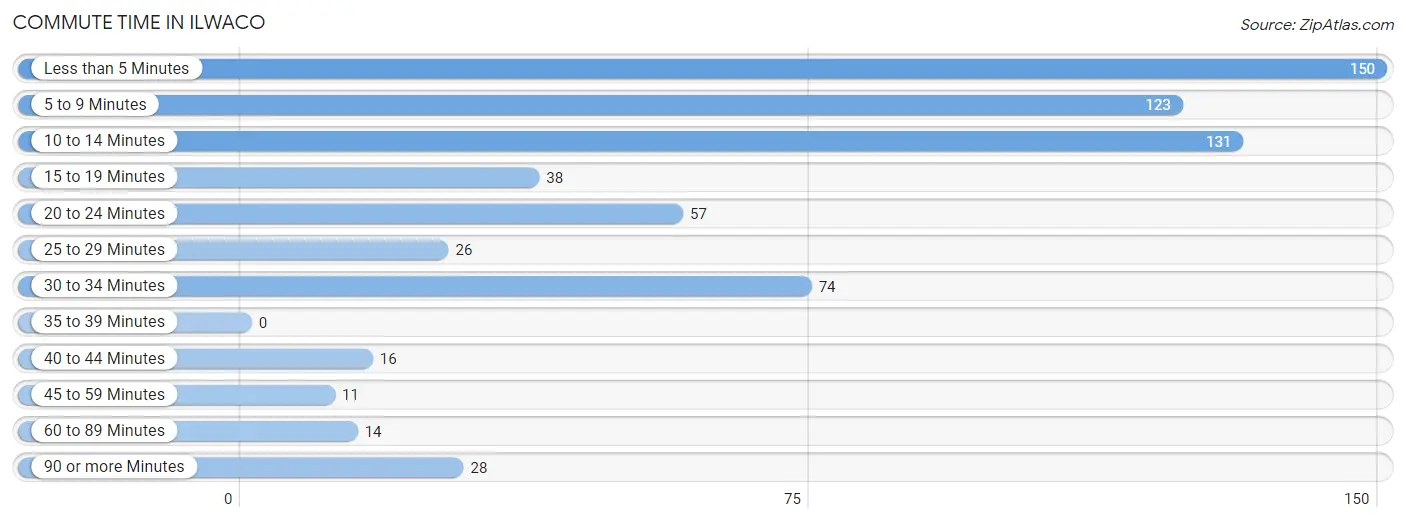
| Commute Time | # Commuters | % Commuters |
| Less than 5 Minutes | 150 | 22.5% |
| 5 to 9 Minutes | 123 | 18.4% |
| 10 to 14 Minutes | 131 | 19.6% |
| 15 to 19 Minutes | 38 | 5.7% |
| 20 to 24 Minutes | 57 | 8.5% |
| 25 to 29 Minutes | 26 | 3.9% |
| 30 to 34 Minutes | 74 | 11.1% |
| 35 to 39 Minutes | 0 | 0.0% |
| 40 to 44 Minutes | 16 | 2.4% |
| 45 to 59 Minutes | 11 | 1.7% |
| 60 to 89 Minutes | 14 | 2.1% |
| 90 or more Minutes | 28 | 4.2% |
Commute Time by Sex in Ilwaco
The most common commute times in Ilwaco are less than 5 minutes (95 commuters, 25.3%) for males and 10 to 14 minutes (106 commuters, 36.3%) for females.
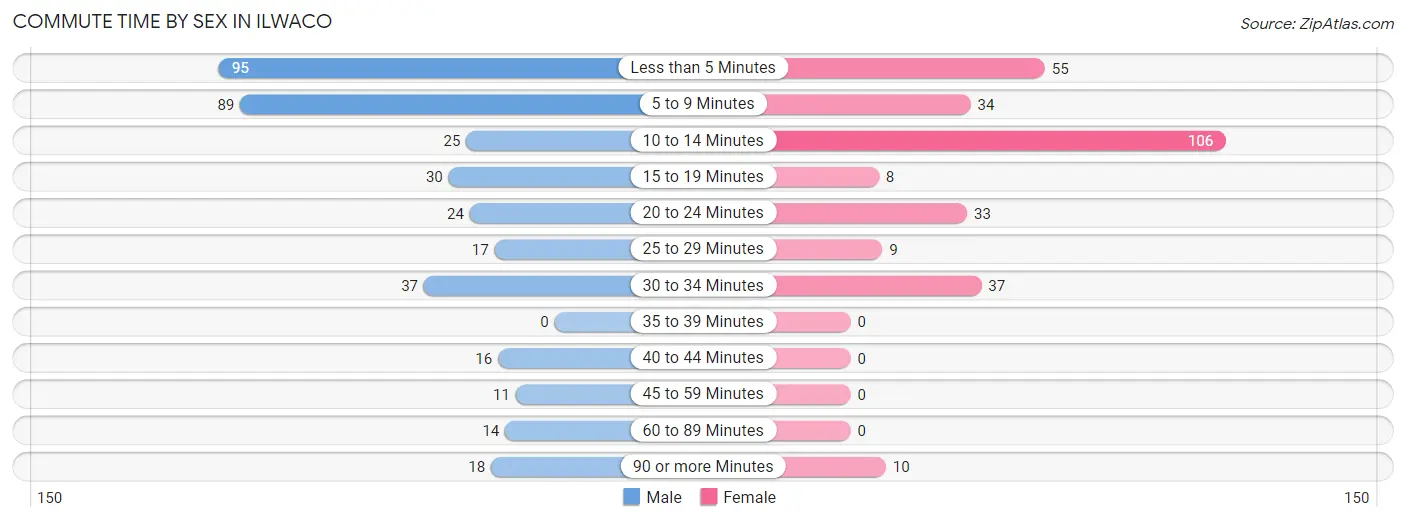
| Commute Time | Male | Female |
| Less than 5 Minutes | 95 (25.3%) | 55 (18.8%) |
| 5 to 9 Minutes | 89 (23.7%) | 34 (11.6%) |
| 10 to 14 Minutes | 25 (6.7%) | 106 (36.3%) |
| 15 to 19 Minutes | 30 (8.0%) | 8 (2.7%) |
| 20 to 24 Minutes | 24 (6.4%) | 33 (11.3%) |
| 25 to 29 Minutes | 17 (4.5%) | 9 (3.1%) |
| 30 to 34 Minutes | 37 (9.8%) | 37 (12.7%) |
| 35 to 39 Minutes | 0 (0.0%) | 0 (0.0%) |
| 40 to 44 Minutes | 16 (4.3%) | 0 (0.0%) |
| 45 to 59 Minutes | 11 (2.9%) | 0 (0.0%) |
| 60 to 89 Minutes | 14 (3.7%) | 0 (0.0%) |
| 90 or more Minutes | 18 (4.8%) | 10 (3.4%) |
Time of Departure to Work by Sex in Ilwaco
The most frequent times of departure to work in Ilwaco are 4:00 PM to 11:59 PM (69, 18.3%) for males and 9:00 AM to 9:59 AM (119, 40.7%) for females.
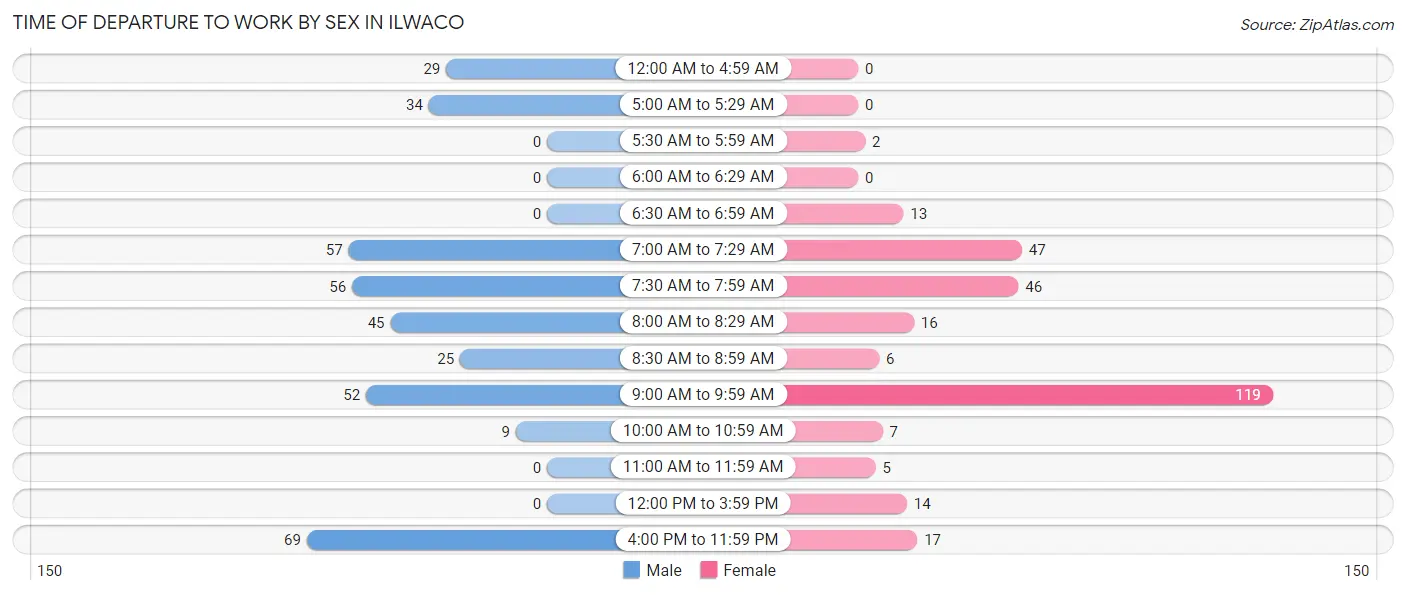
| Time of Departure | Male | Female |
| 12:00 AM to 4:59 AM | 29 (7.7%) | 0 (0.0%) |
| 5:00 AM to 5:29 AM | 34 (9.0%) | 0 (0.0%) |
| 5:30 AM to 5:59 AM | 0 (0.0%) | 2 (0.7%) |
| 6:00 AM to 6:29 AM | 0 (0.0%) | 0 (0.0%) |
| 6:30 AM to 6:59 AM | 0 (0.0%) | 13 (4.4%) |
| 7:00 AM to 7:29 AM | 57 (15.2%) | 47 (16.1%) |
| 7:30 AM to 7:59 AM | 56 (14.9%) | 46 (15.8%) |
| 8:00 AM to 8:29 AM | 45 (12.0%) | 16 (5.5%) |
| 8:30 AM to 8:59 AM | 25 (6.7%) | 6 (2.1%) |
| 9:00 AM to 9:59 AM | 52 (13.8%) | 119 (40.7%) |
| 10:00 AM to 10:59 AM | 9 (2.4%) | 7 (2.4%) |
| 11:00 AM to 11:59 AM | 0 (0.0%) | 5 (1.7%) |
| 12:00 PM to 3:59 PM | 0 (0.0%) | 14 (4.8%) |
| 4:00 PM to 11:59 PM | 69 (18.3%) | 17 (5.8%) |
| Total | 376 (100.0%) | 292 (100.0%) |
Housing Occupancy in Ilwaco
Occupancy by Ownership in Ilwaco
Of the total 469 dwellings in Ilwaco, owner-occupied units account for 317 (67.6%), while renter-occupied units make up 152 (32.4%).
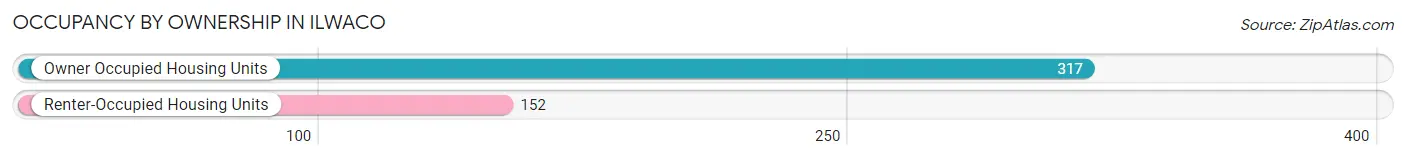
| Occupancy | # Housing Units | % Housing Units |
| Owner Occupied Housing Units | 317 | 67.6% |
| Renter-Occupied Housing Units | 152 | 32.4% |
| Total Occupied Housing Units | 469 | 100.0% |
Occupancy by Household Size in Ilwaco
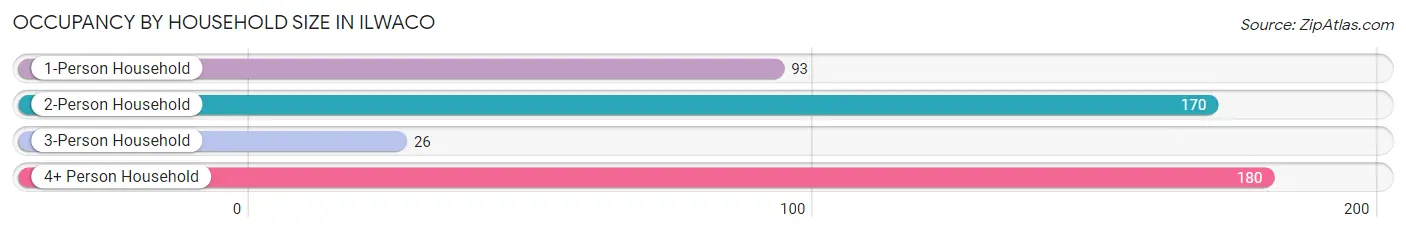
| Household Size | # Housing Units | % Housing Units |
| 1-Person Household | 93 | 19.8% |
| 2-Person Household | 170 | 36.2% |
| 3-Person Household | 26 | 5.5% |
| 4+ Person Household | 180 | 38.4% |
| Total Housing Units | 469 | 100.0% |
Occupancy by Ownership by Household Size in Ilwaco
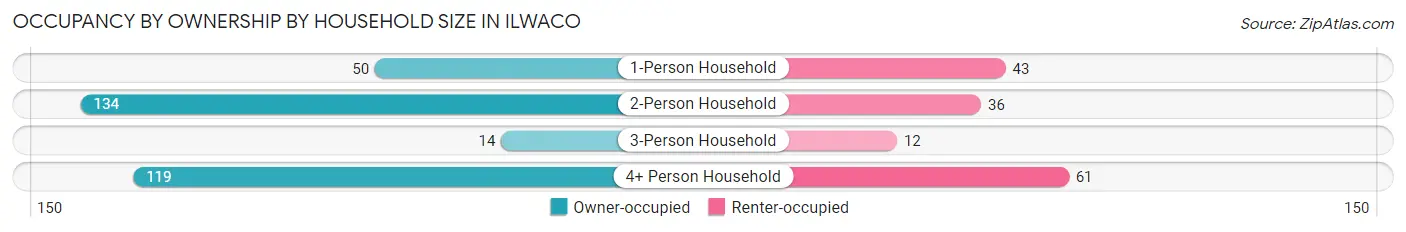
| Household Size | Owner-occupied | Renter-occupied |
| 1-Person Household | 50 (53.8%) | 43 (46.2%) |
| 2-Person Household | 134 (78.8%) | 36 (21.2%) |
| 3-Person Household | 14 (53.8%) | 12 (46.2%) |
| 4+ Person Household | 119 (66.1%) | 61 (33.9%) |
| Total Housing Units | 317 (67.6%) | 152 (32.4%) |
Occupancy by Educational Attainment in Ilwaco
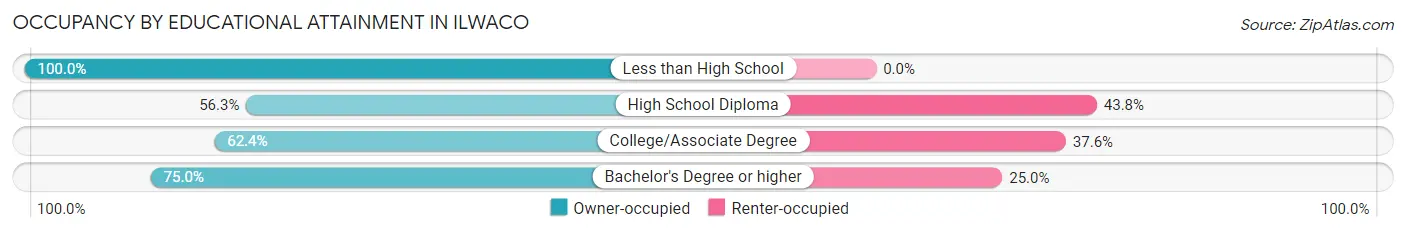
| Household Size | Owner-occupied | Renter-occupied |
| Less than High School | 35 (100.0%) | 0 (0.0%) |
| High School Diploma | 54 (56.2%) | 42 (43.8%) |
| College/Associate Degree | 126 (62.4%) | 76 (37.6%) |
| Bachelor's Degree or higher | 102 (75.0%) | 34 (25.0%) |
Occupancy by Age of Householder in Ilwaco
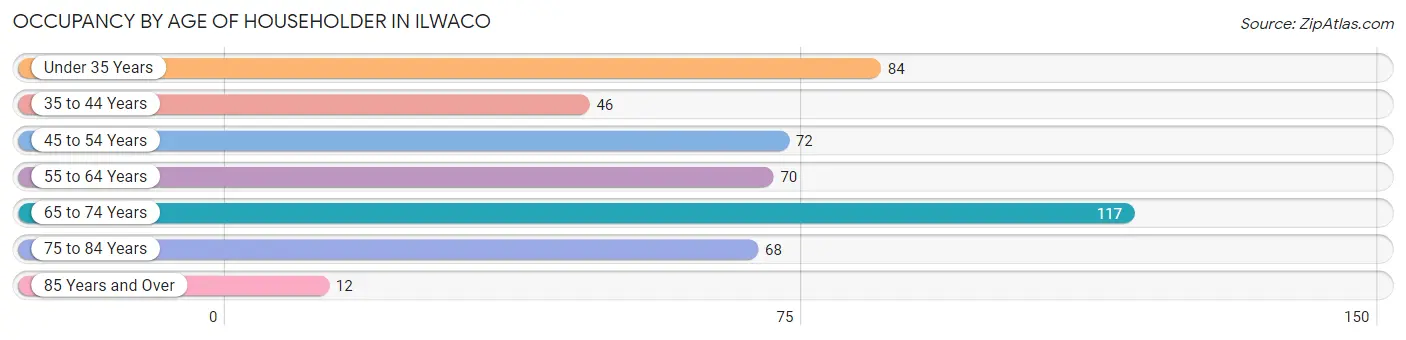
| Age Bracket | # Households | % Households |
| Under 35 Years | 84 | 17.9% |
| 35 to 44 Years | 46 | 9.8% |
| 45 to 54 Years | 72 | 15.3% |
| 55 to 64 Years | 70 | 14.9% |
| 65 to 74 Years | 117 | 24.9% |
| 75 to 84 Years | 68 | 14.5% |
| 85 Years and Over | 12 | 2.6% |
| Total | 469 | 100.0% |
Housing Finances in Ilwaco
Median Income by Occupancy in Ilwaco
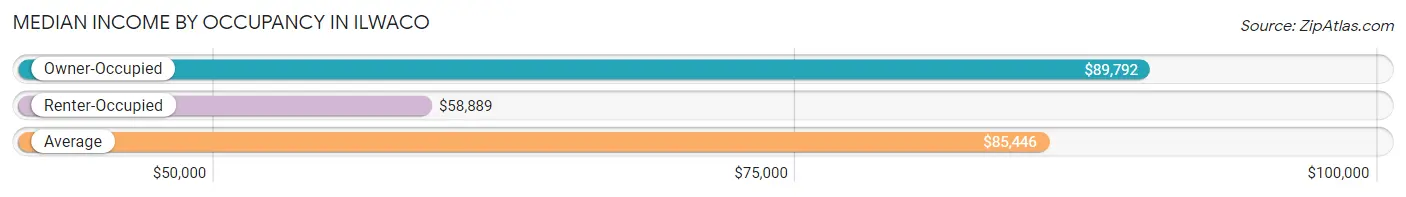
| Occupancy Type | # Households | Median Income |
| Owner-Occupied | 317 (67.6%) | $89,792 |
| Renter-Occupied | 152 (32.4%) | $58,889 |
| Average | 469 (100.0%) | $85,446 |
Occupancy by Householder Income Bracket in Ilwaco
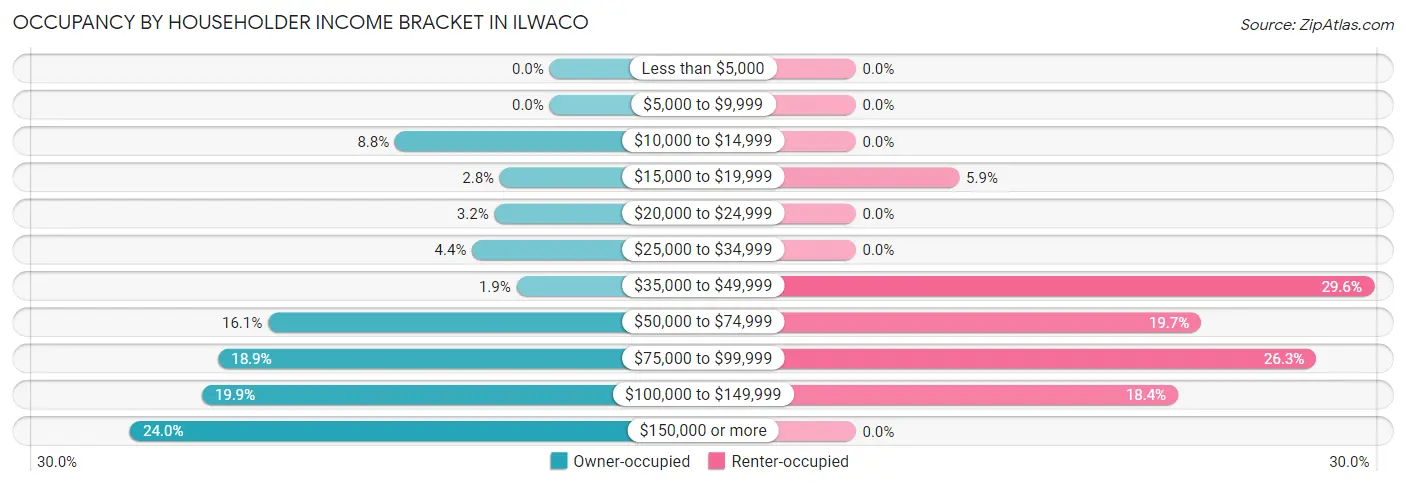
| Income Bracket | Owner-occupied | Renter-occupied |
| Less than $5,000 | 0 (0.0%) | 0 (0.0%) |
| $5,000 to $9,999 | 0 (0.0%) | 0 (0.0%) |
| $10,000 to $14,999 | 28 (8.8%) | 0 (0.0%) |
| $15,000 to $19,999 | 9 (2.8%) | 9 (5.9%) |
| $20,000 to $24,999 | 10 (3.2%) | 0 (0.0%) |
| $25,000 to $34,999 | 14 (4.4%) | 0 (0.0%) |
| $35,000 to $49,999 | 6 (1.9%) | 45 (29.6%) |
| $50,000 to $74,999 | 51 (16.1%) | 30 (19.7%) |
| $75,000 to $99,999 | 60 (18.9%) | 40 (26.3%) |
| $100,000 to $149,999 | 63 (19.9%) | 28 (18.4%) |
| $150,000 or more | 76 (24.0%) | 0 (0.0%) |
| Total | 317 (100.0%) | 152 (100.0%) |
Monthly Housing Cost Tiers in Ilwaco
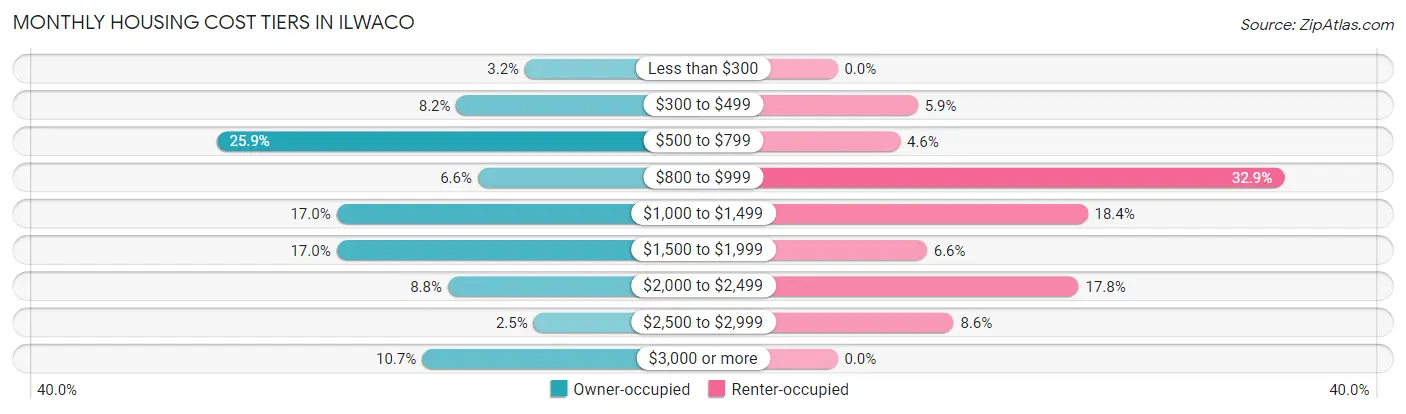
| Monthly Cost | Owner-occupied | Renter-occupied |
| Less than $300 | 10 (3.2%) | 0 (0.0%) |
| $300 to $499 | 26 (8.2%) | 9 (5.9%) |
| $500 to $799 | 82 (25.9%) | 7 (4.6%) |
| $800 to $999 | 21 (6.6%) | 50 (32.9%) |
| $1,000 to $1,499 | 54 (17.0%) | 28 (18.4%) |
| $1,500 to $1,999 | 54 (17.0%) | 10 (6.6%) |
| $2,000 to $2,499 | 28 (8.8%) | 27 (17.8%) |
| $2,500 to $2,999 | 8 (2.5%) | 13 (8.6%) |
| $3,000 or more | 34 (10.7%) | 0 (0.0%) |
| Total | 317 (100.0%) | 152 (100.0%) |
Physical Housing Characteristics in Ilwaco
Housing Structures in Ilwaco
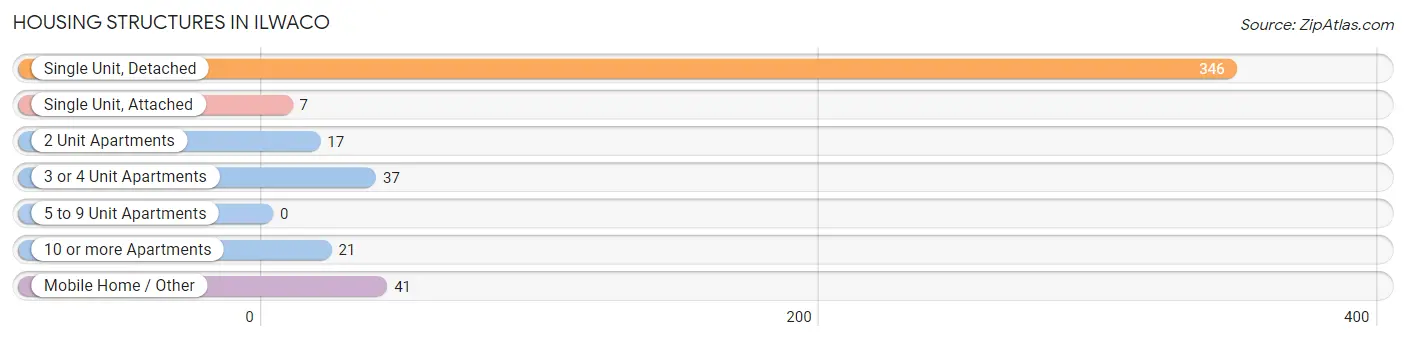
| Structure Type | # Housing Units | % Housing Units |
| Single Unit, Detached | 346 | 73.8% |
| Single Unit, Attached | 7 | 1.5% |
| 2 Unit Apartments | 17 | 3.6% |
| 3 or 4 Unit Apartments | 37 | 7.9% |
| 5 to 9 Unit Apartments | 0 | 0.0% |
| 10 or more Apartments | 21 | 4.5% |
| Mobile Home / Other | 41 | 8.7% |
| Total | 469 | 100.0% |
Housing Structures by Occupancy in Ilwaco
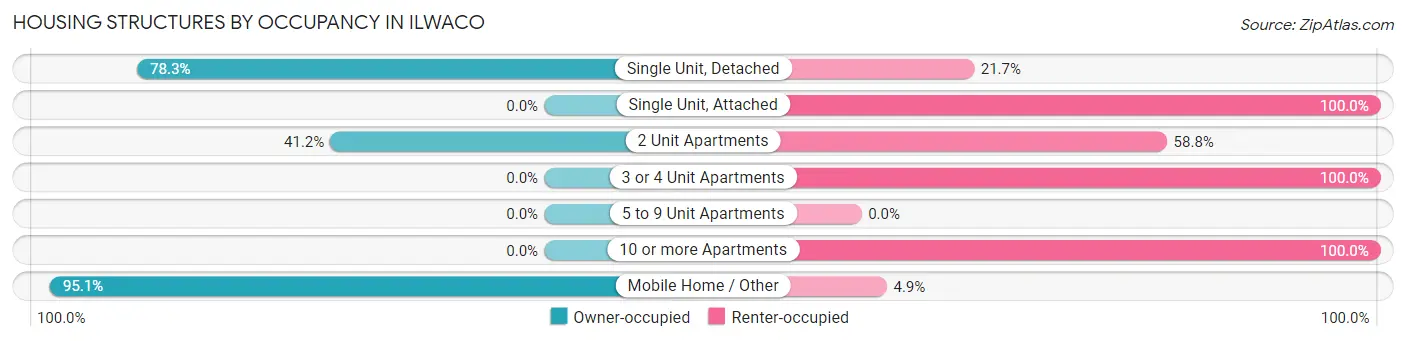
| Structure Type | Owner-occupied | Renter-occupied |
| Single Unit, Detached | 271 (78.3%) | 75 (21.7%) |
| Single Unit, Attached | 0 (0.0%) | 7 (100.0%) |
| 2 Unit Apartments | 7 (41.2%) | 10 (58.8%) |
| 3 or 4 Unit Apartments | 0 (0.0%) | 37 (100.0%) |
| 5 to 9 Unit Apartments | 0 (0.0%) | 0 (0.0%) |
| 10 or more Apartments | 0 (0.0%) | 21 (100.0%) |
| Mobile Home / Other | 39 (95.1%) | 2 (4.9%) |
| Total | 317 (67.6%) | 152 (32.4%) |
Housing Structures by Number of Rooms in Ilwaco
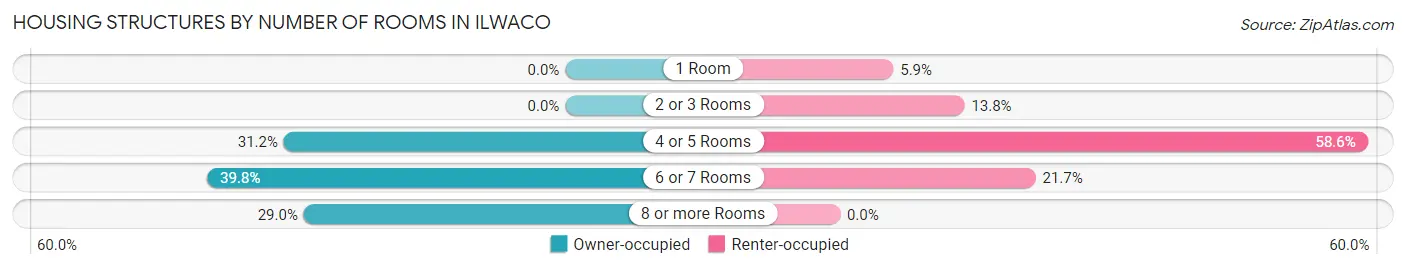
| Number of Rooms | Owner-occupied | Renter-occupied |
| 1 Room | 0 (0.0%) | 9 (5.9%) |
| 2 or 3 Rooms | 0 (0.0%) | 21 (13.8%) |
| 4 or 5 Rooms | 99 (31.2%) | 89 (58.6%) |
| 6 or 7 Rooms | 126 (39.8%) | 33 (21.7%) |
| 8 or more Rooms | 92 (29.0%) | 0 (0.0%) |
| Total | 317 (100.0%) | 152 (100.0%) |
Housing Structure by Heating Type in Ilwaco
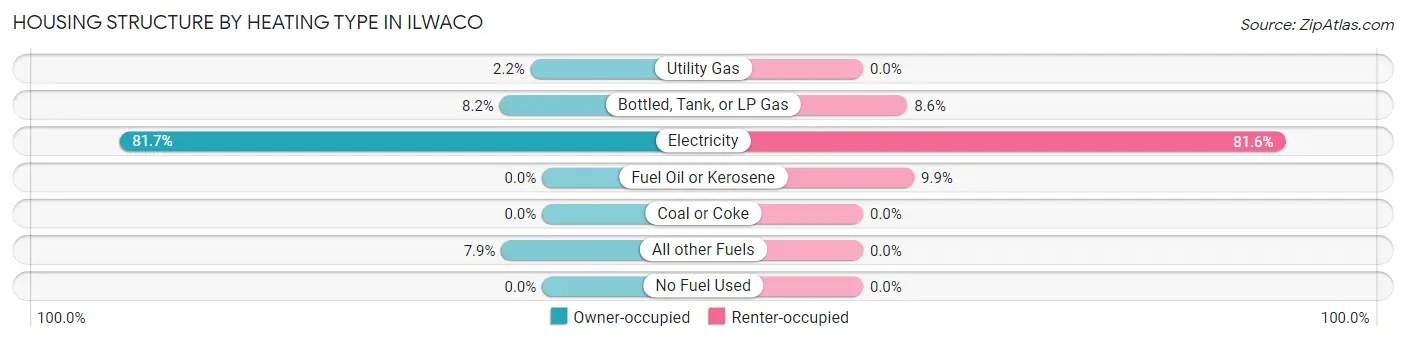
| Heating Type | Owner-occupied | Renter-occupied |
| Utility Gas | 7 (2.2%) | 0 (0.0%) |
| Bottled, Tank, or LP Gas | 26 (8.2%) | 13 (8.6%) |
| Electricity | 259 (81.7%) | 124 (81.6%) |
| Fuel Oil or Kerosene | 0 (0.0%) | 15 (9.9%) |
| Coal or Coke | 0 (0.0%) | 0 (0.0%) |
| All other Fuels | 25 (7.9%) | 0 (0.0%) |
| No Fuel Used | 0 (0.0%) | 0 (0.0%) |
| Total | 317 (100.0%) | 152 (100.0%) |
Household Vehicle Usage in Ilwaco
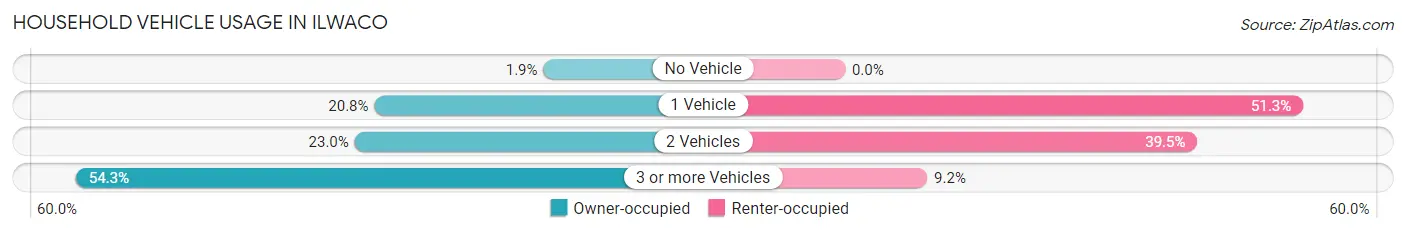
| Vehicles per Household | Owner-occupied | Renter-occupied |
| No Vehicle | 6 (1.9%) | 0 (0.0%) |
| 1 Vehicle | 66 (20.8%) | 78 (51.3%) |
| 2 Vehicles | 73 (23.0%) | 60 (39.5%) |
| 3 or more Vehicles | 172 (54.3%) | 14 (9.2%) |
| Total | 317 (100.0%) | 152 (100.0%) |
Real Estate & Mortgages in Ilwaco
Real Estate and Mortgage Overview in Ilwaco
| Characteristic | Without Mortgage | With Mortgage |
| Housing Units | 145 | 172 |
| Median Property Value | $304,300 | $452,400 |
| Median Household Income | $56,875 | $61 |
| Monthly Housing Costs | $620 | $34 |
| Real Estate Taxes | $3,188 | $14 |
Property Value by Mortgage Status in Ilwaco
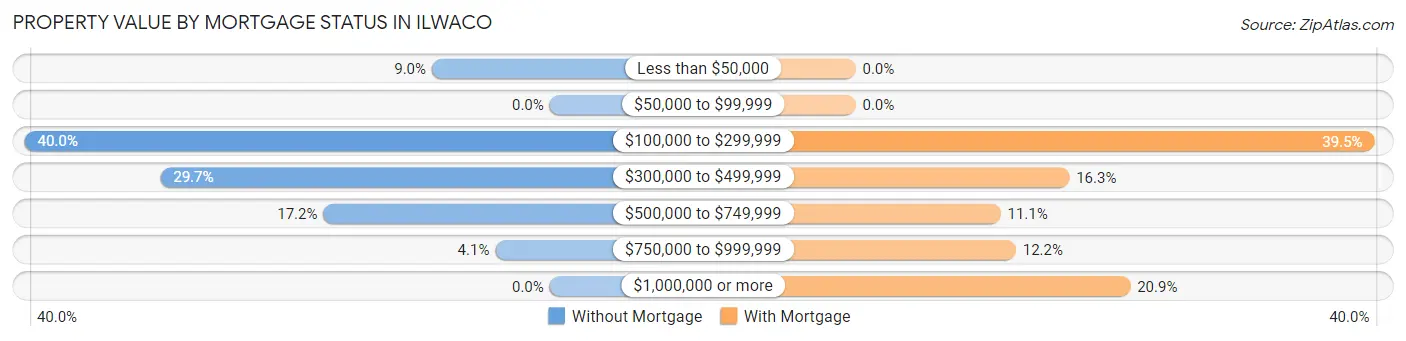
| Property Value | Without Mortgage | With Mortgage |
| Less than $50,000 | 13 (9.0%) | 0 (0.0%) |
| $50,000 to $99,999 | 0 (0.0%) | 0 (0.0%) |
| $100,000 to $299,999 | 58 (40.0%) | 68 (39.5%) |
| $300,000 to $499,999 | 43 (29.7%) | 28 (16.3%) |
| $500,000 to $749,999 | 25 (17.2%) | 19 (11.1%) |
| $750,000 to $999,999 | 6 (4.1%) | 21 (12.2%) |
| $1,000,000 or more | 0 (0.0%) | 36 (20.9%) |
| Total | 145 (100.0%) | 172 (100.0%) |
Household Income by Mortgage Status in Ilwaco
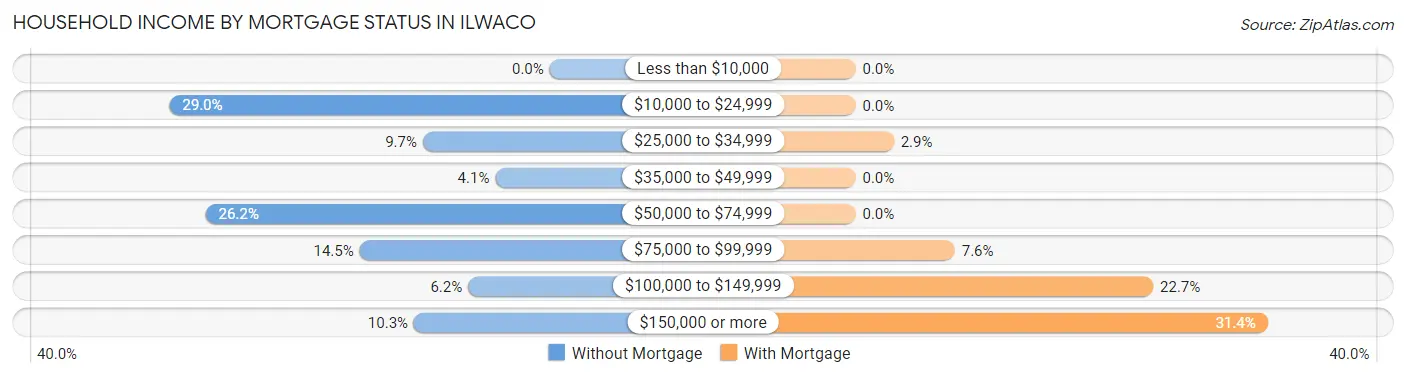
| Household Income | Without Mortgage | With Mortgage |
| Less than $10,000 | 0 (0.0%) | 0 (0.0%) |
| $10,000 to $24,999 | 42 (29.0%) | 0 (0.0%) |
| $25,000 to $34,999 | 14 (9.7%) | 5 (2.9%) |
| $35,000 to $49,999 | 6 (4.1%) | 0 (0.0%) |
| $50,000 to $74,999 | 38 (26.2%) | 0 (0.0%) |
| $75,000 to $99,999 | 21 (14.5%) | 13 (7.6%) |
| $100,000 to $149,999 | 9 (6.2%) | 39 (22.7%) |
| $150,000 or more | 15 (10.3%) | 54 (31.4%) |
| Total | 145 (100.0%) | 172 (100.0%) |
Property Value to Household Income Ratio in Ilwaco
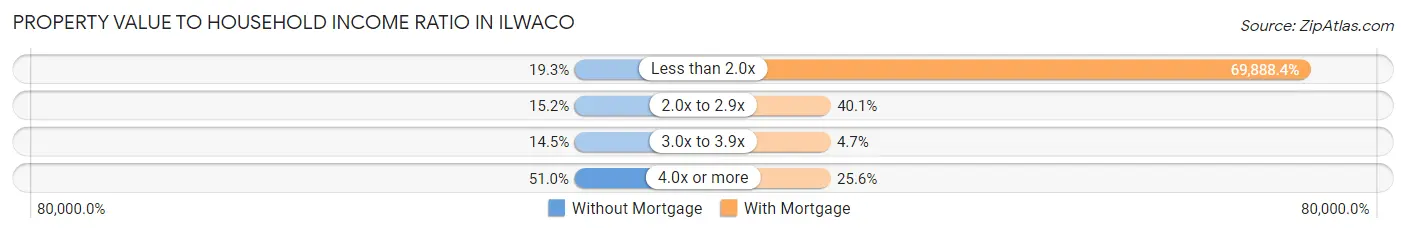
| Value-to-Income Ratio | Without Mortgage | With Mortgage |
| Less than 2.0x | 28 (19.3%) | 120,208 (69,888.4%) |
| 2.0x to 2.9x | 22 (15.2%) | 69 (40.1%) |
| 3.0x to 3.9x | 21 (14.5%) | 8 (4.6%) |
| 4.0x or more | 74 (51.0%) | 44 (25.6%) |
| Total | 145 (100.0%) | 172 (100.0%) |
Real Estate Taxes by Mortgage Status in Ilwaco
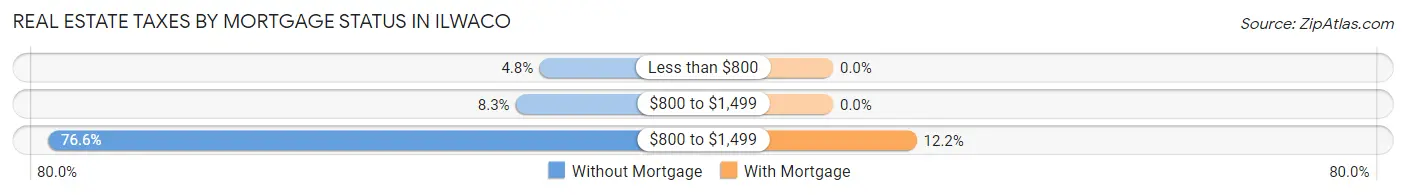
| Property Taxes | Without Mortgage | With Mortgage |
| Less than $800 | 7 (4.8%) | 0 (0.0%) |
| $800 to $1,499 | 12 (8.3%) | 0 (0.0%) |
| $800 to $1,499 | 111 (76.5%) | 21 (12.2%) |
| Total | 145 (100.0%) | 172 (100.0%) |
Health & Disability in Ilwaco
Health Insurance Coverage by Age in Ilwaco
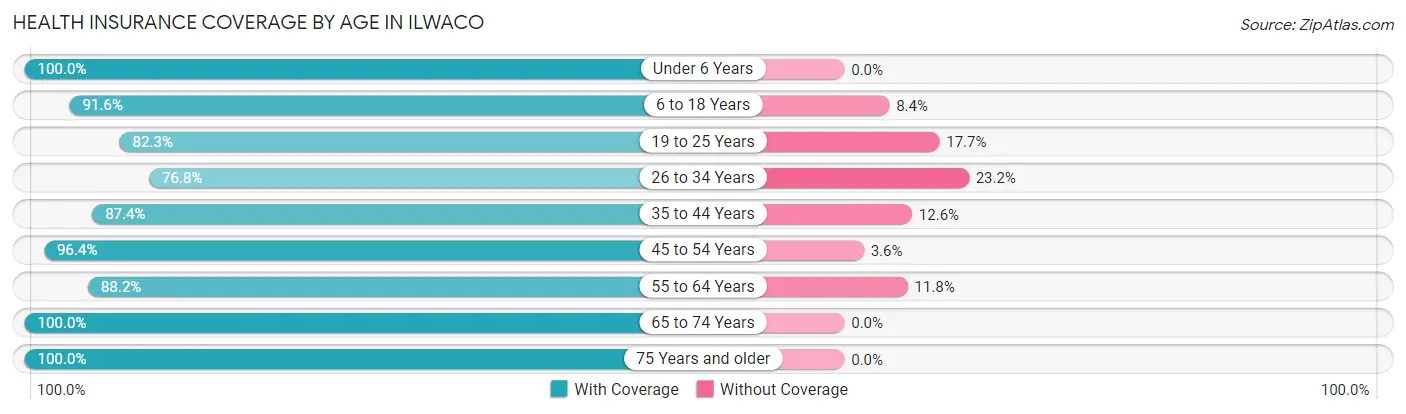
| Age Bracket | With Coverage | Without Coverage |
| Under 6 Years | 81 (100.0%) | 0 (0.0%) |
| 6 to 18 Years | 164 (91.6%) | 15 (8.4%) |
| 19 to 25 Years | 79 (82.3%) | 17 (17.7%) |
| 26 to 34 Years | 192 (76.8%) | 58 (23.2%) |
| 35 to 44 Years | 97 (87.4%) | 14 (12.6%) |
| 45 to 54 Years | 133 (96.4%) | 5 (3.6%) |
| 55 to 64 Years | 127 (88.2%) | 17 (11.8%) |
| 65 to 74 Years | 241 (100.0%) | 0 (0.0%) |
| 75 Years and older | 181 (100.0%) | 0 (0.0%) |
| Total | 1,295 (91.1%) | 126 (8.9%) |
Health Insurance Coverage by Citizenship Status in Ilwaco
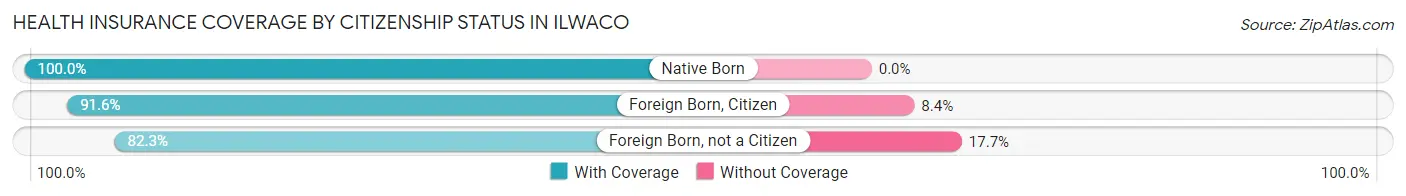
| Citizenship Status | With Coverage | Without Coverage |
| Native Born | 81 (100.0%) | 0 (0.0%) |
| Foreign Born, Citizen | 164 (91.6%) | 15 (8.4%) |
| Foreign Born, not a Citizen | 79 (82.3%) | 17 (17.7%) |
Health Insurance Coverage by Household Income in Ilwaco
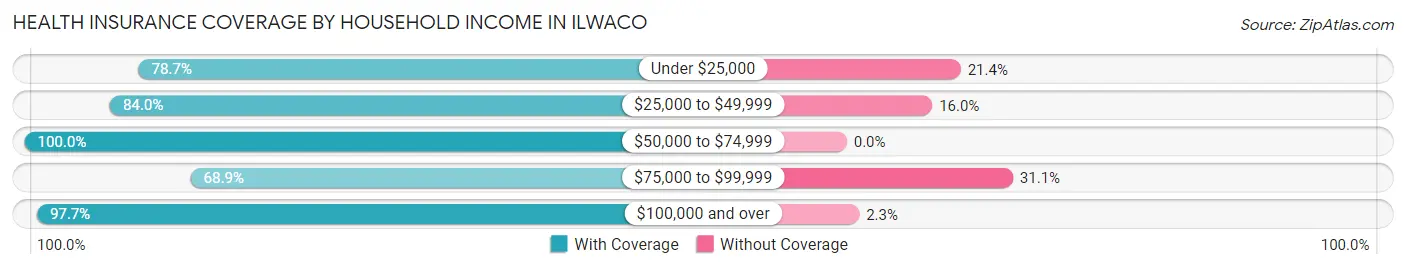
| Household Income | With Coverage | Without Coverage |
| Under $25,000 | 70 (78.6%) | 19 (21.3%) |
| $25,000 to $49,999 | 147 (84.0%) | 28 (16.0%) |
| $50,000 to $74,999 | 184 (100.0%) | 0 (0.0%) |
| $75,000 to $99,999 | 135 (68.9%) | 61 (31.1%) |
| $100,000 and over | 759 (97.7%) | 18 (2.3%) |
Public vs Private Health Insurance Coverage by Age in Ilwaco
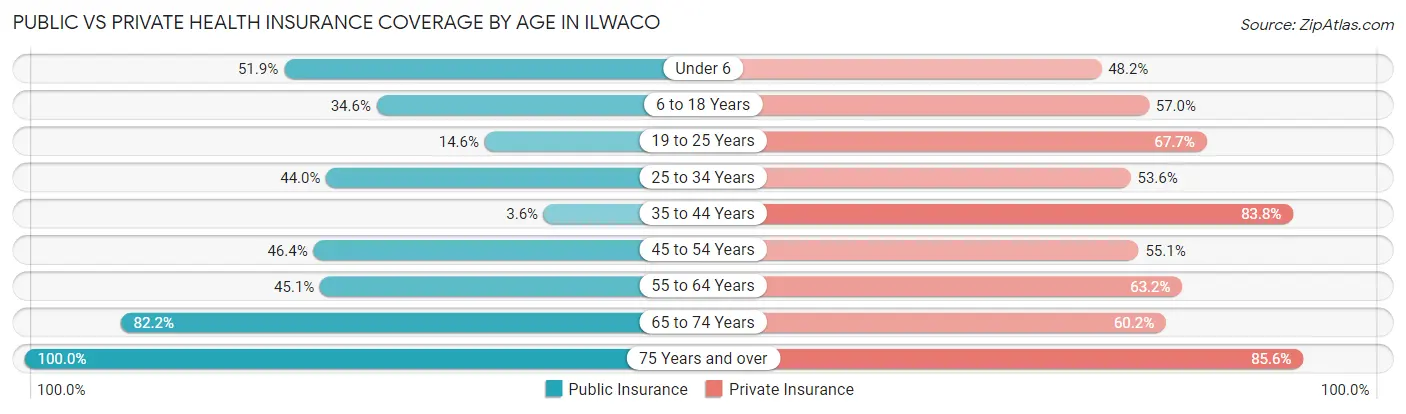
| Age Bracket | Public Insurance | Private Insurance |
| Under 6 | 42 (51.8%) | 39 (48.1%) |
| 6 to 18 Years | 62 (34.6%) | 102 (57.0%) |
| 19 to 25 Years | 14 (14.6%) | 65 (67.7%) |
| 25 to 34 Years | 110 (44.0%) | 134 (53.6%) |
| 35 to 44 Years | 4 (3.6%) | 93 (83.8%) |
| 45 to 54 Years | 64 (46.4%) | 76 (55.1%) |
| 55 to 64 Years | 65 (45.1%) | 91 (63.2%) |
| 65 to 74 Years | 198 (82.2%) | 145 (60.2%) |
| 75 Years and over | 181 (100.0%) | 155 (85.6%) |
| Total | 740 (52.1%) | 900 (63.3%) |
Disability Status by Sex by Age in Ilwaco
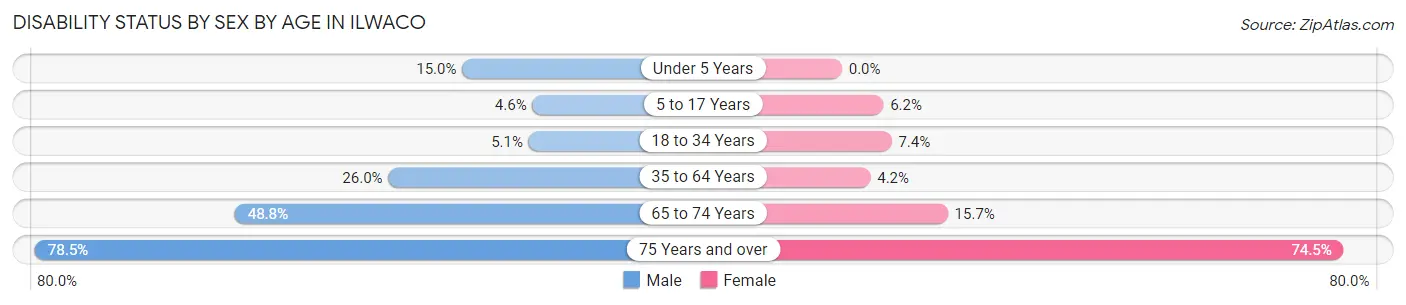
| Age Bracket | Male | Female |
| Under 5 Years | 6 (15.0%) | 0 (0.0%) |
| 5 to 17 Years | 6 (4.6%) | 4 (6.1%) |
| 18 to 34 Years | 8 (5.1%) | 14 (7.4%) |
| 35 to 64 Years | 53 (26.0%) | 8 (4.2%) |
| 65 to 74 Years | 40 (48.8%) | 25 (15.7%) |
| 75 Years and over | 102 (78.5%) | 38 (74.5%) |
Disability Class by Sex by Age in Ilwaco
Disability Class: Hearing Difficulty
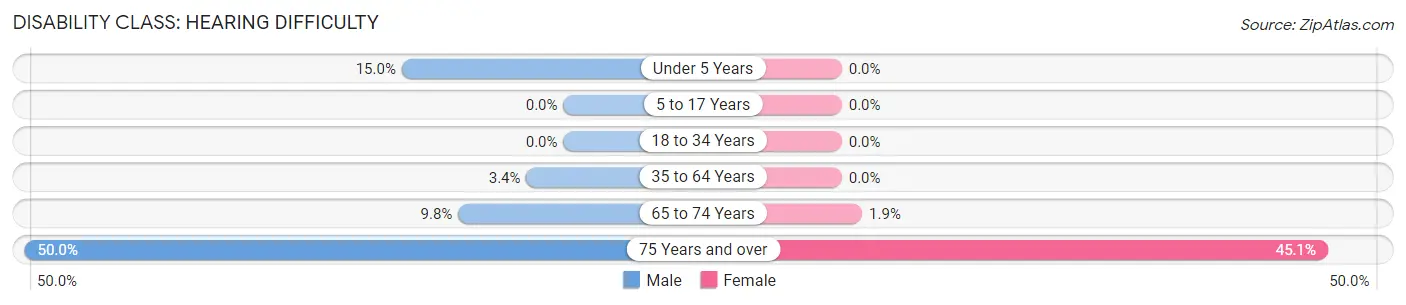
| Age Bracket | Male | Female |
| Under 5 Years | 6 (15.0%) | 0 (0.0%) |
| 5 to 17 Years | 0 (0.0%) | 0 (0.0%) |
| 18 to 34 Years | 0 (0.0%) | 0 (0.0%) |
| 35 to 64 Years | 7 (3.4%) | 0 (0.0%) |
| 65 to 74 Years | 8 (9.8%) | 3 (1.9%) |
| 75 Years and over | 65 (50.0%) | 23 (45.1%) |
Disability Class: Vision Difficulty
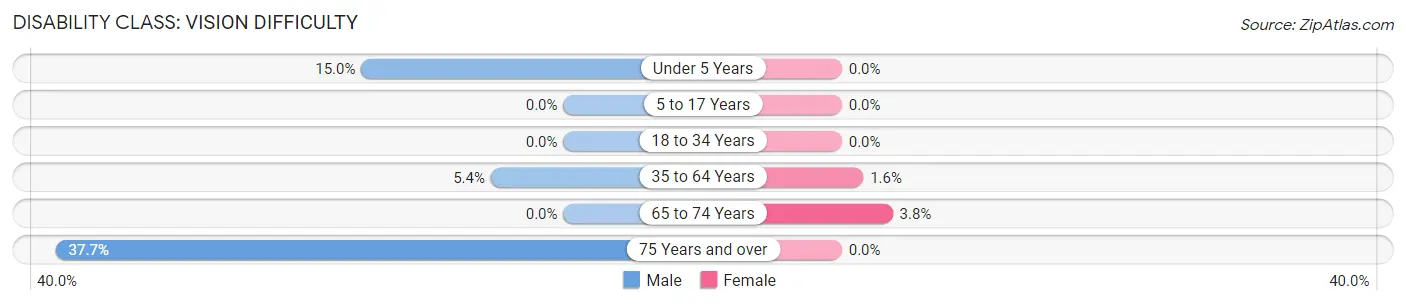
| Age Bracket | Male | Female |
| Under 5 Years | 6 (15.0%) | 0 (0.0%) |
| 5 to 17 Years | 0 (0.0%) | 0 (0.0%) |
| 18 to 34 Years | 0 (0.0%) | 0 (0.0%) |
| 35 to 64 Years | 11 (5.4%) | 3 (1.6%) |
| 65 to 74 Years | 0 (0.0%) | 6 (3.8%) |
| 75 Years and over | 49 (37.7%) | 0 (0.0%) |
Disability Class: Cognitive Difficulty
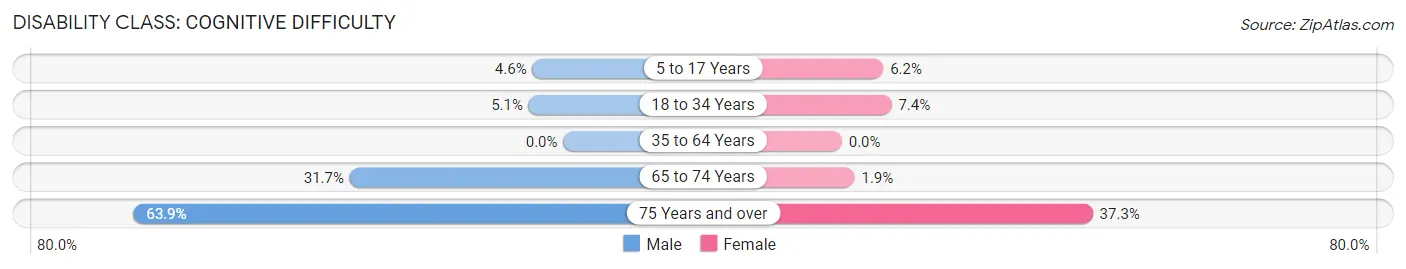
| Age Bracket | Male | Female |
| 5 to 17 Years | 6 (4.6%) | 4 (6.1%) |
| 18 to 34 Years | 8 (5.1%) | 14 (7.4%) |
| 35 to 64 Years | 0 (0.0%) | 0 (0.0%) |
| 65 to 74 Years | 26 (31.7%) | 3 (1.9%) |
| 75 Years and over | 83 (63.8%) | 19 (37.2%) |
Disability Class: Ambulatory Difficulty
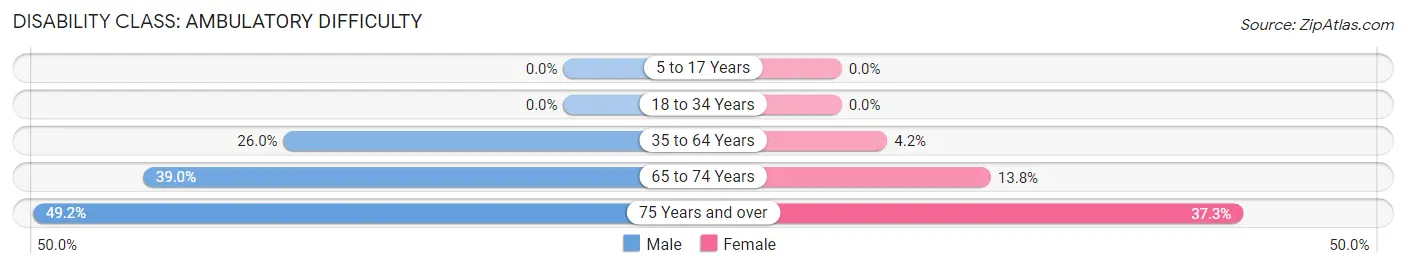
| Age Bracket | Male | Female |
| 5 to 17 Years | 0 (0.0%) | 0 (0.0%) |
| 18 to 34 Years | 0 (0.0%) | 0 (0.0%) |
| 35 to 64 Years | 53 (26.0%) | 8 (4.2%) |
| 65 to 74 Years | 32 (39.0%) | 22 (13.8%) |
| 75 Years and over | 64 (49.2%) | 19 (37.2%) |
Disability Class: Self-Care Difficulty
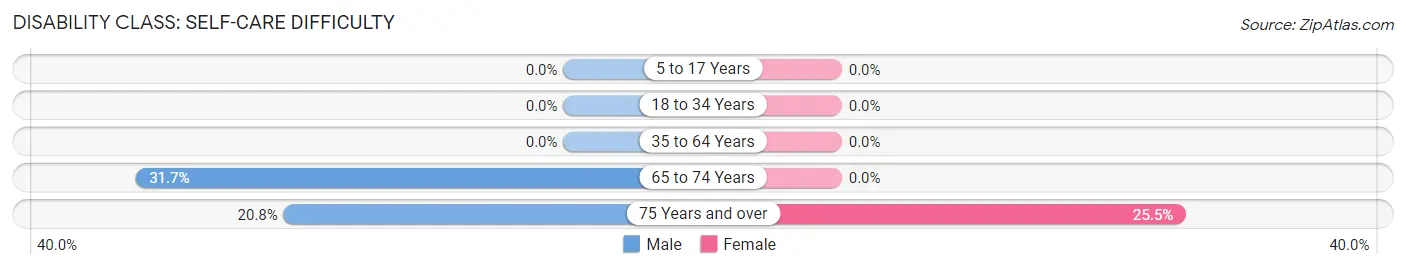
| Age Bracket | Male | Female |
| 5 to 17 Years | 0 (0.0%) | 0 (0.0%) |
| 18 to 34 Years | 0 (0.0%) | 0 (0.0%) |
| 35 to 64 Years | 0 (0.0%) | 0 (0.0%) |
| 65 to 74 Years | 26 (31.7%) | 0 (0.0%) |
| 75 Years and over | 27 (20.8%) | 13 (25.5%) |
Technology Access in Ilwaco
Computing Device Access in Ilwaco
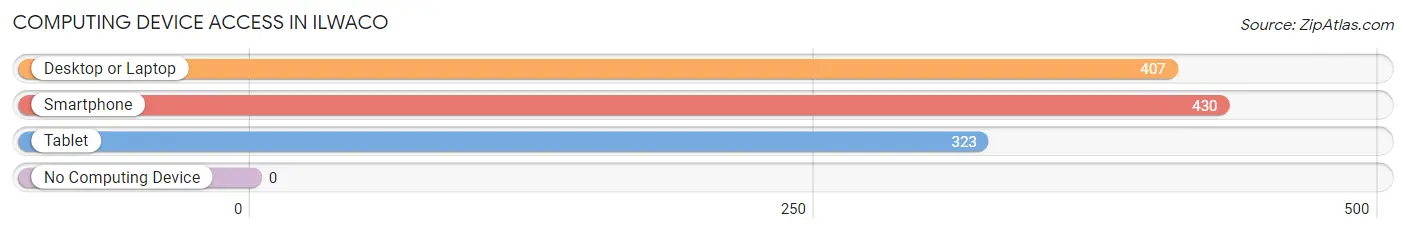
| Device Type | # Households | % Households |
| Desktop or Laptop | 407 | 86.8% |
| Smartphone | 430 | 91.7% |
| Tablet | 323 | 68.9% |
| No Computing Device | 0 | 0.0% |
| Total | 469 | 100.0% |
Internet Access in Ilwaco
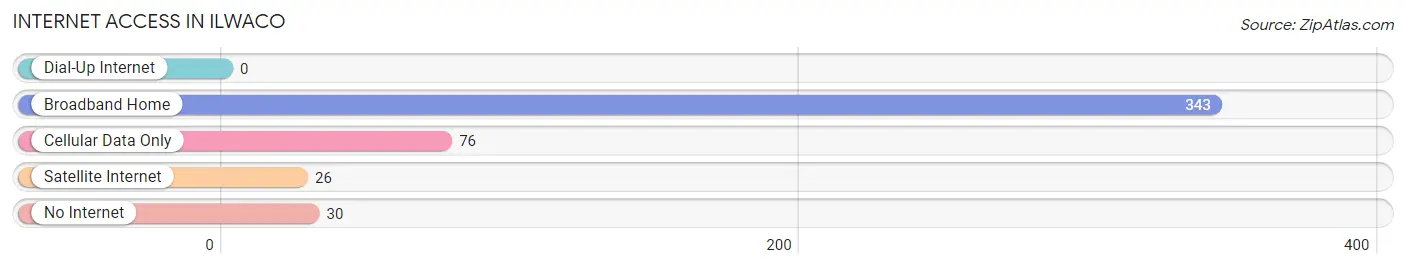
| Internet Type | # Households | % Households |
| Dial-Up Internet | 0 | 0.0% |
| Broadband Home | 343 | 73.1% |
| Cellular Data Only | 76 | 16.2% |
| Satellite Internet | 26 | 5.5% |
| No Internet | 30 | 6.4% |
| Total | 469 | 100.0% |
Ilwaco Summary
Ilwaco is a small city located in the southwestern corner of Washington State, on the Long Beach Peninsula. It is situated on the Columbia River, just north of the Oregon border. The city is known for its beautiful beaches, fishing, and outdoor recreation.
History
The area that is now Ilwaco was first inhabited by the Chinook Indians, who lived in the area for thousands of years before the arrival of European settlers. The first Europeans to explore the area were the Lewis and Clark Expedition, who arrived in 1805. The first permanent settlers arrived in the area in the early 1800s, and the town of Ilwaco was officially founded in 1851.
The town was named after the Chinook word for “place of many fish”, and the area quickly became known for its fishing industry. In the late 1800s, the town was a major port for the lumber industry, and the town’s economy was largely based on the lumber trade.
In the early 1900s, the town began to develop as a tourist destination, and the fishing industry continued to thrive. The town was incorporated in 1909, and the population grew steadily throughout the 20th century.
Geography
Ilwaco is located in the southwestern corner of Washington State, on the Long Beach Peninsula. The city is situated on the Columbia River, just north of the Oregon border. The city is bordered by the Pacific Ocean to the west, and the Willapa Bay to the east.
The city has a total area of 2.3 square miles, all of which is land. The city is located at an elevation of 10 feet above sea level. The climate in Ilwaco is mild and temperate, with warm summers and mild winters.
Economy
The economy of Ilwaco is largely based on tourism and fishing. The city is a popular destination for beachgoers, and the fishing industry is still a major part of the local economy. The city is also home to several small businesses, including restaurants, shops, and galleries.
The city is also home to the Port of Ilwaco, which is a major port for the lumber industry. The port is also a major shipping hub for the region, and is home to several large shipping companies.
Demographics
As of the 2010 census, the population of Ilwaco was 1,541. The population is largely white (94.2%), with small percentages of African American (1.2%), Native American (0.7%), Asian (0.6%), and other races (2.3%). The median household income in Ilwaco is $41,944, and the median age is 44.
Conclusion
Ilwaco is a small city located in the southwestern corner of Washington State, on the Long Beach Peninsula. The city is known for its beautiful beaches, fishing, and outdoor recreation. The economy of Ilwaco is largely based on tourism and fishing, and the city is home to several small businesses. The population of Ilwaco is largely white, with a median household income of $41,944 and a median age of 44.
Common Questions
What is Per Capita Income in Ilwaco?
Per Capita income in Ilwaco is $39,386.
What is the Median Family Income in Ilwaco?
Median Family Income in Ilwaco is $79,821.
What is the Median Household income in Ilwaco?
Median Household Income in Ilwaco is $85,446.
What is Income or Wage Gap in Ilwaco?
Income or Wage Gap in Ilwaco is 10.3%.
Women in Ilwaco earn 89.7 cents for every dollar earned by a man.
What is Inequality or Gini Index in Ilwaco?
Inequality or Gini Index in Ilwaco is 0.42.
What is the Total Population of Ilwaco?
Total Population of Ilwaco is 1,433.
What is the Total Male Population of Ilwaco?
Total Male Population of Ilwaco is 755.
What is the Total Female Population of Ilwaco?
Total Female Population of Ilwaco is 678.
What is the Ratio of Males per 100 Females in Ilwaco?
There are 111.36 Males per 100 Females in Ilwaco.
What is the Ratio of Females per 100 Males in Ilwaco?
There are 89.80 Females per 100 Males in Ilwaco.
What is the Median Population Age in Ilwaco?
Median Population Age in Ilwaco is 43.6 Years.
What is the Average Family Size in Ilwaco
Average Family Size in Ilwaco is 3.1 People.
What is the Average Household Size in Ilwaco
Average Household Size in Ilwaco is 3.0 People.
How Large is the Labor Force in Ilwaco?
There are 734 People in the Labor Forcein in Ilwaco.
What is the Percentage of People in the Labor Force in Ilwaco?
60.1% of People are in the Labor Force in Ilwaco.
What is the Unemployment Rate in Ilwaco?
Unemployment Rate in Ilwaco is 0.6%.