Zip Codes with the Highest Percentage of Population Employed in Architecture & Engineering in Seattle, WA
RELATED REPORTS & OPTIONS
Architecture & Engineering
Seattle
Compare Zip Codes
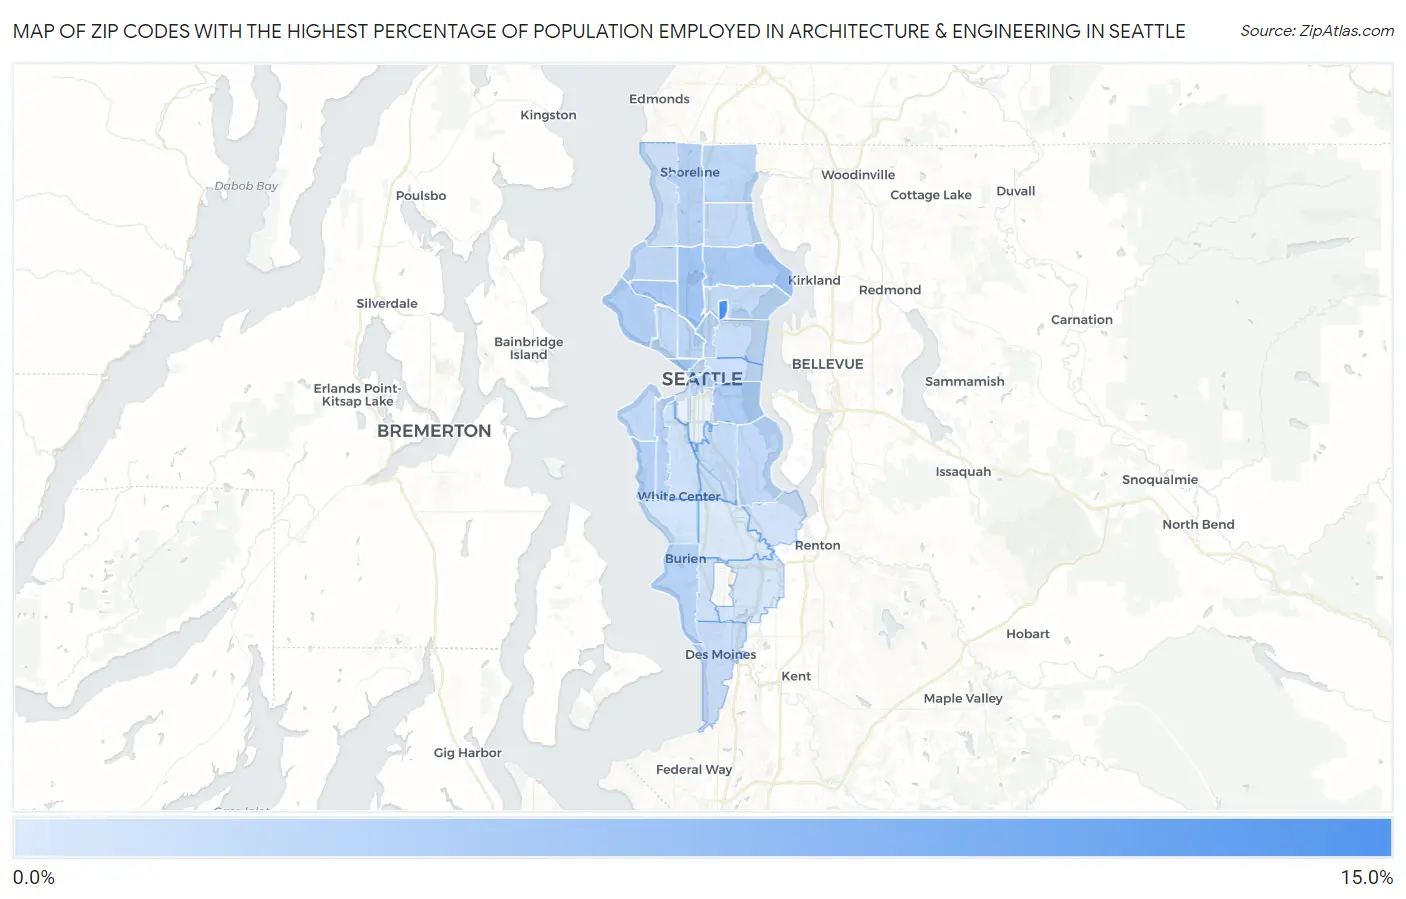
Map of Zip Codes with the Highest Percentage of Population Employed in Architecture & Engineering in Seattle
0.98%
14.6%
Zip Codes with the Highest Percentage of Population Employed in Architecture & Engineering in Seattle, WA
| Zip Code | % Employed | vs State | vs National | |
| 1. | 98195 | 14.6% | 2.8%(+11.8)#5 | 2.1%(+12.4)#155 |
| 2. | 98103 | 6.1% | 2.8%(+3.31)#21 | 2.1%(+3.95)#1,042 |
| 3. | 98121 | 5.6% | 2.8%(+2.82)#29 | 2.1%(+3.47)#1,274 |
| 4. | 98107 | 5.4% | 2.8%(+2.63)#32 | 2.1%(+3.27)#1,373 |
| 5. | 98115 | 5.3% | 2.8%(+2.52)#36 | 2.1%(+3.16)#1,444 |
| 6. | 98144 | 4.8% | 2.8%(+2.03)#47 | 2.1%(+2.67)#1,808 |
| 7. | 98199 | 4.6% | 2.8%(+1.79)#56 | 2.1%(+2.43)#2,037 |
| 8. | 98136 | 4.5% | 2.8%(+1.76)#60 | 2.1%(+2.40)#2,073 |
| 9. | 98102 | 4.3% | 2.8%(+1.47)#67 | 2.1%(+2.11)#2,414 |
| 10. | 98126 | 4.2% | 2.8%(+1.44)#71 | 2.1%(+2.08)#2,464 |
| 11. | 98133 | 4.2% | 2.8%(+1.37)#75 | 2.1%(+2.01)#2,540 |
| 12. | 98166 | 4.0% | 2.8%(+1.18)#83 | 2.1%(+1.83)#2,810 |
| 13. | 98109 | 3.9% | 2.8%(+1.16)#86 | 2.1%(+1.80)#2,848 |
| 14. | 98104 | 3.8% | 2.8%(+0.978)#92 | 2.1%(+1.62)#3,155 |
| 15. | 98101 | 3.7% | 2.8%(+0.900)#96 | 2.1%(+1.54)#3,312 |
| 16. | 98164 | 3.6% | 2.8%(+0.762)#106 | 2.1%(+1.40)#3,603 |
| 17. | 98155 | 3.5% | 2.8%(+0.714)#107 | 2.1%(+1.36)#3,723 |
| 18. | 98116 | 3.5% | 2.8%(+0.666)#111 | 2.1%(+1.31)#3,837 |
| 19. | 98119 | 3.4% | 2.8%(+0.646)#113 | 2.1%(+1.29)#3,887 |
| 20. | 98118 | 3.4% | 2.8%(+0.612)#114 | 2.1%(+1.25)#3,956 |
| 21. | 98117 | 3.3% | 2.8%(+0.509)#121 | 2.1%(+1.15)#4,195 |
| 22. | 98125 | 3.2% | 2.8%(+0.459)#126 | 2.1%(+1.10)#4,331 |
| 23. | 98105 | 3.2% | 2.8%(+0.377)#130 | 2.1%(+1.02)#4,546 |
| 24. | 98108 | 3.0% | 2.8%(+0.242)#142 | 2.1%(+0.884)#4,950 |
| 25. | 98112 | 2.8% | 2.8%(-0.035)#160 | 2.1%(+0.607)#5,937 |
| 26. | 98198 | 2.5% | 2.8%(-0.312)#178 | 2.1%(+0.330)#7,092 |
| 27. | 98122 | 2.3% | 2.8%(-0.472)#198 | 2.1%(+0.170)#7,855 |
| 28. | 98177 | 2.3% | 2.8%(-0.522)#200 | 2.1%(+0.120)#8,105 |
| 29. | 98106 | 2.1% | 2.8%(-0.682)#221 | 2.1%(-0.040)#8,983 |
| 30. | 98178 | 2.0% | 2.8%(-0.746)#237 | 2.1%(-0.104)#9,336 |
| 31. | 98148 | 2.0% | 2.8%(-0.840)#244 | 2.1%(-0.198)#9,909 |
| 32. | 98146 | 1.8% | 2.8%(-0.941)#248 | 2.1%(-0.299)#10,542 |
| 33. | 98188 | 1.5% | 2.8%(-1.29)#285 | 2.1%(-0.650)#12,890 |
| 34. | 98168 | 0.98% | 2.8%(-1.81)#343 | 2.1%(-1.16)#16,720 |
1
Common Questions
What are the Top 10 Zip Codes with the Highest Percentage of Population Employed in Architecture & Engineering in Seattle, WA?
Top 10 Zip Codes with the Highest Percentage of Population Employed in Architecture & Engineering in Seattle, WA are:
What zip code has the Highest Percentage of Population Employed in Architecture & Engineering in Seattle, WA?
98195 has the Highest Percentage of Population Employed in Architecture & Engineering in Seattle, WA with 14.6%.
What is the Percentage of Population Employed in Architecture & Engineering in Seattle, WA?
Percentage of Population Employed in Architecture & Engineering in Seattle is 4.0%.
What is the Percentage of Population Employed in Architecture & Engineering in Washington?
Percentage of Population Employed in Architecture & Engineering in Washington is 2.8%.
What is the Percentage of Population Employed in Architecture & Engineering in the United States?
Percentage of Population Employed in Architecture & Engineering in the United States is 2.1%.