Hobart, WA Map & Demographics
Hobart Map
Hobart Overview
$63,562
PER CAPITA INCOME
$170,446
AVG FAMILY INCOME
$143,125
AVG HOUSEHOLD INCOME
35.0%
WAGE / INCOME GAP [ % ]
65.0¢/ $1
WAGE / INCOME GAP [ $ ]
0.42
INEQUALITY / GINI INDEX
7,155
TOTAL POPULATION
3,701
MALE POPULATION
3,454
FEMALE POPULATION
107.15
MALES / 100 FEMALES
93.33
FEMALES / 100 MALES
42.5
MEDIAN AGE
3.1
AVG FAMILY SIZE
2.8
AVG HOUSEHOLD SIZE
3,660
LABOR FORCE [ PEOPLE ]
63.7%
PERCENT IN LABOR FORCE
3.4%
UNEMPLOYMENT RATE
Income in Hobart
Income Overview in Hobart
Per Capita Income in Hobart is $63,562, while median incomes of families and households are $170,446 and $143,125 respectively.
| Characteristic | Number | Measure |
| Per Capita Income | 7,155 | $63,562 |
| Median Family Income | 2,024 | $170,446 |
| Mean Family Income | 2,024 | $192,252 |
| Median Household Income | 2,579 | $143,125 |
| Mean Household Income | 2,579 | $171,781 |
| Income Deficit | 2,024 | $0 |
| Wage / Income Gap (%) | 7,155 | 35.04% |
| Wage / Income Gap ($) | 7,155 | 64.96¢ per $1 |
| Gini / Inequality Index | 7,155 | 0.42 |
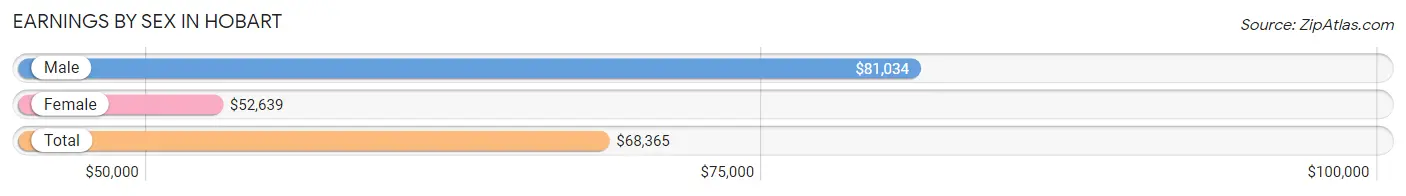
Earnings by Sex in Hobart
Average Earnings in Hobart are $68,365, $81,034 for men and $52,639 for women, a difference of 35.0%.
| Sex | Number | Average Earnings |
| Male | 2,212 (55.5%) | $81,034 |
| Female | 1,771 (44.5%) | $52,639 |
| Total | 3,983 (100.0%) | $68,365 |
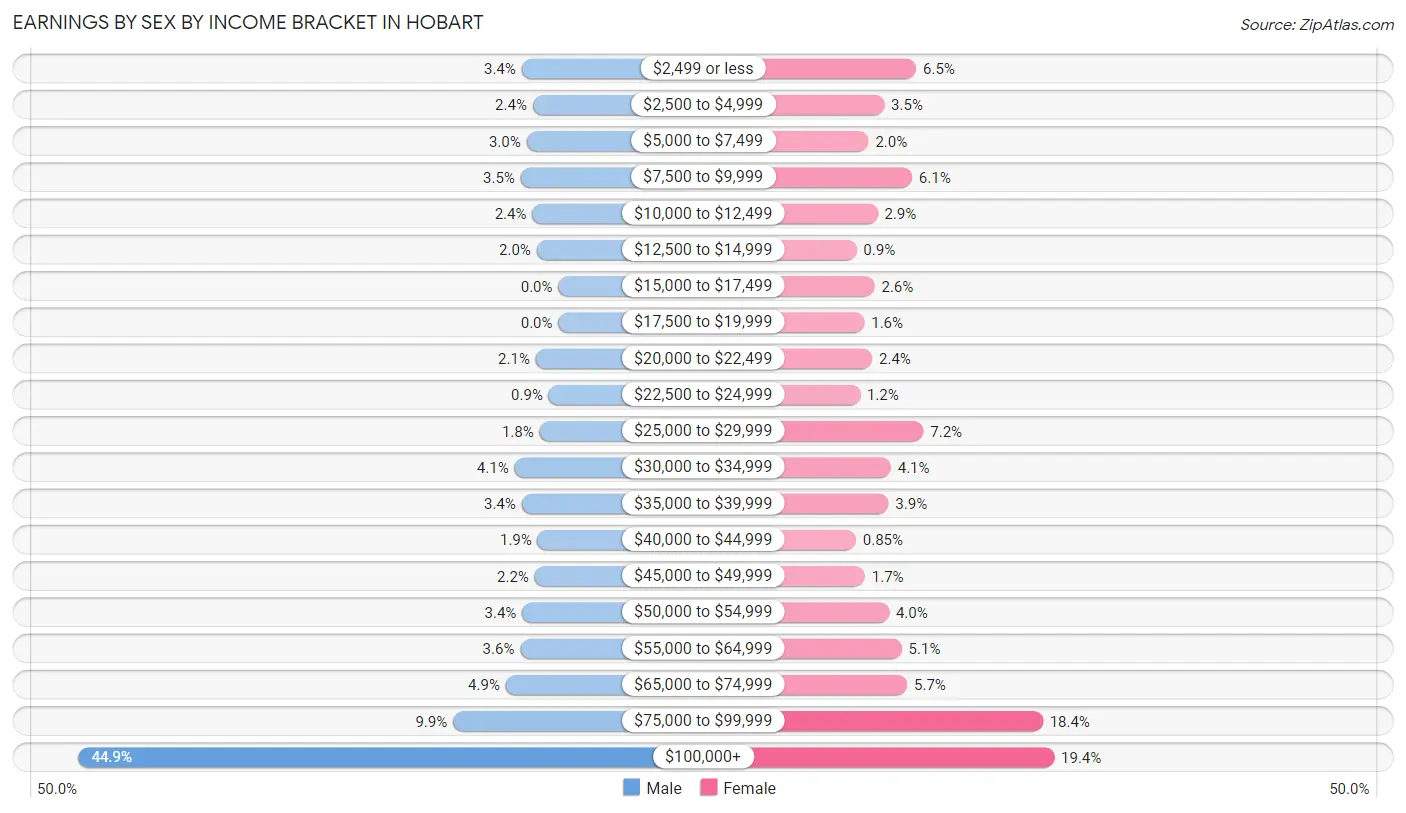
Earnings by Sex by Income Bracket in Hobart
The most common earnings brackets in Hobart are $100,000+ for men (994 | 44.9%) and $100,000+ for women (344 | 19.4%).
| Income | Male | Female |
| $2,499 or less | 76 (3.4%) | 115 (6.5%) |
| $2,500 to $4,999 | 53 (2.4%) | 62 (3.5%) |
| $5,000 to $7,499 | 66 (3.0%) | 36 (2.0%) |
| $7,500 to $9,999 | 78 (3.5%) | 108 (6.1%) |
| $10,000 to $12,499 | 54 (2.4%) | 51 (2.9%) |
| $12,500 to $14,999 | 45 (2.0%) | 16 (0.9%) |
| $15,000 to $17,499 | 0 (0.0%) | 46 (2.6%) |
| $17,500 to $19,999 | 0 (0.0%) | 29 (1.6%) |
| $20,000 to $22,499 | 47 (2.1%) | 42 (2.4%) |
| $22,500 to $24,999 | 20 (0.9%) | 22 (1.2%) |
| $25,000 to $29,999 | 39 (1.8%) | 127 (7.2%) |
| $30,000 to $34,999 | 91 (4.1%) | 73 (4.1%) |
| $35,000 to $39,999 | 76 (3.4%) | 69 (3.9%) |
| $40,000 to $44,999 | 43 (1.9%) | 15 (0.9%) |
| $45,000 to $49,999 | 49 (2.2%) | 30 (1.7%) |
| $50,000 to $54,999 | 75 (3.4%) | 70 (4.0%) |
| $55,000 to $64,999 | 79 (3.6%) | 91 (5.1%) |
| $65,000 to $74,999 | 109 (4.9%) | 100 (5.7%) |
| $75,000 to $99,999 | 218 (9.9%) | 325 (18.3%) |
| $100,000+ | 994 (44.9%) | 344 (19.4%) |
| Total | 2,212 (100.0%) | 1,771 (100.0%) |
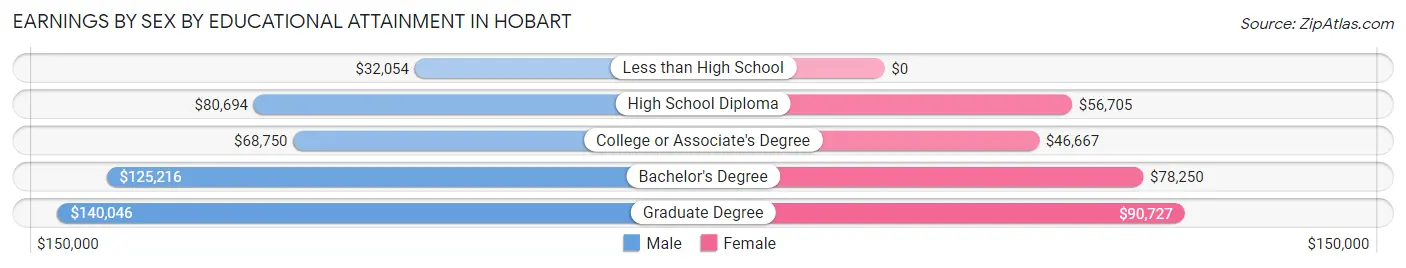
Earnings by Sex by Educational Attainment in Hobart
Average earnings in Hobart are $102,353 for men and $70,202 for women, a difference of 31.4%. Men with an educational attainment of graduate degree enjoy the highest average annual earnings of $140,046, while those with less than high school education earn the least with $32,054. Women with an educational attainment of graduate degree earn the most with the average annual earnings of $90,727, while those with college or associate's degree education have the smallest earnings of $46,667.
| Educational Attainment | Male Income | Female Income |
| Less than High School | $32,054 | $0 |
| High School Diploma | $80,694 | $56,705 |
| College or Associate's Degree | $68,750 | $46,667 |
| Bachelor's Degree | $125,216 | $78,250 |
| Graduate Degree | $140,046 | $90,727 |
| Total | $102,353 | $70,202 |
Family Income in Hobart
Family Income Brackets in Hobart
According to the Hobart family income data, there are 696 families falling into the $200,000+ income range, which is the most common income bracket and makes up 34.4% of all families. Conversely, the $15,000 to $24,999 income bracket is the least frequent group with only 18 families (0.9%) belonging to this category.
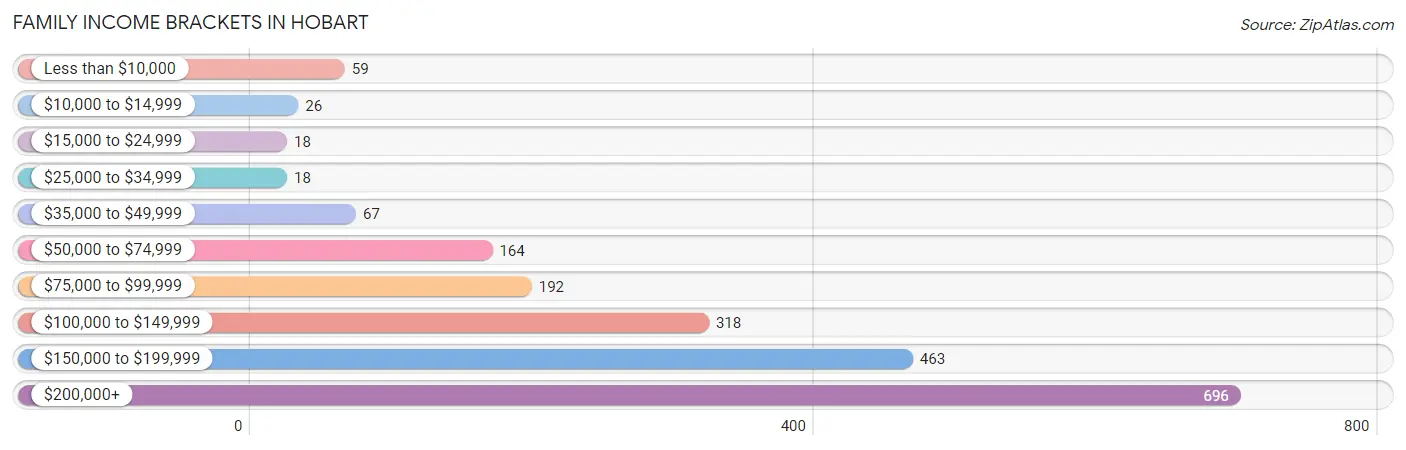
| Income Bracket | # Families | % Families |
| Less than $10,000 | 59 | 2.9% |
| $10,000 to $14,999 | 26 | 1.3% |
| $15,000 to $24,999 | 18 | 0.9% |
| $25,000 to $34,999 | 18 | 0.9% |
| $35,000 to $49,999 | 67 | 3.3% |
| $50,000 to $74,999 | 164 | 8.1% |
| $75,000 to $99,999 | 192 | 9.5% |
| $100,000 to $149,999 | 318 | 15.7% |
| $150,000 to $199,999 | 463 | 22.9% |
| $200,000+ | 696 | 34.4% |
Family Income by Famaliy Size in Hobart
5-person families (120 | 5.9%) account for the highest median family income in Hobart with $250,001 per family, while 2-person families (972 | 48.0%) have the highest median income of $77,812 per family member.
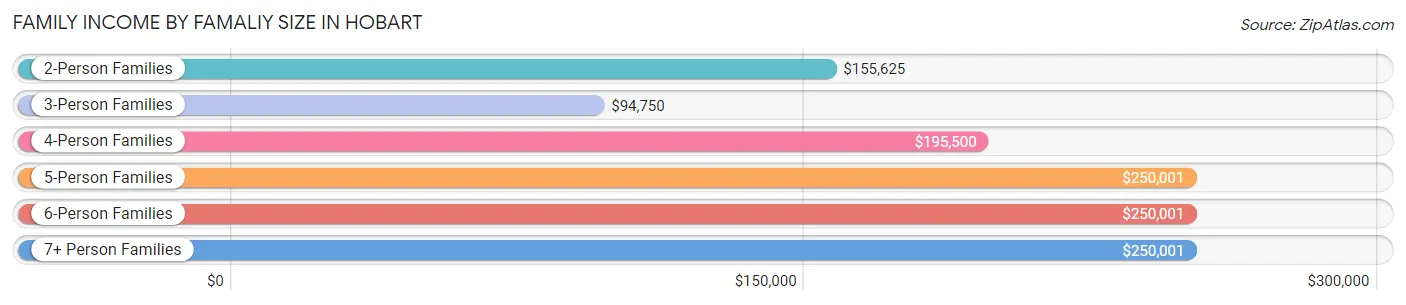
| Income Bracket | # Families | Median Income |
| 2-Person Families | 972 (48.0%) | $155,625 |
| 3-Person Families | 369 (18.2%) | $94,750 |
| 4-Person Families | 470 (23.2%) | $195,500 |
| 5-Person Families | 120 (5.9%) | $250,001 |
| 6-Person Families | 66 (3.3%) | $250,001 |
| 7+ Person Families | 27 (1.3%) | $250,001 |
| Total | 2,024 (100.0%) | $170,446 |
Family Income by Number of Earners in Hobart
The median family income in Hobart is $170,446, with families comprising 3+ earners (276) having the highest median family income of $213,750, while families with no earners (222) have the lowest median family income of $91,563, accounting for 13.6% and 11.0% of families, respectively.
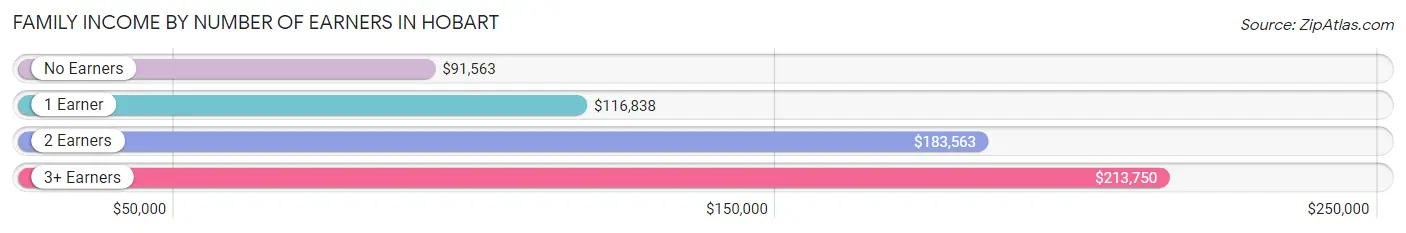
| Number of Earners | # Families | Median Income |
| No Earners | 222 (11.0%) | $91,563 |
| 1 Earner | 710 (35.1%) | $116,838 |
| 2 Earners | 816 (40.3%) | $183,563 |
| 3+ Earners | 276 (13.6%) | $213,750 |
| Total | 2,024 (100.0%) | $170,446 |
Household Income in Hobart
Household Income Brackets in Hobart
With 810 households falling in the category, the $200,000+ income range is the most frequent in Hobart, accounting for 31.4% of all households. In contrast, only 18 households (0.7%) fall into the $15,000 to $24,999 income bracket, making it the least populous group.
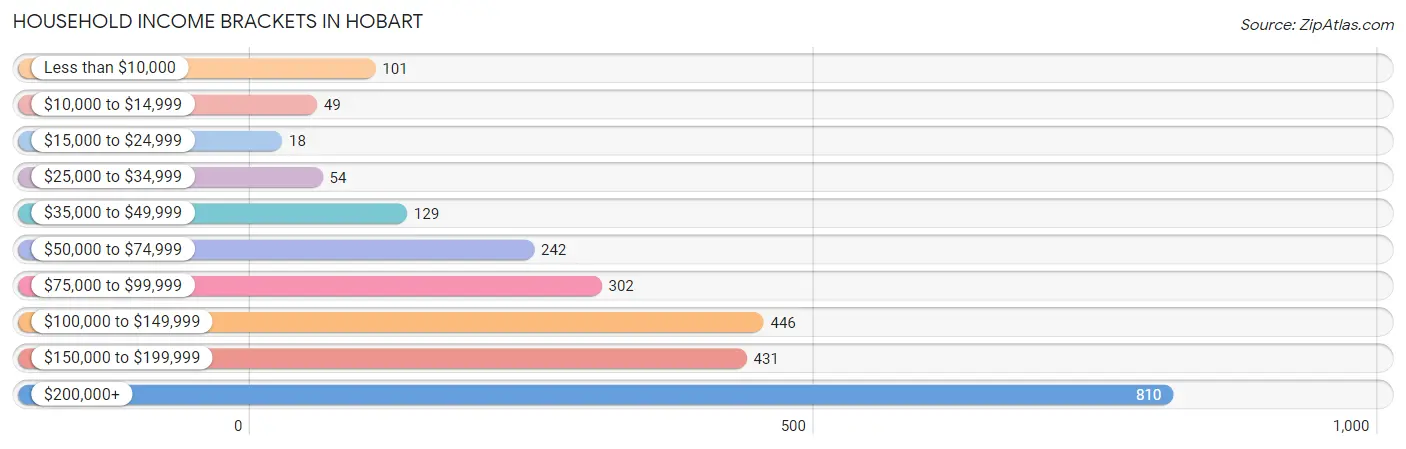
| Income Bracket | # Households | % Households |
| Less than $10,000 | 101 | 3.9% |
| $10,000 to $14,999 | 49 | 1.9% |
| $15,000 to $24,999 | 18 | 0.7% |
| $25,000 to $34,999 | 54 | 2.1% |
| $35,000 to $49,999 | 129 | 5.0% |
| $50,000 to $74,999 | 242 | 9.4% |
| $75,000 to $99,999 | 302 | 11.7% |
| $100,000 to $149,999 | 446 | 17.3% |
| $150,000 to $199,999 | 431 | 16.7% |
| $200,000+ | 810 | 31.4% |
Household Income by Householder Age in Hobart
The median household income in Hobart is $143,125, with the highest median household income of $163,750 found in the 25 to 44 years age bracket for the primary householder. A total of 786 households (30.5%) fall into this category. Meanwhile, the 15 to 24 years age bracket for the primary householder has the lowest median household income of $0, with 40 households (1.5%) in this group.
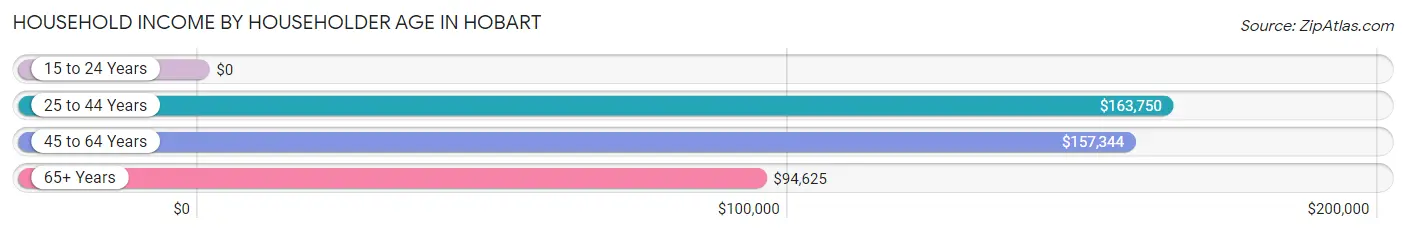
| Income Bracket | # Households | Median Income |
| 15 to 24 Years | 40 (1.5%) | $0 |
| 25 to 44 Years | 786 (30.5%) | $163,750 |
| 45 to 64 Years | 1,100 (42.6%) | $157,344 |
| 65+ Years | 653 (25.3%) | $94,625 |
| Total | 2,579 (100.0%) | $143,125 |
Poverty in Hobart
Income Below Poverty by Sex and Age in Hobart
With 5.9% poverty level for males and 3.5% for females among the residents of Hobart, under 5 year old males and 45 to 54 year old females are the most vulnerable to poverty, with 36 males (22.2%) and 35 females (6.5%) in their respective age groups living below the poverty level.
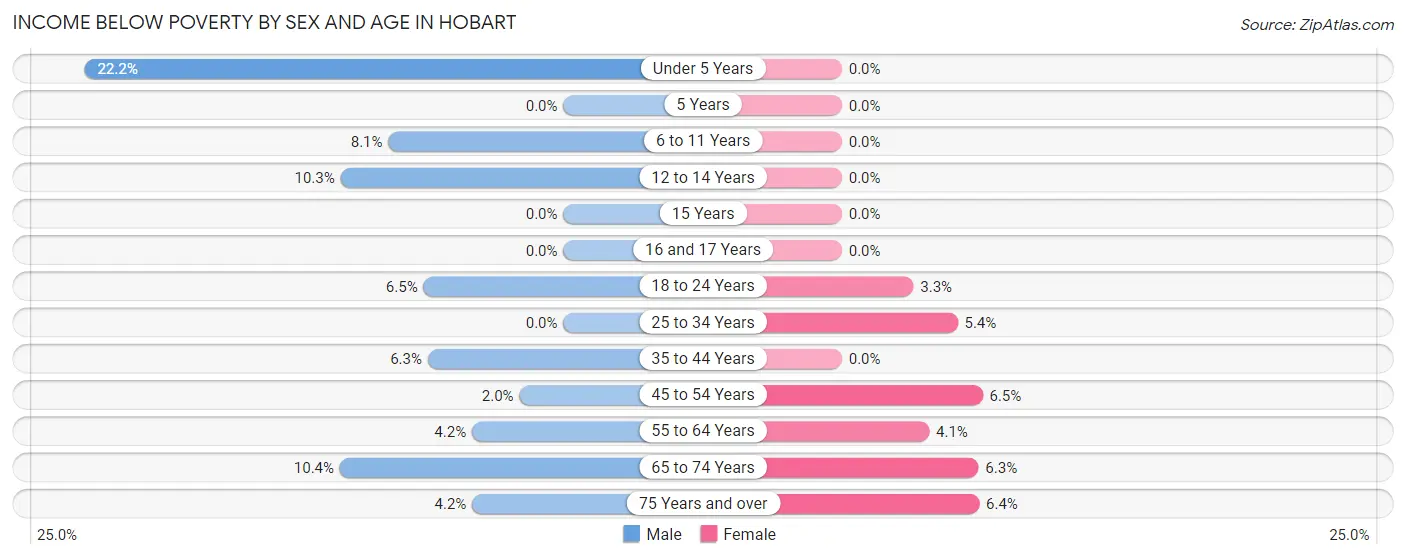
| Age Bracket | Male | Female |
| Under 5 Years | 36 (22.2%) | 0 (0.0%) |
| 5 Years | 0 (0.0%) | 0 (0.0%) |
| 6 to 11 Years | 31 (8.1%) | 0 (0.0%) |
| 12 to 14 Years | 18 (10.3%) | 0 (0.0%) |
| 15 Years | 0 (0.0%) | 0 (0.0%) |
| 16 and 17 Years | 0 (0.0%) | 0 (0.0%) |
| 18 to 24 Years | 17 (6.5%) | 10 (3.3%) |
| 25 to 34 Years | 0 (0.0%) | 16 (5.4%) |
| 35 to 44 Years | 33 (6.3%) | 0 (0.0%) |
| 45 to 54 Years | 10 (2.0%) | 35 (6.5%) |
| 55 to 64 Years | 28 (4.2%) | 19 (4.1%) |
| 65 to 74 Years | 36 (10.4%) | 30 (6.3%) |
| 75 Years and over | 9 (4.2%) | 10 (6.4%) |
| Total | 218 (5.9%) | 120 (3.5%) |
Income Above Poverty by Sex and Age in Hobart
According to the poverty statistics in Hobart, males aged 5 years and females aged under 5 years are the age groups that are most secure financially, with 100.0% of males and 100.0% of females in these age groups living above the poverty line.
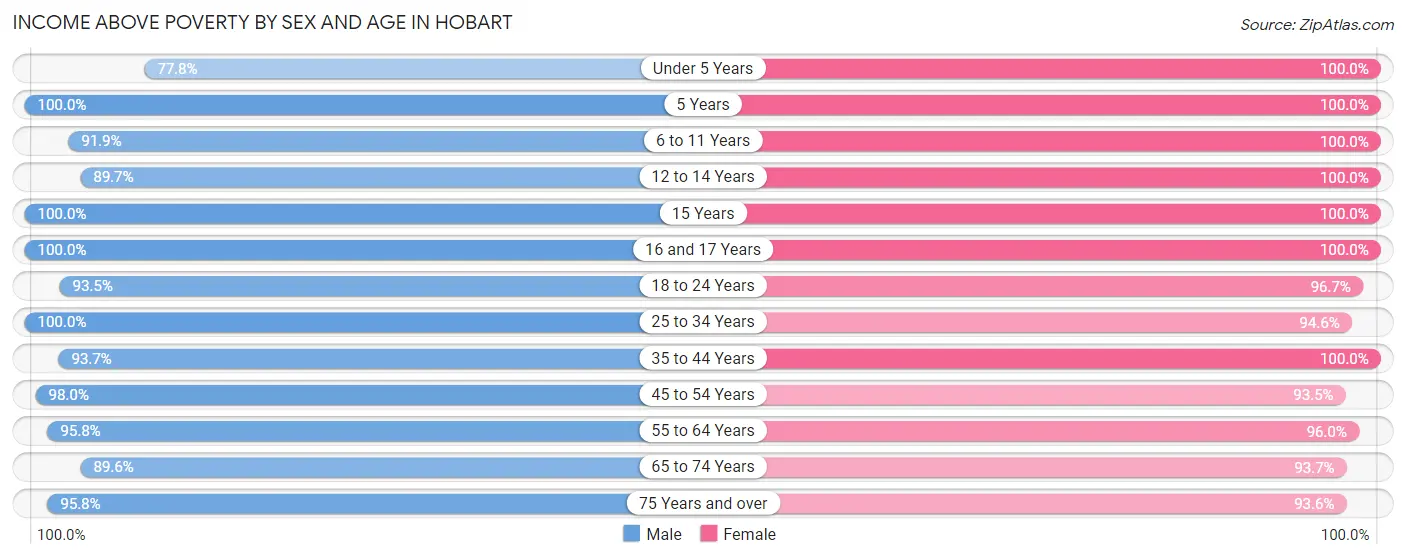
| Age Bracket | Male | Female |
| Under 5 Years | 126 (77.8%) | 96 (100.0%) |
| 5 Years | 17 (100.0%) | 18 (100.0%) |
| 6 to 11 Years | 351 (91.9%) | 296 (100.0%) |
| 12 to 14 Years | 156 (89.7%) | 123 (100.0%) |
| 15 Years | 46 (100.0%) | 43 (100.0%) |
| 16 and 17 Years | 89 (100.0%) | 135 (100.0%) |
| 18 to 24 Years | 245 (93.5%) | 291 (96.7%) |
| 25 to 34 Years | 310 (100.0%) | 282 (94.6%) |
| 35 to 44 Years | 492 (93.7%) | 479 (100.0%) |
| 45 to 54 Years | 481 (98.0%) | 501 (93.5%) |
| 55 to 64 Years | 632 (95.8%) | 450 (96.0%) |
| 65 to 74 Years | 311 (89.6%) | 443 (93.7%) |
| 75 Years and over | 204 (95.8%) | 147 (93.6%) |
| Total | 3,460 (94.1%) | 3,304 (96.5%) |
Income Below Poverty Among Married-Couple Families in Hobart
The poverty statistics for married-couple families in Hobart show that 2.5% or 44 of the total 1,762 families live below the poverty line. Families with no children have the highest poverty rate of 2.9%, comprising of 33 families. On the other hand, families with 3 or 4 children have the lowest poverty rate of 0.0%, which includes 0 families.
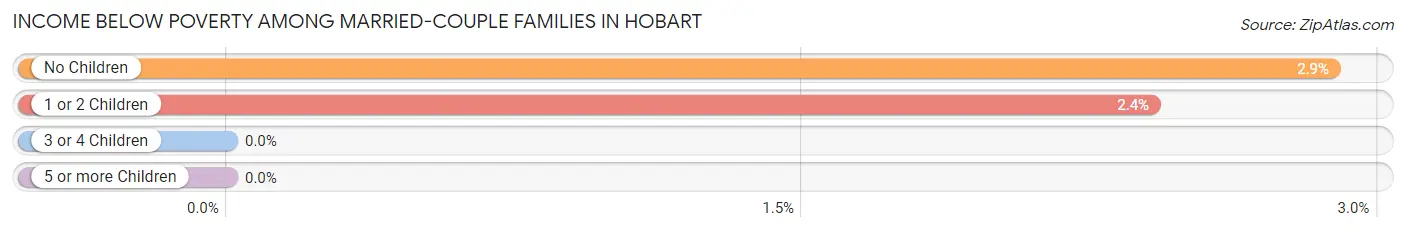
| Children | Above Poverty | Below Poverty |
| No Children | 1,111 (97.1%) | 33 (2.9%) |
| 1 or 2 Children | 445 (97.6%) | 11 (2.4%) |
| 3 or 4 Children | 162 (100.0%) | 0 (0.0%) |
| 5 or more Children | 0 (0.0%) | 0 (0.0%) |
| Total | 1,718 (97.5%) | 44 (2.5%) |
Income Below Poverty Among Single-Parent Households in Hobart
According to the poverty data in Hobart, 38.8% or 33 single-father households and 5.1% or 9 single-mother households are living below the poverty line. Among single-father households, those with 1 or 2 children have the highest poverty rate, with 33 households (61.1%) experiencing poverty. Likewise, among single-mother households, those with 1 or 2 children have the highest poverty rate, with 9 households (12.3%) falling below the poverty line.
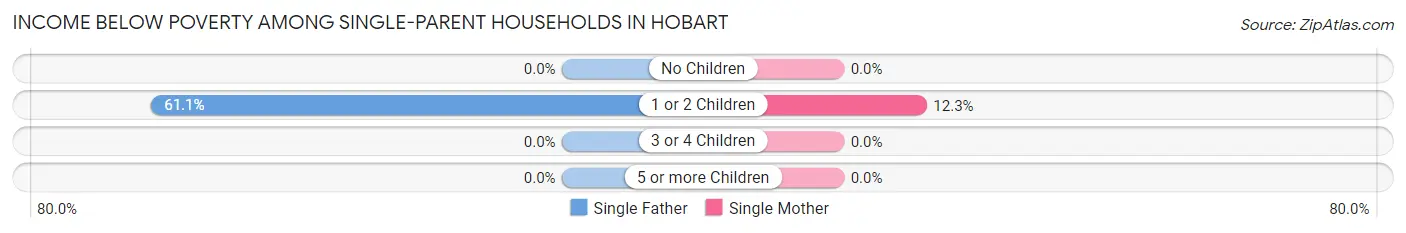
| Children | Single Father | Single Mother |
| No Children | 0 (0.0%) | 0 (0.0%) |
| 1 or 2 Children | 33 (61.1%) | 9 (12.3%) |
| 3 or 4 Children | 0 (0.0%) | 0 (0.0%) |
| 5 or more Children | 0 (0.0%) | 0 (0.0%) |
| Total | 33 (38.8%) | 9 (5.1%) |
Income Below Poverty Among Married-Couple vs Single-Parent Households in Hobart
The poverty data for Hobart shows that 44 of the married-couple family households (2.5%) and 42 of the single-parent households (16.0%) are living below the poverty level. Within the married-couple family households, those with no children have the highest poverty rate, with 33 households (2.9%) falling below the poverty line. Among the single-parent households, those with 1 or 2 children have the highest poverty rate, with 42 household (33.1%) living below poverty.
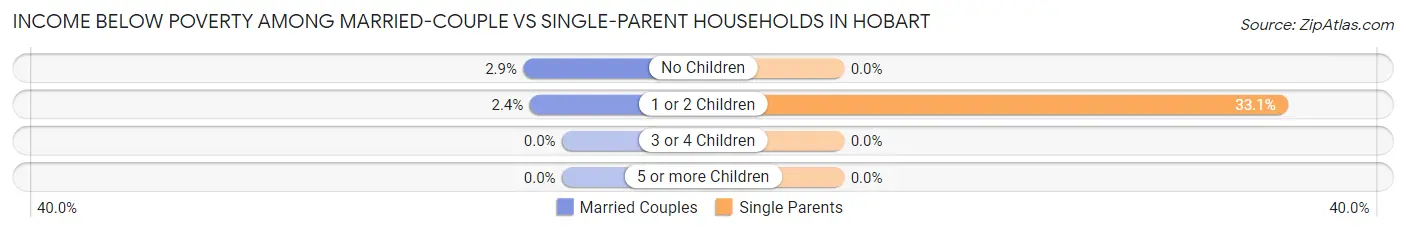
| Children | Married-Couple Families | Single-Parent Households |
| No Children | 33 (2.9%) | 0 (0.0%) |
| 1 or 2 Children | 11 (2.4%) | 42 (33.1%) |
| 3 or 4 Children | 0 (0.0%) | 0 (0.0%) |
| 5 or more Children | 0 (0.0%) | 0 (0.0%) |
| Total | 44 (2.5%) | 42 (16.0%) |
Race in Hobart
The most populous races in Hobart are White / Caucasian (5,971 | 83.5%), Two or more Races (624 | 8.7%), and Hispanic or Latino (621 | 8.7%).
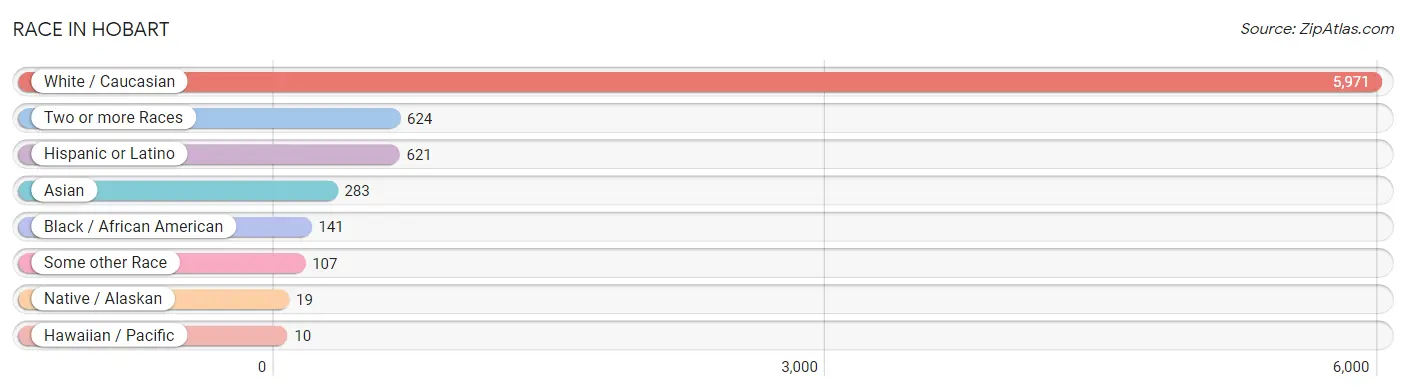
| Race | # Population | % Population |
| Asian | 283 | 4.0% |
| Black / African American | 141 | 2.0% |
| Hawaiian / Pacific | 10 | 0.1% |
| Hispanic or Latino | 621 | 8.7% |
| Native / Alaskan | 19 | 0.3% |
| White / Caucasian | 5,971 | 83.5% |
| Two or more Races | 624 | 8.7% |
| Some other Race | 107 | 1.5% |
| Total | 7,155 | 100.0% |
Ancestry in Hobart
The most populous ancestries reported in Hobart are German (1,025 | 14.3%), English (958 | 13.4%), Irish (615 | 8.6%), Norwegian (472 | 6.6%), and Polish (460 | 6.4%), together accounting for 49.3% of all Hobart residents.
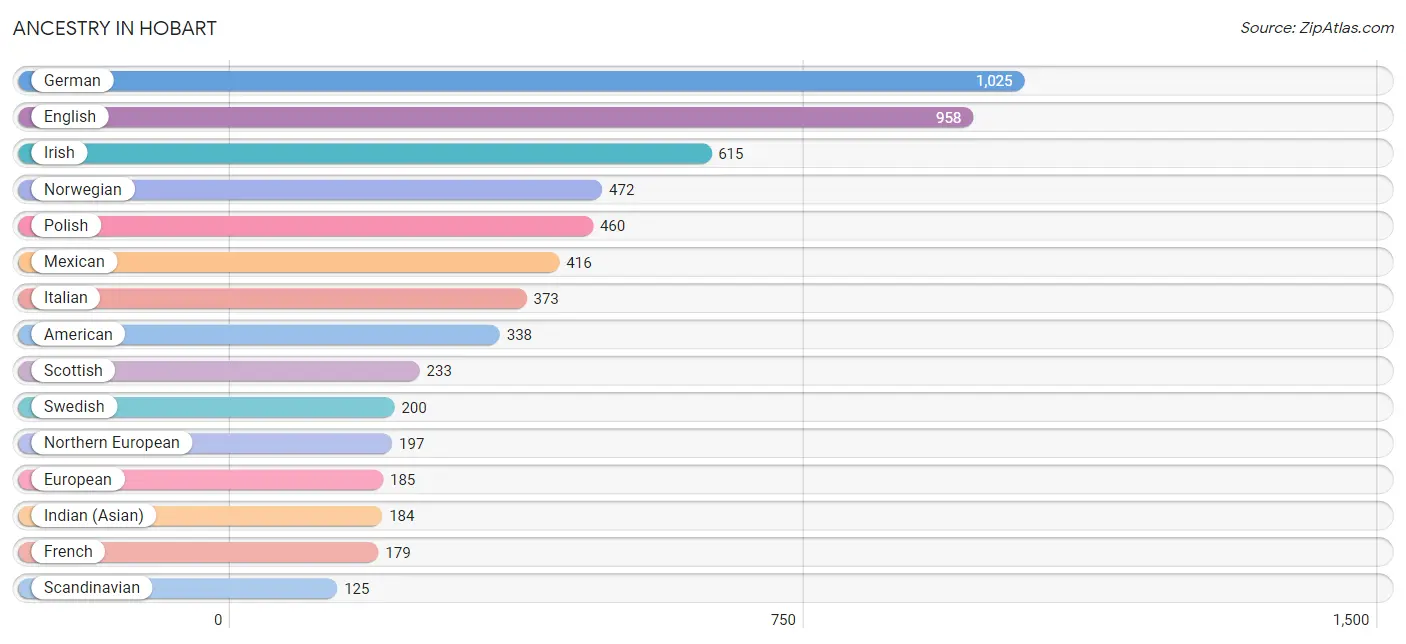
| Ancestry | # Population | % Population |
| African | 106 | 1.5% |
| American | 338 | 4.7% |
| Assyrian / Chaldean / Syriac | 10 | 0.1% |
| Austrian | 110 | 1.5% |
| Belgian | 12 | 0.2% |
| Bhutanese | 56 | 0.8% |
| Blackfeet | 8 | 0.1% |
| British | 73 | 1.0% |
| Burmese | 12 | 0.2% |
| Canadian | 57 | 0.8% |
| Central American | 101 | 1.4% |
| Cherokee | 10 | 0.1% |
| Colville | 6 | 0.1% |
| Croatian | 20 | 0.3% |
| Cuban | 43 | 0.6% |
| Czech | 22 | 0.3% |
| Danish | 99 | 1.4% |
| Dutch | 87 | 1.2% |
| Eastern European | 87 | 1.2% |
| English | 958 | 13.4% |
| European | 185 | 2.6% |
| Finnish | 62 | 0.9% |
| French | 179 | 2.5% |
| French American Indian | 8 | 0.1% |
| French Canadian | 24 | 0.3% |
| German | 1,025 | 14.3% |
| Greek | 95 | 1.3% |
| Honduran | 101 | 1.4% |
| Hungarian | 4 | 0.1% |
| Indian (Asian) | 184 | 2.6% |
| Irish | 615 | 8.6% |
| Italian | 373 | 5.2% |
| Japanese | 38 | 0.5% |
| Korean | 44 | 0.6% |
| Malaysian | 79 | 1.1% |
| Mexican | 416 | 5.8% |
| Northern European | 197 | 2.8% |
| Norwegian | 472 | 6.6% |
| Polish | 460 | 6.4% |
| Portuguese | 27 | 0.4% |
| Russian | 24 | 0.3% |
| Samoan | 10 | 0.1% |
| Scandinavian | 125 | 1.8% |
| Scotch-Irish | 58 | 0.8% |
| Scottish | 233 | 3.3% |
| Slovak | 6 | 0.1% |
| Spaniard | 41 | 0.6% |
| Spanish | 10 | 0.1% |
| Spanish American | 10 | 0.1% |
| Sri Lankan | 14 | 0.2% |
| Subsaharan African | 106 | 1.5% |
| Swedish | 200 | 2.8% |
| Swiss | 38 | 0.5% |
| Thai | 43 | 0.6% |
| Tlingit-Haida | 10 | 0.1% |
| Ukrainian | 8 | 0.1% |
| Welsh | 83 | 1.2% | View All 57 Rows |
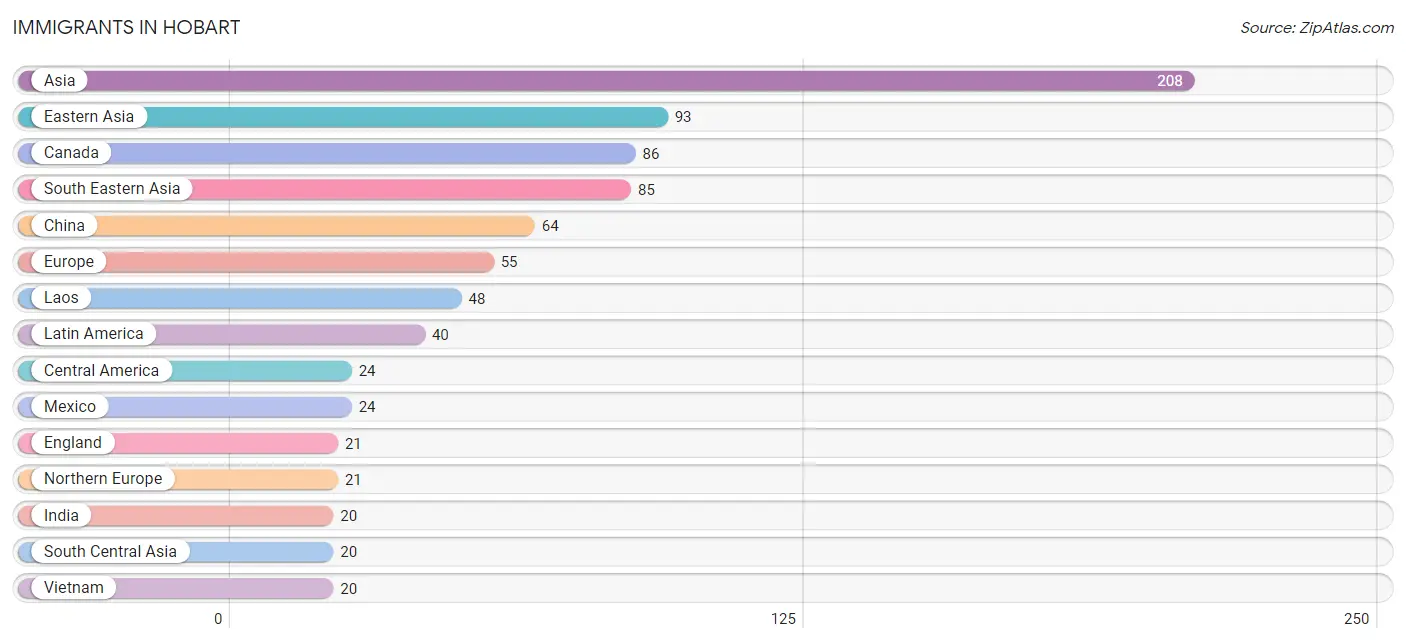
Immigrants in Hobart
The most numerous immigrant groups reported in Hobart came from Asia (208 | 2.9%), Eastern Asia (93 | 1.3%), Canada (86 | 1.2%), South Eastern Asia (85 | 1.2%), and China (64 | 0.9%), together accounting for 7.5% of all Hobart residents.
| Immigration Origin | # Population | % Population |
| Asia | 208 | 2.9% |
| Cambodia | 17 | 0.2% |
| Canada | 86 | 1.2% |
| Caribbean | 16 | 0.2% |
| Central America | 24 | 0.3% |
| China | 64 | 0.9% |
| Cuba | 16 | 0.2% |
| Czechoslovakia | 4 | 0.1% |
| Eastern Asia | 93 | 1.3% |
| Eastern Europe | 12 | 0.2% |
| England | 21 | 0.3% |
| Europe | 55 | 0.8% |
| Germany | 12 | 0.2% |
| India | 20 | 0.3% |
| Italy | 10 | 0.1% |
| Japan | 17 | 0.2% |
| Korea | 12 | 0.2% |
| Laos | 48 | 0.7% |
| Latin America | 40 | 0.6% |
| Mexico | 24 | 0.3% |
| Northern Europe | 21 | 0.3% |
| Russia | 8 | 0.1% |
| South Central Asia | 20 | 0.3% |
| South Eastern Asia | 85 | 1.2% |
| Southern Europe | 10 | 0.1% |
| Vietnam | 20 | 0.3% |
| Western Europe | 12 | 0.2% | View All 27 Rows |
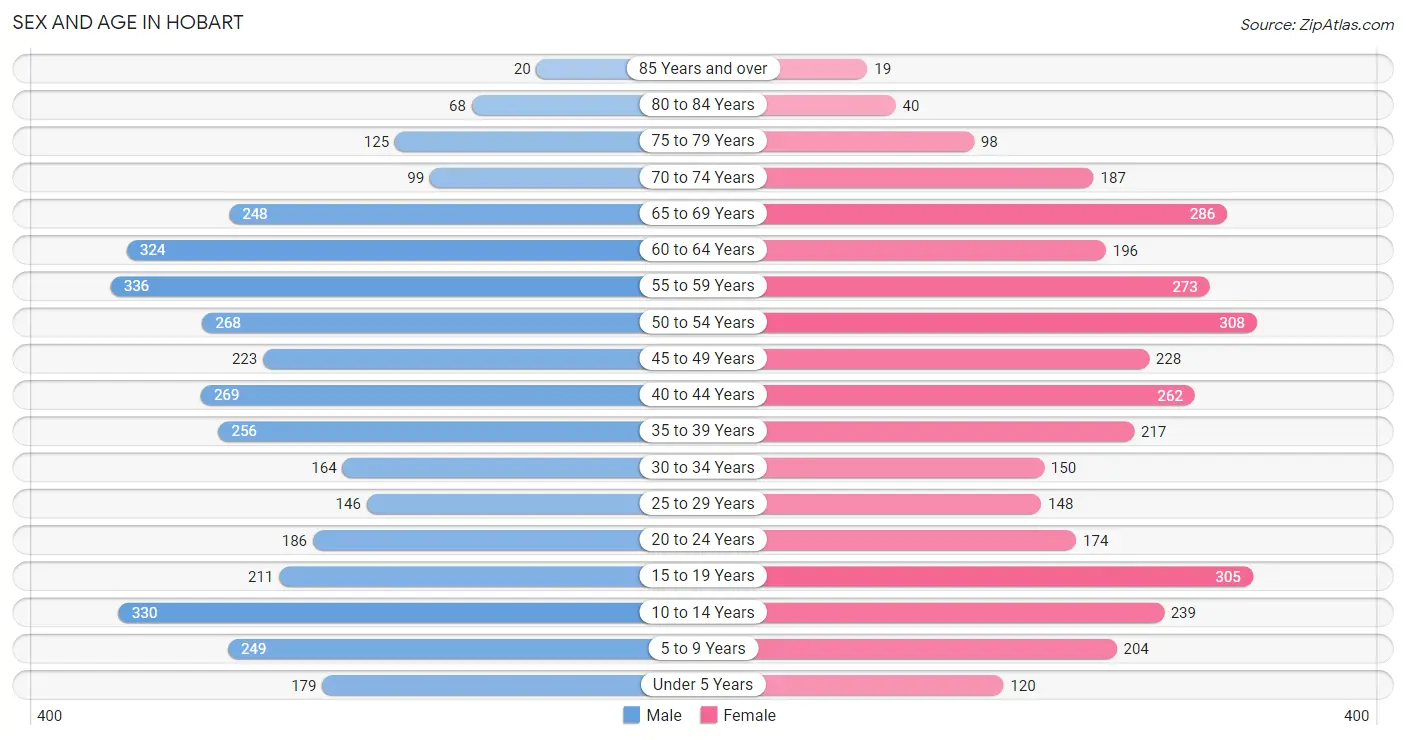
Sex and Age in Hobart
Sex and Age in Hobart
The most populous age groups in Hobart are 55 to 59 Years (336 | 9.1%) for men and 50 to 54 Years (308 | 8.9%) for women.
| Age Bracket | Male | Female |
| Under 5 Years | 179 (4.8%) | 120 (3.5%) |
| 5 to 9 Years | 249 (6.7%) | 204 (5.9%) |
| 10 to 14 Years | 330 (8.9%) | 239 (6.9%) |
| 15 to 19 Years | 211 (5.7%) | 305 (8.8%) |
| 20 to 24 Years | 186 (5.0%) | 174 (5.0%) |
| 25 to 29 Years | 146 (3.9%) | 148 (4.3%) |
| 30 to 34 Years | 164 (4.4%) | 150 (4.3%) |
| 35 to 39 Years | 256 (6.9%) | 217 (6.3%) |
| 40 to 44 Years | 269 (7.3%) | 262 (7.6%) |
| 45 to 49 Years | 223 (6.0%) | 228 (6.6%) |
| 50 to 54 Years | 268 (7.2%) | 308 (8.9%) |
| 55 to 59 Years | 336 (9.1%) | 273 (7.9%) |
| 60 to 64 Years | 324 (8.7%) | 196 (5.7%) |
| 65 to 69 Years | 248 (6.7%) | 286 (8.3%) |
| 70 to 74 Years | 99 (2.7%) | 187 (5.4%) |
| 75 to 79 Years | 125 (3.4%) | 98 (2.8%) |
| 80 to 84 Years | 68 (1.8%) | 40 (1.2%) |
| 85 Years and over | 20 (0.5%) | 19 (0.5%) |
| Total | 3,701 (100.0%) | 3,454 (100.0%) |
Families and Households in Hobart
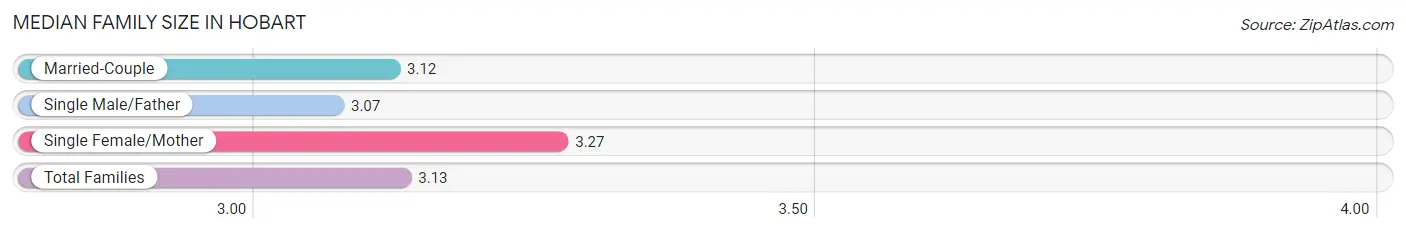
Median Family Size in Hobart
The median family size in Hobart is 3.13 persons per family, with single female/mother families (177 | 8.7%) accounting for the largest median family size of 3.27 persons per family. On the other hand, single male/father families (85 | 4.2%) represent the smallest median family size with 3.07 persons per family.
| Family Type | # Families | Family Size |
| Married-Couple | 1,762 (87.1%) | 3.12 |
| Single Male/Father | 85 (4.2%) | 3.07 |
| Single Female/Mother | 177 (8.7%) | 3.27 |
| Total Families | 2,024 (100.0%) | 3.13 |
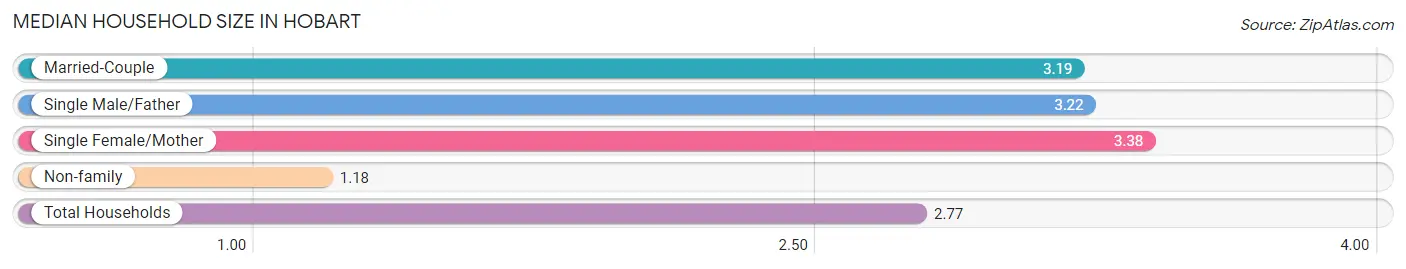
Median Household Size in Hobart
The median household size in Hobart is 2.77 persons per household, with single female/mother households (177 | 6.9%) accounting for the largest median household size of 3.38 persons per household. non-family households (555 | 21.5%) represent the smallest median household size with 1.18 persons per household.
| Household Type | # Households | Household Size |
| Married-Couple | 1,762 (68.3%) | 3.19 |
| Single Male/Father | 85 (3.3%) | 3.22 |
| Single Female/Mother | 177 (6.9%) | 3.38 |
| Non-family | 555 (21.5%) | 1.18 |
| Total Households | 2,579 (100.0%) | 2.77 |
Household Size by Marriage Status in Hobart
Out of a total of 2,579 households in Hobart, 2,024 (78.5%) are family households, while 555 (21.5%) are nonfamily households. The most numerous type of family households are 2-person households, comprising 954, and the most common type of nonfamily households are 1-person households, comprising 452.
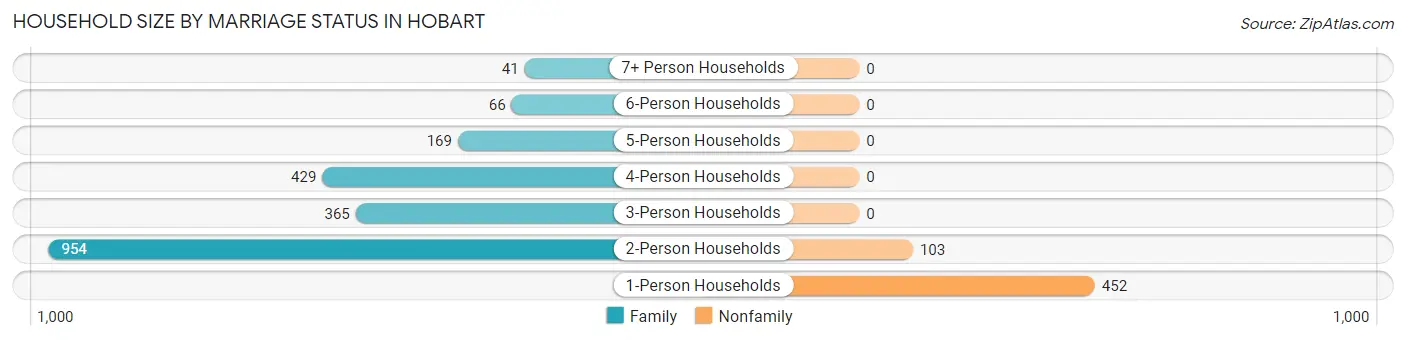
| Household Size | Family Households | Nonfamily Households |
| 1-Person Households | - | 452 (17.5%) |
| 2-Person Households | 954 (37.0%) | 103 (4.0%) |
| 3-Person Households | 365 (14.1%) | 0 (0.0%) |
| 4-Person Households | 429 (16.6%) | 0 (0.0%) |
| 5-Person Households | 169 (6.6%) | 0 (0.0%) |
| 6-Person Households | 66 (2.6%) | 0 (0.0%) |
| 7+ Person Households | 41 (1.6%) | 0 (0.0%) |
| Total | 2,024 (78.5%) | 555 (21.5%) |
Female Fertility in Hobart
Fertility by Age in Hobart
Average fertility rate in Hobart is 5.0 births per 1,000 women. Women in the age bracket of 20 to 34 years have the highest fertility rate with 15.0 births per 1,000 women. Women in the age bracket of 20 to 34 years acount for 100.0% of all women with births.
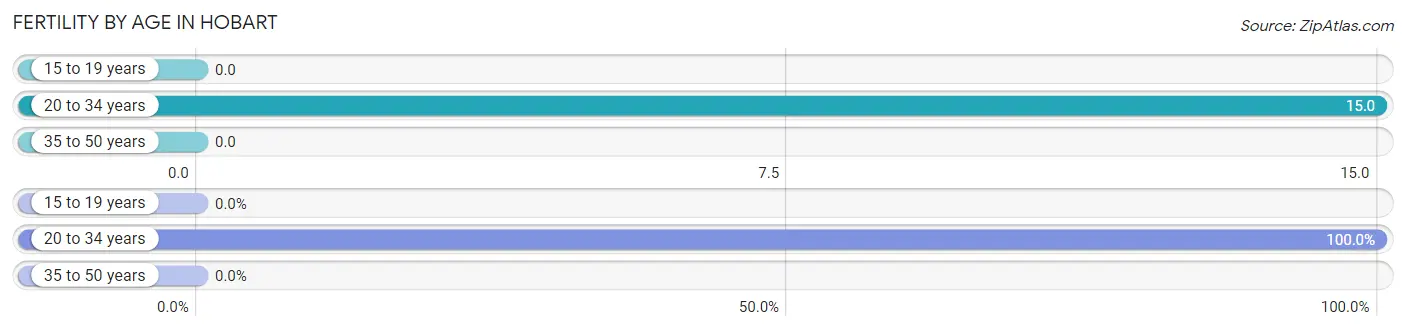
| Age Bracket | Women with Births | Births / 1,000 Women |
| 15 to 19 years | 0 (0.0%) | 0.0 |
| 20 to 34 years | 7 (100.0%) | 15.0 |
| 35 to 50 years | 0 (0.0%) | 0.0 |
| Total | 7 (100.0%) | 5.0 |
Fertility by Age by Marriage Status in Hobart
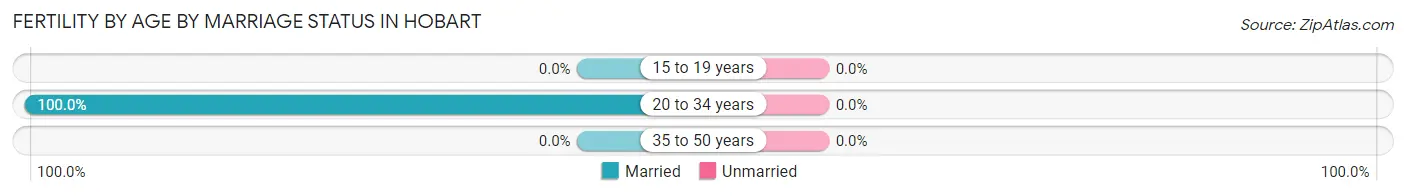
| Age Bracket | Married | Unmarried |
| 15 to 19 years | 0 (0.0%) | 0 (0.0%) |
| 20 to 34 years | 7 (100.0%) | 0 (0.0%) |
| 35 to 50 years | 0 (0.0%) | 0 (0.0%) |
| Total | 7 (100.0%) | 0 (0.0%) |
Fertility by Education in Hobart
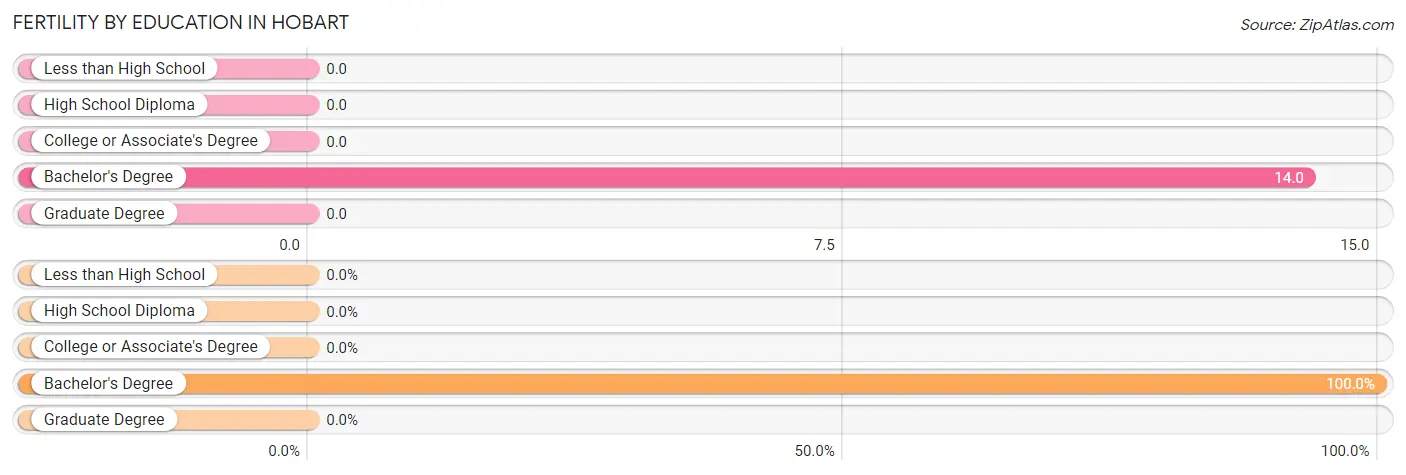
| Educational Attainment | Women with Births | Births / 1,000 Women |
| Less than High School | 0 (0.0%) | 0.0 |
| High School Diploma | 0 (0.0%) | 0.0 |
| College or Associate's Degree | 0 (0.0%) | 0.0 |
| Bachelor's Degree | 7 (100.0%) | 14.0 |
| Graduate Degree | 0 (0.0%) | 0.0 |
| Total | 7 (100.0%) | 5.0 |
Fertility by Education by Marriage Status in Hobart
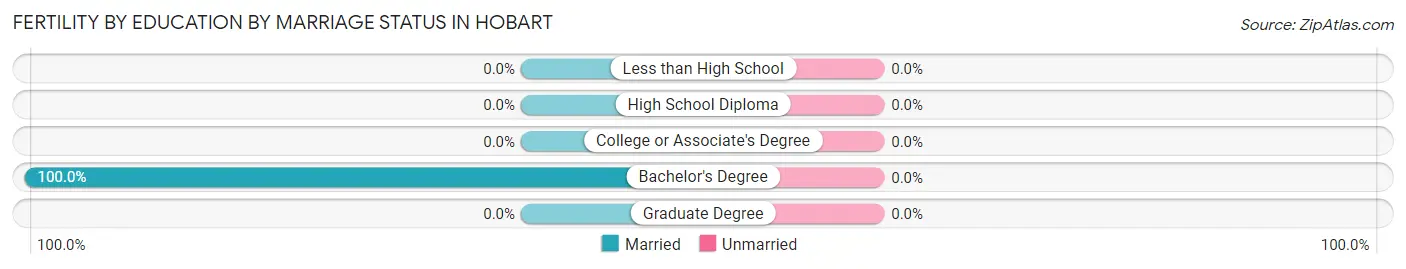
| Educational Attainment | Married | Unmarried |
| Less than High School | 0 (0.0%) | 0 (0.0%) |
| High School Diploma | 0 (0.0%) | 0 (0.0%) |
| College or Associate's Degree | 0 (0.0%) | 0 (0.0%) |
| Bachelor's Degree | 7 (100.0%) | 0 (0.0%) |
| Graduate Degree | 0 (0.0%) | 0 (0.0%) |
| Total | 7 (100.0%) | 0 (0.0%) |
Employment Characteristics in Hobart
Employment by Class of Employer in Hobart
Among the 3,522 employed individuals in Hobart, private company employees (2,224 | 63.1%), local government employees (306 | 8.7%), and self-employed (incorporated) (305 | 8.7%) make up the most common classes of employment.
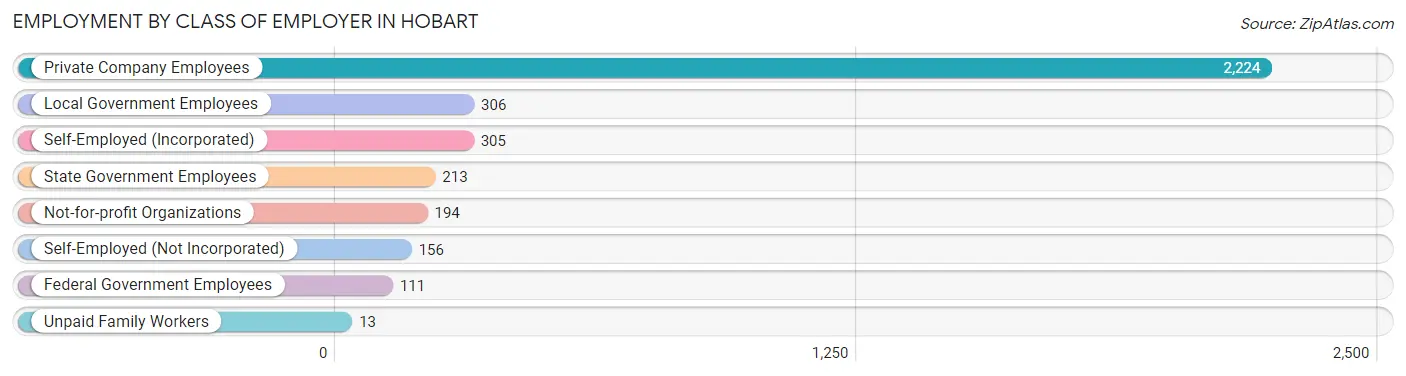
| Employer Class | # Employees | % Employees |
| Private Company Employees | 2,224 | 63.1% |
| Self-Employed (Incorporated) | 305 | 8.7% |
| Self-Employed (Not Incorporated) | 156 | 4.4% |
| Not-for-profit Organizations | 194 | 5.5% |
| Local Government Employees | 306 | 8.7% |
| State Government Employees | 213 | 6.0% |
| Federal Government Employees | 111 | 3.2% |
| Unpaid Family Workers | 13 | 0.4% |
| Total | 3,522 | 100.0% |
Employment Status by Age in Hobart
According to the labor force statistics for Hobart, out of the total population over 16 years of age (5,745), 63.7% or 3,660 individuals are in the labor force, with 3.4% or 124 of them unemployed. The age group with the highest labor force participation rate is 25 to 29 years, with 100.0% or 294 individuals in the labor force. Within the labor force, the 20 to 24 years age range has the highest percentage of unemployed individuals, with 18.0% or 53 of them being unemployed.
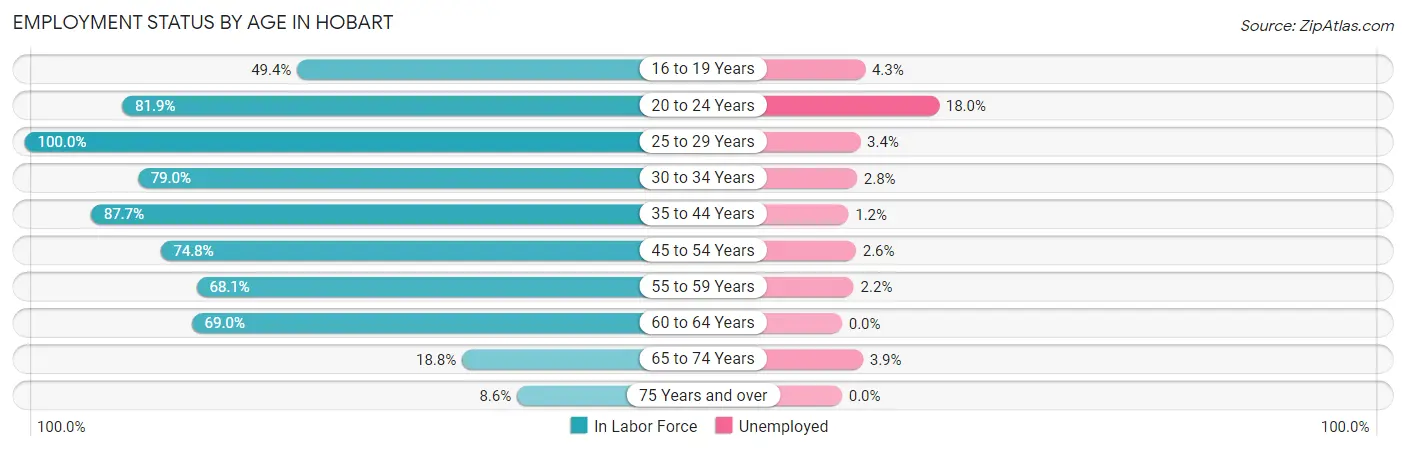
| Age Bracket | In Labor Force | Unemployed |
| 16 to 19 Years | 211 (49.4%) | 9 (4.3%) |
| 20 to 24 Years | 295 (81.9%) | 53 (18.0%) |
| 25 to 29 Years | 294 (100.0%) | 10 (3.4%) |
| 30 to 34 Years | 248 (79.0%) | 7 (2.8%) |
| 35 to 44 Years | 881 (87.7%) | 11 (1.2%) |
| 45 to 54 Years | 768 (74.8%) | 20 (2.6%) |
| 55 to 59 Years | 415 (68.1%) | 9 (2.2%) |
| 60 to 64 Years | 359 (69.0%) | 0 (0.0%) |
| 65 to 74 Years | 154 (18.8%) | 6 (3.9%) |
| 75 Years and over | 32 (8.6%) | 0 (0.0%) |
| Total | 3,660 (63.7%) | 124 (3.4%) |
Employment Status by Educational Attainment in Hobart
According to labor force statistics for Hobart, 78.7% of individuals (2,965) out of the total population between 25 and 64 years of age (3,768) are in the labor force, with 1.9% or 56 of them being unemployed. The group with the highest labor force participation rate are those with the educational attainment of bachelor's degree or higher, with 86.1% or 1,596 individuals in the labor force. Within the labor force, individuals with high school diploma education have the highest percentage of unemployment, with 8.2% or 28 of them being unemployed.
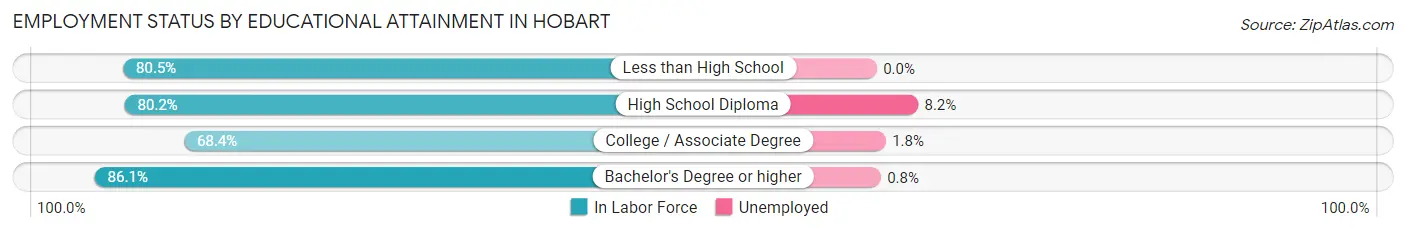
| Educational Attainment | In Labor Force | Unemployed |
| Less than High School | 66 (80.5%) | 0 (0.0%) |
| High School Diploma | 340 (80.2%) | 35 (8.2%) |
| College / Associate Degree | 963 (68.4%) | 25 (1.8%) |
| Bachelor's Degree or higher | 1,596 (86.1%) | 15 (0.8%) |
| Total | 2,965 (78.7%) | 72 (1.9%) |
Employment Occupations by Sex in Hobart
Management, Business, Science and Arts Occupations
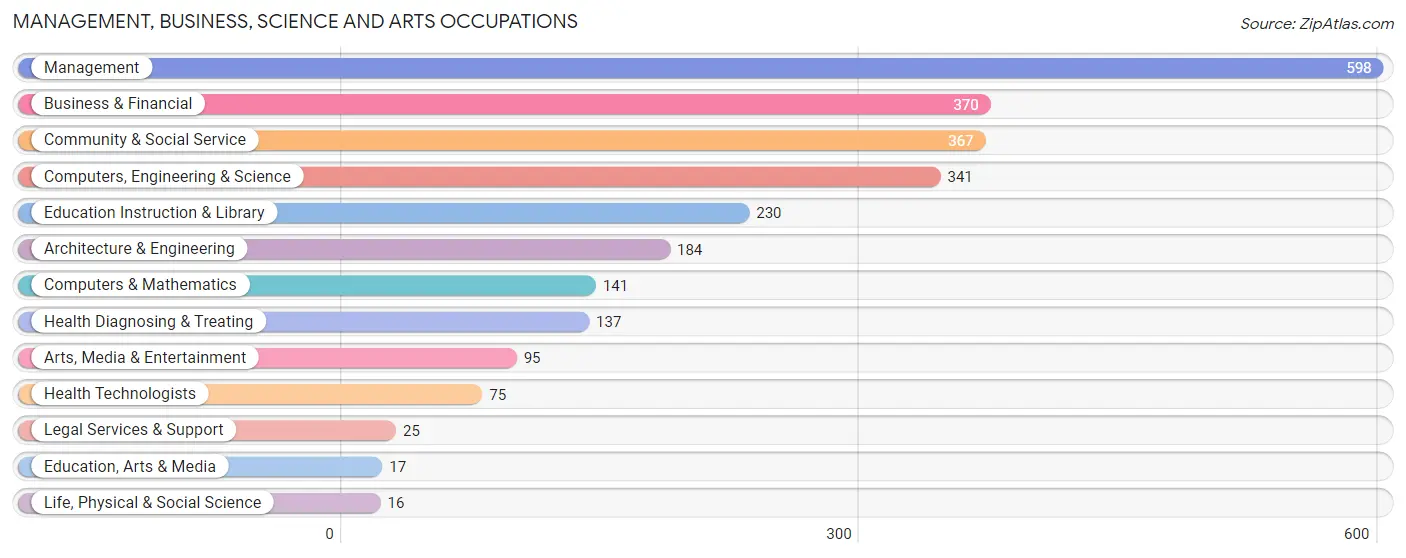
The most common Management, Business, Science and Arts occupations in Hobart are Management (598 | 16.9%), Business & Financial (370 | 10.5%), Community & Social Service (367 | 10.4%), Computers, Engineering & Science (341 | 9.7%), and Education Instruction & Library (230 | 6.5%).
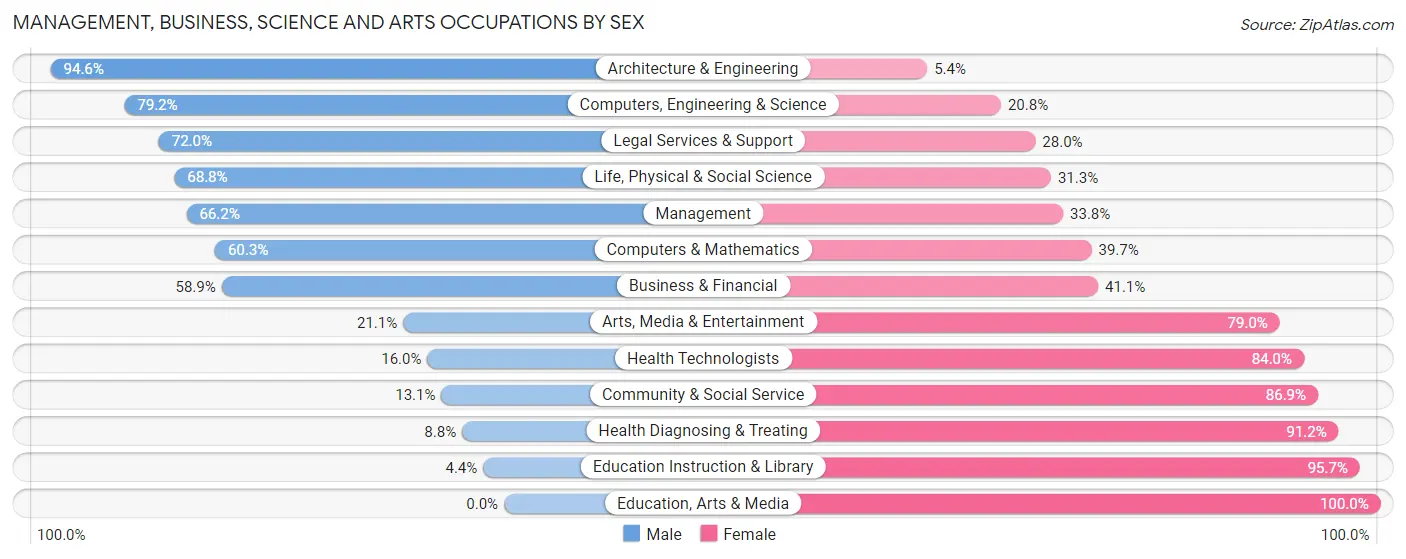
Management, Business, Science and Arts Occupations by Sex
Within the Management, Business, Science and Arts occupations in Hobart, the most male-oriented occupations are Architecture & Engineering (94.6%), Computers, Engineering & Science (79.2%), and Legal Services & Support (72.0%), while the most female-oriented occupations are Education, Arts & Media (100.0%), Education Instruction & Library (95.7%), and Health Diagnosing & Treating (91.2%).
| Occupation | Male | Female |
| Management | 396 (66.2%) | 202 (33.8%) |
| Business & Financial | 218 (58.9%) | 152 (41.1%) |
| Computers, Engineering & Science | 270 (79.2%) | 71 (20.8%) |
| Computers & Mathematics | 85 (60.3%) | 56 (39.7%) |
| Architecture & Engineering | 174 (94.6%) | 10 (5.4%) |
| Life, Physical & Social Science | 11 (68.8%) | 5 (31.2%) |
| Community & Social Service | 48 (13.1%) | 319 (86.9%) |
| Education, Arts & Media | 0 (0.0%) | 17 (100.0%) |
| Legal Services & Support | 18 (72.0%) | 7 (28.0%) |
| Education Instruction & Library | 10 (4.3%) | 220 (95.7%) |
| Arts, Media & Entertainment | 20 (21.0%) | 75 (78.9%) |
| Health Diagnosing & Treating | 12 (8.8%) | 125 (91.2%) |
| Health Technologists | 12 (16.0%) | 63 (84.0%) |
| Total (Category) | 944 (52.1%) | 869 (47.9%) |
| Total (Overall) | 1,951 (55.2%) | 1,581 (44.8%) |
Services Occupations
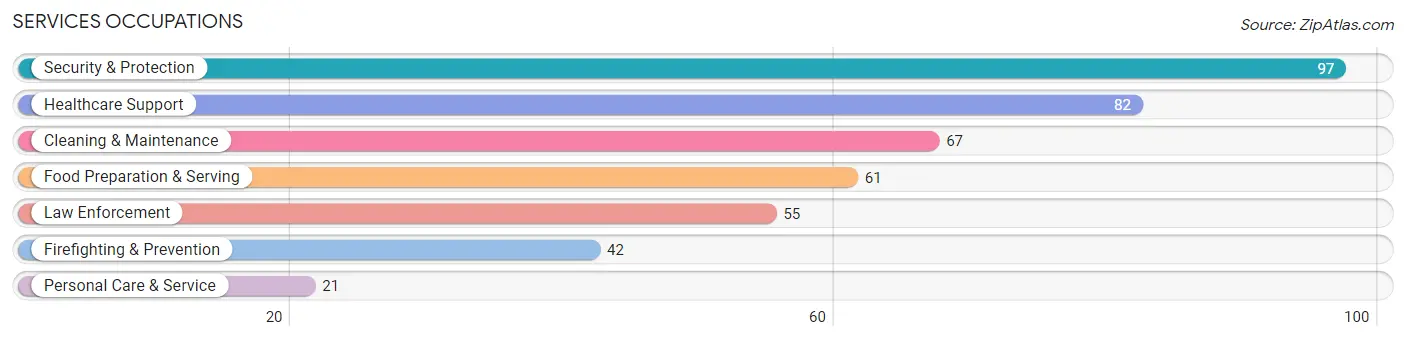
The most common Services occupations in Hobart are Security & Protection (97 | 2.8%), Healthcare Support (82 | 2.3%), Cleaning & Maintenance (67 | 1.9%), Food Preparation & Serving (61 | 1.7%), and Law Enforcement (55 | 1.6%).
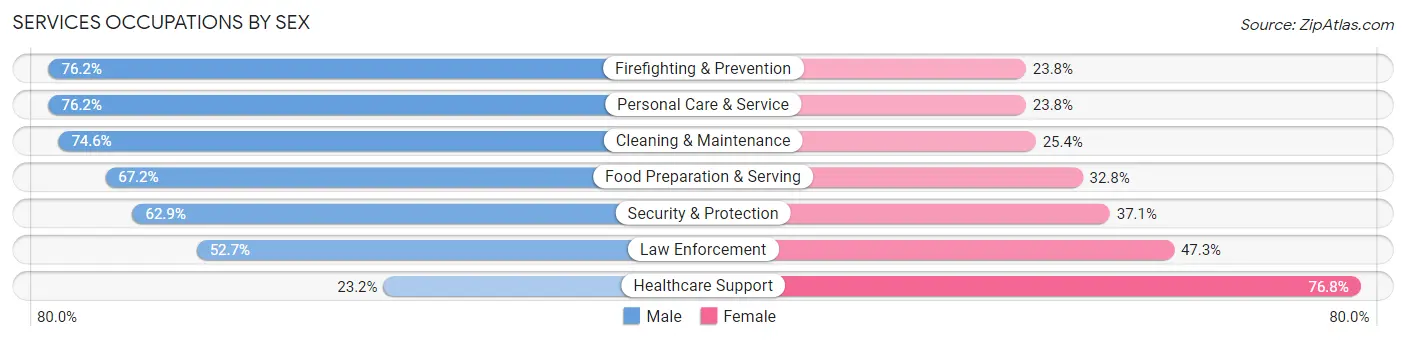
Services Occupations by Sex
Within the Services occupations in Hobart, the most male-oriented occupations are Firefighting & Prevention (76.2%), Personal Care & Service (76.2%), and Cleaning & Maintenance (74.6%), while the most female-oriented occupations are Healthcare Support (76.8%), Law Enforcement (47.3%), and Security & Protection (37.1%).
| Occupation | Male | Female |
| Healthcare Support | 19 (23.2%) | 63 (76.8%) |
| Security & Protection | 61 (62.9%) | 36 (37.1%) |
| Firefighting & Prevention | 32 (76.2%) | 10 (23.8%) |
| Law Enforcement | 29 (52.7%) | 26 (47.3%) |
| Food Preparation & Serving | 41 (67.2%) | 20 (32.8%) |
| Cleaning & Maintenance | 50 (74.6%) | 17 (25.4%) |
| Personal Care & Service | 16 (76.2%) | 5 (23.8%) |
| Total (Category) | 187 (57.0%) | 141 (43.0%) |
| Total (Overall) | 1,951 (55.2%) | 1,581 (44.8%) |
Sales and Office Occupations
The most common Sales and Office occupations in Hobart are Office & Administration (451 | 12.8%), and Sales & Related (330 | 9.3%).
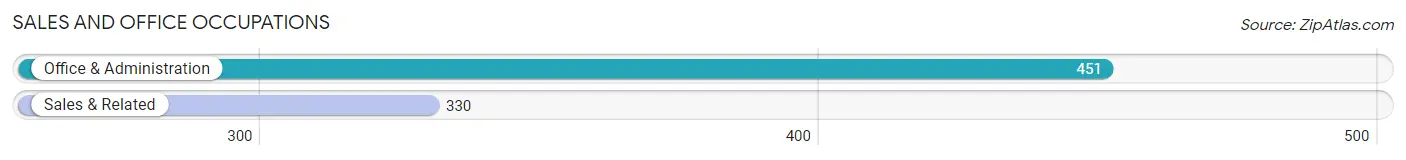
Sales and Office Occupations by Sex
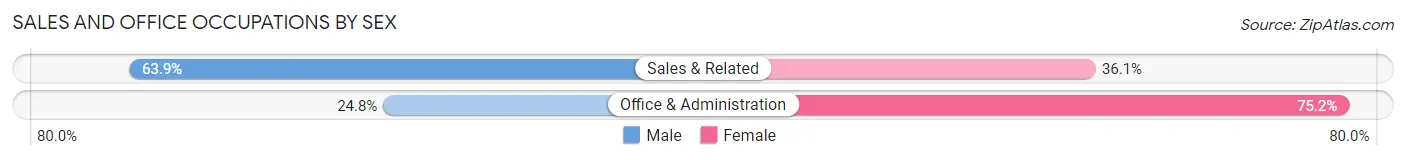
| Occupation | Male | Female |
| Sales & Related | 211 (63.9%) | 119 (36.1%) |
| Office & Administration | 112 (24.8%) | 339 (75.2%) |
| Total (Category) | 323 (41.4%) | 458 (58.6%) |
| Total (Overall) | 1,951 (55.2%) | 1,581 (44.8%) |
Natural Resources, Construction and Maintenance Occupations
The most common Natural Resources, Construction and Maintenance occupations in Hobart are Construction & Extraction (178 | 5.0%), and Installation, Maintenance & Repair (100 | 2.8%).
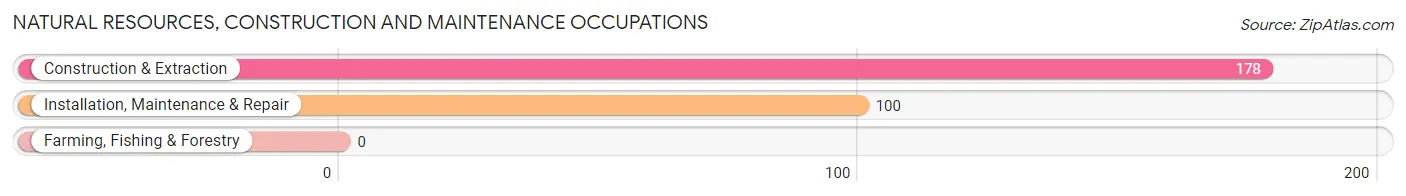
Natural Resources, Construction and Maintenance Occupations by Sex
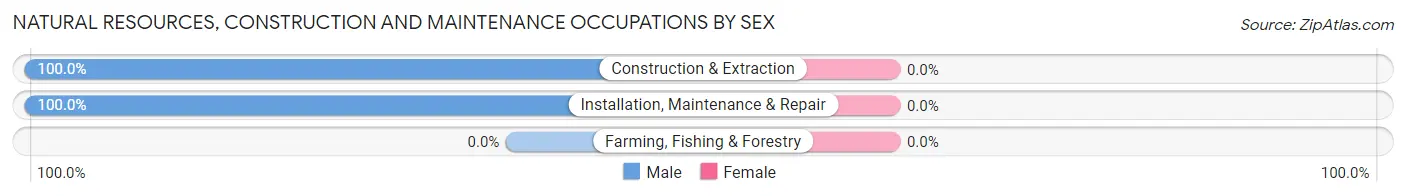
| Occupation | Male | Female |
| Farming, Fishing & Forestry | 0 (0.0%) | 0 (0.0%) |
| Construction & Extraction | 178 (100.0%) | 0 (0.0%) |
| Installation, Maintenance & Repair | 100 (100.0%) | 0 (0.0%) |
| Total (Category) | 278 (100.0%) | 0 (0.0%) |
| Total (Overall) | 1,951 (55.2%) | 1,581 (44.8%) |
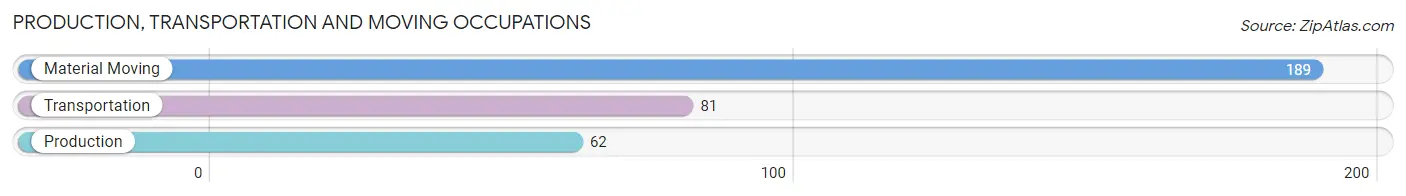
Production, Transportation and Moving Occupations
The most common Production, Transportation and Moving occupations in Hobart are Material Moving (189 | 5.3%), Transportation (81 | 2.3%), and Production (62 | 1.8%).
Production, Transportation and Moving Occupations by Sex
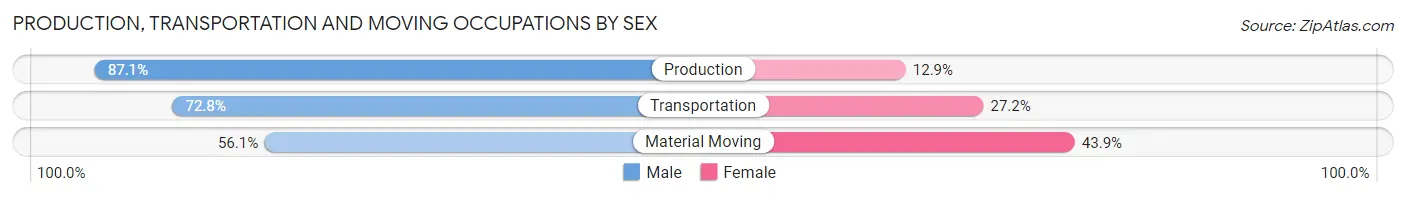
| Occupation | Male | Female |
| Production | 54 (87.1%) | 8 (12.9%) |
| Transportation | 59 (72.8%) | 22 (27.2%) |
| Material Moving | 106 (56.1%) | 83 (43.9%) |
| Total (Category) | 219 (66.0%) | 113 (34.0%) |
| Total (Overall) | 1,951 (55.2%) | 1,581 (44.8%) |
Employment Industries by Sex in Hobart
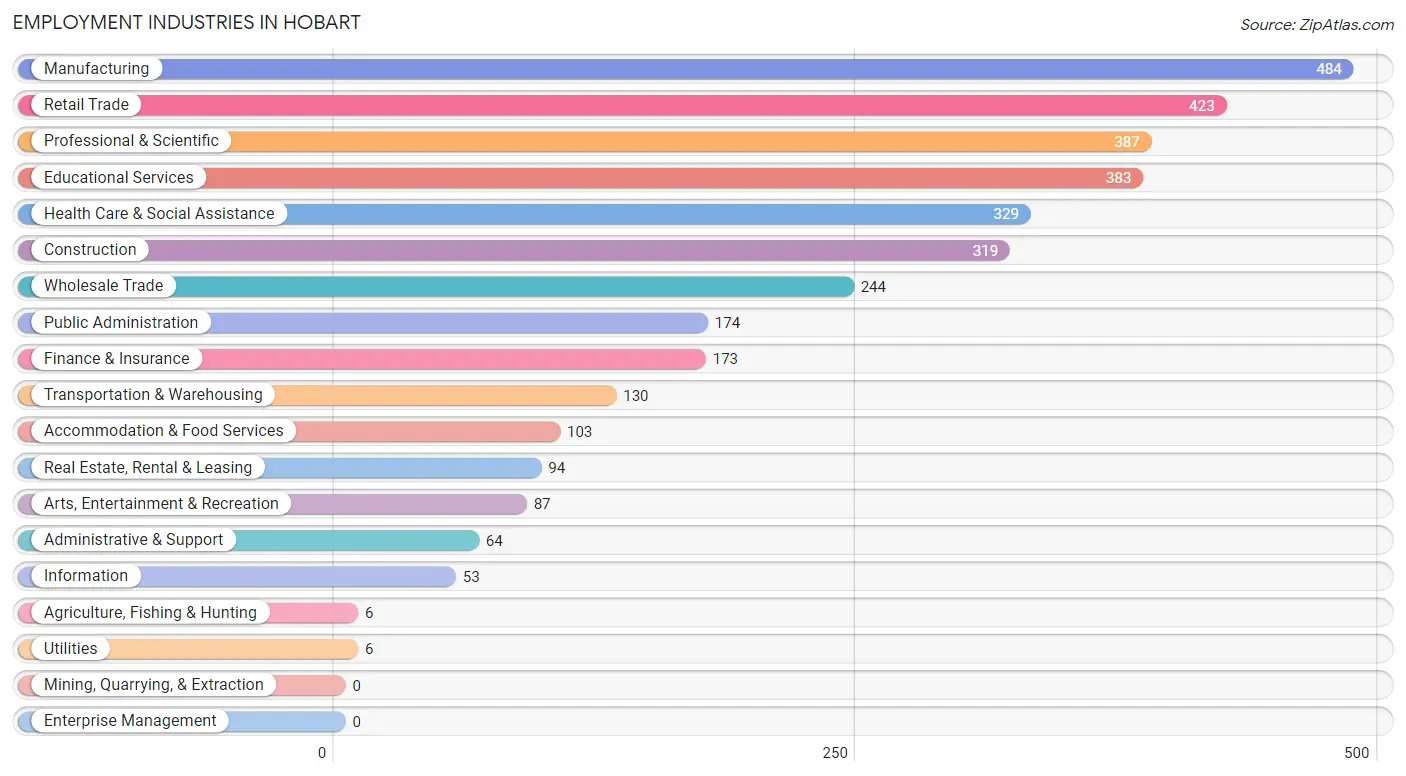
Employment Industries in Hobart
The major employment industries in Hobart include Manufacturing (484 | 13.7%), Retail Trade (423 | 12.0%), Professional & Scientific (387 | 11.0%), Educational Services (383 | 10.8%), and Health Care & Social Assistance (329 | 9.3%).
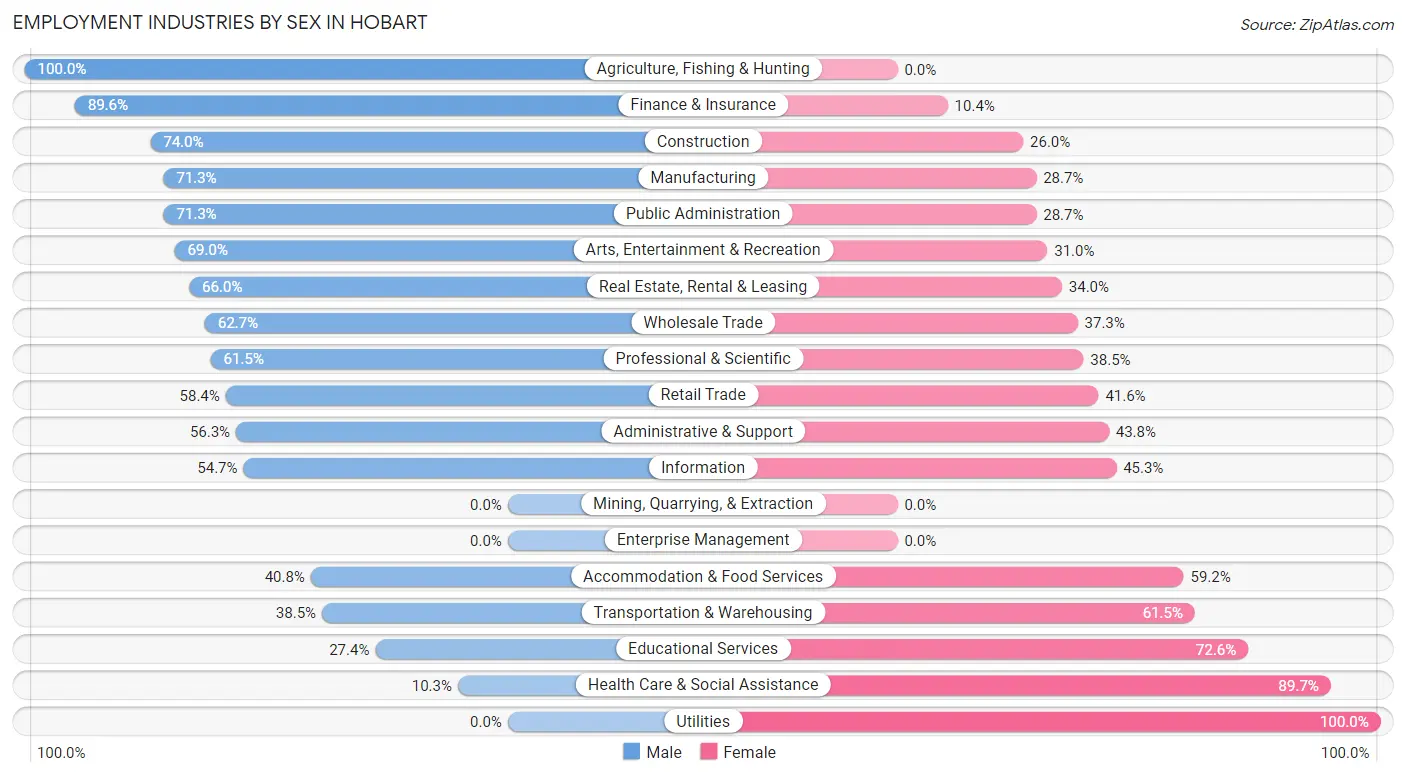
Employment Industries by Sex in Hobart
The Hobart industries that see more men than women are Agriculture, Fishing & Hunting (100.0%), Finance & Insurance (89.6%), and Construction (74.0%), whereas the industries that tend to have a higher number of women are Utilities (100.0%), Health Care & Social Assistance (89.7%), and Educational Services (72.6%).
| Industry | Male | Female |
| Agriculture, Fishing & Hunting | 6 (100.0%) | 0 (0.0%) |
| Mining, Quarrying, & Extraction | 0 (0.0%) | 0 (0.0%) |
| Construction | 236 (74.0%) | 83 (26.0%) |
| Manufacturing | 345 (71.3%) | 139 (28.7%) |
| Wholesale Trade | 153 (62.7%) | 91 (37.3%) |
| Retail Trade | 247 (58.4%) | 176 (41.6%) |
| Transportation & Warehousing | 50 (38.5%) | 80 (61.5%) |
| Utilities | 0 (0.0%) | 6 (100.0%) |
| Information | 29 (54.7%) | 24 (45.3%) |
| Finance & Insurance | 155 (89.6%) | 18 (10.4%) |
| Real Estate, Rental & Leasing | 62 (66.0%) | 32 (34.0%) |
| Professional & Scientific | 238 (61.5%) | 149 (38.5%) |
| Enterprise Management | 0 (0.0%) | 0 (0.0%) |
| Administrative & Support | 36 (56.2%) | 28 (43.8%) |
| Educational Services | 105 (27.4%) | 278 (72.6%) |
| Health Care & Social Assistance | 34 (10.3%) | 295 (89.7%) |
| Arts, Entertainment & Recreation | 60 (69.0%) | 27 (31.0%) |
| Accommodation & Food Services | 42 (40.8%) | 61 (59.2%) |
| Public Administration | 124 (71.3%) | 50 (28.7%) |
| Total | 1,951 (55.2%) | 1,581 (44.8%) |
Education in Hobart
School Enrollment in Hobart
The most common levels of schooling among the 1,673 students in Hobart are middle school (508 | 30.4%), high school (375 | 22.4%), and elementary school (368 | 22.0%).
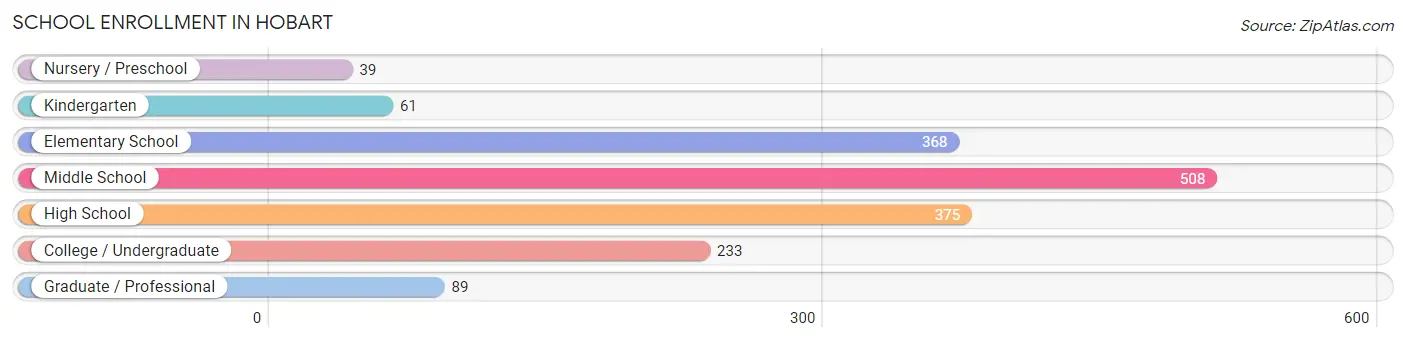
| School Level | # Students | % Students |
| Nursery / Preschool | 39 | 2.3% |
| Kindergarten | 61 | 3.6% |
| Elementary School | 368 | 22.0% |
| Middle School | 508 | 30.4% |
| High School | 375 | 22.4% |
| College / Undergraduate | 233 | 13.9% |
| Graduate / Professional | 89 | 5.3% |
| Total | 1,673 | 100.0% |
School Enrollment by Age by Funding Source in Hobart
Out of a total of 1,673 students who are enrolled in schools in Hobart, 231 (13.8%) attend a private institution, while the remaining 1,442 (86.2%) are enrolled in public schools. The age group of 3 to 4 year olds has the highest likelihood of being enrolled in private schools, with 24 (72.7% in the age bracket) enrolled. Conversely, the age group of 18 to 19 year olds has the lowest likelihood of being enrolled in a private school, with 110 (100.0% in the age bracket) attending a public institution.
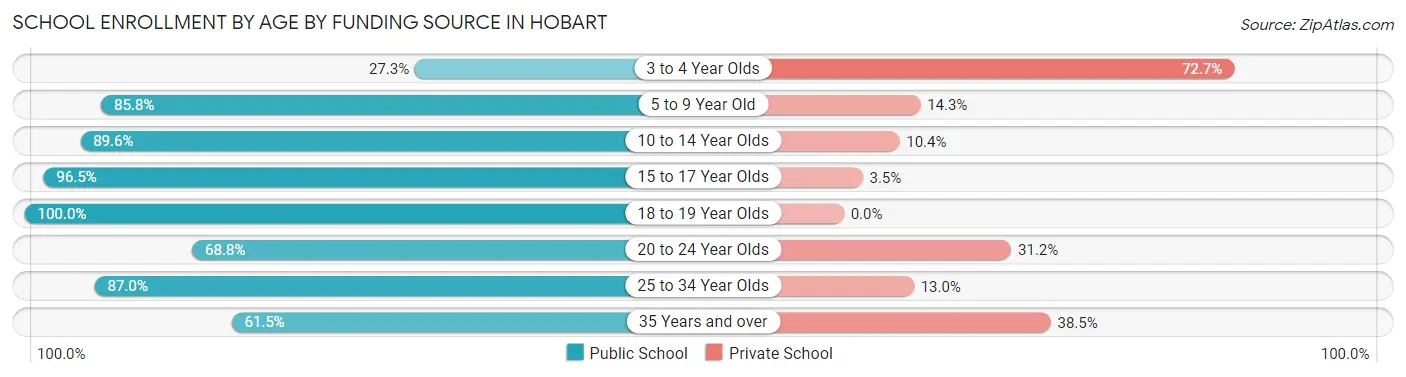
| Age Bracket | Public School | Private School |
| 3 to 4 Year Olds | 9 (27.3%) | 24 (72.7%) |
| 5 to 9 Year Old | 337 (85.8%) | 56 (14.2%) |
| 10 to 14 Year Olds | 502 (89.6%) | 58 (10.4%) |
| 15 to 17 Year Olds | 302 (96.5%) | 11 (3.5%) |
| 18 to 19 Year Olds | 110 (100.0%) | 0 (0.0%) |
| 20 to 24 Year Olds | 75 (68.8%) | 34 (31.2%) |
| 25 to 34 Year Olds | 40 (87.0%) | 6 (13.0%) |
| 35 Years and over | 67 (61.5%) | 42 (38.5%) |
| Total | 1,442 (86.2%) | 231 (13.8%) |
Educational Attainment by Field of Study in Hobart
Business (621 | 25.5%), engineering (340 | 14.0%), social sciences (291 | 11.9%), education (201 | 8.2%), and arts & humanities (194 | 8.0%) are the most common fields of study among 2,438 individuals in Hobart who have obtained a bachelor's degree or higher.
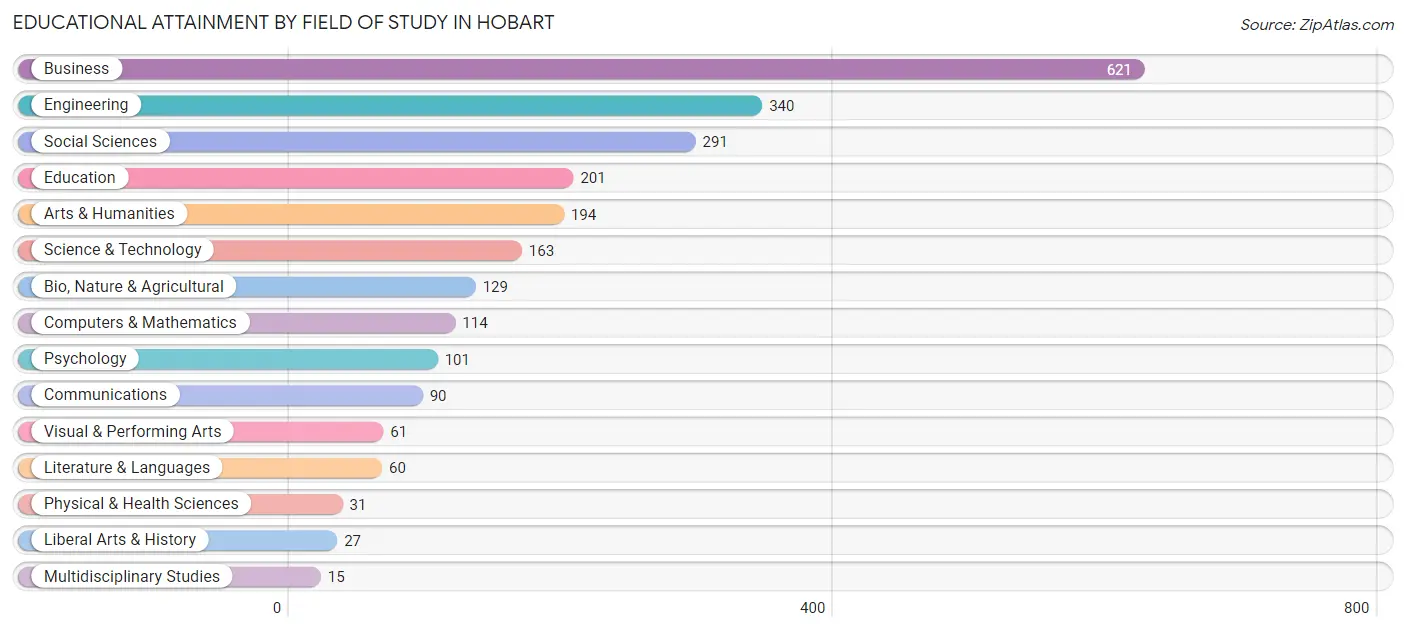
| Field of Study | # Graduates | % Graduates |
| Computers & Mathematics | 114 | 4.7% |
| Bio, Nature & Agricultural | 129 | 5.3% |
| Physical & Health Sciences | 31 | 1.3% |
| Psychology | 101 | 4.1% |
| Social Sciences | 291 | 11.9% |
| Engineering | 340 | 14.0% |
| Multidisciplinary Studies | 15 | 0.6% |
| Science & Technology | 163 | 6.7% |
| Business | 621 | 25.5% |
| Education | 201 | 8.2% |
| Literature & Languages | 60 | 2.5% |
| Liberal Arts & History | 27 | 1.1% |
| Visual & Performing Arts | 61 | 2.5% |
| Communications | 90 | 3.7% |
| Arts & Humanities | 194 | 8.0% |
| Total | 2,438 | 100.0% |
Transportation & Commute in Hobart
Vehicle Availability by Sex in Hobart
The most prevalent vehicle ownership categories in Hobart are males with 2 vehicles (659, accounting for 33.8%) and females with 2 vehicles (385, making up 41.9%).
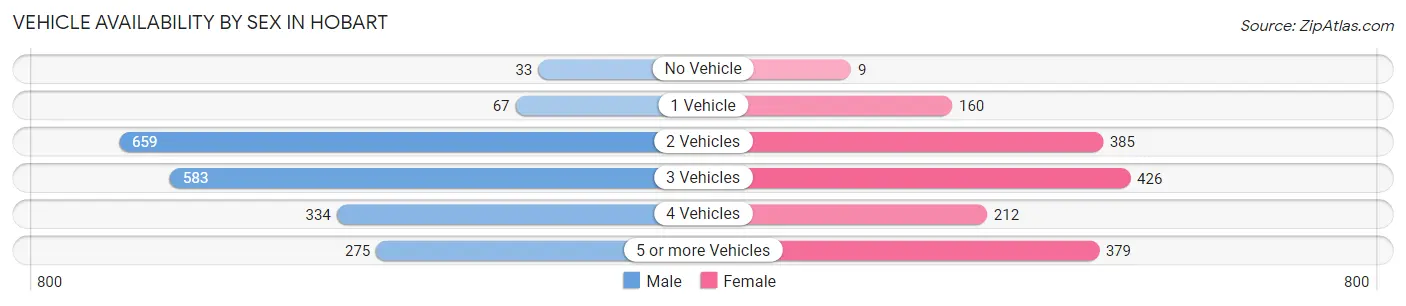
| Vehicles Available | Male | Female |
| No Vehicle | 33 (1.7%) | 9 (0.6%) |
| 1 Vehicle | 67 (3.4%) | 160 (10.2%) |
| 2 Vehicles | 659 (33.8%) | 385 (24.5%) |
| 3 Vehicles | 583 (29.9%) | 426 (27.1%) |
| 4 Vehicles | 334 (17.1%) | 212 (13.5%) |
| 5 or more Vehicles | 275 (14.1%) | 379 (24.1%) |
| Total | 1,951 (100.0%) | 1,571 (100.0%) |
Commute Time in Hobart
The most frequently occuring commute durations in Hobart are 45 to 59 minutes (393 commuters, 13.4%), 20 to 24 minutes (371 commuters, 12.7%), and 30 to 34 minutes (367 commuters, 12.5%).
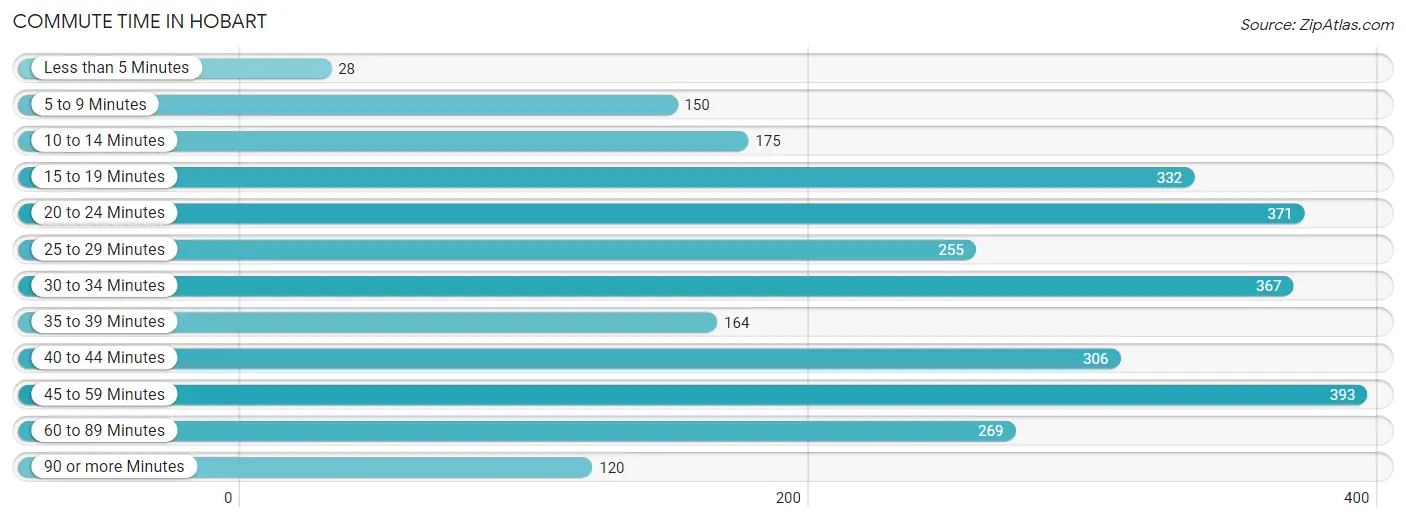
| Commute Time | # Commuters | % Commuters |
| Less than 5 Minutes | 28 | 1.0% |
| 5 to 9 Minutes | 150 | 5.1% |
| 10 to 14 Minutes | 175 | 6.0% |
| 15 to 19 Minutes | 332 | 11.3% |
| 20 to 24 Minutes | 371 | 12.7% |
| 25 to 29 Minutes | 255 | 8.7% |
| 30 to 34 Minutes | 367 | 12.5% |
| 35 to 39 Minutes | 164 | 5.6% |
| 40 to 44 Minutes | 306 | 10.4% |
| 45 to 59 Minutes | 393 | 13.4% |
| 60 to 89 Minutes | 269 | 9.2% |
| 90 or more Minutes | 120 | 4.1% |
Commute Time by Sex in Hobart
The most common commute times in Hobart are 45 to 59 minutes (237 commuters, 14.7%) for males and 20 to 24 minutes (187 commuters, 14.1%) for females.
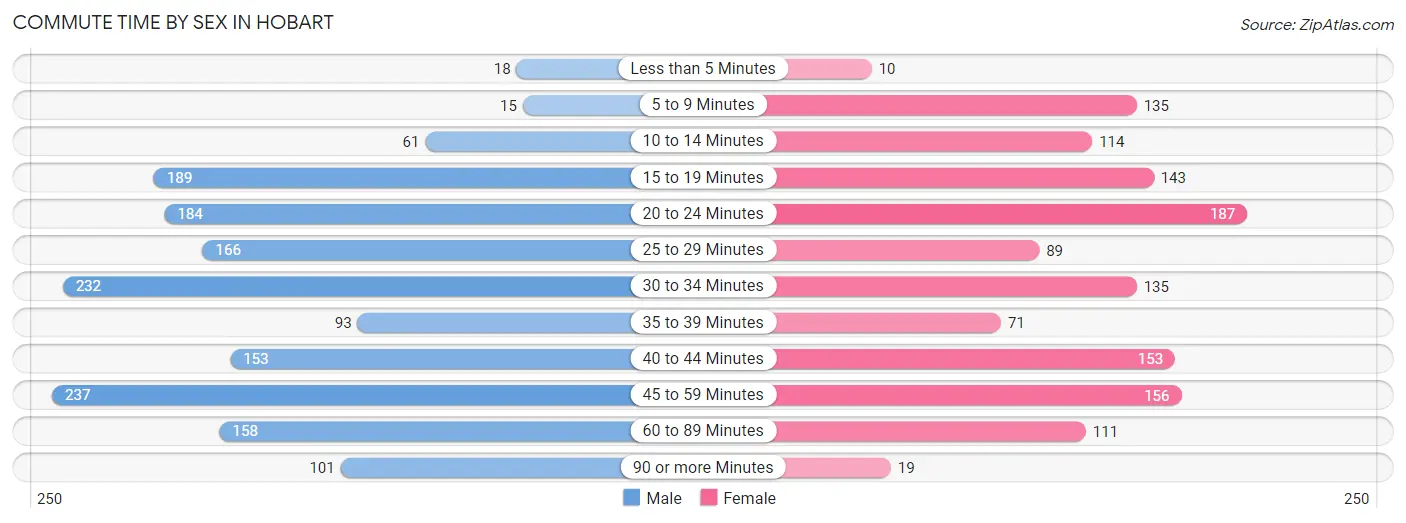
| Commute Time | Male | Female |
| Less than 5 Minutes | 18 (1.1%) | 10 (0.8%) |
| 5 to 9 Minutes | 15 (0.9%) | 135 (10.2%) |
| 10 to 14 Minutes | 61 (3.8%) | 114 (8.6%) |
| 15 to 19 Minutes | 189 (11.8%) | 143 (10.8%) |
| 20 to 24 Minutes | 184 (11.5%) | 187 (14.1%) |
| 25 to 29 Minutes | 166 (10.3%) | 89 (6.7%) |
| 30 to 34 Minutes | 232 (14.4%) | 135 (10.2%) |
| 35 to 39 Minutes | 93 (5.8%) | 71 (5.4%) |
| 40 to 44 Minutes | 153 (9.5%) | 153 (11.6%) |
| 45 to 59 Minutes | 237 (14.7%) | 156 (11.8%) |
| 60 to 89 Minutes | 158 (9.8%) | 111 (8.4%) |
| 90 or more Minutes | 101 (6.3%) | 19 (1.4%) |
Time of Departure to Work by Sex in Hobart
The most frequent times of departure to work in Hobart are 6:00 AM to 6:29 AM (350, 21.8%) for males and 7:30 AM to 7:59 AM (226, 17.1%) for females.
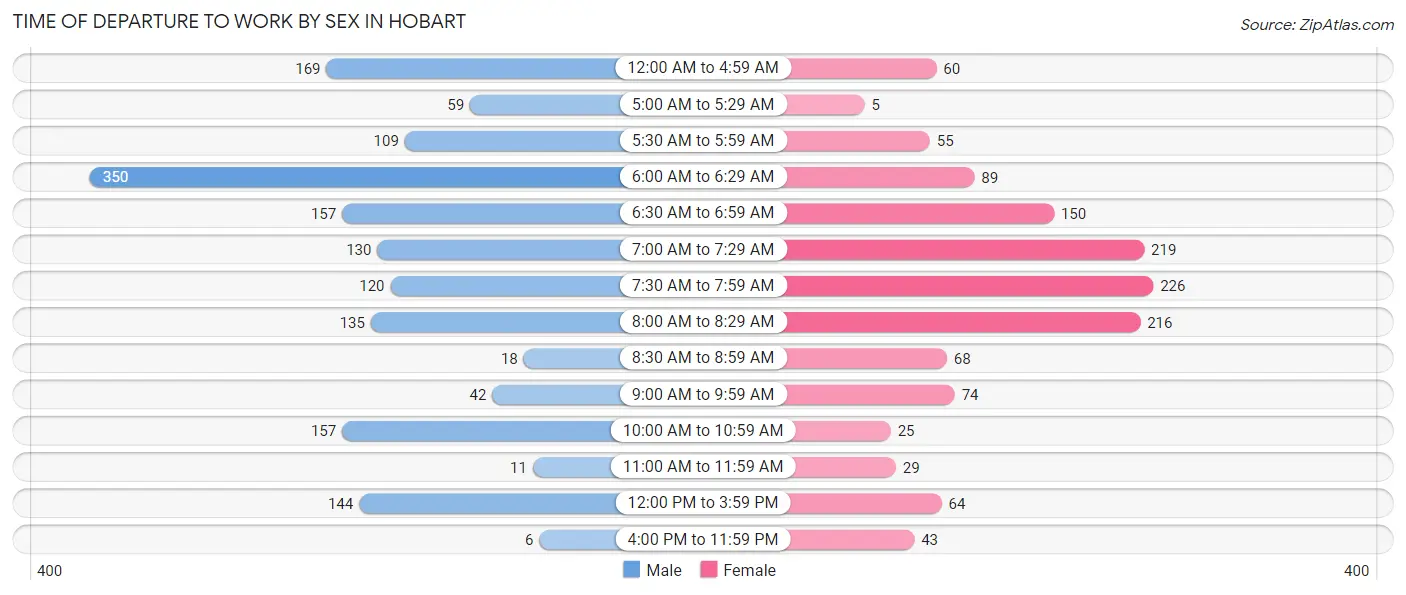
| Time of Departure | Male | Female |
| 12:00 AM to 4:59 AM | 169 (10.5%) | 60 (4.5%) |
| 5:00 AM to 5:29 AM | 59 (3.7%) | 5 (0.4%) |
| 5:30 AM to 5:59 AM | 109 (6.8%) | 55 (4.2%) |
| 6:00 AM to 6:29 AM | 350 (21.8%) | 89 (6.7%) |
| 6:30 AM to 6:59 AM | 157 (9.8%) | 150 (11.3%) |
| 7:00 AM to 7:29 AM | 130 (8.1%) | 219 (16.6%) |
| 7:30 AM to 7:59 AM | 120 (7.5%) | 226 (17.1%) |
| 8:00 AM to 8:29 AM | 135 (8.4%) | 216 (16.3%) |
| 8:30 AM to 8:59 AM | 18 (1.1%) | 68 (5.1%) |
| 9:00 AM to 9:59 AM | 42 (2.6%) | 74 (5.6%) |
| 10:00 AM to 10:59 AM | 157 (9.8%) | 25 (1.9%) |
| 11:00 AM to 11:59 AM | 11 (0.7%) | 29 (2.2%) |
| 12:00 PM to 3:59 PM | 144 (9.0%) | 64 (4.8%) |
| 4:00 PM to 11:59 PM | 6 (0.4%) | 43 (3.3%) |
| Total | 1,607 (100.0%) | 1,323 (100.0%) |
Housing Occupancy in Hobart
Occupancy by Ownership in Hobart
Of the total 2,579 dwellings in Hobart, owner-occupied units account for 2,353 (91.2%), while renter-occupied units make up 226 (8.8%).
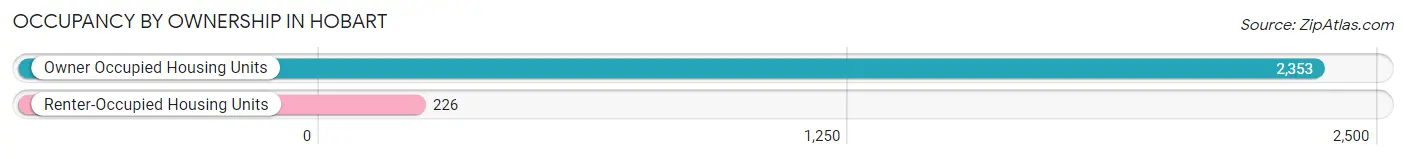
| Occupancy | # Housing Units | % Housing Units |
| Owner Occupied Housing Units | 2,353 | 91.2% |
| Renter-Occupied Housing Units | 226 | 8.8% |
| Total Occupied Housing Units | 2,579 | 100.0% |
Occupancy by Household Size in Hobart
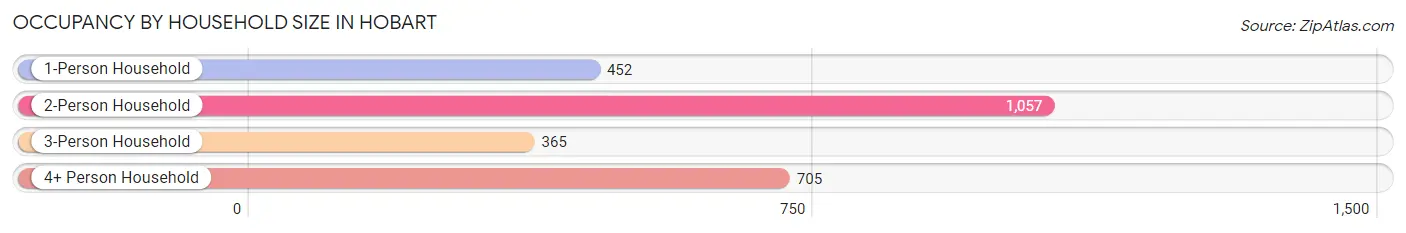
| Household Size | # Housing Units | % Housing Units |
| 1-Person Household | 452 | 17.5% |
| 2-Person Household | 1,057 | 41.0% |
| 3-Person Household | 365 | 14.1% |
| 4+ Person Household | 705 | 27.3% |
| Total Housing Units | 2,579 | 100.0% |
Occupancy by Ownership by Household Size in Hobart
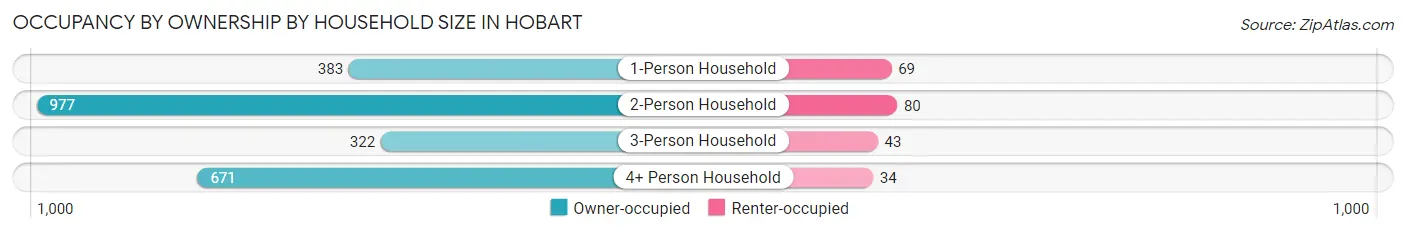
| Household Size | Owner-occupied | Renter-occupied |
| 1-Person Household | 383 (84.7%) | 69 (15.3%) |
| 2-Person Household | 977 (92.4%) | 80 (7.6%) |
| 3-Person Household | 322 (88.2%) | 43 (11.8%) |
| 4+ Person Household | 671 (95.2%) | 34 (4.8%) |
| Total Housing Units | 2,353 (91.2%) | 226 (8.8%) |
Occupancy by Educational Attainment in Hobart
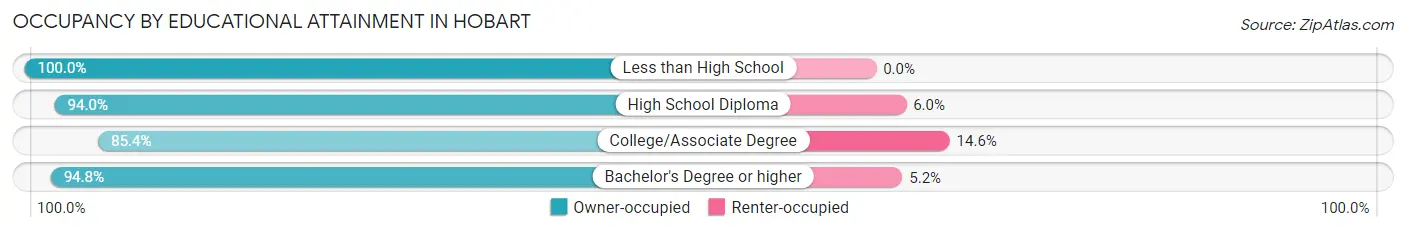
| Household Size | Owner-occupied | Renter-occupied |
| Less than High School | 54 (100.0%) | 0 (0.0%) |
| High School Diploma | 268 (94.0%) | 17 (6.0%) |
| College/Associate Degree | 844 (85.4%) | 144 (14.6%) |
| Bachelor's Degree or higher | 1,187 (94.8%) | 65 (5.2%) |
Occupancy by Age of Householder in Hobart
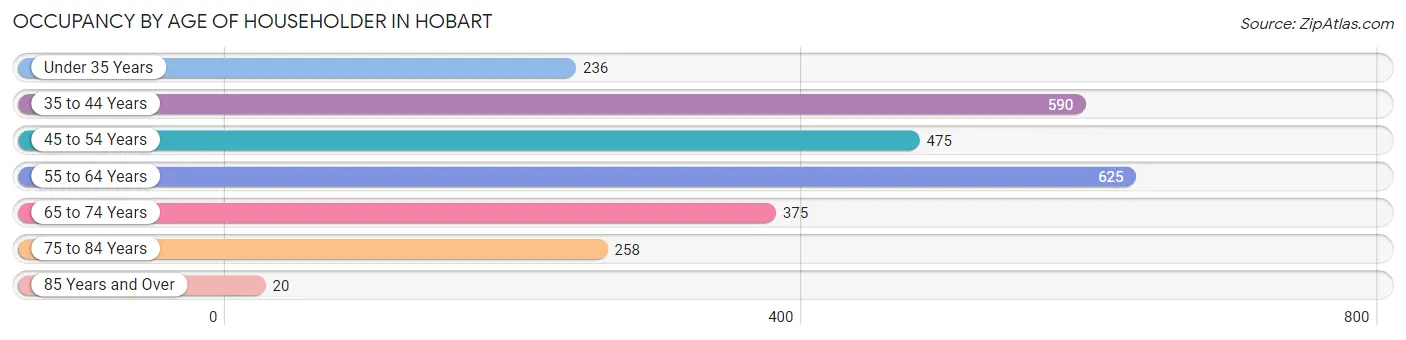
| Age Bracket | # Households | % Households |
| Under 35 Years | 236 | 9.1% |
| 35 to 44 Years | 590 | 22.9% |
| 45 to 54 Years | 475 | 18.4% |
| 55 to 64 Years | 625 | 24.2% |
| 65 to 74 Years | 375 | 14.5% |
| 75 to 84 Years | 258 | 10.0% |
| 85 Years and Over | 20 | 0.8% |
| Total | 2,579 | 100.0% |
Housing Finances in Hobart
Median Income by Occupancy in Hobart
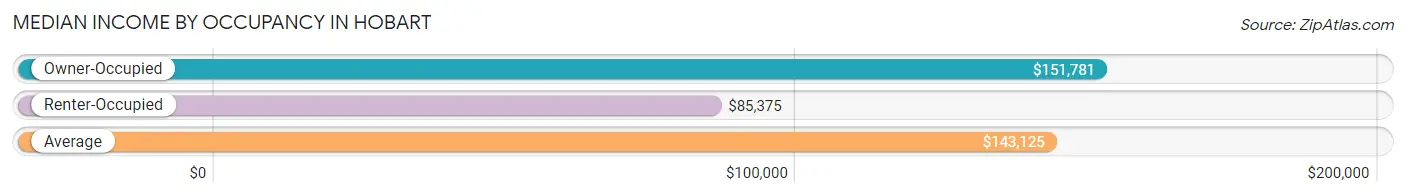
| Occupancy Type | # Households | Median Income |
| Owner-Occupied | 2,353 (91.2%) | $151,781 |
| Renter-Occupied | 226 (8.8%) | $85,375 |
| Average | 2,579 (100.0%) | $143,125 |
Occupancy by Householder Income Bracket in Hobart
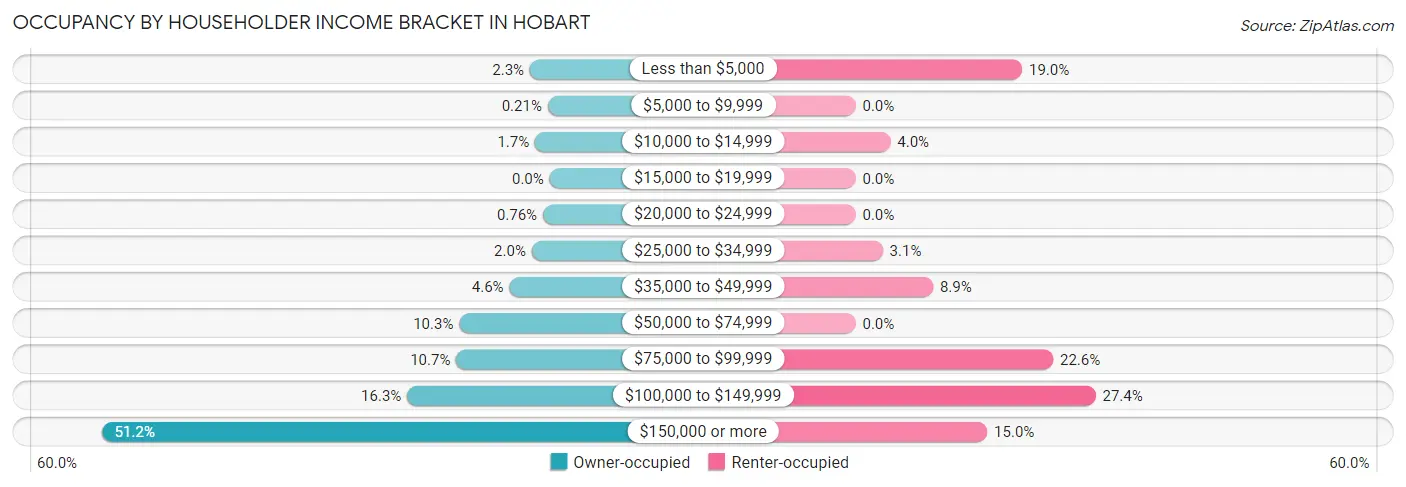
| Income Bracket | Owner-occupied | Renter-occupied |
| Less than $5,000 | 53 (2.2%) | 43 (19.0%) |
| $5,000 to $9,999 | 5 (0.2%) | 0 (0.0%) |
| $10,000 to $14,999 | 39 (1.7%) | 9 (4.0%) |
| $15,000 to $19,999 | 0 (0.0%) | 0 (0.0%) |
| $20,000 to $24,999 | 18 (0.8%) | 0 (0.0%) |
| $25,000 to $34,999 | 48 (2.0%) | 7 (3.1%) |
| $35,000 to $49,999 | 108 (4.6%) | 20 (8.8%) |
| $50,000 to $74,999 | 243 (10.3%) | 0 (0.0%) |
| $75,000 to $99,999 | 251 (10.7%) | 51 (22.6%) |
| $100,000 to $149,999 | 383 (16.3%) | 62 (27.4%) |
| $150,000 or more | 1,205 (51.2%) | 34 (15.0%) |
| Total | 2,353 (100.0%) | 226 (100.0%) |
Monthly Housing Cost Tiers in Hobart

| Monthly Cost | Owner-occupied | Renter-occupied |
| Less than $300 | 37 (1.6%) | 0 (0.0%) |
| $300 to $499 | 11 (0.5%) | 0 (0.0%) |
| $500 to $799 | 125 (5.3%) | 0 (0.0%) |
| $800 to $999 | 138 (5.9%) | 11 (4.9%) |
| $1,000 to $1,499 | 343 (14.6%) | 0 (0.0%) |
| $1,500 to $1,999 | 104 (4.4%) | 39 (17.3%) |
| $2,000 to $2,499 | 311 (13.2%) | 92 (40.7%) |
| $2,500 to $2,999 | 295 (12.5%) | 0 (0.0%) |
| $3,000 or more | 989 (42.0%) | 15 (6.6%) |
| Total | 2,353 (100.0%) | 226 (100.0%) |
Physical Housing Characteristics in Hobart
Housing Structures in Hobart
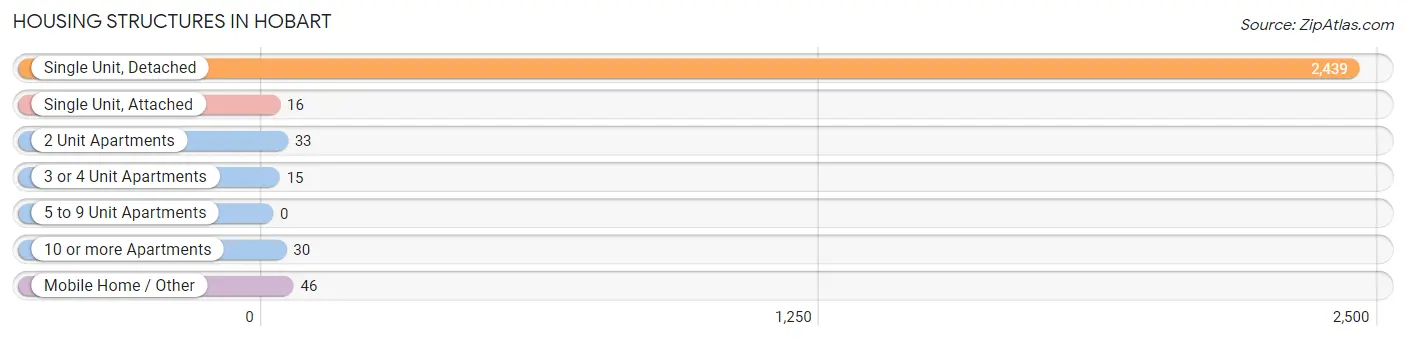
| Structure Type | # Housing Units | % Housing Units |
| Single Unit, Detached | 2,439 | 94.6% |
| Single Unit, Attached | 16 | 0.6% |
| 2 Unit Apartments | 33 | 1.3% |
| 3 or 4 Unit Apartments | 15 | 0.6% |
| 5 to 9 Unit Apartments | 0 | 0.0% |
| 10 or more Apartments | 30 | 1.2% |
| Mobile Home / Other | 46 | 1.8% |
| Total | 2,579 | 100.0% |
Housing Structures by Occupancy in Hobart
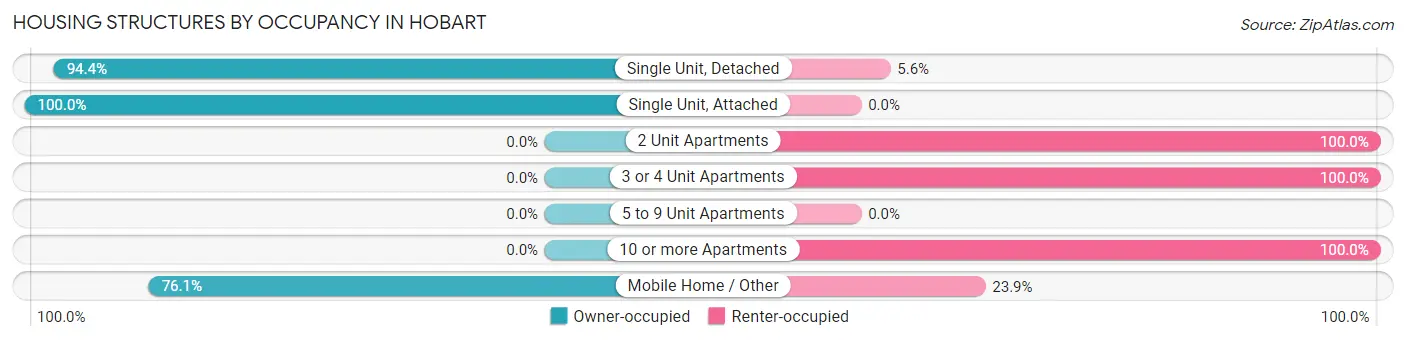
| Structure Type | Owner-occupied | Renter-occupied |
| Single Unit, Detached | 2,302 (94.4%) | 137 (5.6%) |
| Single Unit, Attached | 16 (100.0%) | 0 (0.0%) |
| 2 Unit Apartments | 0 (0.0%) | 33 (100.0%) |
| 3 or 4 Unit Apartments | 0 (0.0%) | 15 (100.0%) |
| 5 to 9 Unit Apartments | 0 (0.0%) | 0 (0.0%) |
| 10 or more Apartments | 0 (0.0%) | 30 (100.0%) |
| Mobile Home / Other | 35 (76.1%) | 11 (23.9%) |
| Total | 2,353 (91.2%) | 226 (8.8%) |
Housing Structures by Number of Rooms in Hobart
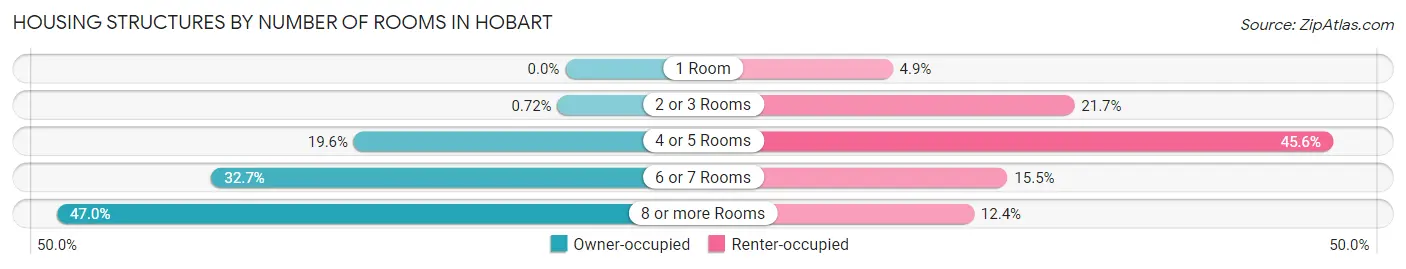
| Number of Rooms | Owner-occupied | Renter-occupied |
| 1 Room | 0 (0.0%) | 11 (4.9%) |
| 2 or 3 Rooms | 17 (0.7%) | 49 (21.7%) |
| 4 or 5 Rooms | 460 (19.6%) | 103 (45.6%) |
| 6 or 7 Rooms | 770 (32.7%) | 35 (15.5%) |
| 8 or more Rooms | 1,106 (47.0%) | 28 (12.4%) |
| Total | 2,353 (100.0%) | 226 (100.0%) |
Housing Structure by Heating Type in Hobart
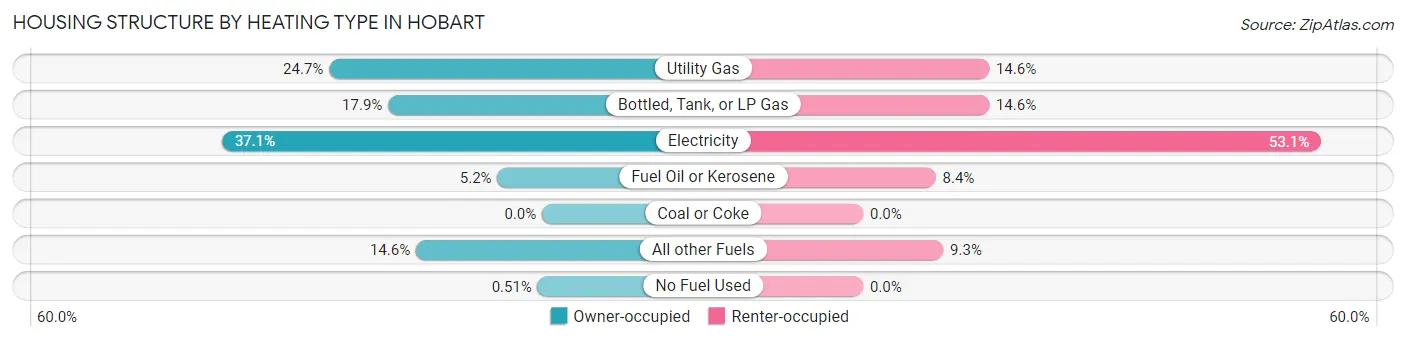
| Heating Type | Owner-occupied | Renter-occupied |
| Utility Gas | 581 (24.7%) | 33 (14.6%) |
| Bottled, Tank, or LP Gas | 420 (17.8%) | 33 (14.6%) |
| Electricity | 874 (37.1%) | 120 (53.1%) |
| Fuel Oil or Kerosene | 122 (5.2%) | 19 (8.4%) |
| Coal or Coke | 0 (0.0%) | 0 (0.0%) |
| All other Fuels | 344 (14.6%) | 21 (9.3%) |
| No Fuel Used | 12 (0.5%) | 0 (0.0%) |
| Total | 2,353 (100.0%) | 226 (100.0%) |
Household Vehicle Usage in Hobart
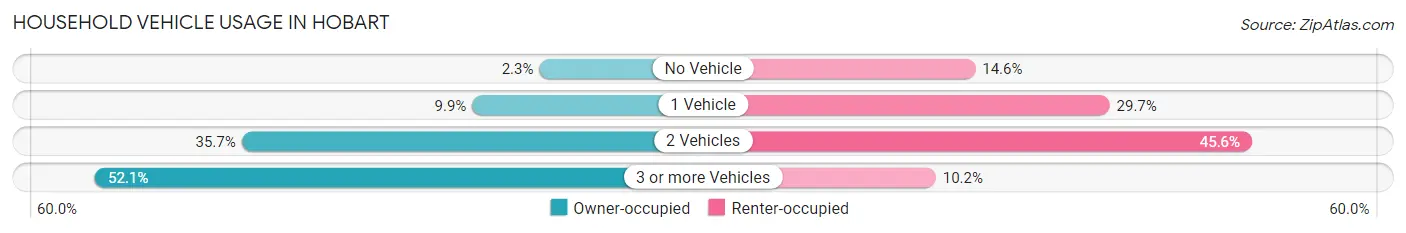
| Vehicles per Household | Owner-occupied | Renter-occupied |
| No Vehicle | 55 (2.3%) | 33 (14.6%) |
| 1 Vehicle | 232 (9.9%) | 67 (29.6%) |
| 2 Vehicles | 840 (35.7%) | 103 (45.6%) |
| 3 or more Vehicles | 1,226 (52.1%) | 23 (10.2%) |
| Total | 2,353 (100.0%) | 226 (100.0%) |
Real Estate & Mortgages in Hobart
Real Estate and Mortgage Overview in Hobart
| Characteristic | Without Mortgage | With Mortgage |
| Housing Units | 659 | 1,694 |
| Median Property Value | $782,700 | $839,900 |
| Median Household Income | $89,920 | $939 |
| Monthly Housing Costs | $1,055 | $989 |
| Real Estate Taxes | $8,611 | $6 |
Property Value by Mortgage Status in Hobart
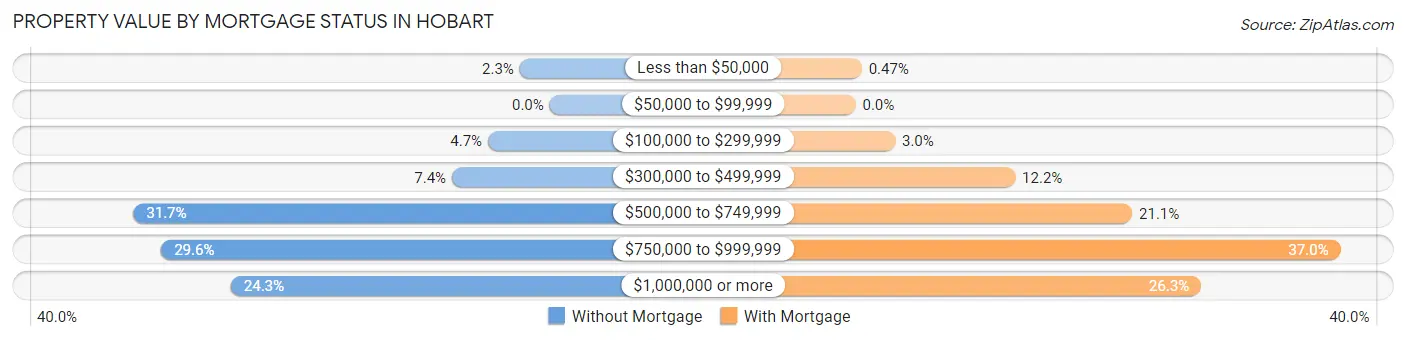
| Property Value | Without Mortgage | With Mortgage |
| Less than $50,000 | 15 (2.3%) | 8 (0.5%) |
| $50,000 to $99,999 | 0 (0.0%) | 0 (0.0%) |
| $100,000 to $299,999 | 31 (4.7%) | 51 (3.0%) |
| $300,000 to $499,999 | 49 (7.4%) | 206 (12.2%) |
| $500,000 to $749,999 | 209 (31.7%) | 357 (21.1%) |
| $750,000 to $999,999 | 195 (29.6%) | 626 (36.9%) |
| $1,000,000 or more | 160 (24.3%) | 446 (26.3%) |
| Total | 659 (100.0%) | 1,694 (100.0%) |
Household Income by Mortgage Status in Hobart
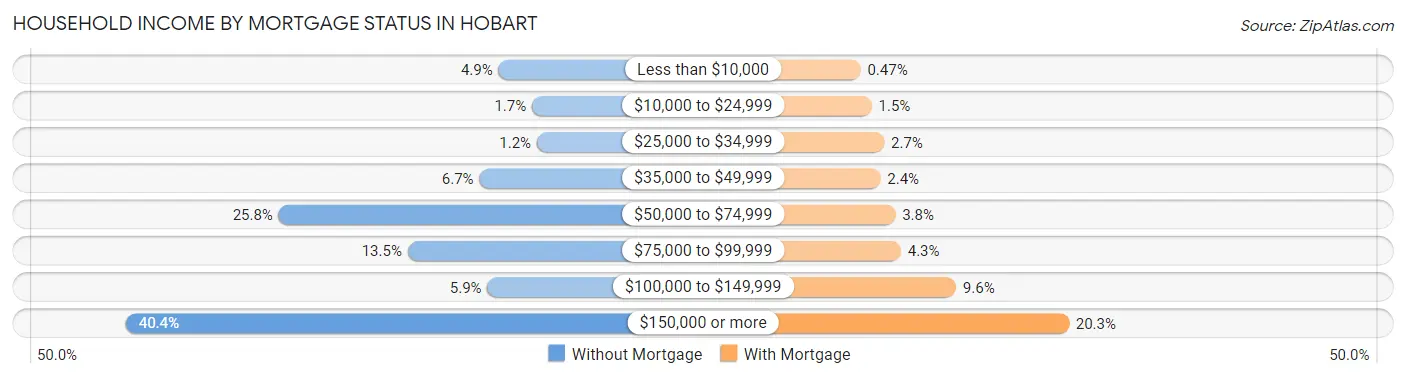
| Household Income | Without Mortgage | With Mortgage |
| Less than $10,000 | 32 (4.9%) | 8 (0.5%) |
| $10,000 to $24,999 | 11 (1.7%) | 26 (1.5%) |
| $25,000 to $34,999 | 8 (1.2%) | 46 (2.7%) |
| $35,000 to $49,999 | 44 (6.7%) | 40 (2.4%) |
| $50,000 to $74,999 | 170 (25.8%) | 64 (3.8%) |
| $75,000 to $99,999 | 89 (13.5%) | 73 (4.3%) |
| $100,000 to $149,999 | 39 (5.9%) | 162 (9.6%) |
| $150,000 or more | 266 (40.4%) | 344 (20.3%) |
| Total | 659 (100.0%) | 1,694 (100.0%) |
Property Value to Household Income Ratio in Hobart
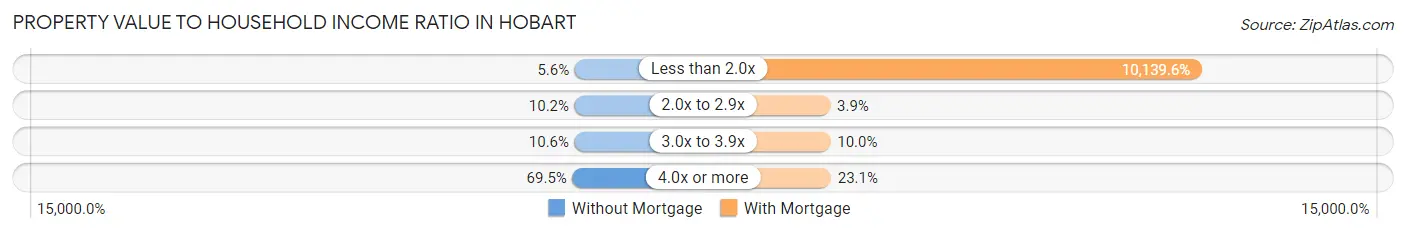
| Value-to-Income Ratio | Without Mortgage | With Mortgage |
| Less than 2.0x | 37 (5.6%) | 171,765 (10,139.6%) |
| 2.0x to 2.9x | 67 (10.2%) | 66 (3.9%) |
| 3.0x to 3.9x | 70 (10.6%) | 170 (10.0%) |
| 4.0x or more | 458 (69.5%) | 392 (23.1%) |
| Total | 659 (100.0%) | 1,694 (100.0%) |
Real Estate Taxes by Mortgage Status in Hobart
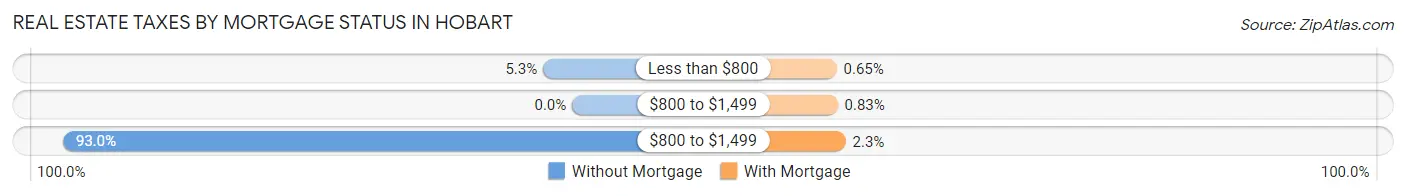
| Property Taxes | Without Mortgage | With Mortgage |
| Less than $800 | 35 (5.3%) | 11 (0.6%) |
| $800 to $1,499 | 0 (0.0%) | 14 (0.8%) |
| $800 to $1,499 | 613 (93.0%) | 39 (2.3%) |
| Total | 659 (100.0%) | 1,694 (100.0%) |
Health & Disability in Hobart
Health Insurance Coverage by Age in Hobart
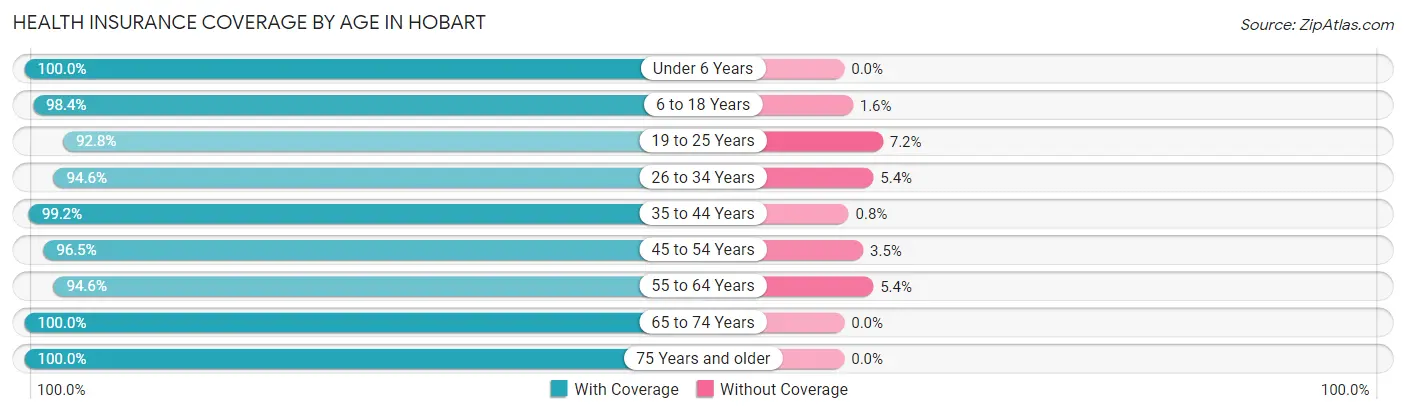
| Age Bracket | With Coverage | Without Coverage |
| Under 6 Years | 340 (100.0%) | 0 (0.0%) |
| 6 to 18 Years | 1,374 (98.4%) | 22 (1.6%) |
| 19 to 25 Years | 478 (92.8%) | 37 (7.2%) |
| 26 to 34 Years | 524 (94.6%) | 30 (5.4%) |
| 35 to 44 Years | 996 (99.2%) | 8 (0.8%) |
| 45 to 54 Years | 991 (96.5%) | 36 (3.5%) |
| 55 to 64 Years | 1,068 (94.6%) | 61 (5.4%) |
| 65 to 74 Years | 820 (100.0%) | 0 (0.0%) |
| 75 Years and older | 370 (100.0%) | 0 (0.0%) |
| Total | 6,961 (97.3%) | 194 (2.7%) |
Health Insurance Coverage by Citizenship Status in Hobart
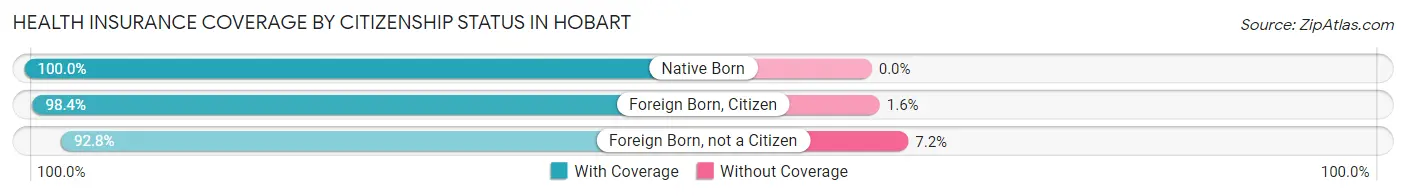
| Citizenship Status | With Coverage | Without Coverage |
| Native Born | 340 (100.0%) | 0 (0.0%) |
| Foreign Born, Citizen | 1,374 (98.4%) | 22 (1.6%) |
| Foreign Born, not a Citizen | 478 (92.8%) | 37 (7.2%) |
Health Insurance Coverage by Household Income in Hobart
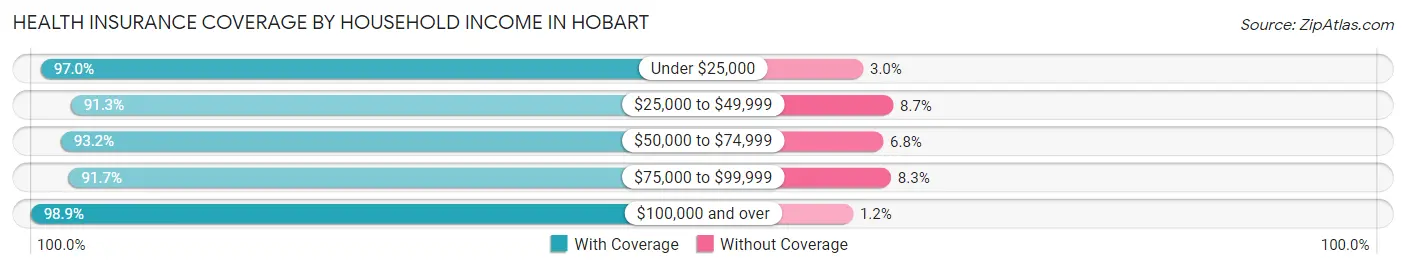
| Household Income | With Coverage | Without Coverage |
| Under $25,000 | 319 (97.0%) | 10 (3.0%) |
| $25,000 to $49,999 | 337 (91.3%) | 32 (8.7%) |
| $50,000 to $74,999 | 589 (93.2%) | 43 (6.8%) |
| $75,000 to $99,999 | 544 (91.7%) | 49 (8.3%) |
| $100,000 and over | 5,158 (98.9%) | 60 (1.1%) |
Public vs Private Health Insurance Coverage by Age in Hobart
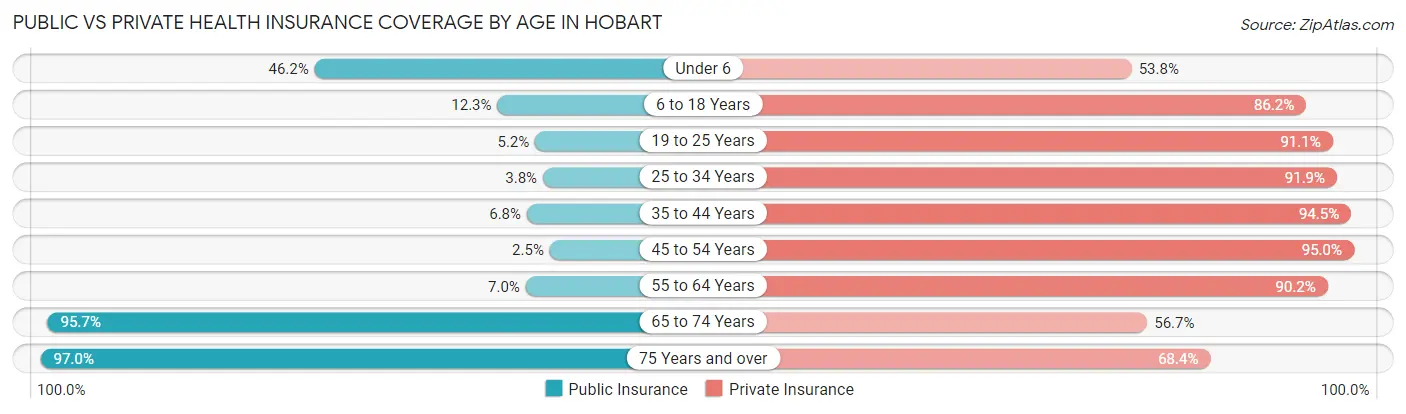
| Age Bracket | Public Insurance | Private Insurance |
| Under 6 | 157 (46.2%) | 183 (53.8%) |
| 6 to 18 Years | 171 (12.2%) | 1,203 (86.2%) |
| 19 to 25 Years | 27 (5.2%) | 469 (91.1%) |
| 25 to 34 Years | 21 (3.8%) | 509 (91.9%) |
| 35 to 44 Years | 68 (6.8%) | 949 (94.5%) |
| 45 to 54 Years | 26 (2.5%) | 976 (95.0%) |
| 55 to 64 Years | 79 (7.0%) | 1,018 (90.2%) |
| 65 to 74 Years | 785 (95.7%) | 465 (56.7%) |
| 75 Years and over | 359 (97.0%) | 253 (68.4%) |
| Total | 1,693 (23.7%) | 6,025 (84.2%) |
Disability Status by Sex by Age in Hobart
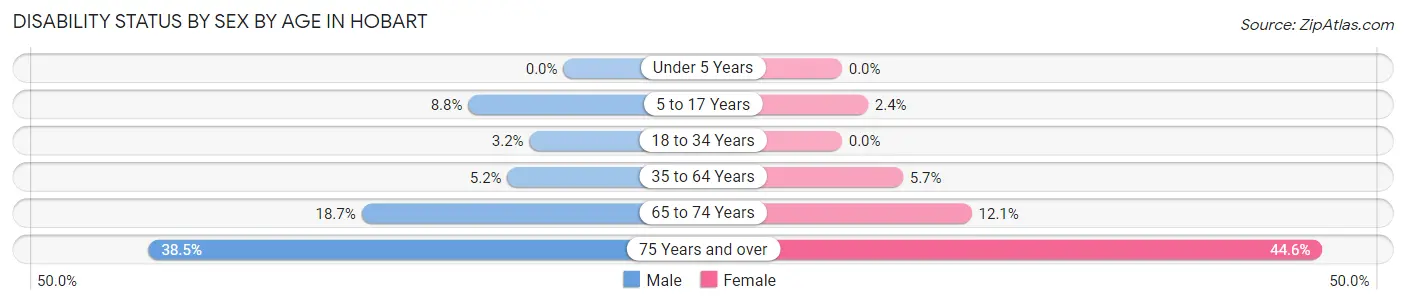
| Age Bracket | Male | Female |
| Under 5 Years | 0 (0.0%) | 0 (0.0%) |
| 5 to 17 Years | 63 (8.8%) | 15 (2.4%) |
| 18 to 34 Years | 18 (3.2%) | 0 (0.0%) |
| 35 to 64 Years | 87 (5.2%) | 84 (5.7%) |
| 65 to 74 Years | 65 (18.7%) | 57 (12.0%) |
| 75 Years and over | 82 (38.5%) | 70 (44.6%) |
Disability Class by Sex by Age in Hobart
Disability Class: Hearing Difficulty
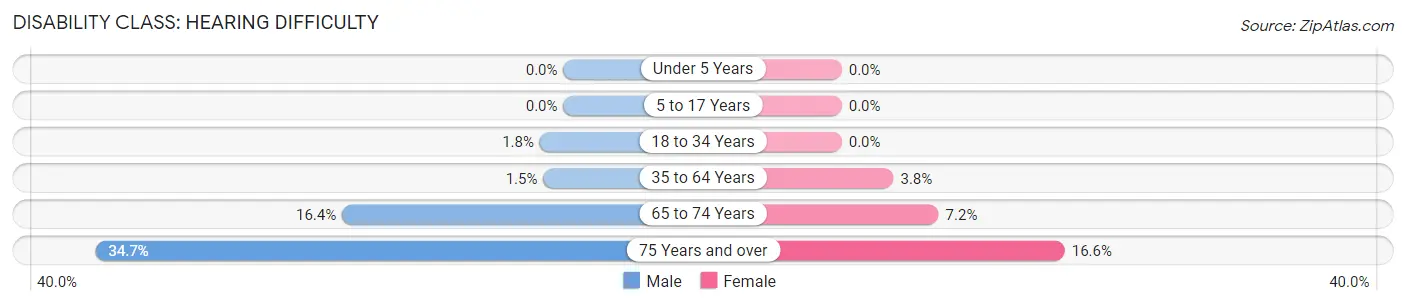
| Age Bracket | Male | Female |
| Under 5 Years | 0 (0.0%) | 0 (0.0%) |
| 5 to 17 Years | 0 (0.0%) | 0 (0.0%) |
| 18 to 34 Years | 10 (1.8%) | 0 (0.0%) |
| 35 to 64 Years | 25 (1.5%) | 57 (3.8%) |
| 65 to 74 Years | 57 (16.4%) | 34 (7.2%) |
| 75 Years and over | 74 (34.7%) | 26 (16.6%) |
Disability Class: Vision Difficulty
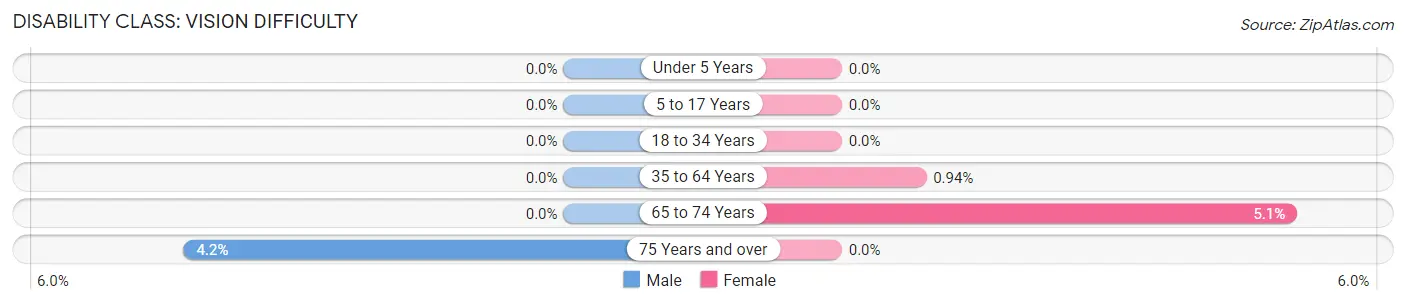
| Age Bracket | Male | Female |
| Under 5 Years | 0 (0.0%) | 0 (0.0%) |
| 5 to 17 Years | 0 (0.0%) | 0 (0.0%) |
| 18 to 34 Years | 0 (0.0%) | 0 (0.0%) |
| 35 to 64 Years | 0 (0.0%) | 14 (0.9%) |
| 65 to 74 Years | 0 (0.0%) | 24 (5.1%) |
| 75 Years and over | 9 (4.2%) | 0 (0.0%) |
Disability Class: Cognitive Difficulty
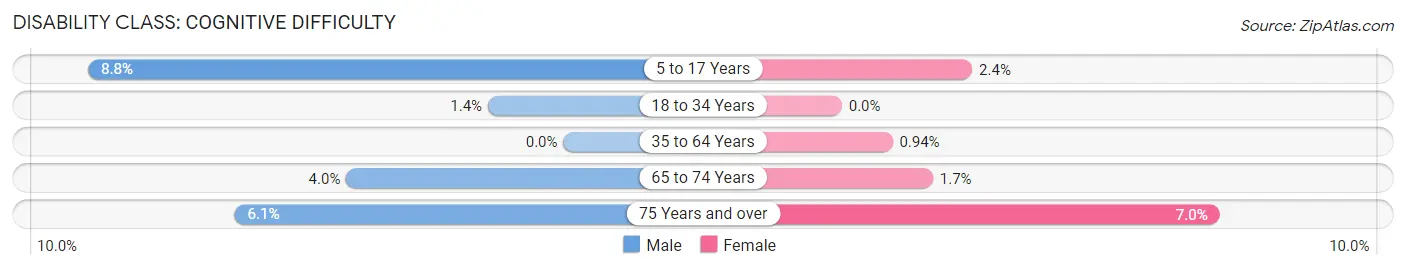
| Age Bracket | Male | Female |
| 5 to 17 Years | 63 (8.8%) | 15 (2.4%) |
| 18 to 34 Years | 8 (1.4%) | 0 (0.0%) |
| 35 to 64 Years | 0 (0.0%) | 14 (0.9%) |
| 65 to 74 Years | 14 (4.0%) | 8 (1.7%) |
| 75 Years and over | 13 (6.1%) | 11 (7.0%) |
Disability Class: Ambulatory Difficulty
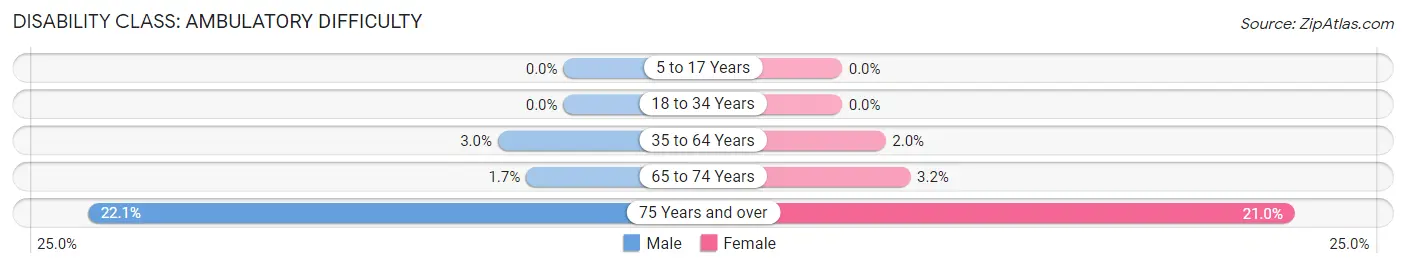
| Age Bracket | Male | Female |
| 5 to 17 Years | 0 (0.0%) | 0 (0.0%) |
| 18 to 34 Years | 0 (0.0%) | 0 (0.0%) |
| 35 to 64 Years | 51 (3.0%) | 30 (2.0%) |
| 65 to 74 Years | 6 (1.7%) | 15 (3.2%) |
| 75 Years and over | 47 (22.1%) | 33 (21.0%) |
Disability Class: Self-Care Difficulty
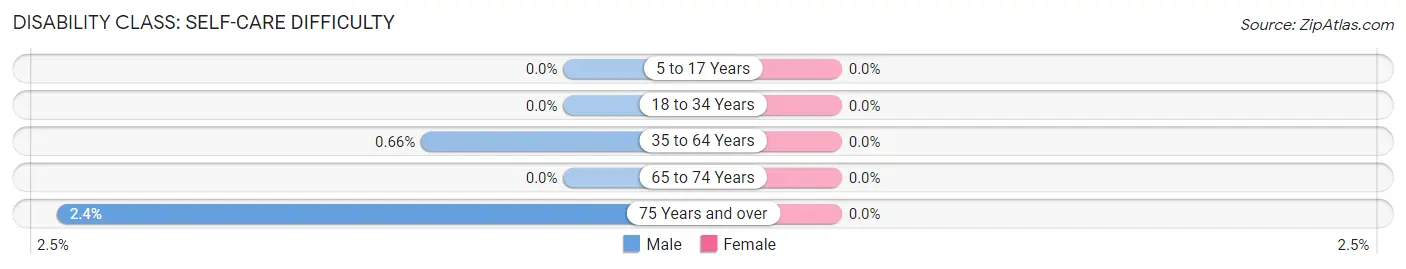
| Age Bracket | Male | Female |
| 5 to 17 Years | 0 (0.0%) | 0 (0.0%) |
| 18 to 34 Years | 0 (0.0%) | 0 (0.0%) |
| 35 to 64 Years | 11 (0.7%) | 0 (0.0%) |
| 65 to 74 Years | 0 (0.0%) | 0 (0.0%) |
| 75 Years and over | 5 (2.4%) | 0 (0.0%) |
Technology Access in Hobart
Computing Device Access in Hobart
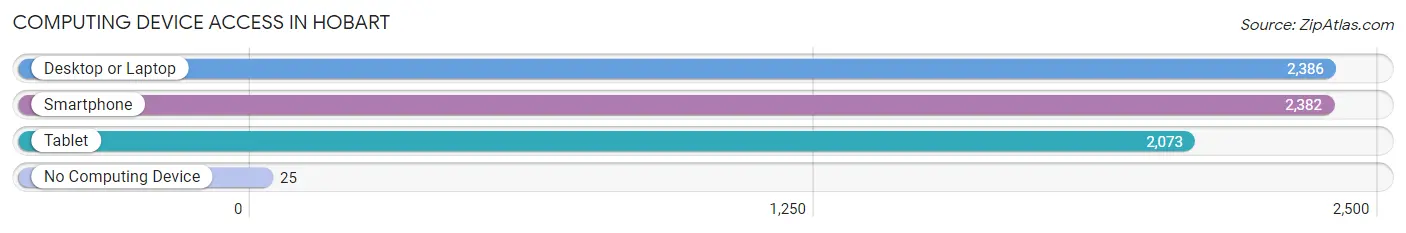
| Device Type | # Households | % Households |
| Desktop or Laptop | 2,386 | 92.5% |
| Smartphone | 2,382 | 92.4% |
| Tablet | 2,073 | 80.4% |
| No Computing Device | 25 | 1.0% |
| Total | 2,579 | 100.0% |
Internet Access in Hobart
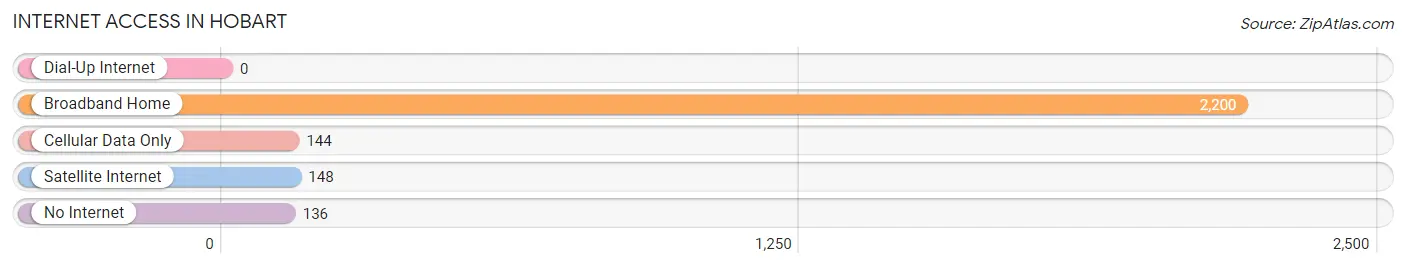
| Internet Type | # Households | % Households |
| Dial-Up Internet | 0 | 0.0% |
| Broadband Home | 2,200 | 85.3% |
| Cellular Data Only | 144 | 5.6% |
| Satellite Internet | 148 | 5.7% |
| No Internet | 136 | 5.3% |
| Total | 2,579 | 100.0% |
Hobart Summary
Hobart is the capital of the Australian state of Tasmania, located on the Derwent River in the south-east of the state. It is the second oldest city in Australia, founded in 1804, and is the most populous city in Tasmania, with a population of approximately 225,000 people.
History
Hobart was founded in 1804 by Lieutenant-Colonel David Collins, who was sent to the area by the British government to establish a penal colony. The settlement was initially called Hobart Town, and was named after Lord Hobart, the British Secretary of State for War and the Colonies. The settlement was initially used as a penal colony, and convicts were sent to the area to work on public works projects. The settlement grew rapidly, and by 1820 it had become the largest town in Australia.
In 1825, the settlement was renamed Hobart, and it was declared a city in 1842. During the 19th century, Hobart developed into a major port and commercial centre, and it became the administrative centre of the state of Tasmania. The city also became a major centre for shipbuilding, and it was the home of the Australian Antarctic Expedition of 1911-1914.
Geography
Hobart is located on the Derwent River in the south-east of Tasmania. The city is surrounded by mountains, including Mount Wellington, which rises to 1,271 metres above sea level. The city is located on the western shore of the Derwent River, and is the second deepest natural harbour in the world.
The city has a temperate climate, with warm summers and mild winters. The average temperature in summer is around 21°C, and in winter it is around 10°C. The city receives an average of 890mm of rainfall per year.
Economy
Hobart is the economic and administrative centre of Tasmania, and is the state's largest city. The city's economy is based on a range of industries, including tourism, manufacturing, education, health care, finance, and government services.
The city is home to a number of major companies, including the University of Tasmania, the Royal Hobart Hospital, and the Tasmanian Government. The city is also home to a number of major tourist attractions, including the Museum of Old and New Art, the Salamanca Markets, and the Royal Tasmanian Botanical Gardens.
Demographics
As of the 2016 census, the population of Hobart was 225,000 people. The city has a diverse population, with people from a range of backgrounds and cultures. The city has a median age of 37 years, and the majority of the population is of European descent. The city also has a significant Indigenous population, with approximately 5% of the population identifying as Aboriginal or Torres Strait Islander.
The city has a high level of education, with approximately 70% of the population having completed at least a high school education. The city also has a high level of employment, with approximately 70% of the population aged 15 and over being employed. The median household income in Hobart is $1,072 per week, and the median house price is $521,000.
Common Questions
What is Per Capita Income in Hobart?
Per Capita income in Hobart is $63,562.
What is the Median Family Income in Hobart?
Median Family Income in Hobart is $170,446.
What is the Median Household income in Hobart?
Median Household Income in Hobart is $143,125.
What is Income or Wage Gap in Hobart?
Income or Wage Gap in Hobart is 35.0%.
Women in Hobart earn 65.0 cents for every dollar earned by a man.
What is Inequality or Gini Index in Hobart?
Inequality or Gini Index in Hobart is 0.42.
What is the Total Population of Hobart?
Total Population of Hobart is 7,155.
What is the Total Male Population of Hobart?
Total Male Population of Hobart is 3,701.
What is the Total Female Population of Hobart?
Total Female Population of Hobart is 3,454.
What is the Ratio of Males per 100 Females in Hobart?
There are 107.15 Males per 100 Females in Hobart.
What is the Ratio of Females per 100 Males in Hobart?
There are 93.33 Females per 100 Males in Hobart.
What is the Median Population Age in Hobart?
Median Population Age in Hobart is 42.5 Years.
What is the Average Family Size in Hobart
Average Family Size in Hobart is 3.1 People.
What is the Average Household Size in Hobart
Average Household Size in Hobart is 2.8 People.
How Large is the Labor Force in Hobart?
There are 3,660 People in the Labor Forcein in Hobart.
What is the Percentage of People in the Labor Force in Hobart?
63.7% of People are in the Labor Force in Hobart.
What is the Unemployment Rate in Hobart?
Unemployment Rate in Hobart is 3.4%.