Zip Codes with the Highest Percentage of Population Employed in Architecture & Engineering in Woodinville, WA
RELATED REPORTS & OPTIONS
Architecture & Engineering
Woodinville
Compare Zip Codes
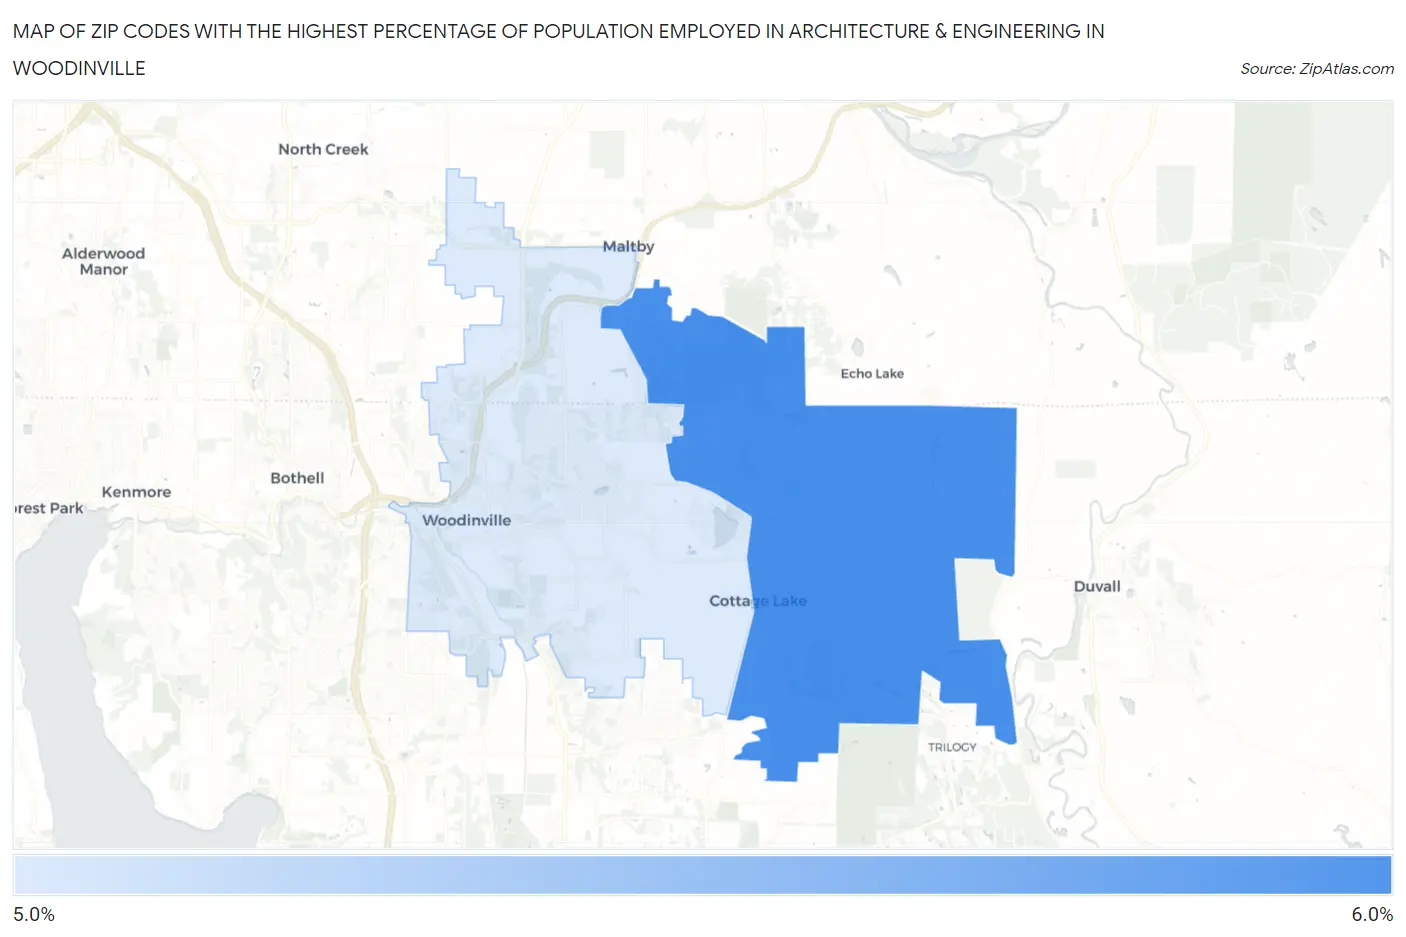
Map of Zip Codes with the Highest Percentage of Population Employed in Architecture & Engineering in Woodinville
5.7%
5.7%
Zip Codes with the Highest Percentage of Population Employed in Architecture & Engineering in Woodinville, WA
| Zip Code | % Employed | vs State | vs National | |
| 1. | 98077 | 5.7% | 2.8%(+2.93)#27 | 2.1%(+3.57)#1,213 |
| 2. | 98072 | 5.7% | 2.8%(+2.88)#28 | 2.1%(+3.52)#1,235 |
1
Common Questions
What are the Top Zip Codes with the Highest Percentage of Population Employed in Architecture & Engineering in Woodinville, WA?
Top Zip Codes with the Highest Percentage of Population Employed in Architecture & Engineering in Woodinville, WA are:
What zip code has the Highest Percentage of Population Employed in Architecture & Engineering in Woodinville, WA?
98077 has the Highest Percentage of Population Employed in Architecture & Engineering in Woodinville, WA with 5.7%.
What is the Percentage of Population Employed in Architecture & Engineering in Woodinville, WA?
Percentage of Population Employed in Architecture & Engineering in Woodinville is 5.0%.
What is the Percentage of Population Employed in Architecture & Engineering in Washington?
Percentage of Population Employed in Architecture & Engineering in Washington is 2.8%.
What is the Percentage of Population Employed in Architecture & Engineering in the United States?
Percentage of Population Employed in Architecture & Engineering in the United States is 2.1%.