Picnic Point, WA Map & Demographics
Picnic Point Map
Picnic Point Overview
$56,294
PER CAPITA INCOME
$154,890
AVG FAMILY INCOME
$129,769
AVG HOUSEHOLD INCOME
13.6%
WAGE / INCOME GAP [ % ]
86.4¢/ $1
WAGE / INCOME GAP [ $ ]
$13,767
FAMILY INCOME DEFICIT
0.39
INEQUALITY / GINI INDEX
9,951
TOTAL POPULATION
5,519
MALE POPULATION
4,432
FEMALE POPULATION
124.53
MALES / 100 FEMALES
80.30
FEMALES / 100 MALES
42.5
MEDIAN AGE
3.0
AVG FAMILY SIZE
2.7
AVG HOUSEHOLD SIZE
5,557
LABOR FORCE [ PEOPLE ]
67.3%
PERCENT IN LABOR FORCE
4.4%
UNEMPLOYMENT RATE
Income in Picnic Point
Income Overview in Picnic Point
Per Capita Income in Picnic Point is $56,294, while median incomes of families and households are $154,890 and $129,769 respectively.
| Characteristic | Number | Measure |
| Per Capita Income | 9,951 | $56,294 |
| Median Family Income | 2,751 | $154,890 |
| Mean Family Income | 2,751 | $170,102 |
| Median Household Income | 3,656 | $129,769 |
| Mean Household Income | 3,656 | $151,727 |
| Income Deficit | 2,751 | $13,767 |
| Wage / Income Gap (%) | 9,951 | 13.60% |
| Wage / Income Gap ($) | 9,951 | 86.40¢ per $1 |
| Gini / Inequality Index | 9,951 | 0.39 |
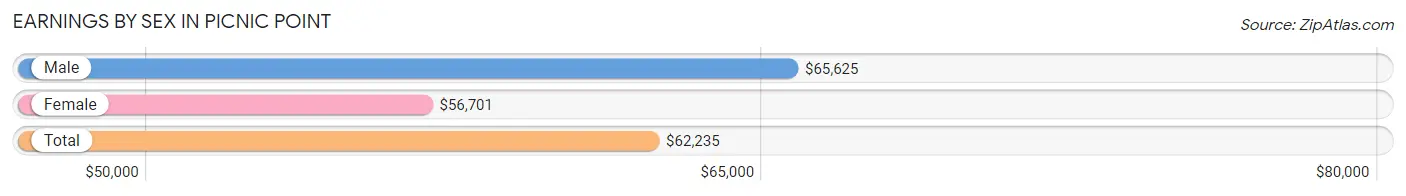
Earnings by Sex in Picnic Point
Average Earnings in Picnic Point are $62,235, $65,625 for men and $56,701 for women, a difference of 13.6%.
| Sex | Number | Average Earnings |
| Male | 3,333 (59.2%) | $65,625 |
| Female | 2,299 (40.8%) | $56,701 |
| Total | 5,632 (100.0%) | $62,235 |
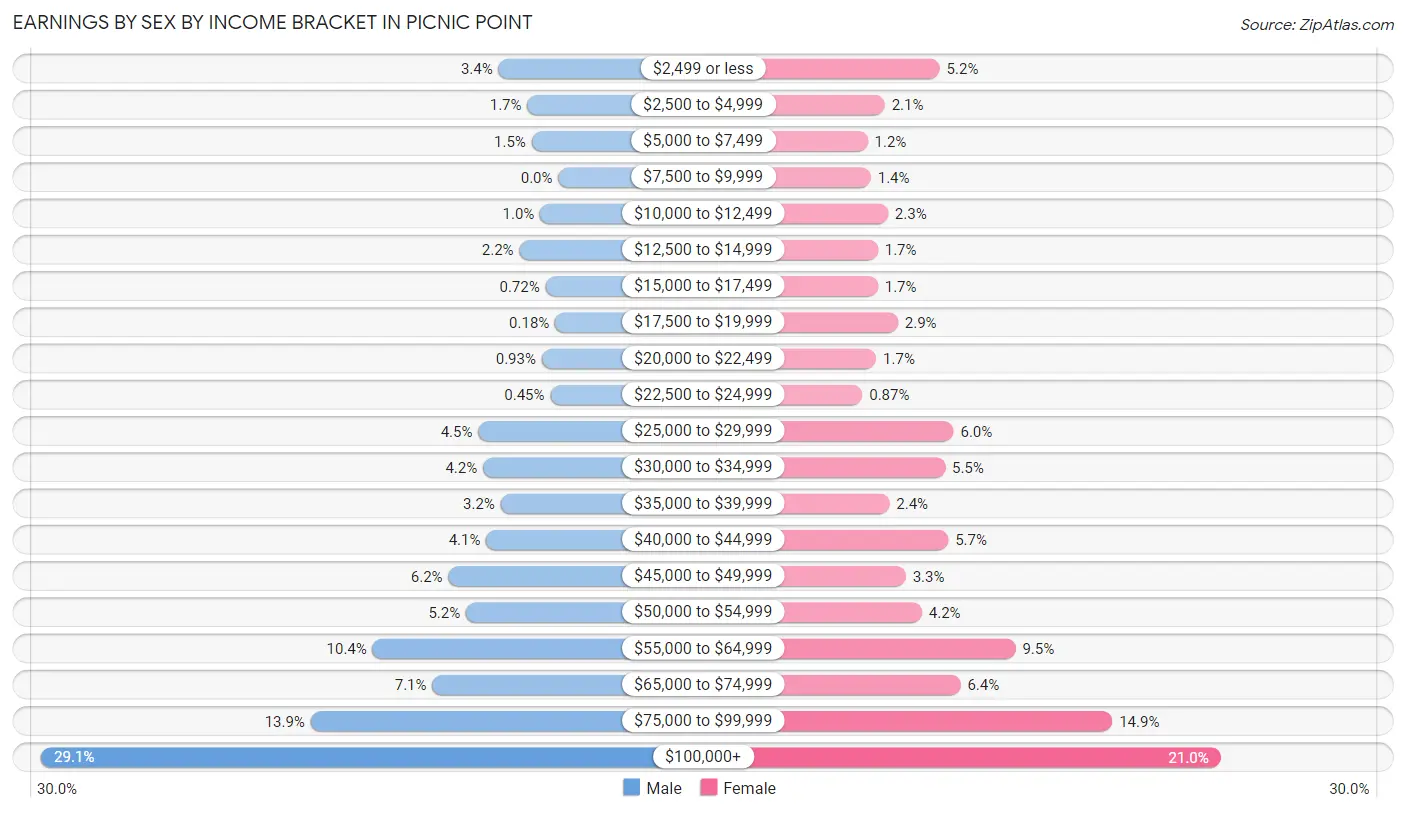
Earnings by Sex by Income Bracket in Picnic Point
The most common earnings brackets in Picnic Point are $100,000+ for men (969 | 29.1%) and $100,000+ for women (483 | 21.0%).
| Income | Male | Female |
| $2,499 or less | 112 (3.4%) | 120 (5.2%) |
| $2,500 to $4,999 | 58 (1.7%) | 49 (2.1%) |
| $5,000 to $7,499 | 50 (1.5%) | 27 (1.2%) |
| $7,500 to $9,999 | 0 (0.0%) | 31 (1.3%) |
| $10,000 to $12,499 | 34 (1.0%) | 53 (2.3%) |
| $12,500 to $14,999 | 73 (2.2%) | 40 (1.7%) |
| $15,000 to $17,499 | 24 (0.7%) | 40 (1.7%) |
| $17,500 to $19,999 | 6 (0.2%) | 66 (2.9%) |
| $20,000 to $22,499 | 31 (0.9%) | 38 (1.7%) |
| $22,500 to $24,999 | 15 (0.4%) | 20 (0.9%) |
| $25,000 to $29,999 | 150 (4.5%) | 138 (6.0%) |
| $30,000 to $34,999 | 141 (4.2%) | 127 (5.5%) |
| $35,000 to $39,999 | 108 (3.2%) | 55 (2.4%) |
| $40,000 to $44,999 | 135 (4.1%) | 131 (5.7%) |
| $45,000 to $49,999 | 206 (6.2%) | 76 (3.3%) |
| $50,000 to $54,999 | 173 (5.2%) | 97 (4.2%) |
| $55,000 to $64,999 | 348 (10.4%) | 218 (9.5%) |
| $65,000 to $74,999 | 236 (7.1%) | 147 (6.4%) |
| $75,000 to $99,999 | 464 (13.9%) | 343 (14.9%) |
| $100,000+ | 969 (29.1%) | 483 (21.0%) |
| Total | 3,333 (100.0%) | 2,299 (100.0%) |
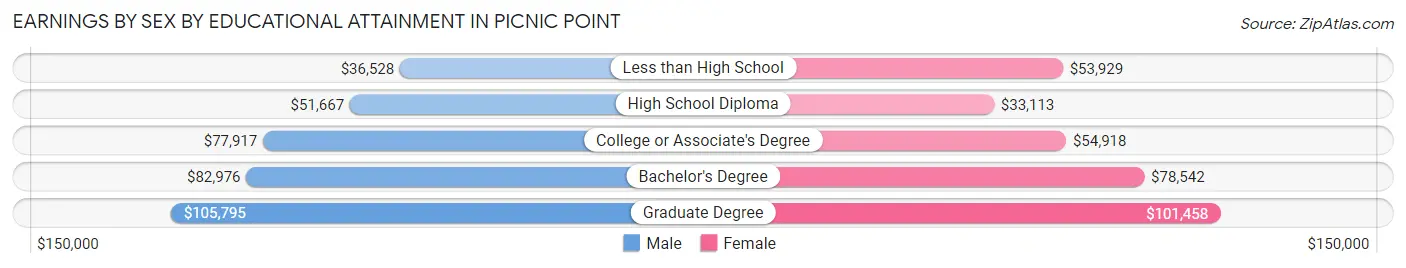
Earnings by Sex by Educational Attainment in Picnic Point
Average earnings in Picnic Point are $72,385 for men and $60,488 for women, a difference of 16.4%. Men with an educational attainment of graduate degree enjoy the highest average annual earnings of $105,795, while those with less than high school education earn the least with $36,528. Women with an educational attainment of graduate degree earn the most with the average annual earnings of $101,458, while those with high school diploma education have the smallest earnings of $33,113.
| Educational Attainment | Male Income | Female Income |
| Less than High School | $36,528 | $53,929 |
| High School Diploma | $51,667 | $33,113 |
| College or Associate's Degree | $77,917 | $54,918 |
| Bachelor's Degree | $82,976 | $78,542 |
| Graduate Degree | $105,795 | $101,458 |
| Total | $72,385 | $60,488 |
Family Income in Picnic Point
Family Income Brackets in Picnic Point
According to the Picnic Point family income data, there are 773 families falling into the $150,000 to $199,999 income range, which is the most common income bracket and makes up 28.1% of all families.
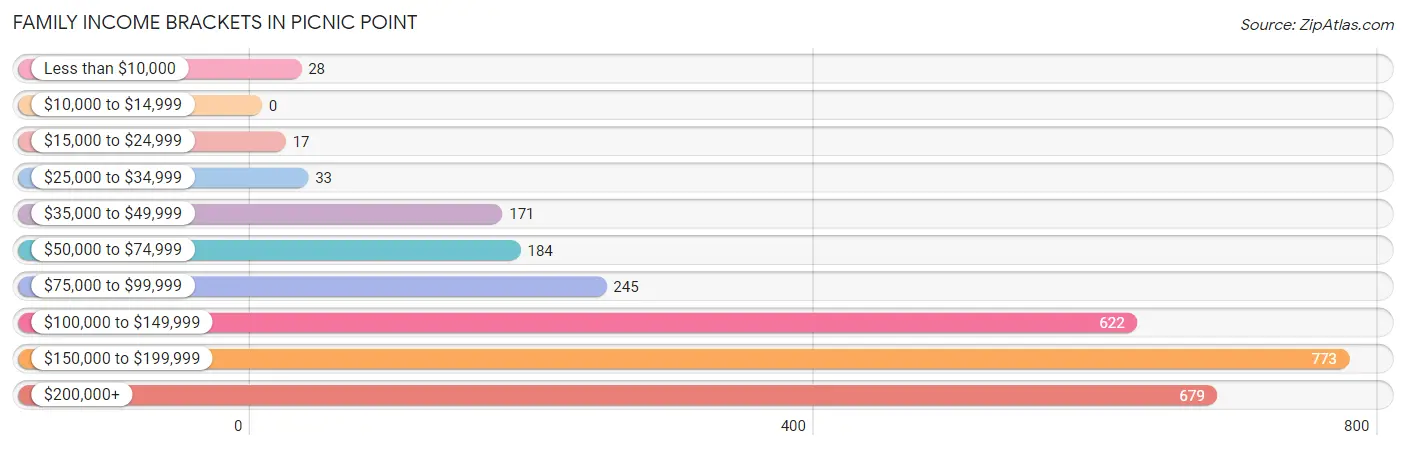
| Income Bracket | # Families | % Families |
| Less than $10,000 | 28 | 1.0% |
| $10,000 to $14,999 | 0 | 0.0% |
| $15,000 to $24,999 | 17 | 0.6% |
| $25,000 to $34,999 | 33 | 1.2% |
| $35,000 to $49,999 | 171 | 6.2% |
| $50,000 to $74,999 | 184 | 6.7% |
| $75,000 to $99,999 | 245 | 8.9% |
| $100,000 to $149,999 | 622 | 22.6% |
| $150,000 to $199,999 | 773 | 28.1% |
| $200,000+ | 679 | 24.7% |
Family Income by Famaliy Size in Picnic Point
6-person families (67 | 2.4%) account for the highest median family income in Picnic Point with $250,001 per family, while 2-person families (1,126 | 40.9%) have the highest median income of $64,616 per family member.
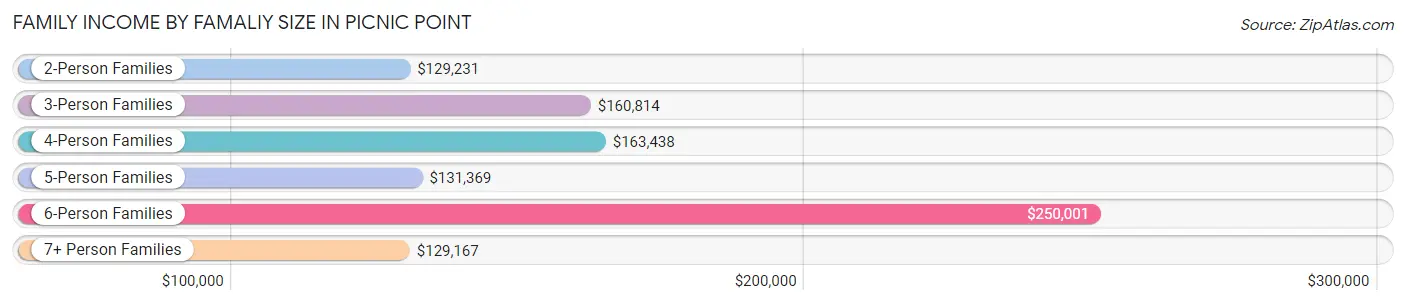
| Income Bracket | # Families | Median Income |
| 2-Person Families | 1,126 (40.9%) | $129,231 |
| 3-Person Families | 772 (28.1%) | $160,814 |
| 4-Person Families | 612 (22.3%) | $163,438 |
| 5-Person Families | 152 (5.5%) | $131,369 |
| 6-Person Families | 67 (2.4%) | $250,001 |
| 7+ Person Families | 22 (0.8%) | $129,167 |
| Total | 2,751 (100.0%) | $154,890 |
Family Income by Number of Earners in Picnic Point
The median family income in Picnic Point is $154,890, with families comprising 2 earners (1,337) having the highest median family income of $165,869, while families with no earners (363) have the lowest median family income of $81,382, accounting for 48.6% and 13.2% of families, respectively.
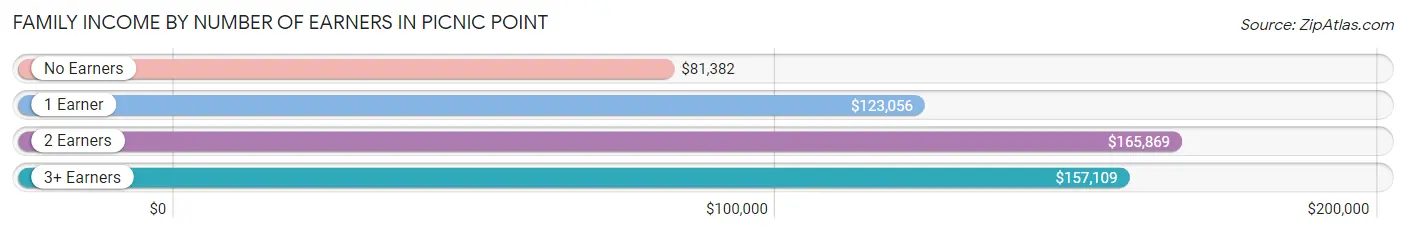
| Number of Earners | # Families | Median Income |
| No Earners | 363 (13.2%) | $81,382 |
| 1 Earner | 628 (22.8%) | $123,056 |
| 2 Earners | 1,337 (48.6%) | $165,869 |
| 3+ Earners | 423 (15.4%) | $157,109 |
| Total | 2,751 (100.0%) | $154,890 |
Household Income in Picnic Point
Household Income Brackets in Picnic Point
With 848 households falling in the category, the $150,000 to $199,999 income range is the most frequent in Picnic Point, accounting for 23.2% of all households. In contrast, only 33 households (0.9%) fall into the $10,000 to $14,999 income bracket, making it the least populous group.
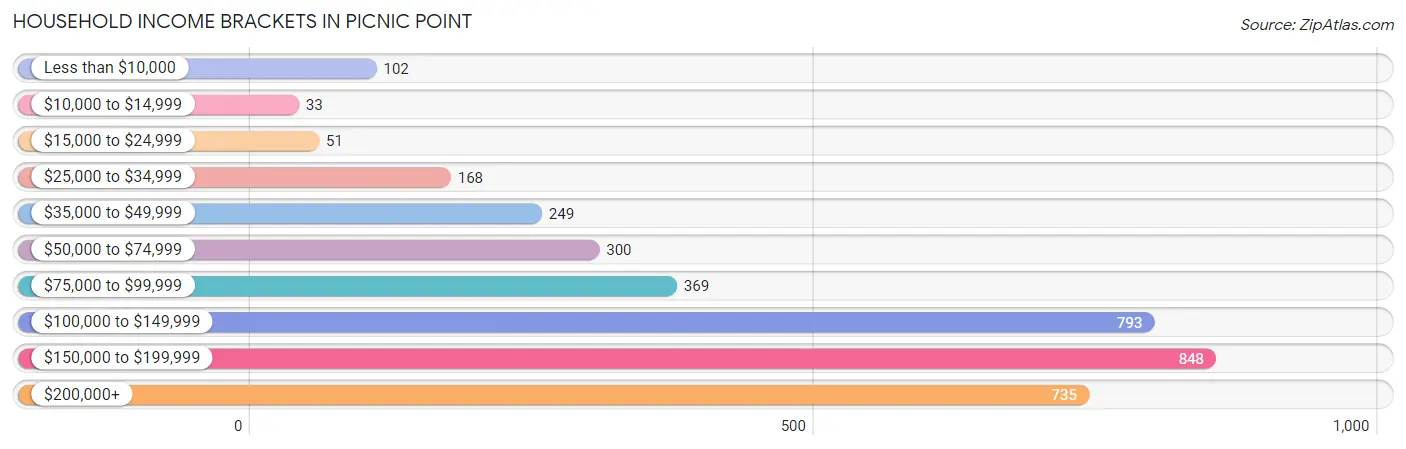
| Income Bracket | # Households | % Households |
| Less than $10,000 | 102 | 2.8% |
| $10,000 to $14,999 | 33 | 0.9% |
| $15,000 to $24,999 | 51 | 1.4% |
| $25,000 to $34,999 | 168 | 4.6% |
| $35,000 to $49,999 | 249 | 6.8% |
| $50,000 to $74,999 | 300 | 8.2% |
| $75,000 to $99,999 | 369 | 10.1% |
| $100,000 to $149,999 | 793 | 21.7% |
| $150,000 to $199,999 | 848 | 23.2% |
| $200,000+ | 735 | 20.1% |
Household Income by Householder Age in Picnic Point
The median household income in Picnic Point is $129,769, with the highest median household income of $156,683 found in the 25 to 44 years age bracket for the primary householder. A total of 1,264 households (34.6%) fall into this category. Meanwhile, the 15 to 24 years age bracket for the primary householder has the lowest median household income of $0, with 31 households (0.9%) in this group.
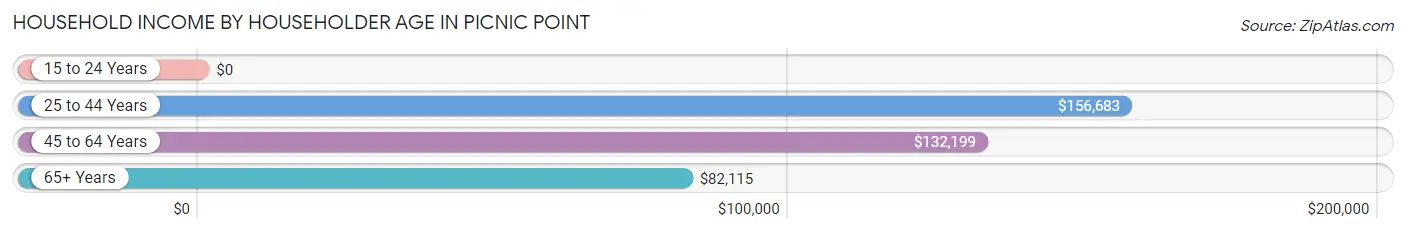
| Income Bracket | # Households | Median Income |
| 15 to 24 Years | 31 (0.9%) | $0 |
| 25 to 44 Years | 1,264 (34.6%) | $156,683 |
| 45 to 64 Years | 1,433 (39.2%) | $132,199 |
| 65+ Years | 928 (25.4%) | $82,115 |
| Total | 3,656 (100.0%) | $129,769 |
Poverty in Picnic Point
Income Below Poverty by Sex and Age in Picnic Point
With 6.4% poverty level for males and 2.4% for females among the residents of Picnic Point, 18 to 24 year old males and 15 year old females are the most vulnerable to poverty, with 88 males (19.7%) and 9 females (25.7%) in their respective age groups living below the poverty level.
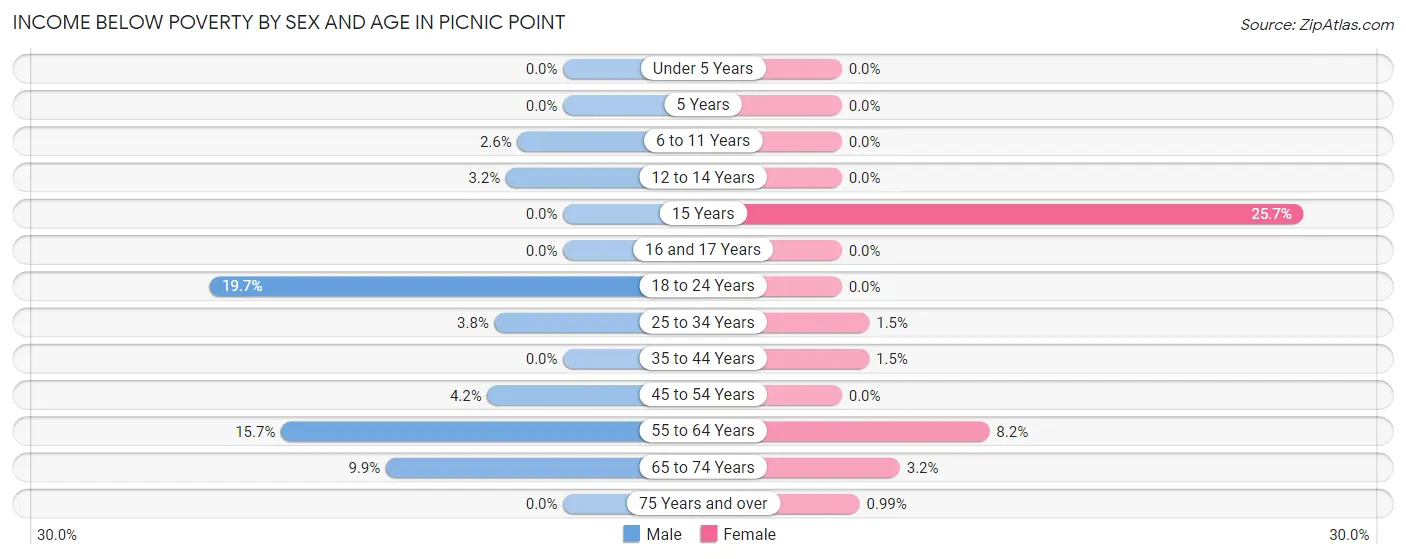
| Age Bracket | Male | Female |
| Under 5 Years | 0 (0.0%) | 0 (0.0%) |
| 5 Years | 0 (0.0%) | 0 (0.0%) |
| 6 to 11 Years | 9 (2.5%) | 0 (0.0%) |
| 12 to 14 Years | 9 (3.2%) | 0 (0.0%) |
| 15 Years | 0 (0.0%) | 9 (25.7%) |
| 16 and 17 Years | 0 (0.0%) | 0 (0.0%) |
| 18 to 24 Years | 88 (19.7%) | 0 (0.0%) |
| 25 to 34 Years | 28 (3.8%) | 7 (1.5%) |
| 35 to 44 Years | 0 (0.0%) | 11 (1.5%) |
| 45 to 54 Years | 32 (4.2%) | 0 (0.0%) |
| 55 to 64 Years | 129 (15.7%) | 56 (8.2%) |
| 65 to 74 Years | 55 (9.9%) | 18 (3.2%) |
| 75 Years and over | 0 (0.0%) | 3 (1.0%) |
| Total | 350 (6.4%) | 104 (2.4%) |
Income Above Poverty by Sex and Age in Picnic Point
According to the poverty statistics in Picnic Point, males aged under 5 years and females aged under 5 years are the age groups that are most secure financially, with 100.0% of males and 100.0% of females in these age groups living above the poverty line.
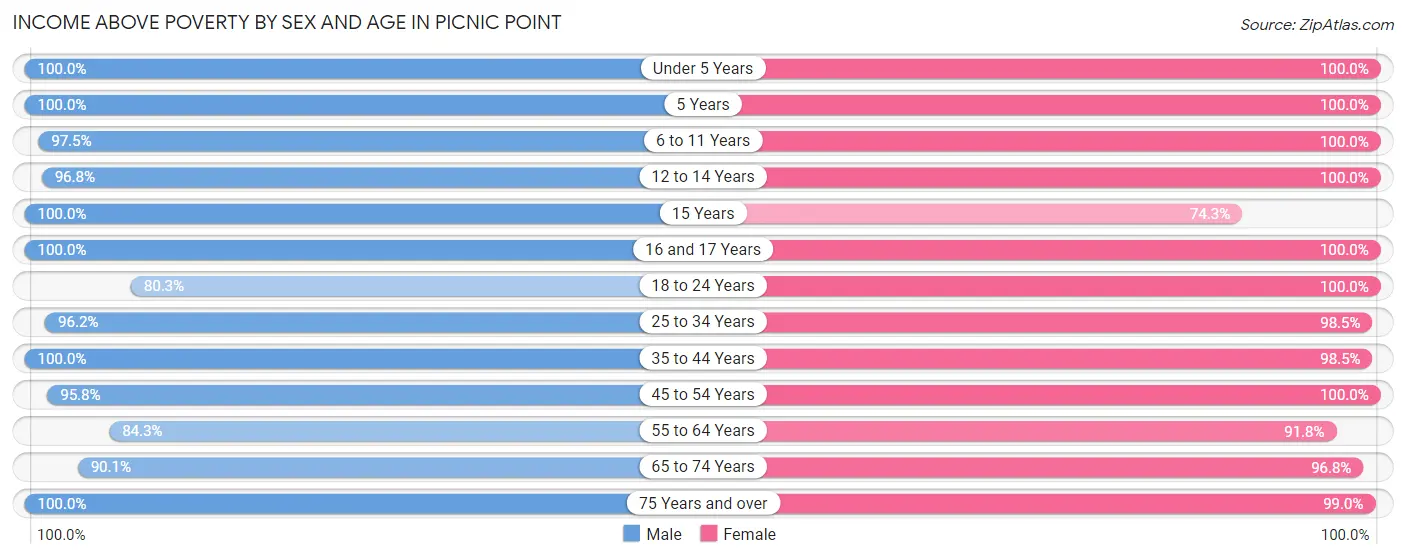
| Age Bracket | Male | Female |
| Under 5 Years | 144 (100.0%) | 201 (100.0%) |
| 5 Years | 29 (100.0%) | 56 (100.0%) |
| 6 to 11 Years | 344 (97.5%) | 344 (100.0%) |
| 12 to 14 Years | 273 (96.8%) | 195 (100.0%) |
| 15 Years | 52 (100.0%) | 26 (74.3%) |
| 16 and 17 Years | 184 (100.0%) | 133 (100.0%) |
| 18 to 24 Years | 358 (80.3%) | 149 (100.0%) |
| 25 to 34 Years | 705 (96.2%) | 451 (98.5%) |
| 35 to 44 Years | 904 (100.0%) | 712 (98.5%) |
| 45 to 54 Years | 727 (95.8%) | 596 (100.0%) |
| 55 to 64 Years | 692 (84.3%) | 625 (91.8%) |
| 65 to 74 Years | 502 (90.1%) | 540 (96.8%) |
| 75 Years and over | 250 (100.0%) | 300 (99.0%) |
| Total | 5,164 (93.6%) | 4,328 (97.7%) |
Income Below Poverty Among Married-Couple Families in Picnic Point
The poverty statistics for married-couple families in Picnic Point show that 1.6% or 39 of the total 2,390 families live below the poverty line. Families with 3 or 4 children have the highest poverty rate of 7.5%, comprising of 11 families. On the other hand, families with 1 or 2 children have the lowest poverty rate of 0.0%, which includes 0 families.
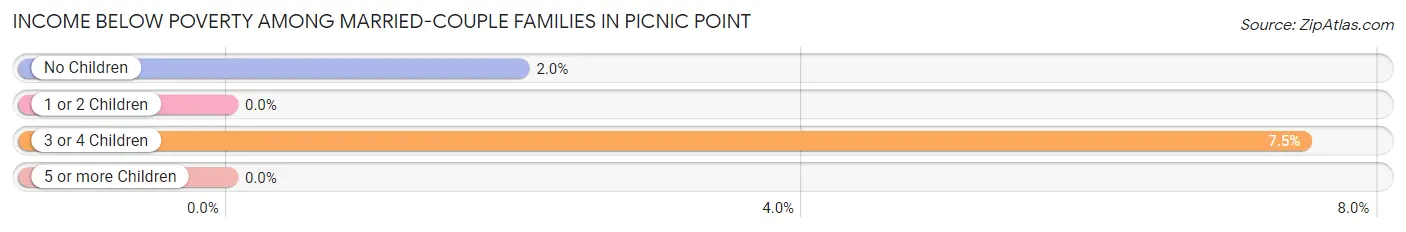
| Children | Above Poverty | Below Poverty |
| No Children | 1,349 (98.0%) | 28 (2.0%) |
| 1 or 2 Children | 850 (100.0%) | 0 (0.0%) |
| 3 or 4 Children | 136 (92.5%) | 11 (7.5%) |
| 5 or more Children | 16 (100.0%) | 0 (0.0%) |
| Total | 2,351 (98.4%) | 39 (1.6%) |
Income Below Poverty Among Single-Parent Households in Picnic Point
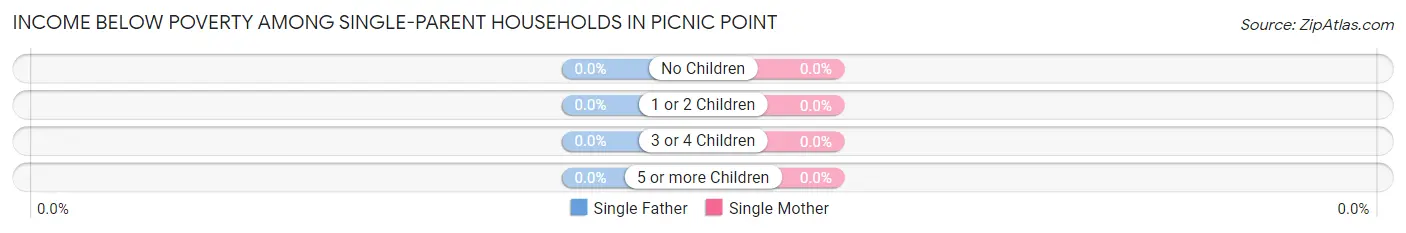
| Children | Single Father | Single Mother |
| No Children | 0 (0.0%) | 0 (0.0%) |
| 1 or 2 Children | 0 (0.0%) | 0 (0.0%) |
| 3 or 4 Children | 0 (0.0%) | 0 (0.0%) |
| 5 or more Children | 0 (0.0%) | 0 (0.0%) |
| Total | 0 (0.0%) | 0 (0.0%) |
Income Below Poverty Among Married-Couple vs Single-Parent Households in Picnic Point
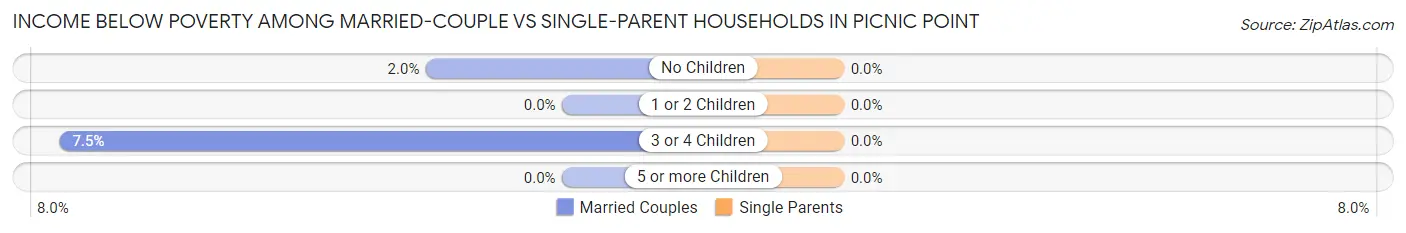
| Children | Married-Couple Families | Single-Parent Households |
| No Children | 28 (2.0%) | 0 (0.0%) |
| 1 or 2 Children | 0 (0.0%) | 0 (0.0%) |
| 3 or 4 Children | 11 (7.5%) | 0 (0.0%) |
| 5 or more Children | 0 (0.0%) | 0 (0.0%) |
| Total | 39 (1.6%) | 0 (0.0%) |
Race in Picnic Point
The most populous races in Picnic Point are White / Caucasian (6,886 | 69.2%), Asian (1,612 | 16.2%), and Two or more Races (1,081 | 10.9%).
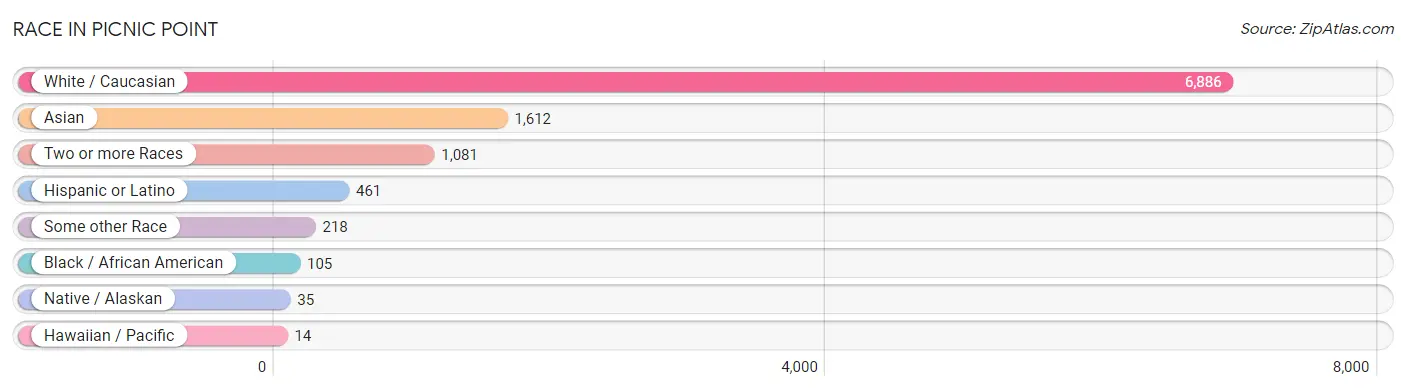
| Race | # Population | % Population |
| Asian | 1,612 | 16.2% |
| Black / African American | 105 | 1.1% |
| Hawaiian / Pacific | 14 | 0.1% |
| Hispanic or Latino | 461 | 4.6% |
| Native / Alaskan | 35 | 0.4% |
| White / Caucasian | 6,886 | 69.2% |
| Two or more Races | 1,081 | 10.9% |
| Some other Race | 218 | 2.2% |
| Total | 9,951 | 100.0% |
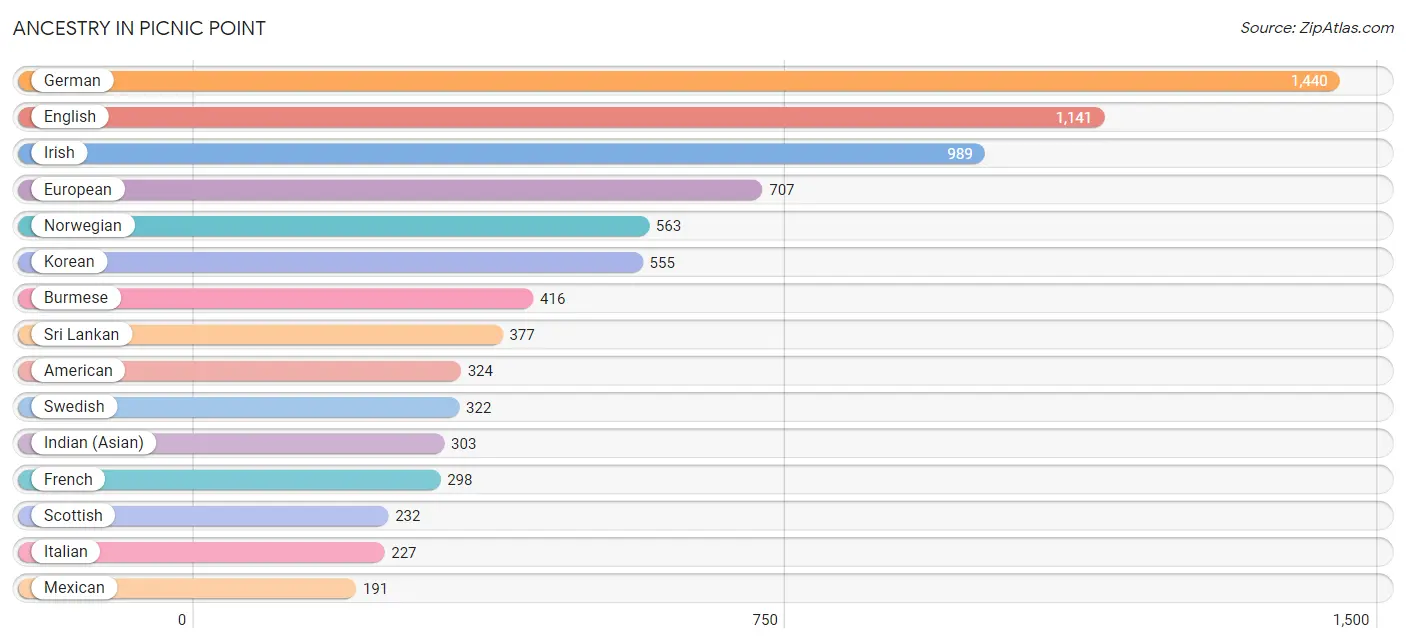
Ancestry in Picnic Point
The most populous ancestries reported in Picnic Point are German (1,440 | 14.5%), English (1,141 | 11.5%), Irish (989 | 9.9%), European (707 | 7.1%), and Norwegian (563 | 5.7%), together accounting for 48.6% of all Picnic Point residents.
| Ancestry | # Population | % Population |
| American | 324 | 3.3% |
| Arab | 95 | 0.9% |
| Armenian | 51 | 0.5% |
| Austrian | 18 | 0.2% |
| Belgian | 14 | 0.1% |
| Bhutanese | 91 | 0.9% |
| Brazilian | 31 | 0.3% |
| British | 123 | 1.2% |
| Bulgarian | 54 | 0.5% |
| Burmese | 416 | 4.2% |
| Cajun | 3 | 0.0% |
| Canadian | 6 | 0.1% |
| Central American | 8 | 0.1% |
| Cherokee | 11 | 0.1% |
| Chilean | 7 | 0.1% |
| Colombian | 11 | 0.1% |
| Croatian | 14 | 0.1% |
| Crow | 38 | 0.4% |
| Czech | 21 | 0.2% |
| Danish | 34 | 0.3% |
| Dutch | 60 | 0.6% |
| Eastern European | 36 | 0.4% |
| Ecuadorian | 12 | 0.1% |
| Egyptian | 68 | 0.7% |
| English | 1,141 | 11.5% |
| Ethiopian | 28 | 0.3% |
| European | 707 | 7.1% |
| Finnish | 64 | 0.6% |
| French | 298 | 3.0% |
| French American Indian | 29 | 0.3% |
| French Canadian | 10 | 0.1% |
| German | 1,440 | 14.5% |
| Greek | 131 | 1.3% |
| Guatemalan | 8 | 0.1% |
| Guyanese | 10 | 0.1% |
| Hungarian | 10 | 0.1% |
| Indian (Asian) | 303 | 3.0% |
| Iranian | 24 | 0.2% |
| Irish | 989 | 9.9% |
| Italian | 227 | 2.3% |
| Japanese | 84 | 0.8% |
| Kenyan | 20 | 0.2% |
| Korean | 555 | 5.6% |
| Laotian | 57 | 0.6% |
| Lebanese | 18 | 0.2% |
| Lithuanian | 52 | 0.5% |
| Malaysian | 74 | 0.7% |
| Maltese | 13 | 0.1% |
| Mexican | 191 | 1.9% |
| Moroccan | 9 | 0.1% |
| Native Hawaiian | 87 | 0.9% |
| Northern European | 18 | 0.2% |
| Norwegian | 563 | 5.7% |
| Pakistani | 48 | 0.5% |
| Peruvian | 136 | 1.4% |
| Polish | 162 | 1.6% |
| Portuguese | 16 | 0.2% |
| Puerto Rican | 4 | 0.0% |
| Puget Sound Salish | 10 | 0.1% |
| Romanian | 61 | 0.6% |
| Russian | 188 | 1.9% |
| Scandinavian | 186 | 1.9% |
| Scotch-Irish | 40 | 0.4% |
| Scottish | 232 | 2.3% |
| Slovak | 34 | 0.3% |
| South American | 166 | 1.7% |
| Spaniard | 13 | 0.1% |
| Spanish | 7 | 0.1% |
| Sri Lankan | 377 | 3.8% |
| Subsaharan African | 48 | 0.5% |
| Swedish | 322 | 3.2% |
| Swiss | 77 | 0.8% |
| Thai | 109 | 1.1% |
| Tlingit-Haida | 43 | 0.4% |
| Turkish | 45 | 0.4% |
| U.S. Virgin Islander | 12 | 0.1% |
| Ukrainian | 62 | 0.6% |
| Welsh | 99 | 1.0% |
| Yaqui | 6 | 0.1% | View All 79 Rows |
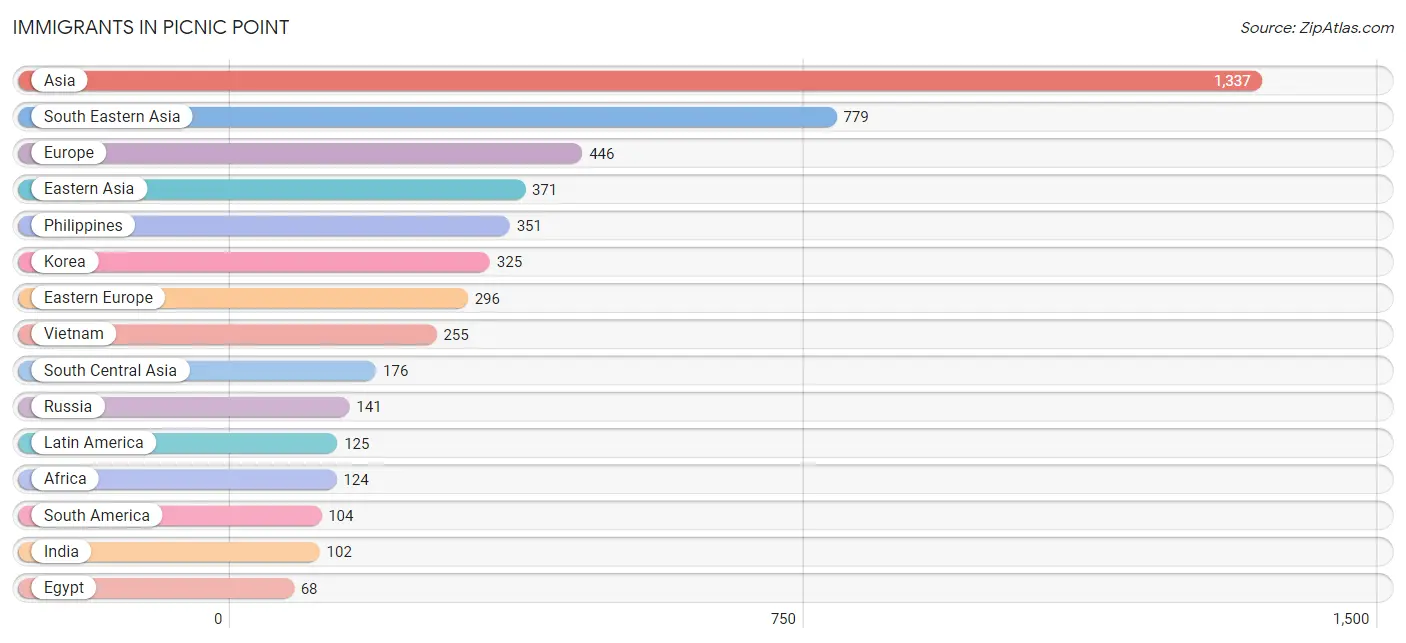
Immigrants in Picnic Point
The most numerous immigrant groups reported in Picnic Point came from Asia (1,337 | 13.4%), South Eastern Asia (779 | 7.8%), Europe (446 | 4.5%), Eastern Asia (371 | 3.7%), and Philippines (351 | 3.5%), together accounting for 33.0% of all Picnic Point residents.
| Immigration Origin | # Population | % Population |
| Africa | 124 | 1.3% |
| Asia | 1,337 | 13.4% |
| Belgium | 14 | 0.1% |
| Brazil | 26 | 0.3% |
| Bulgaria | 42 | 0.4% |
| Cambodia | 31 | 0.3% |
| Canada | 31 | 0.3% |
| Central America | 21 | 0.2% |
| Chile | 7 | 0.1% |
| China | 46 | 0.5% |
| Colombia | 11 | 0.1% |
| Croatia | 7 | 0.1% |
| Eastern Africa | 48 | 0.5% |
| Eastern Asia | 371 | 3.7% |
| Eastern Europe | 296 | 3.0% |
| Egypt | 68 | 0.7% |
| El Salvador | 8 | 0.1% |
| England | 31 | 0.3% |
| Ethiopia | 31 | 0.3% |
| Europe | 446 | 4.5% |
| Germany | 36 | 0.4% |
| India | 102 | 1.0% |
| Indonesia | 30 | 0.3% |
| Iran | 64 | 0.6% |
| Kenya | 17 | 0.2% |
| Korea | 325 | 3.3% |
| Laos | 25 | 0.3% |
| Latin America | 125 | 1.3% |
| Lebanon | 11 | 0.1% |
| Malaysia | 40 | 0.4% |
| Mexico | 13 | 0.1% |
| Moldova | 61 | 0.6% |
| Northern Africa | 68 | 0.7% |
| Northern Europe | 60 | 0.6% |
| Peru | 60 | 0.6% |
| Philippines | 351 | 3.5% |
| Russia | 141 | 1.4% |
| South Africa | 8 | 0.1% |
| South America | 104 | 1.1% |
| South Central Asia | 176 | 1.8% |
| South Eastern Asia | 779 | 7.8% |
| Sweden | 10 | 0.1% |
| Thailand | 29 | 0.3% |
| Ukraine | 35 | 0.4% |
| Vietnam | 255 | 2.6% |
| Western Asia | 11 | 0.1% |
| Western Europe | 50 | 0.5% | View All 47 Rows |
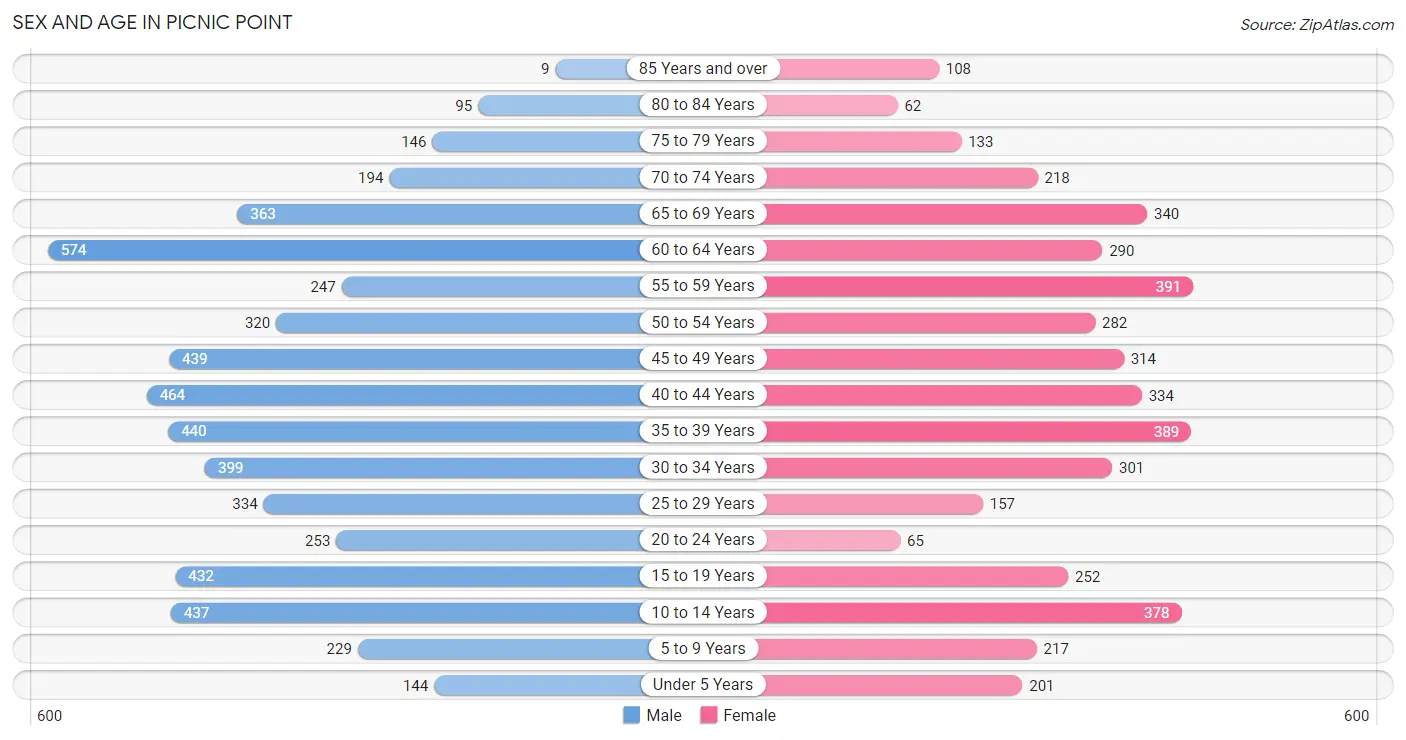
Sex and Age in Picnic Point
Sex and Age in Picnic Point
The most populous age groups in Picnic Point are 60 to 64 Years (574 | 10.4%) for men and 55 to 59 Years (391 | 8.8%) for women.
| Age Bracket | Male | Female |
| Under 5 Years | 144 (2.6%) | 201 (4.5%) |
| 5 to 9 Years | 229 (4.2%) | 217 (4.9%) |
| 10 to 14 Years | 437 (7.9%) | 378 (8.5%) |
| 15 to 19 Years | 432 (7.8%) | 252 (5.7%) |
| 20 to 24 Years | 253 (4.6%) | 65 (1.5%) |
| 25 to 29 Years | 334 (6.0%) | 157 (3.5%) |
| 30 to 34 Years | 399 (7.2%) | 301 (6.8%) |
| 35 to 39 Years | 440 (8.0%) | 389 (8.8%) |
| 40 to 44 Years | 464 (8.4%) | 334 (7.5%) |
| 45 to 49 Years | 439 (8.0%) | 314 (7.1%) |
| 50 to 54 Years | 320 (5.8%) | 282 (6.4%) |
| 55 to 59 Years | 247 (4.5%) | 391 (8.8%) |
| 60 to 64 Years | 574 (10.4%) | 290 (6.5%) |
| 65 to 69 Years | 363 (6.6%) | 340 (7.7%) |
| 70 to 74 Years | 194 (3.5%) | 218 (4.9%) |
| 75 to 79 Years | 146 (2.6%) | 133 (3.0%) |
| 80 to 84 Years | 95 (1.7%) | 62 (1.4%) |
| 85 Years and over | 9 (0.2%) | 108 (2.4%) |
| Total | 5,519 (100.0%) | 4,432 (100.0%) |
Families and Households in Picnic Point
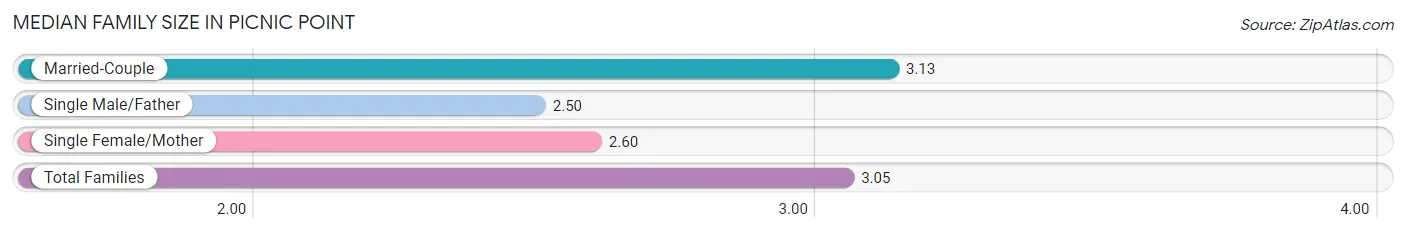
Median Family Size in Picnic Point
The median family size in Picnic Point is 3.05 persons per family, with married-couple families (2,390 | 86.9%) accounting for the largest median family size of 3.13 persons per family. On the other hand, single male/father families (205 | 7.4%) represent the smallest median family size with 2.50 persons per family.
| Family Type | # Families | Family Size |
| Married-Couple | 2,390 (86.9%) | 3.13 |
| Single Male/Father | 205 (7.4%) | 2.50 |
| Single Female/Mother | 156 (5.7%) | 2.60 |
| Total Families | 2,751 (100.0%) | 3.05 |
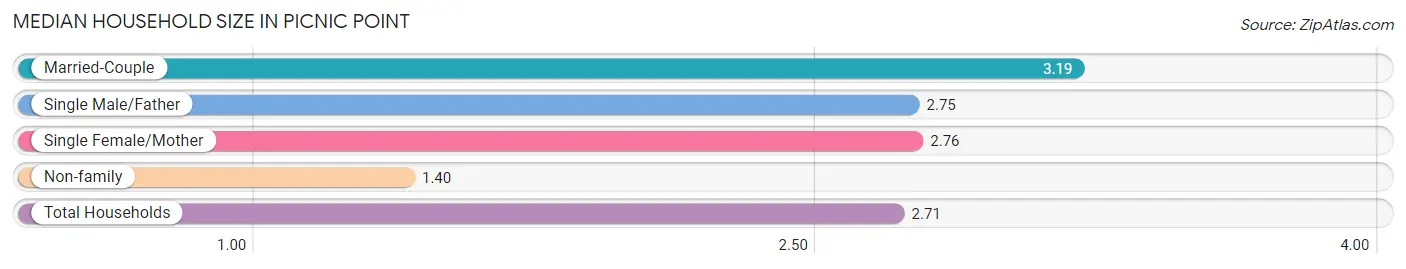
Median Household Size in Picnic Point
The median household size in Picnic Point is 2.71 persons per household, with married-couple households (2,390 | 65.4%) accounting for the largest median household size of 3.19 persons per household. non-family households (905 | 24.7%) represent the smallest median household size with 1.40 persons per household.
| Household Type | # Households | Household Size |
| Married-Couple | 2,390 (65.4%) | 3.19 |
| Single Male/Father | 205 (5.6%) | 2.75 |
| Single Female/Mother | 156 (4.3%) | 2.76 |
| Non-family | 905 (24.7%) | 1.40 |
| Total Households | 3,656 (100.0%) | 2.71 |
Household Size by Marriage Status in Picnic Point
Out of a total of 3,656 households in Picnic Point, 2,751 (75.2%) are family households, while 905 (24.7%) are nonfamily households. The most numerous type of family households are 2-person households, comprising 1,059, and the most common type of nonfamily households are 1-person households, comprising 622.
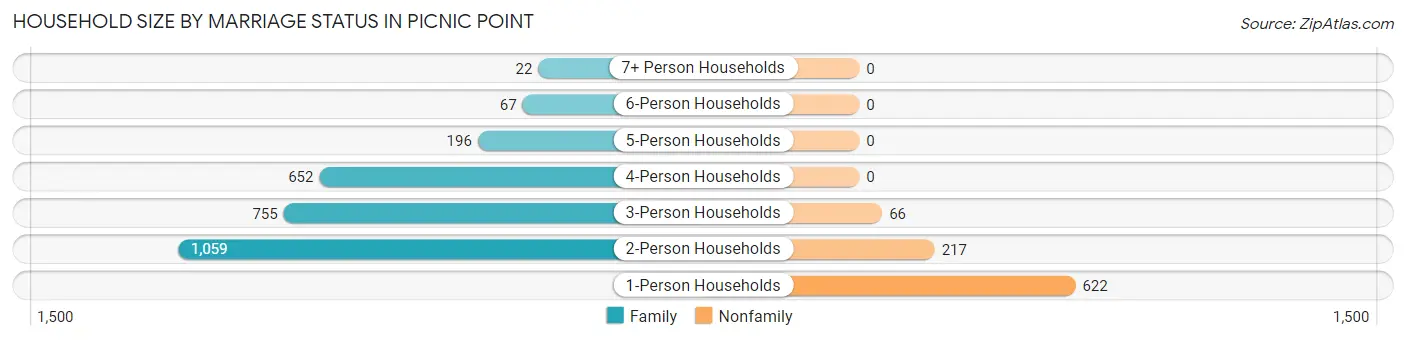
| Household Size | Family Households | Nonfamily Households |
| 1-Person Households | - | 622 (17.0%) |
| 2-Person Households | 1,059 (29.0%) | 217 (5.9%) |
| 3-Person Households | 755 (20.6%) | 66 (1.8%) |
| 4-Person Households | 652 (17.8%) | 0 (0.0%) |
| 5-Person Households | 196 (5.4%) | 0 (0.0%) |
| 6-Person Households | 67 (1.8%) | 0 (0.0%) |
| 7+ Person Households | 22 (0.6%) | 0 (0.0%) |
| Total | 2,751 (75.2%) | 905 (24.7%) |
Female Fertility in Picnic Point
Fertility by Age in Picnic Point
Average fertility rate in Picnic Point is 32.0 births per 1,000 women. Women in the age bracket of 20 to 34 years have the highest fertility rate with 73.0 births per 1,000 women. Women in the age bracket of 20 to 34 years acount for 63.3% of all women with births.
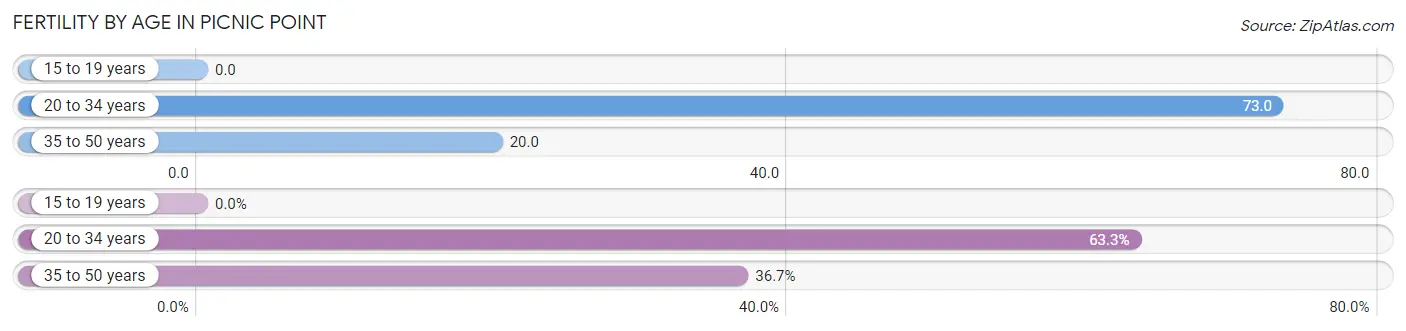
| Age Bracket | Women with Births | Births / 1,000 Women |
| 15 to 19 years | 0 (0.0%) | 0.0 |
| 20 to 34 years | 38 (63.3%) | 73.0 |
| 35 to 50 years | 22 (36.7%) | 20.0 |
| Total | 60 (100.0%) | 32.0 |
Fertility by Age by Marriage Status in Picnic Point
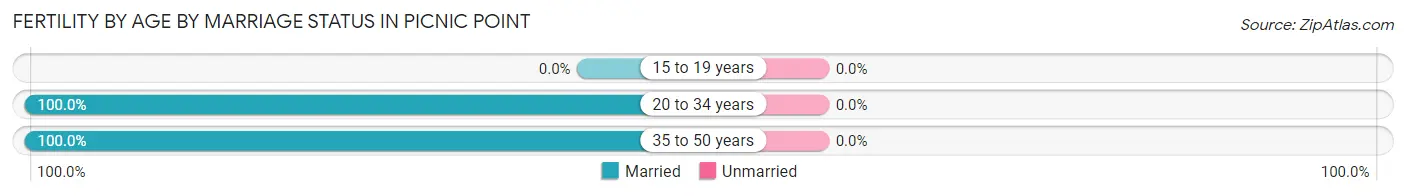
| Age Bracket | Married | Unmarried |
| 15 to 19 years | 0 (0.0%) | 0 (0.0%) |
| 20 to 34 years | 38 (100.0%) | 0 (0.0%) |
| 35 to 50 years | 22 (100.0%) | 0 (0.0%) |
| Total | 60 (100.0%) | 0 (0.0%) |
Fertility by Education in Picnic Point
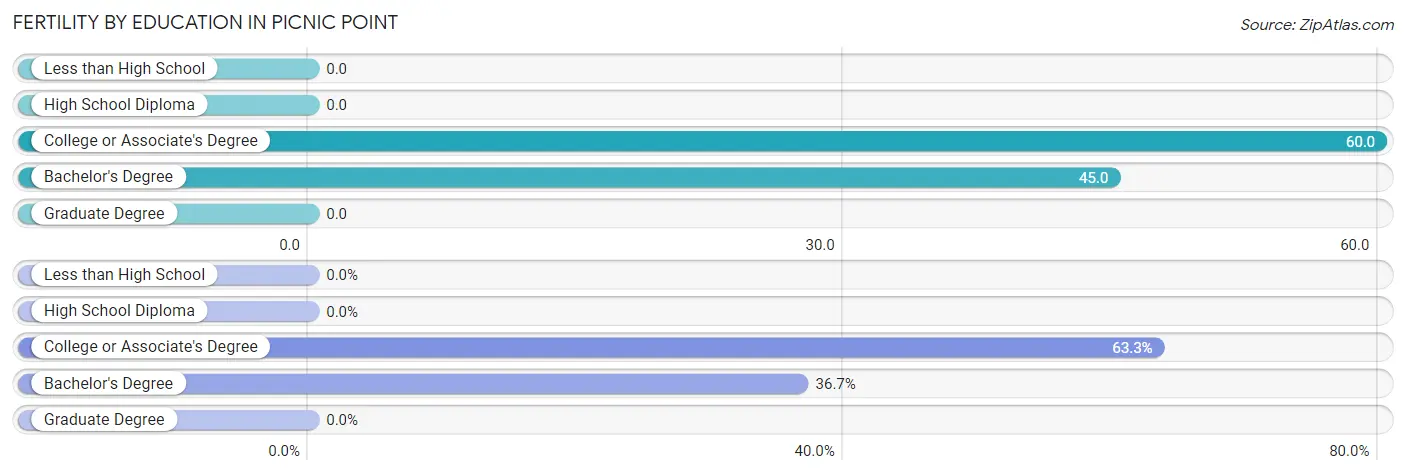
| Educational Attainment | Women with Births | Births / 1,000 Women |
| Less than High School | 0 (0.0%) | 0.0 |
| High School Diploma | 0 (0.0%) | 0.0 |
| College or Associate's Degree | 38 (63.3%) | 60.0 |
| Bachelor's Degree | 22 (36.7%) | 45.0 |
| Graduate Degree | 0 (0.0%) | 0.0 |
| Total | 60 (100.0%) | 32.0 |
Fertility by Education by Marriage Status in Picnic Point
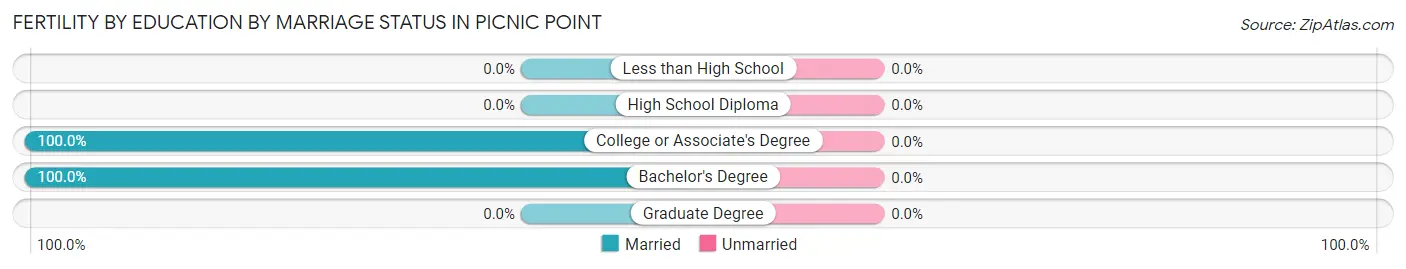
| Educational Attainment | Married | Unmarried |
| Less than High School | 0 (0.0%) | 0 (0.0%) |
| High School Diploma | 0 (0.0%) | 0 (0.0%) |
| College or Associate's Degree | 38 (100.0%) | 0 (0.0%) |
| Bachelor's Degree | 22 (100.0%) | 0 (0.0%) |
| Graduate Degree | 0 (0.0%) | 0 (0.0%) |
| Total | 60 (100.0%) | 0 (0.0%) |
Employment Characteristics in Picnic Point
Employment by Class of Employer in Picnic Point
Among the 5,143 employed individuals in Picnic Point, private company employees (3,426 | 66.6%), not-for-profit organizations (365 | 7.1%), and self-employed (not incorporated) (361 | 7.0%) make up the most common classes of employment.

| Employer Class | # Employees | % Employees |
| Private Company Employees | 3,426 | 66.6% |
| Self-Employed (Incorporated) | 291 | 5.7% |
| Self-Employed (Not Incorporated) | 361 | 7.0% |
| Not-for-profit Organizations | 365 | 7.1% |
| Local Government Employees | 318 | 6.2% |
| State Government Employees | 282 | 5.5% |
| Federal Government Employees | 90 | 1.8% |
| Unpaid Family Workers | 10 | 0.2% |
| Total | 5,143 | 100.0% |
Employment Status by Age in Picnic Point
According to the labor force statistics for Picnic Point, out of the total population over 16 years of age (8,257), 67.3% or 5,557 individuals are in the labor force, with 4.4% or 245 of them unemployed. The age group with the highest labor force participation rate is 45 to 54 years, with 93.4% or 1,266 individuals in the labor force. Within the labor force, the 16 to 19 years age range has the highest percentage of unemployed individuals, with 24.6% or 66 of them being unemployed.
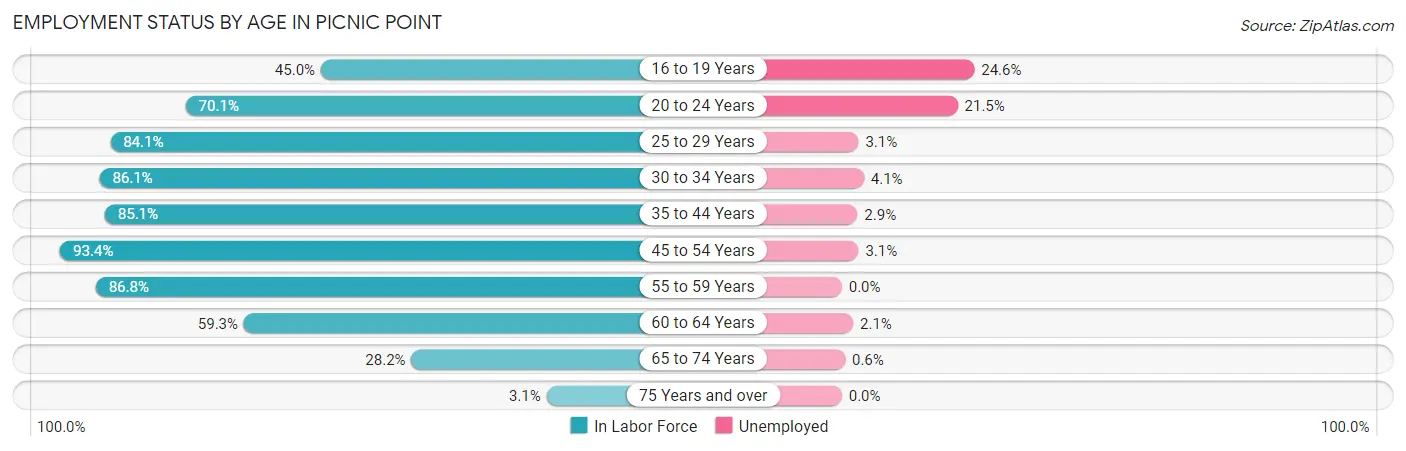
| Age Bracket | In Labor Force | Unemployed |
| 16 to 19 Years | 268 (45.0%) | 66 (24.6%) |
| 20 to 24 Years | 223 (70.1%) | 48 (21.5%) |
| 25 to 29 Years | 413 (84.1%) | 13 (3.1%) |
| 30 to 34 Years | 603 (86.1%) | 25 (4.1%) |
| 35 to 44 Years | 1,385 (85.1%) | 40 (2.9%) |
| 45 to 54 Years | 1,266 (93.4%) | 39 (3.1%) |
| 55 to 59 Years | 554 (86.8%) | 0 (0.0%) |
| 60 to 64 Years | 512 (59.3%) | 11 (2.1%) |
| 65 to 74 Years | 314 (28.2%) | 2 (0.6%) |
| 75 Years and over | 17 (3.1%) | 0 (0.0%) |
| Total | 5,557 (67.3%) | 245 (4.4%) |
Employment Status by Educational Attainment in Picnic Point
According to labor force statistics for Picnic Point, 83.4% of individuals (4,733) out of the total population between 25 and 64 years of age (5,675) are in the labor force, with 2.7% or 128 of them being unemployed. The group with the highest labor force participation rate are those with the educational attainment of bachelor's degree or higher, with 89.1% or 1,825 individuals in the labor force. Within the labor force, individuals with less than high school education have the highest percentage of unemployment, with 4.4% or 8 of them being unemployed.
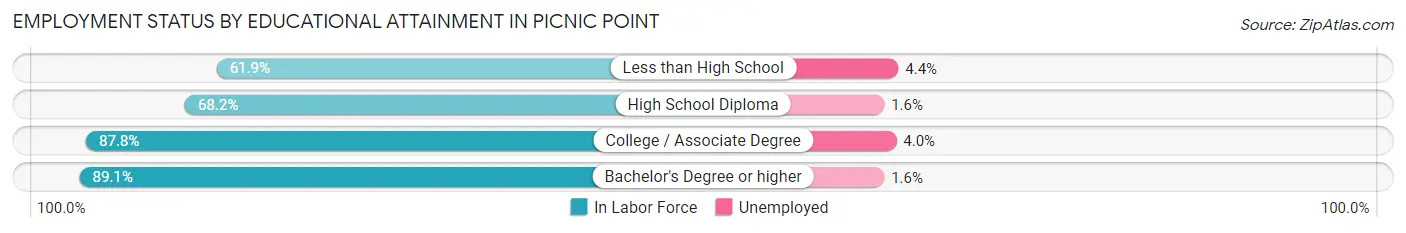
| Educational Attainment | In Labor Force | Unemployed |
| Less than High School | 182 (61.9%) | 13 (4.4%) |
| High School Diploma | 704 (68.2%) | 17 (1.6%) |
| College / Associate Degree | 2,020 (87.8%) | 92 (4.0%) |
| Bachelor's Degree or higher | 1,825 (89.1%) | 33 (1.6%) |
| Total | 4,733 (83.4%) | 153 (2.7%) |
Employment Occupations by Sex in Picnic Point
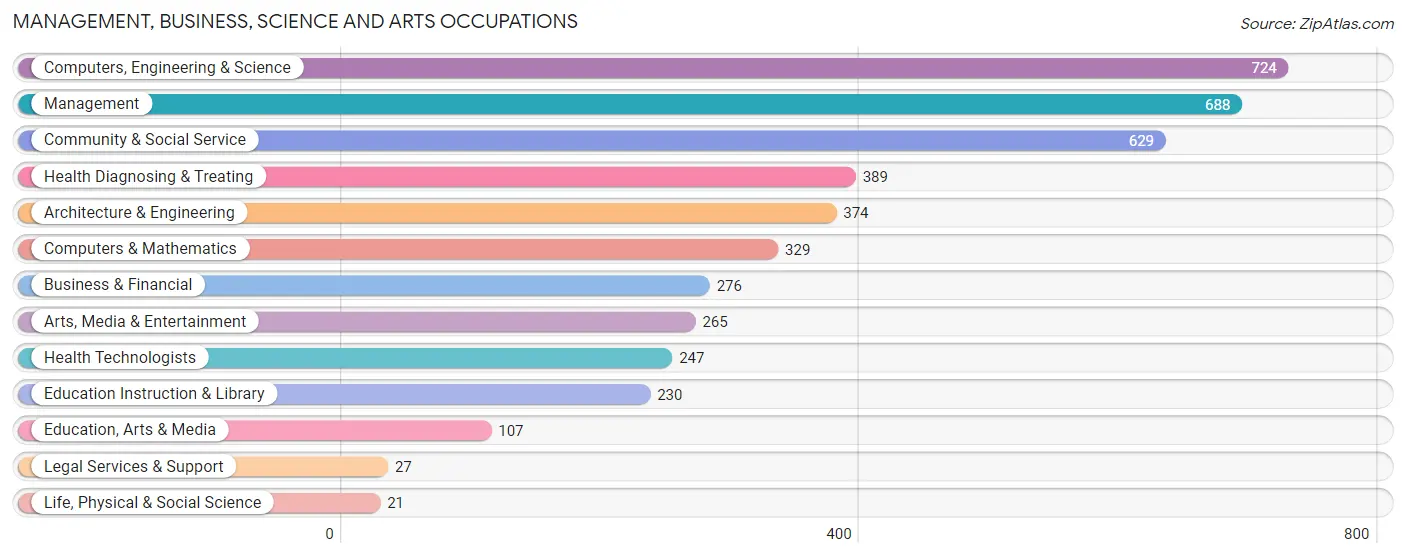
Management, Business, Science and Arts Occupations
The most common Management, Business, Science and Arts occupations in Picnic Point are Computers, Engineering & Science (724 | 13.6%), Management (688 | 13.0%), Community & Social Service (629 | 11.8%), Health Diagnosing & Treating (389 | 7.3%), and Architecture & Engineering (374 | 7.0%).
Management, Business, Science and Arts Occupations by Sex
Within the Management, Business, Science and Arts occupations in Picnic Point, the most male-oriented occupations are Architecture & Engineering (92.8%), Computers, Engineering & Science (88.3%), and Computers & Mathematics (86.0%), while the most female-oriented occupations are Health Technologists (84.2%), Health Diagnosing & Treating (82.3%), and Education Instruction & Library (77.8%).
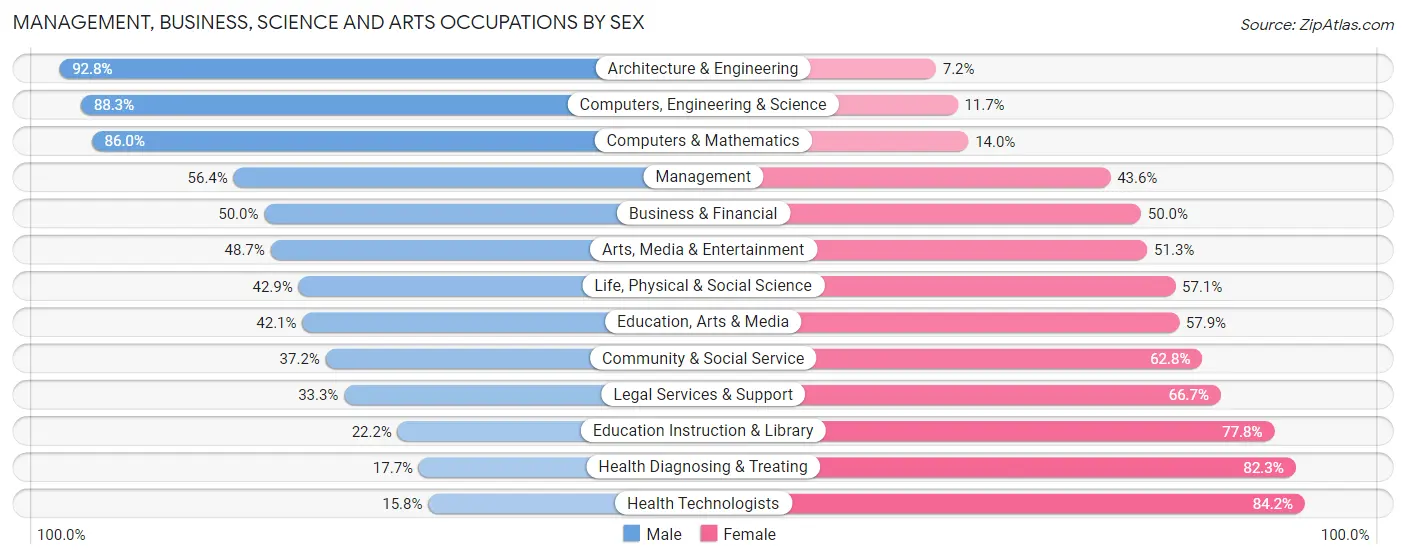
| Occupation | Male | Female |
| Management | 388 (56.4%) | 300 (43.6%) |
| Business & Financial | 138 (50.0%) | 138 (50.0%) |
| Computers, Engineering & Science | 639 (88.3%) | 85 (11.7%) |
| Computers & Mathematics | 283 (86.0%) | 46 (14.0%) |
| Architecture & Engineering | 347 (92.8%) | 27 (7.2%) |
| Life, Physical & Social Science | 9 (42.9%) | 12 (57.1%) |
| Community & Social Service | 234 (37.2%) | 395 (62.8%) |
| Education, Arts & Media | 45 (42.1%) | 62 (57.9%) |
| Legal Services & Support | 9 (33.3%) | 18 (66.7%) |
| Education Instruction & Library | 51 (22.2%) | 179 (77.8%) |
| Arts, Media & Entertainment | 129 (48.7%) | 136 (51.3%) |
| Health Diagnosing & Treating | 69 (17.7%) | 320 (82.3%) |
| Health Technologists | 39 (15.8%) | 208 (84.2%) |
| Total (Category) | 1,468 (54.2%) | 1,238 (45.8%) |
| Total (Overall) | 3,169 (59.7%) | 2,141 (40.3%) |
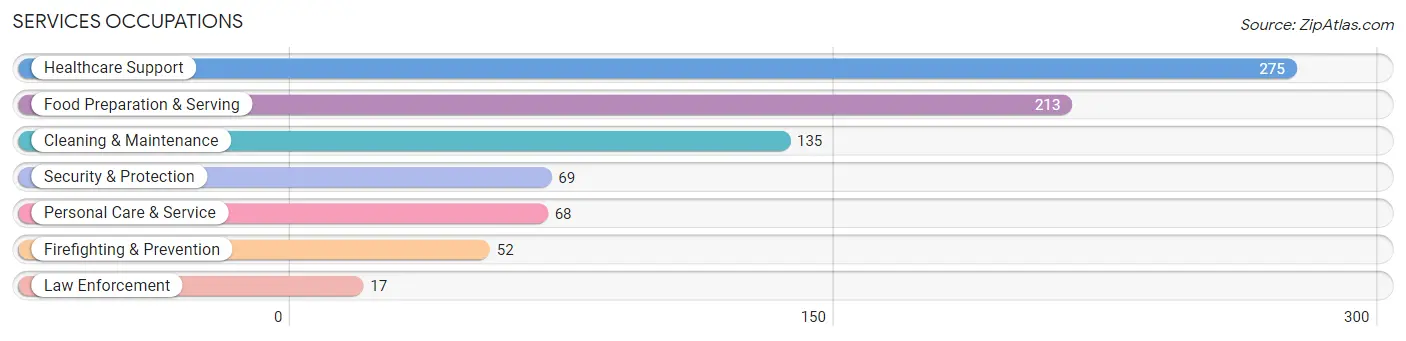
Services Occupations
The most common Services occupations in Picnic Point are Healthcare Support (275 | 5.2%), Food Preparation & Serving (213 | 4.0%), Cleaning & Maintenance (135 | 2.5%), Security & Protection (69 | 1.3%), and Personal Care & Service (68 | 1.3%).
Services Occupations by Sex
Within the Services occupations in Picnic Point, the most male-oriented occupations are Security & Protection (100.0%), Firefighting & Prevention (100.0%), and Law Enforcement (100.0%), while the most female-oriented occupations are Healthcare Support (70.2%), Personal Care & Service (63.2%), and Food Preparation & Serving (42.2%).
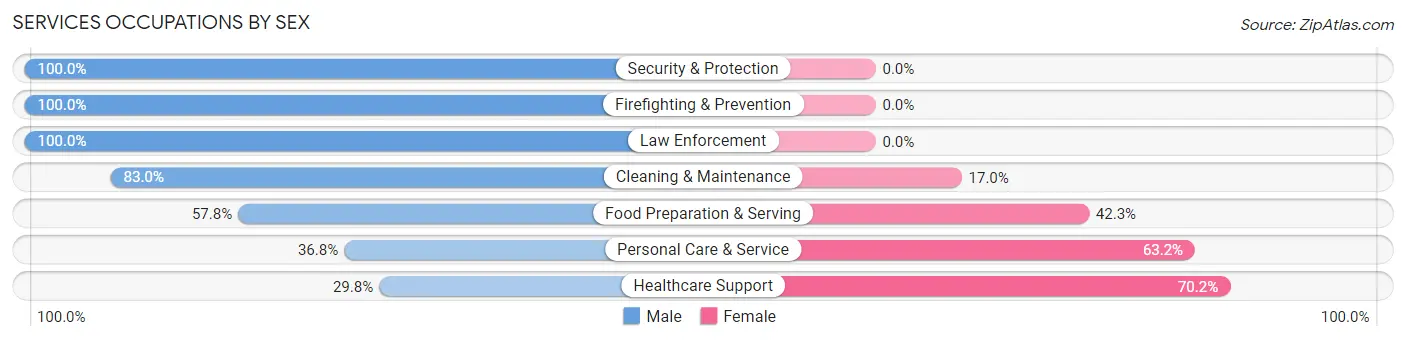
| Occupation | Male | Female |
| Healthcare Support | 82 (29.8%) | 193 (70.2%) |
| Security & Protection | 69 (100.0%) | 0 (0.0%) |
| Firefighting & Prevention | 52 (100.0%) | 0 (0.0%) |
| Law Enforcement | 17 (100.0%) | 0 (0.0%) |
| Food Preparation & Serving | 123 (57.8%) | 90 (42.2%) |
| Cleaning & Maintenance | 112 (83.0%) | 23 (17.0%) |
| Personal Care & Service | 25 (36.8%) | 43 (63.2%) |
| Total (Category) | 411 (54.1%) | 349 (45.9%) |
| Total (Overall) | 3,169 (59.7%) | 2,141 (40.3%) |
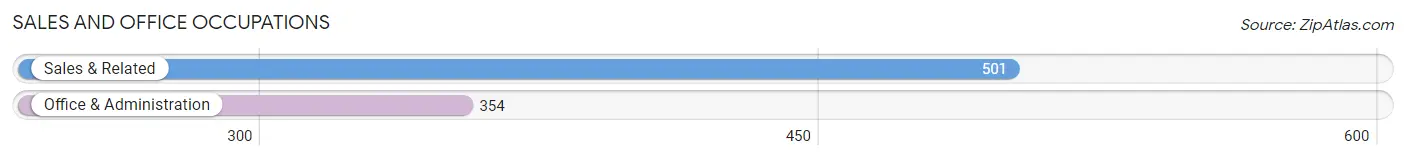
Sales and Office Occupations
The most common Sales and Office occupations in Picnic Point are Sales & Related (501 | 9.4%), and Office & Administration (354 | 6.7%).
Sales and Office Occupations by Sex
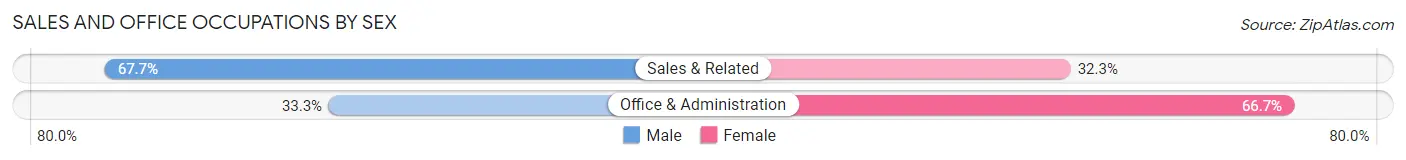
| Occupation | Male | Female |
| Sales & Related | 339 (67.7%) | 162 (32.3%) |
| Office & Administration | 118 (33.3%) | 236 (66.7%) |
| Total (Category) | 457 (53.4%) | 398 (46.6%) |
| Total (Overall) | 3,169 (59.7%) | 2,141 (40.3%) |
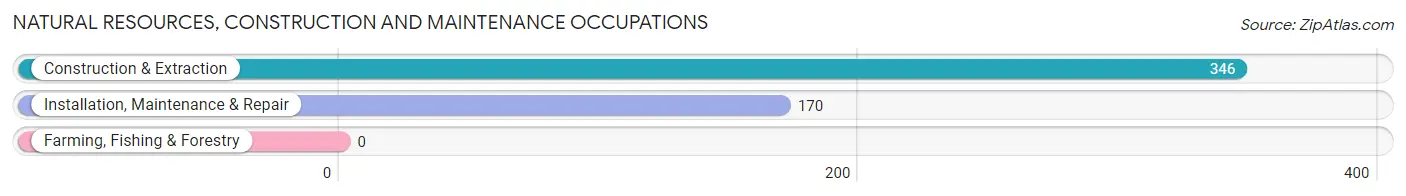
Natural Resources, Construction and Maintenance Occupations
The most common Natural Resources, Construction and Maintenance occupations in Picnic Point are Construction & Extraction (346 | 6.5%), and Installation, Maintenance & Repair (170 | 3.2%).
Natural Resources, Construction and Maintenance Occupations by Sex
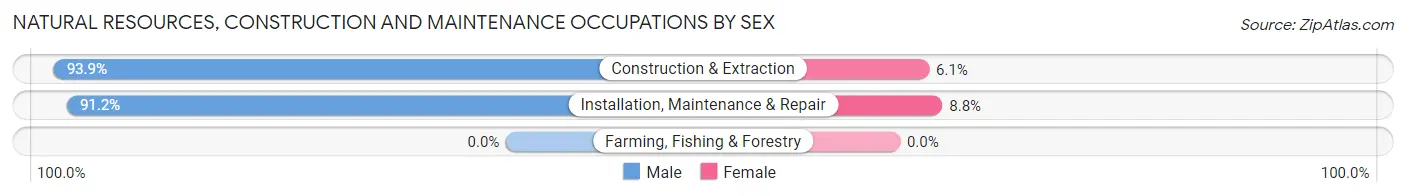
| Occupation | Male | Female |
| Farming, Fishing & Forestry | 0 (0.0%) | 0 (0.0%) |
| Construction & Extraction | 325 (93.9%) | 21 (6.1%) |
| Installation, Maintenance & Repair | 155 (91.2%) | 15 (8.8%) |
| Total (Category) | 480 (93.0%) | 36 (7.0%) |
| Total (Overall) | 3,169 (59.7%) | 2,141 (40.3%) |
Production, Transportation and Moving Occupations
The most common Production, Transportation and Moving occupations in Picnic Point are Material Moving (181 | 3.4%), Transportation (158 | 3.0%), and Production (134 | 2.5%).
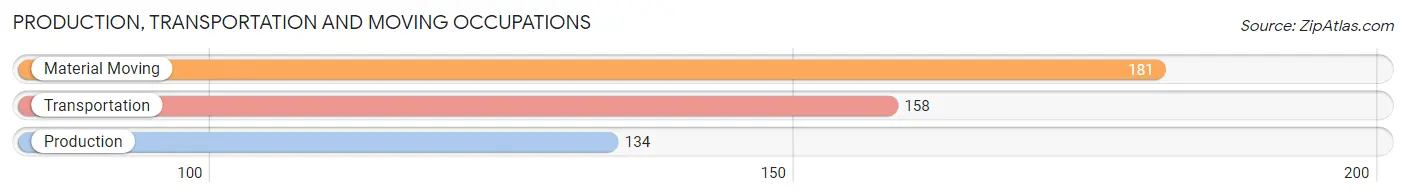
Production, Transportation and Moving Occupations by Sex
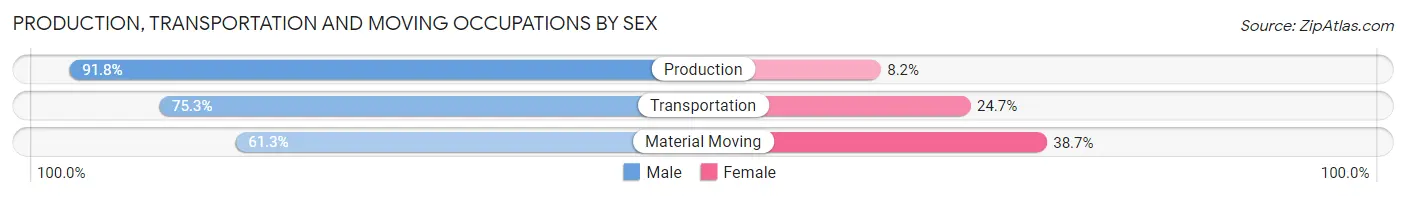
| Occupation | Male | Female |
| Production | 123 (91.8%) | 11 (8.2%) |
| Transportation | 119 (75.3%) | 39 (24.7%) |
| Material Moving | 111 (61.3%) | 70 (38.7%) |
| Total (Category) | 353 (74.6%) | 120 (25.4%) |
| Total (Overall) | 3,169 (59.7%) | 2,141 (40.3%) |
Employment Industries by Sex in Picnic Point
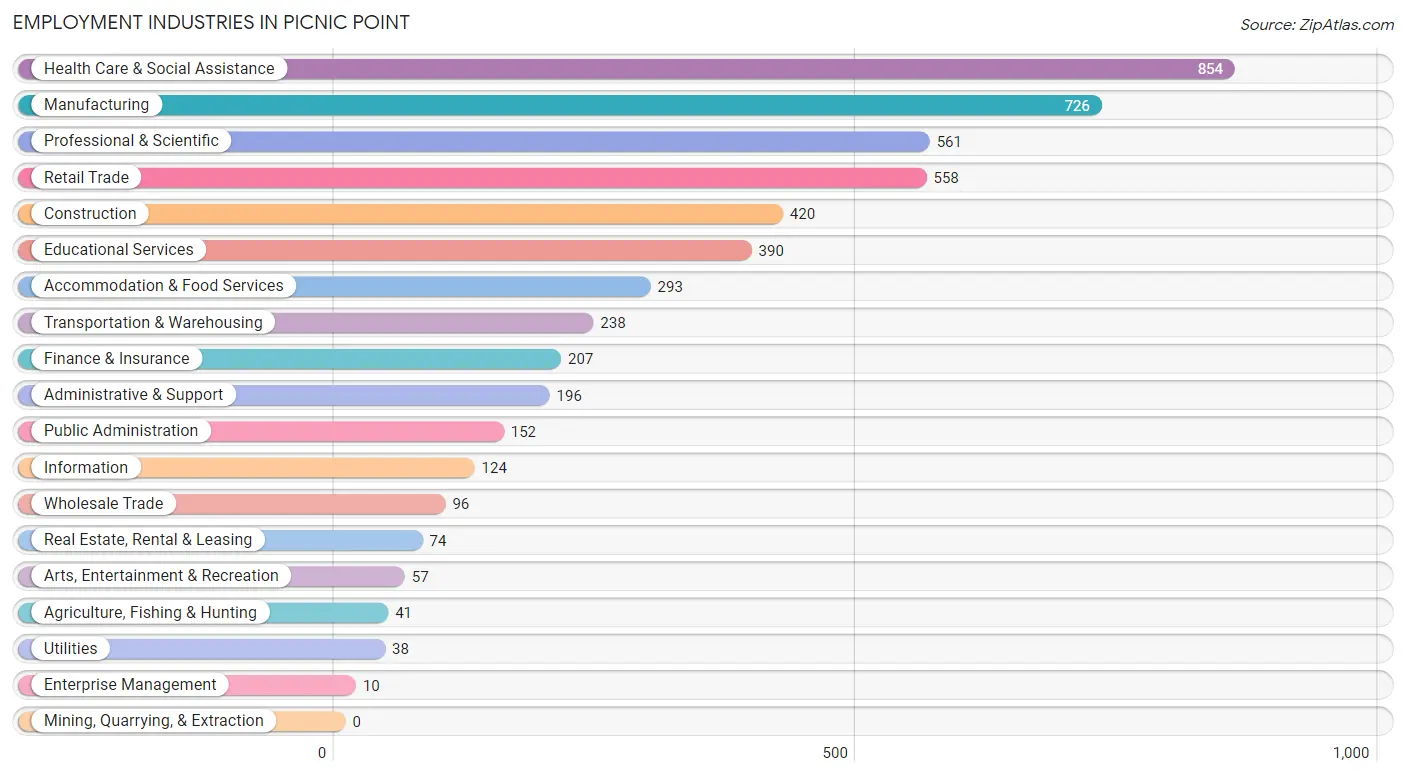
Employment Industries in Picnic Point
The major employment industries in Picnic Point include Health Care & Social Assistance (854 | 16.1%), Manufacturing (726 | 13.7%), Professional & Scientific (561 | 10.6%), Retail Trade (558 | 10.5%), and Construction (420 | 7.9%).
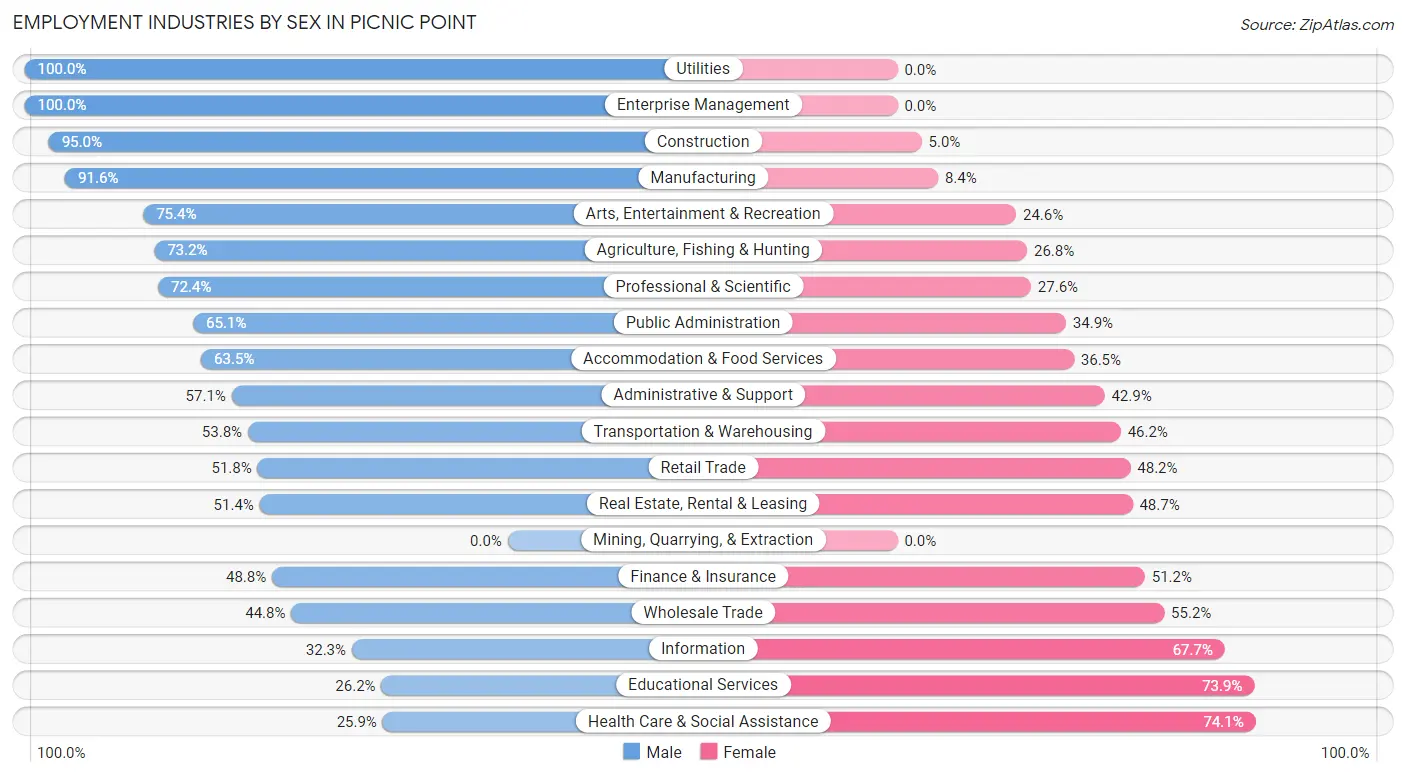
Employment Industries by Sex in Picnic Point
The Picnic Point industries that see more men than women are Utilities (100.0%), Enterprise Management (100.0%), and Construction (95.0%), whereas the industries that tend to have a higher number of women are Health Care & Social Assistance (74.1%), Educational Services (73.9%), and Information (67.7%).
| Industry | Male | Female |
| Agriculture, Fishing & Hunting | 30 (73.2%) | 11 (26.8%) |
| Mining, Quarrying, & Extraction | 0 (0.0%) | 0 (0.0%) |
| Construction | 399 (95.0%) | 21 (5.0%) |
| Manufacturing | 665 (91.6%) | 61 (8.4%) |
| Wholesale Trade | 43 (44.8%) | 53 (55.2%) |
| Retail Trade | 289 (51.8%) | 269 (48.2%) |
| Transportation & Warehousing | 128 (53.8%) | 110 (46.2%) |
| Utilities | 38 (100.0%) | 0 (0.0%) |
| Information | 40 (32.3%) | 84 (67.7%) |
| Finance & Insurance | 101 (48.8%) | 106 (51.2%) |
| Real Estate, Rental & Leasing | 38 (51.3%) | 36 (48.6%) |
| Professional & Scientific | 406 (72.4%) | 155 (27.6%) |
| Enterprise Management | 10 (100.0%) | 0 (0.0%) |
| Administrative & Support | 112 (57.1%) | 84 (42.9%) |
| Educational Services | 102 (26.2%) | 288 (73.9%) |
| Health Care & Social Assistance | 221 (25.9%) | 633 (74.1%) |
| Arts, Entertainment & Recreation | 43 (75.4%) | 14 (24.6%) |
| Accommodation & Food Services | 186 (63.5%) | 107 (36.5%) |
| Public Administration | 99 (65.1%) | 53 (34.9%) |
| Total | 3,169 (59.7%) | 2,141 (40.3%) |
Education in Picnic Point
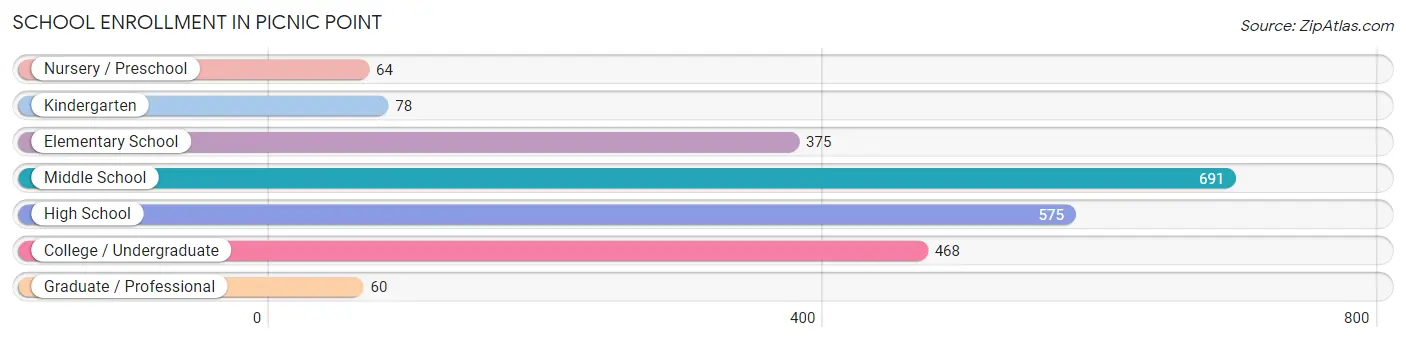
School Enrollment in Picnic Point
The most common levels of schooling among the 2,311 students in Picnic Point are middle school (691 | 29.9%), high school (575 | 24.9%), and college / undergraduate (468 | 20.3%).
| School Level | # Students | % Students |
| Nursery / Preschool | 64 | 2.8% |
| Kindergarten | 78 | 3.4% |
| Elementary School | 375 | 16.2% |
| Middle School | 691 | 29.9% |
| High School | 575 | 24.9% |
| College / Undergraduate | 468 | 20.3% |
| Graduate / Professional | 60 | 2.6% |
| Total | 2,311 | 100.0% |
School Enrollment by Age by Funding Source in Picnic Point
Out of a total of 2,311 students who are enrolled in schools in Picnic Point, 266 (11.5%) attend a private institution, while the remaining 2,045 (88.5%) are enrolled in public schools. The age group of 3 to 4 year olds has the highest likelihood of being enrolled in private schools, with 32 (56.1% in the age bracket) enrolled. Conversely, the age group of 35 years and over has the lowest likelihood of being enrolled in a private school, with 199 (96.1% in the age bracket) attending a public institution.
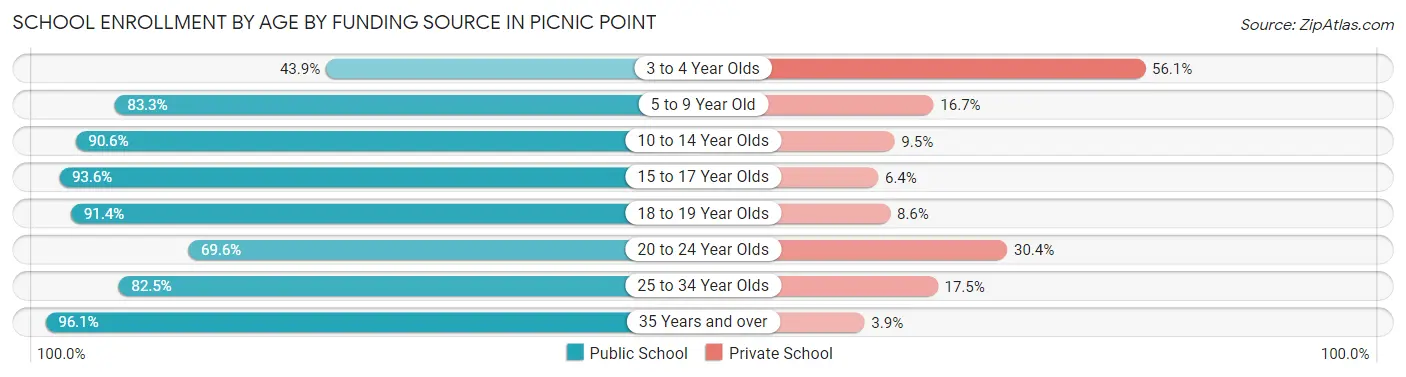
| Age Bracket | Public School | Private School |
| 3 to 4 Year Olds | 25 (43.9%) | 32 (56.1%) |
| 5 to 9 Year Old | 299 (83.3%) | 60 (16.7%) |
| 10 to 14 Year Olds | 738 (90.5%) | 77 (9.5%) |
| 15 to 17 Year Olds | 380 (93.6%) | 26 (6.4%) |
| 18 to 19 Year Olds | 254 (91.4%) | 24 (8.6%) |
| 20 to 24 Year Olds | 32 (69.6%) | 14 (30.4%) |
| 25 to 34 Year Olds | 118 (82.5%) | 25 (17.5%) |
| 35 Years and over | 199 (96.1%) | 8 (3.9%) |
| Total | 2,045 (88.5%) | 266 (11.5%) |
Educational Attainment by Field of Study in Picnic Point
Engineering (454 | 15.7%), business (437 | 15.1%), science & technology (306 | 10.6%), visual & performing arts (204 | 7.1%), and social sciences (202 | 7.0%) are the most common fields of study among 2,890 individuals in Picnic Point who have obtained a bachelor's degree or higher.
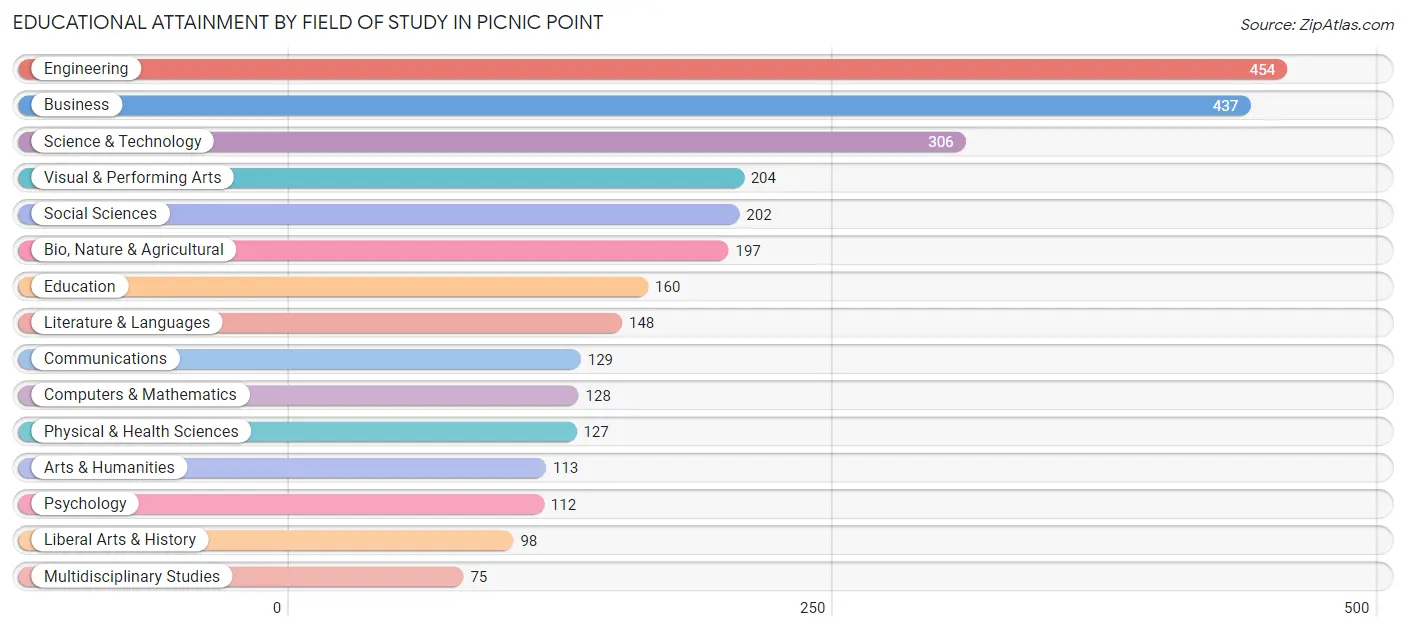
| Field of Study | # Graduates | % Graduates |
| Computers & Mathematics | 128 | 4.4% |
| Bio, Nature & Agricultural | 197 | 6.8% |
| Physical & Health Sciences | 127 | 4.4% |
| Psychology | 112 | 3.9% |
| Social Sciences | 202 | 7.0% |
| Engineering | 454 | 15.7% |
| Multidisciplinary Studies | 75 | 2.6% |
| Science & Technology | 306 | 10.6% |
| Business | 437 | 15.1% |
| Education | 160 | 5.5% |
| Literature & Languages | 148 | 5.1% |
| Liberal Arts & History | 98 | 3.4% |
| Visual & Performing Arts | 204 | 7.1% |
| Communications | 129 | 4.5% |
| Arts & Humanities | 113 | 3.9% |
| Total | 2,890 | 100.0% |
Transportation & Commute in Picnic Point
Vehicle Availability by Sex in Picnic Point
The most prevalent vehicle ownership categories in Picnic Point are males with 2 vehicles (1,345, accounting for 43.5%) and females with 2 vehicles (841, making up 65.6%).
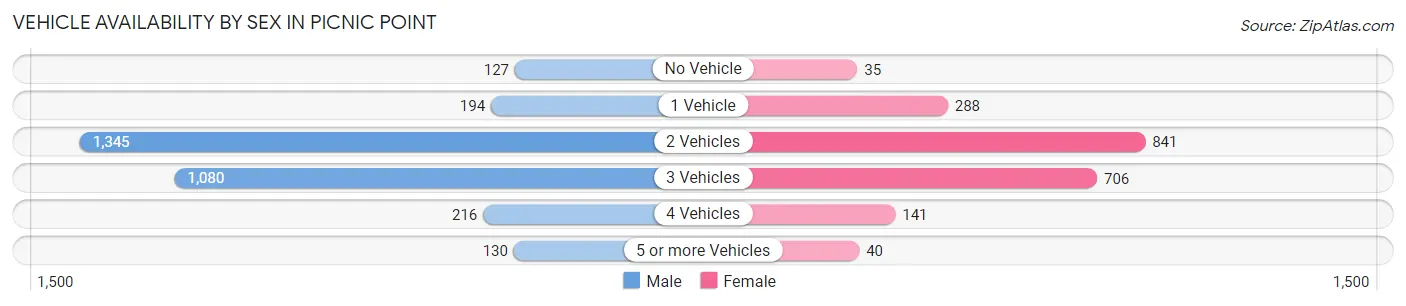
| Vehicles Available | Male | Female |
| No Vehicle | 127 (4.1%) | 35 (1.7%) |
| 1 Vehicle | 194 (6.3%) | 288 (14.0%) |
| 2 Vehicles | 1,345 (43.5%) | 841 (41.0%) |
| 3 Vehicles | 1,080 (34.9%) | 706 (34.4%) |
| 4 Vehicles | 216 (7.0%) | 141 (6.9%) |
| 5 or more Vehicles | 130 (4.2%) | 40 (1.9%) |
| Total | 3,092 (100.0%) | 2,051 (100.0%) |
Commute Time in Picnic Point
The most frequently occuring commute durations in Picnic Point are 30 to 34 minutes (811 commuters, 19.5%), 20 to 24 minutes (713 commuters, 17.1%), and 15 to 19 minutes (577 commuters, 13.9%).
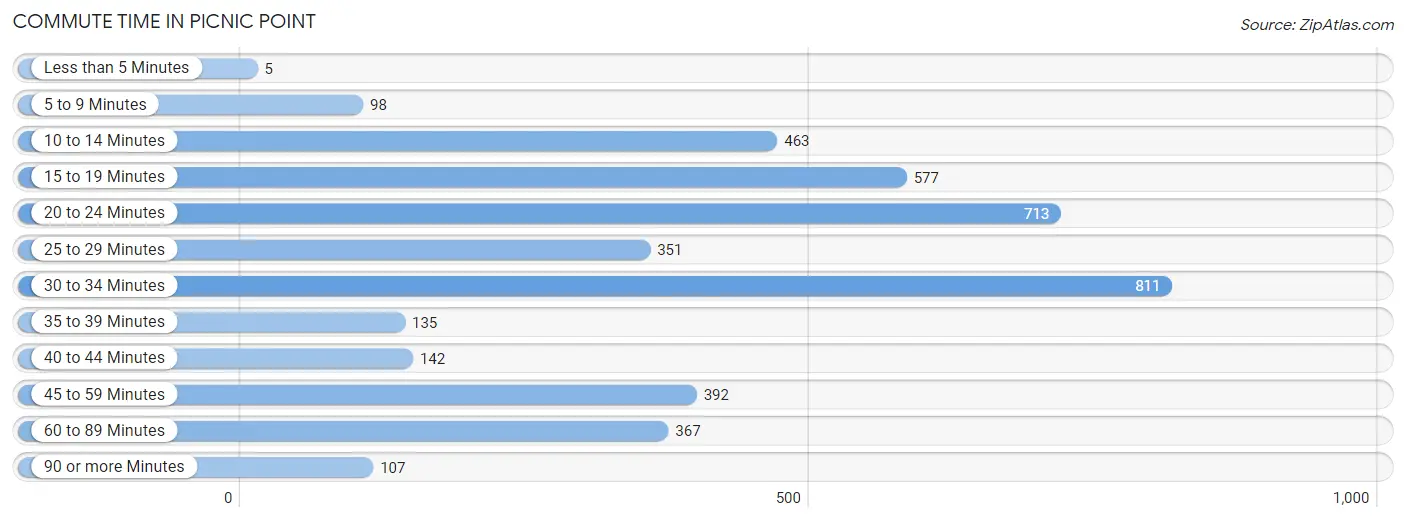
| Commute Time | # Commuters | % Commuters |
| Less than 5 Minutes | 5 | 0.1% |
| 5 to 9 Minutes | 98 | 2.4% |
| 10 to 14 Minutes | 463 | 11.1% |
| 15 to 19 Minutes | 577 | 13.9% |
| 20 to 24 Minutes | 713 | 17.1% |
| 25 to 29 Minutes | 351 | 8.4% |
| 30 to 34 Minutes | 811 | 19.5% |
| 35 to 39 Minutes | 135 | 3.2% |
| 40 to 44 Minutes | 142 | 3.4% |
| 45 to 59 Minutes | 392 | 9.4% |
| 60 to 89 Minutes | 367 | 8.8% |
| 90 or more Minutes | 107 | 2.6% |
Commute Time by Sex in Picnic Point
The most common commute times in Picnic Point are 30 to 34 minutes (475 commuters, 18.3%) for males and 20 to 24 minutes (387 commuters, 24.7%) for females.
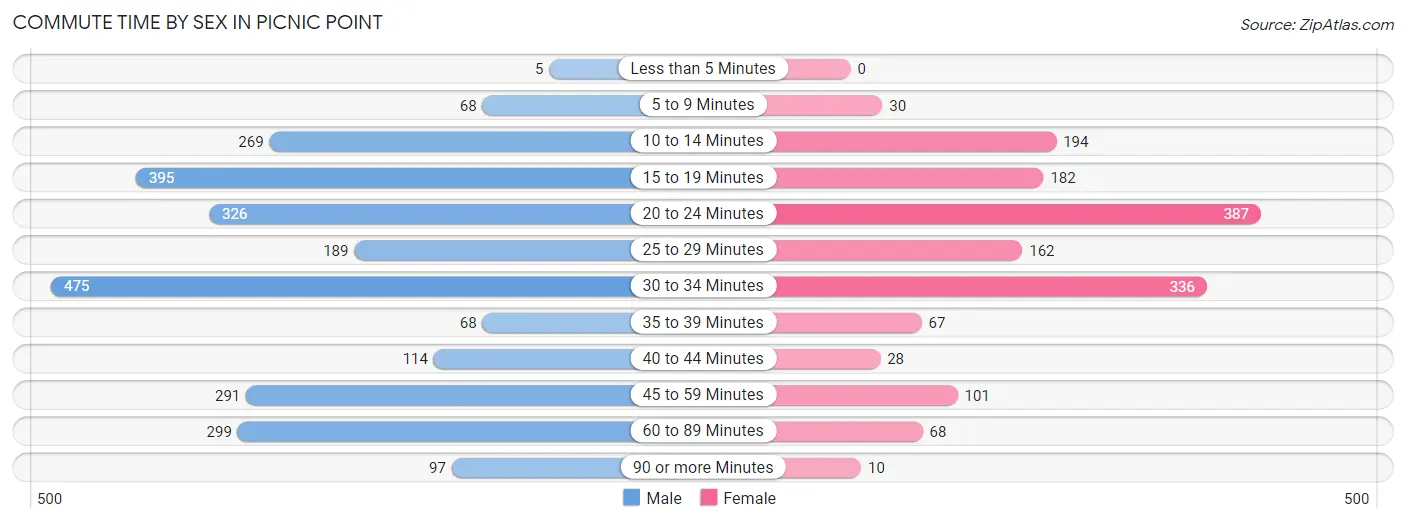
| Commute Time | Male | Female |
| Less than 5 Minutes | 5 (0.2%) | 0 (0.0%) |
| 5 to 9 Minutes | 68 (2.6%) | 30 (1.9%) |
| 10 to 14 Minutes | 269 (10.4%) | 194 (12.4%) |
| 15 to 19 Minutes | 395 (15.2%) | 182 (11.6%) |
| 20 to 24 Minutes | 326 (12.6%) | 387 (24.7%) |
| 25 to 29 Minutes | 189 (7.3%) | 162 (10.3%) |
| 30 to 34 Minutes | 475 (18.3%) | 336 (21.5%) |
| 35 to 39 Minutes | 68 (2.6%) | 67 (4.3%) |
| 40 to 44 Minutes | 114 (4.4%) | 28 (1.8%) |
| 45 to 59 Minutes | 291 (11.2%) | 101 (6.5%) |
| 60 to 89 Minutes | 299 (11.5%) | 68 (4.3%) |
| 90 or more Minutes | 97 (3.7%) | 10 (0.6%) |
Time of Departure to Work by Sex in Picnic Point
The most frequent times of departure to work in Picnic Point are 6:00 AM to 6:29 AM (487, 18.8%) for males and 12:00 PM to 3:59 PM (188, 12.0%) for females.
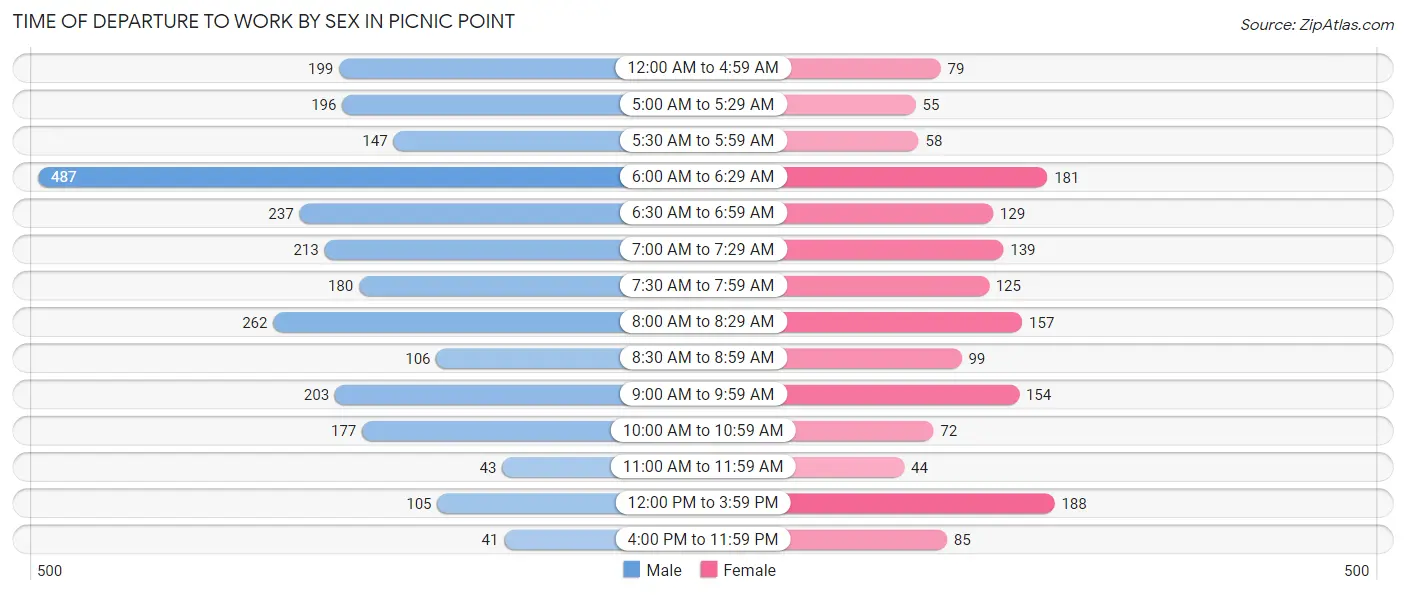
| Time of Departure | Male | Female |
| 12:00 AM to 4:59 AM | 199 (7.7%) | 79 (5.1%) |
| 5:00 AM to 5:29 AM | 196 (7.5%) | 55 (3.5%) |
| 5:30 AM to 5:59 AM | 147 (5.7%) | 58 (3.7%) |
| 6:00 AM to 6:29 AM | 487 (18.8%) | 181 (11.6%) |
| 6:30 AM to 6:59 AM | 237 (9.1%) | 129 (8.2%) |
| 7:00 AM to 7:29 AM | 213 (8.2%) | 139 (8.9%) |
| 7:30 AM to 7:59 AM | 180 (6.9%) | 125 (8.0%) |
| 8:00 AM to 8:29 AM | 262 (10.1%) | 157 (10.0%) |
| 8:30 AM to 8:59 AM | 106 (4.1%) | 99 (6.3%) |
| 9:00 AM to 9:59 AM | 203 (7.8%) | 154 (9.8%) |
| 10:00 AM to 10:59 AM | 177 (6.8%) | 72 (4.6%) |
| 11:00 AM to 11:59 AM | 43 (1.7%) | 44 (2.8%) |
| 12:00 PM to 3:59 PM | 105 (4.0%) | 188 (12.0%) |
| 4:00 PM to 11:59 PM | 41 (1.6%) | 85 (5.4%) |
| Total | 2,596 (100.0%) | 1,565 (100.0%) |
Housing Occupancy in Picnic Point
Occupancy by Ownership in Picnic Point
Of the total 3,656 dwellings in Picnic Point, owner-occupied units account for 3,005 (82.2%), while renter-occupied units make up 651 (17.8%).
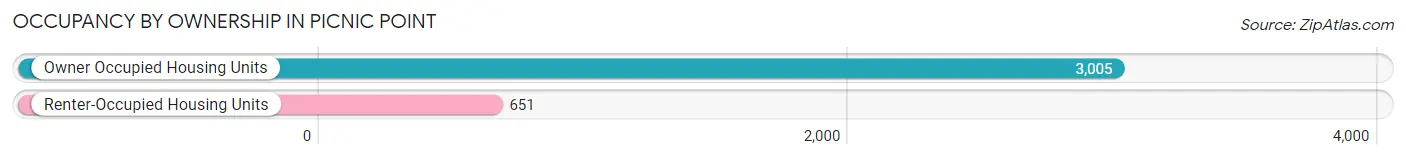
| Occupancy | # Housing Units | % Housing Units |
| Owner Occupied Housing Units | 3,005 | 82.2% |
| Renter-Occupied Housing Units | 651 | 17.8% |
| Total Occupied Housing Units | 3,656 | 100.0% |
Occupancy by Household Size in Picnic Point
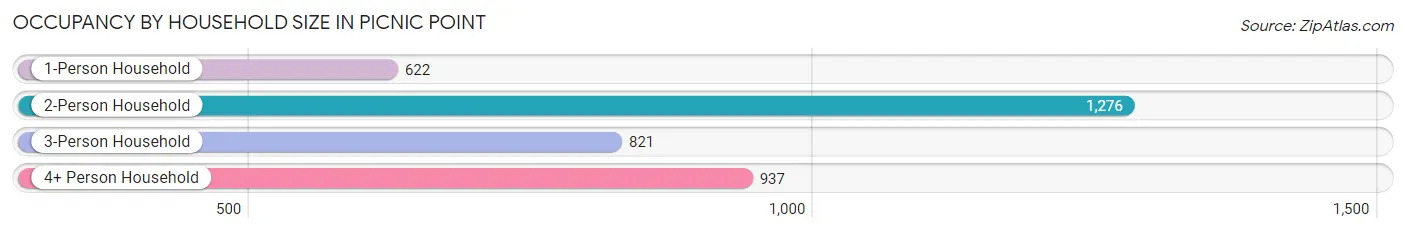
| Household Size | # Housing Units | % Housing Units |
| 1-Person Household | 622 | 17.0% |
| 2-Person Household | 1,276 | 34.9% |
| 3-Person Household | 821 | 22.5% |
| 4+ Person Household | 937 | 25.6% |
| Total Housing Units | 3,656 | 100.0% |
Occupancy by Ownership by Household Size in Picnic Point
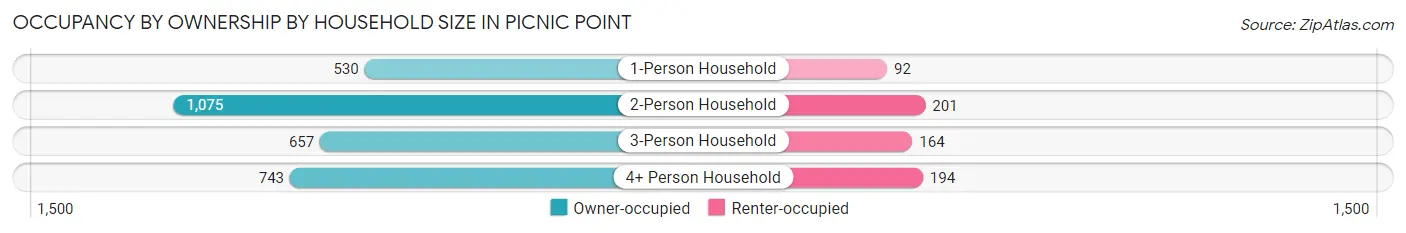
| Household Size | Owner-occupied | Renter-occupied |
| 1-Person Household | 530 (85.2%) | 92 (14.8%) |
| 2-Person Household | 1,075 (84.3%) | 201 (15.8%) |
| 3-Person Household | 657 (80.0%) | 164 (20.0%) |
| 4+ Person Household | 743 (79.3%) | 194 (20.7%) |
| Total Housing Units | 3,005 (82.2%) | 651 (17.8%) |
Occupancy by Educational Attainment in Picnic Point
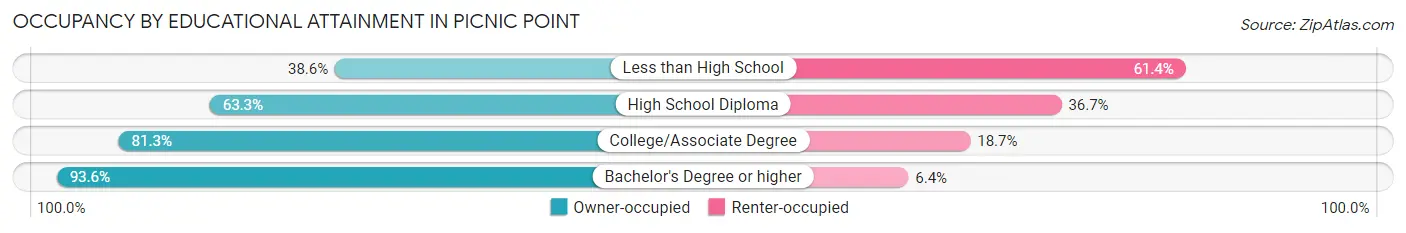
| Household Size | Owner-occupied | Renter-occupied |
| Less than High School | 51 (38.6%) | 81 (61.4%) |
| High School Diploma | 360 (63.3%) | 209 (36.7%) |
| College/Associate Degree | 1,142 (81.3%) | 262 (18.7%) |
| Bachelor's Degree or higher | 1,452 (93.6%) | 99 (6.4%) |
Occupancy by Age of Householder in Picnic Point
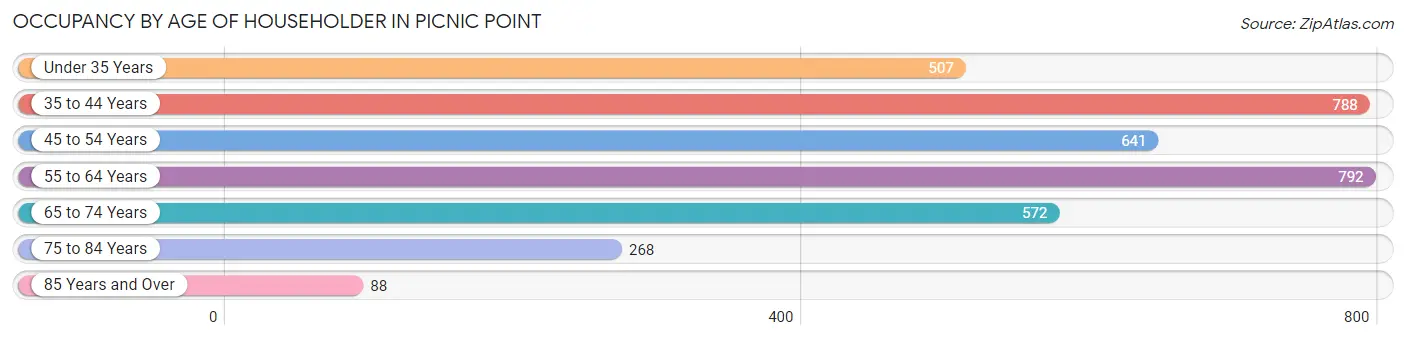
| Age Bracket | # Households | % Households |
| Under 35 Years | 507 | 13.9% |
| 35 to 44 Years | 788 | 21.5% |
| 45 to 54 Years | 641 | 17.5% |
| 55 to 64 Years | 792 | 21.7% |
| 65 to 74 Years | 572 | 15.7% |
| 75 to 84 Years | 268 | 7.3% |
| 85 Years and Over | 88 | 2.4% |
| Total | 3,656 | 100.0% |
Housing Finances in Picnic Point
Median Income by Occupancy in Picnic Point
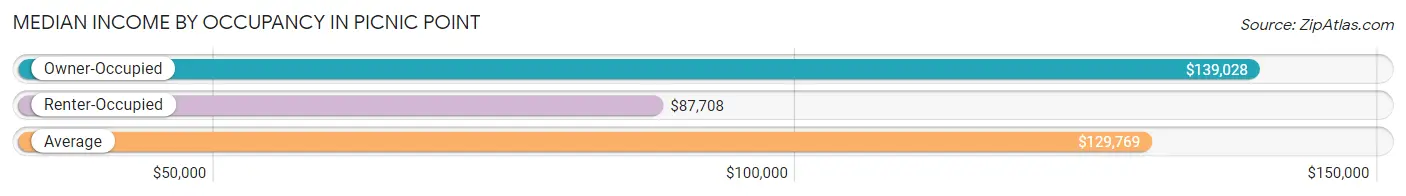
| Occupancy Type | # Households | Median Income |
| Owner-Occupied | 3,005 (82.2%) | $139,028 |
| Renter-Occupied | 651 (17.8%) | $87,708 |
| Average | 3,656 (100.0%) | $129,769 |
Occupancy by Householder Income Bracket in Picnic Point
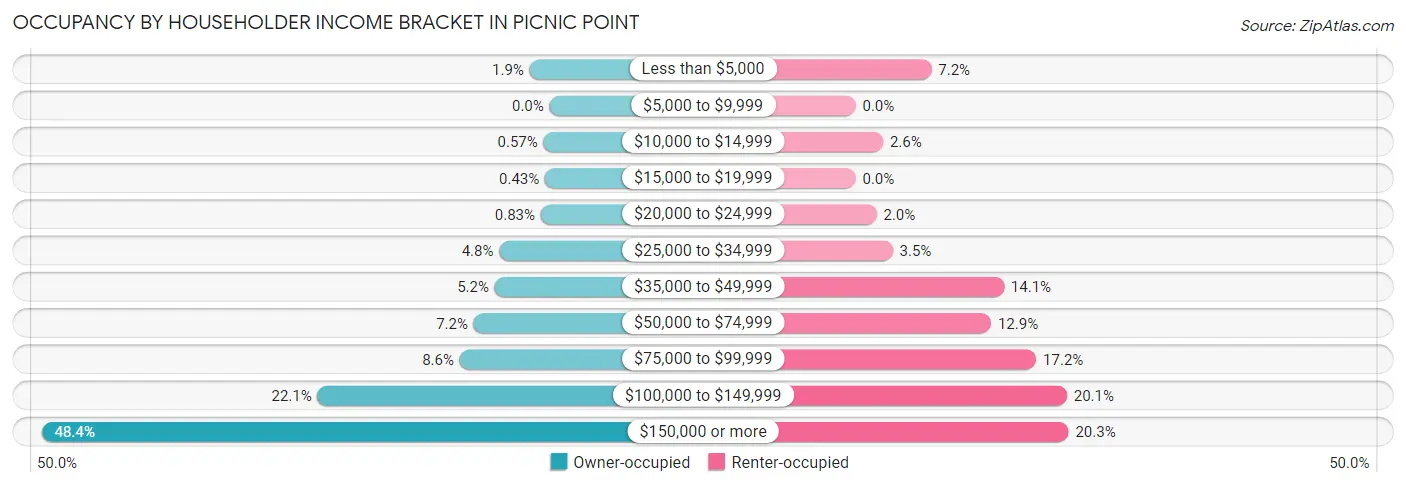
| Income Bracket | Owner-occupied | Renter-occupied |
| Less than $5,000 | 57 (1.9%) | 47 (7.2%) |
| $5,000 to $9,999 | 0 (0.0%) | 0 (0.0%) |
| $10,000 to $14,999 | 17 (0.6%) | 17 (2.6%) |
| $15,000 to $19,999 | 13 (0.4%) | 0 (0.0%) |
| $20,000 to $24,999 | 25 (0.8%) | 13 (2.0%) |
| $25,000 to $34,999 | 144 (4.8%) | 23 (3.5%) |
| $35,000 to $49,999 | 157 (5.2%) | 92 (14.1%) |
| $50,000 to $74,999 | 217 (7.2%) | 84 (12.9%) |
| $75,000 to $99,999 | 257 (8.6%) | 112 (17.2%) |
| $100,000 to $149,999 | 664 (22.1%) | 131 (20.1%) |
| $150,000 or more | 1,454 (48.4%) | 132 (20.3%) |
| Total | 3,005 (100.0%) | 651 (100.0%) |
Monthly Housing Cost Tiers in Picnic Point
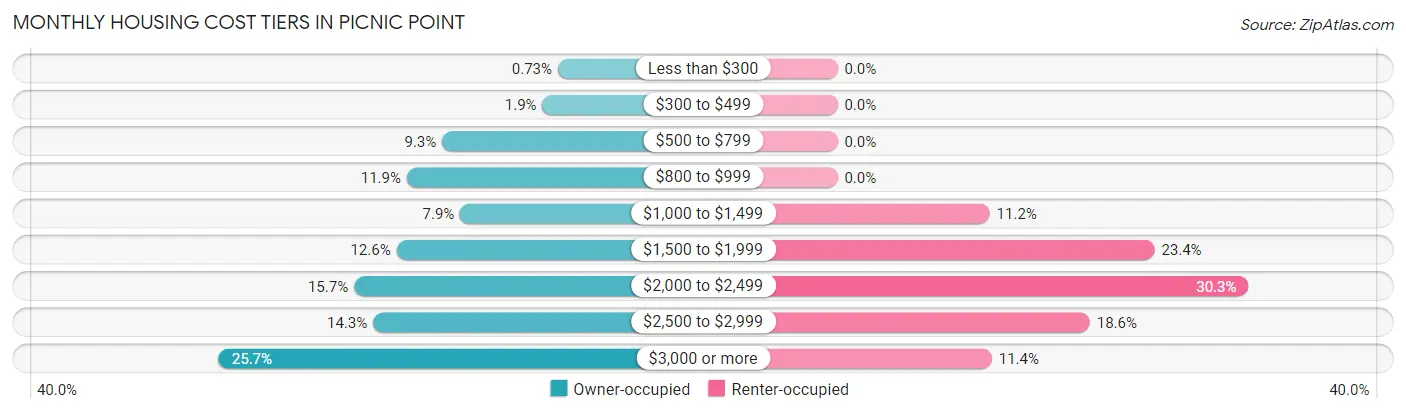
| Monthly Cost | Owner-occupied | Renter-occupied |
| Less than $300 | 22 (0.7%) | 0 (0.0%) |
| $300 to $499 | 56 (1.9%) | 0 (0.0%) |
| $500 to $799 | 278 (9.2%) | 0 (0.0%) |
| $800 to $999 | 356 (11.8%) | 0 (0.0%) |
| $1,000 to $1,499 | 238 (7.9%) | 73 (11.2%) |
| $1,500 to $1,999 | 379 (12.6%) | 152 (23.4%) |
| $2,000 to $2,499 | 473 (15.7%) | 197 (30.3%) |
| $2,500 to $2,999 | 431 (14.3%) | 121 (18.6%) |
| $3,000 or more | 772 (25.7%) | 74 (11.4%) |
| Total | 3,005 (100.0%) | 651 (100.0%) |
Physical Housing Characteristics in Picnic Point
Housing Structures in Picnic Point
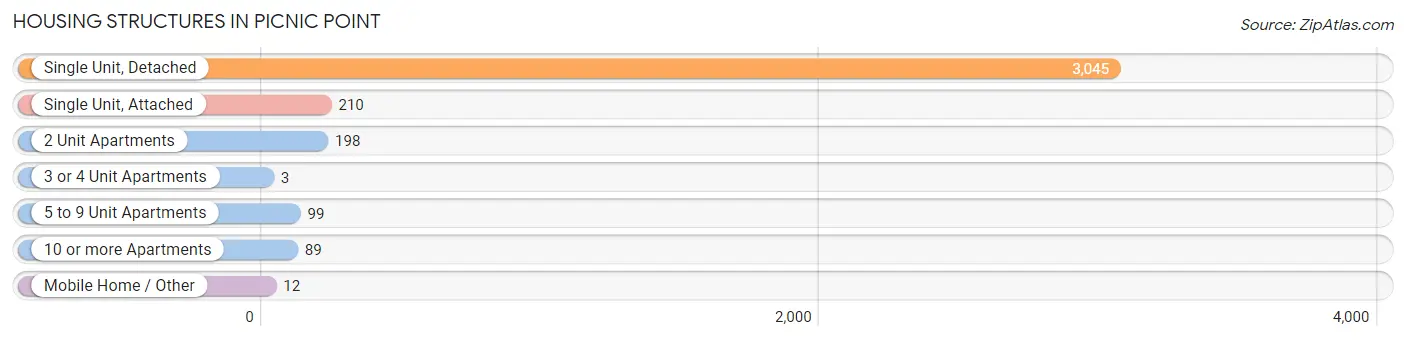
| Structure Type | # Housing Units | % Housing Units |
| Single Unit, Detached | 3,045 | 83.3% |
| Single Unit, Attached | 210 | 5.7% |
| 2 Unit Apartments | 198 | 5.4% |
| 3 or 4 Unit Apartments | 3 | 0.1% |
| 5 to 9 Unit Apartments | 99 | 2.7% |
| 10 or more Apartments | 89 | 2.4% |
| Mobile Home / Other | 12 | 0.3% |
| Total | 3,656 | 100.0% |
Housing Structures by Occupancy in Picnic Point
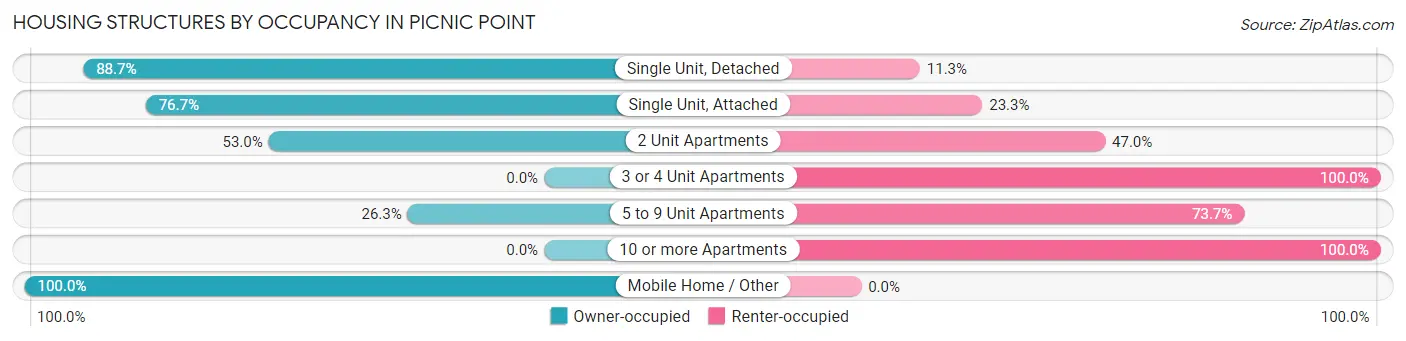
| Structure Type | Owner-occupied | Renter-occupied |
| Single Unit, Detached | 2,701 (88.7%) | 344 (11.3%) |
| Single Unit, Attached | 161 (76.7%) | 49 (23.3%) |
| 2 Unit Apartments | 105 (53.0%) | 93 (47.0%) |
| 3 or 4 Unit Apartments | 0 (0.0%) | 3 (100.0%) |
| 5 to 9 Unit Apartments | 26 (26.3%) | 73 (73.7%) |
| 10 or more Apartments | 0 (0.0%) | 89 (100.0%) |
| Mobile Home / Other | 12 (100.0%) | 0 (0.0%) |
| Total | 3,005 (82.2%) | 651 (17.8%) |
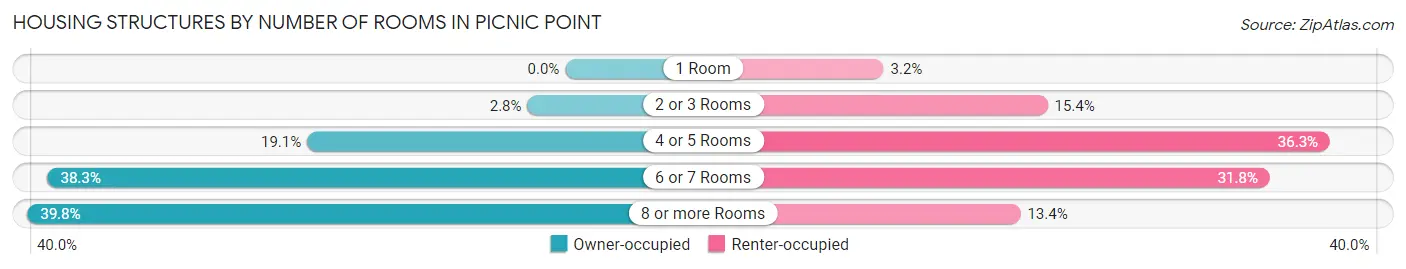
Housing Structures by Number of Rooms in Picnic Point
| Number of Rooms | Owner-occupied | Renter-occupied |
| 1 Room | 0 (0.0%) | 21 (3.2%) |
| 2 or 3 Rooms | 84 (2.8%) | 100 (15.4%) |
| 4 or 5 Rooms | 574 (19.1%) | 236 (36.2%) |
| 6 or 7 Rooms | 1,151 (38.3%) | 207 (31.8%) |
| 8 or more Rooms | 1,196 (39.8%) | 87 (13.4%) |
| Total | 3,005 (100.0%) | 651 (100.0%) |
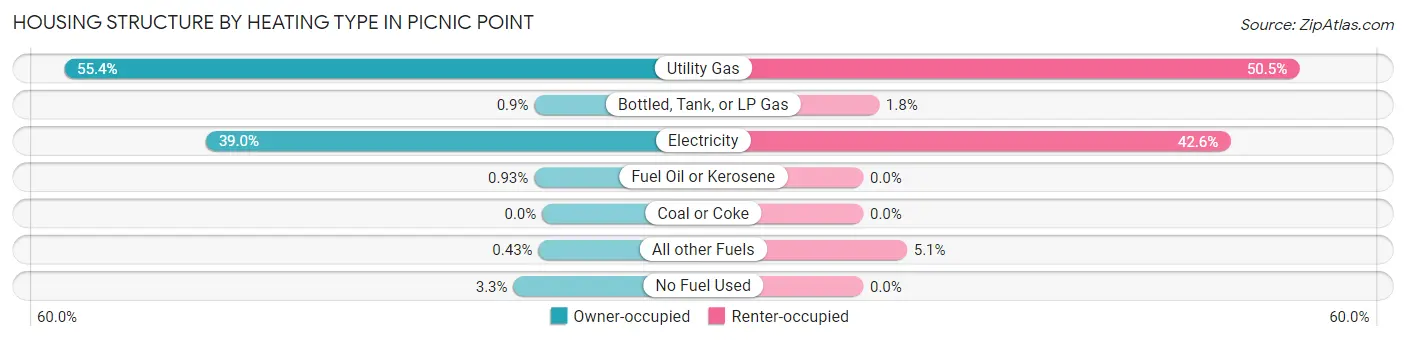
Housing Structure by Heating Type in Picnic Point
| Heating Type | Owner-occupied | Renter-occupied |
| Utility Gas | 1,665 (55.4%) | 329 (50.5%) |
| Bottled, Tank, or LP Gas | 27 (0.9%) | 12 (1.8%) |
| Electricity | 1,172 (39.0%) | 277 (42.5%) |
| Fuel Oil or Kerosene | 28 (0.9%) | 0 (0.0%) |
| Coal or Coke | 0 (0.0%) | 0 (0.0%) |
| All other Fuels | 13 (0.4%) | 33 (5.1%) |
| No Fuel Used | 100 (3.3%) | 0 (0.0%) |
| Total | 3,005 (100.0%) | 651 (100.0%) |
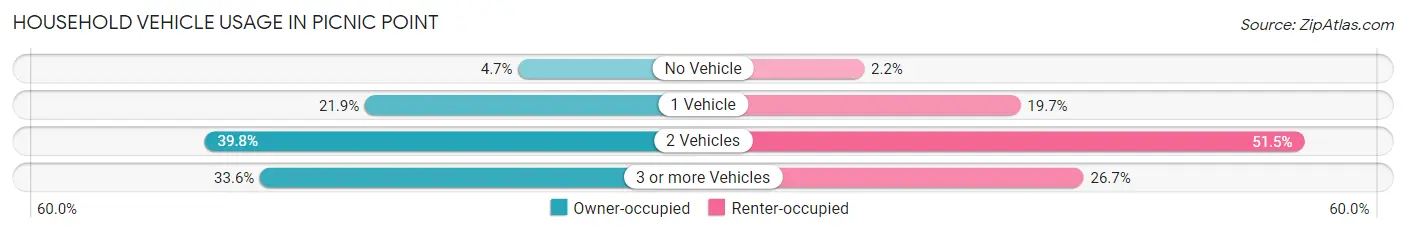
Household Vehicle Usage in Picnic Point
| Vehicles per Household | Owner-occupied | Renter-occupied |
| No Vehicle | 141 (4.7%) | 14 (2.1%) |
| 1 Vehicle | 657 (21.9%) | 128 (19.7%) |
| 2 Vehicles | 1,197 (39.8%) | 335 (51.5%) |
| 3 or more Vehicles | 1,010 (33.6%) | 174 (26.7%) |
| Total | 3,005 (100.0%) | 651 (100.0%) |
Real Estate & Mortgages in Picnic Point
Real Estate and Mortgage Overview in Picnic Point
| Characteristic | Without Mortgage | With Mortgage |
| Housing Units | 910 | 2,095 |
| Median Property Value | $614,100 | $679,400 |
| Median Household Income | $92,371 | $1,214 |
| Monthly Housing Costs | $843 | $769 |
| Real Estate Taxes | $5,334 | $94 |
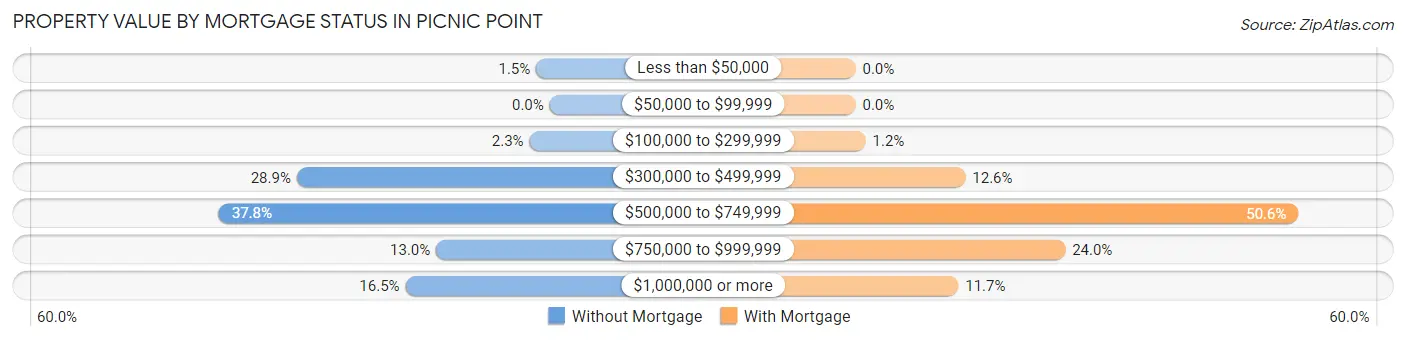
Property Value by Mortgage Status in Picnic Point
| Property Value | Without Mortgage | With Mortgage |
| Less than $50,000 | 14 (1.5%) | 0 (0.0%) |
| $50,000 to $99,999 | 0 (0.0%) | 0 (0.0%) |
| $100,000 to $299,999 | 21 (2.3%) | 24 (1.1%) |
| $300,000 to $499,999 | 263 (28.9%) | 263 (12.6%) |
| $500,000 to $749,999 | 344 (37.8%) | 1,060 (50.6%) |
| $750,000 to $999,999 | 118 (13.0%) | 502 (24.0%) |
| $1,000,000 or more | 150 (16.5%) | 246 (11.7%) |
| Total | 910 (100.0%) | 2,095 (100.0%) |
Household Income by Mortgage Status in Picnic Point
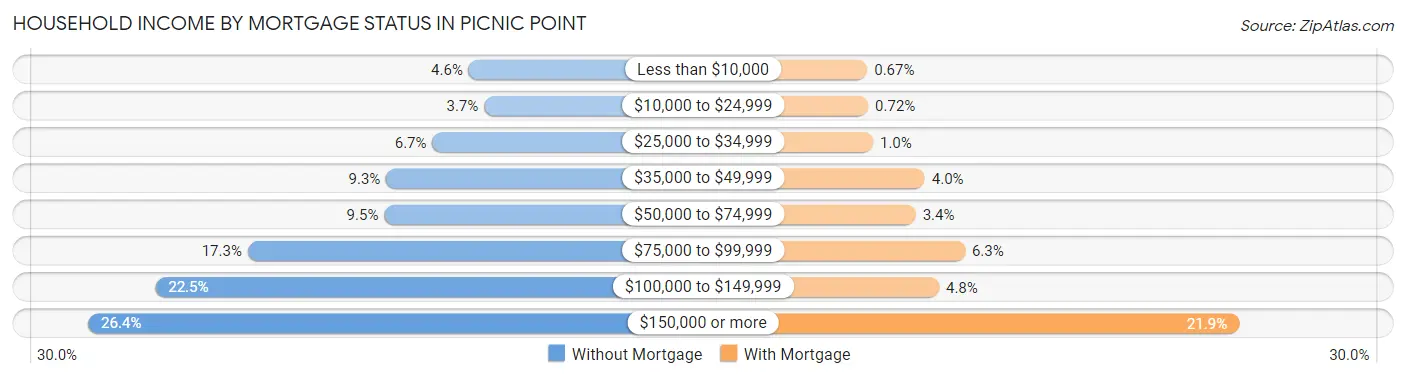
| Household Income | Without Mortgage | With Mortgage |
| Less than $10,000 | 42 (4.6%) | 14 (0.7%) |
| $10,000 to $24,999 | 34 (3.7%) | 15 (0.7%) |
| $25,000 to $34,999 | 61 (6.7%) | 21 (1.0%) |
| $35,000 to $49,999 | 85 (9.3%) | 83 (4.0%) |
| $50,000 to $74,999 | 86 (9.5%) | 72 (3.4%) |
| $75,000 to $99,999 | 157 (17.2%) | 131 (6.2%) |
| $100,000 to $149,999 | 205 (22.5%) | 100 (4.8%) |
| $150,000 or more | 240 (26.4%) | 459 (21.9%) |
| Total | 910 (100.0%) | 2,095 (100.0%) |
Property Value to Household Income Ratio in Picnic Point
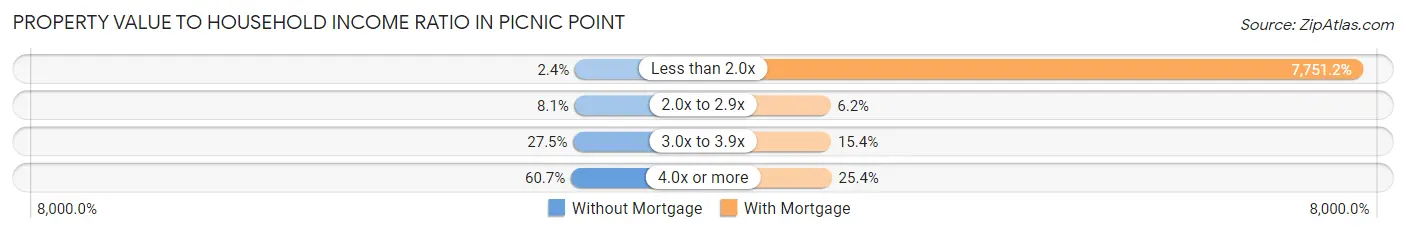
| Value-to-Income Ratio | Without Mortgage | With Mortgage |
| Less than 2.0x | 22 (2.4%) | 162,388 (7,751.2%) |
| 2.0x to 2.9x | 74 (8.1%) | 129 (6.2%) |
| 3.0x to 3.9x | 250 (27.5%) | 323 (15.4%) |
| 4.0x or more | 552 (60.7%) | 531 (25.4%) |
| Total | 910 (100.0%) | 2,095 (100.0%) |
Real Estate Taxes by Mortgage Status in Picnic Point
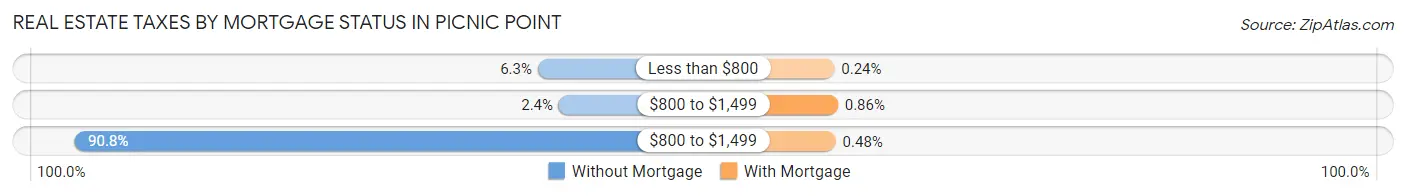
| Property Taxes | Without Mortgage | With Mortgage |
| Less than $800 | 57 (6.3%) | 5 (0.2%) |
| $800 to $1,499 | 22 (2.4%) | 18 (0.9%) |
| $800 to $1,499 | 826 (90.8%) | 10 (0.5%) |
| Total | 910 (100.0%) | 2,095 (100.0%) |
Health & Disability in Picnic Point
Health Insurance Coverage by Age in Picnic Point
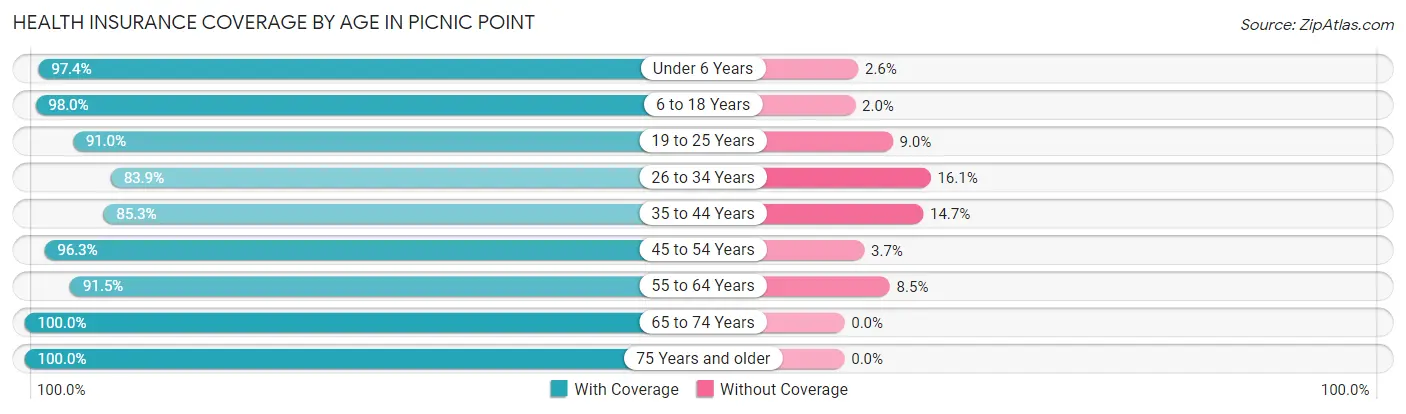
| Age Bracket | With Coverage | Without Coverage |
| Under 6 Years | 419 (97.4%) | 11 (2.6%) |
| 6 to 18 Years | 1,702 (98.0%) | 35 (2.0%) |
| 19 to 25 Years | 405 (91.0%) | 40 (9.0%) |
| 26 to 34 Years | 992 (83.9%) | 190 (16.1%) |
| 35 to 44 Years | 1,388 (85.3%) | 239 (14.7%) |
| 45 to 54 Years | 1,305 (96.3%) | 50 (3.7%) |
| 55 to 64 Years | 1,375 (91.5%) | 127 (8.5%) |
| 65 to 74 Years | 1,115 (100.0%) | 0 (0.0%) |
| 75 Years and older | 553 (100.0%) | 0 (0.0%) |
| Total | 9,254 (93.0%) | 692 (7.0%) |
Health Insurance Coverage by Citizenship Status in Picnic Point
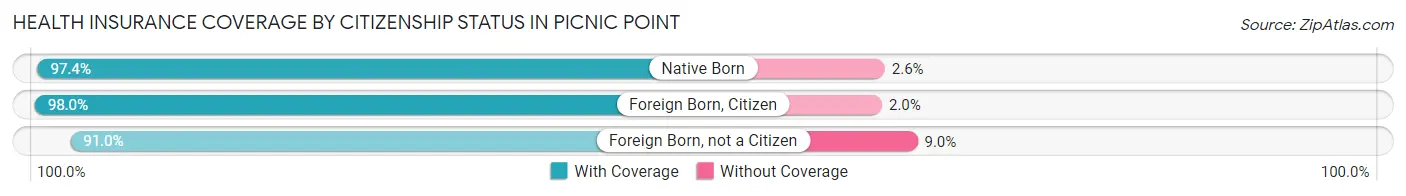
| Citizenship Status | With Coverage | Without Coverage |
| Native Born | 419 (97.4%) | 11 (2.6%) |
| Foreign Born, Citizen | 1,702 (98.0%) | 35 (2.0%) |
| Foreign Born, not a Citizen | 405 (91.0%) | 40 (9.0%) |
Health Insurance Coverage by Household Income in Picnic Point
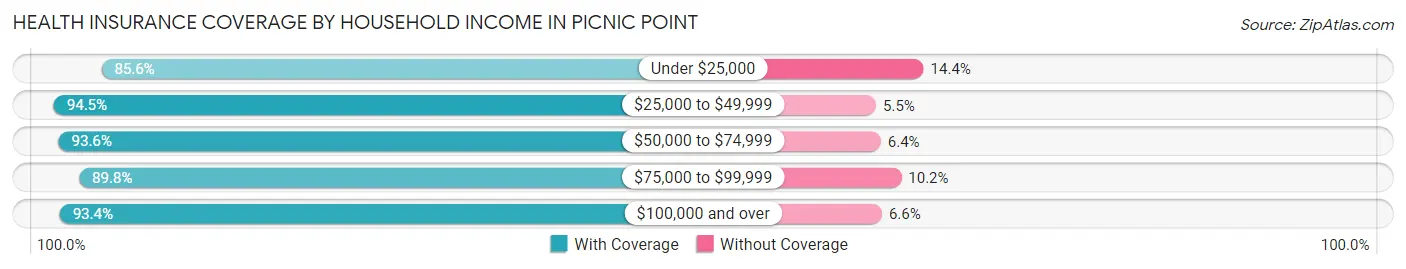
| Household Income | With Coverage | Without Coverage |
| Under $25,000 | 214 (85.6%) | 36 (14.4%) |
| $25,000 to $49,999 | 688 (94.5%) | 40 (5.5%) |
| $50,000 to $74,999 | 690 (93.6%) | 47 (6.4%) |
| $75,000 to $99,999 | 747 (89.8%) | 85 (10.2%) |
| $100,000 and over | 6,859 (93.4%) | 484 (6.6%) |
Public vs Private Health Insurance Coverage by Age in Picnic Point
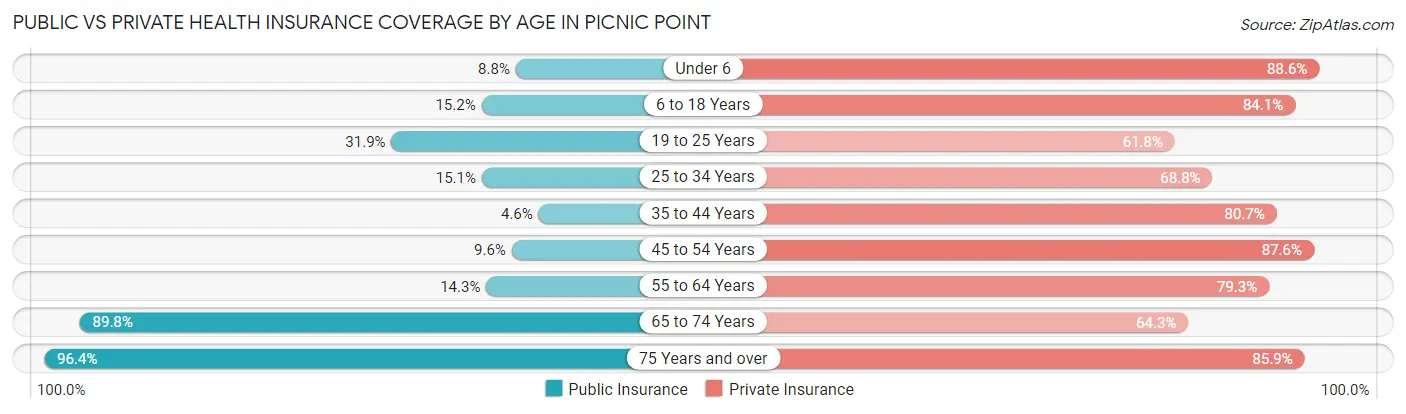
| Age Bracket | Public Insurance | Private Insurance |
| Under 6 | 38 (8.8%) | 381 (88.6%) |
| 6 to 18 Years | 264 (15.2%) | 1,461 (84.1%) |
| 19 to 25 Years | 142 (31.9%) | 275 (61.8%) |
| 25 to 34 Years | 179 (15.1%) | 813 (68.8%) |
| 35 to 44 Years | 75 (4.6%) | 1,313 (80.7%) |
| 45 to 54 Years | 130 (9.6%) | 1,187 (87.6%) |
| 55 to 64 Years | 215 (14.3%) | 1,191 (79.3%) |
| 65 to 74 Years | 1,001 (89.8%) | 717 (64.3%) |
| 75 Years and over | 533 (96.4%) | 475 (85.9%) |
| Total | 2,577 (25.9%) | 7,813 (78.5%) |
Disability Status by Sex by Age in Picnic Point
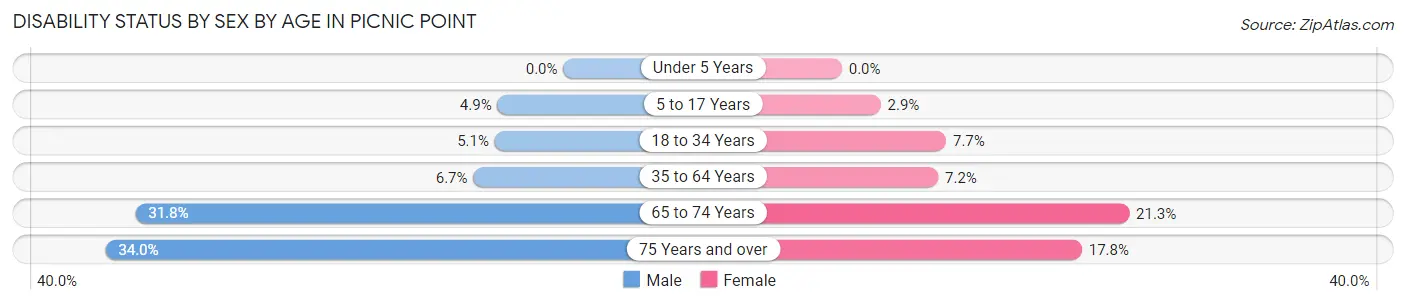
| Age Bracket | Male | Female |
| Under 5 Years | 0 (0.0%) | 0 (0.0%) |
| 5 to 17 Years | 44 (4.9%) | 22 (2.9%) |
| 18 to 34 Years | 60 (5.1%) | 47 (7.7%) |
| 35 to 64 Years | 166 (6.7%) | 143 (7.1%) |
| 65 to 74 Years | 177 (31.8%) | 119 (21.3%) |
| 75 Years and over | 85 (34.0%) | 54 (17.8%) |
Disability Class by Sex by Age in Picnic Point
Disability Class: Hearing Difficulty
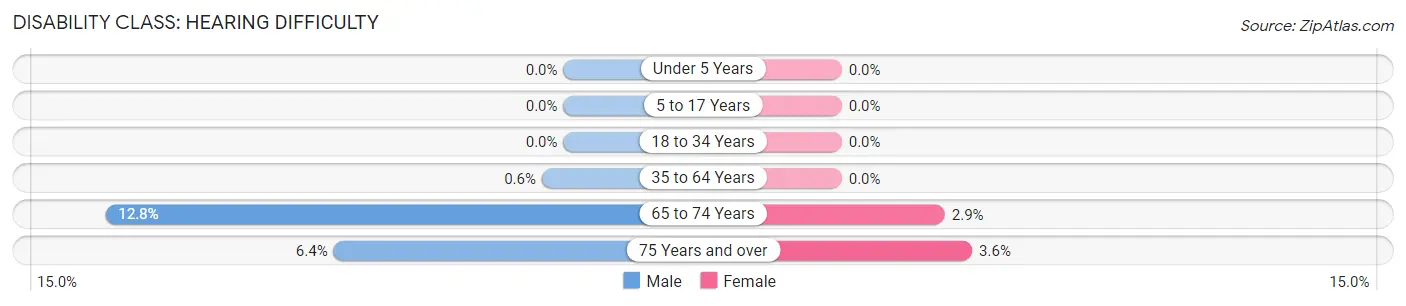
| Age Bracket | Male | Female |
| Under 5 Years | 0 (0.0%) | 0 (0.0%) |
| 5 to 17 Years | 0 (0.0%) | 0 (0.0%) |
| 18 to 34 Years | 0 (0.0%) | 0 (0.0%) |
| 35 to 64 Years | 15 (0.6%) | 0 (0.0%) |
| 65 to 74 Years | 71 (12.8%) | 16 (2.9%) |
| 75 Years and over | 16 (6.4%) | 11 (3.6%) |
Disability Class: Vision Difficulty
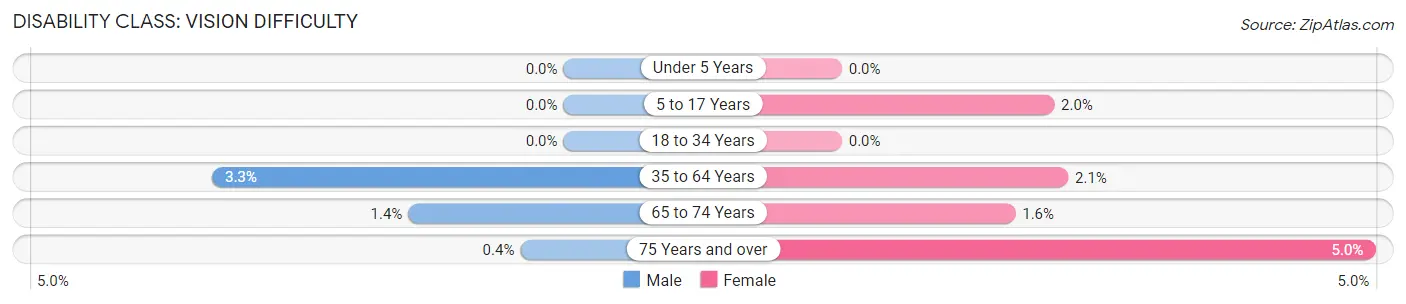
| Age Bracket | Male | Female |
| Under 5 Years | 0 (0.0%) | 0 (0.0%) |
| 5 to 17 Years | 0 (0.0%) | 15 (2.0%) |
| 18 to 34 Years | 0 (0.0%) | 0 (0.0%) |
| 35 to 64 Years | 81 (3.3%) | 42 (2.1%) |
| 65 to 74 Years | 8 (1.4%) | 9 (1.6%) |
| 75 Years and over | 1 (0.4%) | 15 (5.0%) |
Disability Class: Cognitive Difficulty
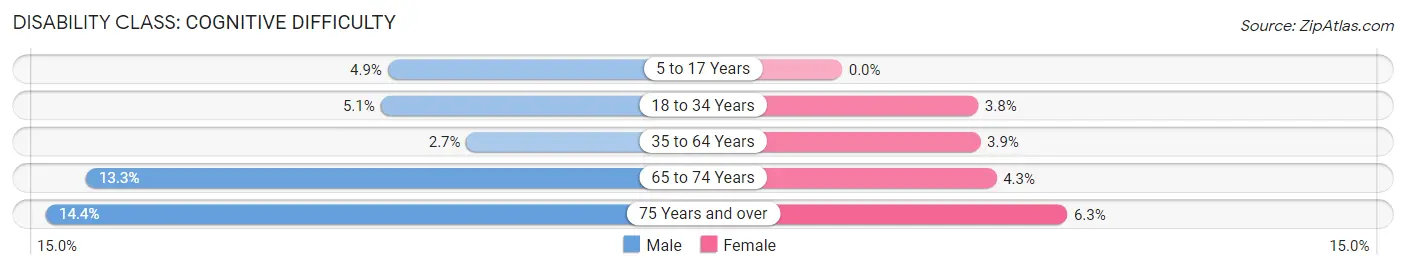
| Age Bracket | Male | Female |
| 5 to 17 Years | 44 (4.9%) | 0 (0.0%) |
| 18 to 34 Years | 60 (5.1%) | 23 (3.8%) |
| 35 to 64 Years | 67 (2.7%) | 77 (3.8%) |
| 65 to 74 Years | 74 (13.3%) | 24 (4.3%) |
| 75 Years and over | 36 (14.4%) | 19 (6.3%) |
Disability Class: Ambulatory Difficulty
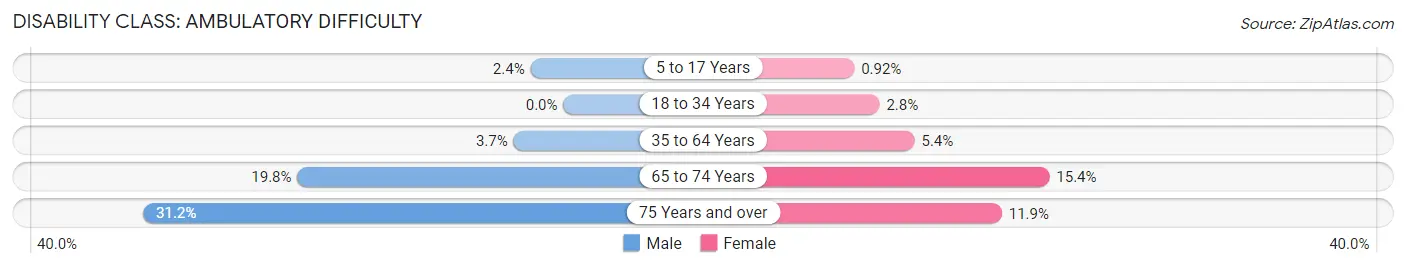
| Age Bracket | Male | Female |
| 5 to 17 Years | 22 (2.4%) | 7 (0.9%) |
| 18 to 34 Years | 0 (0.0%) | 17 (2.8%) |
| 35 to 64 Years | 92 (3.7%) | 108 (5.4%) |
| 65 to 74 Years | 110 (19.8%) | 86 (15.4%) |
| 75 Years and over | 78 (31.2%) | 36 (11.9%) |
Disability Class: Self-Care Difficulty
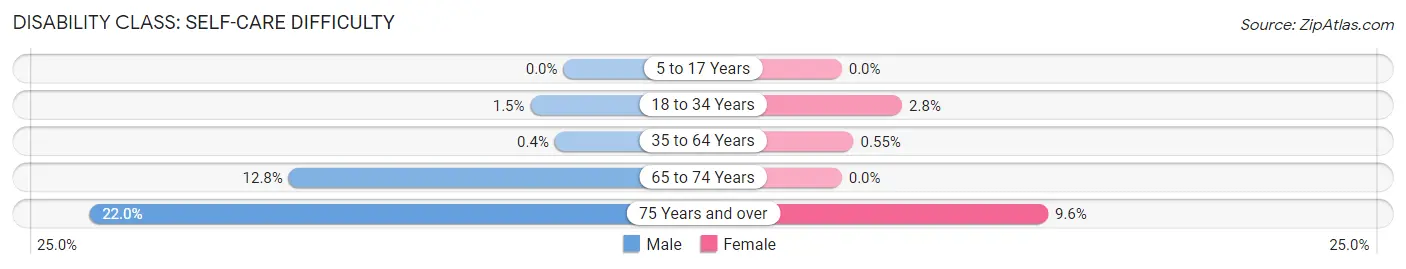
| Age Bracket | Male | Female |
| 5 to 17 Years | 0 (0.0%) | 0 (0.0%) |
| 18 to 34 Years | 18 (1.5%) | 17 (2.8%) |
| 35 to 64 Years | 10 (0.4%) | 11 (0.5%) |
| 65 to 74 Years | 71 (12.8%) | 0 (0.0%) |
| 75 Years and over | 55 (22.0%) | 29 (9.6%) |
Technology Access in Picnic Point
Computing Device Access in Picnic Point
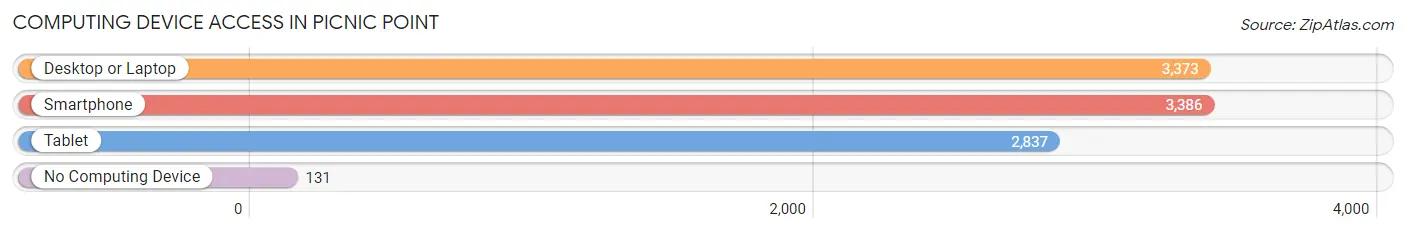
| Device Type | # Households | % Households |
| Desktop or Laptop | 3,373 | 92.3% |
| Smartphone | 3,386 | 92.6% |
| Tablet | 2,837 | 77.6% |
| No Computing Device | 131 | 3.6% |
| Total | 3,656 | 100.0% |
Internet Access in Picnic Point
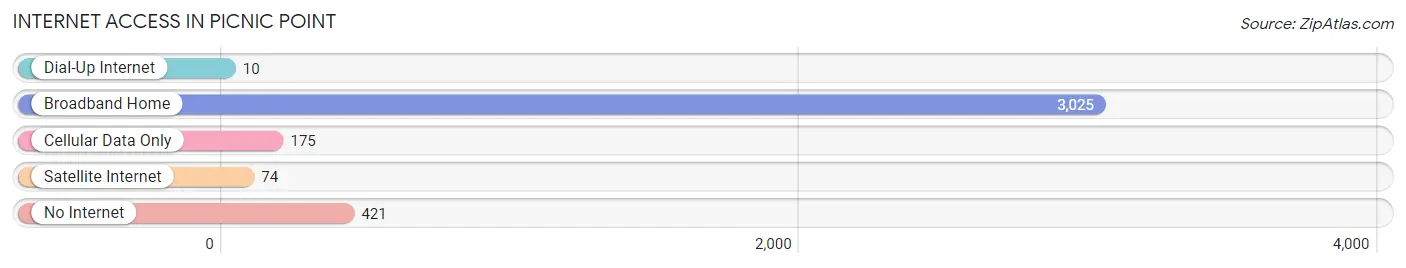
| Internet Type | # Households | % Households |
| Dial-Up Internet | 10 | 0.3% |
| Broadband Home | 3,025 | 82.7% |
| Cellular Data Only | 175 | 4.8% |
| Satellite Internet | 74 | 2.0% |
| No Internet | 421 | 11.5% |
| Total | 3,656 | 100.0% |
Picnic Point Summary
Picnic Point is a small town located in the south-western corner of Western Australia, approximately 20 kilometres south of the city of Bunbury. It is situated on the banks of the Collie River, and is surrounded by lush green hills and farmland. The town has a population of around 1,000 people, and is a popular tourist destination due to its picturesque scenery and proximity to the coast.
History
Picnic Point was first settled in the late 1800s by a group of settlers from England. The town was originally known as 'Collie Point', and was used as a stopover point for travellers heading south from Perth. In the early 1900s, the town was renamed 'Picnic Point' due to its popularity as a picnic spot.
The town grew steadily throughout the 20th century, and by the 1950s it had become a popular holiday destination for families from Perth. The town was also home to a number of small businesses, including a general store, a post office, a hotel and a number of cafes and restaurants.
Geography
Picnic Point is located in the south-western corner of Western Australia, approximately 20 kilometres south of the city of Bunbury. The town is situated on the banks of the Collie River, and is surrounded by lush green hills and farmland. The town is located close to the coast, and is a popular tourist destination due to its picturesque scenery.
The town is located in the Peel region of Western Australia, and is part of the Shire of Capel. The town is located close to the towns of Capel, Dardanup and Donnybrook, and is within easy reach of the cities of Bunbury and Perth.
Economy
Picnic Point is a small town with a population of around 1,000 people. The town is home to a number of small businesses, including a general store, a post office, a hotel and a number of cafes and restaurants. The town is also home to a number of small farms, which produce a variety of fruits and vegetables.
The town is a popular tourist destination due to its picturesque scenery and proximity to the coast. The town is home to a number of tourist attractions, including a number of wineries, a golf course and a number of walking trails. The town is also home to a number of festivals and events throughout the year, including the annual Picnic Point Festival.
Demographics
According to the 2016 census, the population of Picnic Point was 1,039 people. The median age of the population was 44 years, and the median weekly household income was $1,717. The majority of the population (86.3%) identified as Australian, while the remaining 13.7% identified as other ethnicities. The most common religious affiliation was Catholic (30.2%), followed by Anglican (17.2%) and No Religion (15.2%). The majority of the population (90.2%) spoke English as their first language, while the remaining 9.8% spoke other languages.
Common Questions
What is Per Capita Income in Picnic Point?
Per Capita income in Picnic Point is $56,294.
What is the Median Family Income in Picnic Point?
Median Family Income in Picnic Point is $154,890.
What is the Median Household income in Picnic Point?
Median Household Income in Picnic Point is $129,769.
What is Income or Wage Gap in Picnic Point?
Income or Wage Gap in Picnic Point is 13.6%.
Women in Picnic Point earn 86.4 cents for every dollar earned by a man.
What is Family Income Deficit in Picnic Point?
Family Income Deficit in Picnic Point is $13,767.
Families that are below poverty line in Picnic Point earn $13,767 less on average than the poverty threshold level.
What is Inequality or Gini Index in Picnic Point?
Inequality or Gini Index in Picnic Point is 0.39.
What is the Total Population of Picnic Point?
Total Population of Picnic Point is 9,951.
What is the Total Male Population of Picnic Point?
Total Male Population of Picnic Point is 5,519.
What is the Total Female Population of Picnic Point?
Total Female Population of Picnic Point is 4,432.
What is the Ratio of Males per 100 Females in Picnic Point?
There are 124.53 Males per 100 Females in Picnic Point.
What is the Ratio of Females per 100 Males in Picnic Point?
There are 80.30 Females per 100 Males in Picnic Point.
What is the Median Population Age in Picnic Point?
Median Population Age in Picnic Point is 42.5 Years.
What is the Average Family Size in Picnic Point
Average Family Size in Picnic Point is 3.0 People.
What is the Average Household Size in Picnic Point
Average Household Size in Picnic Point is 2.7 People.
How Large is the Labor Force in Picnic Point?
There are 5,557 People in the Labor Forcein in Picnic Point.
What is the Percentage of People in the Labor Force in Picnic Point?
67.3% of People are in the Labor Force in Picnic Point.
What is the Unemployment Rate in Picnic Point?
Unemployment Rate in Picnic Point is 4.4%.