Bothell East, WA Map & Demographics
Bothell East Map
Bothell East Overview
$67,615
PER CAPITA INCOME
$169,286
AVG FAMILY INCOME
$161,628
AVG HOUSEHOLD INCOME
60.7%
WAGE / INCOME GAP [ % ]
39.3¢/ $1
WAGE / INCOME GAP [ $ ]
0.40
INEQUALITY / GINI INDEX
13,948
TOTAL POPULATION
6,534
MALE POPULATION
7,414
FEMALE POPULATION
88.13
MALES / 100 FEMALES
113.47
FEMALES / 100 MALES
33.6
MEDIAN AGE
3.1
AVG FAMILY SIZE
2.9
AVG HOUSEHOLD SIZE
7,562
LABOR FORCE [ PEOPLE ]
74.8%
PERCENT IN LABOR FORCE
3.7%
UNEMPLOYMENT RATE
Income in Bothell East
Income Overview in Bothell East
Per Capita Income in Bothell East is $67,615, while median incomes of families and households are $169,286 and $161,628 respectively.
| Characteristic | Number | Measure |
| Per Capita Income | 13,948 | $67,615 |
| Median Family Income | 3,960 | $169,286 |
| Mean Family Income | 3,960 | $210,440 |
| Median Household Income | 4,788 | $161,628 |
| Mean Household Income | 4,788 | $198,442 |
| Income Deficit | 3,960 | $0 |
| Wage / Income Gap (%) | 13,948 | 60.73% |
| Wage / Income Gap ($) | 13,948 | 39.27¢ per $1 |
| Gini / Inequality Index | 13,948 | 0.40 |
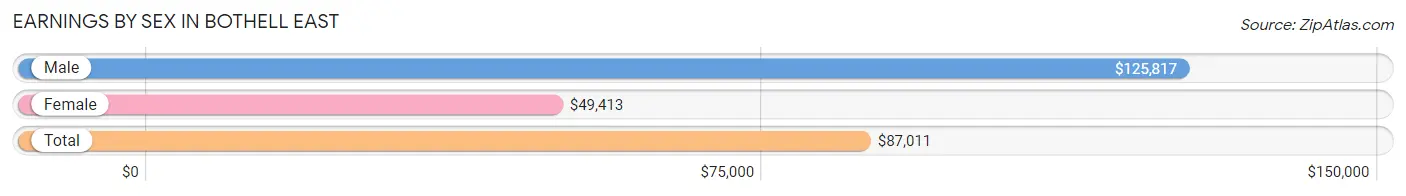
Earnings by Sex in Bothell East
Average Earnings in Bothell East are $87,011, $125,817 for men and $49,413 for women, a difference of 60.7%.
| Sex | Number | Average Earnings |
| Male | 4,065 (52.6%) | $125,817 |
| Female | 3,661 (47.4%) | $49,413 |
| Total | 7,726 (100.0%) | $87,011 |
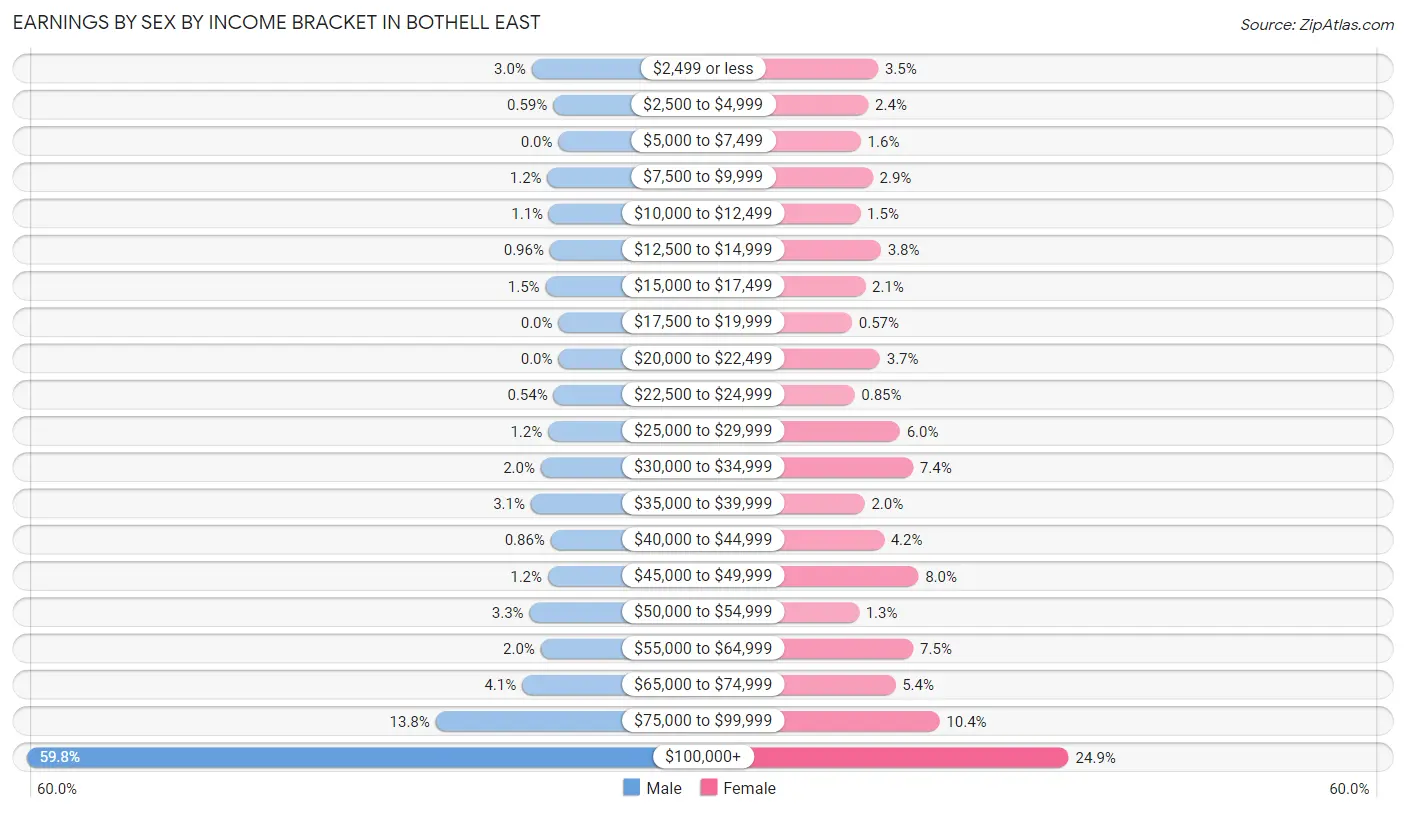
Earnings by Sex by Income Bracket in Bothell East
The most common earnings brackets in Bothell East are $100,000+ for men (2,430 | 59.8%) and $100,000+ for women (913 | 24.9%).
| Income | Male | Female |
| $2,499 or less | 122 (3.0%) | 128 (3.5%) |
| $2,500 to $4,999 | 24 (0.6%) | 88 (2.4%) |
| $5,000 to $7,499 | 0 (0.0%) | 57 (1.6%) |
| $7,500 to $9,999 | 50 (1.2%) | 106 (2.9%) |
| $10,000 to $12,499 | 43 (1.1%) | 55 (1.5%) |
| $12,500 to $14,999 | 39 (1.0%) | 140 (3.8%) |
| $15,000 to $17,499 | 59 (1.5%) | 75 (2.1%) |
| $17,500 to $19,999 | 0 (0.0%) | 21 (0.6%) |
| $20,000 to $22,499 | 0 (0.0%) | 136 (3.7%) |
| $22,500 to $24,999 | 22 (0.5%) | 31 (0.9%) |
| $25,000 to $29,999 | 47 (1.2%) | 218 (5.9%) |
| $30,000 to $34,999 | 80 (2.0%) | 272 (7.4%) |
| $35,000 to $39,999 | 126 (3.1%) | 73 (2.0%) |
| $40,000 to $44,999 | 35 (0.9%) | 152 (4.2%) |
| $45,000 to $49,999 | 48 (1.2%) | 294 (8.0%) |
| $50,000 to $54,999 | 132 (3.3%) | 49 (1.3%) |
| $55,000 to $64,999 | 81 (2.0%) | 273 (7.5%) |
| $65,000 to $74,999 | 166 (4.1%) | 199 (5.4%) |
| $75,000 to $99,999 | 561 (13.8%) | 381 (10.4%) |
| $100,000+ | 2,430 (59.8%) | 913 (24.9%) |
| Total | 4,065 (100.0%) | 3,661 (100.0%) |
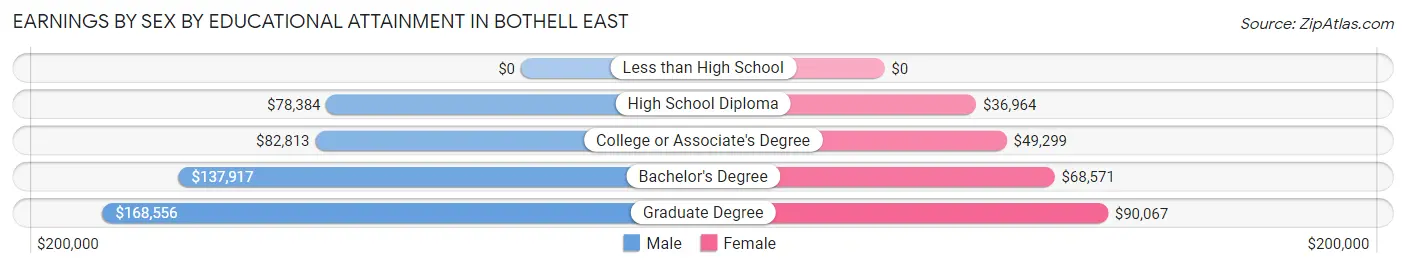
Earnings by Sex by Educational Attainment in Bothell East
Average earnings in Bothell East are $136,640 for men and $64,202 for women, a difference of 53.0%. Men with an educational attainment of graduate degree enjoy the highest average annual earnings of $168,556, while those with high school diploma education earn the least with $78,384. Women with an educational attainment of graduate degree earn the most with the average annual earnings of $90,067, while those with high school diploma education have the smallest earnings of $36,964.
| Educational Attainment | Male Income | Female Income |
| Less than High School | - | - |
| High School Diploma | $78,384 | $36,964 |
| College or Associate's Degree | $82,813 | $49,299 |
| Bachelor's Degree | $137,917 | $68,571 |
| Graduate Degree | $168,556 | $90,067 |
| Total | $136,640 | $64,202 |
Family Income in Bothell East
Family Income Brackets in Bothell East
According to the Bothell East family income data, there are 1,687 families falling into the $200,000+ income range, which is the most common income bracket and makes up 42.6% of all families.
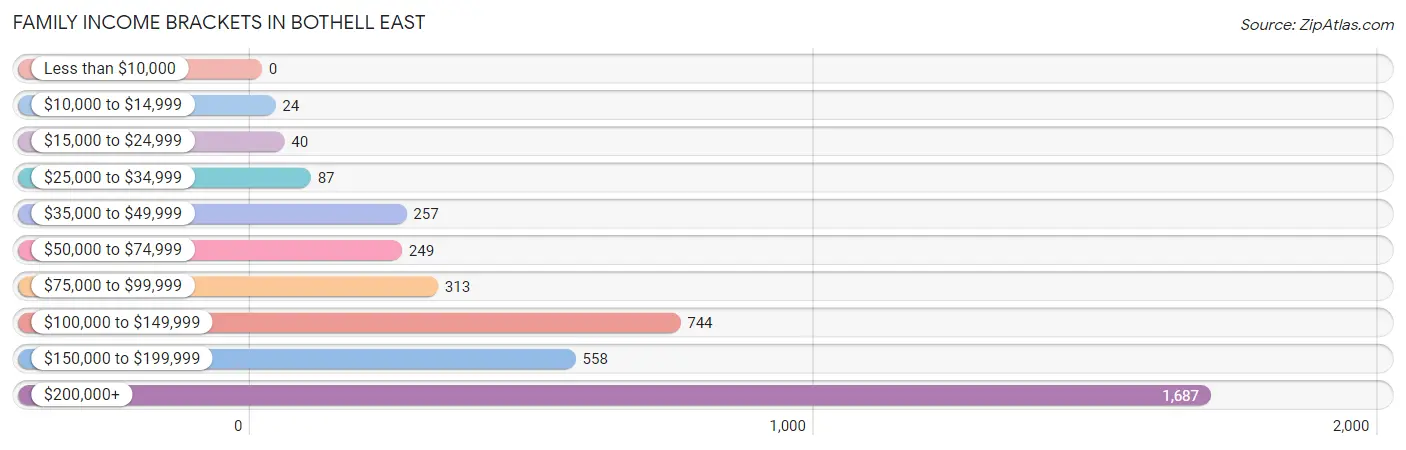
| Income Bracket | # Families | % Families |
| Less than $10,000 | 0 | 0.0% |
| $10,000 to $14,999 | 24 | 0.6% |
| $15,000 to $24,999 | 40 | 1.0% |
| $25,000 to $34,999 | 87 | 2.2% |
| $35,000 to $49,999 | 257 | 6.5% |
| $50,000 to $74,999 | 249 | 6.3% |
| $75,000 to $99,999 | 313 | 7.9% |
| $100,000 to $149,999 | 744 | 18.8% |
| $150,000 to $199,999 | 558 | 14.1% |
| $200,000+ | 1,687 | 42.6% |
Family Income by Famaliy Size in Bothell East
4-person families (1,140 | 28.8%) account for the highest median family income in Bothell East with $230,833 per family, while 3-person families (895 | 22.6%) have the highest median income of $60,903 per family member.
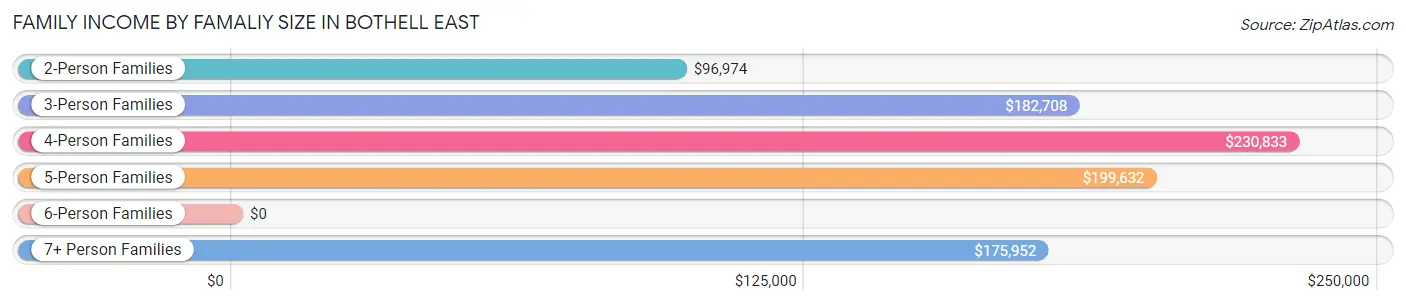
| Income Bracket | # Families | Median Income |
| 2-Person Families | 1,414 (35.7%) | $96,974 |
| 3-Person Families | 895 (22.6%) | $182,708 |
| 4-Person Families | 1,140 (28.8%) | $230,833 |
| 5-Person Families | 424 (10.7%) | $199,632 |
| 6-Person Families | 45 (1.1%) | $0 |
| 7+ Person Families | 42 (1.1%) | $175,952 |
| Total | 3,960 (100.0%) | $169,286 |
Family Income by Number of Earners in Bothell East
The median family income in Bothell East is $169,286, with families comprising 3+ earners (256) having the highest median family income of $213,167, while families with no earners (214) have the lowest median family income of $74,750, accounting for 6.5% and 5.4% of families, respectively.
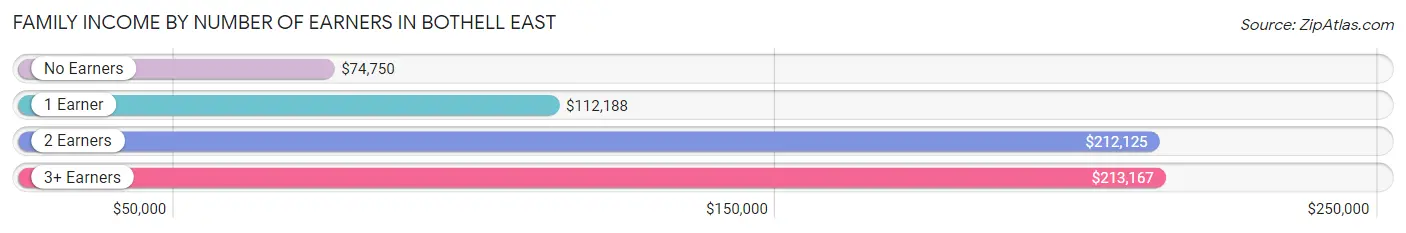
| Number of Earners | # Families | Median Income |
| No Earners | 214 (5.4%) | $74,750 |
| 1 Earner | 1,379 (34.8%) | $112,188 |
| 2 Earners | 2,111 (53.3%) | $212,125 |
| 3+ Earners | 256 (6.5%) | $213,167 |
| Total | 3,960 (100.0%) | $169,286 |
Household Income in Bothell East
Household Income Brackets in Bothell East
With 1,901 households falling in the category, the $200,000+ income range is the most frequent in Bothell East, accounting for 39.7% of all households.
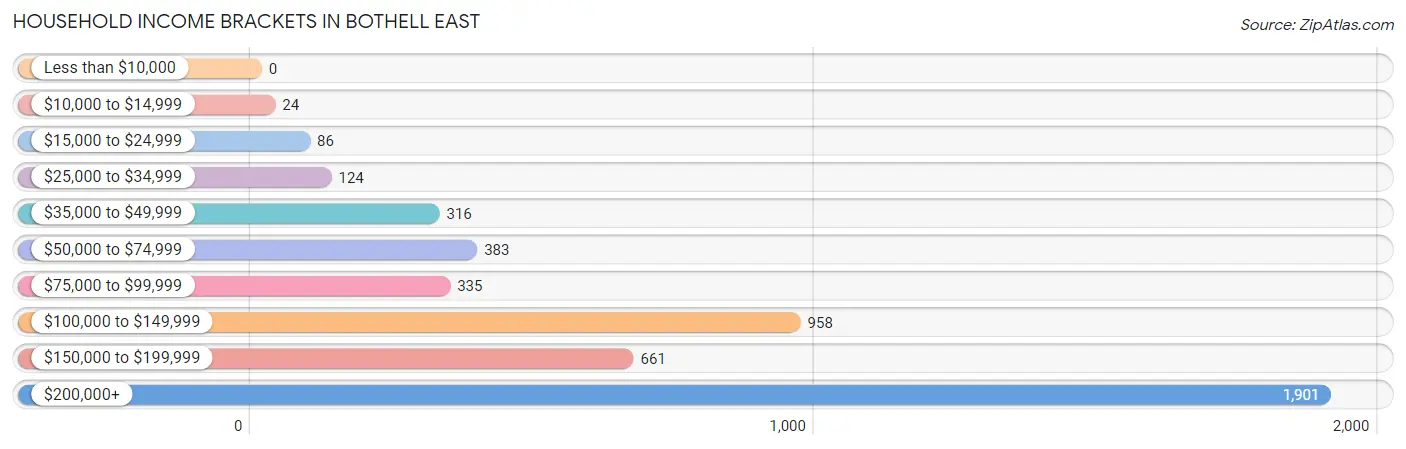
| Income Bracket | # Households | % Households |
| Less than $10,000 | 0 | 0.0% |
| $10,000 to $14,999 | 24 | 0.5% |
| $15,000 to $24,999 | 86 | 1.8% |
| $25,000 to $34,999 | 124 | 2.6% |
| $35,000 to $49,999 | 316 | 6.6% |
| $50,000 to $74,999 | 383 | 8.0% |
| $75,000 to $99,999 | 335 | 7.0% |
| $100,000 to $149,999 | 958 | 20.0% |
| $150,000 to $199,999 | 661 | 13.8% |
| $200,000+ | 1,901 | 39.7% |
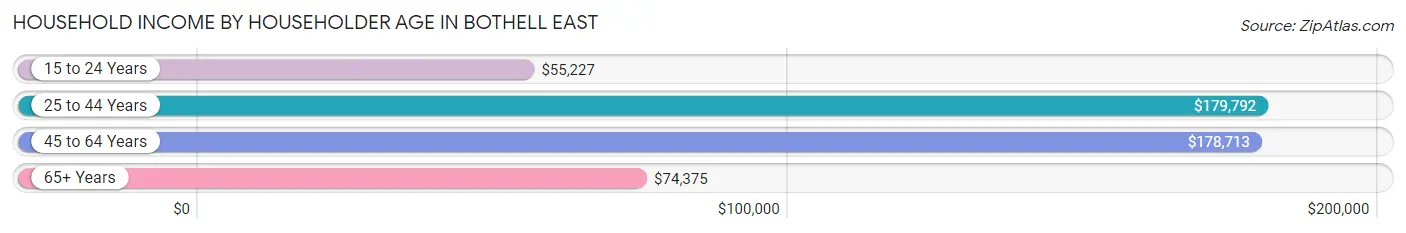
Household Income by Householder Age in Bothell East
The median household income in Bothell East is $161,628, with the highest median household income of $179,792 found in the 25 to 44 years age bracket for the primary householder. A total of 2,532 households (52.9%) fall into this category. Meanwhile, the 15 to 24 years age bracket for the primary householder has the lowest median household income of $55,227, with 96 households (2.0%) in this group.
| Income Bracket | # Households | Median Income |
| 15 to 24 Years | 96 (2.0%) | $55,227 |
| 25 to 44 Years | 2,532 (52.9%) | $179,792 |
| 45 to 64 Years | 1,719 (35.9%) | $178,713 |
| 65+ Years | 441 (9.2%) | $74,375 |
| Total | 4,788 (100.0%) | $161,628 |
Poverty in Bothell East
Income Below Poverty by Sex and Age in Bothell East
With 2.3% poverty level for males and 2.8% for females among the residents of Bothell East, 16 and 17 year old males and 75 year old and over females are the most vulnerable to poverty, with 32 males (24.1%) and 46 females (18.4%) in their respective age groups living below the poverty level.
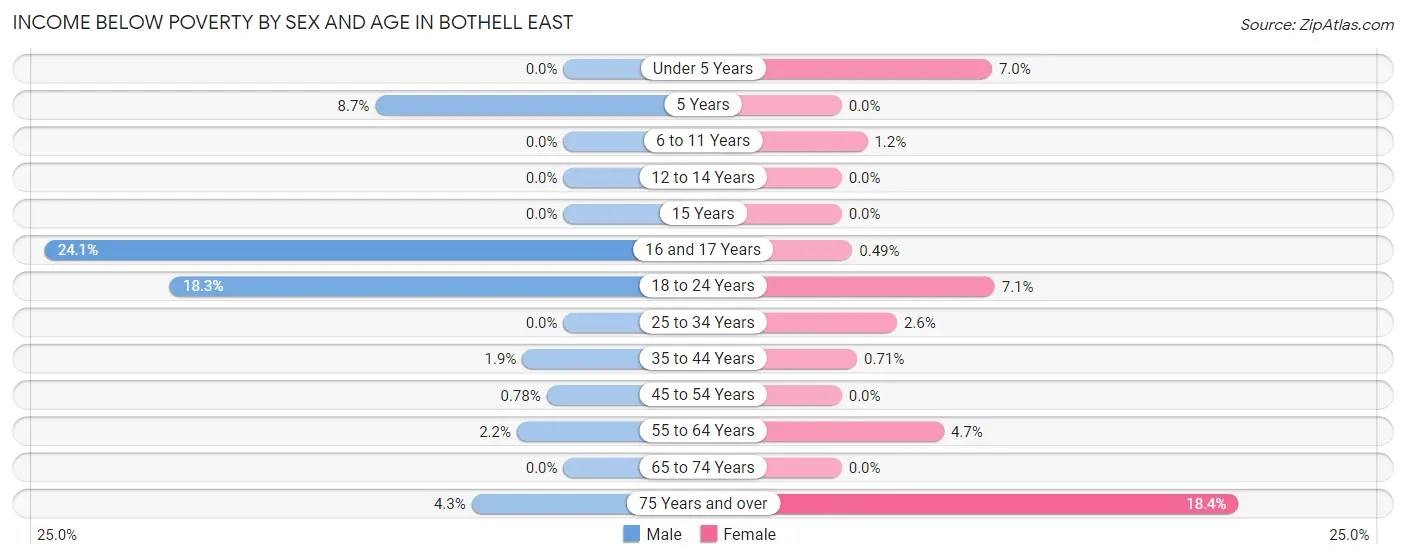
| Age Bracket | Male | Female |
| Under 5 Years | 0 (0.0%) | 41 (7.0%) |
| 5 Years | 11 (8.7%) | 0 (0.0%) |
| 6 to 11 Years | 0 (0.0%) | 10 (1.2%) |
| 12 to 14 Years | 0 (0.0%) | 0 (0.0%) |
| 15 Years | 0 (0.0%) | 0 (0.0%) |
| 16 and 17 Years | 32 (24.1%) | 1 (0.5%) |
| 18 to 24 Years | 52 (18.2%) | 43 (7.1%) |
| 25 to 34 Years | 0 (0.0%) | 28 (2.6%) |
| 35 to 44 Years | 26 (1.9%) | 10 (0.7%) |
| 45 to 54 Years | 8 (0.8%) | 0 (0.0%) |
| 55 to 64 Years | 9 (2.2%) | 29 (4.7%) |
| 65 to 74 Years | 0 (0.0%) | 0 (0.0%) |
| 75 Years and over | 8 (4.3%) | 46 (18.4%) |
| Total | 146 (2.3%) | 208 (2.8%) |
Income Above Poverty by Sex and Age in Bothell East
According to the poverty statistics in Bothell East, males aged under 5 years and females aged 5 years are the age groups that are most secure financially, with 100.0% of males and 100.0% of females in these age groups living above the poverty line.
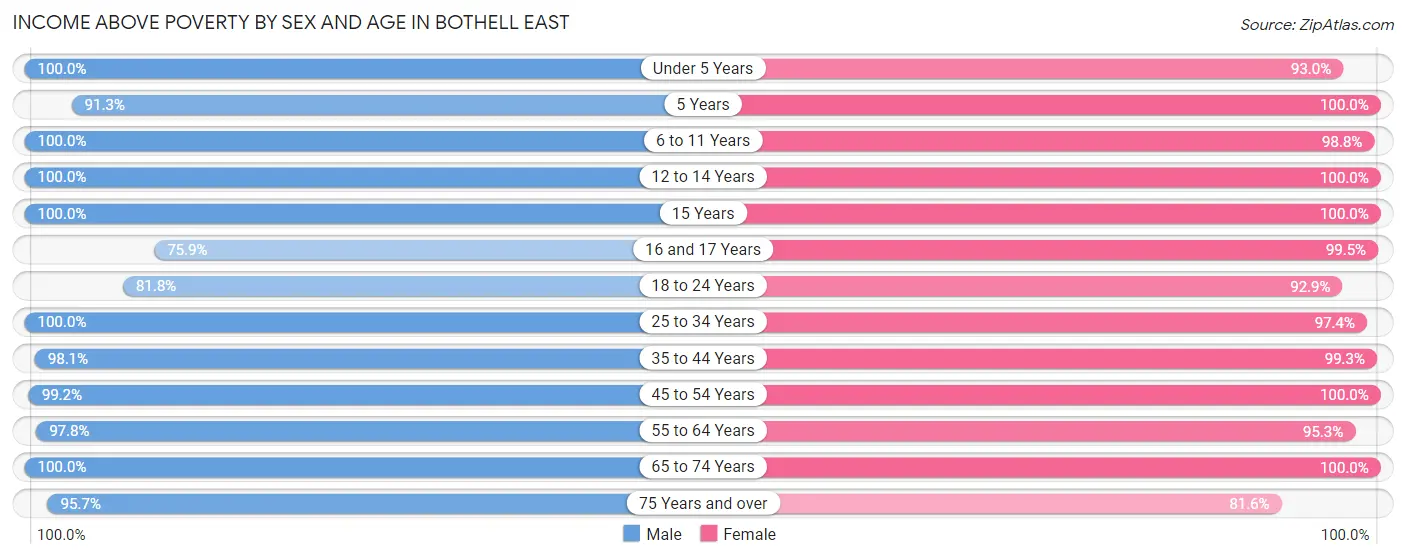
| Age Bracket | Male | Female |
| Under 5 Years | 617 (100.0%) | 547 (93.0%) |
| 5 Years | 115 (91.3%) | 98 (100.0%) |
| 6 to 11 Years | 617 (100.0%) | 833 (98.8%) |
| 12 to 14 Years | 286 (100.0%) | 341 (100.0%) |
| 15 Years | 19 (100.0%) | 236 (100.0%) |
| 16 and 17 Years | 101 (75.9%) | 203 (99.5%) |
| 18 to 24 Years | 233 (81.8%) | 563 (92.9%) |
| 25 to 34 Years | 1,142 (100.0%) | 1,066 (97.4%) |
| 35 to 44 Years | 1,332 (98.1%) | 1,401 (99.3%) |
| 45 to 54 Years | 1,018 (99.2%) | 837 (100.0%) |
| 55 to 64 Years | 407 (97.8%) | 583 (95.3%) |
| 65 to 74 Years | 254 (100.0%) | 279 (100.0%) |
| 75 Years and over | 180 (95.7%) | 204 (81.6%) |
| Total | 6,321 (97.7%) | 7,191 (97.2%) |
Income Below Poverty Among Married-Couple Families in Bothell East
The poverty statistics for married-couple families in Bothell East show that 0.9% or 30 of the total 3,228 families live below the poverty line. Families with 1 or 2 children have the highest poverty rate of 1.2%, comprising of 23 families. On the other hand, families with 3 or 4 children have the lowest poverty rate of 0.0%, which includes 0 families.
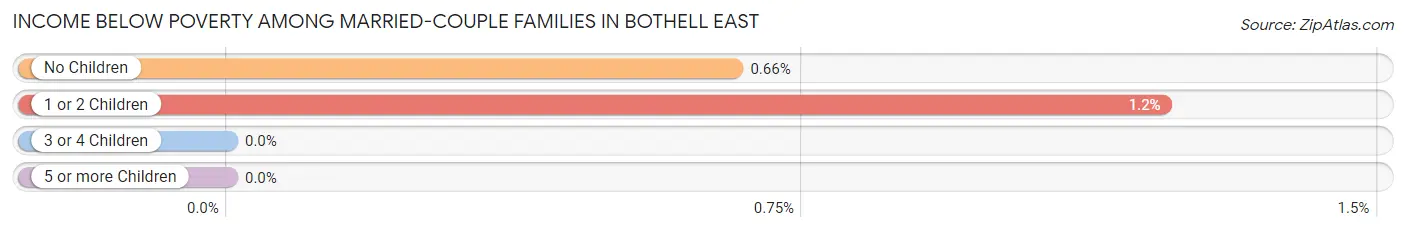
| Children | Above Poverty | Below Poverty |
| No Children | 1,058 (99.3%) | 7 (0.7%) |
| 1 or 2 Children | 1,868 (98.8%) | 23 (1.2%) |
| 3 or 4 Children | 272 (100.0%) | 0 (0.0%) |
| 5 or more Children | 0 (0.0%) | 0 (0.0%) |
| Total | 3,198 (99.1%) | 30 (0.9%) |
Income Below Poverty Among Single-Parent Households in Bothell East
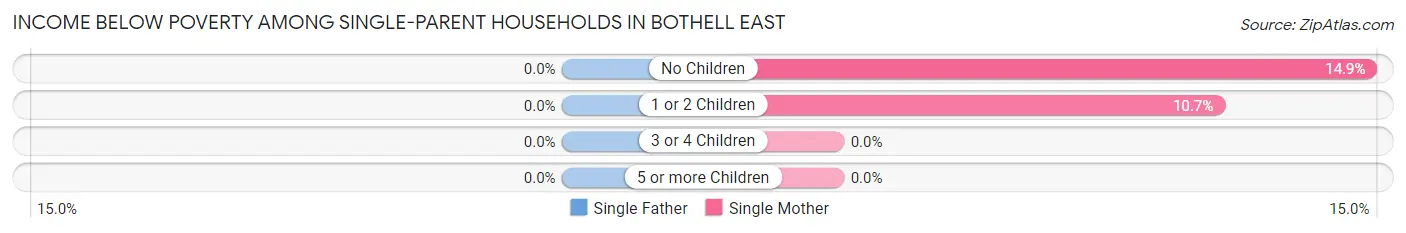
| Children | Single Father | Single Mother |
| No Children | 0 (0.0%) | 17 (14.9%) |
| 1 or 2 Children | 0 (0.0%) | 21 (10.7%) |
| 3 or 4 Children | 0 (0.0%) | 0 (0.0%) |
| 5 or more Children | 0 (0.0%) | 0 (0.0%) |
| Total | 0 (0.0%) | 38 (11.2%) |
Income Below Poverty Among Married-Couple vs Single-Parent Households in Bothell East
The poverty data for Bothell East shows that 30 of the married-couple family households (0.9%) and 38 of the single-parent households (5.2%) are living below the poverty level. Within the married-couple family households, those with 1 or 2 children have the highest poverty rate, with 23 households (1.2%) falling below the poverty line. Among the single-parent households, those with 1 or 2 children have the highest poverty rate, with 21 household (6.5%) living below poverty.
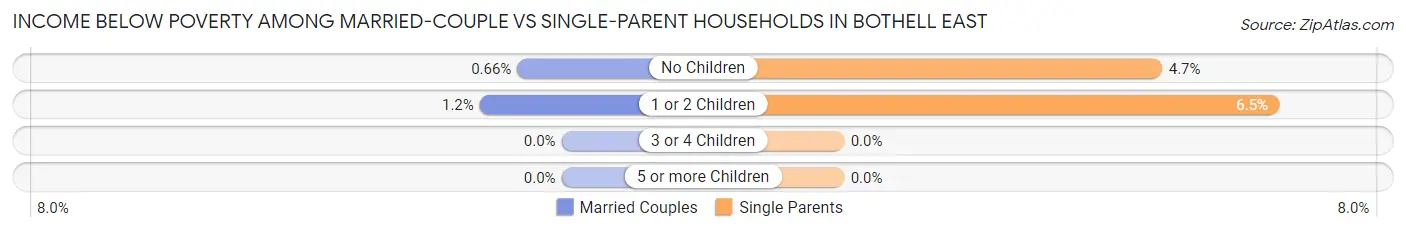
| Children | Married-Couple Families | Single-Parent Households |
| No Children | 7 (0.7%) | 17 (4.7%) |
| 1 or 2 Children | 23 (1.2%) | 21 (6.5%) |
| 3 or 4 Children | 0 (0.0%) | 0 (0.0%) |
| 5 or more Children | 0 (0.0%) | 0 (0.0%) |
| Total | 30 (0.9%) | 38 (5.2%) |
Race in Bothell East
The most populous races in Bothell East are Asian (6,157 | 44.1%), White / Caucasian (5,995 | 43.0%), and Hispanic or Latino (956 | 6.9%).
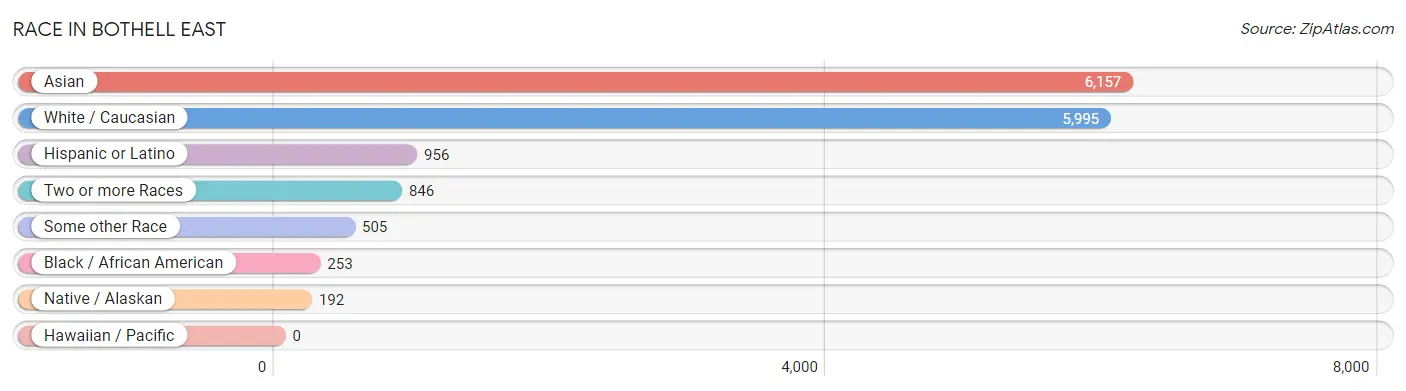
| Race | # Population | % Population |
| Asian | 6,157 | 44.1% |
| Black / African American | 253 | 1.8% |
| Hawaiian / Pacific | 0 | 0.0% |
| Hispanic or Latino | 956 | 6.9% |
| Native / Alaskan | 192 | 1.4% |
| White / Caucasian | 5,995 | 43.0% |
| Two or more Races | 846 | 6.1% |
| Some other Race | 505 | 3.6% |
| Total | 13,948 | 100.0% |
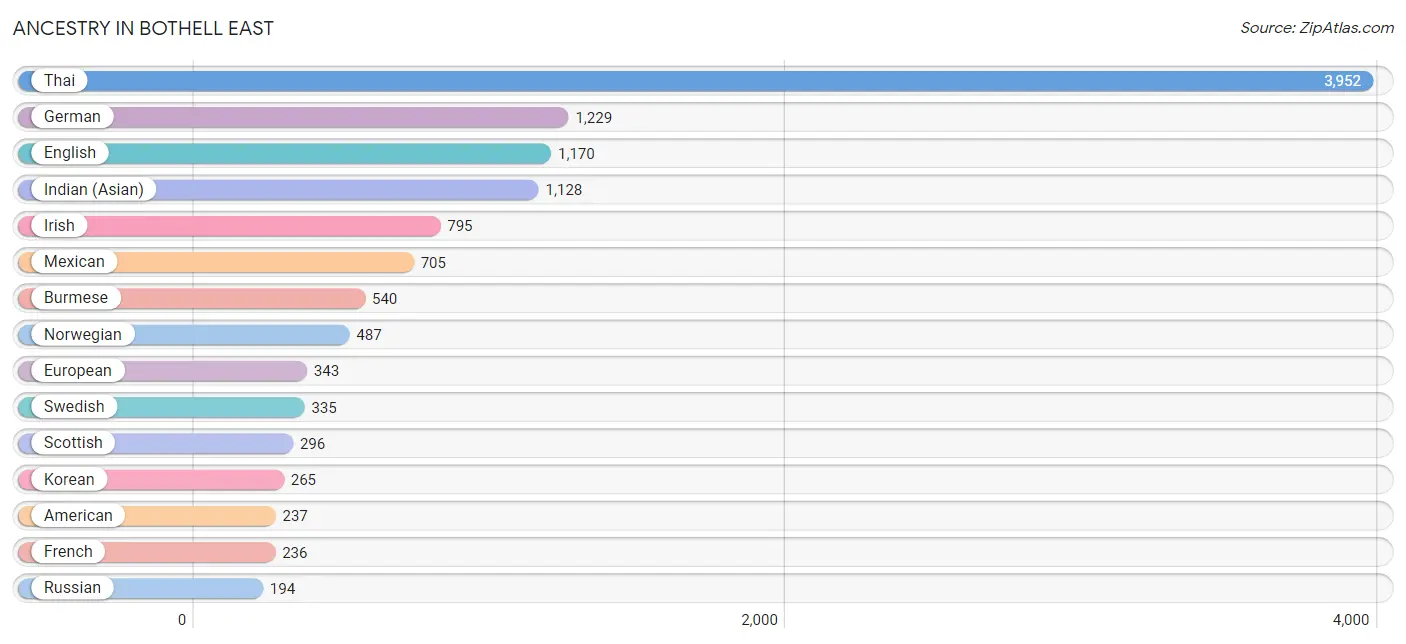
Ancestry in Bothell East
The most populous ancestries reported in Bothell East are Thai (3,952 | 28.3%), German (1,229 | 8.8%), English (1,170 | 8.4%), Indian (Asian) (1,128 | 8.1%), and Irish (795 | 5.7%), together accounting for 59.3% of all Bothell East residents.
| Ancestry | # Population | % Population |
| American | 237 | 1.7% |
| Arab | 7 | 0.1% |
| Argentinean | 13 | 0.1% |
| Austrian | 109 | 0.8% |
| Belgian | 37 | 0.3% |
| Bhutanese | 124 | 0.9% |
| Brazilian | 38 | 0.3% |
| British | 139 | 1.0% |
| Burmese | 540 | 3.9% |
| Cambodian | 37 | 0.3% |
| Canadian | 45 | 0.3% |
| Central American | 23 | 0.2% |
| Chilean | 19 | 0.1% |
| Chippewa | 2 | 0.0% |
| Cuban | 9 | 0.1% |
| Czech | 45 | 0.3% |
| Czechoslovakian | 8 | 0.1% |
| Danish | 32 | 0.2% |
| Dutch | 74 | 0.5% |
| English | 1,170 | 8.4% |
| Ethiopian | 11 | 0.1% |
| European | 343 | 2.5% |
| Filipino | 77 | 0.5% |
| Finnish | 94 | 0.7% |
| French | 236 | 1.7% |
| French Canadian | 132 | 0.9% |
| German | 1,229 | 8.8% |
| Guatemalan | 23 | 0.2% |
| Hungarian | 15 | 0.1% |
| Icelander | 11 | 0.1% |
| Indian (Asian) | 1,128 | 8.1% |
| Iranian | 57 | 0.4% |
| Irish | 795 | 5.7% |
| Italian | 171 | 1.2% |
| Japanese | 96 | 0.7% |
| Korean | 265 | 1.9% |
| Lithuanian | 85 | 0.6% |
| Luxembourger | 15 | 0.1% |
| Mexican | 705 | 5.1% |
| Northern European | 21 | 0.2% |
| Norwegian | 487 | 3.5% |
| Pakistani | 64 | 0.5% |
| Polish | 99 | 0.7% |
| Portuguese | 15 | 0.1% |
| Puerto Rican | 90 | 0.6% |
| Romanian | 37 | 0.3% |
| Russian | 194 | 1.4% |
| Scandinavian | 26 | 0.2% |
| Scotch-Irish | 117 | 0.8% |
| Scottish | 296 | 2.1% |
| Serbian | 34 | 0.2% |
| Somali | 7 | 0.1% |
| South American | 32 | 0.2% |
| Spaniard | 12 | 0.1% |
| Spanish | 85 | 0.6% |
| Sri Lankan | 109 | 0.8% |
| Subsaharan African | 173 | 1.2% |
| Swedish | 335 | 2.4% |
| Thai | 3,952 | 28.3% |
| Tlingit-Haida | 30 | 0.2% |
| Ukrainian | 28 | 0.2% |
| Vietnamese | 39 | 0.3% |
| Welsh | 73 | 0.5% |
| Yugoslavian | 104 | 0.7% | View All 64 Rows |
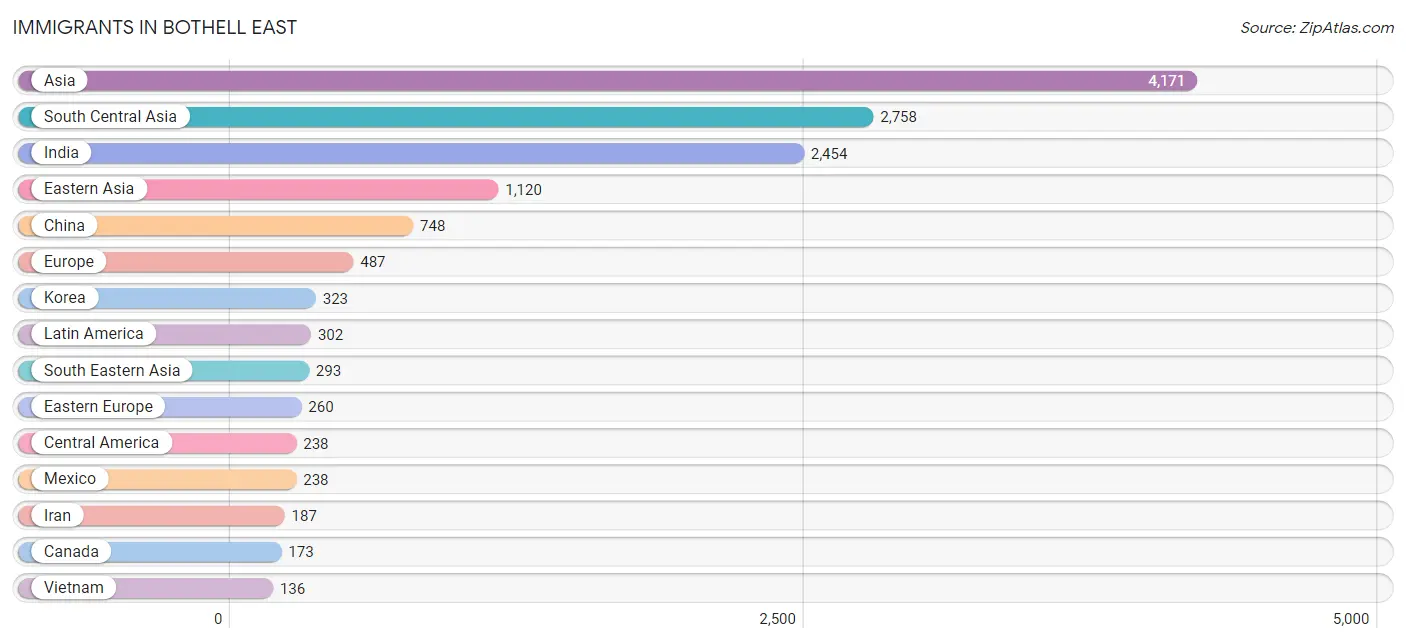
Immigrants in Bothell East
The most numerous immigrant groups reported in Bothell East came from Asia (4,171 | 29.9%), South Central Asia (2,758 | 19.8%), India (2,454 | 17.6%), Eastern Asia (1,120 | 8.0%), and China (748 | 5.4%), together accounting for 80.6% of all Bothell East residents.
| Immigration Origin | # Population | % Population |
| Africa | 119 | 0.9% |
| Argentina | 13 | 0.1% |
| Asia | 4,171 | 29.9% |
| Bangladesh | 27 | 0.2% |
| Bosnia and Herzegovina | 104 | 0.7% |
| Brazil | 38 | 0.3% |
| Cambodia | 21 | 0.2% |
| Canada | 173 | 1.2% |
| Central America | 238 | 1.7% |
| Chile | 13 | 0.1% |
| China | 748 | 5.4% |
| Czechoslovakia | 15 | 0.1% |
| Eastern Africa | 6 | 0.0% |
| Eastern Asia | 1,120 | 8.0% |
| Eastern Europe | 260 | 1.9% |
| England | 28 | 0.2% |
| Ethiopia | 6 | 0.0% |
| Europe | 487 | 3.5% |
| France | 63 | 0.4% |
| Germany | 1 | 0.0% |
| India | 2,454 | 17.6% |
| Iran | 187 | 1.3% |
| Japan | 21 | 0.2% |
| Korea | 323 | 2.3% |
| Latin America | 302 | 2.2% |
| Mexico | 238 | 1.7% |
| Northern Europe | 28 | 0.2% |
| Pakistan | 90 | 0.6% |
| Philippines | 103 | 0.7% |
| Poland | 16 | 0.1% |
| Russia | 85 | 0.6% |
| Serbia | 34 | 0.2% |
| South Africa | 4 | 0.0% |
| South America | 64 | 0.5% |
| South Central Asia | 2,758 | 19.8% |
| South Eastern Asia | 293 | 2.1% |
| Southern Europe | 97 | 0.7% |
| Spain | 97 | 0.7% |
| Taiwan | 132 | 0.9% |
| Thailand | 33 | 0.2% |
| Ukraine | 6 | 0.0% |
| Vietnam | 136 | 1.0% |
| Western Africa | 109 | 0.8% |
| Western Europe | 64 | 0.5% | View All 44 Rows |
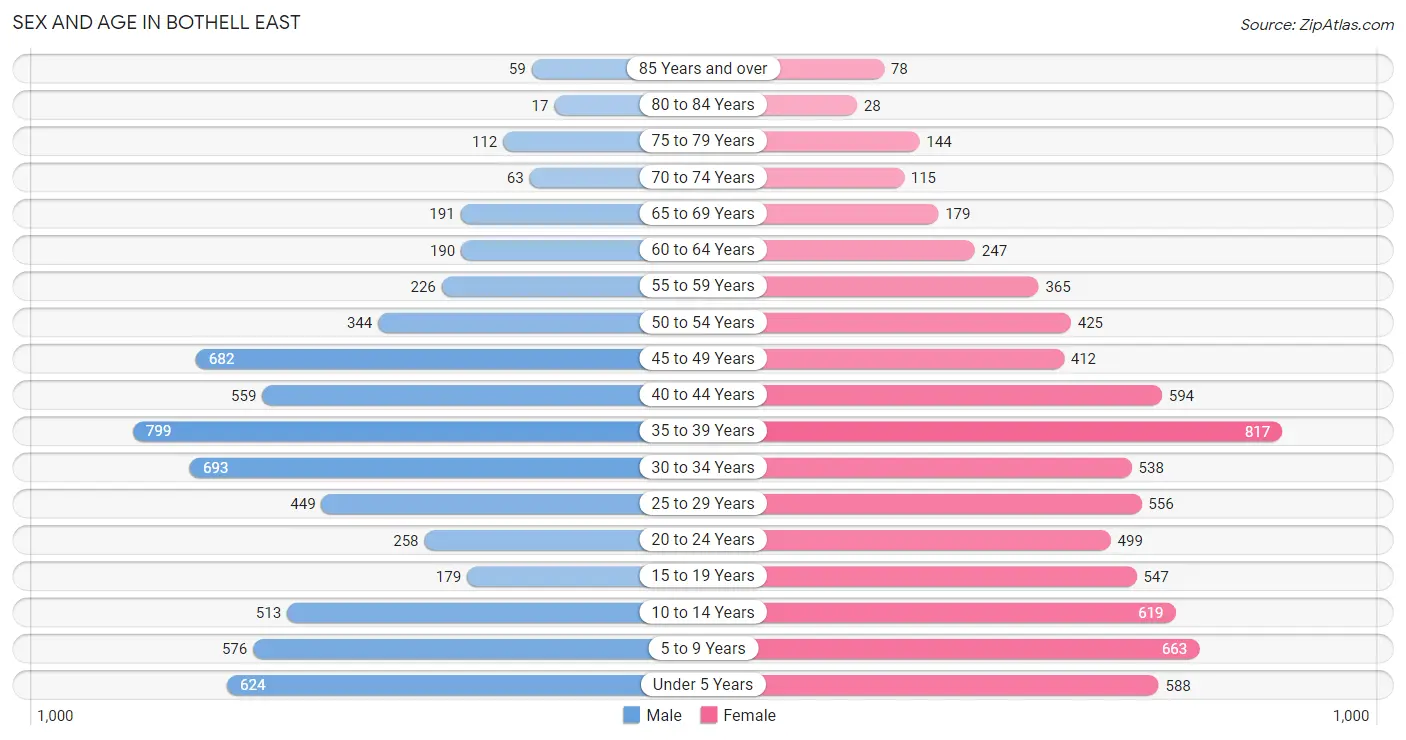
Sex and Age in Bothell East
Sex and Age in Bothell East
The most populous age groups in Bothell East are 35 to 39 Years (799 | 12.2%) for men and 35 to 39 Years (817 | 11.0%) for women.
| Age Bracket | Male | Female |
| Under 5 Years | 624 (9.6%) | 588 (7.9%) |
| 5 to 9 Years | 576 (8.8%) | 663 (8.9%) |
| 10 to 14 Years | 513 (7.9%) | 619 (8.4%) |
| 15 to 19 Years | 179 (2.7%) | 547 (7.4%) |
| 20 to 24 Years | 258 (4.0%) | 499 (6.7%) |
| 25 to 29 Years | 449 (6.9%) | 556 (7.5%) |
| 30 to 34 Years | 693 (10.6%) | 538 (7.3%) |
| 35 to 39 Years | 799 (12.2%) | 817 (11.0%) |
| 40 to 44 Years | 559 (8.6%) | 594 (8.0%) |
| 45 to 49 Years | 682 (10.4%) | 412 (5.6%) |
| 50 to 54 Years | 344 (5.3%) | 425 (5.7%) |
| 55 to 59 Years | 226 (3.5%) | 365 (4.9%) |
| 60 to 64 Years | 190 (2.9%) | 247 (3.3%) |
| 65 to 69 Years | 191 (2.9%) | 179 (2.4%) |
| 70 to 74 Years | 63 (1.0%) | 115 (1.5%) |
| 75 to 79 Years | 112 (1.7%) | 144 (1.9%) |
| 80 to 84 Years | 17 (0.3%) | 28 (0.4%) |
| 85 Years and over | 59 (0.9%) | 78 (1.1%) |
| Total | 6,534 (100.0%) | 7,414 (100.0%) |
Families and Households in Bothell East
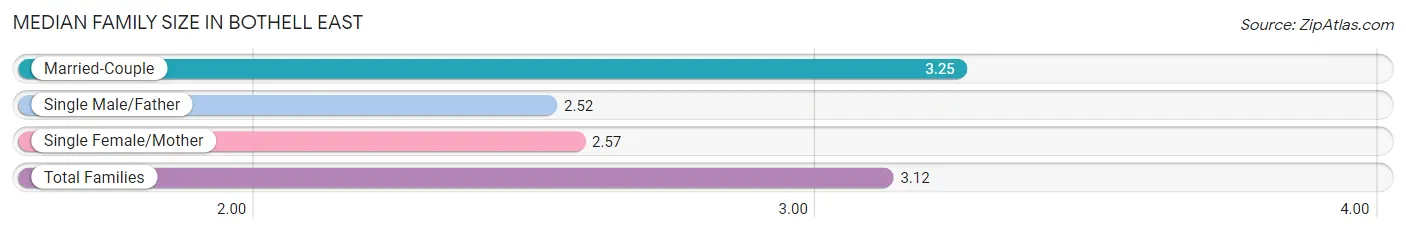
Median Family Size in Bothell East
The median family size in Bothell East is 3.12 persons per family, with married-couple families (3,228 | 81.5%) accounting for the largest median family size of 3.25 persons per family. On the other hand, single male/father families (392 | 9.9%) represent the smallest median family size with 2.52 persons per family.
| Family Type | # Families | Family Size |
| Married-Couple | 3,228 (81.5%) | 3.25 |
| Single Male/Father | 392 (9.9%) | 2.52 |
| Single Female/Mother | 340 (8.6%) | 2.57 |
| Total Families | 3,960 (100.0%) | 3.12 |
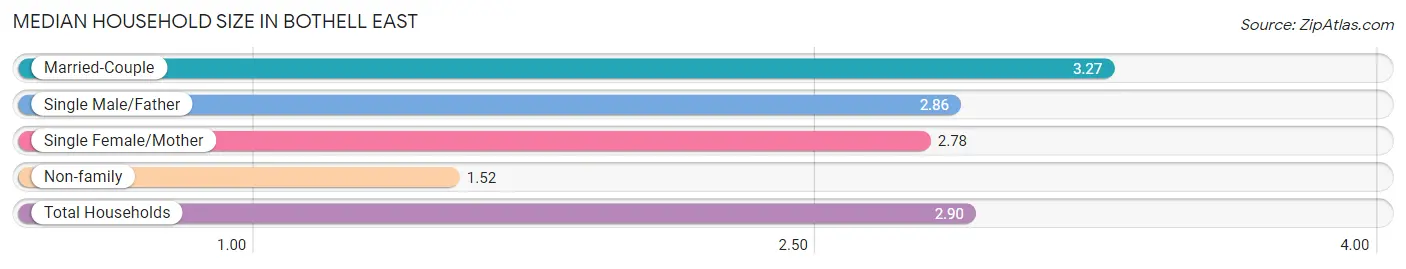
Median Household Size in Bothell East
The median household size in Bothell East is 2.90 persons per household, with married-couple households (3,228 | 67.4%) accounting for the largest median household size of 3.27 persons per household. non-family households (828 | 17.3%) represent the smallest median household size with 1.52 persons per household.
| Household Type | # Households | Household Size |
| Married-Couple | 3,228 (67.4%) | 3.27 |
| Single Male/Father | 392 (8.2%) | 2.86 |
| Single Female/Mother | 340 (7.1%) | 2.78 |
| Non-family | 828 (17.3%) | 1.52 |
| Total Households | 4,788 (100.0%) | 2.90 |
Household Size by Marriage Status in Bothell East
Out of a total of 4,788 households in Bothell East, 3,960 (82.7%) are family households, while 828 (17.3%) are nonfamily households. The most numerous type of family households are 2-person households, comprising 1,258, and the most common type of nonfamily households are 1-person households, comprising 560.
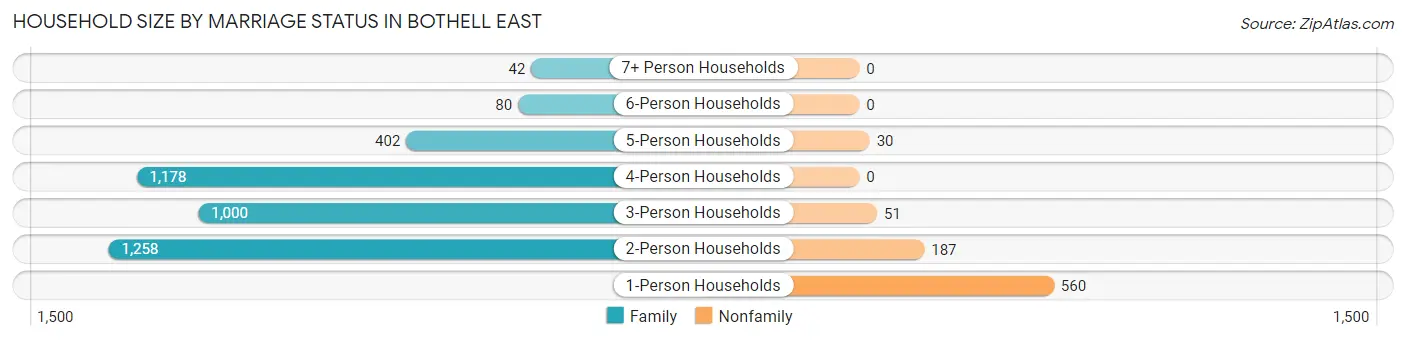
| Household Size | Family Households | Nonfamily Households |
| 1-Person Households | - | 560 (11.7%) |
| 2-Person Households | 1,258 (26.3%) | 187 (3.9%) |
| 3-Person Households | 1,000 (20.9%) | 51 (1.1%) |
| 4-Person Households | 1,178 (24.6%) | 0 (0.0%) |
| 5-Person Households | 402 (8.4%) | 30 (0.6%) |
| 6-Person Households | 80 (1.7%) | 0 (0.0%) |
| 7+ Person Households | 42 (0.9%) | 0 (0.0%) |
| Total | 3,960 (82.7%) | 828 (17.3%) |
Female Fertility in Bothell East
Fertility by Age in Bothell East
Average fertility rate in Bothell East is 67.0 births per 1,000 women. Women in the age bracket of 20 to 34 years have the highest fertility rate with 116.0 births per 1,000 women. Women in the age bracket of 20 to 34 years acount for 69.0% of all women with births.
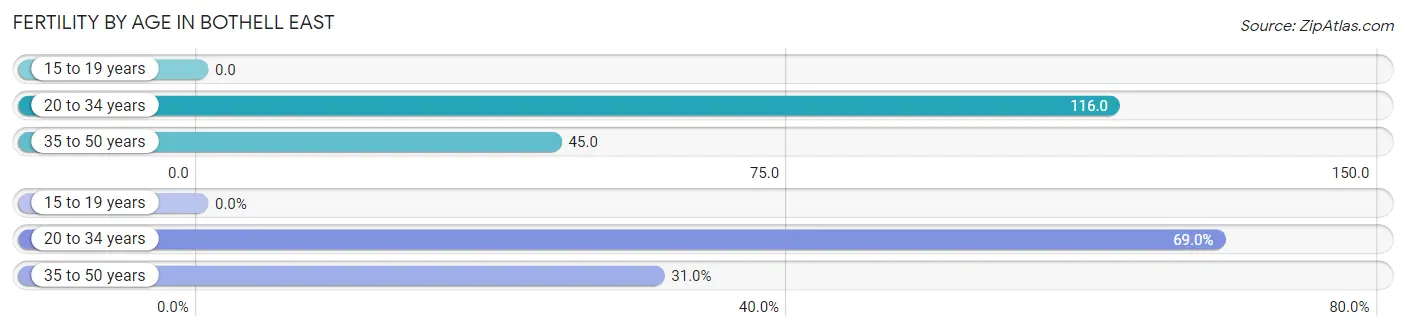
| Age Bracket | Women with Births | Births / 1,000 Women |
| 15 to 19 years | 0 (0.0%) | 0.0 |
| 20 to 34 years | 185 (69.0%) | 116.0 |
| 35 to 50 years | 83 (31.0%) | 45.0 |
| Total | 268 (100.0%) | 67.0 |
Fertility by Age by Marriage Status in Bothell East
76.9% of women with births (268) in Bothell East are married. The highest percentage of unmarried women with births falls into 20 to 34 years age bracket with 33.5% of them unmarried at the time of birth, while the lowest percentage of unmarried women with births belong to 35 to 50 years age bracket with 0.0% of them unmarried.
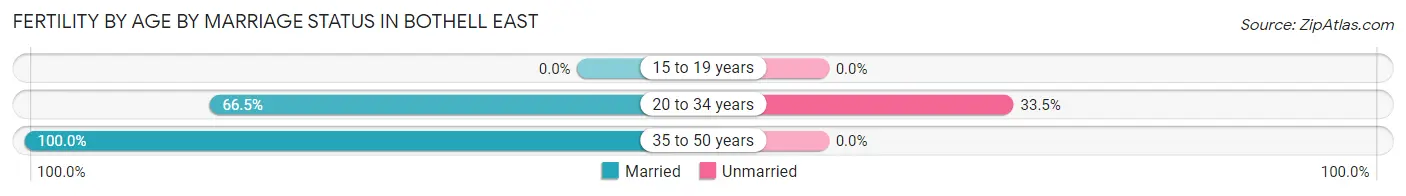
| Age Bracket | Married | Unmarried |
| 15 to 19 years | 0 (0.0%) | 0 (0.0%) |
| 20 to 34 years | 123 (66.5%) | 62 (33.5%) |
| 35 to 50 years | 83 (100.0%) | 0 (0.0%) |
| Total | 206 (76.9%) | 62 (23.1%) |
Fertility by Education in Bothell East
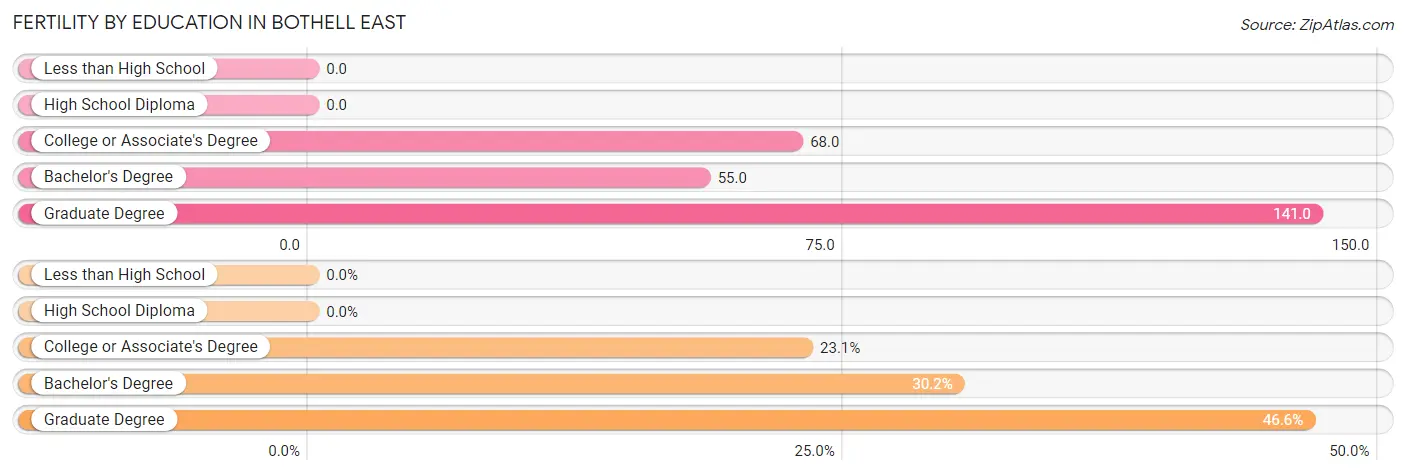
| Educational Attainment | Women with Births | Births / 1,000 Women |
| Less than High School | 0 (0.0%) | 0.0 |
| High School Diploma | 0 (0.0%) | 0.0 |
| College or Associate's Degree | 62 (23.1%) | 68.0 |
| Bachelor's Degree | 81 (30.2%) | 55.0 |
| Graduate Degree | 125 (46.6%) | 141.0 |
| Total | 268 (100.0%) | 67.0 |
Fertility by Education by Marriage Status in Bothell East
23.1% of women with births in Bothell East are unmarried. Women with the educational attainment of bachelor's degree are most likely to be married with 100.0% of them married at childbirth, while women with the educational attainment of college or associate's degree are least likely to be married with 100.0% of them unmarried at childbirth.
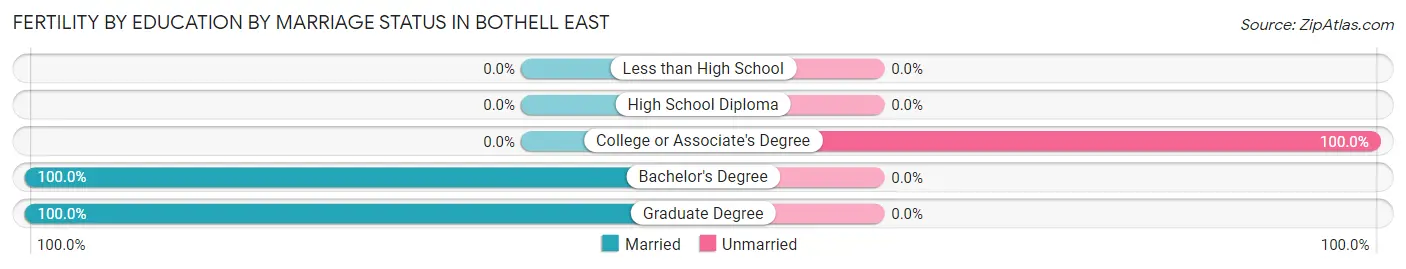
| Educational Attainment | Married | Unmarried |
| Less than High School | 0 (0.0%) | 0 (0.0%) |
| High School Diploma | 0 (0.0%) | 0 (0.0%) |
| College or Associate's Degree | 0 (0.0%) | 62 (100.0%) |
| Bachelor's Degree | 81 (100.0%) | 0 (0.0%) |
| Graduate Degree | 125 (100.0%) | 0 (0.0%) |
| Total | 206 (76.9%) | 62 (23.1%) |
Employment Characteristics in Bothell East
Employment by Class of Employer in Bothell East
Among the 7,206 employed individuals in Bothell East, private company employees (6,101 | 84.7%), not-for-profit organizations (365 | 5.1%), and state government employees (263 | 3.6%) make up the most common classes of employment.
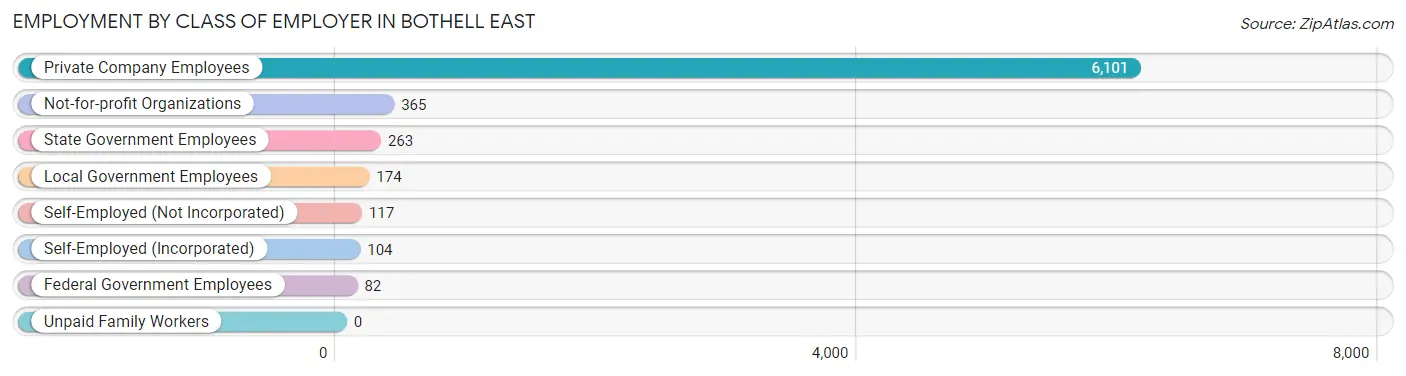
| Employer Class | # Employees | % Employees |
| Private Company Employees | 6,101 | 84.7% |
| Self-Employed (Incorporated) | 104 | 1.4% |
| Self-Employed (Not Incorporated) | 117 | 1.6% |
| Not-for-profit Organizations | 365 | 5.1% |
| Local Government Employees | 174 | 2.4% |
| State Government Employees | 263 | 3.6% |
| Federal Government Employees | 82 | 1.1% |
| Unpaid Family Workers | 0 | 0.0% |
| Total | 7,206 | 100.0% |
Employment Status by Age in Bothell East
According to the labor force statistics for Bothell East, out of the total population over 16 years of age (10,110), 74.8% or 7,562 individuals are in the labor force, with 3.7% or 280 of them unemployed. The age group with the highest labor force participation rate is 25 to 29 years, with 96.8% or 973 individuals in the labor force. Within the labor force, the 75 years and over age range has the highest percentage of unemployed individuals, with 67.7% or 21 of them being unemployed.
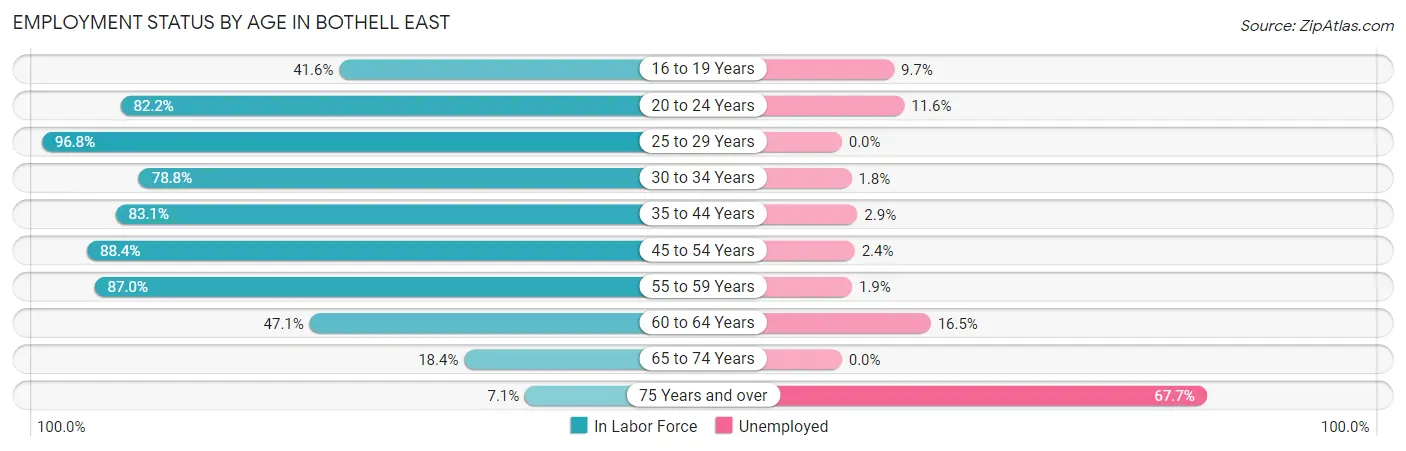
| Age Bracket | In Labor Force | Unemployed |
| 16 to 19 Years | 196 (41.6%) | 19 (9.7%) |
| 20 to 24 Years | 622 (82.2%) | 72 (11.6%) |
| 25 to 29 Years | 973 (96.8%) | 0 (0.0%) |
| 30 to 34 Years | 970 (78.8%) | 17 (1.8%) |
| 35 to 44 Years | 2,301 (83.1%) | 67 (2.9%) |
| 45 to 54 Years | 1,647 (88.4%) | 40 (2.4%) |
| 55 to 59 Years | 514 (87.0%) | 10 (1.9%) |
| 60 to 64 Years | 206 (47.1%) | 34 (16.5%) |
| 65 to 74 Years | 101 (18.4%) | 0 (0.0%) |
| 75 Years and over | 31 (7.1%) | 21 (67.7%) |
| Total | 7,562 (74.8%) | 280 (3.7%) |
Employment Status by Educational Attainment in Bothell East
According to labor force statistics for Bothell East, 83.7% of individuals (6,609) out of the total population between 25 and 64 years of age (7,896) are in the labor force, with 2.5% or 165 of them being unemployed. The group with the highest labor force participation rate are those with the educational attainment of bachelor's degree or higher, with 86.4% or 4,647 individuals in the labor force. Within the labor force, individuals with college / associate degree education have the highest percentage of unemployment, with 3.3% or 40 of them being unemployed.
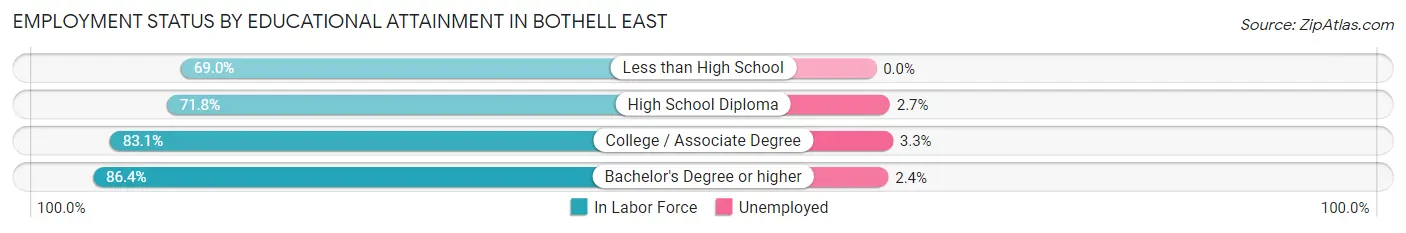
| Educational Attainment | In Labor Force | Unemployed |
| Less than High School | 129 (69.0%) | 0 (0.0%) |
| High School Diploma | 629 (71.8%) | 24 (2.7%) |
| College / Associate Degree | 1,208 (83.1%) | 48 (3.3%) |
| Bachelor's Degree or higher | 4,647 (86.4%) | 129 (2.4%) |
| Total | 6,609 (83.7%) | 197 (2.5%) |
Employment Occupations by Sex in Bothell East
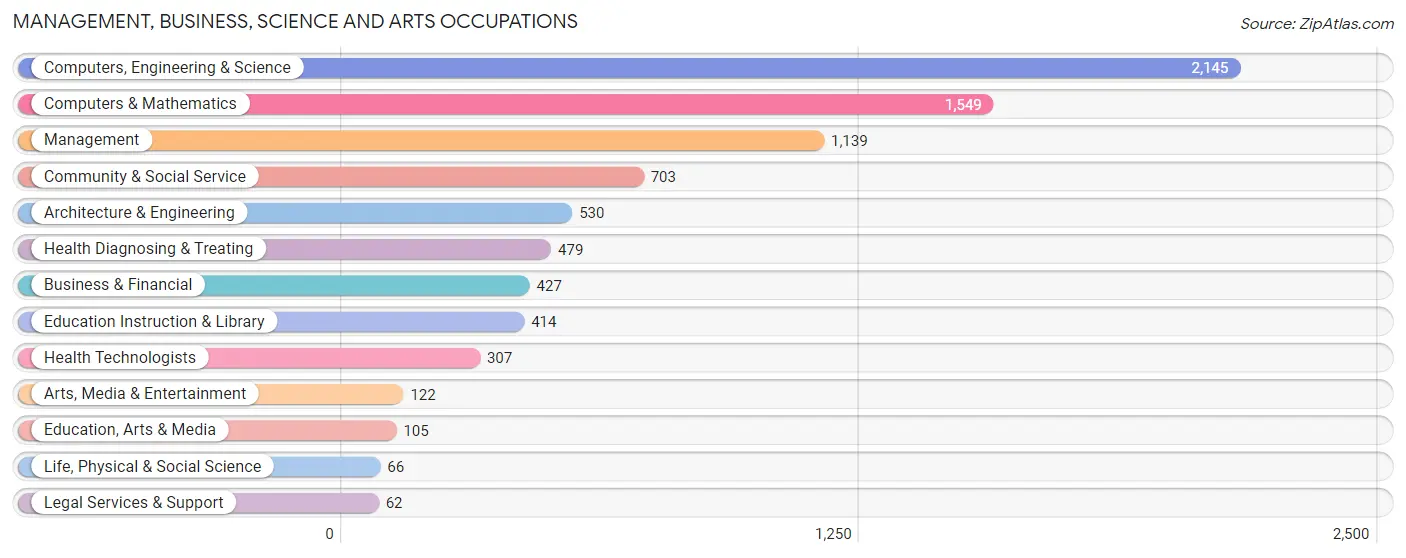
Management, Business, Science and Arts Occupations
The most common Management, Business, Science and Arts occupations in Bothell East are Computers, Engineering & Science (2,145 | 29.5%), Computers & Mathematics (1,549 | 21.3%), Management (1,139 | 15.7%), Community & Social Service (703 | 9.7%), and Architecture & Engineering (530 | 7.3%).
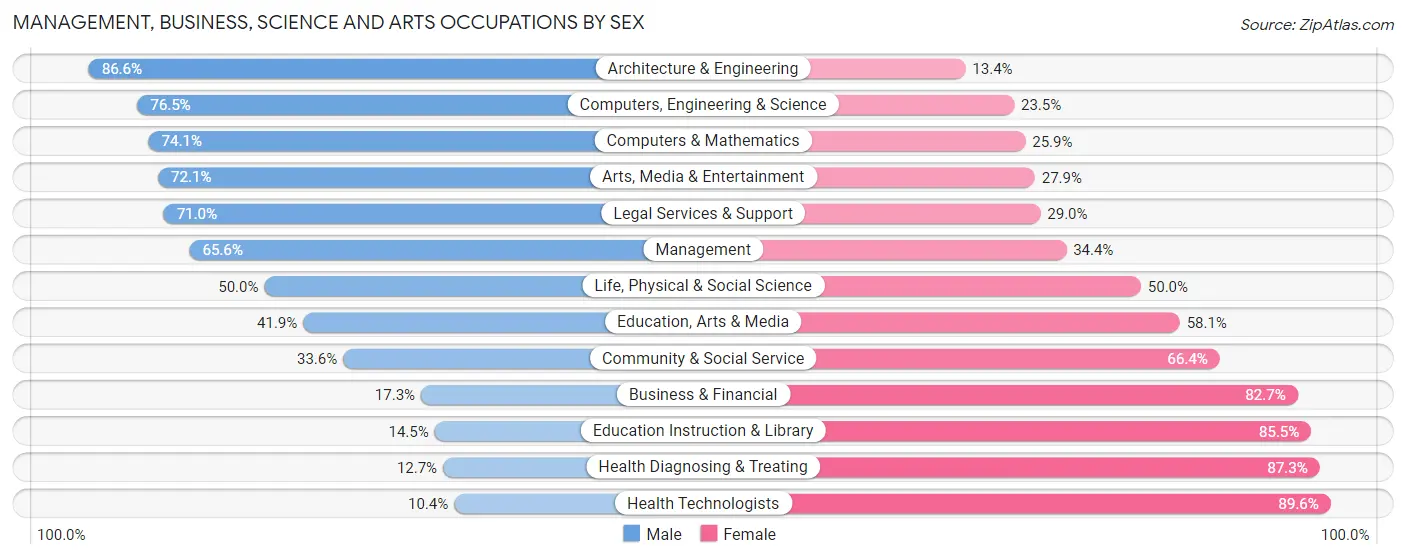
Management, Business, Science and Arts Occupations by Sex
Within the Management, Business, Science and Arts occupations in Bothell East, the most male-oriented occupations are Architecture & Engineering (86.6%), Computers, Engineering & Science (76.5%), and Computers & Mathematics (74.1%), while the most female-oriented occupations are Health Technologists (89.6%), Health Diagnosing & Treating (87.3%), and Education Instruction & Library (85.5%).
| Occupation | Male | Female |
| Management | 747 (65.6%) | 392 (34.4%) |
| Business & Financial | 74 (17.3%) | 353 (82.7%) |
| Computers, Engineering & Science | 1,640 (76.5%) | 505 (23.5%) |
| Computers & Mathematics | 1,148 (74.1%) | 401 (25.9%) |
| Architecture & Engineering | 459 (86.6%) | 71 (13.4%) |
| Life, Physical & Social Science | 33 (50.0%) | 33 (50.0%) |
| Community & Social Service | 236 (33.6%) | 467 (66.4%) |
| Education, Arts & Media | 44 (41.9%) | 61 (58.1%) |
| Legal Services & Support | 44 (71.0%) | 18 (29.0%) |
| Education Instruction & Library | 60 (14.5%) | 354 (85.5%) |
| Arts, Media & Entertainment | 88 (72.1%) | 34 (27.9%) |
| Health Diagnosing & Treating | 61 (12.7%) | 418 (87.3%) |
| Health Technologists | 32 (10.4%) | 275 (89.6%) |
| Total (Category) | 2,758 (56.4%) | 2,135 (43.6%) |
| Total (Overall) | 3,860 (53.1%) | 3,403 (46.9%) |
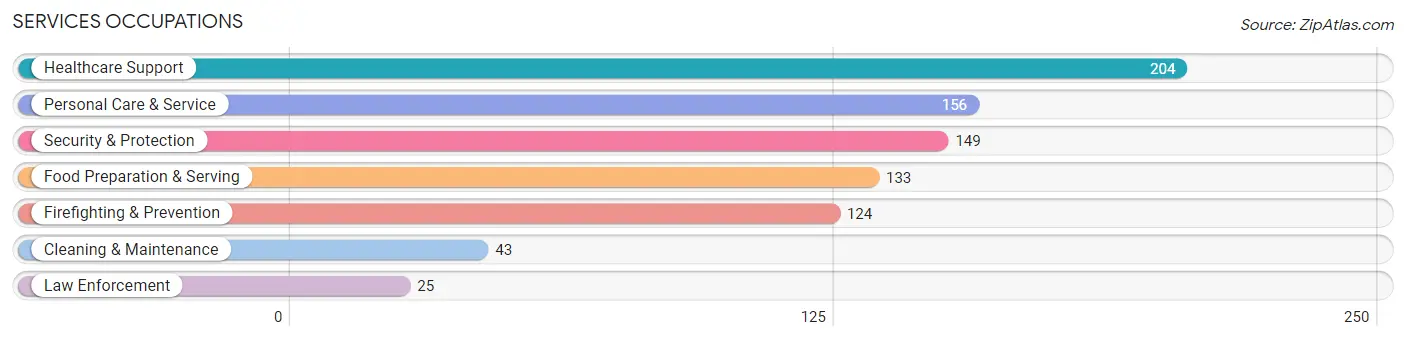
Services Occupations
The most common Services occupations in Bothell East are Healthcare Support (204 | 2.8%), Personal Care & Service (156 | 2.1%), Security & Protection (149 | 2.1%), Food Preparation & Serving (133 | 1.8%), and Firefighting & Prevention (124 | 1.7%).
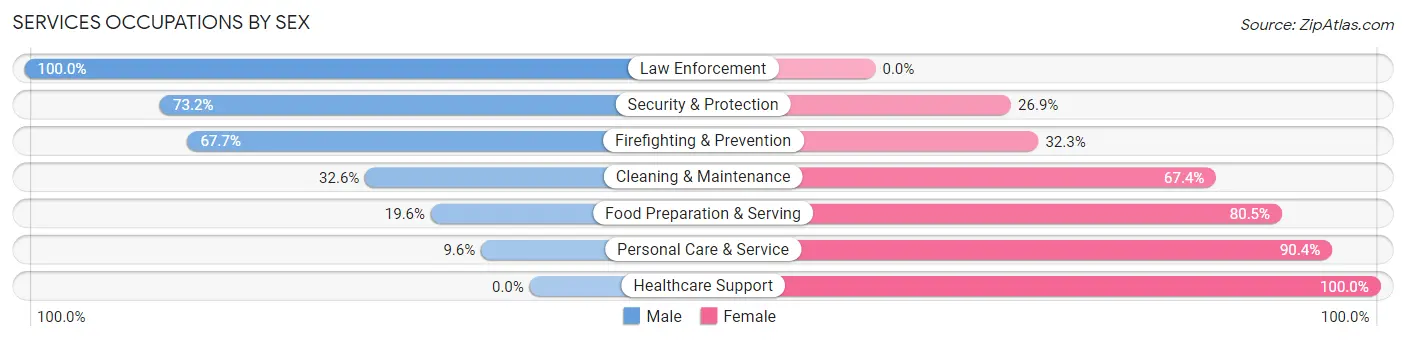
Services Occupations by Sex
Within the Services occupations in Bothell East, the most male-oriented occupations are Law Enforcement (100.0%), Security & Protection (73.2%), and Firefighting & Prevention (67.7%), while the most female-oriented occupations are Healthcare Support (100.0%), Personal Care & Service (90.4%), and Food Preparation & Serving (80.4%).
| Occupation | Male | Female |
| Healthcare Support | 0 (0.0%) | 204 (100.0%) |
| Security & Protection | 109 (73.2%) | 40 (26.9%) |
| Firefighting & Prevention | 84 (67.7%) | 40 (32.3%) |
| Law Enforcement | 25 (100.0%) | 0 (0.0%) |
| Food Preparation & Serving | 26 (19.6%) | 107 (80.4%) |
| Cleaning & Maintenance | 14 (32.6%) | 29 (67.4%) |
| Personal Care & Service | 15 (9.6%) | 141 (90.4%) |
| Total (Category) | 164 (23.9%) | 521 (76.1%) |
| Total (Overall) | 3,860 (53.1%) | 3,403 (46.9%) |
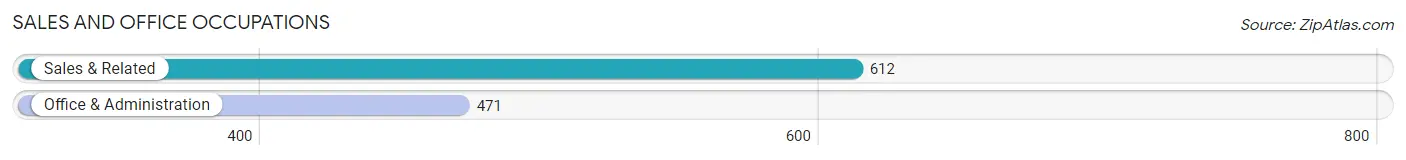
Sales and Office Occupations
The most common Sales and Office occupations in Bothell East are Sales & Related (612 | 8.4%), and Office & Administration (471 | 6.5%).
Sales and Office Occupations by Sex
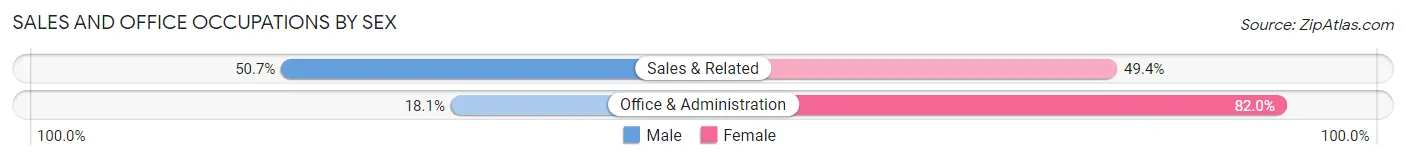
| Occupation | Male | Female |
| Sales & Related | 310 (50.6%) | 302 (49.3%) |
| Office & Administration | 85 (18.0%) | 386 (82.0%) |
| Total (Category) | 395 (36.5%) | 688 (63.5%) |
| Total (Overall) | 3,860 (53.1%) | 3,403 (46.9%) |
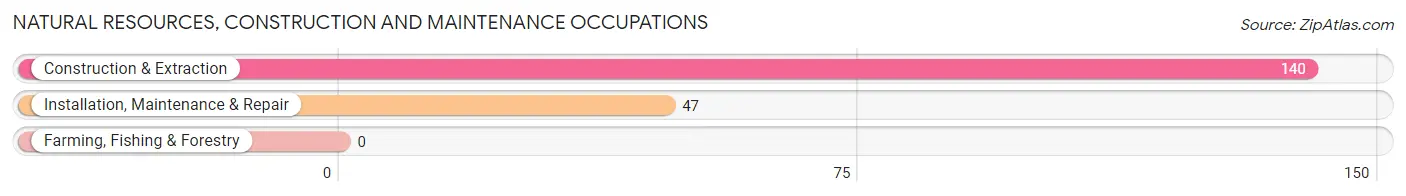
Natural Resources, Construction and Maintenance Occupations
The most common Natural Resources, Construction and Maintenance occupations in Bothell East are Construction & Extraction (140 | 1.9%), and Installation, Maintenance & Repair (47 | 0.6%).
Natural Resources, Construction and Maintenance Occupations by Sex
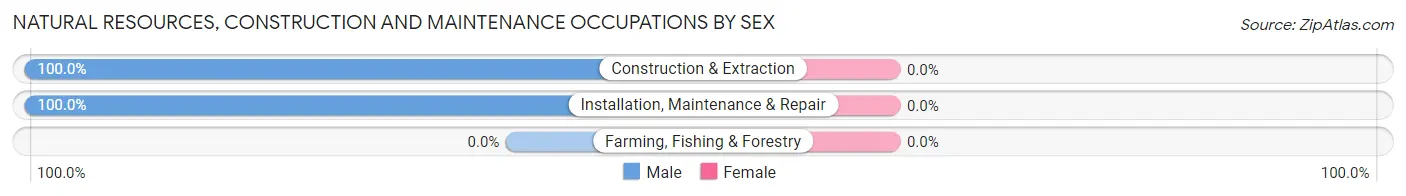
| Occupation | Male | Female |
| Farming, Fishing & Forestry | 0 (0.0%) | 0 (0.0%) |
| Construction & Extraction | 140 (100.0%) | 0 (0.0%) |
| Installation, Maintenance & Repair | 47 (100.0%) | 0 (0.0%) |
| Total (Category) | 187 (100.0%) | 0 (0.0%) |
| Total (Overall) | 3,860 (53.1%) | 3,403 (46.9%) |
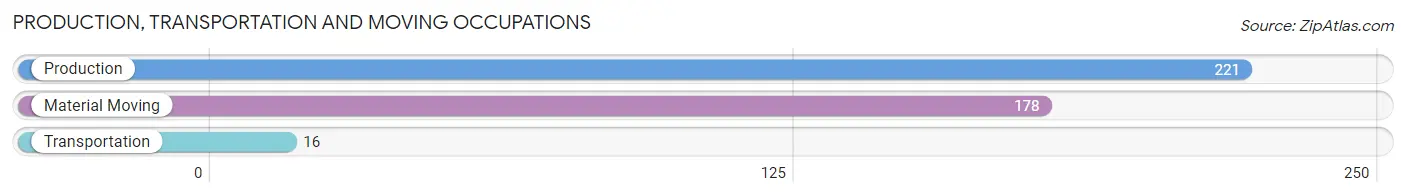
Production, Transportation and Moving Occupations
The most common Production, Transportation and Moving occupations in Bothell East are Production (221 | 3.0%), Material Moving (178 | 2.5%), and Transportation (16 | 0.2%).
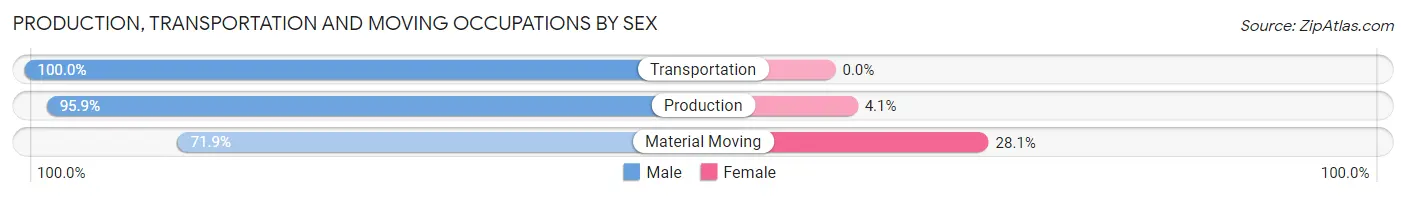
Production, Transportation and Moving Occupations by Sex
| Occupation | Male | Female |
| Production | 212 (95.9%) | 9 (4.1%) |
| Transportation | 16 (100.0%) | 0 (0.0%) |
| Material Moving | 128 (71.9%) | 50 (28.1%) |
| Total (Category) | 356 (85.8%) | 59 (14.2%) |
| Total (Overall) | 3,860 (53.1%) | 3,403 (46.9%) |
Employment Industries by Sex in Bothell East
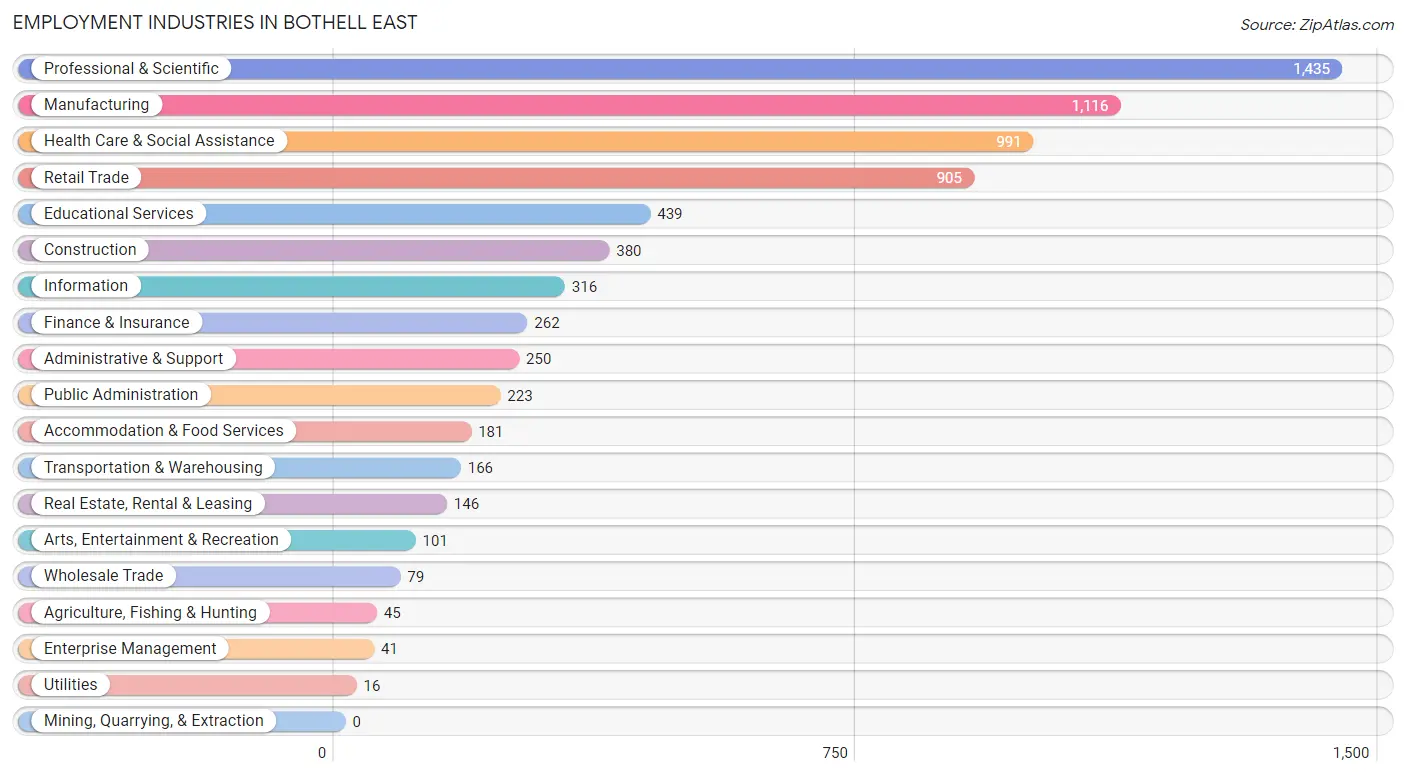
Employment Industries in Bothell East
The major employment industries in Bothell East include Professional & Scientific (1,435 | 19.8%), Manufacturing (1,116 | 15.4%), Health Care & Social Assistance (991 | 13.6%), Retail Trade (905 | 12.5%), and Educational Services (439 | 6.0%).
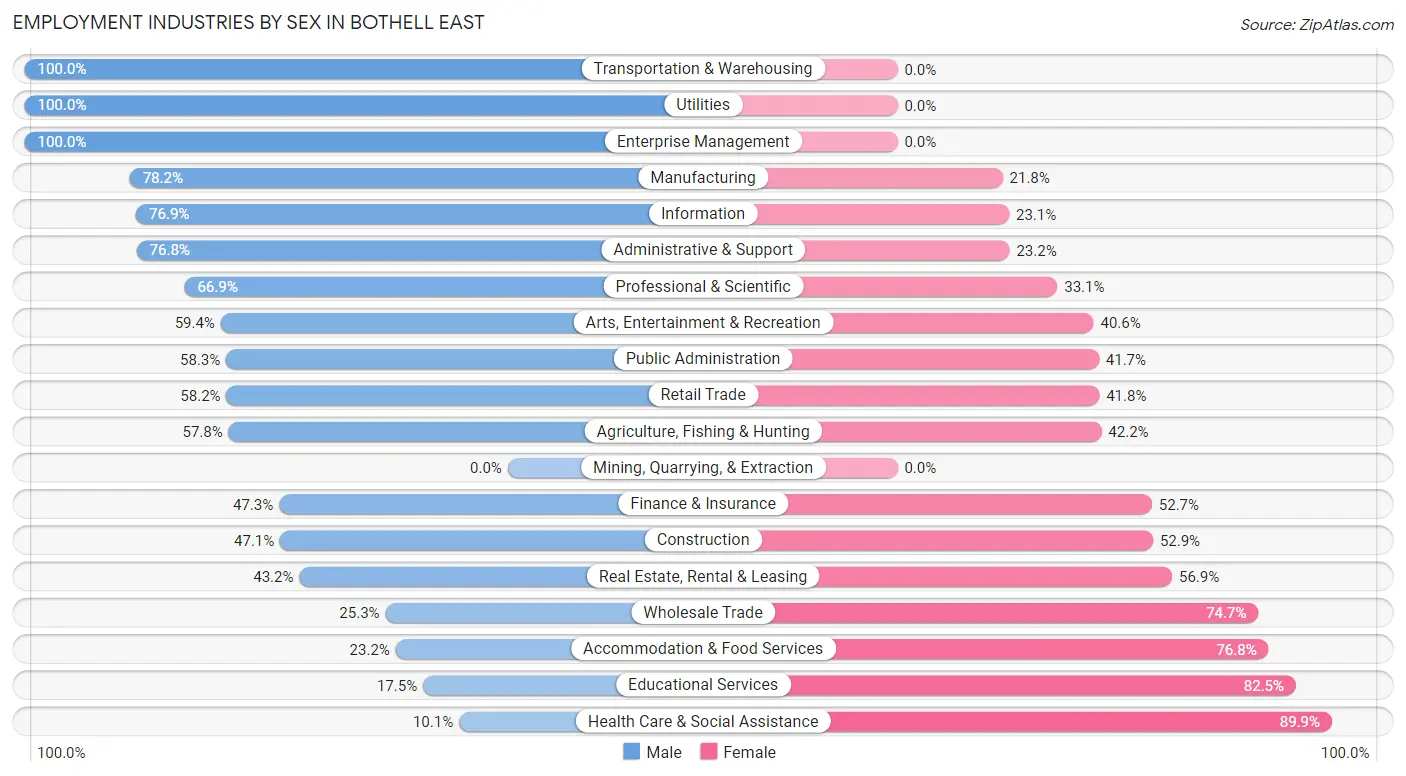
Employment Industries by Sex in Bothell East
The Bothell East industries that see more men than women are Transportation & Warehousing (100.0%), Utilities (100.0%), and Enterprise Management (100.0%), whereas the industries that tend to have a higher number of women are Health Care & Social Assistance (89.9%), Educational Services (82.5%), and Accommodation & Food Services (76.8%).
| Industry | Male | Female |
| Agriculture, Fishing & Hunting | 26 (57.8%) | 19 (42.2%) |
| Mining, Quarrying, & Extraction | 0 (0.0%) | 0 (0.0%) |
| Construction | 179 (47.1%) | 201 (52.9%) |
| Manufacturing | 873 (78.2%) | 243 (21.8%) |
| Wholesale Trade | 20 (25.3%) | 59 (74.7%) |
| Retail Trade | 527 (58.2%) | 378 (41.8%) |
| Transportation & Warehousing | 166 (100.0%) | 0 (0.0%) |
| Utilities | 16 (100.0%) | 0 (0.0%) |
| Information | 243 (76.9%) | 73 (23.1%) |
| Finance & Insurance | 124 (47.3%) | 138 (52.7%) |
| Real Estate, Rental & Leasing | 63 (43.1%) | 83 (56.9%) |
| Professional & Scientific | 960 (66.9%) | 475 (33.1%) |
| Enterprise Management | 41 (100.0%) | 0 (0.0%) |
| Administrative & Support | 192 (76.8%) | 58 (23.2%) |
| Educational Services | 77 (17.5%) | 362 (82.5%) |
| Health Care & Social Assistance | 100 (10.1%) | 891 (89.9%) |
| Arts, Entertainment & Recreation | 60 (59.4%) | 41 (40.6%) |
| Accommodation & Food Services | 42 (23.2%) | 139 (76.8%) |
| Public Administration | 130 (58.3%) | 93 (41.7%) |
| Total | 3,860 (53.1%) | 3,403 (46.9%) |
Education in Bothell East
School Enrollment in Bothell East
The most common levels of schooling among the 4,025 students in Bothell East are elementary school (1,046 | 26.0%), middle school (859 | 21.3%), and high school (694 | 17.2%).
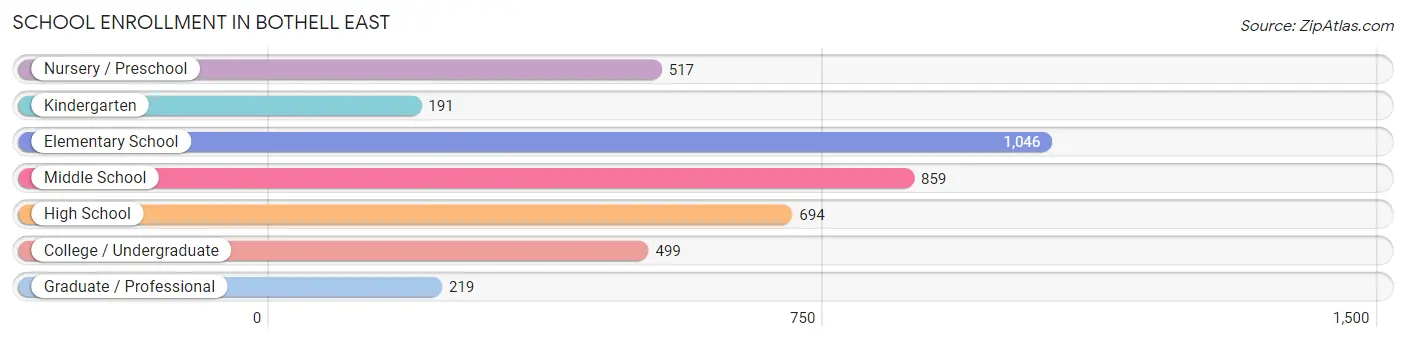
| School Level | # Students | % Students |
| Nursery / Preschool | 517 | 12.8% |
| Kindergarten | 191 | 4.8% |
| Elementary School | 1,046 | 26.0% |
| Middle School | 859 | 21.3% |
| High School | 694 | 17.2% |
| College / Undergraduate | 499 | 12.4% |
| Graduate / Professional | 219 | 5.4% |
| Total | 4,025 | 100.0% |
School Enrollment by Age by Funding Source in Bothell East
Out of a total of 4,025 students who are enrolled in schools in Bothell East, 805 (20.0%) attend a private institution, while the remaining 3,220 (80.0%) are enrolled in public schools. The age group of 3 to 4 year olds has the highest likelihood of being enrolled in private schools, with 283 (72.9% in the age bracket) enrolled. Conversely, the age group of 18 to 19 year olds has the lowest likelihood of being enrolled in a private school, with 77 (100.0% in the age bracket) attending a public institution.
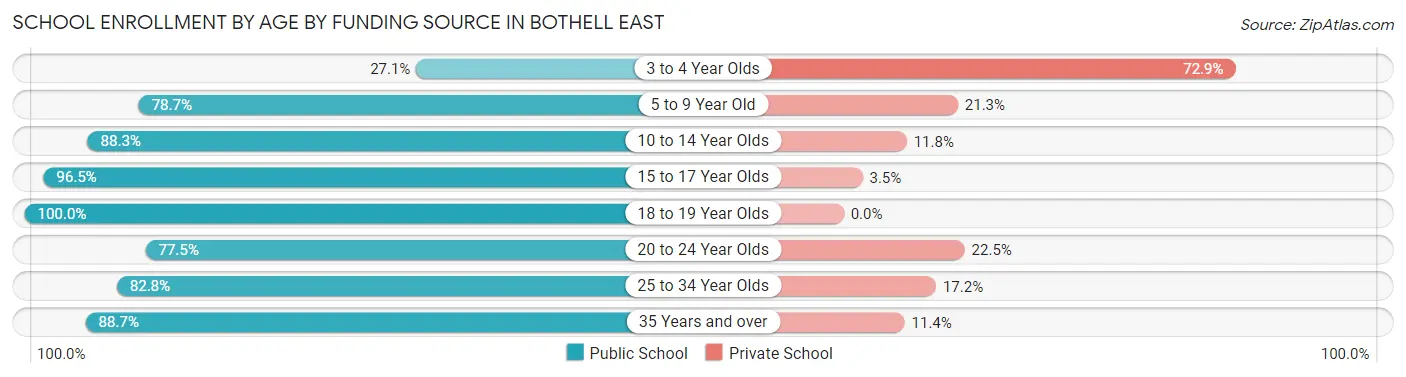
| Age Bracket | Public School | Private School |
| 3 to 4 Year Olds | 105 (27.1%) | 283 (72.9%) |
| 5 to 9 Year Old | 951 (78.7%) | 257 (21.3%) |
| 10 to 14 Year Olds | 999 (88.2%) | 133 (11.7%) |
| 15 to 17 Year Olds | 550 (96.5%) | 20 (3.5%) |
| 18 to 19 Year Olds | 77 (100.0%) | 0 (0.0%) |
| 20 to 24 Year Olds | 227 (77.5%) | 66 (22.5%) |
| 25 to 34 Year Olds | 106 (82.8%) | 22 (17.2%) |
| 35 Years and over | 203 (88.6%) | 26 (11.4%) |
| Total | 3,220 (80.0%) | 805 (20.0%) |
Educational Attainment by Field of Study in Bothell East
Engineering (1,586 | 26.2%), computers & mathematics (951 | 15.7%), business (813 | 13.4%), science & technology (399 | 6.6%), and social sciences (395 | 6.5%) are the most common fields of study among 6,049 individuals in Bothell East who have obtained a bachelor's degree or higher.
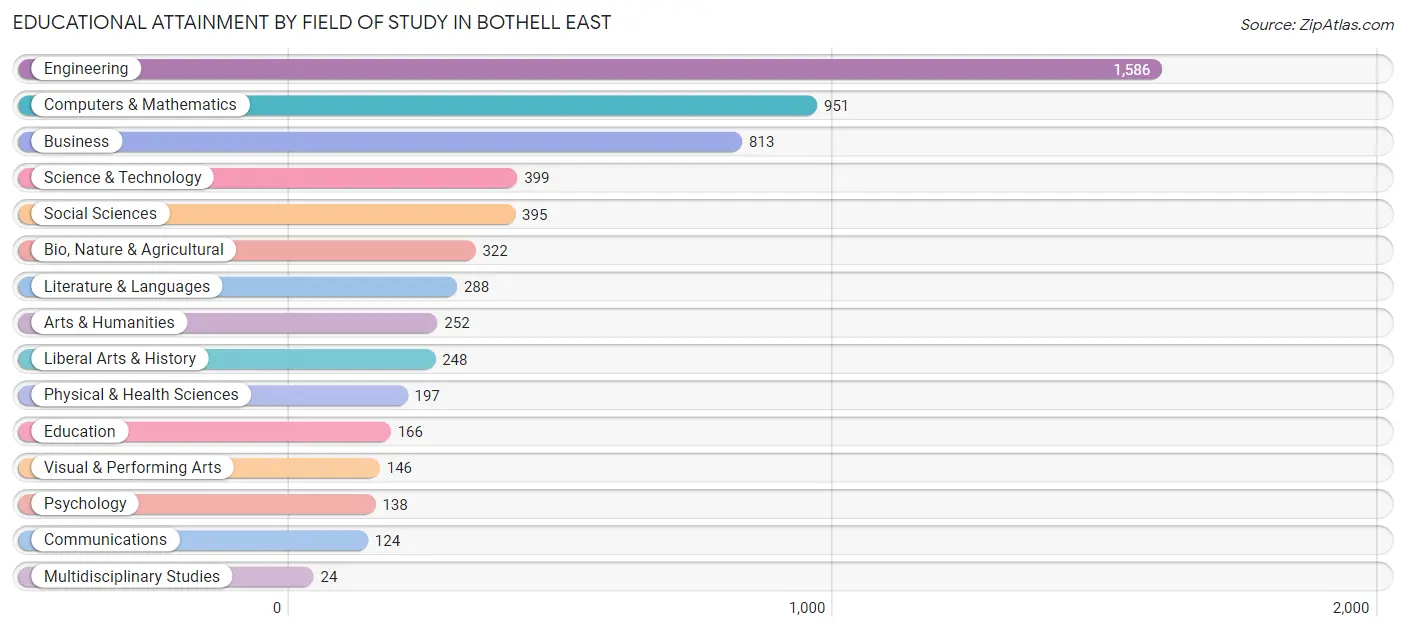
| Field of Study | # Graduates | % Graduates |
| Computers & Mathematics | 951 | 15.7% |
| Bio, Nature & Agricultural | 322 | 5.3% |
| Physical & Health Sciences | 197 | 3.3% |
| Psychology | 138 | 2.3% |
| Social Sciences | 395 | 6.5% |
| Engineering | 1,586 | 26.2% |
| Multidisciplinary Studies | 24 | 0.4% |
| Science & Technology | 399 | 6.6% |
| Business | 813 | 13.4% |
| Education | 166 | 2.7% |
| Literature & Languages | 288 | 4.8% |
| Liberal Arts & History | 248 | 4.1% |
| Visual & Performing Arts | 146 | 2.4% |
| Communications | 124 | 2.1% |
| Arts & Humanities | 252 | 4.2% |
| Total | 6,049 | 100.0% |
Transportation & Commute in Bothell East
Vehicle Availability by Sex in Bothell East
The most prevalent vehicle ownership categories in Bothell East are males with 2 vehicles (2,085, accounting for 54.4%) and females with 2 vehicles (1,593, making up 61.8%).
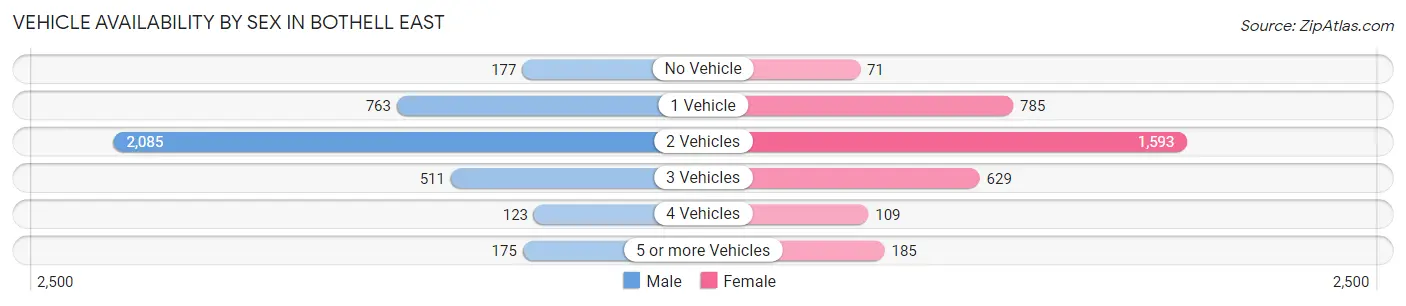
| Vehicles Available | Male | Female |
| No Vehicle | 177 (4.6%) | 71 (2.1%) |
| 1 Vehicle | 763 (19.9%) | 785 (23.3%) |
| 2 Vehicles | 2,085 (54.4%) | 1,593 (47.2%) |
| 3 Vehicles | 511 (13.3%) | 629 (18.6%) |
| 4 Vehicles | 123 (3.2%) | 109 (3.2%) |
| 5 or more Vehicles | 175 (4.6%) | 185 (5.5%) |
| Total | 3,834 (100.0%) | 3,372 (100.0%) |
Commute Time in Bothell East
The most frequently occuring commute durations in Bothell East are 30 to 34 minutes (1,178 commuters, 22.2%), 20 to 24 minutes (765 commuters, 14.4%), and 45 to 59 minutes (722 commuters, 13.6%).
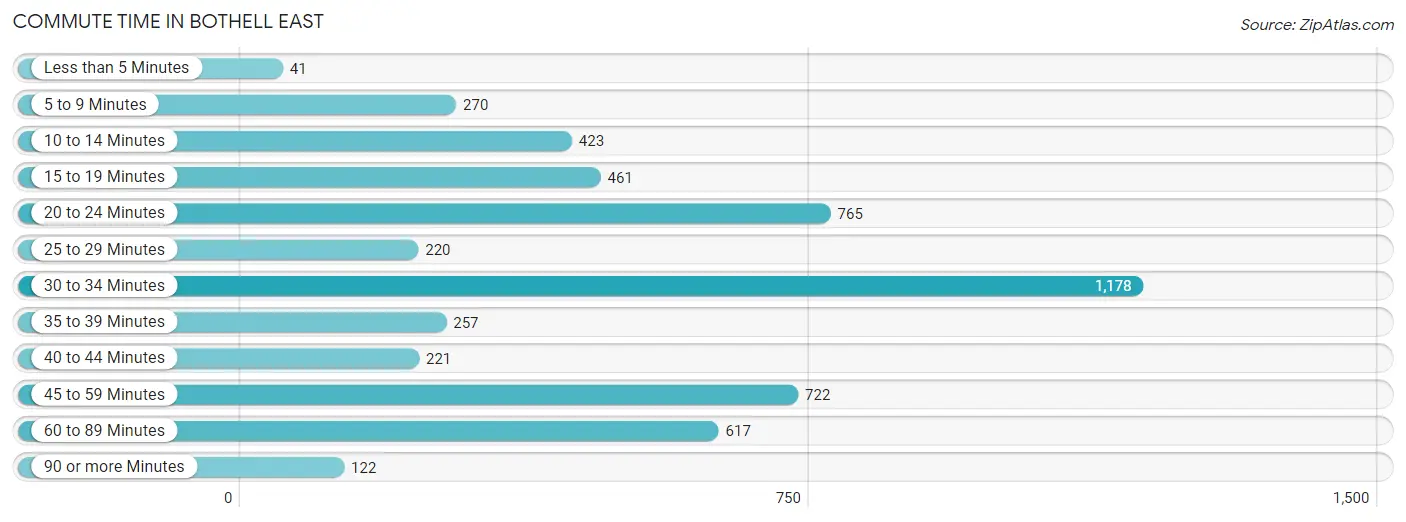
| Commute Time | # Commuters | % Commuters |
| Less than 5 Minutes | 41 | 0.8% |
| 5 to 9 Minutes | 270 | 5.1% |
| 10 to 14 Minutes | 423 | 8.0% |
| 15 to 19 Minutes | 461 | 8.7% |
| 20 to 24 Minutes | 765 | 14.4% |
| 25 to 29 Minutes | 220 | 4.2% |
| 30 to 34 Minutes | 1,178 | 22.2% |
| 35 to 39 Minutes | 257 | 4.9% |
| 40 to 44 Minutes | 221 | 4.2% |
| 45 to 59 Minutes | 722 | 13.6% |
| 60 to 89 Minutes | 617 | 11.7% |
| 90 or more Minutes | 122 | 2.3% |
Commute Time by Sex in Bothell East
The most common commute times in Bothell East are 30 to 34 minutes (703 commuters, 25.2%) for males and 30 to 34 minutes (475 commuters, 19.0%) for females.
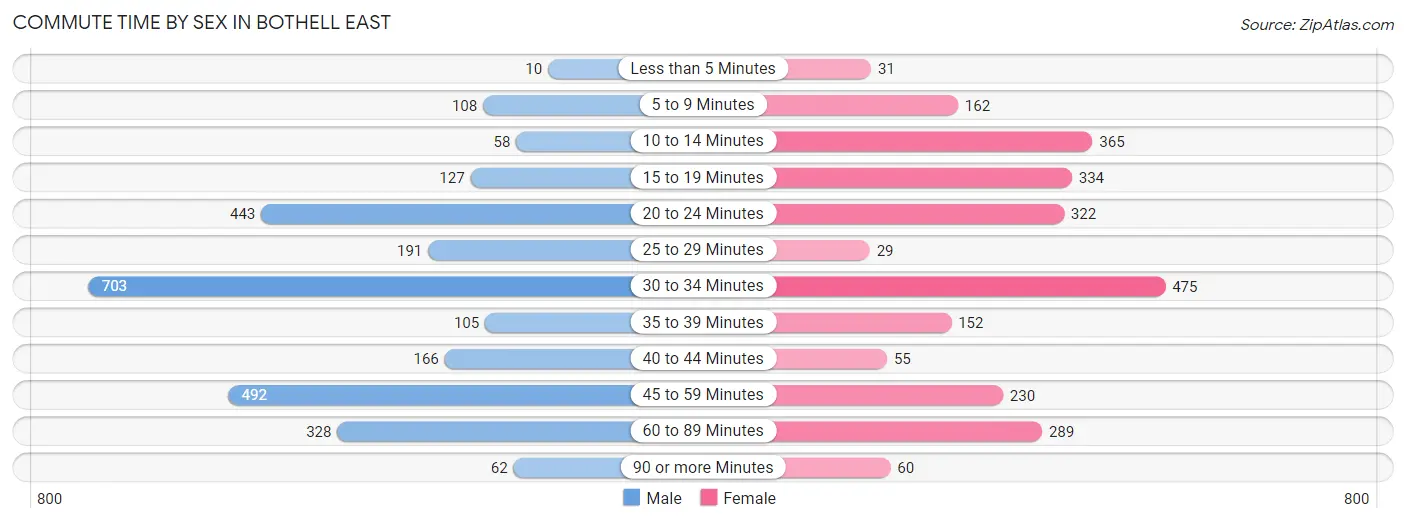
| Commute Time | Male | Female |
| Less than 5 Minutes | 10 (0.4%) | 31 (1.2%) |
| 5 to 9 Minutes | 108 (3.9%) | 162 (6.5%) |
| 10 to 14 Minutes | 58 (2.1%) | 365 (14.6%) |
| 15 to 19 Minutes | 127 (4.5%) | 334 (13.3%) |
| 20 to 24 Minutes | 443 (15.9%) | 322 (12.9%) |
| 25 to 29 Minutes | 191 (6.8%) | 29 (1.2%) |
| 30 to 34 Minutes | 703 (25.2%) | 475 (19.0%) |
| 35 to 39 Minutes | 105 (3.8%) | 152 (6.1%) |
| 40 to 44 Minutes | 166 (5.9%) | 55 (2.2%) |
| 45 to 59 Minutes | 492 (17.6%) | 230 (9.2%) |
| 60 to 89 Minutes | 328 (11.7%) | 289 (11.5%) |
| 90 or more Minutes | 62 (2.2%) | 60 (2.4%) |
Time of Departure to Work by Sex in Bothell East
The most frequent times of departure to work in Bothell East are 9:00 AM to 9:59 AM (427, 15.3%) for males and 8:00 AM to 8:29 AM (502, 20.1%) for females.
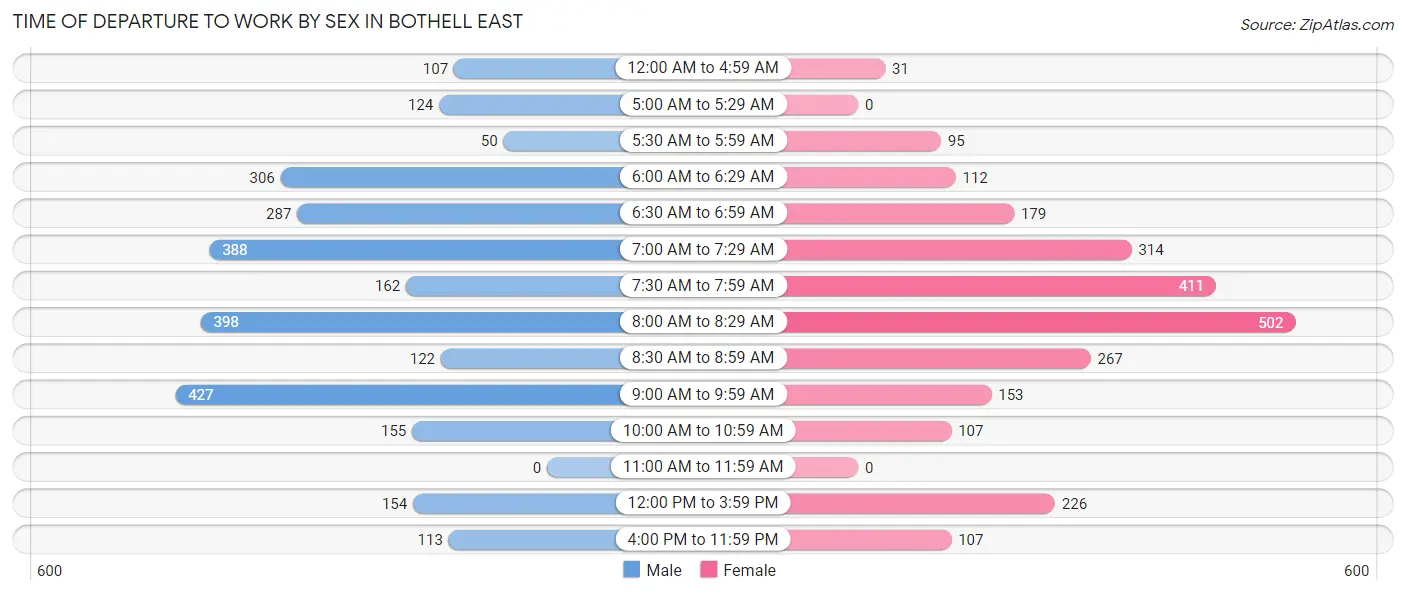
| Time of Departure | Male | Female |
| 12:00 AM to 4:59 AM | 107 (3.8%) | 31 (1.2%) |
| 5:00 AM to 5:29 AM | 124 (4.4%) | 0 (0.0%) |
| 5:30 AM to 5:59 AM | 50 (1.8%) | 95 (3.8%) |
| 6:00 AM to 6:29 AM | 306 (11.0%) | 112 (4.5%) |
| 6:30 AM to 6:59 AM | 287 (10.3%) | 179 (7.1%) |
| 7:00 AM to 7:29 AM | 388 (13.9%) | 314 (12.5%) |
| 7:30 AM to 7:59 AM | 162 (5.8%) | 411 (16.4%) |
| 8:00 AM to 8:29 AM | 398 (14.2%) | 502 (20.1%) |
| 8:30 AM to 8:59 AM | 122 (4.4%) | 267 (10.7%) |
| 9:00 AM to 9:59 AM | 427 (15.3%) | 153 (6.1%) |
| 10:00 AM to 10:59 AM | 155 (5.6%) | 107 (4.3%) |
| 11:00 AM to 11:59 AM | 0 (0.0%) | 0 (0.0%) |
| 12:00 PM to 3:59 PM | 154 (5.5%) | 226 (9.0%) |
| 4:00 PM to 11:59 PM | 113 (4.1%) | 107 (4.3%) |
| Total | 2,793 (100.0%) | 2,504 (100.0%) |
Housing Occupancy in Bothell East
Occupancy by Ownership in Bothell East
Of the total 4,788 dwellings in Bothell East, owner-occupied units account for 2,880 (60.2%), while renter-occupied units make up 1,908 (39.9%).
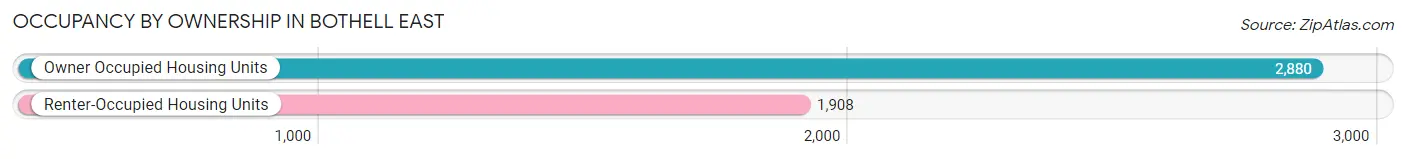
| Occupancy | # Housing Units | % Housing Units |
| Owner Occupied Housing Units | 2,880 | 60.2% |
| Renter-Occupied Housing Units | 1,908 | 39.9% |
| Total Occupied Housing Units | 4,788 | 100.0% |
Occupancy by Household Size in Bothell East
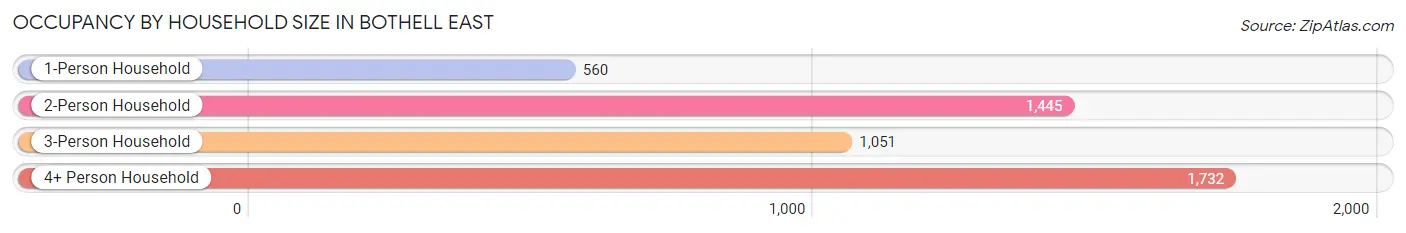
| Household Size | # Housing Units | % Housing Units |
| 1-Person Household | 560 | 11.7% |
| 2-Person Household | 1,445 | 30.2% |
| 3-Person Household | 1,051 | 22.0% |
| 4+ Person Household | 1,732 | 36.2% |
| Total Housing Units | 4,788 | 100.0% |
Occupancy by Ownership by Household Size in Bothell East
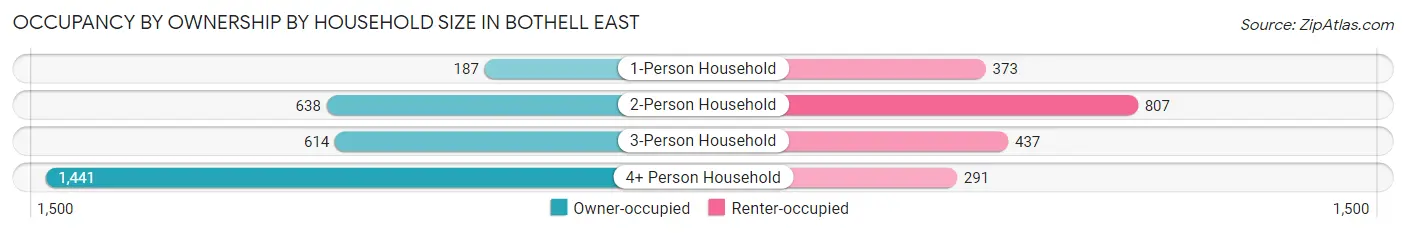
| Household Size | Owner-occupied | Renter-occupied |
| 1-Person Household | 187 (33.4%) | 373 (66.6%) |
| 2-Person Household | 638 (44.2%) | 807 (55.8%) |
| 3-Person Household | 614 (58.4%) | 437 (41.6%) |
| 4+ Person Household | 1,441 (83.2%) | 291 (16.8%) |
| Total Housing Units | 2,880 (60.2%) | 1,908 (39.9%) |
Occupancy by Educational Attainment in Bothell East
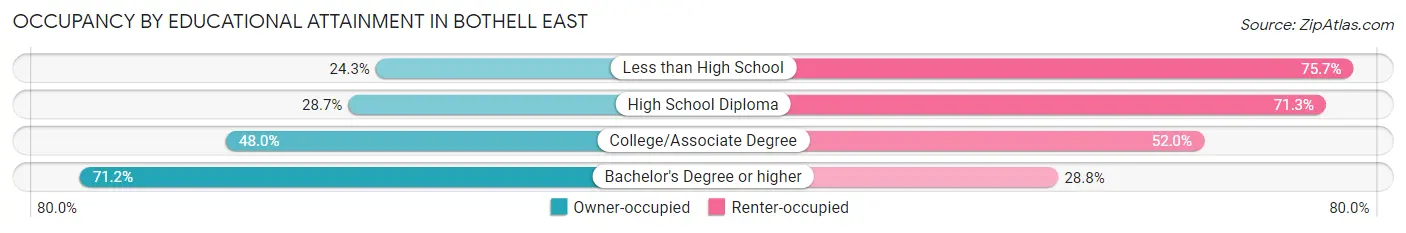
| Household Size | Owner-occupied | Renter-occupied |
| Less than High School | 9 (24.3%) | 28 (75.7%) |
| High School Diploma | 195 (28.7%) | 485 (71.3%) |
| College/Associate Degree | 464 (48.0%) | 502 (52.0%) |
| Bachelor's Degree or higher | 2,212 (71.2%) | 893 (28.8%) |
Occupancy by Age of Householder in Bothell East
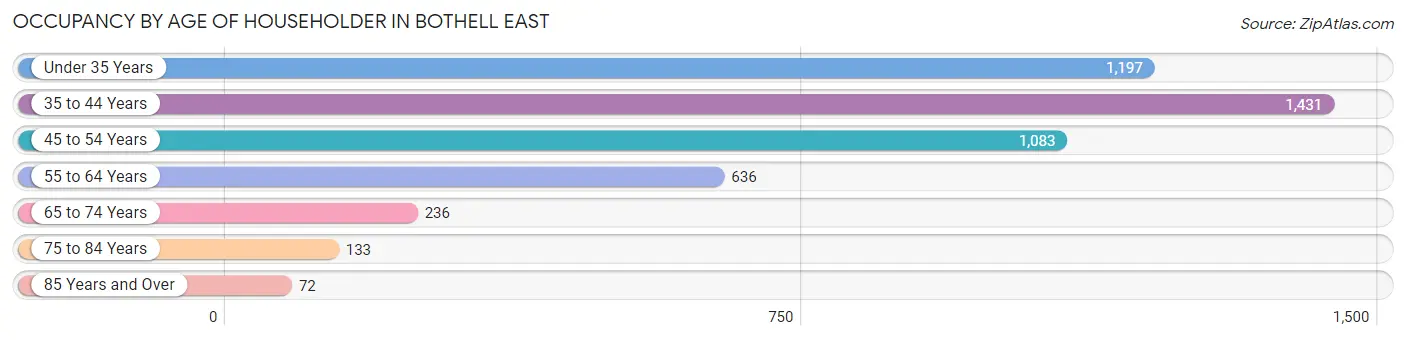
| Age Bracket | # Households | % Households |
| Under 35 Years | 1,197 | 25.0% |
| 35 to 44 Years | 1,431 | 29.9% |
| 45 to 54 Years | 1,083 | 22.6% |
| 55 to 64 Years | 636 | 13.3% |
| 65 to 74 Years | 236 | 4.9% |
| 75 to 84 Years | 133 | 2.8% |
| 85 Years and Over | 72 | 1.5% |
| Total | 4,788 | 100.0% |
Housing Finances in Bothell East
Median Income by Occupancy in Bothell East
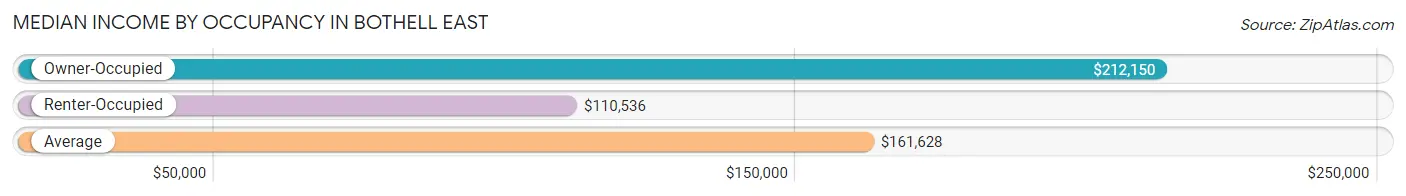
| Occupancy Type | # Households | Median Income |
| Owner-Occupied | 2,880 (60.2%) | $212,150 |
| Renter-Occupied | 1,908 (39.9%) | $110,536 |
| Average | 4,788 (100.0%) | $161,628 |
Occupancy by Householder Income Bracket in Bothell East
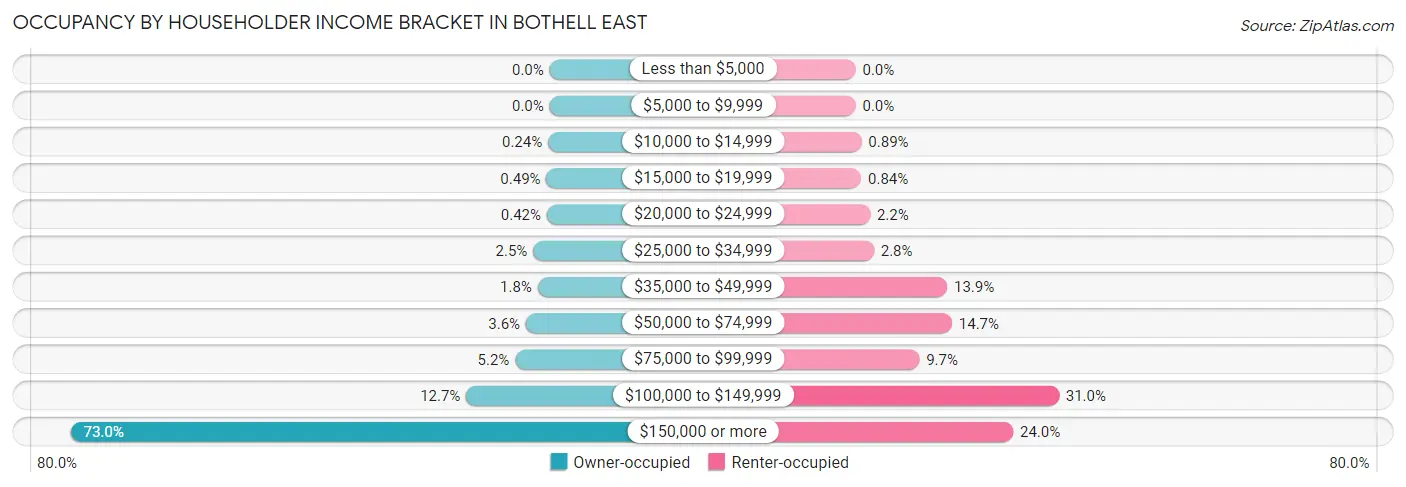
| Income Bracket | Owner-occupied | Renter-occupied |
| Less than $5,000 | 0 (0.0%) | 0 (0.0%) |
| $5,000 to $9,999 | 0 (0.0%) | 0 (0.0%) |
| $10,000 to $14,999 | 7 (0.2%) | 17 (0.9%) |
| $15,000 to $19,999 | 14 (0.5%) | 16 (0.8%) |
| $20,000 to $24,999 | 12 (0.4%) | 42 (2.2%) |
| $25,000 to $34,999 | 72 (2.5%) | 53 (2.8%) |
| $35,000 to $49,999 | 52 (1.8%) | 266 (13.9%) |
| $50,000 to $74,999 | 104 (3.6%) | 280 (14.7%) |
| $75,000 to $99,999 | 151 (5.2%) | 185 (9.7%) |
| $100,000 to $149,999 | 366 (12.7%) | 591 (31.0%) |
| $150,000 or more | 2,102 (73.0%) | 458 (24.0%) |
| Total | 2,880 (100.0%) | 1,908 (100.0%) |
Monthly Housing Cost Tiers in Bothell East
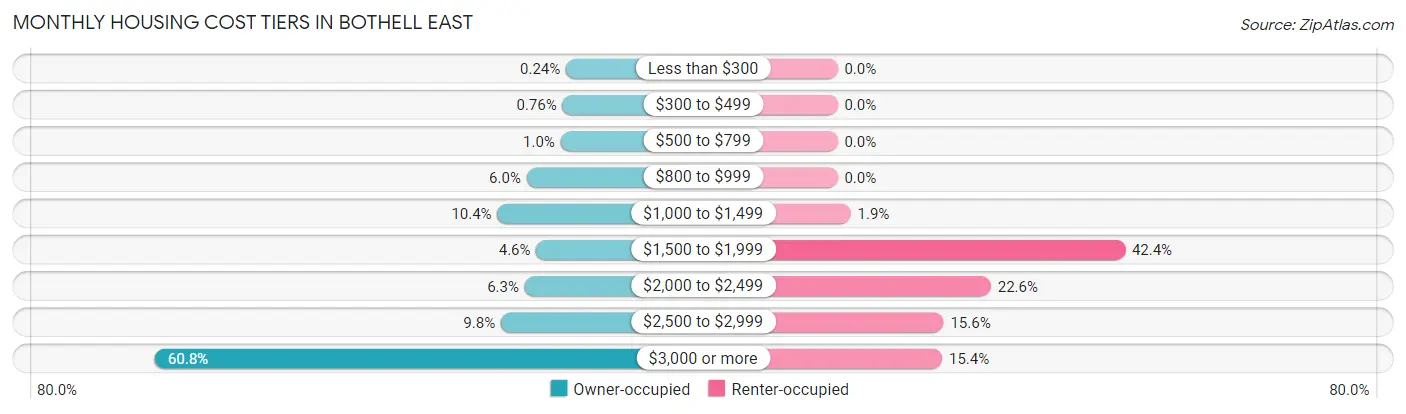
| Monthly Cost | Owner-occupied | Renter-occupied |
| Less than $300 | 7 (0.2%) | 0 (0.0%) |
| $300 to $499 | 22 (0.8%) | 0 (0.0%) |
| $500 to $799 | 30 (1.0%) | 0 (0.0%) |
| $800 to $999 | 174 (6.0%) | 0 (0.0%) |
| $1,000 to $1,499 | 298 (10.3%) | 37 (1.9%) |
| $1,500 to $1,999 | 133 (4.6%) | 808 (42.3%) |
| $2,000 to $2,499 | 182 (6.3%) | 431 (22.6%) |
| $2,500 to $2,999 | 283 (9.8%) | 298 (15.6%) |
| $3,000 or more | 1,751 (60.8%) | 294 (15.4%) |
| Total | 2,880 (100.0%) | 1,908 (100.0%) |
Physical Housing Characteristics in Bothell East
Housing Structures in Bothell East
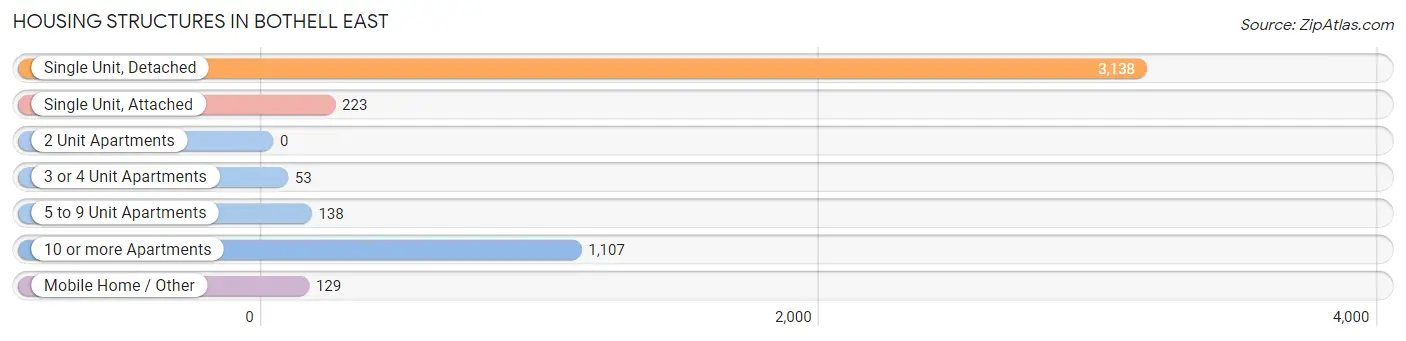
| Structure Type | # Housing Units | % Housing Units |
| Single Unit, Detached | 3,138 | 65.5% |
| Single Unit, Attached | 223 | 4.7% |
| 2 Unit Apartments | 0 | 0.0% |
| 3 or 4 Unit Apartments | 53 | 1.1% |
| 5 to 9 Unit Apartments | 138 | 2.9% |
| 10 or more Apartments | 1,107 | 23.1% |
| Mobile Home / Other | 129 | 2.7% |
| Total | 4,788 | 100.0% |
Housing Structures by Occupancy in Bothell East
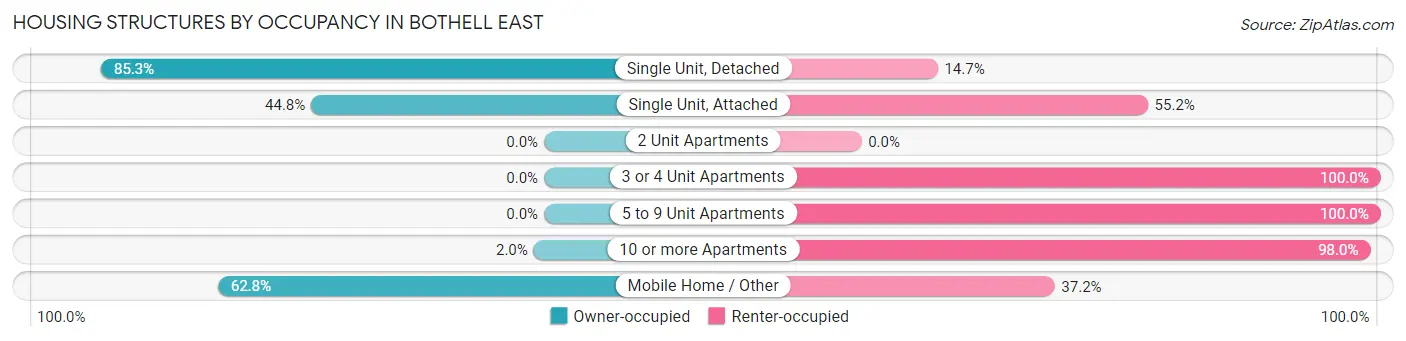
| Structure Type | Owner-occupied | Renter-occupied |
| Single Unit, Detached | 2,677 (85.3%) | 461 (14.7%) |
| Single Unit, Attached | 100 (44.8%) | 123 (55.2%) |
| 2 Unit Apartments | 0 (0.0%) | 0 (0.0%) |
| 3 or 4 Unit Apartments | 0 (0.0%) | 53 (100.0%) |
| 5 to 9 Unit Apartments | 0 (0.0%) | 138 (100.0%) |
| 10 or more Apartments | 22 (2.0%) | 1,085 (98.0%) |
| Mobile Home / Other | 81 (62.8%) | 48 (37.2%) |
| Total | 2,880 (60.2%) | 1,908 (39.9%) |
Housing Structures by Number of Rooms in Bothell East
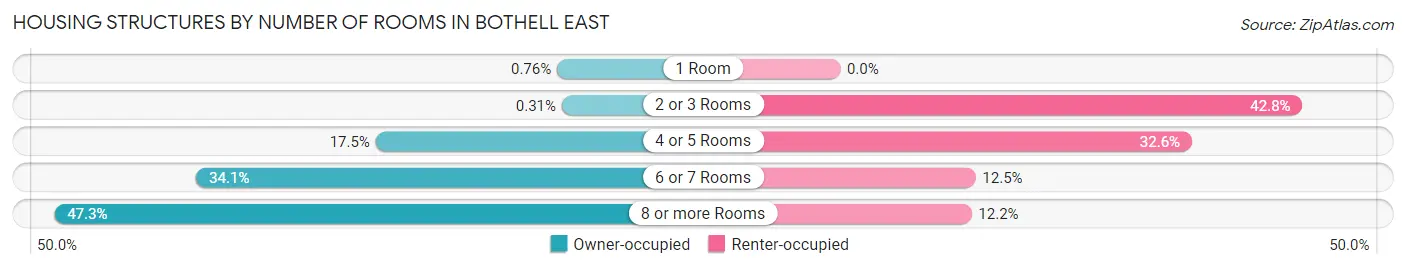
| Number of Rooms | Owner-occupied | Renter-occupied |
| 1 Room | 22 (0.8%) | 0 (0.0%) |
| 2 or 3 Rooms | 9 (0.3%) | 816 (42.8%) |
| 4 or 5 Rooms | 505 (17.5%) | 621 (32.6%) |
| 6 or 7 Rooms | 983 (34.1%) | 239 (12.5%) |
| 8 or more Rooms | 1,361 (47.3%) | 232 (12.2%) |
| Total | 2,880 (100.0%) | 1,908 (100.0%) |
Housing Structure by Heating Type in Bothell East
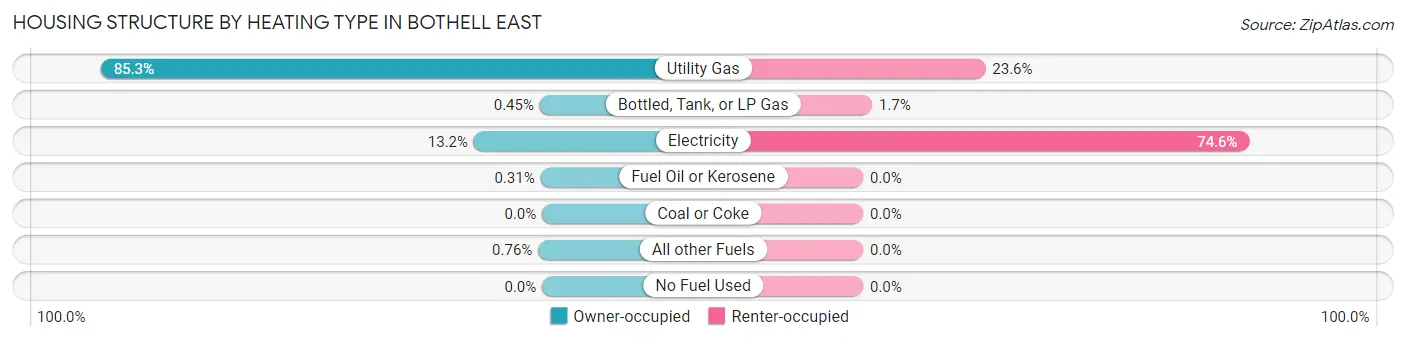
| Heating Type | Owner-occupied | Renter-occupied |
| Utility Gas | 2,456 (85.3%) | 451 (23.6%) |
| Bottled, Tank, or LP Gas | 13 (0.4%) | 33 (1.7%) |
| Electricity | 380 (13.2%) | 1,424 (74.6%) |
| Fuel Oil or Kerosene | 9 (0.3%) | 0 (0.0%) |
| Coal or Coke | 0 (0.0%) | 0 (0.0%) |
| All other Fuels | 22 (0.8%) | 0 (0.0%) |
| No Fuel Used | 0 (0.0%) | 0 (0.0%) |
| Total | 2,880 (100.0%) | 1,908 (100.0%) |
Household Vehicle Usage in Bothell East
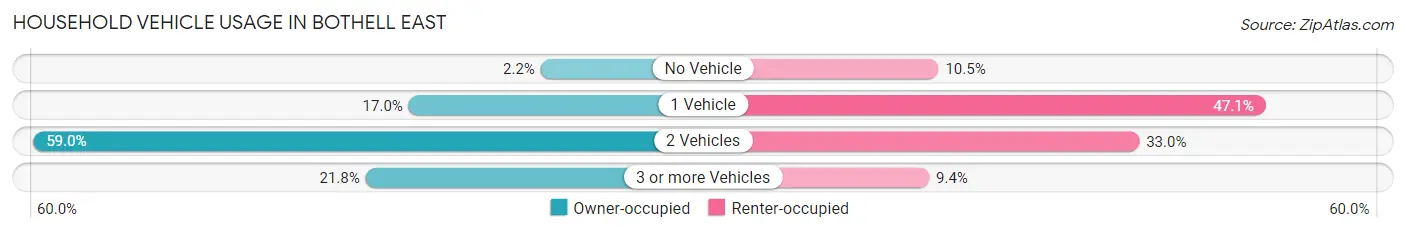
| Vehicles per Household | Owner-occupied | Renter-occupied |
| No Vehicle | 63 (2.2%) | 200 (10.5%) |
| 1 Vehicle | 489 (17.0%) | 899 (47.1%) |
| 2 Vehicles | 1,700 (59.0%) | 629 (33.0%) |
| 3 or more Vehicles | 628 (21.8%) | 180 (9.4%) |
| Total | 2,880 (100.0%) | 1,908 (100.0%) |
Real Estate & Mortgages in Bothell East
Real Estate and Mortgage Overview in Bothell East
| Characteristic | Without Mortgage | With Mortgage |
| Housing Units | 516 | 2,364 |
| Median Property Value | $850,600 | $945,300 |
| Median Household Income | $125,469 | $1,869 |
| Monthly Housing Costs | $1,070 | $1,751 |
| Real Estate Taxes | $8,119 | $5 |
Property Value by Mortgage Status in Bothell East
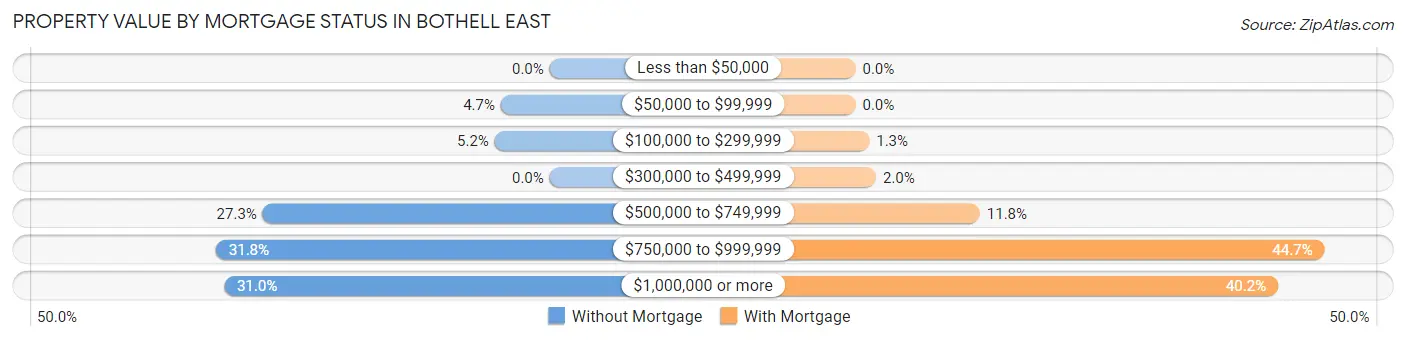
| Property Value | Without Mortgage | With Mortgage |
| Less than $50,000 | 0 (0.0%) | 0 (0.0%) |
| $50,000 to $99,999 | 24 (4.6%) | 0 (0.0%) |
| $100,000 to $299,999 | 27 (5.2%) | 31 (1.3%) |
| $300,000 to $499,999 | 0 (0.0%) | 46 (1.9%) |
| $500,000 to $749,999 | 141 (27.3%) | 280 (11.8%) |
| $750,000 to $999,999 | 164 (31.8%) | 1,056 (44.7%) |
| $1,000,000 or more | 160 (31.0%) | 951 (40.2%) |
| Total | 516 (100.0%) | 2,364 (100.0%) |
Household Income by Mortgage Status in Bothell East
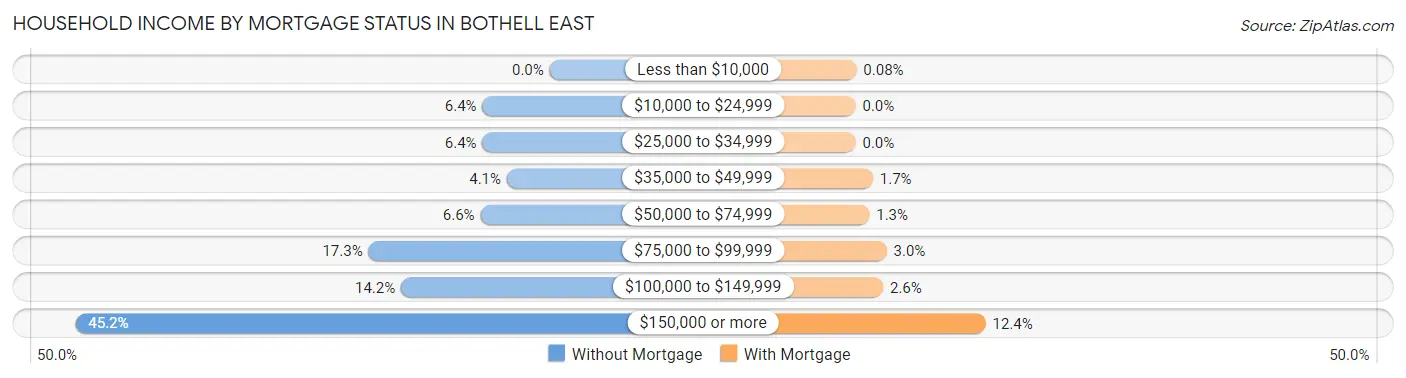
| Household Income | Without Mortgage | With Mortgage |
| Less than $10,000 | 0 (0.0%) | 2 (0.1%) |
| $10,000 to $24,999 | 33 (6.4%) | 0 (0.0%) |
| $25,000 to $34,999 | 33 (6.4%) | 0 (0.0%) |
| $35,000 to $49,999 | 21 (4.1%) | 39 (1.7%) |
| $50,000 to $74,999 | 34 (6.6%) | 31 (1.3%) |
| $75,000 to $99,999 | 89 (17.2%) | 70 (3.0%) |
| $100,000 to $149,999 | 73 (14.1%) | 62 (2.6%) |
| $150,000 or more | 233 (45.2%) | 293 (12.4%) |
| Total | 516 (100.0%) | 2,364 (100.0%) |
Property Value to Household Income Ratio in Bothell East
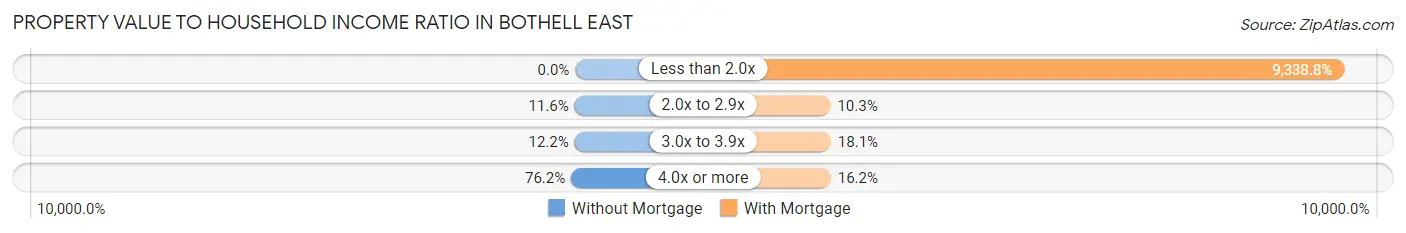
| Value-to-Income Ratio | Without Mortgage | With Mortgage |
| Less than 2.0x | 0 (0.0%) | 220,769 (9,338.8%) |
| 2.0x to 2.9x | 60 (11.6%) | 244 (10.3%) |
| 3.0x to 3.9x | 63 (12.2%) | 428 (18.1%) |
| 4.0x or more | 393 (76.2%) | 382 (16.2%) |
| Total | 516 (100.0%) | 2,364 (100.0%) |
Real Estate Taxes by Mortgage Status in Bothell East
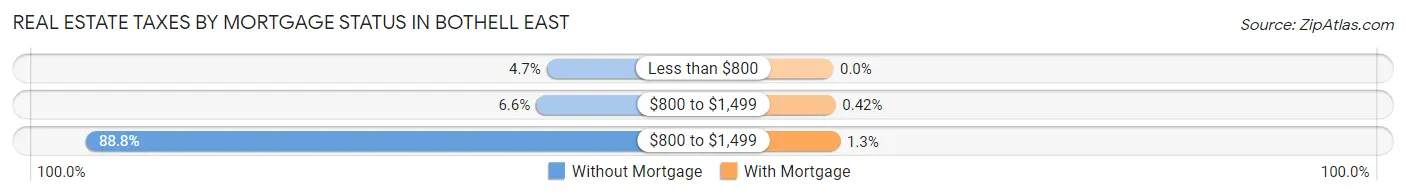
| Property Taxes | Without Mortgage | With Mortgage |
| Less than $800 | 24 (4.6%) | 0 (0.0%) |
| $800 to $1,499 | 34 (6.6%) | 10 (0.4%) |
| $800 to $1,499 | 458 (88.8%) | 30 (1.3%) |
| Total | 516 (100.0%) | 2,364 (100.0%) |
Health & Disability in Bothell East
Health Insurance Coverage by Age in Bothell East
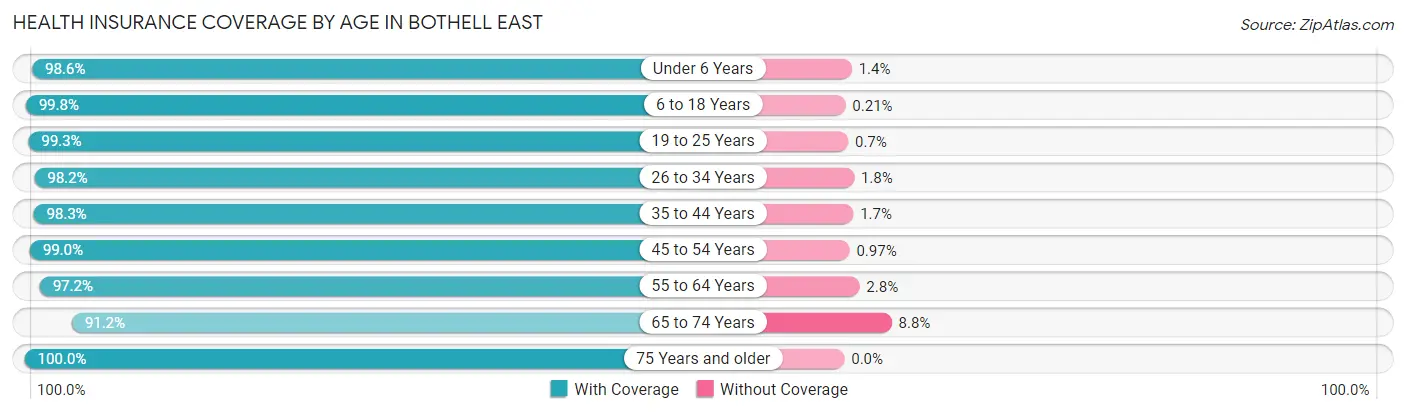
| Age Bracket | With Coverage | Without Coverage |
| Under 6 Years | 1,416 (98.6%) | 20 (1.4%) |
| 6 to 18 Years | 2,792 (99.8%) | 6 (0.2%) |
| 19 to 25 Years | 992 (99.3%) | 7 (0.7%) |
| 26 to 34 Years | 2,011 (98.2%) | 37 (1.8%) |
| 35 to 44 Years | 2,723 (98.3%) | 46 (1.7%) |
| 45 to 54 Years | 1,845 (99.0%) | 18 (1.0%) |
| 55 to 64 Years | 999 (97.2%) | 29 (2.8%) |
| 65 to 74 Years | 486 (91.2%) | 47 (8.8%) |
| 75 Years and older | 438 (100.0%) | 0 (0.0%) |
| Total | 13,702 (98.5%) | 210 (1.5%) |
Health Insurance Coverage by Citizenship Status in Bothell East
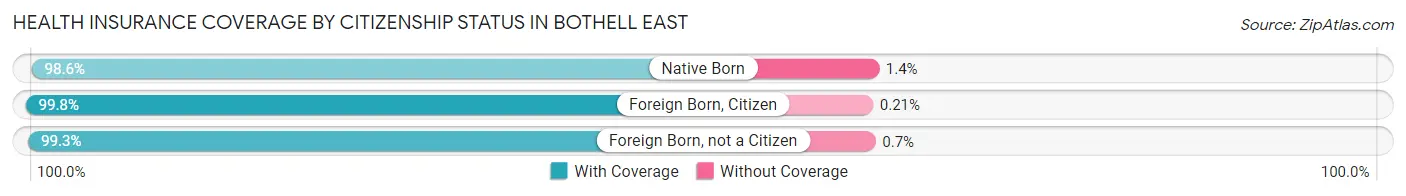
| Citizenship Status | With Coverage | Without Coverage |
| Native Born | 1,416 (98.6%) | 20 (1.4%) |
| Foreign Born, Citizen | 2,792 (99.8%) | 6 (0.2%) |
| Foreign Born, not a Citizen | 992 (99.3%) | 7 (0.7%) |
Health Insurance Coverage by Household Income in Bothell East
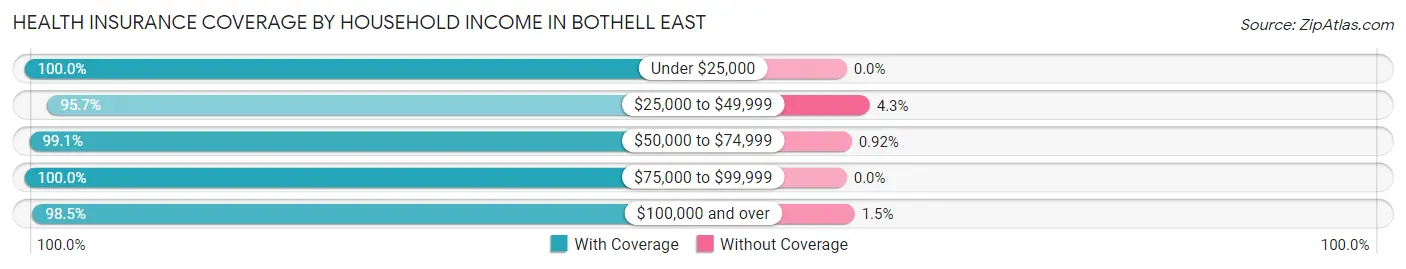
| Household Income | With Coverage | Without Coverage |
| Under $25,000 | 200 (100.0%) | 0 (0.0%) |
| $25,000 to $49,999 | 822 (95.7%) | 37 (4.3%) |
| $50,000 to $74,999 | 756 (99.1%) | 7 (0.9%) |
| $75,000 to $99,999 | 902 (100.0%) | 0 (0.0%) |
| $100,000 and over | 10,973 (98.5%) | 166 (1.5%) |
Public vs Private Health Insurance Coverage by Age in Bothell East
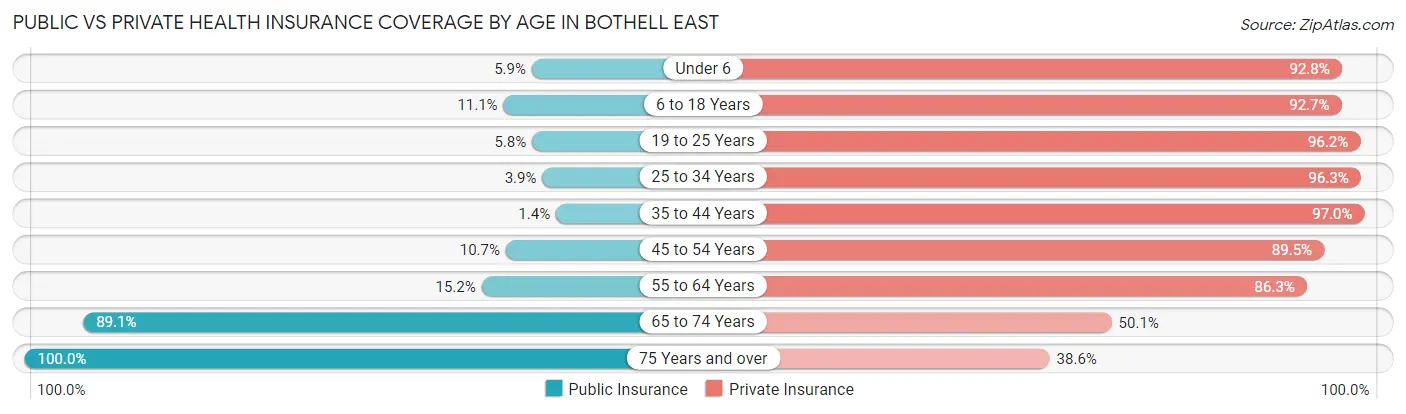
| Age Bracket | Public Insurance | Private Insurance |
| Under 6 | 84 (5.9%) | 1,332 (92.8%) |
| 6 to 18 Years | 311 (11.1%) | 2,594 (92.7%) |
| 19 to 25 Years | 58 (5.8%) | 961 (96.2%) |
| 25 to 34 Years | 80 (3.9%) | 1,972 (96.3%) |
| 35 to 44 Years | 38 (1.4%) | 2,685 (97.0%) |
| 45 to 54 Years | 199 (10.7%) | 1,667 (89.5%) |
| 55 to 64 Years | 156 (15.2%) | 887 (86.3%) |
| 65 to 74 Years | 475 (89.1%) | 267 (50.1%) |
| 75 Years and over | 438 (100.0%) | 169 (38.6%) |
| Total | 1,839 (13.2%) | 12,534 (90.1%) |
Disability Status by Sex by Age in Bothell East
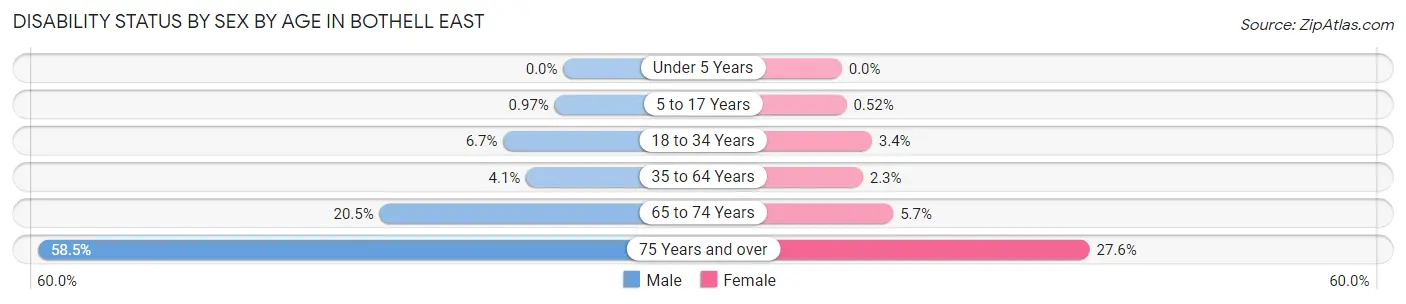
| Age Bracket | Male | Female |
| Under 5 Years | 0 (0.0%) | 0 (0.0%) |
| 5 to 17 Years | 12 (1.0%) | 9 (0.5%) |
| 18 to 34 Years | 94 (6.7%) | 57 (3.4%) |
| 35 to 64 Years | 116 (4.1%) | 67 (2.3%) |
| 65 to 74 Years | 52 (20.5%) | 16 (5.7%) |
| 75 Years and over | 110 (58.5%) | 69 (27.6%) |
Disability Class by Sex by Age in Bothell East
Disability Class: Hearing Difficulty
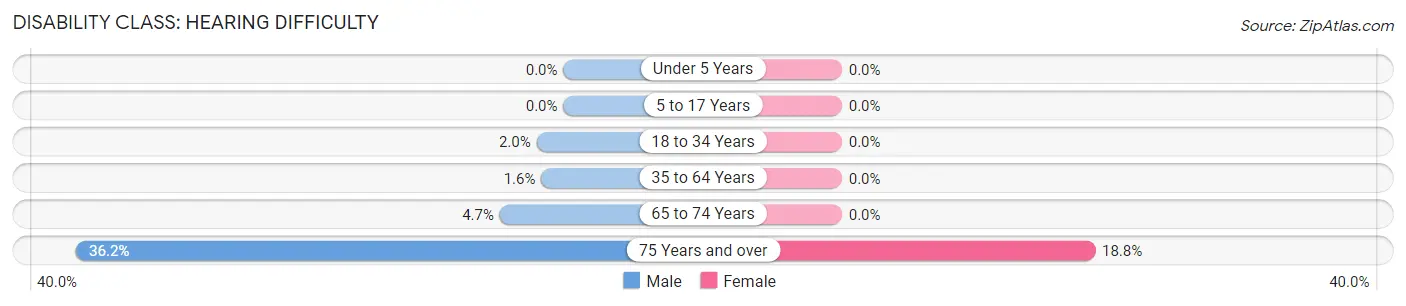
| Age Bracket | Male | Female |
| Under 5 Years | 0 (0.0%) | 0 (0.0%) |
| 5 to 17 Years | 0 (0.0%) | 0 (0.0%) |
| 18 to 34 Years | 28 (2.0%) | 0 (0.0%) |
| 35 to 64 Years | 46 (1.6%) | 0 (0.0%) |
| 65 to 74 Years | 12 (4.7%) | 0 (0.0%) |
| 75 Years and over | 68 (36.2%) | 47 (18.8%) |
Disability Class: Vision Difficulty
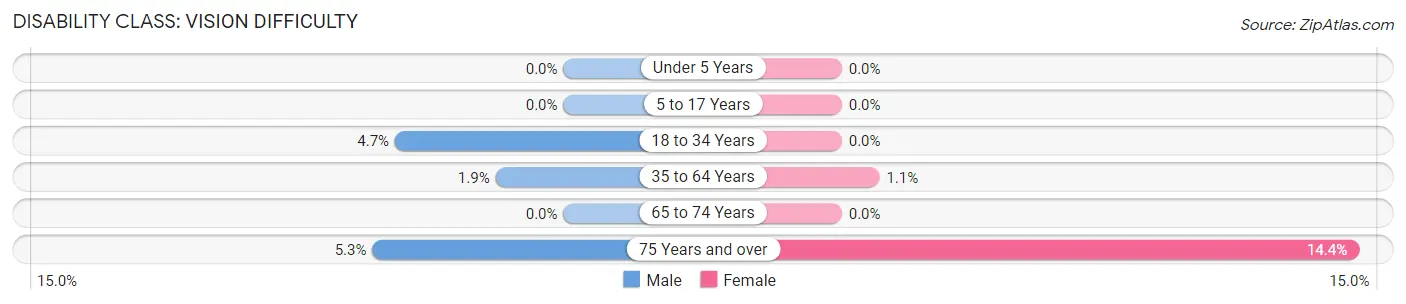
| Age Bracket | Male | Female |
| Under 5 Years | 0 (0.0%) | 0 (0.0%) |
| 5 to 17 Years | 0 (0.0%) | 0 (0.0%) |
| 18 to 34 Years | 66 (4.7%) | 0 (0.0%) |
| 35 to 64 Years | 53 (1.9%) | 30 (1.1%) |
| 65 to 74 Years | 0 (0.0%) | 0 (0.0%) |
| 75 Years and over | 10 (5.3%) | 36 (14.4%) |
Disability Class: Cognitive Difficulty
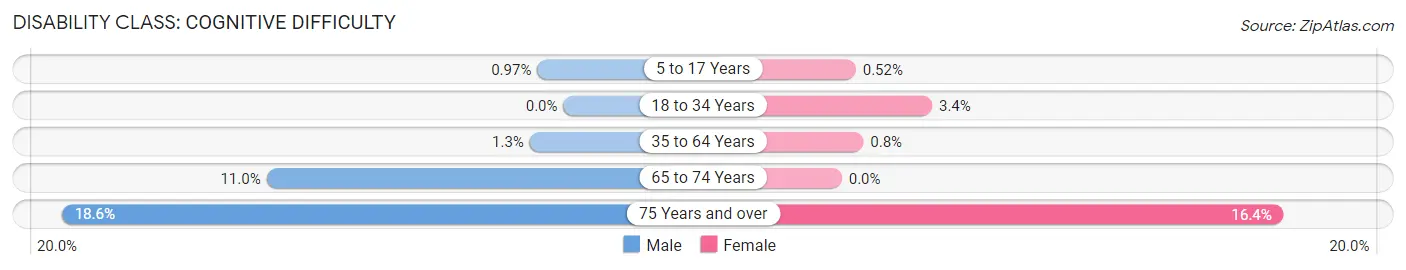
| Age Bracket | Male | Female |
| 5 to 17 Years | 12 (1.0%) | 9 (0.5%) |
| 18 to 34 Years | 0 (0.0%) | 57 (3.4%) |
| 35 to 64 Years | 35 (1.3%) | 23 (0.8%) |
| 65 to 74 Years | 28 (11.0%) | 0 (0.0%) |
| 75 Years and over | 35 (18.6%) | 41 (16.4%) |
Disability Class: Ambulatory Difficulty
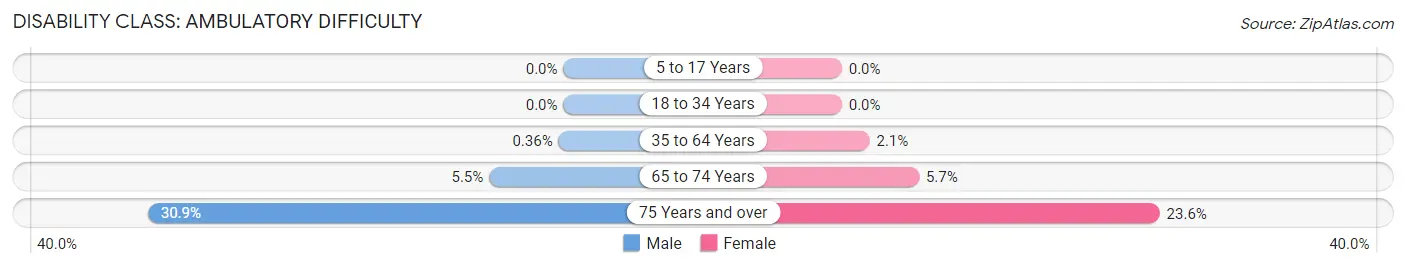
| Age Bracket | Male | Female |
| 5 to 17 Years | 0 (0.0%) | 0 (0.0%) |
| 18 to 34 Years | 0 (0.0%) | 0 (0.0%) |
| 35 to 64 Years | 10 (0.4%) | 59 (2.1%) |
| 65 to 74 Years | 14 (5.5%) | 16 (5.7%) |
| 75 Years and over | 58 (30.8%) | 59 (23.6%) |
Disability Class: Self-Care Difficulty
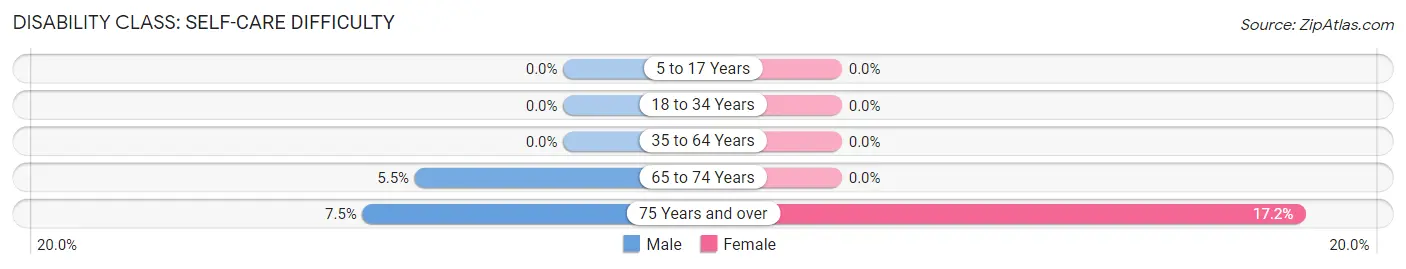
| Age Bracket | Male | Female |
| 5 to 17 Years | 0 (0.0%) | 0 (0.0%) |
| 18 to 34 Years | 0 (0.0%) | 0 (0.0%) |
| 35 to 64 Years | 0 (0.0%) | 0 (0.0%) |
| 65 to 74 Years | 14 (5.5%) | 0 (0.0%) |
| 75 Years and over | 14 (7.4%) | 43 (17.2%) |
Technology Access in Bothell East
Computing Device Access in Bothell East
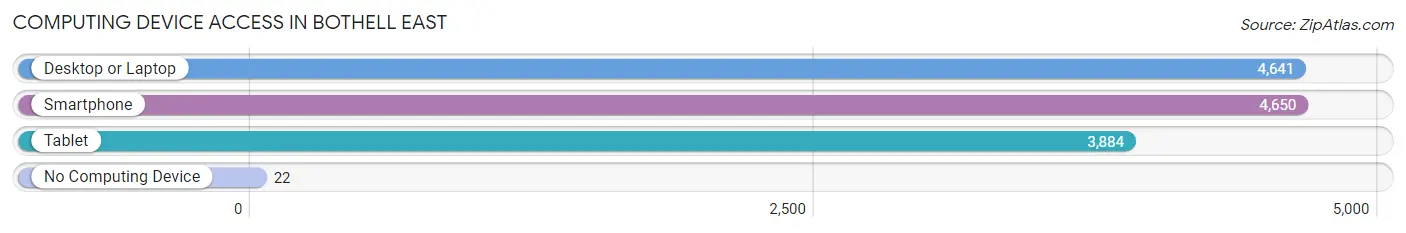
| Device Type | # Households | % Households |
| Desktop or Laptop | 4,641 | 96.9% |
| Smartphone | 4,650 | 97.1% |
| Tablet | 3,884 | 81.1% |
| No Computing Device | 22 | 0.5% |
| Total | 4,788 | 100.0% |
Internet Access in Bothell East
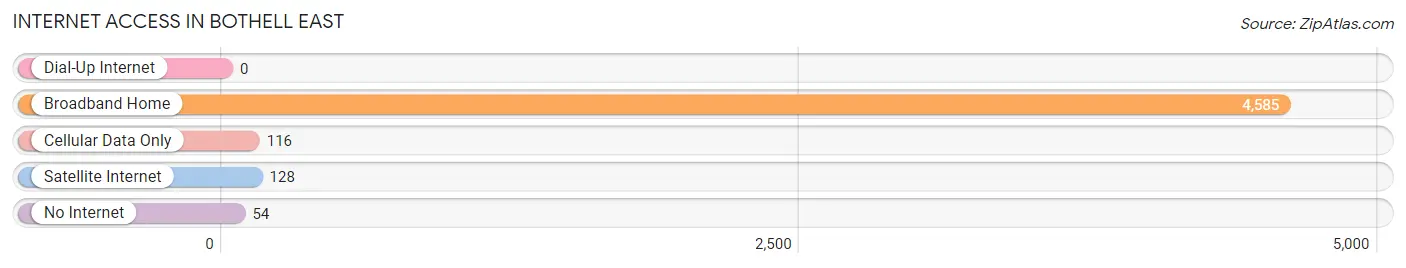
| Internet Type | # Households | % Households |
| Dial-Up Internet | 0 | 0.0% |
| Broadband Home | 4,585 | 95.8% |
| Cellular Data Only | 116 | 2.4% |
| Satellite Internet | 128 | 2.7% |
| No Internet | 54 | 1.1% |
| Total | 4,788 | 100.0% |
Bothell East Summary
Bothell East, WA is a small city located in King County, Washington, United States. It is situated approximately 20 miles northeast of Seattle and is part of the Seattle metropolitan area. Bothell East is bordered by the cities of Woodinville to the north, Redmond to the east, and Kirkland to the south. The population of Bothell East was estimated to be 33,844 in 2019.
History
The area that is now Bothell East was originally inhabited by the Sammamish Native American tribe. The first European settlers arrived in the area in the late 1800s, and the city was officially incorporated in 1909. The city was named after the nearby Bothell Creek, which was named after the first settler in the area, David Bothell.
In the early 1900s, the city was a small farming community, with many of the residents working in the nearby logging and lumber industries. The city experienced a period of rapid growth in the 1950s and 1960s, as the population of the Seattle metropolitan area increased. This growth was fueled by the construction of Interstate 405, which connected Bothell East to Seattle and other nearby cities.
Geography
Bothell East is located in King County, Washington, approximately 20 miles northeast of Seattle. The city is situated in the foothills of the Cascade Mountains, and is bordered by the cities of Woodinville to the north, Redmond to the east, and Kirkland to the south. The city covers an area of 8.3 square miles, and has a population density of 4,072 people per square mile.
The city is located in a temperate climate zone, with warm summers and mild winters. The average annual temperature is 54 degrees Fahrenheit, and the average annual precipitation is 37 inches.
Economy
The economy of Bothell East is largely driven by the technology industry. The city is home to several major technology companies, including Microsoft, Amazon, and T-Mobile. The city is also home to several medical and healthcare companies, including Providence Health & Services and EvergreenHealth.
In addition to the technology and healthcare industries, Bothell East is home to several retail and restaurant businesses. The city is also home to several educational institutions, including the University of Washington Bothell and Cascadia College.
Demographics
As of 2019, the population of Bothell East was estimated to be 33,844. The population is predominantly white (77.3%), followed by Asian (13.2%), Hispanic or Latino (4.7%), and African American (2.2%). The median household income is $90,845, and the median age is 37.
The city is home to a diverse range of religious faiths, including Christianity, Judaism, Islam, and Buddhism. The city is also home to a large number of immigrants, with the largest groups coming from India, China, and the Philippines.
Conclusion
Bothell East, WA is a small city located in King County, Washington, United States. It is situated approximately 20 miles northeast of Seattle and is part of the Seattle metropolitan area. The city has a population of 33,844 and is predominantly white. The economy of Bothell East is largely driven by the technology industry, and the city is home to several major technology companies, including Microsoft, Amazon, and T-Mobile. The city is also home to several medical and healthcare companies, as well as educational institutions. Bothell East is a diverse city, with a range of religious faiths and a large immigrant population.
Common Questions
What is Per Capita Income in Bothell East?
Per Capita income in Bothell East is $67,615.
What is the Median Family Income in Bothell East?
Median Family Income in Bothell East is $169,286.
What is the Median Household income in Bothell East?
Median Household Income in Bothell East is $161,628.
What is Income or Wage Gap in Bothell East?
Income or Wage Gap in Bothell East is 60.7%.
Women in Bothell East earn 39.3 cents for every dollar earned by a man.
What is Inequality or Gini Index in Bothell East?
Inequality or Gini Index in Bothell East is 0.40.
What is the Total Population of Bothell East?
Total Population of Bothell East is 13,948.
What is the Total Male Population of Bothell East?
Total Male Population of Bothell East is 6,534.
What is the Total Female Population of Bothell East?
Total Female Population of Bothell East is 7,414.
What is the Ratio of Males per 100 Females in Bothell East?
There are 88.13 Males per 100 Females in Bothell East.
What is the Ratio of Females per 100 Males in Bothell East?
There are 113.47 Females per 100 Males in Bothell East.
What is the Median Population Age in Bothell East?
Median Population Age in Bothell East is 33.6 Years.
What is the Average Family Size in Bothell East
Average Family Size in Bothell East is 3.1 People.
What is the Average Household Size in Bothell East
Average Household Size in Bothell East is 2.9 People.
How Large is the Labor Force in Bothell East?
There are 7,562 People in the Labor Forcein in Bothell East.
What is the Percentage of People in the Labor Force in Bothell East?
74.8% of People are in the Labor Force in Bothell East.
What is the Unemployment Rate in Bothell East?
Unemployment Rate in Bothell East is 3.7%.