Fox Island, WA Map & Demographics
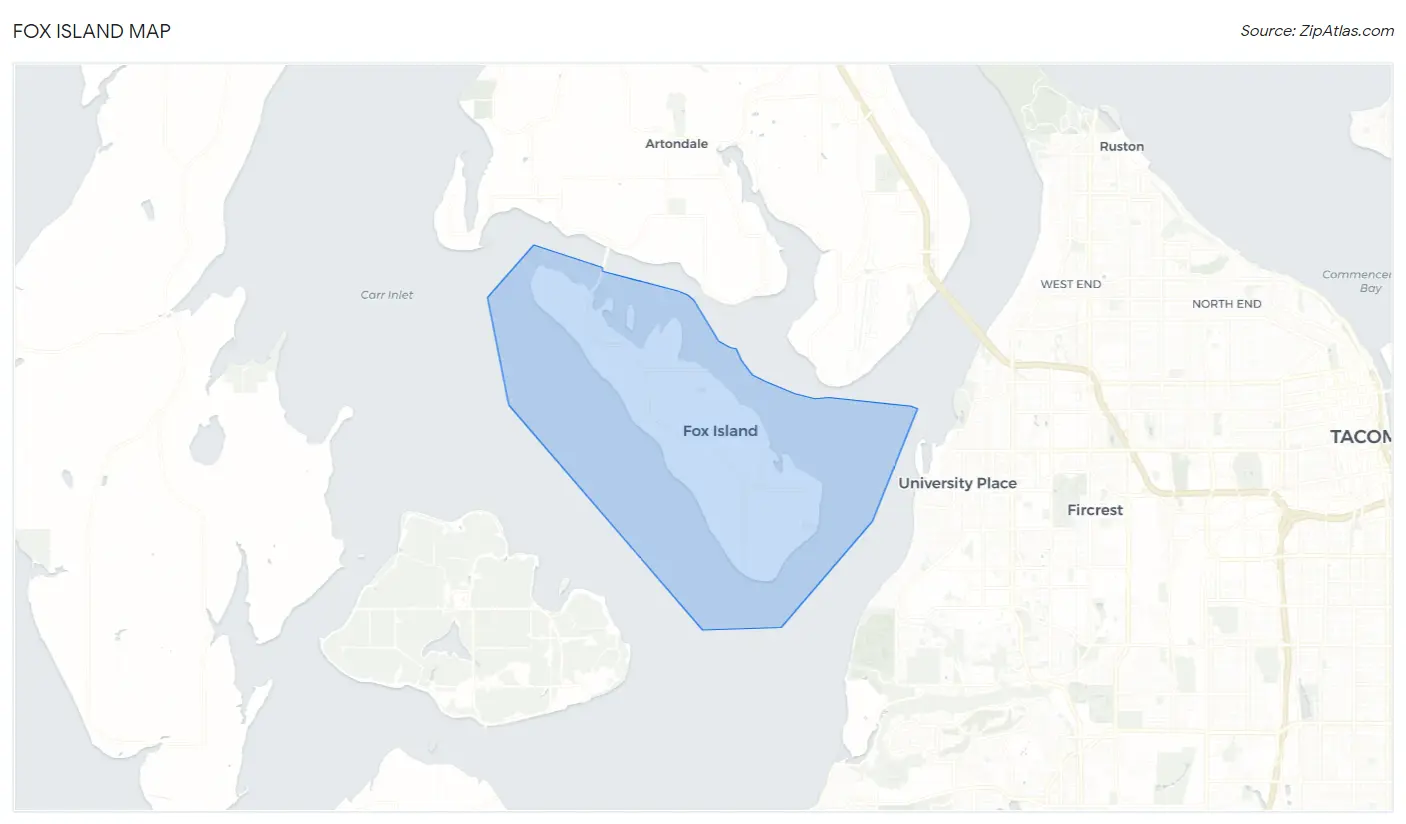
Fox Island Map
Fox Island Overview
$84,382
PER CAPITA INCOME
$185,313
AVG FAMILY INCOME
$157,566
AVG HOUSEHOLD INCOME
61.1%
WAGE / INCOME GAP [ % ]
38.9¢/ $1
WAGE / INCOME GAP [ $ ]
0.46
INEQUALITY / GINI INDEX
3,644
TOTAL POPULATION
1,900
MALE POPULATION
1,744
FEMALE POPULATION
108.94
MALES / 100 FEMALES
91.79
FEMALES / 100 MALES
50.0
MEDIAN AGE
2.9
AVG FAMILY SIZE
2.6
AVG HOUSEHOLD SIZE
1,601
LABOR FORCE [ PEOPLE ]
53.5%
PERCENT IN LABOR FORCE
4.6%
UNEMPLOYMENT RATE
Fox Island Zip Codes
Fox Island Area Codes
Income in Fox Island
Income Overview in Fox Island
Per Capita Income in Fox Island is $84,382, while median incomes of families and households are $185,313 and $157,566 respectively.
| Characteristic | Number | Measure |
| Per Capita Income | 3,644 | $84,382 |
| Median Family Income | 1,145 | $185,313 |
| Mean Family Income | 1,145 | $237,073 |
| Median Household Income | 1,385 | $157,566 |
| Mean Household Income | 1,385 | $214,929 |
| Income Deficit | 1,145 | $0 |
| Wage / Income Gap (%) | 3,644 | 61.09% |
| Wage / Income Gap ($) | 3,644 | 38.91¢ per $1 |
| Gini / Inequality Index | 3,644 | 0.46 |
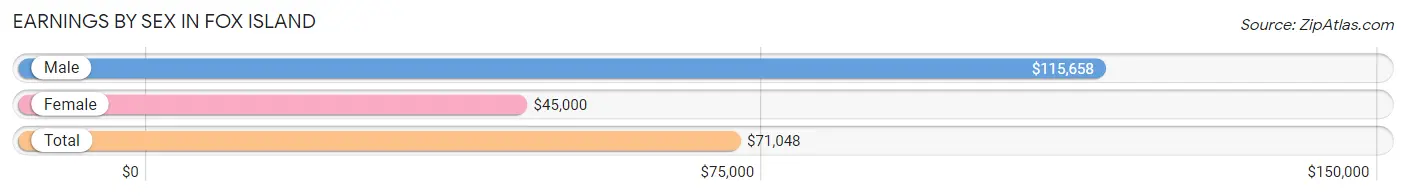
Earnings by Sex in Fox Island
Average Earnings in Fox Island are $71,048, $115,658 for men and $45,000 for women, a difference of 61.1%.
| Sex | Number | Average Earnings |
| Male | 964 (56.8%) | $115,658 |
| Female | 734 (43.2%) | $45,000 |
| Total | 1,698 (100.0%) | $71,048 |
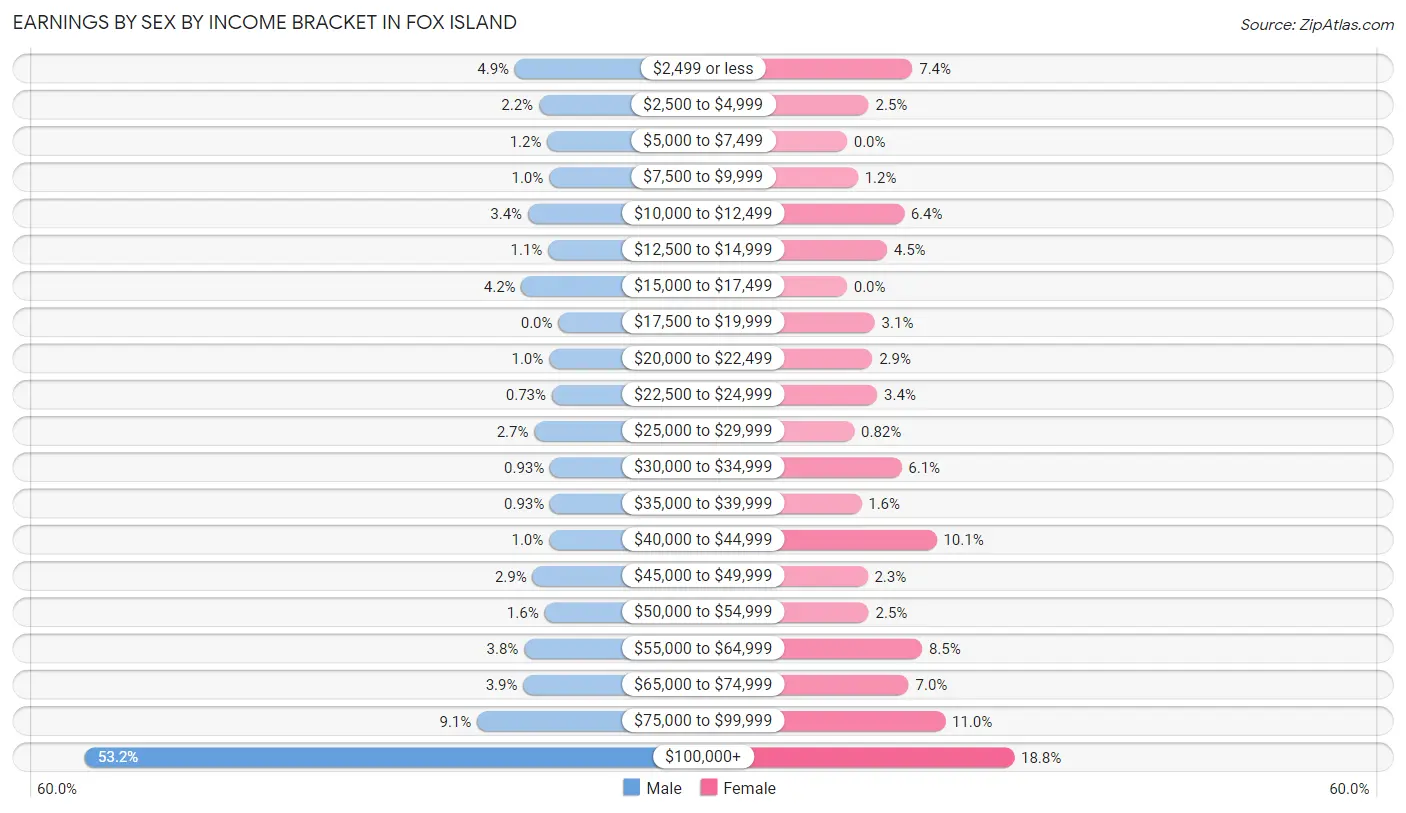
Earnings by Sex by Income Bracket in Fox Island
The most common earnings brackets in Fox Island are $100,000+ for men (513 | 53.2%) and $100,000+ for women (138 | 18.8%).
| Income | Male | Female |
| $2,499 or less | 47 (4.9%) | 54 (7.4%) |
| $2,500 to $4,999 | 21 (2.2%) | 18 (2.5%) |
| $5,000 to $7,499 | 12 (1.2%) | 0 (0.0%) |
| $7,500 to $9,999 | 10 (1.0%) | 9 (1.2%) |
| $10,000 to $12,499 | 33 (3.4%) | 47 (6.4%) |
| $12,500 to $14,999 | 11 (1.1%) | 33 (4.5%) |
| $15,000 to $17,499 | 40 (4.2%) | 0 (0.0%) |
| $17,500 to $19,999 | 0 (0.0%) | 23 (3.1%) |
| $20,000 to $22,499 | 10 (1.0%) | 21 (2.9%) |
| $22,500 to $24,999 | 7 (0.7%) | 25 (3.4%) |
| $25,000 to $29,999 | 26 (2.7%) | 6 (0.8%) |
| $30,000 to $34,999 | 9 (0.9%) | 45 (6.1%) |
| $35,000 to $39,999 | 9 (0.9%) | 12 (1.6%) |
| $40,000 to $44,999 | 10 (1.0%) | 74 (10.1%) |
| $45,000 to $49,999 | 28 (2.9%) | 17 (2.3%) |
| $50,000 to $54,999 | 15 (1.6%) | 18 (2.5%) |
| $55,000 to $64,999 | 37 (3.8%) | 62 (8.5%) |
| $65,000 to $74,999 | 38 (3.9%) | 51 (7.0%) |
| $75,000 to $99,999 | 88 (9.1%) | 81 (11.0%) |
| $100,000+ | 513 (53.2%) | 138 (18.8%) |
| Total | 964 (100.0%) | 734 (100.0%) |
Earnings by Sex by Educational Attainment in Fox Island
Average earnings in Fox Island are $121,563 for men and $47,083 for women, a difference of 61.3%. Men with an educational attainment of graduate degree enjoy the highest average annual earnings of $175,972, while those with bachelor's degree education earn the least with $100,781. Women with an educational attainment of graduate degree earn the most with the average annual earnings of $110,000, while those with high school diploma education have the smallest earnings of $30,761.

| Educational Attainment | Male Income | Female Income |
| Less than High School | - | - |
| High School Diploma | $142,404 | $30,761 |
| College or Associate's Degree | $110,385 | $41,115 |
| Bachelor's Degree | $100,781 | $57,736 |
| Graduate Degree | $175,972 | $110,000 |
| Total | $121,563 | $47,083 |
Family Income in Fox Island
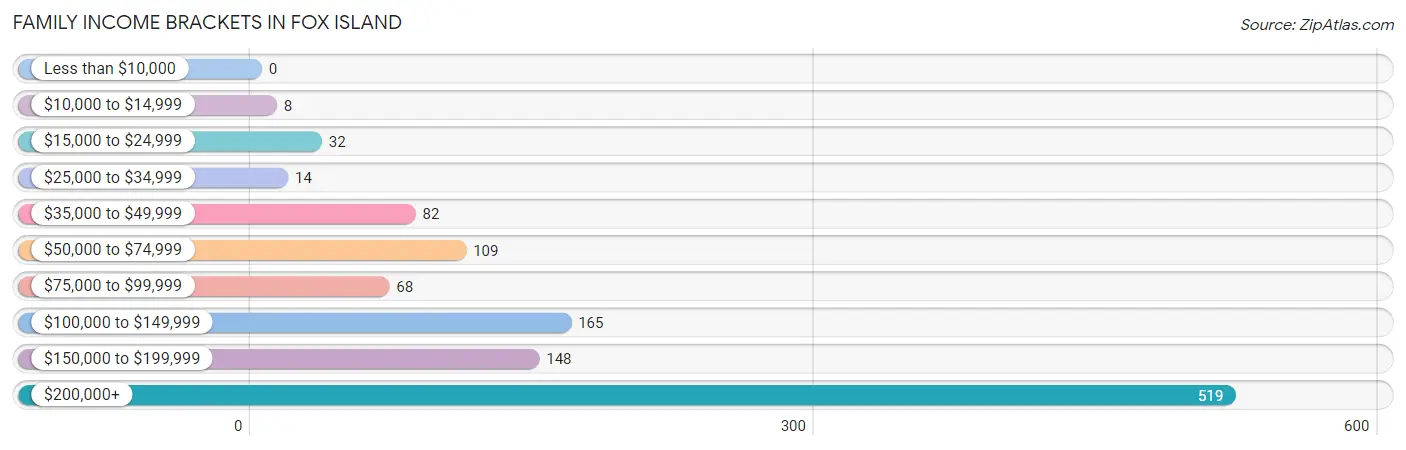
Family Income Brackets in Fox Island
According to the Fox Island family income data, there are 519 families falling into the $200,000+ income range, which is the most common income bracket and makes up 45.3% of all families.
| Income Bracket | # Families | % Families |
| Less than $10,000 | 0 | 0.0% |
| $10,000 to $14,999 | 8 | 0.7% |
| $15,000 to $24,999 | 32 | 2.8% |
| $25,000 to $34,999 | 14 | 1.2% |
| $35,000 to $49,999 | 82 | 7.2% |
| $50,000 to $74,999 | 109 | 9.5% |
| $75,000 to $99,999 | 68 | 5.9% |
| $100,000 to $149,999 | 165 | 14.4% |
| $150,000 to $199,999 | 148 | 12.9% |
| $200,000+ | 519 | 45.3% |
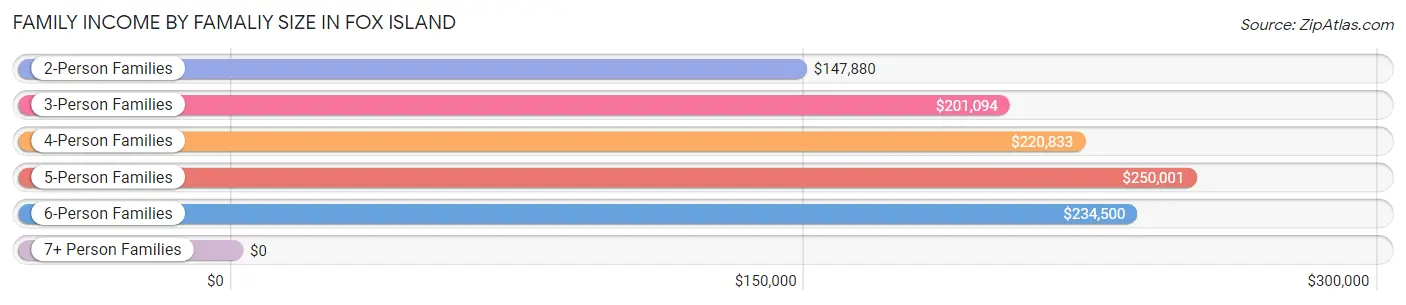
Family Income by Famaliy Size in Fox Island
5-person families (69 | 6.0%) account for the highest median family income in Fox Island with $250,001 per family, while 2-person families (649 | 56.7%) have the highest median income of $73,940 per family member.
| Income Bracket | # Families | Median Income |
| 2-Person Families | 649 (56.7%) | $147,880 |
| 3-Person Families | 217 (19.0%) | $201,094 |
| 4-Person Families | 170 (14.8%) | $220,833 |
| 5-Person Families | 69 (6.0%) | $250,001 |
| 6-Person Families | 40 (3.5%) | $234,500 |
| 7+ Person Families | 0 (0.0%) | $0 |
| Total | 1,145 (100.0%) | $185,313 |
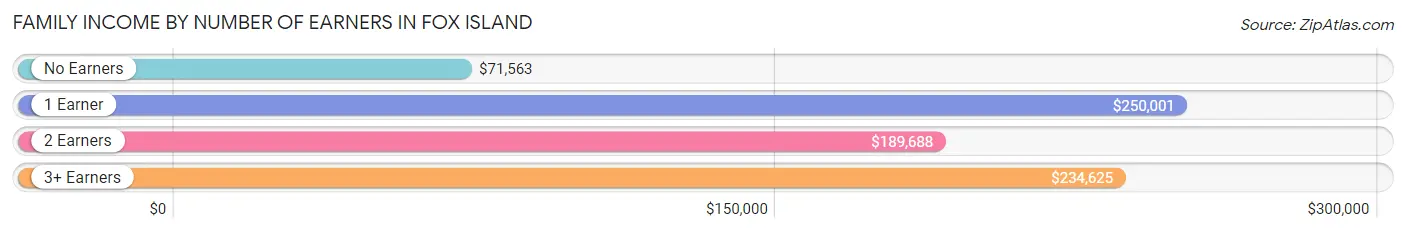
Family Income by Number of Earners in Fox Island
The median family income in Fox Island is $185,313, with families comprising 1 earner (402) having the highest median family income of $250,001, while families with no earners (244) have the lowest median family income of $71,563, accounting for 35.1% and 21.3% of families, respectively.
| Number of Earners | # Families | Median Income |
| No Earners | 244 (21.3%) | $71,563 |
| 1 Earner | 402 (35.1%) | $250,001 |
| 2 Earners | 396 (34.6%) | $189,688 |
| 3+ Earners | 103 (9.0%) | $234,625 |
| Total | 1,145 (100.0%) | $185,313 |
Household Income in Fox Island
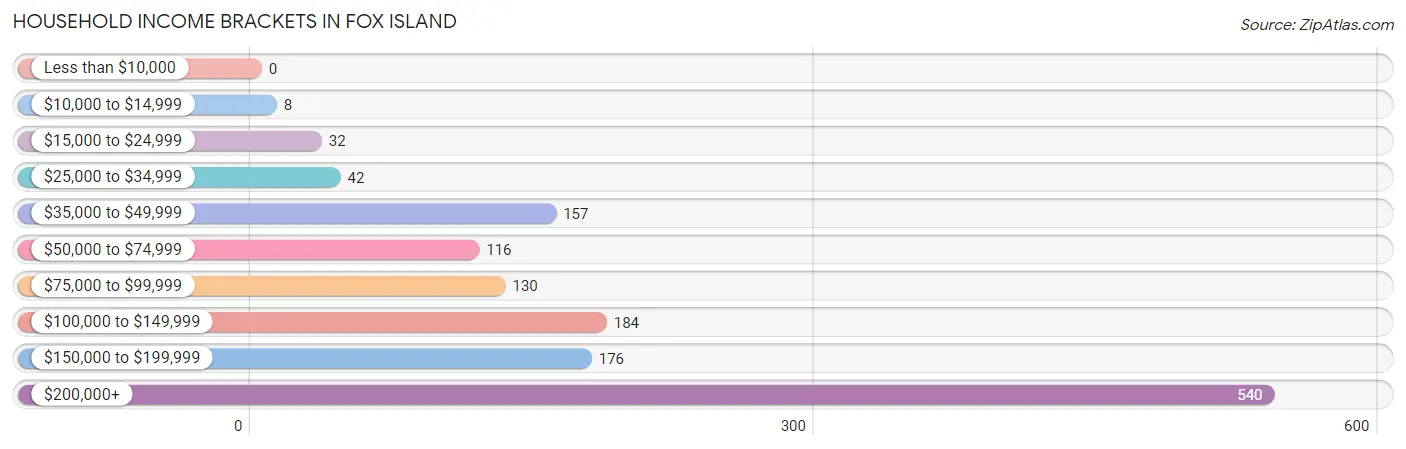
Household Income Brackets in Fox Island
With 540 households falling in the category, the $200,000+ income range is the most frequent in Fox Island, accounting for 39.0% of all households.
| Income Bracket | # Households | % Households |
| Less than $10,000 | 0 | 0.0% |
| $10,000 to $14,999 | 8 | 0.6% |
| $15,000 to $24,999 | 32 | 2.3% |
| $25,000 to $34,999 | 42 | 3.0% |
| $35,000 to $49,999 | 157 | 11.3% |
| $50,000 to $74,999 | 116 | 8.4% |
| $75,000 to $99,999 | 130 | 9.4% |
| $100,000 to $149,999 | 184 | 13.3% |
| $150,000 to $199,999 | 176 | 12.7% |
| $200,000+ | 540 | 39.0% |
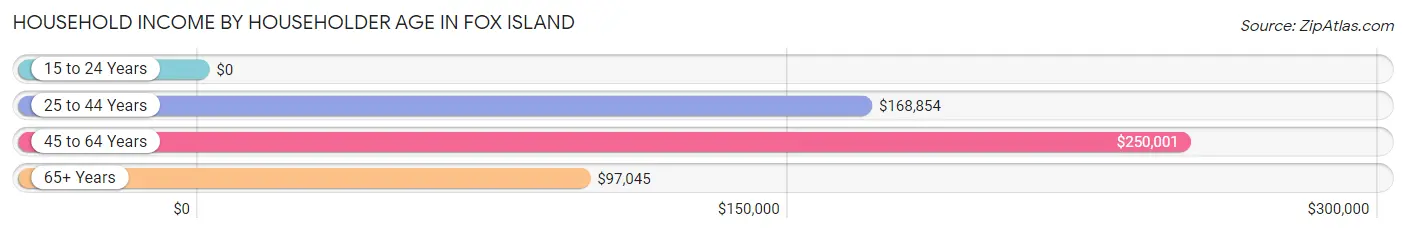
Household Income by Householder Age in Fox Island
The median household income in Fox Island is $157,566, with the highest median household income of $250,001 found in the 45 to 64 years age bracket for the primary householder. A total of 526 households (38.0%) fall into this category.
| Income Bracket | # Households | Median Income |
| 15 to 24 Years | 0 (0.0%) | $0 |
| 25 to 44 Years | 255 (18.4%) | $168,854 |
| 45 to 64 Years | 526 (38.0%) | $250,001 |
| 65+ Years | 604 (43.6%) | $97,045 |
| Total | 1,385 (100.0%) | $157,566 |
Poverty in Fox Island
Income Below Poverty by Sex and Age in Fox Island
With 1.2% poverty level for males and 1.8% for females among the residents of Fox Island, 55 to 64 year old males and 55 to 64 year old females are the most vulnerable to poverty, with 11 males (4.2%) and 24 females (8.4%) in their respective age groups living below the poverty level.
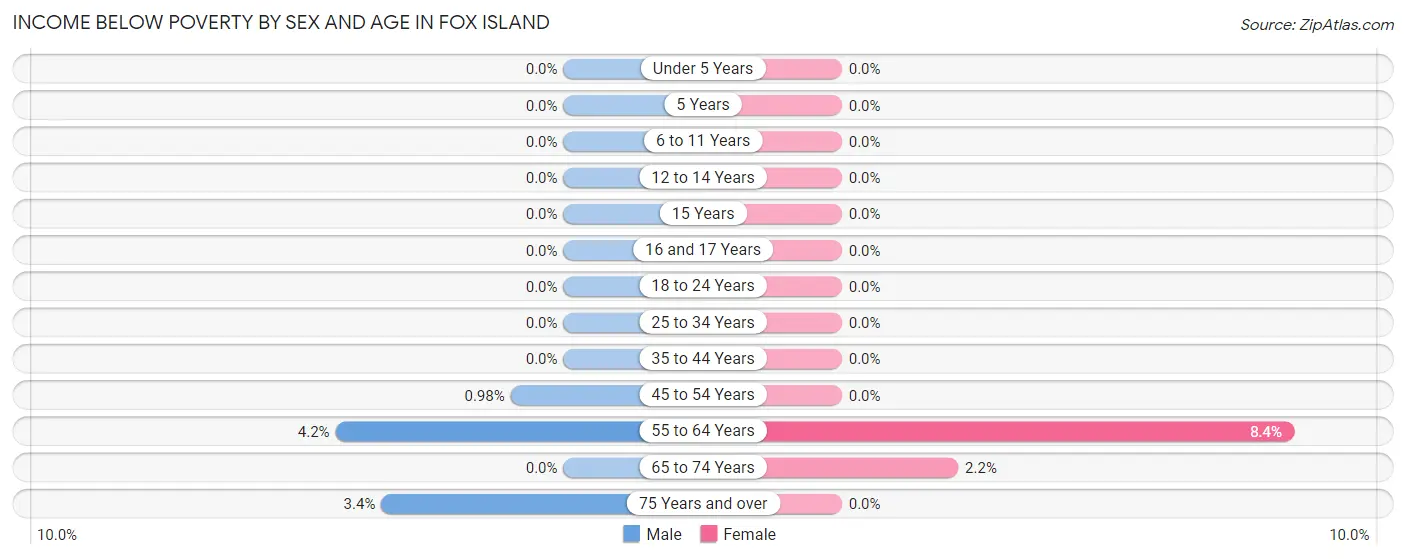
| Age Bracket | Male | Female |
| Under 5 Years | 0 (0.0%) | 0 (0.0%) |
| 5 Years | 0 (0.0%) | 0 (0.0%) |
| 6 to 11 Years | 0 (0.0%) | 0 (0.0%) |
| 12 to 14 Years | 0 (0.0%) | 0 (0.0%) |
| 15 Years | 0 (0.0%) | 0 (0.0%) |
| 16 and 17 Years | 0 (0.0%) | 0 (0.0%) |
| 18 to 24 Years | 0 (0.0%) | 0 (0.0%) |
| 25 to 34 Years | 0 (0.0%) | 0 (0.0%) |
| 35 to 44 Years | 0 (0.0%) | 0 (0.0%) |
| 45 to 54 Years | 3 (1.0%) | 0 (0.0%) |
| 55 to 64 Years | 11 (4.2%) | 24 (8.4%) |
| 65 to 74 Years | 0 (0.0%) | 8 (2.2%) |
| 75 Years and over | 8 (3.4%) | 0 (0.0%) |
| Total | 22 (1.2%) | 32 (1.8%) |
Income Above Poverty by Sex and Age in Fox Island
According to the poverty statistics in Fox Island, males aged under 5 years and females aged under 5 years are the age groups that are most secure financially, with 100.0% of males and 100.0% of females in these age groups living above the poverty line.
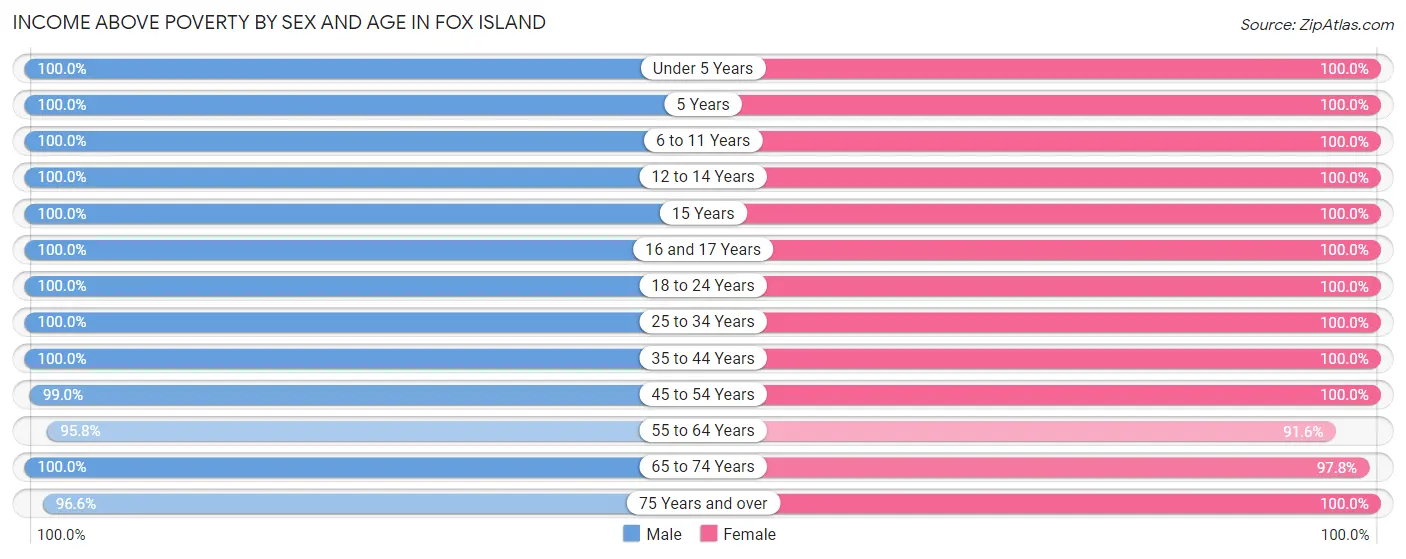
| Age Bracket | Male | Female |
| Under 5 Years | 100 (100.0%) | 33 (100.0%) |
| 5 Years | 12 (100.0%) | 30 (100.0%) |
| 6 to 11 Years | 89 (100.0%) | 102 (100.0%) |
| 12 to 14 Years | 132 (100.0%) | 77 (100.0%) |
| 15 Years | 18 (100.0%) | 33 (100.0%) |
| 16 and 17 Years | 50 (100.0%) | 41 (100.0%) |
| 18 to 24 Years | 103 (100.0%) | 47 (100.0%) |
| 25 to 34 Years | 117 (100.0%) | 90 (100.0%) |
| 35 to 44 Years | 156 (100.0%) | 259 (100.0%) |
| 45 to 54 Years | 304 (99.0%) | 210 (100.0%) |
| 55 to 64 Years | 249 (95.8%) | 262 (91.6%) |
| 65 to 74 Years | 306 (100.0%) | 363 (97.8%) |
| 75 Years and over | 229 (96.6%) | 152 (100.0%) |
| Total | 1,865 (98.8%) | 1,699 (98.2%) |
Income Below Poverty Among Married-Couple Families in Fox Island
The poverty statistics for married-couple families in Fox Island show that 0.7% or 8 of the total 1,069 families live below the poverty line. Families with no children have the highest poverty rate of 1.1%, comprising of 8 families. On the other hand, families with 1 or 2 children have the lowest poverty rate of 0.0%, which includes 0 families.
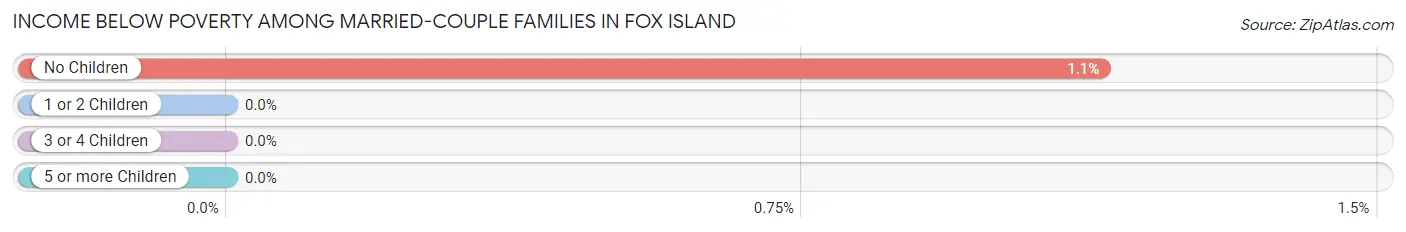
| Children | Above Poverty | Below Poverty |
| No Children | 696 (98.9%) | 8 (1.1%) |
| 1 or 2 Children | 320 (100.0%) | 0 (0.0%) |
| 3 or 4 Children | 45 (100.0%) | 0 (0.0%) |
| 5 or more Children | 0 (0.0%) | 0 (0.0%) |
| Total | 1,061 (99.3%) | 8 (0.7%) |
Income Below Poverty Among Single-Parent Households in Fox Island
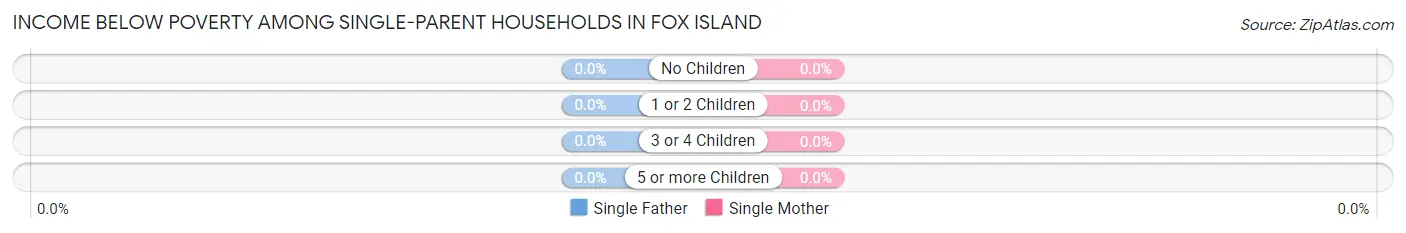
| Children | Single Father | Single Mother |
| No Children | 0 (0.0%) | 0 (0.0%) |
| 1 or 2 Children | 0 (0.0%) | 0 (0.0%) |
| 3 or 4 Children | 0 (0.0%) | 0 (0.0%) |
| 5 or more Children | 0 (0.0%) | 0 (0.0%) |
| Total | 0 (0.0%) | 0 (0.0%) |
Income Below Poverty Among Married-Couple vs Single-Parent Households in Fox Island
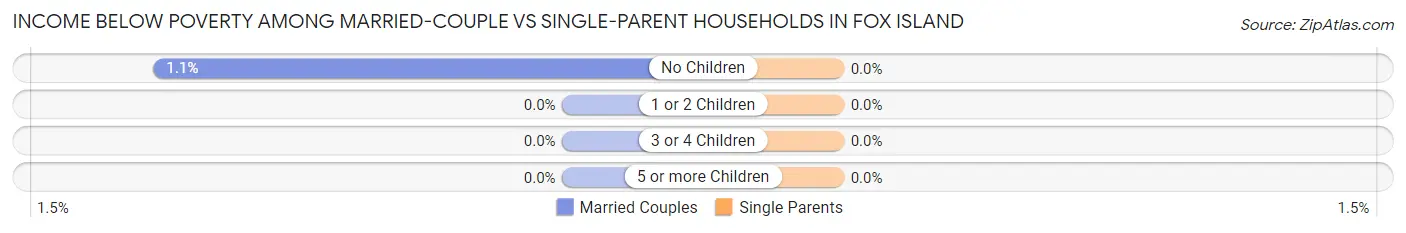
| Children | Married-Couple Families | Single-Parent Households |
| No Children | 8 (1.1%) | 0 (0.0%) |
| 1 or 2 Children | 0 (0.0%) | 0 (0.0%) |
| 3 or 4 Children | 0 (0.0%) | 0 (0.0%) |
| 5 or more Children | 0 (0.0%) | 0 (0.0%) |
| Total | 8 (0.7%) | 0 (0.0%) |
Race in Fox Island
The most populous races in Fox Island are White / Caucasian (3,380 | 92.8%), Hispanic or Latino (185 | 5.1%), and Two or more Races (174 | 4.8%).
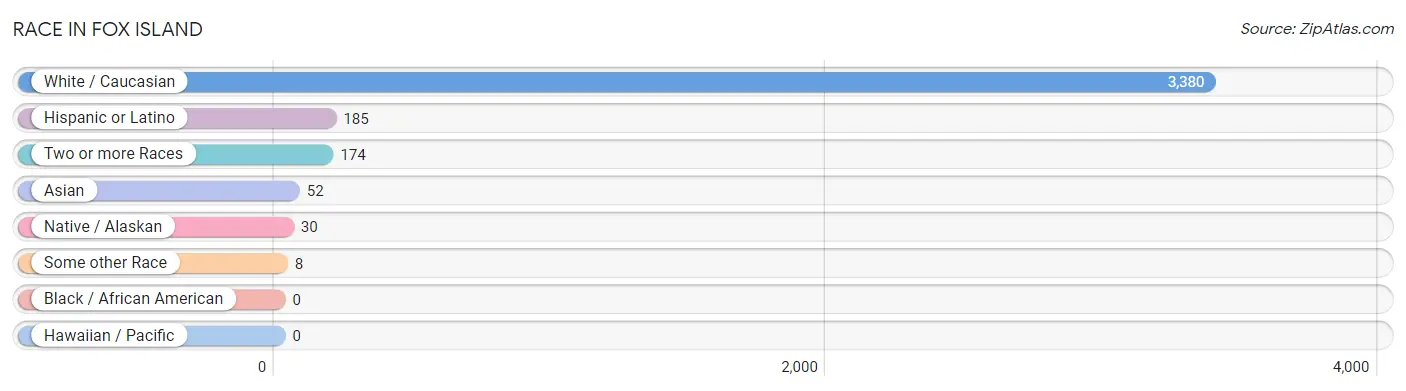
| Race | # Population | % Population |
| Asian | 52 | 1.4% |
| Black / African American | 0 | 0.0% |
| Hawaiian / Pacific | 0 | 0.0% |
| Hispanic or Latino | 185 | 5.1% |
| Native / Alaskan | 30 | 0.8% |
| White / Caucasian | 3,380 | 92.8% |
| Two or more Races | 174 | 4.8% |
| Some other Race | 8 | 0.2% |
| Total | 3,644 | 100.0% |
Ancestry in Fox Island
The most populous ancestries reported in Fox Island are English (695 | 19.1%), German (649 | 17.8%), Irish (396 | 10.9%), European (318 | 8.7%), and Norwegian (283 | 7.8%), together accounting for 64.3% of all Fox Island residents.
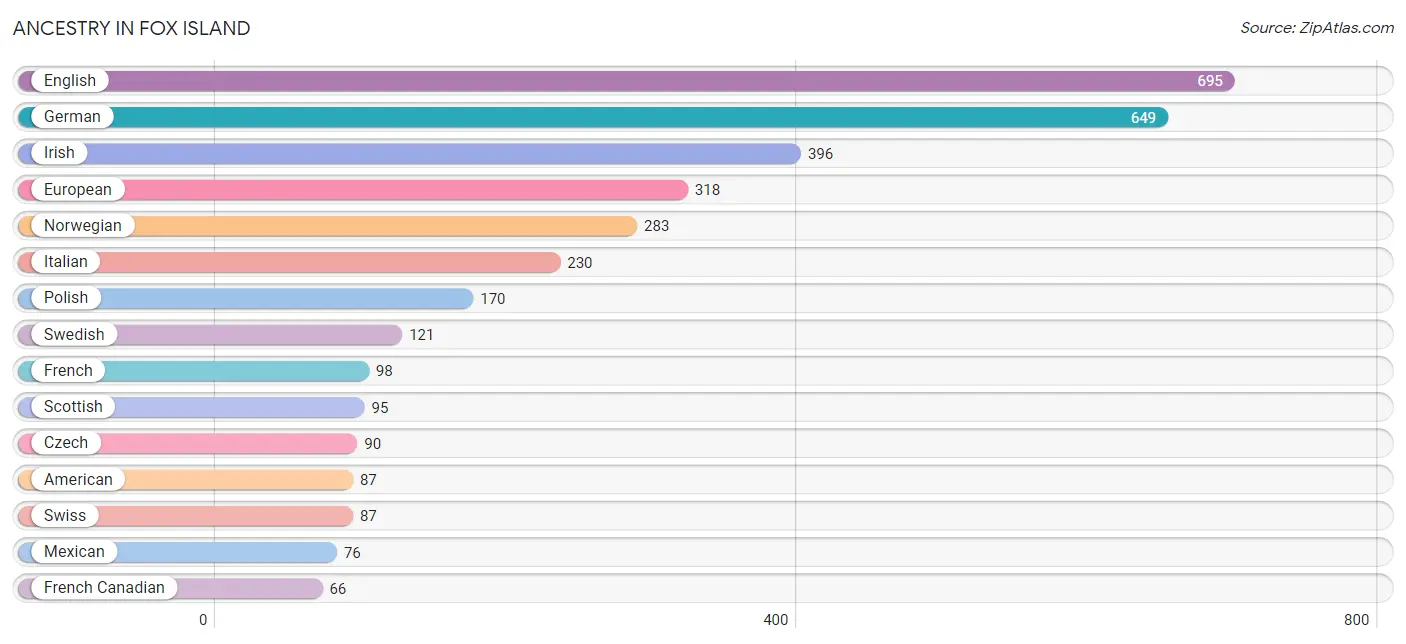
| Ancestry | # Population | % Population |
| Aleut | 8 | 0.2% |
| American | 87 | 2.4% |
| Bhutanese | 28 | 0.8% |
| British | 7 | 0.2% |
| Burmese | 18 | 0.5% |
| Central American | 38 | 1.0% |
| Cherokee | 28 | 0.8% |
| Croatian | 20 | 0.5% |
| Cuban | 12 | 0.3% |
| Czech | 90 | 2.5% |
| Danish | 23 | 0.6% |
| English | 695 | 19.1% |
| European | 318 | 8.7% |
| Filipino | 9 | 0.3% |
| Finnish | 35 | 1.0% |
| French | 98 | 2.7% |
| French Canadian | 66 | 1.8% |
| German | 649 | 17.8% |
| Greek | 7 | 0.2% |
| Irish | 396 | 10.9% |
| Italian | 230 | 6.3% |
| Korean | 46 | 1.3% |
| Mexican | 76 | 2.1% |
| Mexican American Indian | 4 | 0.1% |
| Navajo | 9 | 0.3% |
| Nicaraguan | 38 | 1.0% |
| Norwegian | 283 | 7.8% |
| Polish | 170 | 4.7% |
| Puerto Rican | 48 | 1.3% |
| Russian | 65 | 1.8% |
| Scandinavian | 59 | 1.6% |
| Scotch-Irish | 51 | 1.4% |
| Scottish | 95 | 2.6% |
| Swedish | 121 | 3.3% |
| Swiss | 87 | 2.4% |
| Turkish | 27 | 0.7% |
| Welsh | 50 | 1.4% | View All 37 Rows |
Immigrants in Fox Island
The most numerous immigrant groups reported in Fox Island came from Asia (44 | 1.2%), Europe (43 | 1.2%), Eastern Asia (24 | 0.7%), Turkey (20 | 0.5%), and Western Asia (20 | 0.5%), together accounting for 4.1% of all Fox Island residents.
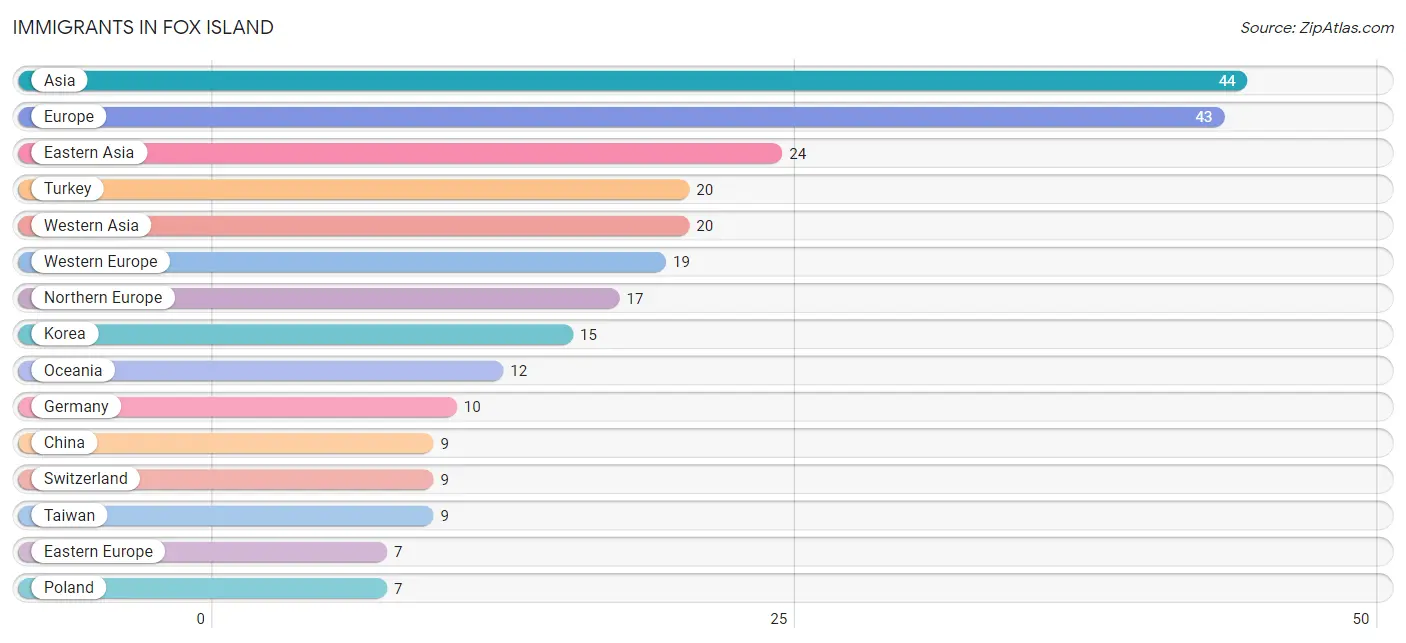
| Immigration Origin | # Population | % Population |
| Asia | 44 | 1.2% |
| China | 9 | 0.3% |
| Eastern Asia | 24 | 0.7% |
| Eastern Europe | 7 | 0.2% |
| Europe | 43 | 1.2% |
| Germany | 10 | 0.3% |
| Korea | 15 | 0.4% |
| Northern Europe | 17 | 0.5% |
| Oceania | 12 | 0.3% |
| Poland | 7 | 0.2% |
| Switzerland | 9 | 0.3% |
| Taiwan | 9 | 0.3% |
| Turkey | 20 | 0.5% |
| Western Asia | 20 | 0.5% |
| Western Europe | 19 | 0.5% | View All 15 Rows |
Sex and Age in Fox Island
Sex and Age in Fox Island
The most populous age groups in Fox Island are 45 to 49 Years (195 | 10.3%) for men and 65 to 69 Years (214 | 12.3%) for women.
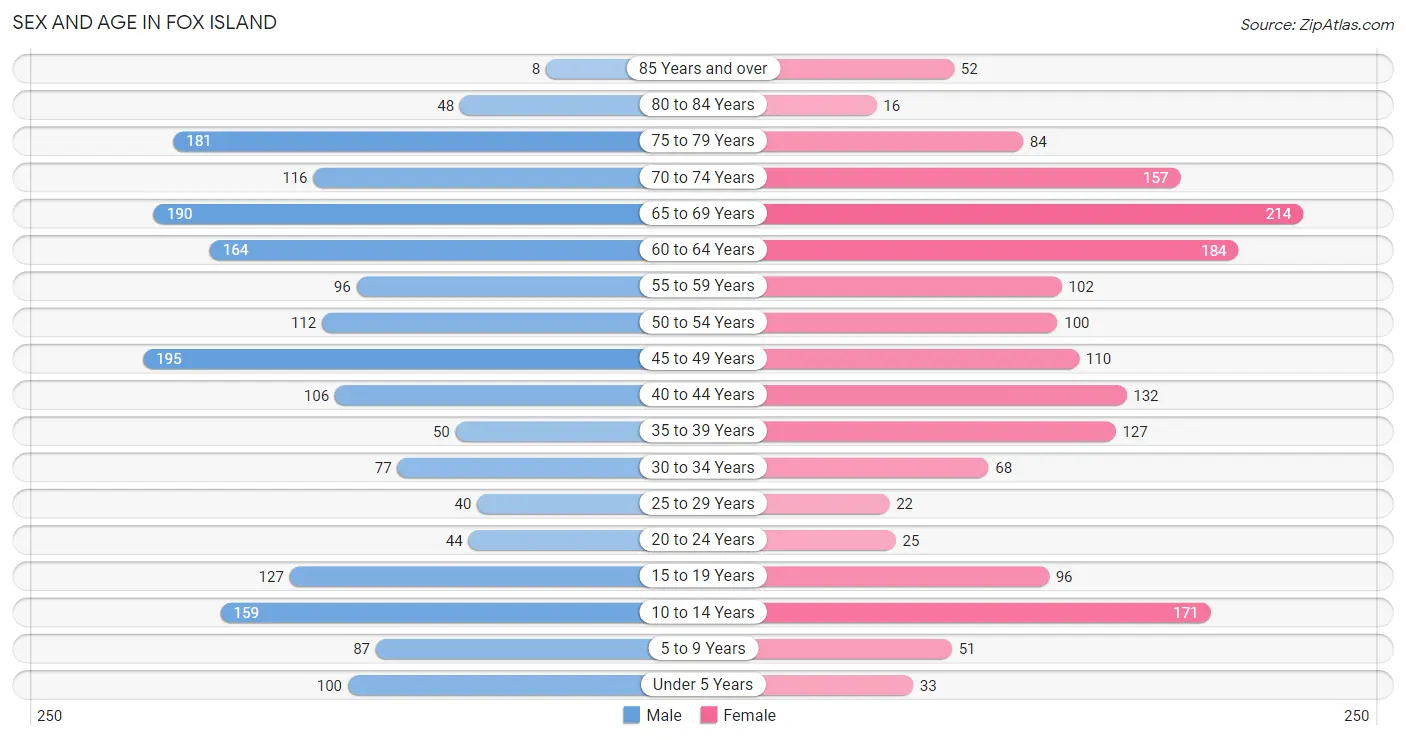
| Age Bracket | Male | Female |
| Under 5 Years | 100 (5.3%) | 33 (1.9%) |
| 5 to 9 Years | 87 (4.6%) | 51 (2.9%) |
| 10 to 14 Years | 159 (8.4%) | 171 (9.8%) |
| 15 to 19 Years | 127 (6.7%) | 96 (5.5%) |
| 20 to 24 Years | 44 (2.3%) | 25 (1.4%) |
| 25 to 29 Years | 40 (2.1%) | 22 (1.3%) |
| 30 to 34 Years | 77 (4.1%) | 68 (3.9%) |
| 35 to 39 Years | 50 (2.6%) | 127 (7.3%) |
| 40 to 44 Years | 106 (5.6%) | 132 (7.6%) |
| 45 to 49 Years | 195 (10.3%) | 110 (6.3%) |
| 50 to 54 Years | 112 (5.9%) | 100 (5.7%) |
| 55 to 59 Years | 96 (5.1%) | 102 (5.9%) |
| 60 to 64 Years | 164 (8.6%) | 184 (10.5%) |
| 65 to 69 Years | 190 (10.0%) | 214 (12.3%) |
| 70 to 74 Years | 116 (6.1%) | 157 (9.0%) |
| 75 to 79 Years | 181 (9.5%) | 84 (4.8%) |
| 80 to 84 Years | 48 (2.5%) | 16 (0.9%) |
| 85 Years and over | 8 (0.4%) | 52 (3.0%) |
| Total | 1,900 (100.0%) | 1,744 (100.0%) |
Families and Households in Fox Island
Median Family Size in Fox Island
The median family size in Fox Island is 2.87 persons per family, with married-couple families (1,069 | 93.4%) accounting for the largest median family size of 2.89 persons per family. On the other hand, single male/father families (9 | 0.8%) represent the smallest median family size with 2.00 persons per family.
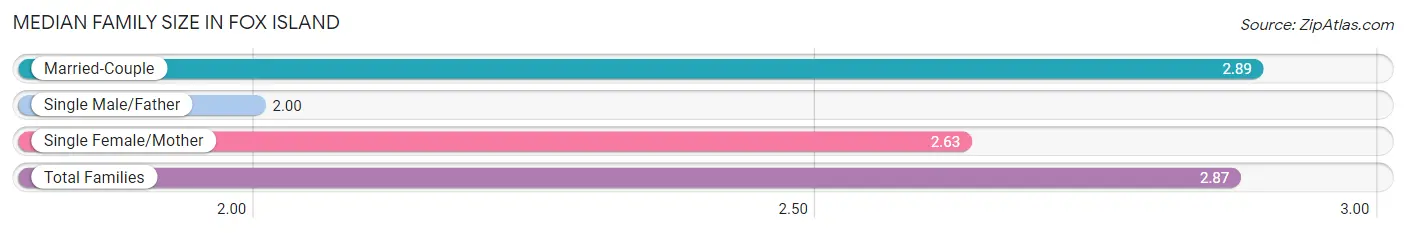
| Family Type | # Families | Family Size |
| Married-Couple | 1,069 (93.4%) | 2.89 |
| Single Male/Father | 9 (0.8%) | 2.00 |
| Single Female/Mother | 67 (5.9%) | 2.63 |
| Total Families | 1,145 (100.0%) | 2.87 |
Median Household Size in Fox Island
The median household size in Fox Island is 2.63 persons per household, with married-couple households (1,069 | 77.2%) accounting for the largest median household size of 2.92 persons per household. non-family households (240 | 17.3%) represent the smallest median household size with 1.35 persons per household.
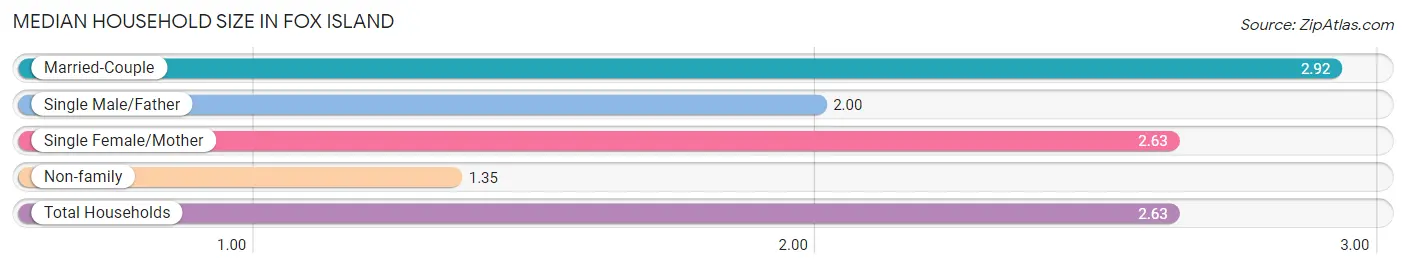
| Household Type | # Households | Household Size |
| Married-Couple | 1,069 (77.2%) | 2.92 |
| Single Male/Father | 9 (0.6%) | 2.00 |
| Single Female/Mother | 67 (4.8%) | 2.63 |
| Non-family | 240 (17.3%) | 1.35 |
| Total Households | 1,385 (100.0%) | 2.63 |
Household Size by Marriage Status in Fox Island
Out of a total of 1,385 households in Fox Island, 1,145 (82.7%) are family households, while 240 (17.3%) are nonfamily households. The most numerous type of family households are 2-person households, comprising 627, and the most common type of nonfamily households are 1-person households, comprising 176.
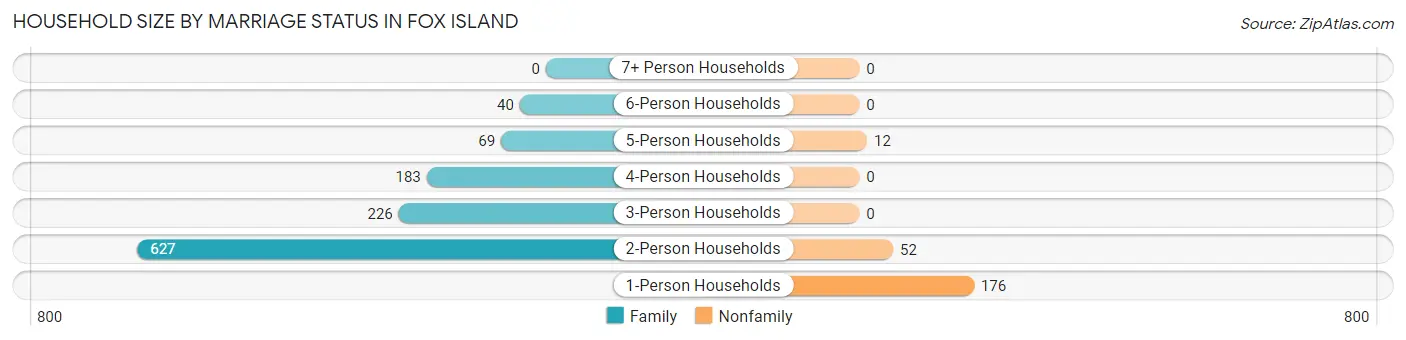
| Household Size | Family Households | Nonfamily Households |
| 1-Person Households | - | 176 (12.7%) |
| 2-Person Households | 627 (45.3%) | 52 (3.7%) |
| 3-Person Households | 226 (16.3%) | 0 (0.0%) |
| 4-Person Households | 183 (13.2%) | 0 (0.0%) |
| 5-Person Households | 69 (5.0%) | 12 (0.9%) |
| 6-Person Households | 40 (2.9%) | 0 (0.0%) |
| 7+ Person Households | 0 (0.0%) | 0 (0.0%) |
| Total | 1,145 (82.7%) | 240 (17.3%) |
Female Fertility in Fox Island
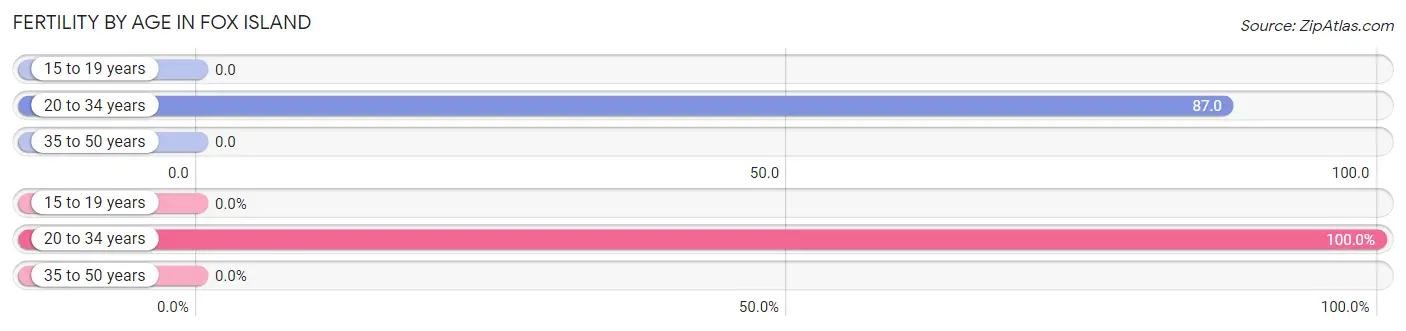
Fertility by Age in Fox Island
Average fertility rate in Fox Island is 17.0 births per 1,000 women. Women in the age bracket of 20 to 34 years have the highest fertility rate with 87.0 births per 1,000 women. Women in the age bracket of 20 to 34 years acount for 100.0% of all women with births.
| Age Bracket | Women with Births | Births / 1,000 Women |
| 15 to 19 years | 0 (0.0%) | 0.0 |
| 20 to 34 years | 10 (100.0%) | 87.0 |
| 35 to 50 years | 0 (0.0%) | 0.0 |
| Total | 10 (100.0%) | 17.0 |
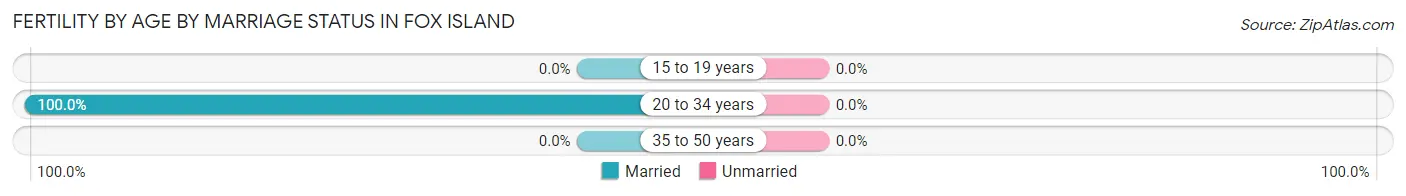
Fertility by Age by Marriage Status in Fox Island
| Age Bracket | Married | Unmarried |
| 15 to 19 years | 0 (0.0%) | 0 (0.0%) |
| 20 to 34 years | 10 (100.0%) | 0 (0.0%) |
| 35 to 50 years | 0 (0.0%) | 0 (0.0%) |
| Total | 10 (100.0%) | 0 (0.0%) |
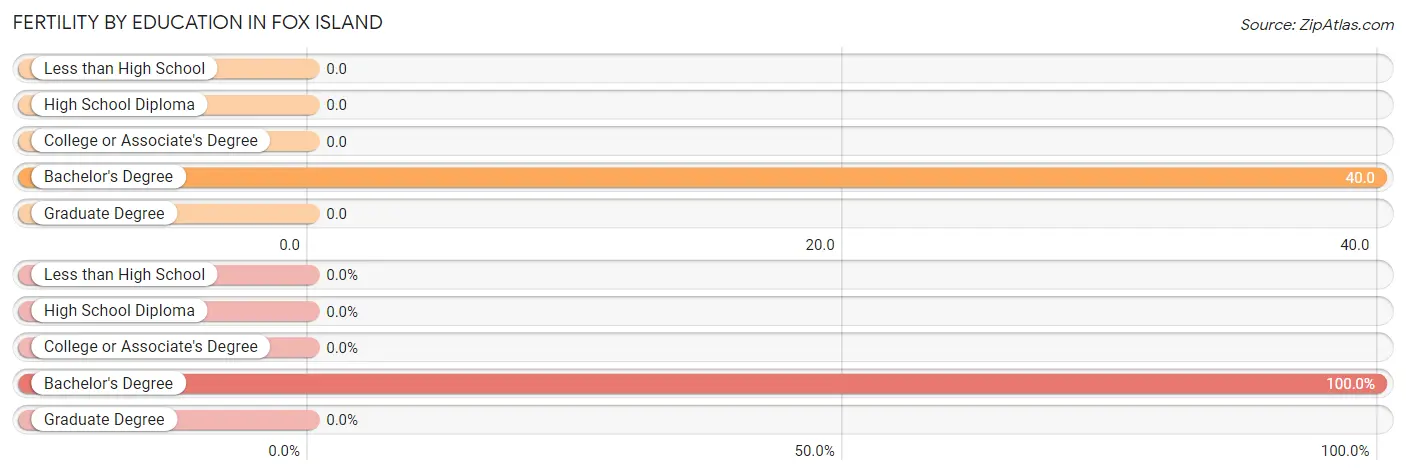
Fertility by Education in Fox Island
| Educational Attainment | Women with Births | Births / 1,000 Women |
| Less than High School | 0 (0.0%) | 0.0 |
| High School Diploma | 0 (0.0%) | 0.0 |
| College or Associate's Degree | 0 (0.0%) | 0.0 |
| Bachelor's Degree | 10 (100.0%) | 40.0 |
| Graduate Degree | 0 (0.0%) | 0.0 |
| Total | 10 (100.0%) | 17.0 |
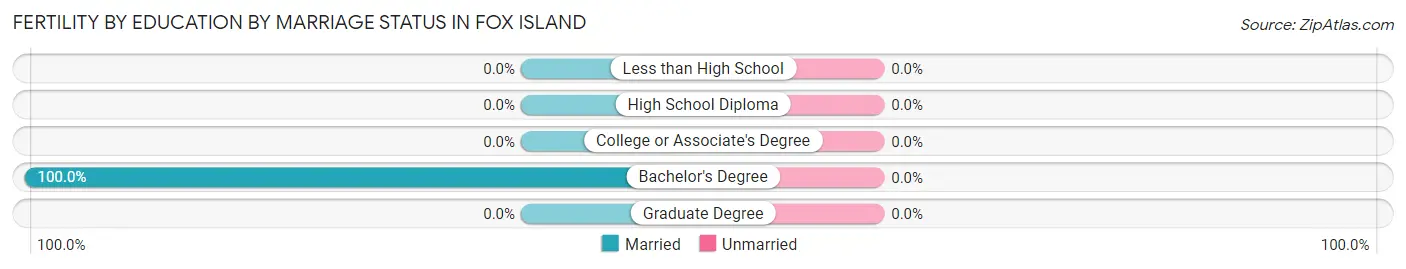
Fertility by Education by Marriage Status in Fox Island
| Educational Attainment | Married | Unmarried |
| Less than High School | 0 (0.0%) | 0 (0.0%) |
| High School Diploma | 0 (0.0%) | 0 (0.0%) |
| College or Associate's Degree | 0 (0.0%) | 0 (0.0%) |
| Bachelor's Degree | 10 (100.0%) | 0 (0.0%) |
| Graduate Degree | 0 (0.0%) | 0 (0.0%) |
| Total | 10 (100.0%) | 0 (0.0%) |
Employment Characteristics in Fox Island
Employment by Class of Employer in Fox Island
Among the 1,517 employed individuals in Fox Island, private company employees (716 | 47.2%), self-employed (incorporated) (205 | 13.5%), and local government employees (177 | 11.7%) make up the most common classes of employment.
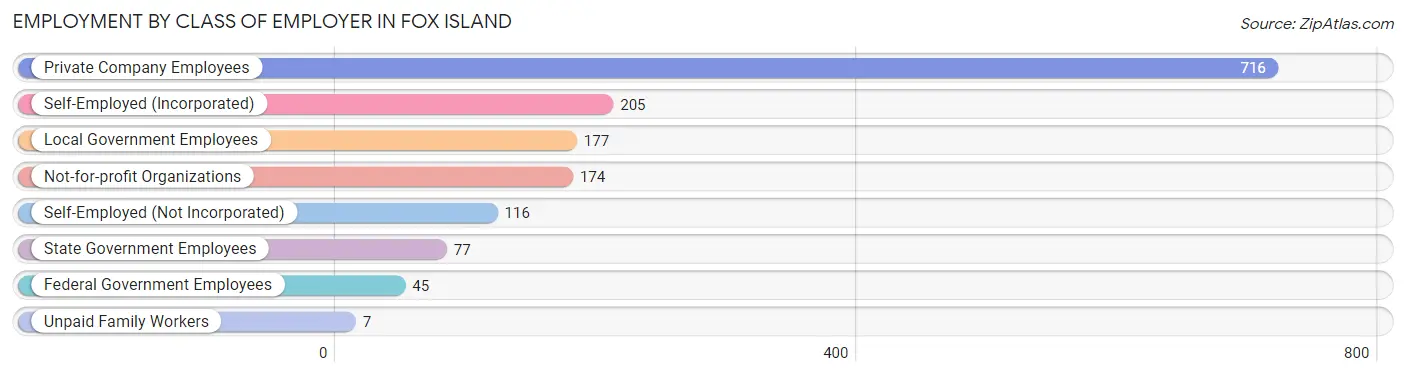
| Employer Class | # Employees | % Employees |
| Private Company Employees | 716 | 47.2% |
| Self-Employed (Incorporated) | 205 | 13.5% |
| Self-Employed (Not Incorporated) | 116 | 7.6% |
| Not-for-profit Organizations | 174 | 11.5% |
| Local Government Employees | 177 | 11.7% |
| State Government Employees | 77 | 5.1% |
| Federal Government Employees | 45 | 3.0% |
| Unpaid Family Workers | 7 | 0.5% |
| Total | 1,517 | 100.0% |
Employment Status by Age in Fox Island
According to the labor force statistics for Fox Island, out of the total population over 16 years of age (2,992), 53.5% or 1,601 individuals are in the labor force, with 4.6% or 74 of them unemployed. The age group with the highest labor force participation rate is 25 to 29 years, with 100.0% or 62 individuals in the labor force. Within the labor force, the 20 to 24 years age range has the highest percentage of unemployed individuals, with 51.7% or 15 of them being unemployed.
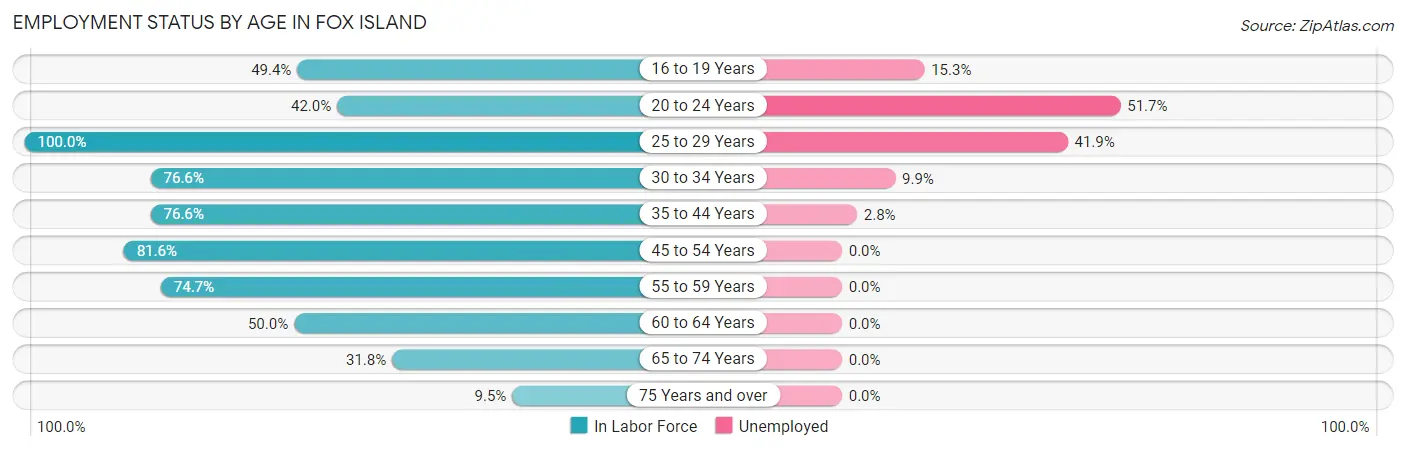
| Age Bracket | In Labor Force | Unemployed |
| 16 to 19 Years | 85 (49.4%) | 13 (15.3%) |
| 20 to 24 Years | 29 (42.0%) | 15 (51.7%) |
| 25 to 29 Years | 62 (100.0%) | 26 (41.9%) |
| 30 to 34 Years | 111 (76.6%) | 11 (9.9%) |
| 35 to 44 Years | 318 (76.6%) | 9 (2.8%) |
| 45 to 54 Years | 422 (81.6%) | 0 (0.0%) |
| 55 to 59 Years | 148 (74.7%) | 0 (0.0%) |
| 60 to 64 Years | 174 (50.0%) | 0 (0.0%) |
| 65 to 74 Years | 215 (31.8%) | 0 (0.0%) |
| 75 Years and over | 37 (9.5%) | 0 (0.0%) |
| Total | 1,601 (53.5%) | 74 (4.6%) |
Employment Status by Educational Attainment in Fox Island
According to labor force statistics for Fox Island, 73.3% of individuals (1,235) out of the total population between 25 and 64 years of age (1,685) are in the labor force, with 3.7% or 46 of them being unemployed. The group with the highest labor force participation rate are those with the educational attainment of college / associate degree, with 91.6% or 369 individuals in the labor force. Within the labor force, individuals with less than high school education have the highest percentage of unemployment, with 46.9% or 15 of them being unemployed.
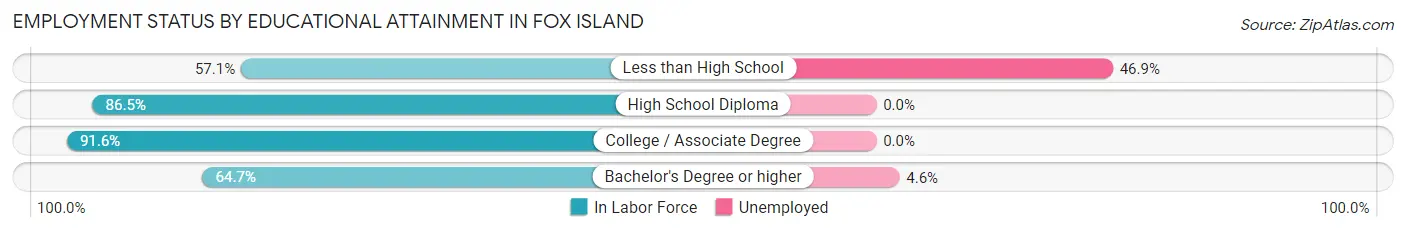
| Educational Attainment | In Labor Force | Unemployed |
| Less than High School | 32 (57.1%) | 26 (46.9%) |
| High School Diploma | 160 (86.5%) | 0 (0.0%) |
| College / Associate Degree | 369 (91.6%) | 0 (0.0%) |
| Bachelor's Degree or higher | 674 (64.7%) | 48 (4.6%) |
| Total | 1,235 (73.3%) | 62 (3.7%) |
Employment Occupations by Sex in Fox Island
Management, Business, Science and Arts Occupations
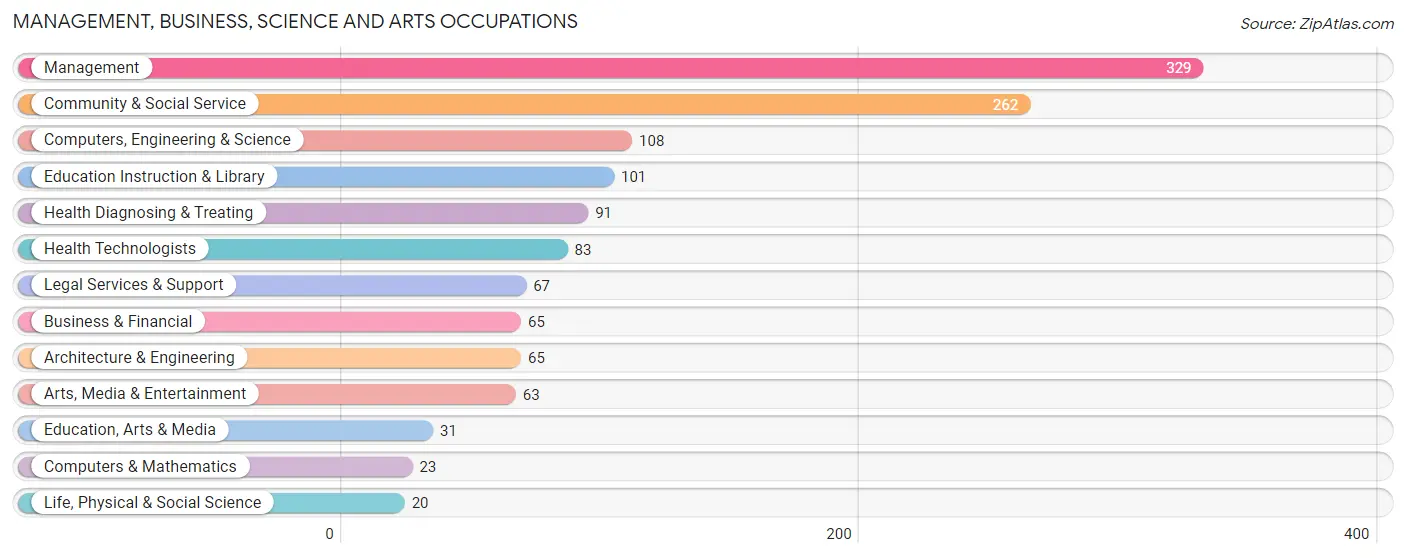
The most common Management, Business, Science and Arts occupations in Fox Island are Management (329 | 21.5%), Community & Social Service (262 | 17.2%), Computers, Engineering & Science (108 | 7.1%), Education Instruction & Library (101 | 6.6%), and Health Diagnosing & Treating (91 | 6.0%).
Management, Business, Science and Arts Occupations by Sex
Within the Management, Business, Science and Arts occupations in Fox Island, the most male-oriented occupations are Computers & Mathematics (100.0%), Architecture & Engineering (84.6%), and Management (82.7%), while the most female-oriented occupations are Life, Physical & Social Science (100.0%), Health Diagnosing & Treating (72.5%), and Health Technologists (69.9%).
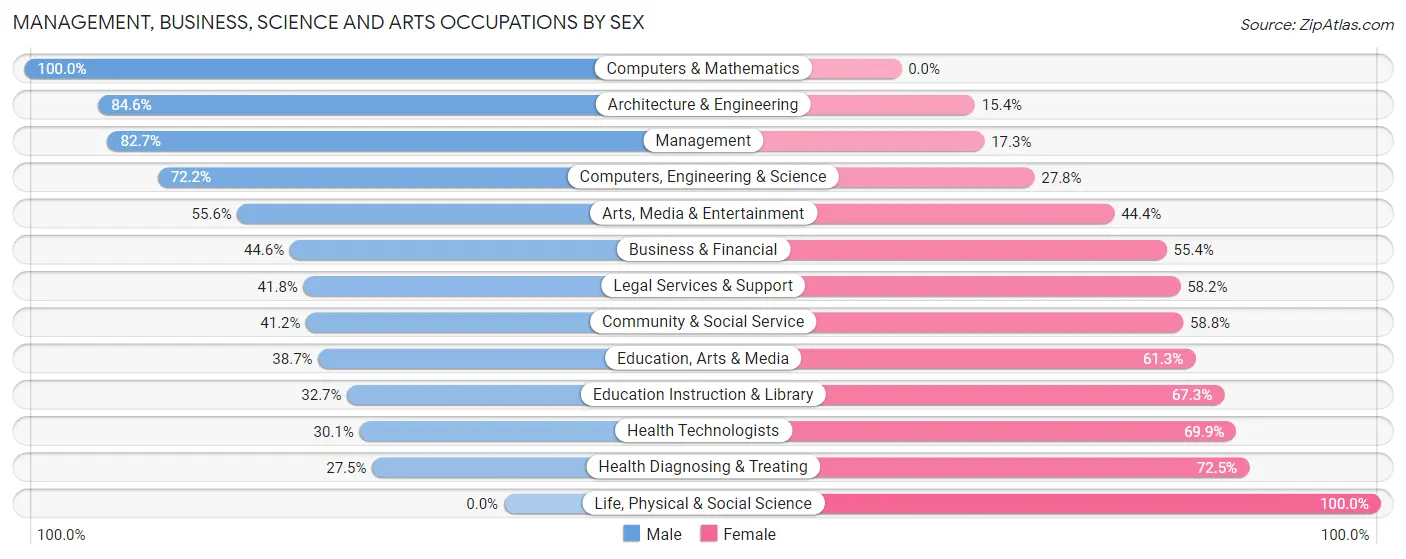
| Occupation | Male | Female |
| Management | 272 (82.7%) | 57 (17.3%) |
| Business & Financial | 29 (44.6%) | 36 (55.4%) |
| Computers, Engineering & Science | 78 (72.2%) | 30 (27.8%) |
| Computers & Mathematics | 23 (100.0%) | 0 (0.0%) |
| Architecture & Engineering | 55 (84.6%) | 10 (15.4%) |
| Life, Physical & Social Science | 0 (0.0%) | 20 (100.0%) |
| Community & Social Service | 108 (41.2%) | 154 (58.8%) |
| Education, Arts & Media | 12 (38.7%) | 19 (61.3%) |
| Legal Services & Support | 28 (41.8%) | 39 (58.2%) |
| Education Instruction & Library | 33 (32.7%) | 68 (67.3%) |
| Arts, Media & Entertainment | 35 (55.6%) | 28 (44.4%) |
| Health Diagnosing & Treating | 25 (27.5%) | 66 (72.5%) |
| Health Technologists | 25 (30.1%) | 58 (69.9%) |
| Total (Category) | 512 (59.9%) | 343 (40.1%) |
| Total (Overall) | 889 (58.2%) | 638 (41.8%) |
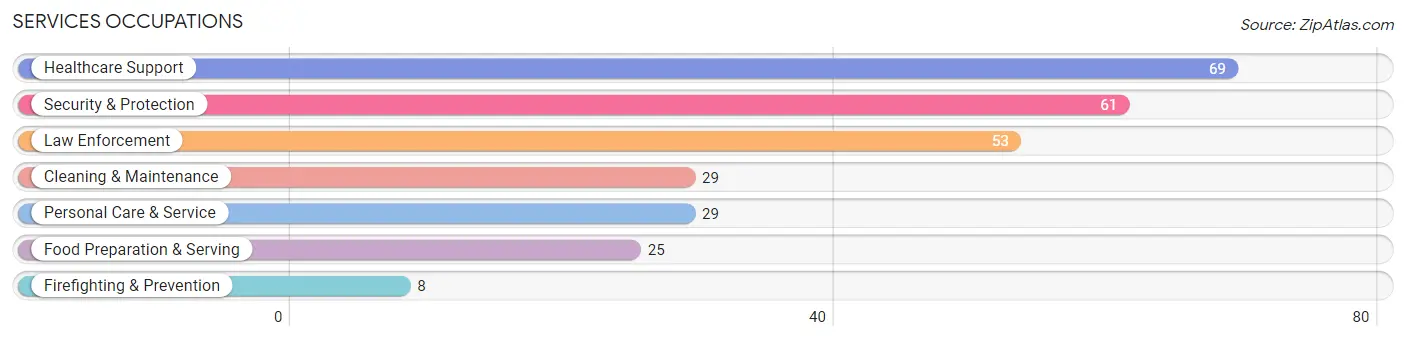
Services Occupations
The most common Services occupations in Fox Island are Healthcare Support (69 | 4.5%), Security & Protection (61 | 4.0%), Law Enforcement (53 | 3.5%), Cleaning & Maintenance (29 | 1.9%), and Personal Care & Service (29 | 1.9%).
Services Occupations by Sex
Within the Services occupations in Fox Island, the most male-oriented occupations are Firefighting & Prevention (100.0%), Security & Protection (83.6%), and Law Enforcement (81.1%), while the most female-oriented occupations are Healthcare Support (100.0%), Food Preparation & Serving (36.0%), and Cleaning & Maintenance (31.0%).
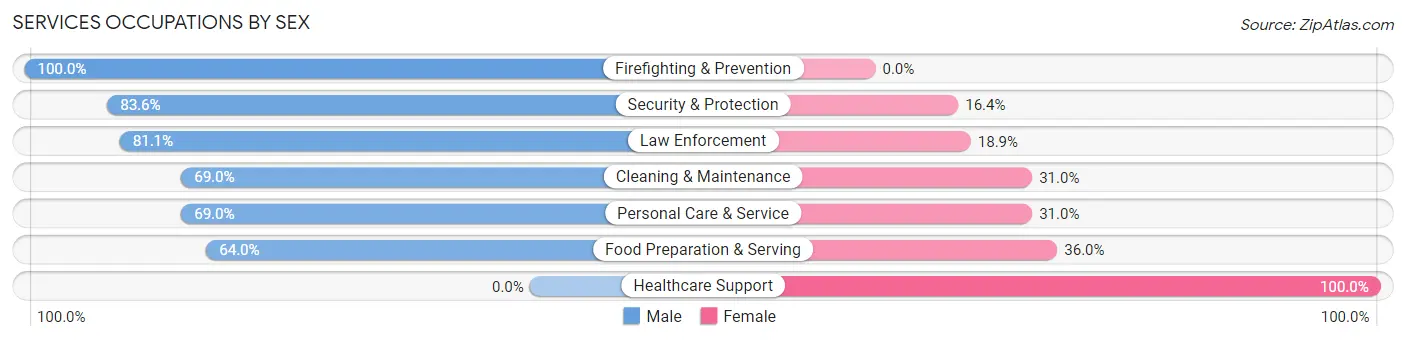
| Occupation | Male | Female |
| Healthcare Support | 0 (0.0%) | 69 (100.0%) |
| Security & Protection | 51 (83.6%) | 10 (16.4%) |
| Firefighting & Prevention | 8 (100.0%) | 0 (0.0%) |
| Law Enforcement | 43 (81.1%) | 10 (18.9%) |
| Food Preparation & Serving | 16 (64.0%) | 9 (36.0%) |
| Cleaning & Maintenance | 20 (69.0%) | 9 (31.0%) |
| Personal Care & Service | 20 (69.0%) | 9 (31.0%) |
| Total (Category) | 107 (50.2%) | 106 (49.8%) |
| Total (Overall) | 889 (58.2%) | 638 (41.8%) |
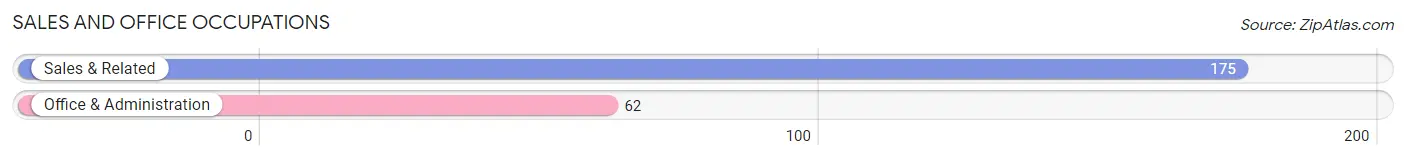
Sales and Office Occupations
The most common Sales and Office occupations in Fox Island are Sales & Related (175 | 11.5%), and Office & Administration (62 | 4.1%).
Sales and Office Occupations by Sex
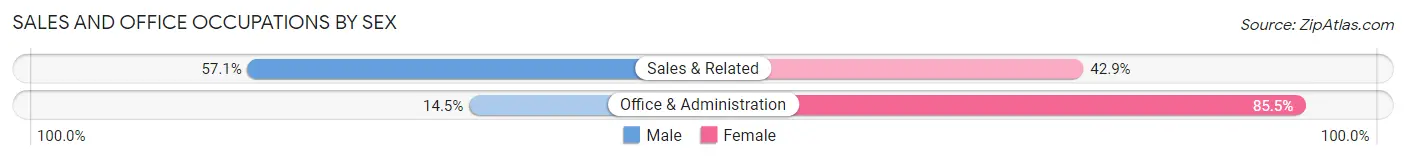
| Occupation | Male | Female |
| Sales & Related | 100 (57.1%) | 75 (42.9%) |
| Office & Administration | 9 (14.5%) | 53 (85.5%) |
| Total (Category) | 109 (46.0%) | 128 (54.0%) |
| Total (Overall) | 889 (58.2%) | 638 (41.8%) |
Natural Resources, Construction and Maintenance Occupations
The most common Natural Resources, Construction and Maintenance occupations in Fox Island are , and Construction & Extraction (60 | 3.9%).
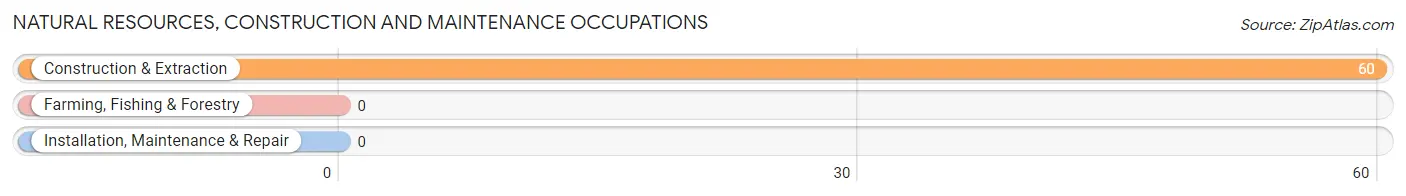
Natural Resources, Construction and Maintenance Occupations by Sex
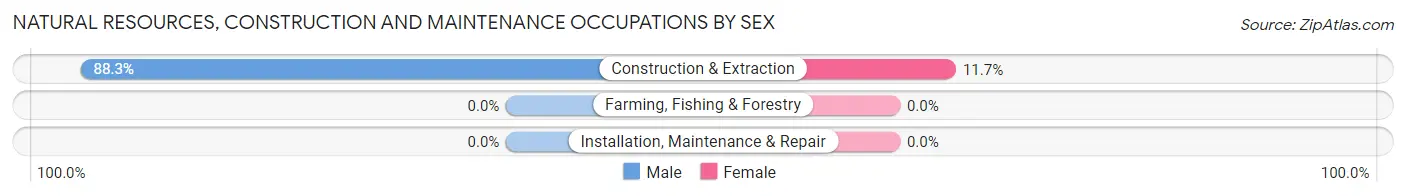
| Occupation | Male | Female |
| Farming, Fishing & Forestry | 0 (0.0%) | 0 (0.0%) |
| Construction & Extraction | 53 (88.3%) | 7 (11.7%) |
| Installation, Maintenance & Repair | 0 (0.0%) | 0 (0.0%) |
| Total (Category) | 53 (88.3%) | 7 (11.7%) |
| Total (Overall) | 889 (58.2%) | 638 (41.8%) |
Production, Transportation and Moving Occupations
The most common Production, Transportation and Moving occupations in Fox Island are Material Moving (91 | 6.0%), Transportation (51 | 3.3%), and Production (20 | 1.3%).
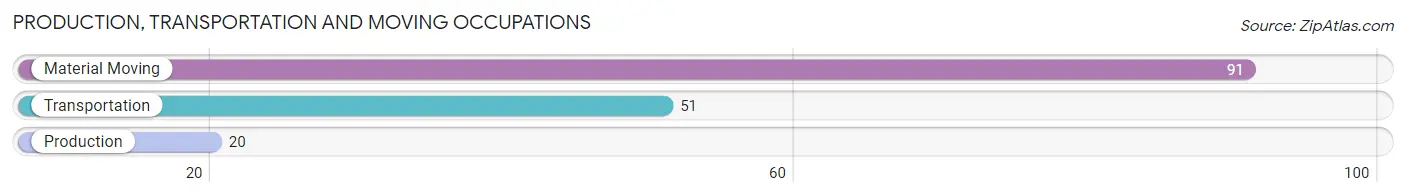
Production, Transportation and Moving Occupations by Sex
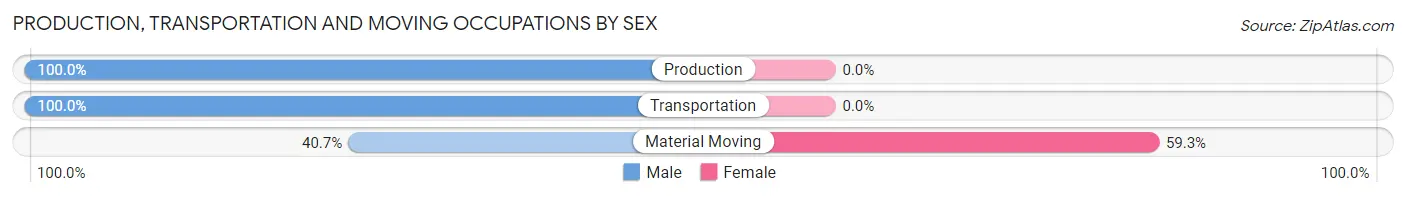
| Occupation | Male | Female |
| Production | 20 (100.0%) | 0 (0.0%) |
| Transportation | 51 (100.0%) | 0 (0.0%) |
| Material Moving | 37 (40.7%) | 54 (59.3%) |
| Total (Category) | 108 (66.7%) | 54 (33.3%) |
| Total (Overall) | 889 (58.2%) | 638 (41.8%) |
Employment Industries by Sex in Fox Island
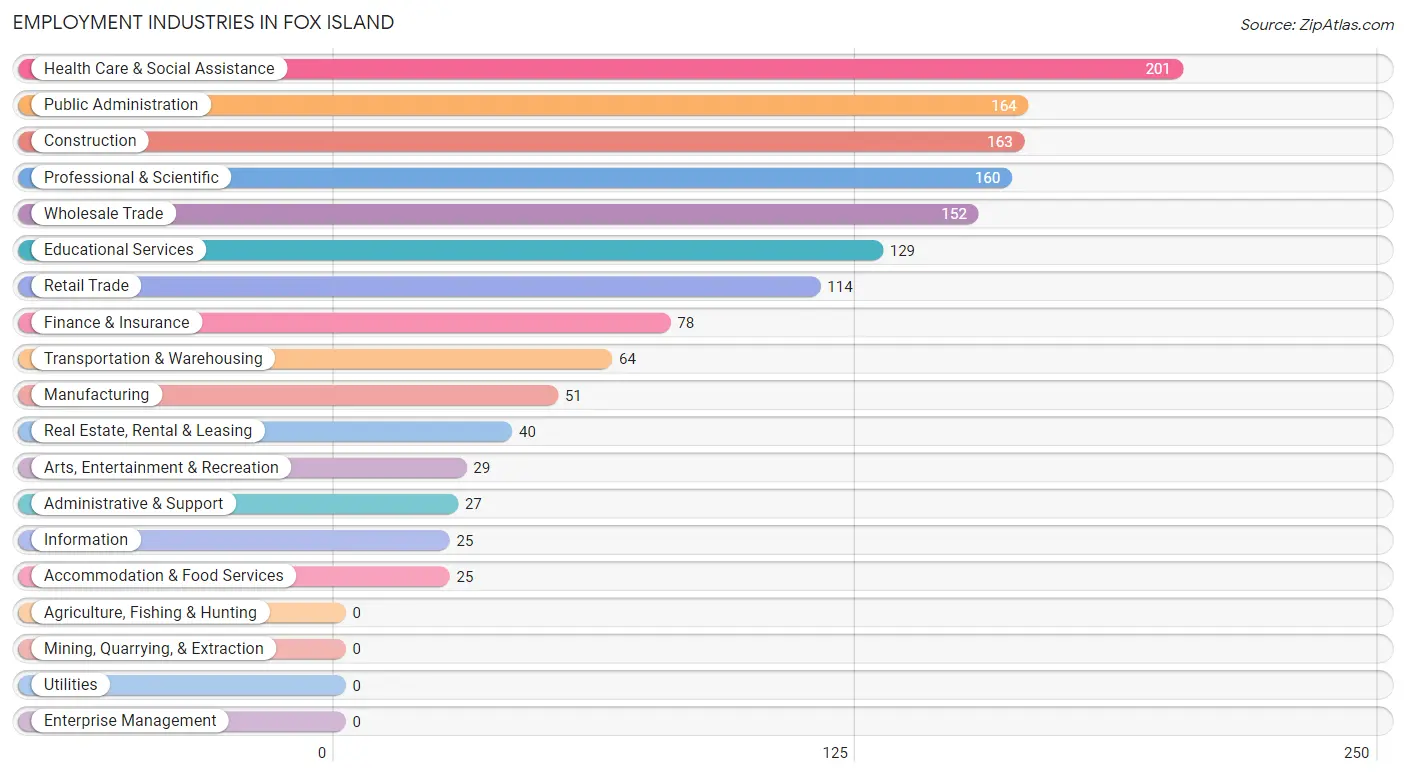
Employment Industries in Fox Island
The major employment industries in Fox Island include Health Care & Social Assistance (201 | 13.2%), Public Administration (164 | 10.7%), Construction (163 | 10.7%), Professional & Scientific (160 | 10.5%), and Wholesale Trade (152 | 10.0%).
Employment Industries by Sex in Fox Island
The Fox Island industries that see more men than women are Transportation & Warehousing (100.0%), Administrative & Support (100.0%), and Arts, Entertainment & Recreation (100.0%), whereas the industries that tend to have a higher number of women are Health Care & Social Assistance (81.6%), Finance & Insurance (70.5%), and Educational Services (59.7%).
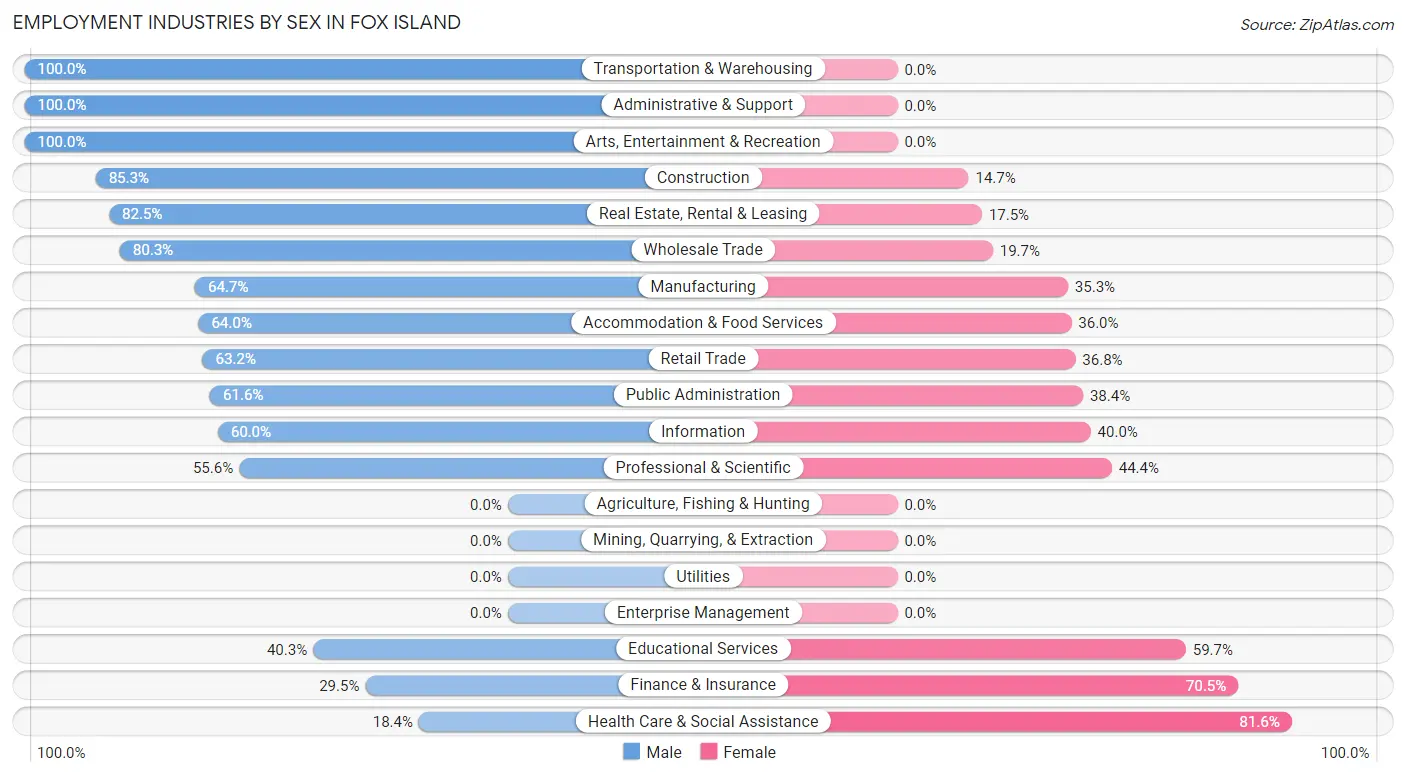
| Industry | Male | Female |
| Agriculture, Fishing & Hunting | 0 (0.0%) | 0 (0.0%) |
| Mining, Quarrying, & Extraction | 0 (0.0%) | 0 (0.0%) |
| Construction | 139 (85.3%) | 24 (14.7%) |
| Manufacturing | 33 (64.7%) | 18 (35.3%) |
| Wholesale Trade | 122 (80.3%) | 30 (19.7%) |
| Retail Trade | 72 (63.2%) | 42 (36.8%) |
| Transportation & Warehousing | 64 (100.0%) | 0 (0.0%) |
| Utilities | 0 (0.0%) | 0 (0.0%) |
| Information | 15 (60.0%) | 10 (40.0%) |
| Finance & Insurance | 23 (29.5%) | 55 (70.5%) |
| Real Estate, Rental & Leasing | 33 (82.5%) | 7 (17.5%) |
| Professional & Scientific | 89 (55.6%) | 71 (44.4%) |
| Enterprise Management | 0 (0.0%) | 0 (0.0%) |
| Administrative & Support | 27 (100.0%) | 0 (0.0%) |
| Educational Services | 52 (40.3%) | 77 (59.7%) |
| Health Care & Social Assistance | 37 (18.4%) | 164 (81.6%) |
| Arts, Entertainment & Recreation | 29 (100.0%) | 0 (0.0%) |
| Accommodation & Food Services | 16 (64.0%) | 9 (36.0%) |
| Public Administration | 101 (61.6%) | 63 (38.4%) |
| Total | 889 (58.2%) | 638 (41.8%) |
Education in Fox Island
School Enrollment in Fox Island
The most common levels of schooling among the 742 students in Fox Island are middle school (291 | 39.2%), high school (164 | 22.1%), and elementary school (101 | 13.6%).
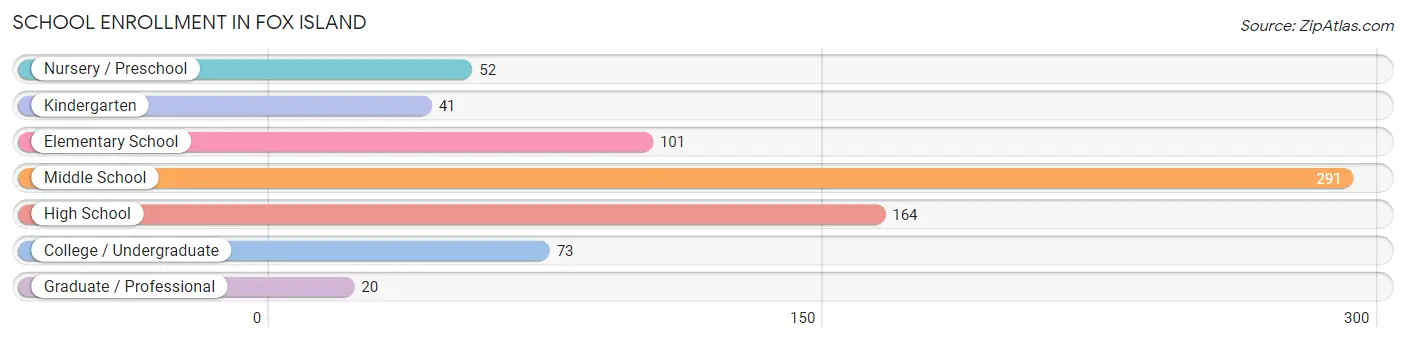
| School Level | # Students | % Students |
| Nursery / Preschool | 52 | 7.0% |
| Kindergarten | 41 | 5.5% |
| Elementary School | 101 | 13.6% |
| Middle School | 291 | 39.2% |
| High School | 164 | 22.1% |
| College / Undergraduate | 73 | 9.8% |
| Graduate / Professional | 20 | 2.7% |
| Total | 742 | 100.0% |
School Enrollment by Age by Funding Source in Fox Island
Out of a total of 742 students who are enrolled in schools in Fox Island, 241 (32.5%) attend a private institution, while the remaining 501 (67.5%) are enrolled in public schools. The age group of 3 to 4 year olds has the highest likelihood of being enrolled in private schools, with 32 (76.2% in the age bracket) enrolled. Conversely, the age group of 20 to 24 year olds has the lowest likelihood of being enrolled in a private school, with 15 (100.0% in the age bracket) attending a public institution.
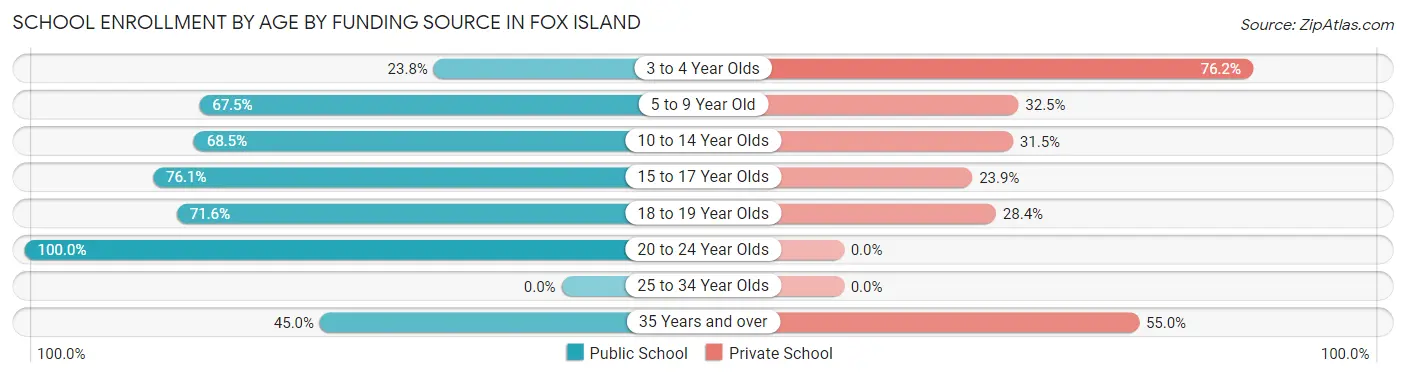
| Age Bracket | Public School | Private School |
| 3 to 4 Year Olds | 10 (23.8%) | 32 (76.2%) |
| 5 to 9 Year Old | 85 (67.5%) | 41 (32.5%) |
| 10 to 14 Year Olds | 226 (68.5%) | 104 (31.5%) |
| 15 to 17 Year Olds | 108 (76.1%) | 34 (23.9%) |
| 18 to 19 Year Olds | 48 (71.6%) | 19 (28.4%) |
| 20 to 24 Year Olds | 15 (100.0%) | 0 (0.0%) |
| 25 to 34 Year Olds | 0 (0.0%) | 0 (0.0%) |
| 35 Years and over | 9 (45.0%) | 11 (55.0%) |
| Total | 501 (67.5%) | 241 (32.5%) |
Educational Attainment by Field of Study in Fox Island
Business (303 | 17.0%), science & technology (241 | 13.5%), social sciences (209 | 11.7%), education (200 | 11.2%), and arts & humanities (127 | 7.1%) are the most common fields of study among 1,783 individuals in Fox Island who have obtained a bachelor's degree or higher.
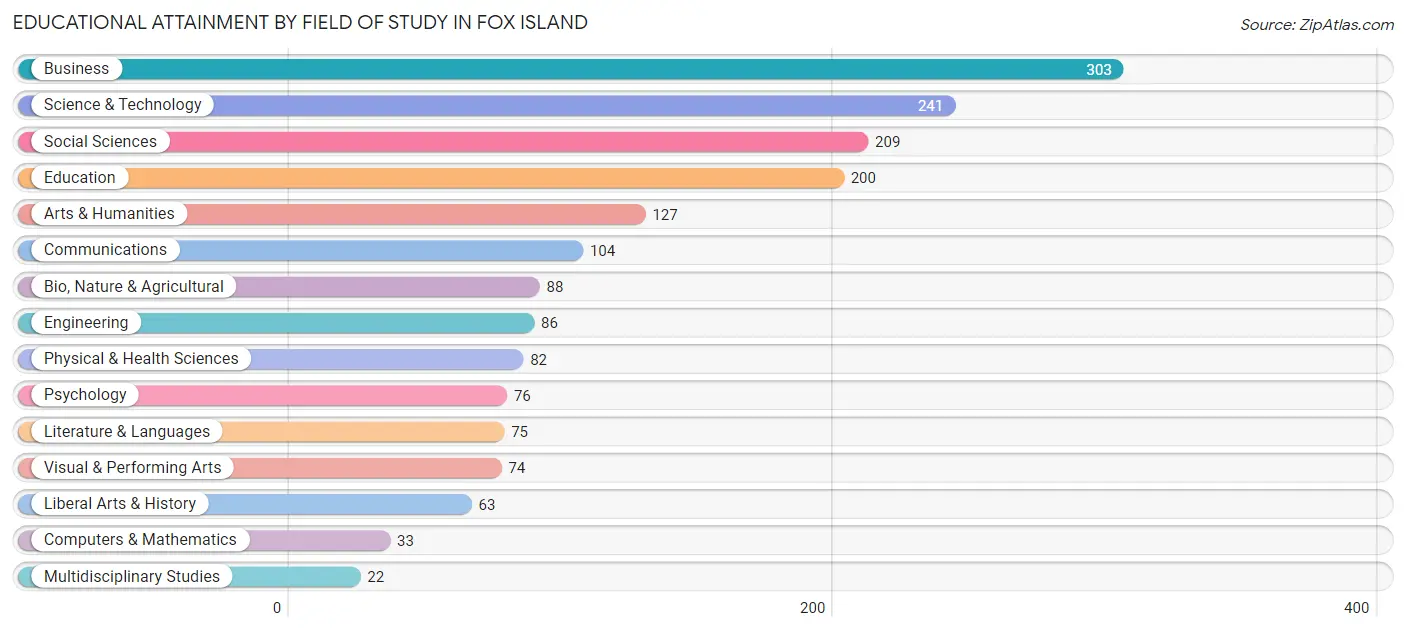
| Field of Study | # Graduates | % Graduates |
| Computers & Mathematics | 33 | 1.8% |
| Bio, Nature & Agricultural | 88 | 4.9% |
| Physical & Health Sciences | 82 | 4.6% |
| Psychology | 76 | 4.3% |
| Social Sciences | 209 | 11.7% |
| Engineering | 86 | 4.8% |
| Multidisciplinary Studies | 22 | 1.2% |
| Science & Technology | 241 | 13.5% |
| Business | 303 | 17.0% |
| Education | 200 | 11.2% |
| Literature & Languages | 75 | 4.2% |
| Liberal Arts & History | 63 | 3.5% |
| Visual & Performing Arts | 74 | 4.2% |
| Communications | 104 | 5.8% |
| Arts & Humanities | 127 | 7.1% |
| Total | 1,783 | 100.0% |
Transportation & Commute in Fox Island
Vehicle Availability by Sex in Fox Island
The most prevalent vehicle ownership categories in Fox Island are males with 2 vehicles (355, accounting for 39.9%) and females with 2 vehicles (282, making up 56.5%).
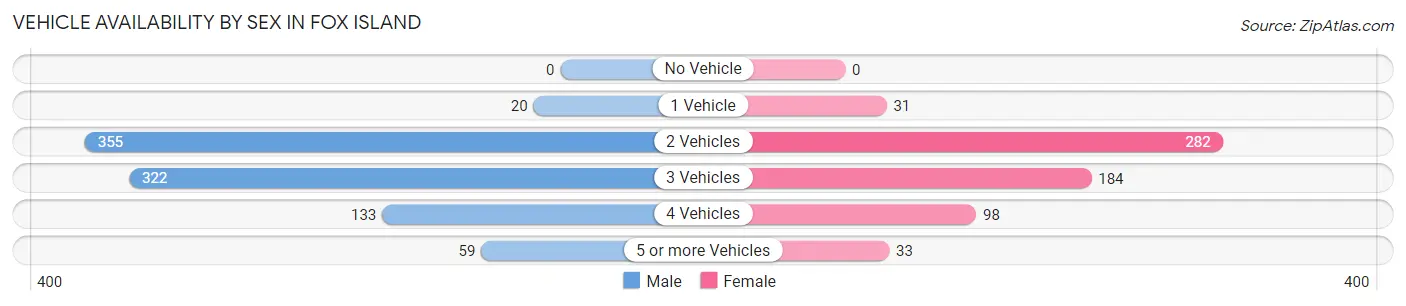
| Vehicles Available | Male | Female |
| No Vehicle | 0 (0.0%) | 0 (0.0%) |
| 1 Vehicle | 20 (2.2%) | 31 (4.9%) |
| 2 Vehicles | 355 (39.9%) | 282 (44.9%) |
| 3 Vehicles | 322 (36.2%) | 184 (29.3%) |
| 4 Vehicles | 133 (15.0%) | 98 (15.6%) |
| 5 or more Vehicles | 59 (6.6%) | 33 (5.2%) |
| Total | 889 (100.0%) | 628 (100.0%) |
Commute Time in Fox Island
The most frequently occuring commute durations in Fox Island are 30 to 34 minutes (270 commuters, 22.2%), 15 to 19 minutes (178 commuters, 14.6%), and 20 to 24 minutes (172 commuters, 14.1%).
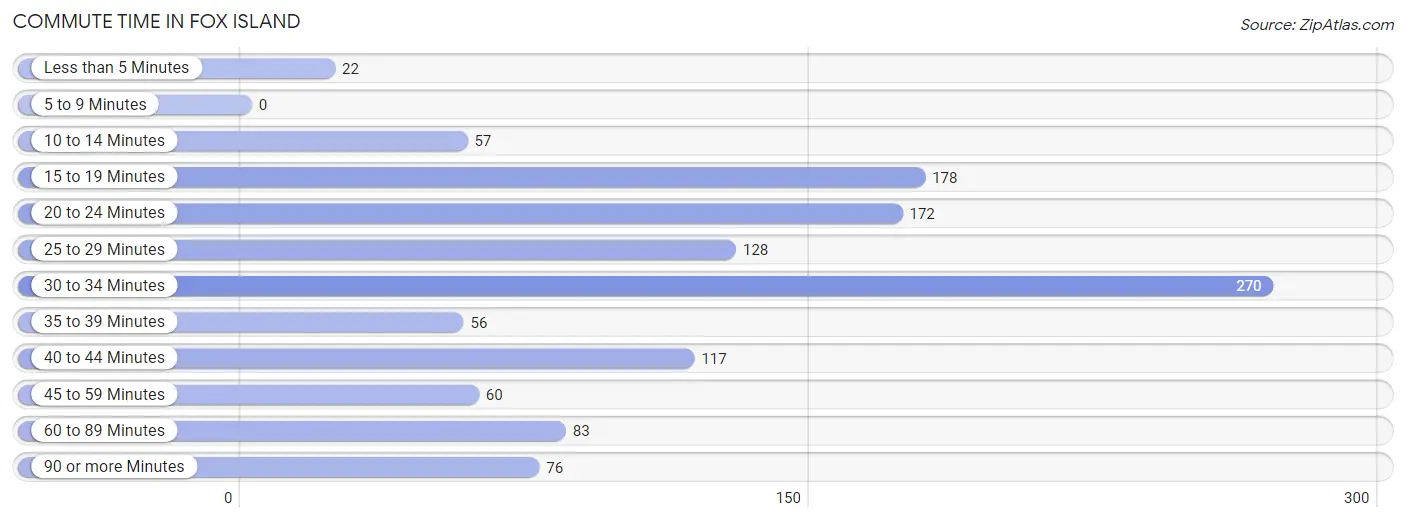
| Commute Time | # Commuters | % Commuters |
| Less than 5 Minutes | 22 | 1.8% |
| 5 to 9 Minutes | 0 | 0.0% |
| 10 to 14 Minutes | 57 | 4.7% |
| 15 to 19 Minutes | 178 | 14.6% |
| 20 to 24 Minutes | 172 | 14.1% |
| 25 to 29 Minutes | 128 | 10.5% |
| 30 to 34 Minutes | 270 | 22.2% |
| 35 to 39 Minutes | 56 | 4.6% |
| 40 to 44 Minutes | 117 | 9.6% |
| 45 to 59 Minutes | 60 | 4.9% |
| 60 to 89 Minutes | 83 | 6.8% |
| 90 or more Minutes | 76 | 6.2% |
Commute Time by Sex in Fox Island
The most common commute times in Fox Island are 30 to 34 minutes (180 commuters, 24.5%) for males and 15 to 19 minutes (101 commuters, 20.9%) for females.
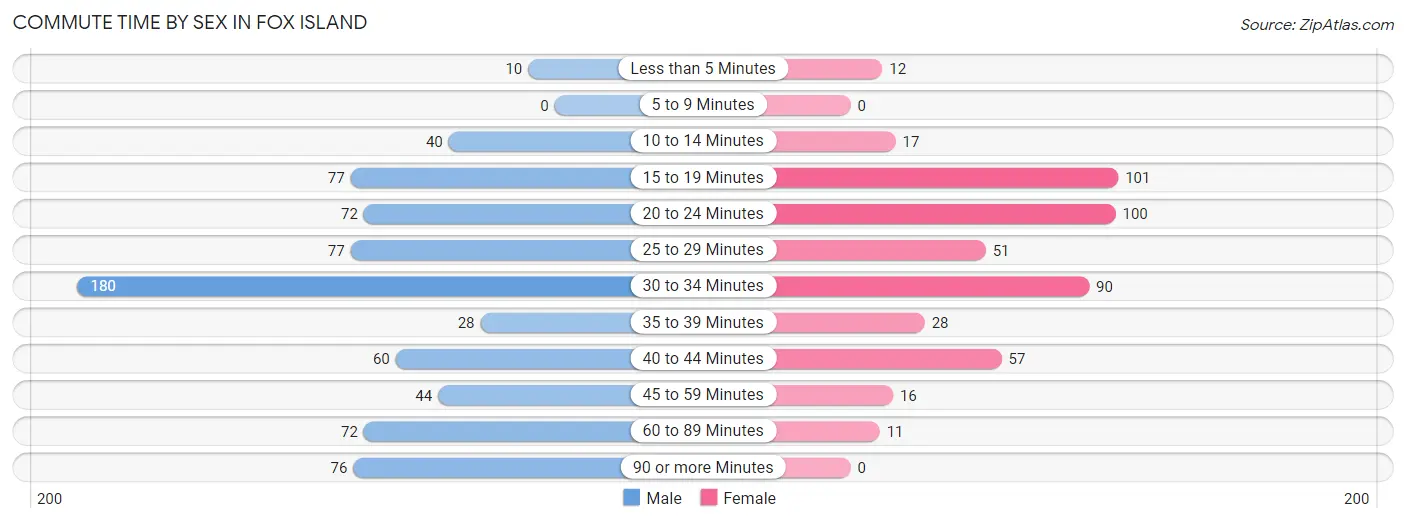
| Commute Time | Male | Female |
| Less than 5 Minutes | 10 (1.4%) | 12 (2.5%) |
| 5 to 9 Minutes | 0 (0.0%) | 0 (0.0%) |
| 10 to 14 Minutes | 40 (5.4%) | 17 (3.5%) |
| 15 to 19 Minutes | 77 (10.5%) | 101 (20.9%) |
| 20 to 24 Minutes | 72 (9.8%) | 100 (20.7%) |
| 25 to 29 Minutes | 77 (10.5%) | 51 (10.6%) |
| 30 to 34 Minutes | 180 (24.5%) | 90 (18.6%) |
| 35 to 39 Minutes | 28 (3.8%) | 28 (5.8%) |
| 40 to 44 Minutes | 60 (8.2%) | 57 (11.8%) |
| 45 to 59 Minutes | 44 (6.0%) | 16 (3.3%) |
| 60 to 89 Minutes | 72 (9.8%) | 11 (2.3%) |
| 90 or more Minutes | 76 (10.3%) | 0 (0.0%) |
Time of Departure to Work by Sex in Fox Island
The most frequent times of departure to work in Fox Island are 7:00 AM to 7:29 AM (140, 19.0%) for males and 7:00 AM to 7:29 AM (82, 17.0%) for females.
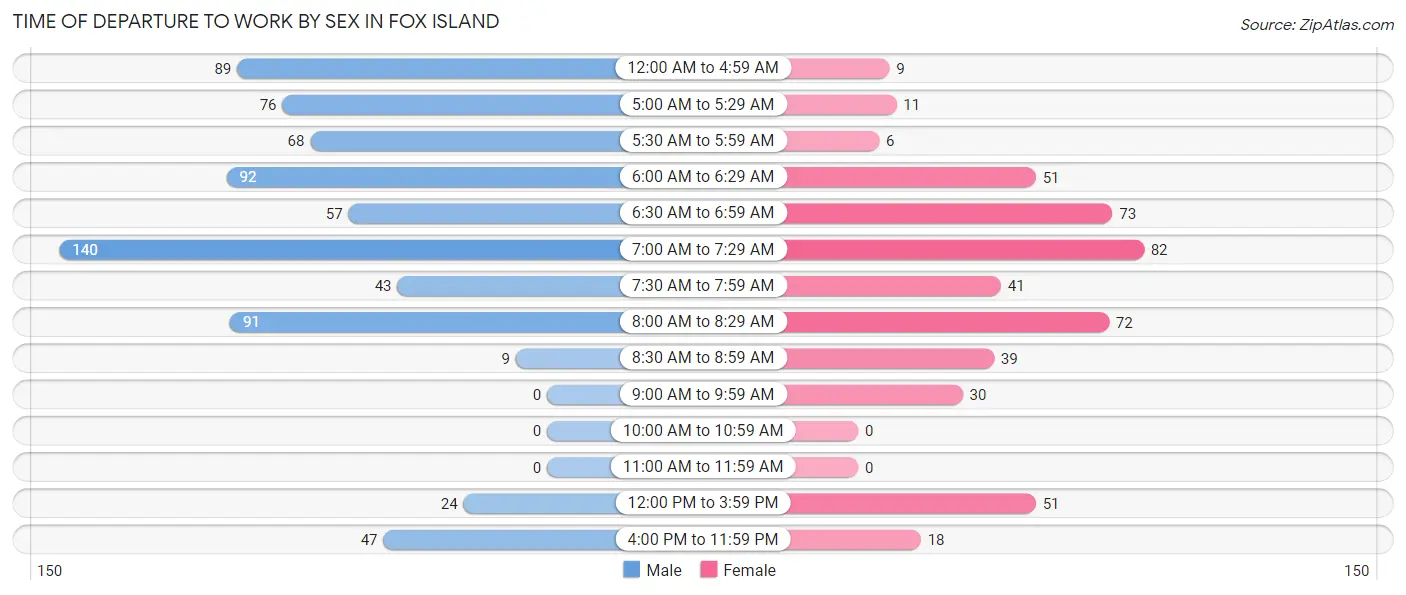
| Time of Departure | Male | Female |
| 12:00 AM to 4:59 AM | 89 (12.1%) | 9 (1.9%) |
| 5:00 AM to 5:29 AM | 76 (10.3%) | 11 (2.3%) |
| 5:30 AM to 5:59 AM | 68 (9.2%) | 6 (1.2%) |
| 6:00 AM to 6:29 AM | 92 (12.5%) | 51 (10.6%) |
| 6:30 AM to 6:59 AM | 57 (7.7%) | 73 (15.1%) |
| 7:00 AM to 7:29 AM | 140 (19.0%) | 82 (17.0%) |
| 7:30 AM to 7:59 AM | 43 (5.8%) | 41 (8.5%) |
| 8:00 AM to 8:29 AM | 91 (12.4%) | 72 (14.9%) |
| 8:30 AM to 8:59 AM | 9 (1.2%) | 39 (8.1%) |
| 9:00 AM to 9:59 AM | 0 (0.0%) | 30 (6.2%) |
| 10:00 AM to 10:59 AM | 0 (0.0%) | 0 (0.0%) |
| 11:00 AM to 11:59 AM | 0 (0.0%) | 0 (0.0%) |
| 12:00 PM to 3:59 PM | 24 (3.3%) | 51 (10.6%) |
| 4:00 PM to 11:59 PM | 47 (6.4%) | 18 (3.7%) |
| Total | 736 (100.0%) | 483 (100.0%) |
Housing Occupancy in Fox Island
Occupancy by Ownership in Fox Island
Of the total 1,385 dwellings in Fox Island, owner-occupied units account for 1,316 (95.0%), while renter-occupied units make up 69 (5.0%).
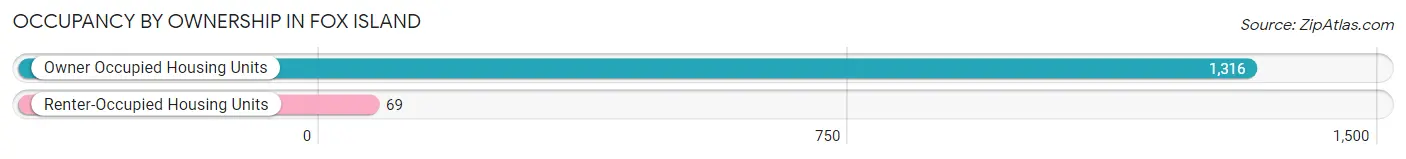
| Occupancy | # Housing Units | % Housing Units |
| Owner Occupied Housing Units | 1,316 | 95.0% |
| Renter-Occupied Housing Units | 69 | 5.0% |
| Total Occupied Housing Units | 1,385 | 100.0% |
Occupancy by Household Size in Fox Island
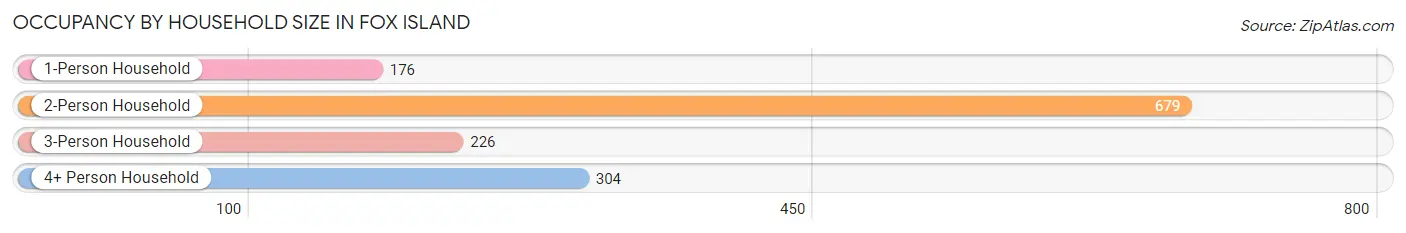
| Household Size | # Housing Units | % Housing Units |
| 1-Person Household | 176 | 12.7% |
| 2-Person Household | 679 | 49.0% |
| 3-Person Household | 226 | 16.3% |
| 4+ Person Household | 304 | 22.0% |
| Total Housing Units | 1,385 | 100.0% |
Occupancy by Ownership by Household Size in Fox Island
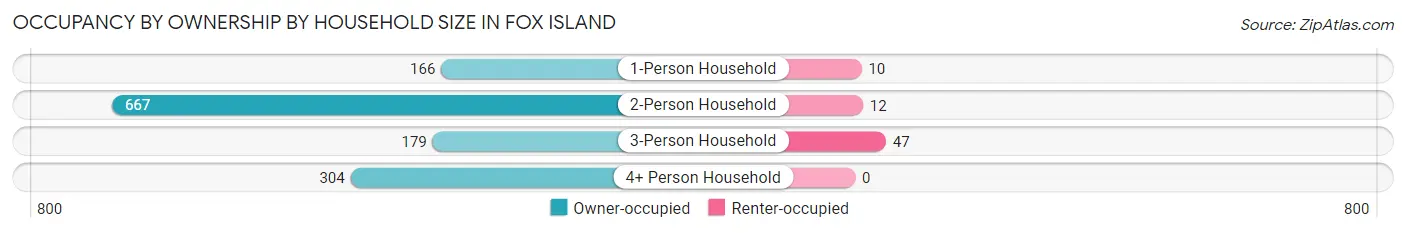
| Household Size | Owner-occupied | Renter-occupied |
| 1-Person Household | 166 (94.3%) | 10 (5.7%) |
| 2-Person Household | 667 (98.2%) | 12 (1.8%) |
| 3-Person Household | 179 (79.2%) | 47 (20.8%) |
| 4+ Person Household | 304 (100.0%) | 0 (0.0%) |
| Total Housing Units | 1,316 (95.0%) | 69 (5.0%) |
Occupancy by Educational Attainment in Fox Island
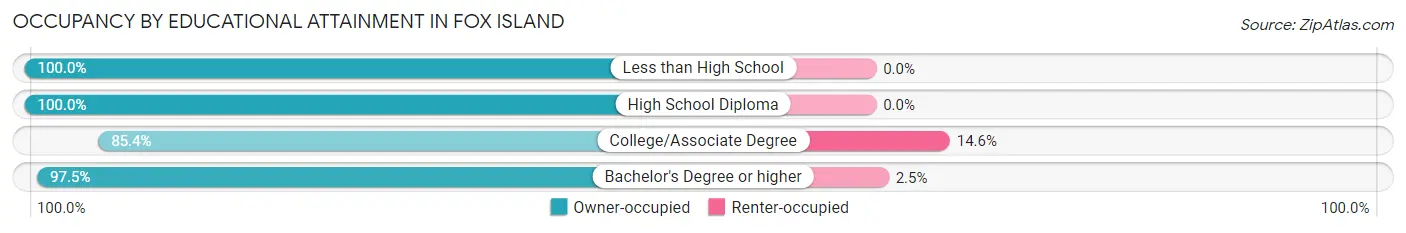
| Household Size | Owner-occupied | Renter-occupied |
| Less than High School | 8 (100.0%) | 0 (0.0%) |
| High School Diploma | 169 (100.0%) | 0 (0.0%) |
| College/Associate Degree | 275 (85.4%) | 47 (14.6%) |
| Bachelor's Degree or higher | 864 (97.5%) | 22 (2.5%) |
Occupancy by Age of Householder in Fox Island
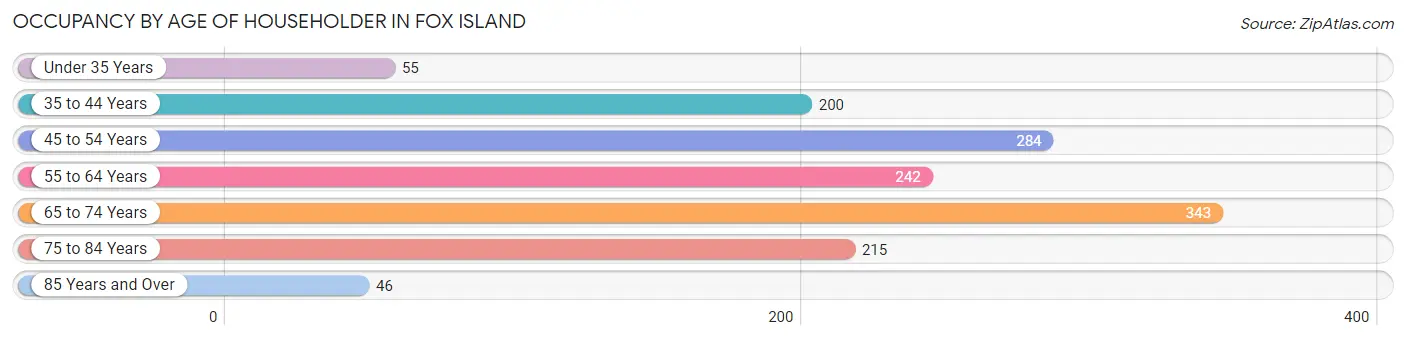
| Age Bracket | # Households | % Households |
| Under 35 Years | 55 | 4.0% |
| 35 to 44 Years | 200 | 14.4% |
| 45 to 54 Years | 284 | 20.5% |
| 55 to 64 Years | 242 | 17.5% |
| 65 to 74 Years | 343 | 24.8% |
| 75 to 84 Years | 215 | 15.5% |
| 85 Years and Over | 46 | 3.3% |
| Total | 1,385 | 100.0% |
Housing Finances in Fox Island
Median Income by Occupancy in Fox Island
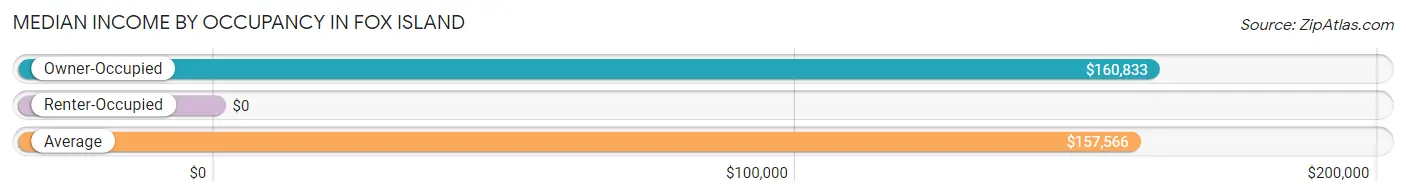
| Occupancy Type | # Households | Median Income |
| Owner-Occupied | 1,316 (95.0%) | $160,833 |
| Renter-Occupied | 69 (5.0%) | $0 |
| Average | 1,385 (100.0%) | $157,566 |
Occupancy by Householder Income Bracket in Fox Island
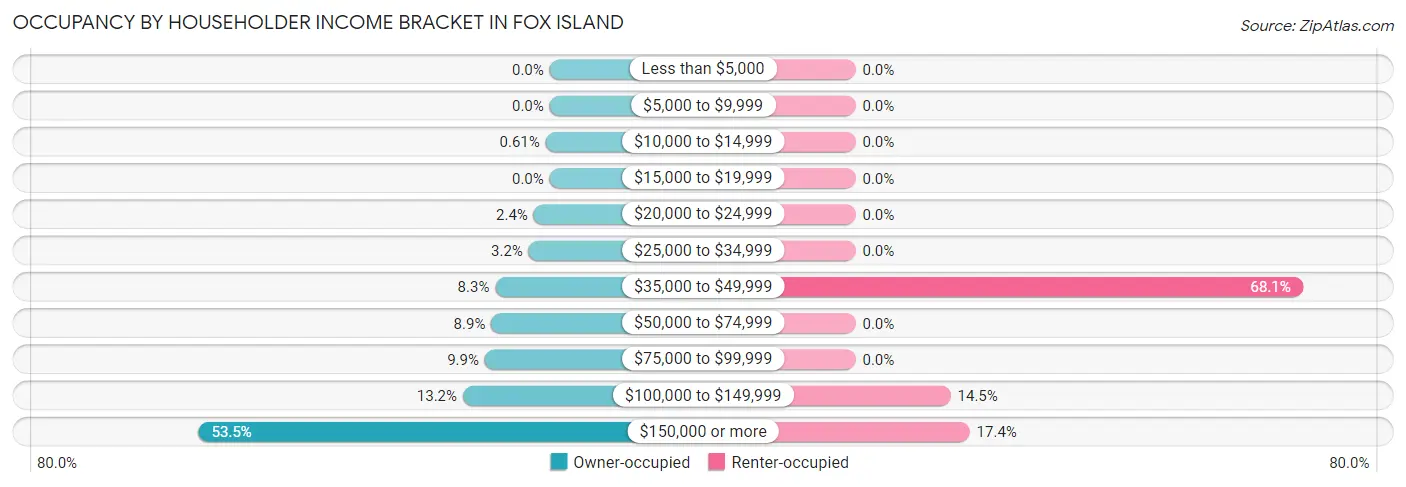
| Income Bracket | Owner-occupied | Renter-occupied |
| Less than $5,000 | 0 (0.0%) | 0 (0.0%) |
| $5,000 to $9,999 | 0 (0.0%) | 0 (0.0%) |
| $10,000 to $14,999 | 8 (0.6%) | 0 (0.0%) |
| $15,000 to $19,999 | 0 (0.0%) | 0 (0.0%) |
| $20,000 to $24,999 | 32 (2.4%) | 0 (0.0%) |
| $25,000 to $34,999 | 42 (3.2%) | 0 (0.0%) |
| $35,000 to $49,999 | 109 (8.3%) | 47 (68.1%) |
| $50,000 to $74,999 | 117 (8.9%) | 0 (0.0%) |
| $75,000 to $99,999 | 130 (9.9%) | 0 (0.0%) |
| $100,000 to $149,999 | 174 (13.2%) | 10 (14.5%) |
| $150,000 or more | 704 (53.5%) | 12 (17.4%) |
| Total | 1,316 (100.0%) | 69 (100.0%) |
Monthly Housing Cost Tiers in Fox Island
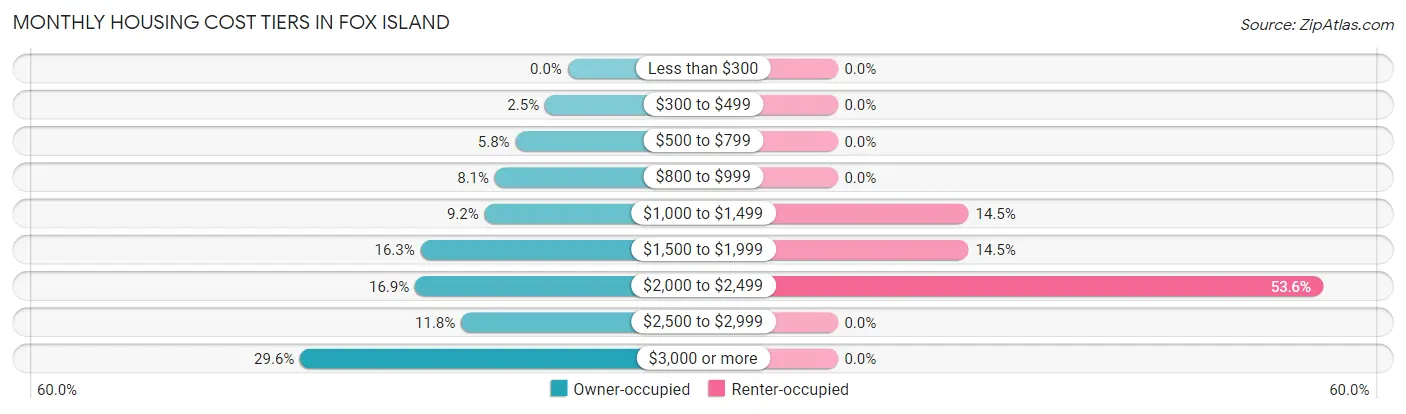
| Monthly Cost | Owner-occupied | Renter-occupied |
| Less than $300 | 0 (0.0%) | 0 (0.0%) |
| $300 to $499 | 33 (2.5%) | 0 (0.0%) |
| $500 to $799 | 76 (5.8%) | 0 (0.0%) |
| $800 to $999 | 106 (8.1%) | 0 (0.0%) |
| $1,000 to $1,499 | 121 (9.2%) | 10 (14.5%) |
| $1,500 to $1,999 | 214 (16.3%) | 10 (14.5%) |
| $2,000 to $2,499 | 222 (16.9%) | 37 (53.6%) |
| $2,500 to $2,999 | 155 (11.8%) | 0 (0.0%) |
| $3,000 or more | 389 (29.6%) | 0 (0.0%) |
| Total | 1,316 (100.0%) | 69 (100.0%) |
Physical Housing Characteristics in Fox Island
Housing Structures in Fox Island
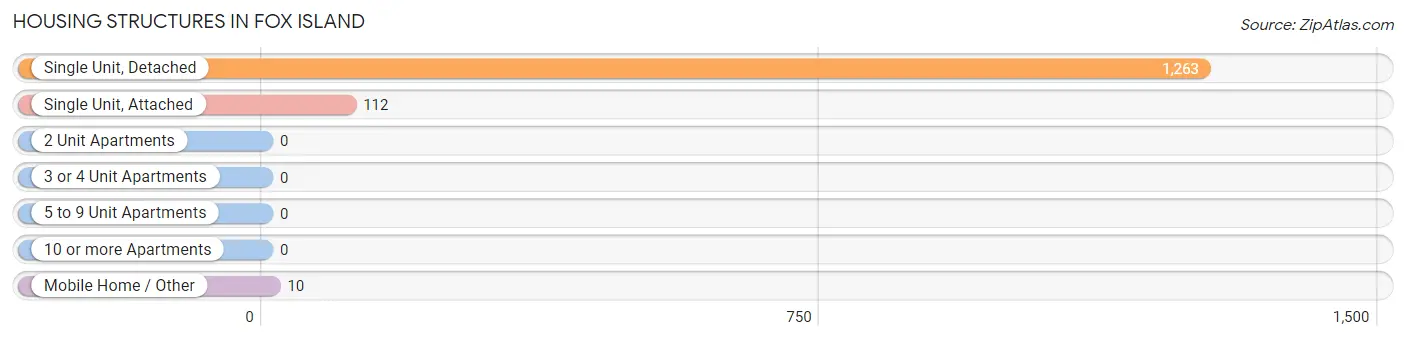
| Structure Type | # Housing Units | % Housing Units |
| Single Unit, Detached | 1,263 | 91.2% |
| Single Unit, Attached | 112 | 8.1% |
| 2 Unit Apartments | 0 | 0.0% |
| 3 or 4 Unit Apartments | 0 | 0.0% |
| 5 to 9 Unit Apartments | 0 | 0.0% |
| 10 or more Apartments | 0 | 0.0% |
| Mobile Home / Other | 10 | 0.7% |
| Total | 1,385 | 100.0% |
Housing Structures by Occupancy in Fox Island
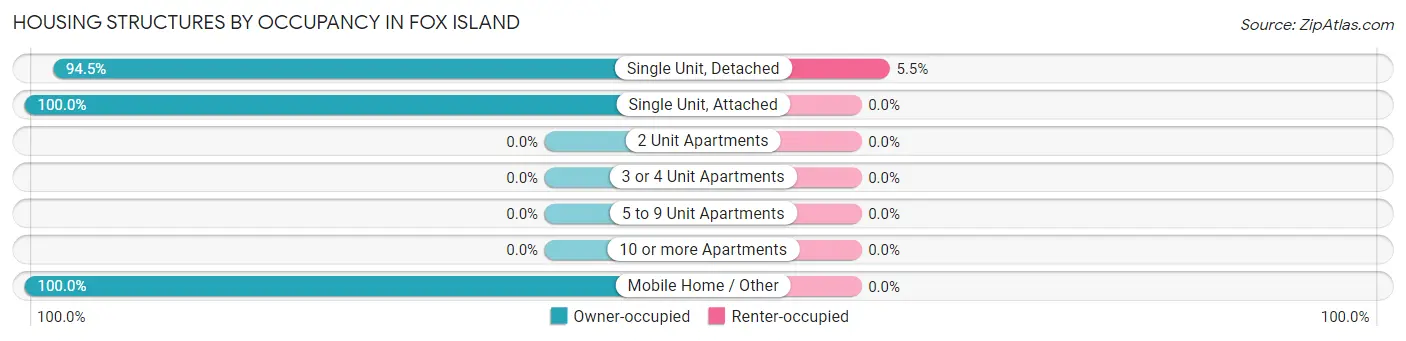
| Structure Type | Owner-occupied | Renter-occupied |
| Single Unit, Detached | 1,194 (94.5%) | 69 (5.5%) |
| Single Unit, Attached | 112 (100.0%) | 0 (0.0%) |
| 2 Unit Apartments | 0 (0.0%) | 0 (0.0%) |
| 3 or 4 Unit Apartments | 0 (0.0%) | 0 (0.0%) |
| 5 to 9 Unit Apartments | 0 (0.0%) | 0 (0.0%) |
| 10 or more Apartments | 0 (0.0%) | 0 (0.0%) |
| Mobile Home / Other | 10 (100.0%) | 0 (0.0%) |
| Total | 1,316 (95.0%) | 69 (5.0%) |
Housing Structures by Number of Rooms in Fox Island
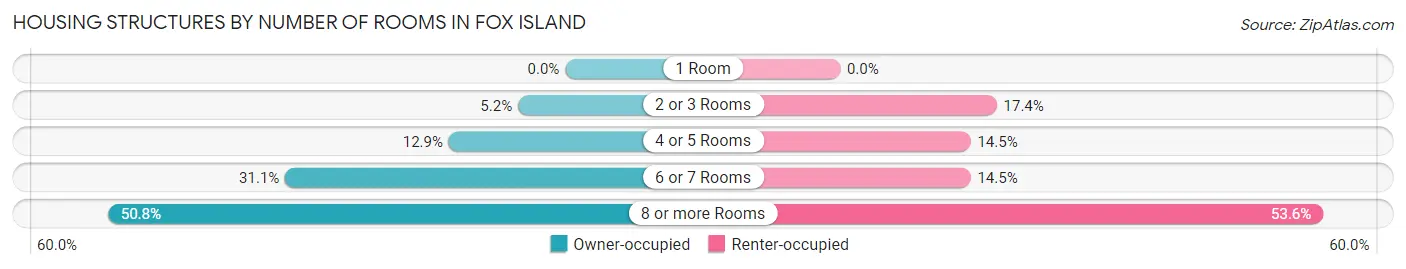
| Number of Rooms | Owner-occupied | Renter-occupied |
| 1 Room | 0 (0.0%) | 0 (0.0%) |
| 2 or 3 Rooms | 69 (5.2%) | 12 (17.4%) |
| 4 or 5 Rooms | 170 (12.9%) | 10 (14.5%) |
| 6 or 7 Rooms | 409 (31.1%) | 10 (14.5%) |
| 8 or more Rooms | 668 (50.8%) | 37 (53.6%) |
| Total | 1,316 (100.0%) | 69 (100.0%) |
Housing Structure by Heating Type in Fox Island
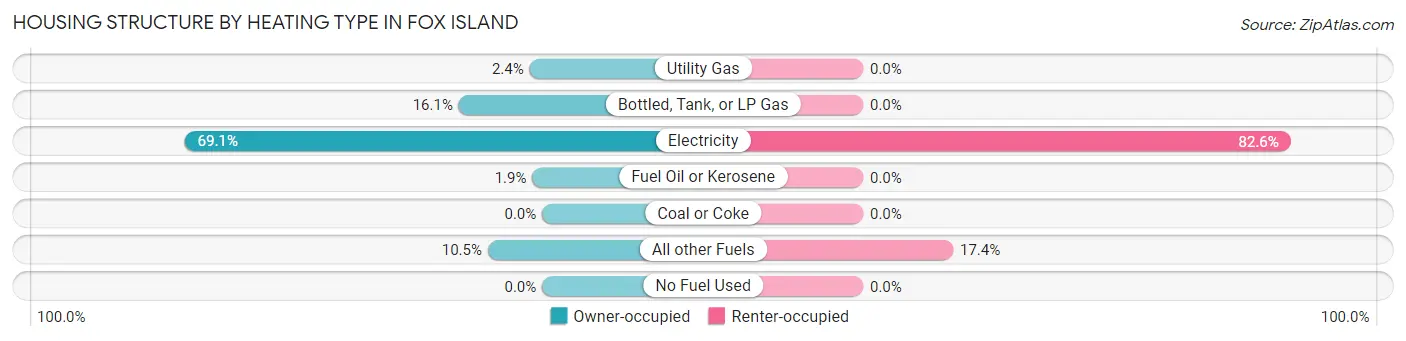
| Heating Type | Owner-occupied | Renter-occupied |
| Utility Gas | 32 (2.4%) | 0 (0.0%) |
| Bottled, Tank, or LP Gas | 212 (16.1%) | 0 (0.0%) |
| Electricity | 909 (69.1%) | 57 (82.6%) |
| Fuel Oil or Kerosene | 25 (1.9%) | 0 (0.0%) |
| Coal or Coke | 0 (0.0%) | 0 (0.0%) |
| All other Fuels | 138 (10.5%) | 12 (17.4%) |
| No Fuel Used | 0 (0.0%) | 0 (0.0%) |
| Total | 1,316 (100.0%) | 69 (100.0%) |
Household Vehicle Usage in Fox Island
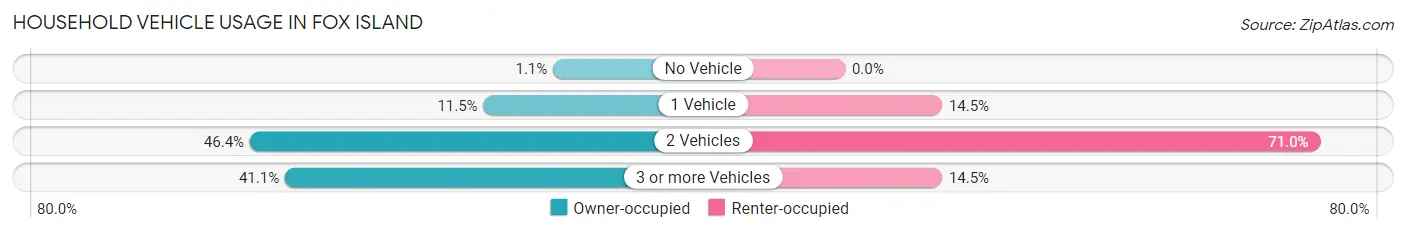
| Vehicles per Household | Owner-occupied | Renter-occupied |
| No Vehicle | 14 (1.1%) | 0 (0.0%) |
| 1 Vehicle | 151 (11.5%) | 10 (14.5%) |
| 2 Vehicles | 610 (46.4%) | 49 (71.0%) |
| 3 or more Vehicles | 541 (41.1%) | 10 (14.5%) |
| Total | 1,316 (100.0%) | 69 (100.0%) |
Real Estate & Mortgages in Fox Island
Real Estate and Mortgage Overview in Fox Island
| Characteristic | Without Mortgage | With Mortgage |
| Housing Units | 489 | 827 |
| Median Property Value | $926,300 | $885,600 |
| Median Household Income | $121,382 | $517 |
| Monthly Housing Costs | $1,069 | $378 |
| Real Estate Taxes | $7,784 | $0 |
Property Value by Mortgage Status in Fox Island
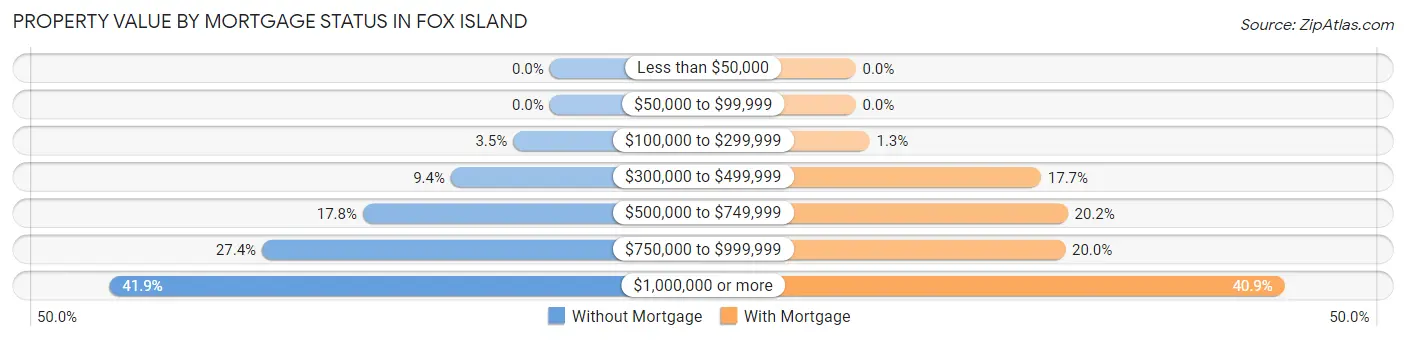
| Property Value | Without Mortgage | With Mortgage |
| Less than $50,000 | 0 (0.0%) | 0 (0.0%) |
| $50,000 to $99,999 | 0 (0.0%) | 0 (0.0%) |
| $100,000 to $299,999 | 17 (3.5%) | 11 (1.3%) |
| $300,000 to $499,999 | 46 (9.4%) | 146 (17.6%) |
| $500,000 to $749,999 | 87 (17.8%) | 167 (20.2%) |
| $750,000 to $999,999 | 134 (27.4%) | 165 (20.0%) |
| $1,000,000 or more | 205 (41.9%) | 338 (40.9%) |
| Total | 489 (100.0%) | 827 (100.0%) |
Household Income by Mortgage Status in Fox Island
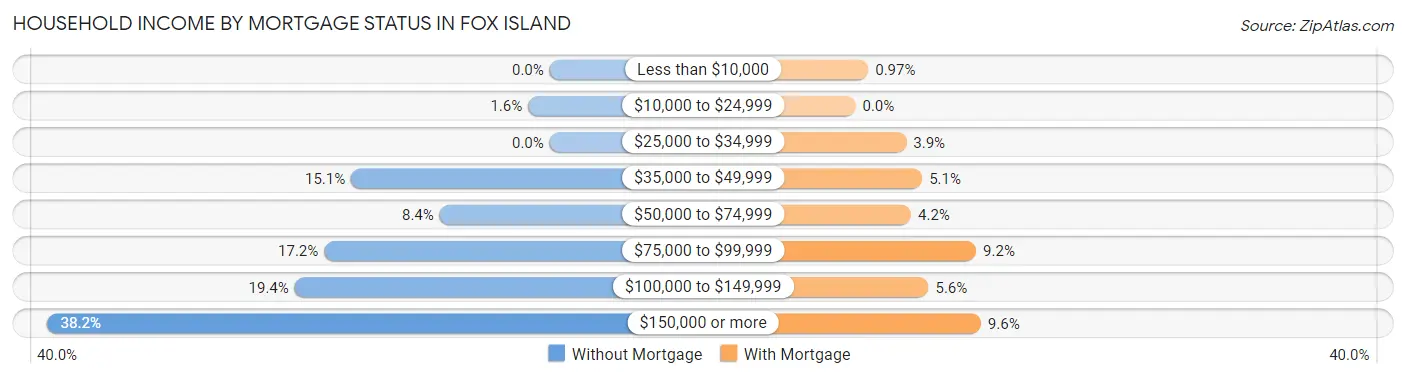
| Household Income | Without Mortgage | With Mortgage |
| Less than $10,000 | 0 (0.0%) | 8 (1.0%) |
| $10,000 to $24,999 | 8 (1.6%) | 0 (0.0%) |
| $25,000 to $34,999 | 0 (0.0%) | 32 (3.9%) |
| $35,000 to $49,999 | 74 (15.1%) | 42 (5.1%) |
| $50,000 to $74,999 | 41 (8.4%) | 35 (4.2%) |
| $75,000 to $99,999 | 84 (17.2%) | 76 (9.2%) |
| $100,000 to $149,999 | 95 (19.4%) | 46 (5.6%) |
| $150,000 or more | 187 (38.2%) | 79 (9.6%) |
| Total | 489 (100.0%) | 827 (100.0%) |
Property Value to Household Income Ratio in Fox Island
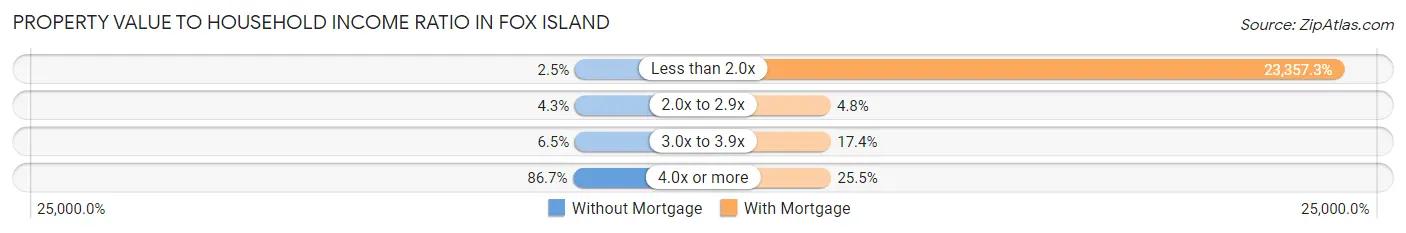
| Value-to-Income Ratio | Without Mortgage | With Mortgage |
| Less than 2.0x | 12 (2.5%) | 193,165 (23,357.3%) |
| 2.0x to 2.9x | 21 (4.3%) | 40 (4.8%) |
| 3.0x to 3.9x | 32 (6.5%) | 144 (17.4%) |
| 4.0x or more | 424 (86.7%) | 211 (25.5%) |
| Total | 489 (100.0%) | 827 (100.0%) |
Real Estate Taxes by Mortgage Status in Fox Island
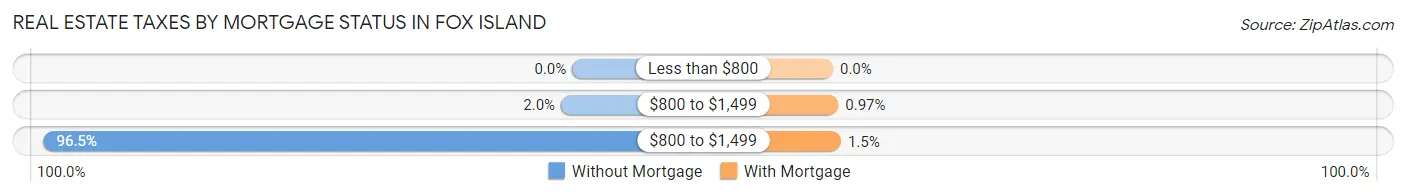
| Property Taxes | Without Mortgage | With Mortgage |
| Less than $800 | 0 (0.0%) | 0 (0.0%) |
| $800 to $1,499 | 10 (2.0%) | 8 (1.0%) |
| $800 to $1,499 | 472 (96.5%) | 12 (1.5%) |
| Total | 489 (100.0%) | 827 (100.0%) |
Health & Disability in Fox Island
Health Insurance Coverage by Age in Fox Island
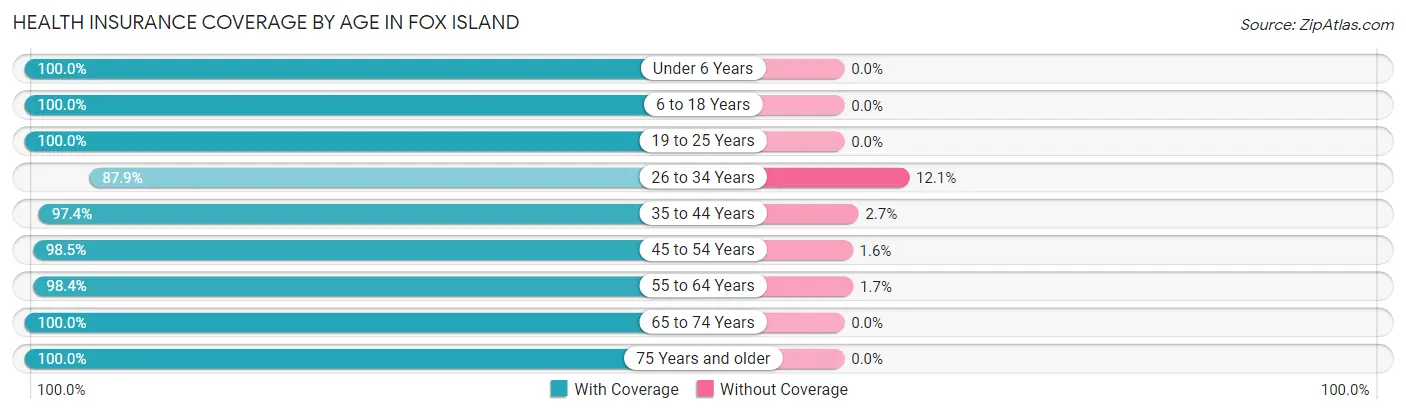
| Age Bracket | With Coverage | Without Coverage |
| Under 6 Years | 175 (100.0%) | 0 (0.0%) |
| 6 to 18 Years | 611 (100.0%) | 0 (0.0%) |
| 19 to 25 Years | 107 (100.0%) | 0 (0.0%) |
| 26 to 34 Years | 182 (87.9%) | 25 (12.1%) |
| 35 to 44 Years | 404 (97.4%) | 11 (2.6%) |
| 45 to 54 Years | 509 (98.5%) | 8 (1.5%) |
| 55 to 64 Years | 537 (98.4%) | 9 (1.7%) |
| 65 to 74 Years | 677 (100.0%) | 0 (0.0%) |
| 75 Years and older | 389 (100.0%) | 0 (0.0%) |
| Total | 3,591 (98.6%) | 53 (1.5%) |
Health Insurance Coverage by Citizenship Status in Fox Island
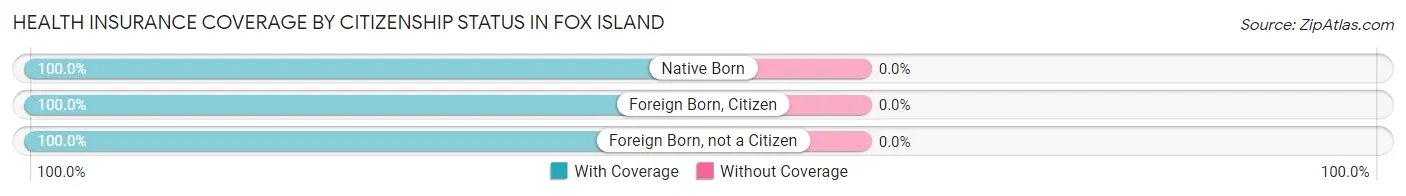
| Citizenship Status | With Coverage | Without Coverage |
| Native Born | 175 (100.0%) | 0 (0.0%) |
| Foreign Born, Citizen | 611 (100.0%) | 0 (0.0%) |
| Foreign Born, not a Citizen | 107 (100.0%) | 0 (0.0%) |
Health Insurance Coverage by Household Income in Fox Island
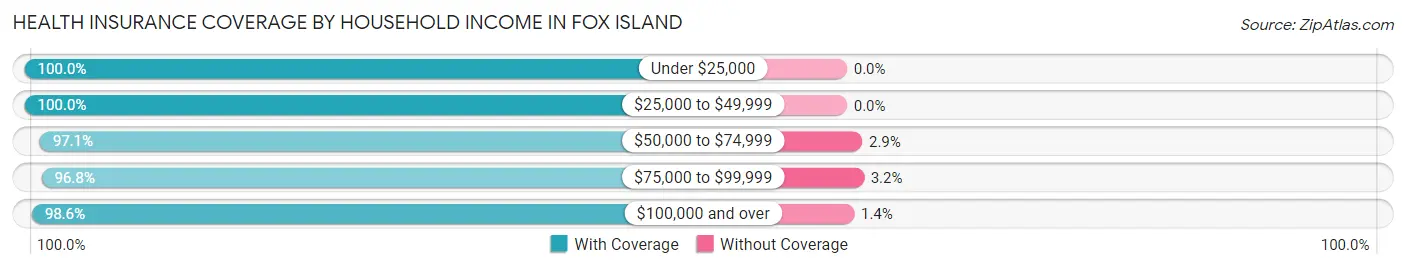
| Household Income | With Coverage | Without Coverage |
| Under $25,000 | 101 (100.0%) | 0 (0.0%) |
| $25,000 to $49,999 | 341 (100.0%) | 0 (0.0%) |
| $50,000 to $74,999 | 272 (97.1%) | 8 (2.9%) |
| $75,000 to $99,999 | 275 (96.8%) | 9 (3.2%) |
| $100,000 and over | 2,602 (98.6%) | 36 (1.4%) |
Public vs Private Health Insurance Coverage by Age in Fox Island
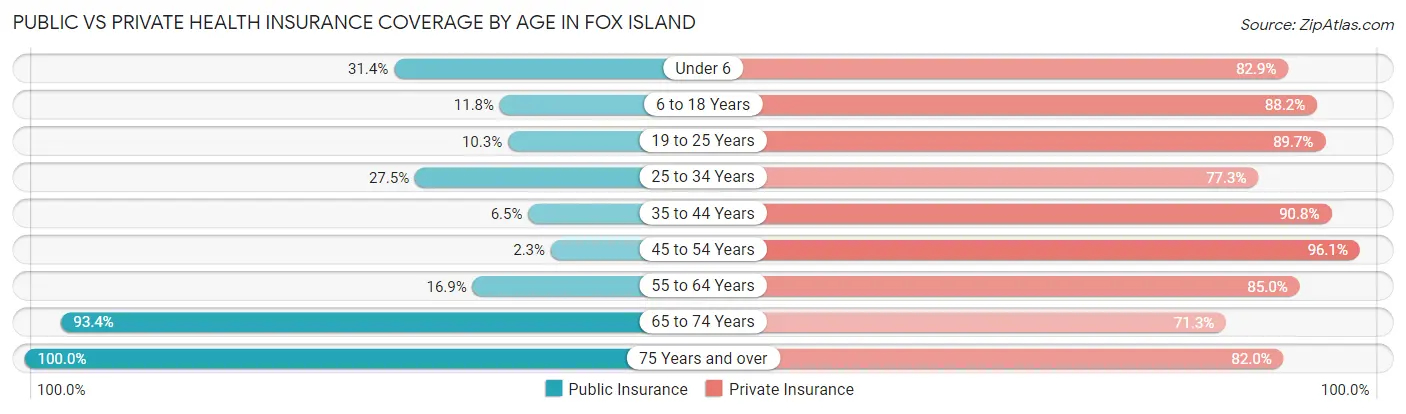
| Age Bracket | Public Insurance | Private Insurance |
| Under 6 | 55 (31.4%) | 145 (82.9%) |
| 6 to 18 Years | 72 (11.8%) | 539 (88.2%) |
| 19 to 25 Years | 11 (10.3%) | 96 (89.7%) |
| 25 to 34 Years | 57 (27.5%) | 160 (77.3%) |
| 35 to 44 Years | 27 (6.5%) | 377 (90.8%) |
| 45 to 54 Years | 12 (2.3%) | 497 (96.1%) |
| 55 to 64 Years | 92 (16.9%) | 464 (85.0%) |
| 65 to 74 Years | 632 (93.3%) | 483 (71.3%) |
| 75 Years and over | 389 (100.0%) | 319 (82.0%) |
| Total | 1,347 (37.0%) | 3,080 (84.5%) |
Disability Status by Sex by Age in Fox Island
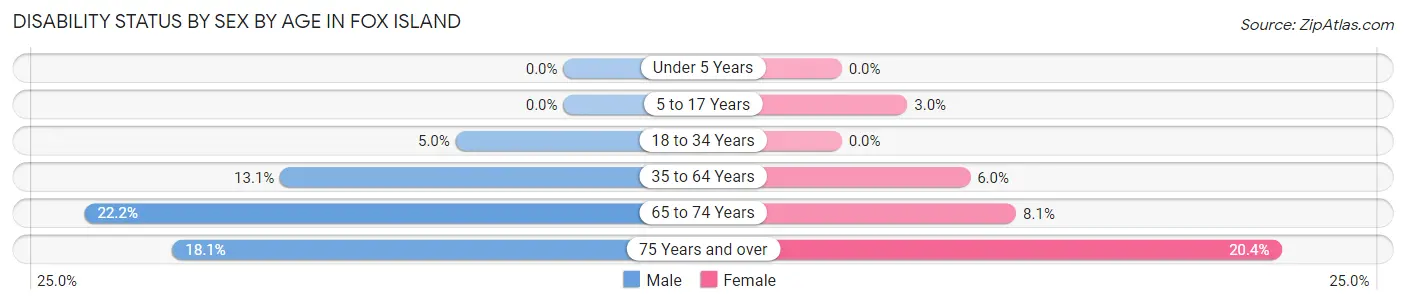
| Age Bracket | Male | Female |
| Under 5 Years | 0 (0.0%) | 0 (0.0%) |
| 5 to 17 Years | 0 (0.0%) | 9 (3.0%) |
| 18 to 34 Years | 11 (5.0%) | 0 (0.0%) |
| 35 to 64 Years | 95 (13.1%) | 45 (6.0%) |
| 65 to 74 Years | 68 (22.2%) | 30 (8.1%) |
| 75 Years and over | 43 (18.1%) | 31 (20.4%) |
Disability Class by Sex by Age in Fox Island
Disability Class: Hearing Difficulty
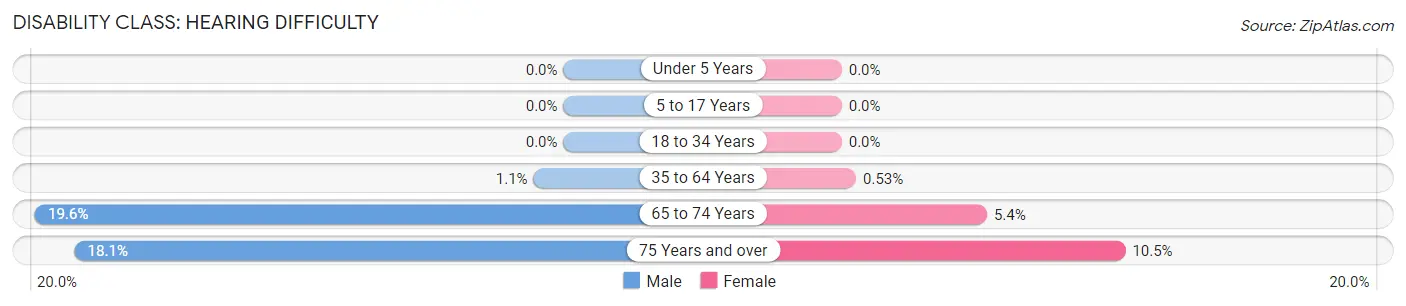
| Age Bracket | Male | Female |
| Under 5 Years | 0 (0.0%) | 0 (0.0%) |
| 5 to 17 Years | 0 (0.0%) | 0 (0.0%) |
| 18 to 34 Years | 0 (0.0%) | 0 (0.0%) |
| 35 to 64 Years | 8 (1.1%) | 4 (0.5%) |
| 65 to 74 Years | 60 (19.6%) | 20 (5.4%) |
| 75 Years and over | 43 (18.1%) | 16 (10.5%) |
Disability Class: Vision Difficulty
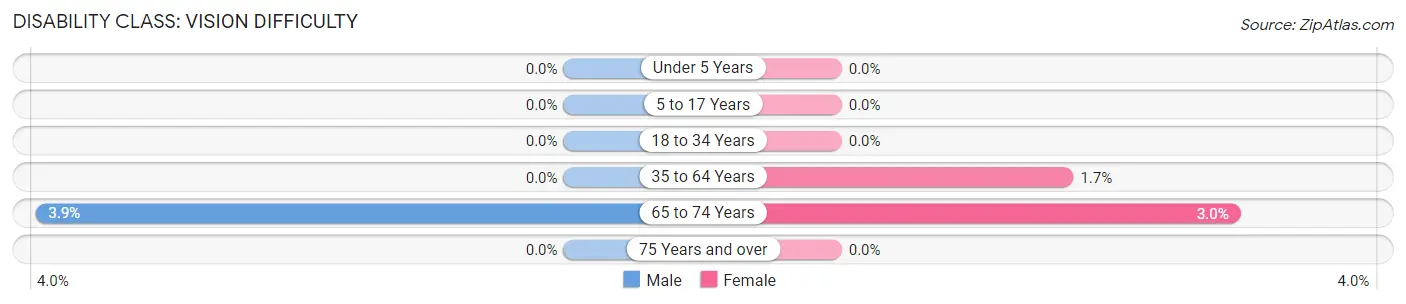
| Age Bracket | Male | Female |
| Under 5 Years | 0 (0.0%) | 0 (0.0%) |
| 5 to 17 Years | 0 (0.0%) | 0 (0.0%) |
| 18 to 34 Years | 0 (0.0%) | 0 (0.0%) |
| 35 to 64 Years | 0 (0.0%) | 13 (1.7%) |
| 65 to 74 Years | 12 (3.9%) | 11 (3.0%) |
| 75 Years and over | 0 (0.0%) | 0 (0.0%) |
Disability Class: Cognitive Difficulty
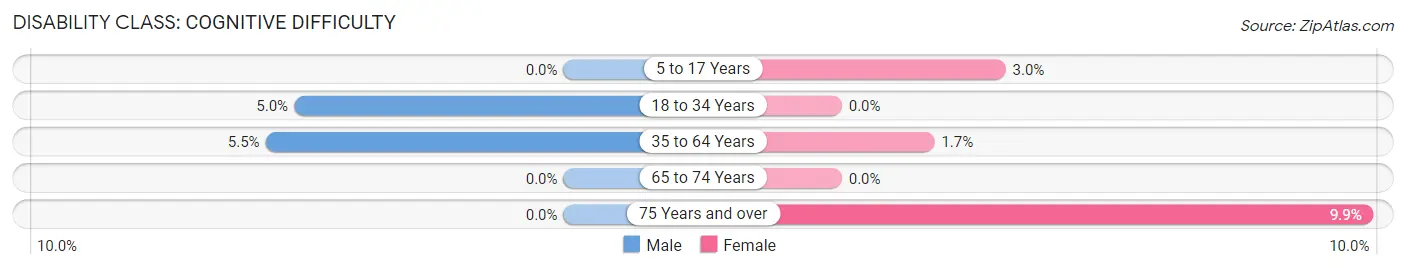
| Age Bracket | Male | Female |
| 5 to 17 Years | 0 (0.0%) | 9 (3.0%) |
| 18 to 34 Years | 11 (5.0%) | 0 (0.0%) |
| 35 to 64 Years | 40 (5.5%) | 13 (1.7%) |
| 65 to 74 Years | 0 (0.0%) | 0 (0.0%) |
| 75 Years and over | 0 (0.0%) | 15 (9.9%) |
Disability Class: Ambulatory Difficulty
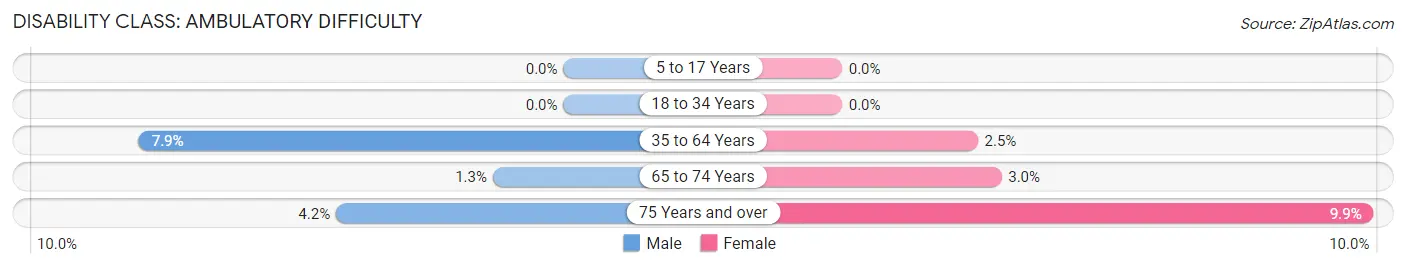
| Age Bracket | Male | Female |
| 5 to 17 Years | 0 (0.0%) | 0 (0.0%) |
| 18 to 34 Years | 0 (0.0%) | 0 (0.0%) |
| 35 to 64 Years | 57 (7.9%) | 19 (2.5%) |
| 65 to 74 Years | 4 (1.3%) | 11 (3.0%) |
| 75 Years and over | 10 (4.2%) | 15 (9.9%) |
Disability Class: Self-Care Difficulty
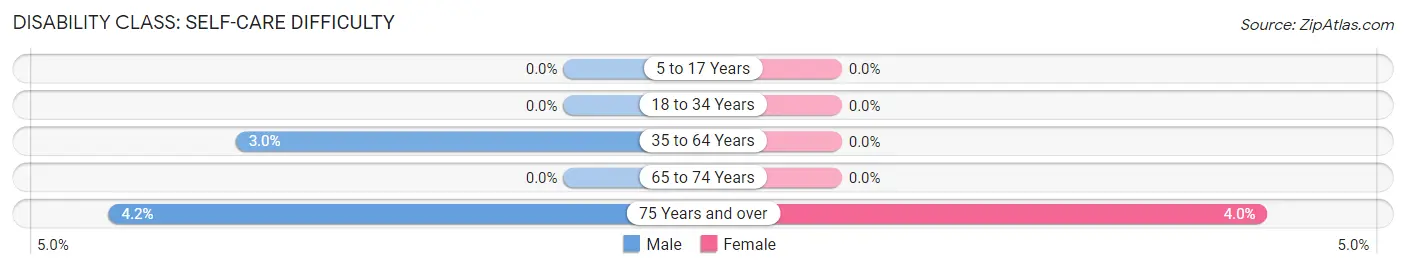
| Age Bracket | Male | Female |
| 5 to 17 Years | 0 (0.0%) | 0 (0.0%) |
| 18 to 34 Years | 0 (0.0%) | 0 (0.0%) |
| 35 to 64 Years | 22 (3.0%) | 0 (0.0%) |
| 65 to 74 Years | 0 (0.0%) | 0 (0.0%) |
| 75 Years and over | 10 (4.2%) | 6 (4.0%) |
Technology Access in Fox Island
Computing Device Access in Fox Island
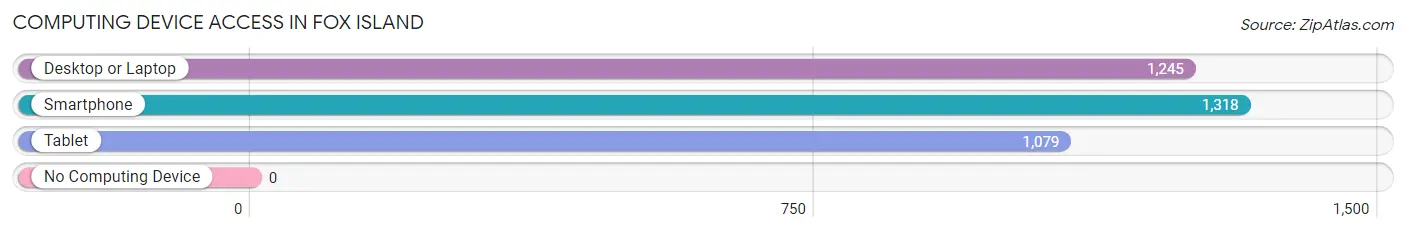
| Device Type | # Households | % Households |
| Desktop or Laptop | 1,245 | 89.9% |
| Smartphone | 1,318 | 95.2% |
| Tablet | 1,079 | 77.9% |
| No Computing Device | 0 | 0.0% |
| Total | 1,385 | 100.0% |
Internet Access in Fox Island
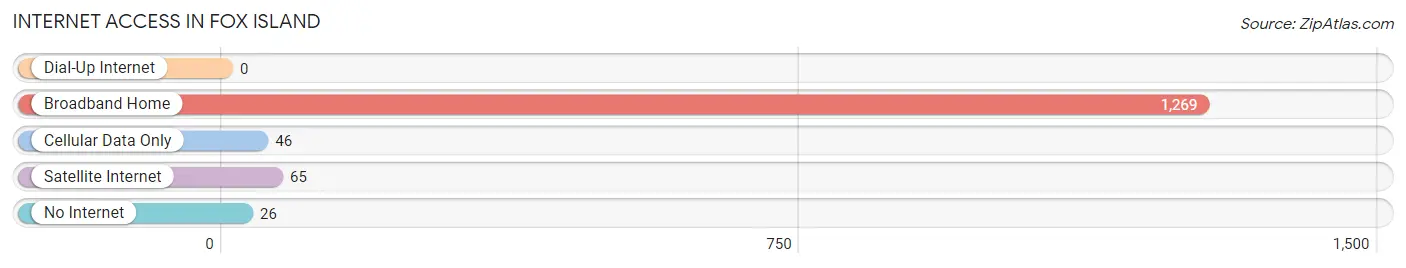
| Internet Type | # Households | % Households |
| Dial-Up Internet | 0 | 0.0% |
| Broadband Home | 1,269 | 91.6% |
| Cellular Data Only | 46 | 3.3% |
| Satellite Internet | 65 | 4.7% |
| No Internet | 26 | 1.9% |
| Total | 1,385 | 100.0% |
Fox Island Summary
Fox Island is a small island located in the Puget Sound of Washington State, United States. It is located in Pierce County and is part of the Kitsap Peninsula. The island is approximately 4.5 square miles in size and is home to approximately 1,400 people.
History
The first known inhabitants of Fox Island were the Suquamish Tribe, who lived in the area for thousands of years before the arrival of Europeans. The island was first explored by Europeans in 1792, when George Vancouver sailed through the area. The island was named after a British naval officer, Captain William Fox.
In the late 1800s, the island was home to a small fishing community. The island was also home to a number of logging camps, which harvested the island’s abundant timber. In the early 1900s, the island was home to a number of resorts, which attracted tourists from around the region.
In the 1950s, the island was home to a number of summer camps, which attracted children from around the region. In the 1960s, the island was home to a number of artists and writers, who were attracted to the island’s natural beauty.
In the 1970s, the island was home to a number of wealthy residents, who built large homes on the island. In the 1980s, the island was home to a number of retirees, who were attracted to the island’s peaceful atmosphere.
Geography
Fox Island is located in the Puget Sound of Washington State, United States. It is located in Pierce County and is part of the Kitsap Peninsula. The island is approximately 4.5 square miles in size and is home to approximately 1,400 people.
The island is surrounded by the waters of the Puget Sound and is connected to the mainland by a bridge. The island is mostly flat, with a few hills and valleys. The highest point on the island is approximately 400 feet above sea level.
The island is home to a number of parks and beaches, which attract visitors from around the region. The island is also home to a number of marinas, which provide access to the waters of the Puget Sound.
Economy
The economy of Fox Island is largely based on tourism and fishing. The island is home to a number of resorts, which attract visitors from around the region. The island is also home to a number of marinas, which provide access to the waters of the Puget Sound.
The island is also home to a number of businesses, which provide goods and services to the local population. These businesses include restaurants, grocery stores, and retail stores.
Demographics
As of the 2010 census, the population of Fox Island was 1,400. The population is largely white (94.3%), with small percentages of other races. The median age of the population is 48.7 years.
The median household income of the population is $76,250, and the median home value is $521,000. The unemployment rate is 4.2%. The majority of the population (90.3%) is married, and the majority of the population (90.3%) owns their own home.
Conclusion
Fox Island is a small island located in the Puget Sound of Washington State, United States. It is located in Pierce County and is part of the Kitsap Peninsula. The island is approximately 4.5 square miles in size and is home to approximately 1,400 people. The island has a long history, and is home to a number of resorts, marinas, and businesses. The economy of the island is largely based on tourism and fishing, and the population is largely white. The median household income of the population is $76,250, and the median home value is $521,000.
Common Questions
What is Per Capita Income in Fox Island?
Per Capita income in Fox Island is $84,382.
What is the Median Family Income in Fox Island?
Median Family Income in Fox Island is $185,313.
What is the Median Household income in Fox Island?
Median Household Income in Fox Island is $157,566.
What is Income or Wage Gap in Fox Island?
Income or Wage Gap in Fox Island is 61.1%.
Women in Fox Island earn 38.9 cents for every dollar earned by a man.
What is Inequality or Gini Index in Fox Island?
Inequality or Gini Index in Fox Island is 0.46.
What is the Total Population of Fox Island?
Total Population of Fox Island is 3,644.
What is the Total Male Population of Fox Island?
Total Male Population of Fox Island is 1,900.
What is the Total Female Population of Fox Island?
Total Female Population of Fox Island is 1,744.
What is the Ratio of Males per 100 Females in Fox Island?
There are 108.94 Males per 100 Females in Fox Island.
What is the Ratio of Females per 100 Males in Fox Island?
There are 91.79 Females per 100 Males in Fox Island.
What is the Median Population Age in Fox Island?
Median Population Age in Fox Island is 50.0 Years.
What is the Average Family Size in Fox Island
Average Family Size in Fox Island is 2.9 People.
What is the Average Household Size in Fox Island
Average Household Size in Fox Island is 2.6 People.
How Large is the Labor Force in Fox Island?
There are 1,601 People in the Labor Forcein in Fox Island.
What is the Percentage of People in the Labor Force in Fox Island?
53.5% of People are in the Labor Force in Fox Island.
What is the Unemployment Rate in Fox Island?
Unemployment Rate in Fox Island is 4.6%.