Fern Prairie, WA Map & Demographics
Fern Prairie Map
Fern Prairie Overview
$41,437
PER CAPITA INCOME
$118,300
AVG FAMILY INCOME
$112,888
AVG HOUSEHOLD INCOME
36.9%
WAGE / INCOME GAP [ % ]
63.1¢/ $1
WAGE / INCOME GAP [ $ ]
0.36
INEQUALITY / GINI INDEX
1,946
TOTAL POPULATION
980
MALE POPULATION
966
FEMALE POPULATION
101.45
MALES / 100 FEMALES
98.57
FEMALES / 100 MALES
46.1
MEDIAN AGE
3.1
AVG FAMILY SIZE
2.9
AVG HOUSEHOLD SIZE
750
LABOR FORCE [ PEOPLE ]
50.4%
PERCENT IN LABOR FORCE
4.0%
UNEMPLOYMENT RATE
Income in Fern Prairie
Income Overview in Fern Prairie
Per Capita Income in Fern Prairie is $41,437, while median incomes of families and households are $118,300 and $112,888 respectively.
| Characteristic | Number | Measure |
| Per Capita Income | 1,946 | $41,437 |
| Median Family Income | 518 | $118,300 |
| Mean Family Income | 518 | $136,039 |
| Median Household Income | 679 | $112,888 |
| Mean Household Income | 679 | $118,655 |
| Income Deficit | 518 | $0 |
| Wage / Income Gap (%) | 1,946 | 36.88% |
| Wage / Income Gap ($) | 1,946 | 63.12¢ per $1 |
| Gini / Inequality Index | 1,946 | 0.36 |
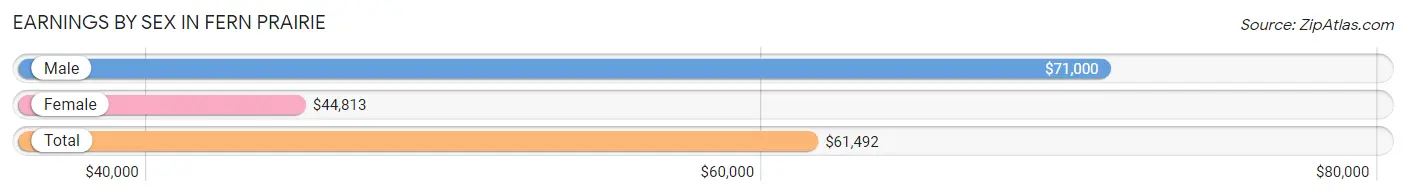
Earnings by Sex in Fern Prairie
Average Earnings in Fern Prairie are $61,492, $71,000 for men and $44,813 for women, a difference of 36.9%.
| Sex | Number | Average Earnings |
| Male | 486 (59.2%) | $71,000 |
| Female | 335 (40.8%) | $44,813 |
| Total | 821 (100.0%) | $61,492 |
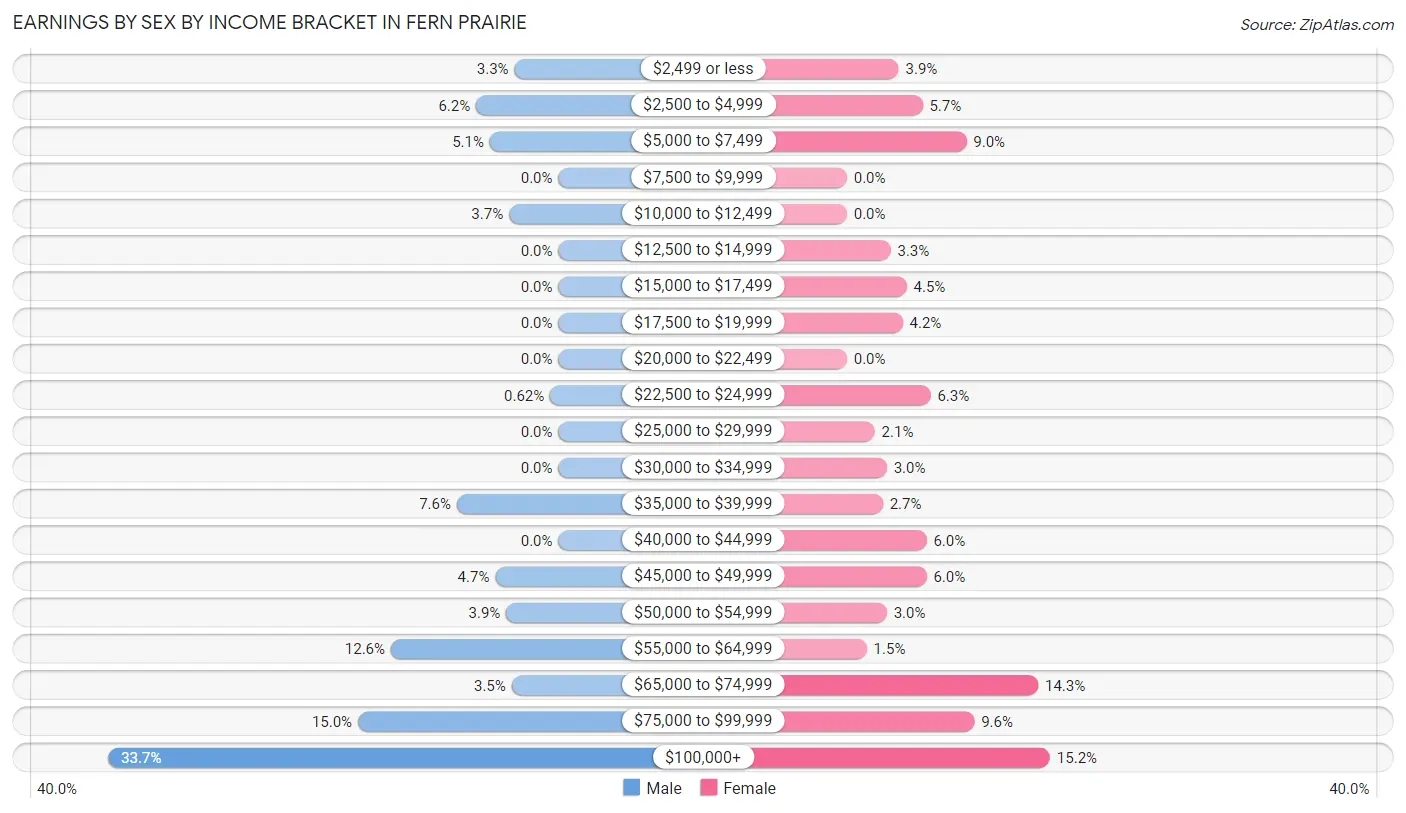
Earnings by Sex by Income Bracket in Fern Prairie
The most common earnings brackets in Fern Prairie are $100,000+ for men (164 | 33.7%) and $100,000+ for women (51 | 15.2%).
| Income | Male | Female |
| $2,499 or less | 16 (3.3%) | 13 (3.9%) |
| $2,500 to $4,999 | 30 (6.2%) | 19 (5.7%) |
| $5,000 to $7,499 | 25 (5.1%) | 30 (9.0%) |
| $7,500 to $9,999 | 0 (0.0%) | 0 (0.0%) |
| $10,000 to $12,499 | 18 (3.7%) | 0 (0.0%) |
| $12,500 to $14,999 | 0 (0.0%) | 11 (3.3%) |
| $15,000 to $17,499 | 0 (0.0%) | 15 (4.5%) |
| $17,500 to $19,999 | 0 (0.0%) | 14 (4.2%) |
| $20,000 to $22,499 | 0 (0.0%) | 0 (0.0%) |
| $22,500 to $24,999 | 3 (0.6%) | 21 (6.3%) |
| $25,000 to $29,999 | 0 (0.0%) | 7 (2.1%) |
| $30,000 to $34,999 | 0 (0.0%) | 10 (3.0%) |
| $35,000 to $39,999 | 37 (7.6%) | 9 (2.7%) |
| $40,000 to $44,999 | 0 (0.0%) | 20 (6.0%) |
| $45,000 to $49,999 | 23 (4.7%) | 20 (6.0%) |
| $50,000 to $54,999 | 19 (3.9%) | 10 (3.0%) |
| $55,000 to $64,999 | 61 (12.6%) | 5 (1.5%) |
| $65,000 to $74,999 | 17 (3.5%) | 48 (14.3%) |
| $75,000 to $99,999 | 73 (15.0%) | 32 (9.6%) |
| $100,000+ | 164 (33.7%) | 51 (15.2%) |
| Total | 486 (100.0%) | 335 (100.0%) |
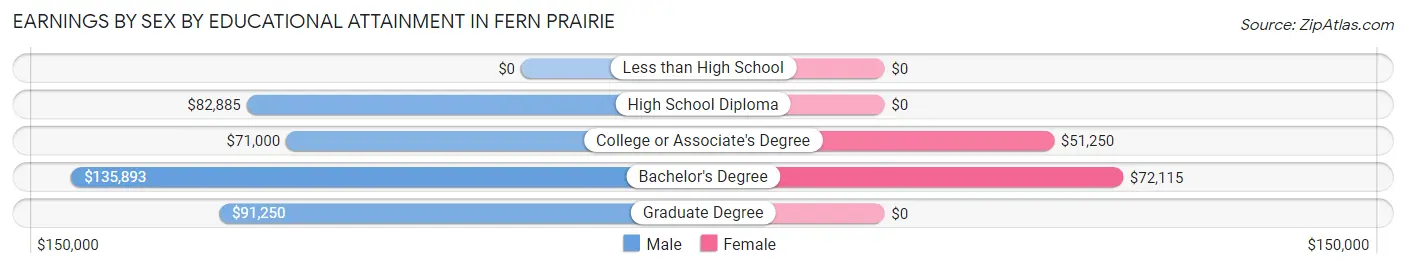
Earnings by Sex by Educational Attainment in Fern Prairie
Average earnings in Fern Prairie are $86,250 for men and $46,375 for women, a difference of 46.2%. Men with an educational attainment of bachelor's degree enjoy the highest average annual earnings of $135,893, while those with college or associate's degree education earn the least with $71,000. Women with an educational attainment of bachelor's degree earn the most with the average annual earnings of $72,115, while those with college or associate's degree education have the smallest earnings of $51,250.
| Educational Attainment | Male Income | Female Income |
| Less than High School | - | - |
| High School Diploma | $82,885 | $0 |
| College or Associate's Degree | $71,000 | $51,250 |
| Bachelor's Degree | $135,893 | $72,115 |
| Graduate Degree | $91,250 | $0 |
| Total | $86,250 | $46,375 |
Family Income in Fern Prairie
Family Income Brackets in Fern Prairie
According to the Fern Prairie family income data, there are 148 families falling into the $100,000 to $149,999 income range, which is the most common income bracket and makes up 28.6% of all families.
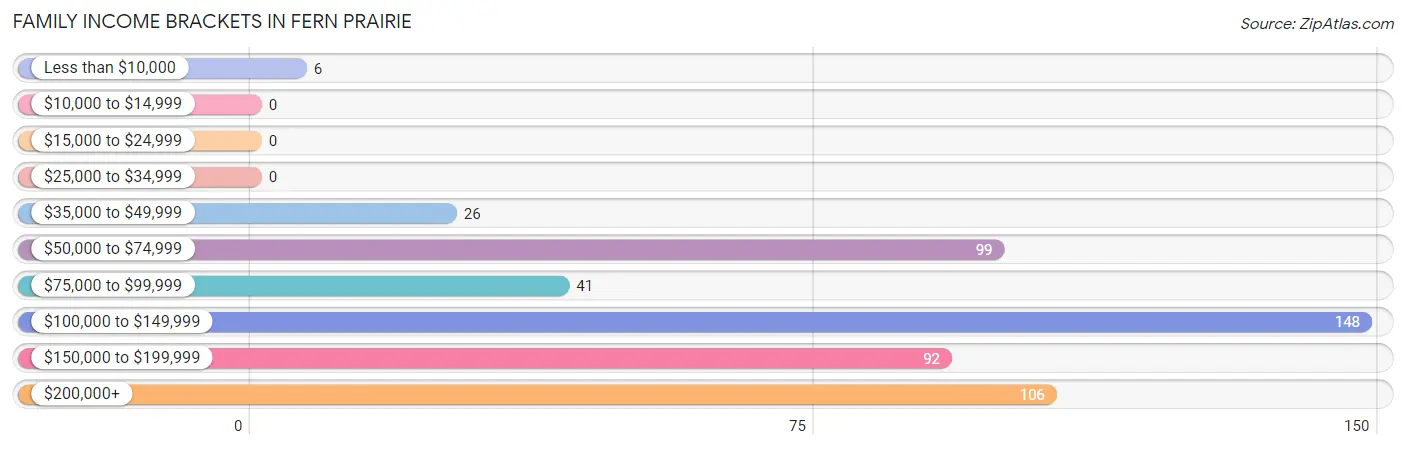
| Income Bracket | # Families | % Families |
| Less than $10,000 | 6 | 1.2% |
| $10,000 to $14,999 | 0 | 0.0% |
| $15,000 to $24,999 | 0 | 0.0% |
| $25,000 to $34,999 | 0 | 0.0% |
| $35,000 to $49,999 | 26 | 5.0% |
| $50,000 to $74,999 | 99 | 19.1% |
| $75,000 to $99,999 | 41 | 7.9% |
| $100,000 to $149,999 | 148 | 28.6% |
| $150,000 to $199,999 | 92 | 17.8% |
| $200,000+ | 106 | 20.5% |
Family Income by Famaliy Size in Fern Prairie
3-person families (84 | 16.2%) account for the highest median family income in Fern Prairie with $135,455 per family, while 2-person families (217 | 41.9%) have the highest median income of $57,396 per family member.
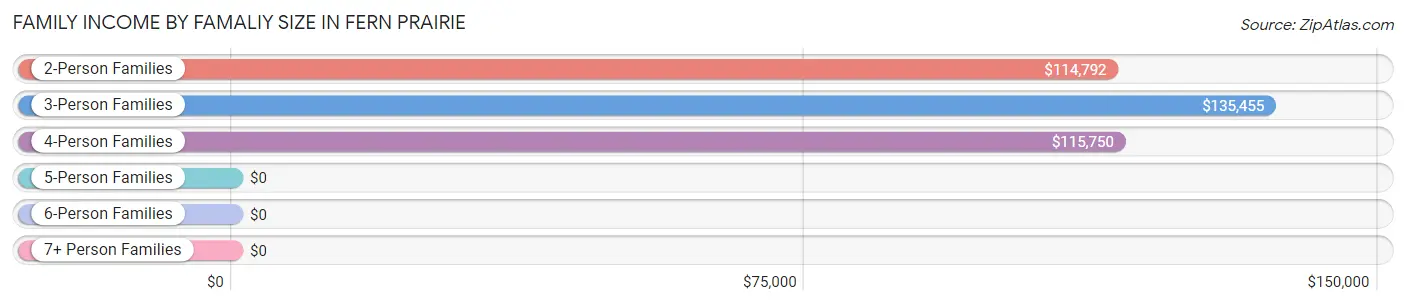
| Income Bracket | # Families | Median Income |
| 2-Person Families | 217 (41.9%) | $114,792 |
| 3-Person Families | 84 (16.2%) | $135,455 |
| 4-Person Families | 177 (34.2%) | $115,750 |
| 5-Person Families | 19 (3.7%) | $0 |
| 6-Person Families | 11 (2.1%) | $0 |
| 7+ Person Families | 10 (1.9%) | $0 |
| Total | 518 (100.0%) | $118,300 |
Family Income by Number of Earners in Fern Prairie
The median family income in Fern Prairie is $118,300, with families comprising 3+ earners (72) having the highest median family income of $196,875, while families with no earners (141) have the lowest median family income of $54,358, accounting for 13.9% and 27.2% of families, respectively.
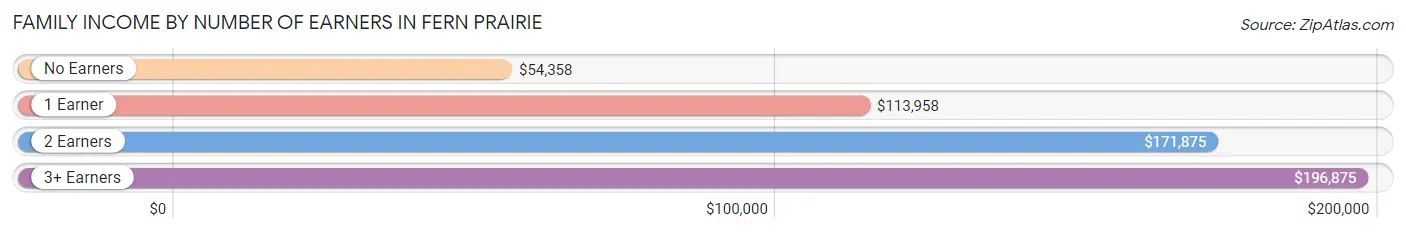
| Number of Earners | # Families | Median Income |
| No Earners | 141 (27.2%) | $54,358 |
| 1 Earner | 169 (32.6%) | $113,958 |
| 2 Earners | 136 (26.3%) | $171,875 |
| 3+ Earners | 72 (13.9%) | $196,875 |
| Total | 518 (100.0%) | $118,300 |
Household Income in Fern Prairie
Household Income Brackets in Fern Prairie
With 185 households falling in the category, the $100,000 to $149,999 income range is the most frequent in Fern Prairie, accounting for 27.3% of all households. In contrast, only 6 households (0.9%) fall into the less than $10,000 income bracket, making it the least populous group.
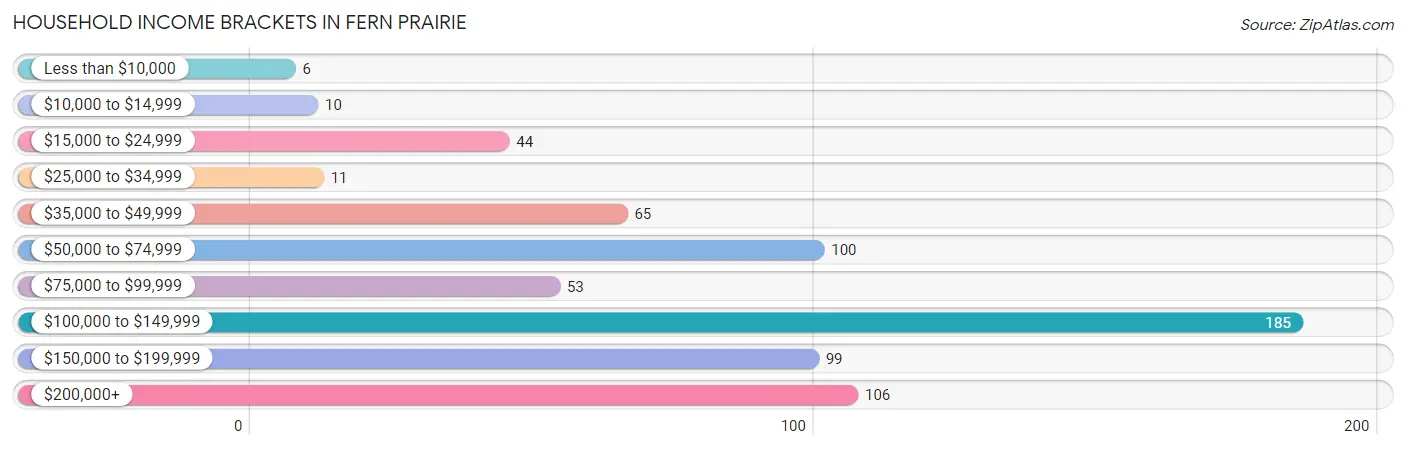
| Income Bracket | # Households | % Households |
| Less than $10,000 | 6 | 0.9% |
| $10,000 to $14,999 | 10 | 1.5% |
| $15,000 to $24,999 | 44 | 6.5% |
| $25,000 to $34,999 | 11 | 1.6% |
| $35,000 to $49,999 | 65 | 9.6% |
| $50,000 to $74,999 | 100 | 14.7% |
| $75,000 to $99,999 | 53 | 7.8% |
| $100,000 to $149,999 | 185 | 27.2% |
| $150,000 to $199,999 | 99 | 14.6% |
| $200,000+ | 106 | 15.6% |
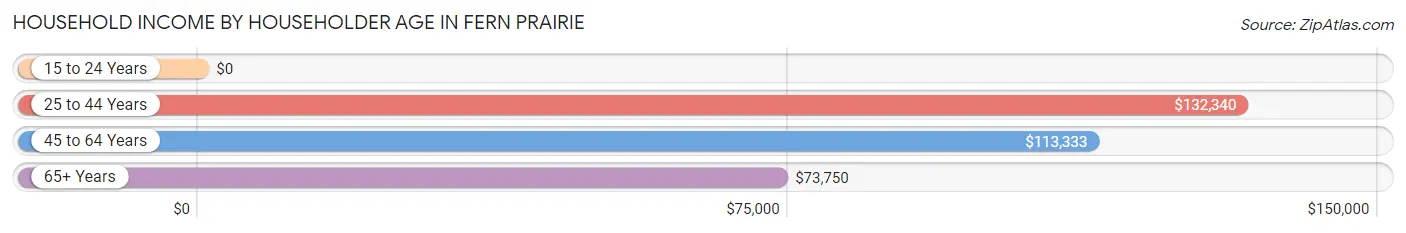
Household Income by Householder Age in Fern Prairie
The median household income in Fern Prairie is $112,888, with the highest median household income of $132,340 found in the 25 to 44 years age bracket for the primary householder. A total of 145 households (21.3%) fall into this category.
| Income Bracket | # Households | Median Income |
| 15 to 24 Years | 0 (0.0%) | $0 |
| 25 to 44 Years | 145 (21.3%) | $132,340 |
| 45 to 64 Years | 344 (50.7%) | $113,333 |
| 65+ Years | 190 (28.0%) | $73,750 |
| Total | 679 (100.0%) | $112,888 |
Poverty in Fern Prairie
Income Below Poverty by Sex and Age in Fern Prairie
With 6.1% poverty level for males and 9.9% for females among the residents of Fern Prairie, 25 to 34 year old males and 18 to 24 year old females are the most vulnerable to poverty, with 16 males (61.5%) and 15 females (53.6%) in their respective age groups living below the poverty level.
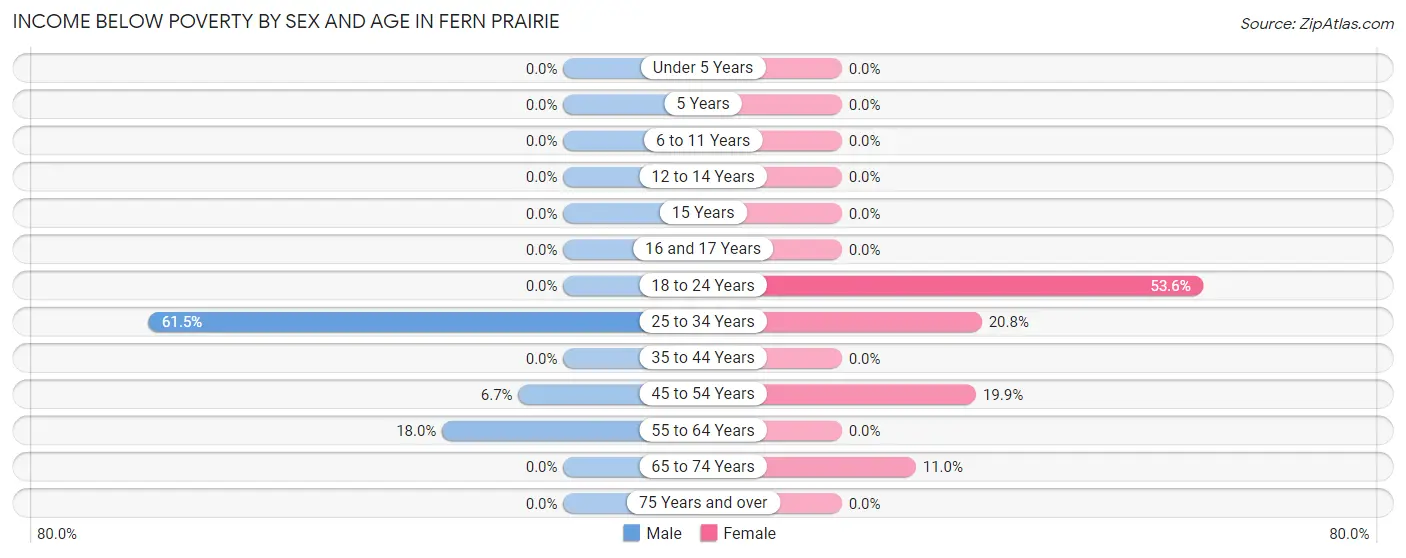
| Age Bracket | Male | Female |
| Under 5 Years | 0 (0.0%) | 0 (0.0%) |
| 5 Years | 0 (0.0%) | 0 (0.0%) |
| 6 to 11 Years | 0 (0.0%) | 0 (0.0%) |
| 12 to 14 Years | 0 (0.0%) | 0 (0.0%) |
| 15 Years | 0 (0.0%) | 0 (0.0%) |
| 16 and 17 Years | 0 (0.0%) | 0 (0.0%) |
| 18 to 24 Years | 0 (0.0%) | 15 (53.6%) |
| 25 to 34 Years | 16 (61.5%) | 16 (20.8%) |
| 35 to 44 Years | 0 (0.0%) | 0 (0.0%) |
| 45 to 54 Years | 10 (6.7%) | 55 (19.9%) |
| 55 to 64 Years | 34 (18.0%) | 0 (0.0%) |
| 65 to 74 Years | 0 (0.0%) | 10 (11.0%) |
| 75 Years and over | 0 (0.0%) | 0 (0.0%) |
| Total | 60 (6.1%) | 96 (9.9%) |
Income Above Poverty by Sex and Age in Fern Prairie
According to the poverty statistics in Fern Prairie, males aged 6 to 11 years and females aged under 5 years are the age groups that are most secure financially, with 100.0% of males and 100.0% of females in these age groups living above the poverty line.
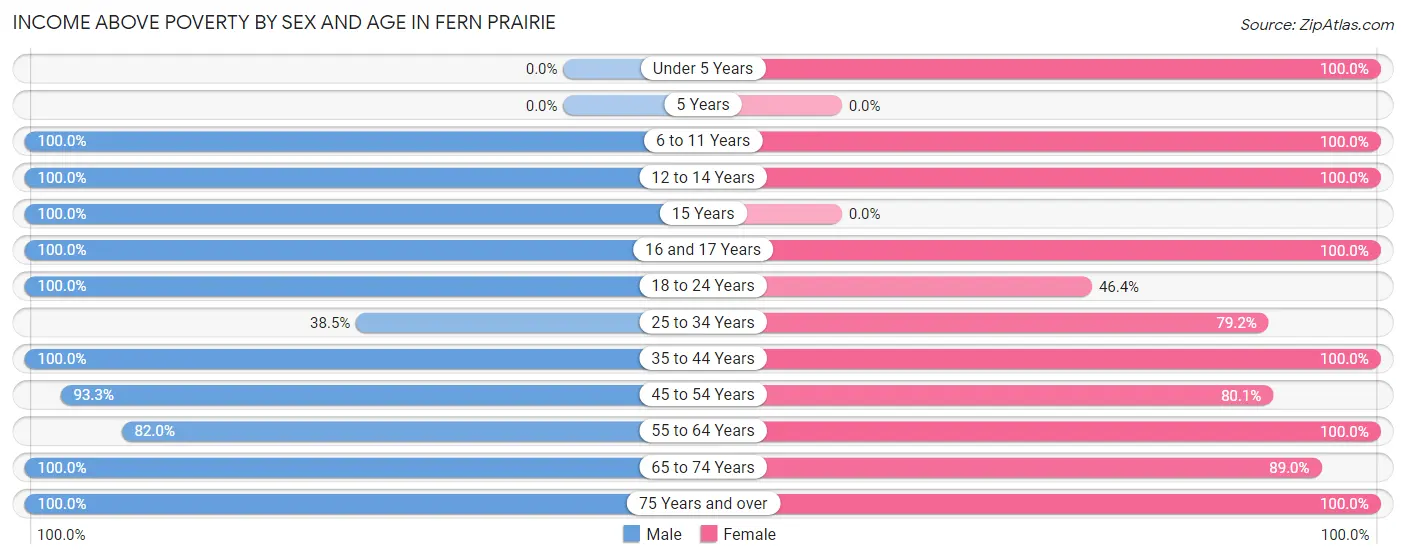
| Age Bracket | Male | Female |
| Under 5 Years | 0 (0.0%) | 6 (100.0%) |
| 5 Years | 0 (0.0%) | 0 (0.0%) |
| 6 to 11 Years | 90 (100.0%) | 133 (100.0%) |
| 12 to 14 Years | 145 (100.0%) | 70 (100.0%) |
| 15 Years | 14 (100.0%) | 0 (0.0%) |
| 16 and 17 Years | 15 (100.0%) | 60 (100.0%) |
| 18 to 24 Years | 70 (100.0%) | 13 (46.4%) |
| 25 to 34 Years | 10 (38.5%) | 61 (79.2%) |
| 35 to 44 Years | 140 (100.0%) | 87 (100.0%) |
| 45 to 54 Years | 140 (93.3%) | 221 (80.1%) |
| 55 to 64 Years | 155 (82.0%) | 84 (100.0%) |
| 65 to 74 Years | 99 (100.0%) | 81 (89.0%) |
| 75 Years and over | 42 (100.0%) | 54 (100.0%) |
| Total | 920 (93.9%) | 870 (90.1%) |
Income Below Poverty Among Married-Couple Families in Fern Prairie
The poverty statistics for married-couple families in Fern Prairie show that 1.5% or 6 of the total 395 families live below the poverty line. Families with no children have the highest poverty rate of 2.4%, comprising of 6 families. On the other hand, families with 1 or 2 children have the lowest poverty rate of 0.0%, which includes 0 families.
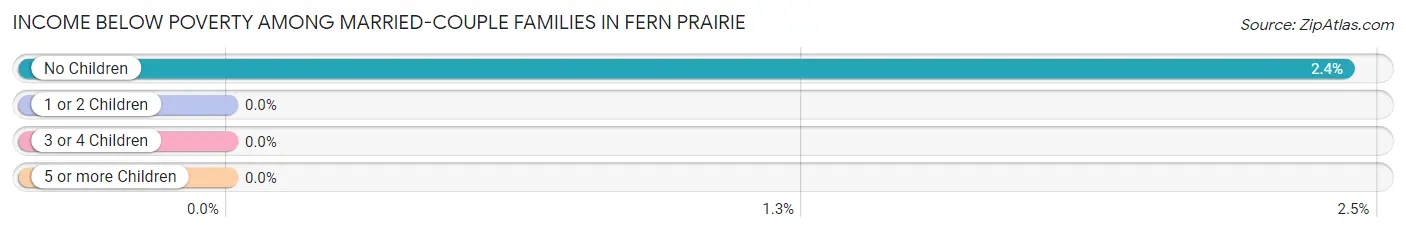
| Children | Above Poverty | Below Poverty |
| No Children | 241 (97.6%) | 6 (2.4%) |
| 1 or 2 Children | 129 (100.0%) | 0 (0.0%) |
| 3 or 4 Children | 19 (100.0%) | 0 (0.0%) |
| 5 or more Children | 0 (0.0%) | 0 (0.0%) |
| Total | 389 (98.5%) | 6 (1.5%) |
Income Below Poverty Among Single-Parent Households in Fern Prairie
| Children | Single Father | Single Mother |
| No Children | 0 (0.0%) | 0 (0.0%) |
| 1 or 2 Children | 0 (0.0%) | 0 (0.0%) |
| 3 or 4 Children | 0 (0.0%) | 0 (0.0%) |
| 5 or more Children | 0 (0.0%) | 0 (0.0%) |
| Total | 0 (0.0%) | 0 (0.0%) |
Income Below Poverty Among Married-Couple vs Single-Parent Households in Fern Prairie
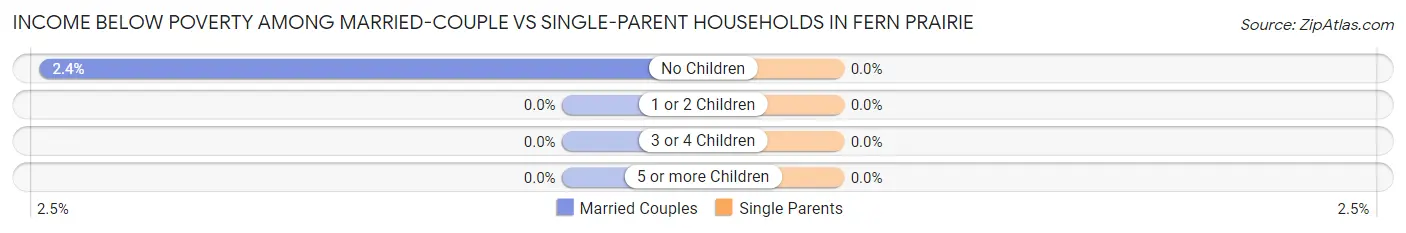
| Children | Married-Couple Families | Single-Parent Households |
| No Children | 6 (2.4%) | 0 (0.0%) |
| 1 or 2 Children | 0 (0.0%) | 0 (0.0%) |
| 3 or 4 Children | 0 (0.0%) | 0 (0.0%) |
| 5 or more Children | 0 (0.0%) | 0 (0.0%) |
| Total | 6 (1.5%) | 0 (0.0%) |
Race in Fern Prairie
The most populous races in Fern Prairie are White / Caucasian (1,796 | 92.3%), Two or more Races (85 | 4.4%), and Hispanic or Latino (84 | 4.3%).
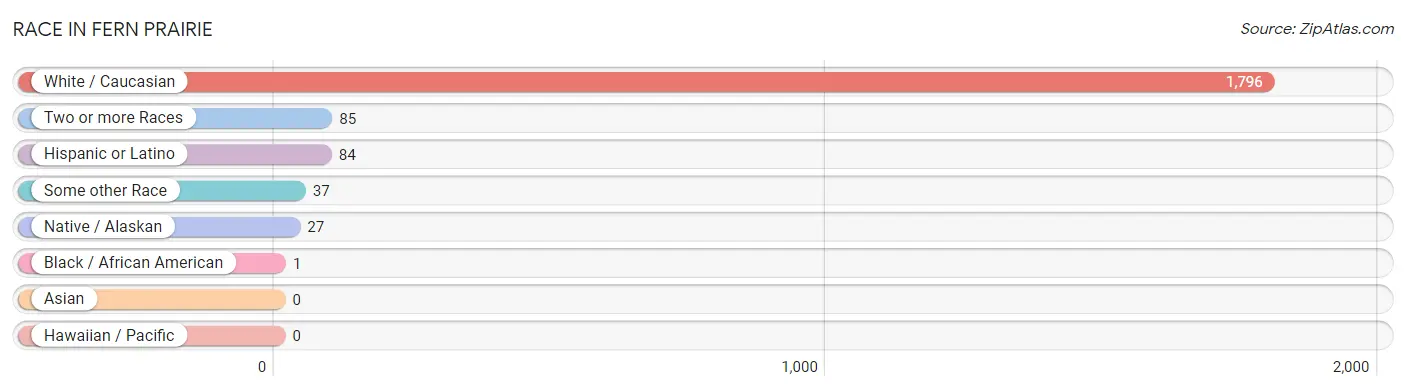
| Race | # Population | % Population |
| Asian | 0 | 0.0% |
| Black / African American | 1 | 0.1% |
| Hawaiian / Pacific | 0 | 0.0% |
| Hispanic or Latino | 84 | 4.3% |
| Native / Alaskan | 27 | 1.4% |
| White / Caucasian | 1,796 | 92.3% |
| Two or more Races | 85 | 4.4% |
| Some other Race | 37 | 1.9% |
| Total | 1,946 | 100.0% |
Ancestry in Fern Prairie
The most populous ancestries reported in Fern Prairie are English (479 | 24.6%), German (338 | 17.4%), Swedish (299 | 15.4%), Irish (132 | 6.8%), and European (86 | 4.4%), together accounting for 68.5% of all Fern Prairie residents.
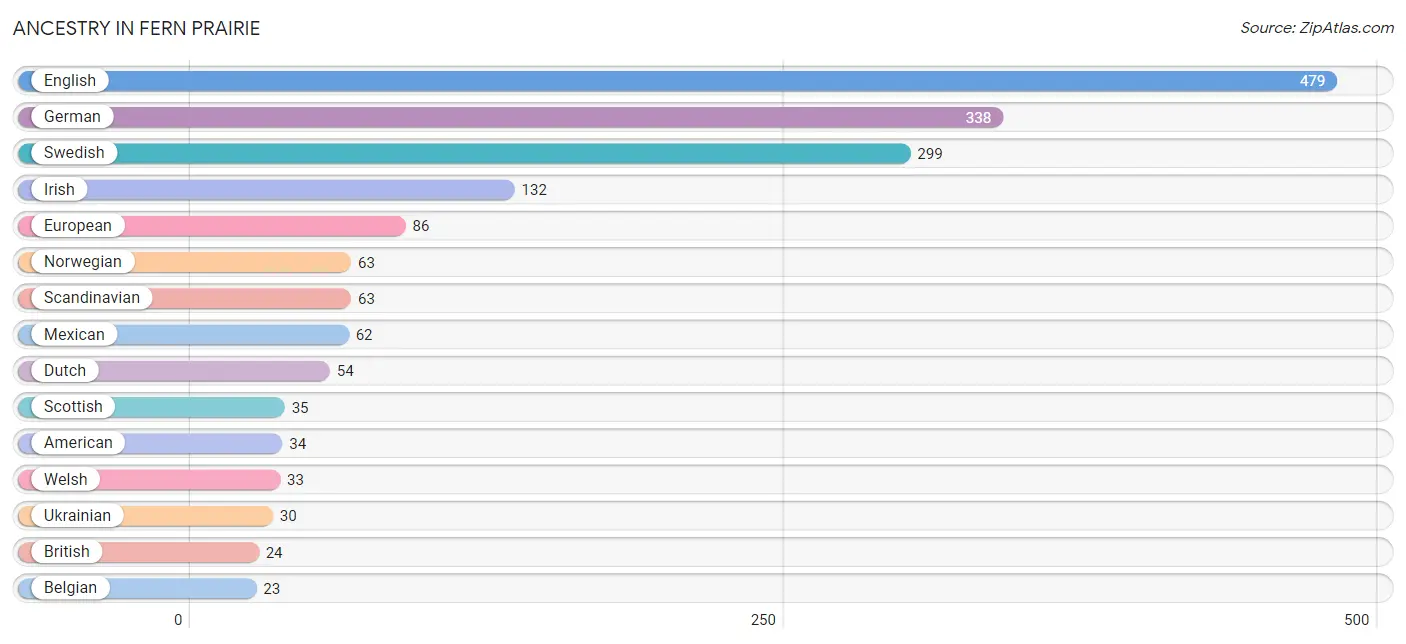
| Ancestry | # Population | % Population |
| American | 34 | 1.8% |
| Austrian | 7 | 0.4% |
| Belgian | 23 | 1.2% |
| British | 24 | 1.2% |
| Choctaw | 19 | 1.0% |
| Croatian | 7 | 0.4% |
| Danish | 3 | 0.2% |
| Dutch | 54 | 2.8% |
| English | 479 | 24.6% |
| European | 86 | 4.4% |
| French | 14 | 0.7% |
| German | 338 | 17.4% |
| Ghanaian | 1 | 0.1% |
| Irish | 132 | 6.8% |
| Italian | 8 | 0.4% |
| Mexican | 62 | 3.2% |
| Northern European | 12 | 0.6% |
| Norwegian | 63 | 3.2% |
| Osage | 5 | 0.3% |
| Polish | 10 | 0.5% |
| Scandinavian | 63 | 3.2% |
| Scotch-Irish | 15 | 0.8% |
| Scottish | 35 | 1.8% |
| Spaniard | 22 | 1.1% |
| Subsaharan African | 1 | 0.1% |
| Swedish | 299 | 15.4% |
| Ukrainian | 30 | 1.5% |
| Welsh | 33 | 1.7% | View All 28 Rows |
Immigrants in Fern Prairie
The most numerous immigrant groups reported in Fern Prairie came from Europe (78 | 4.0%), Eastern Europe (39 | 2.0%), Ukraine (39 | 2.0%), Western Europe (32 | 1.6%), and Germany (15 | 0.8%), together accounting for 10.4% of all Fern Prairie residents.
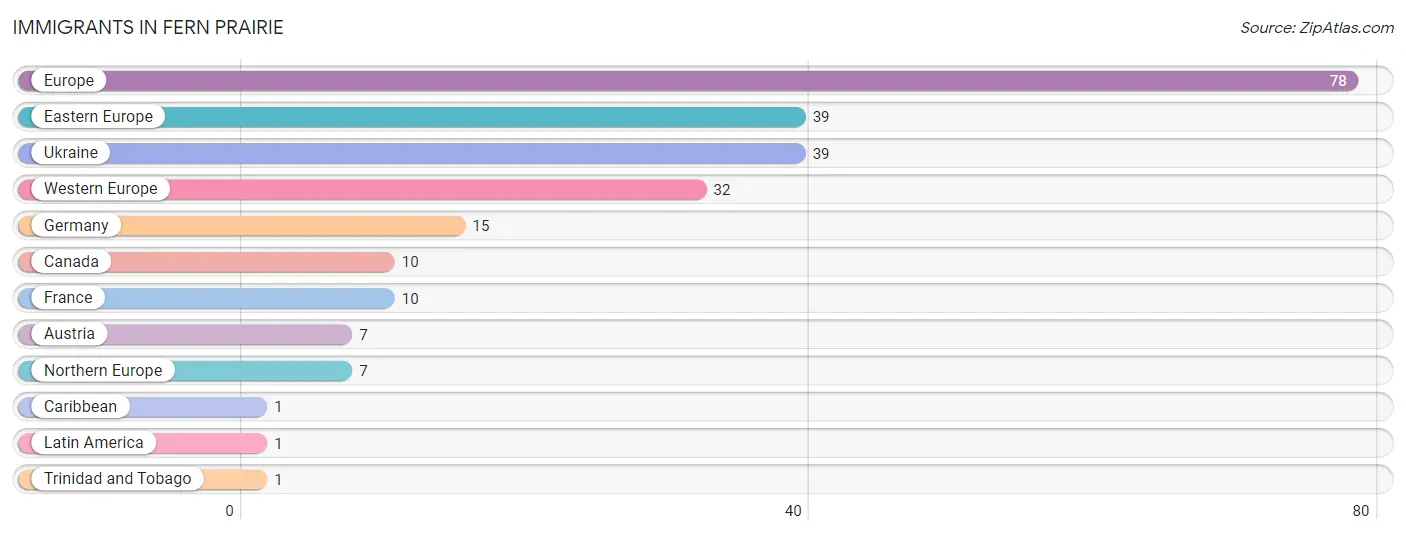
| Immigration Origin | # Population | % Population |
| Austria | 7 | 0.4% |
| Canada | 10 | 0.5% |
| Caribbean | 1 | 0.1% |
| Eastern Europe | 39 | 2.0% |
| Europe | 78 | 4.0% |
| France | 10 | 0.5% |
| Germany | 15 | 0.8% |
| Latin America | 1 | 0.1% |
| Northern Europe | 7 | 0.4% |
| Trinidad and Tobago | 1 | 0.1% |
| Ukraine | 39 | 2.0% |
| Western Europe | 32 | 1.6% | View All 12 Rows |
Sex and Age in Fern Prairie
Sex and Age in Fern Prairie
The most populous age groups in Fern Prairie are 10 to 14 Years (220 | 22.5%) for men and 50 to 54 Years (174 | 18.0%) for women.
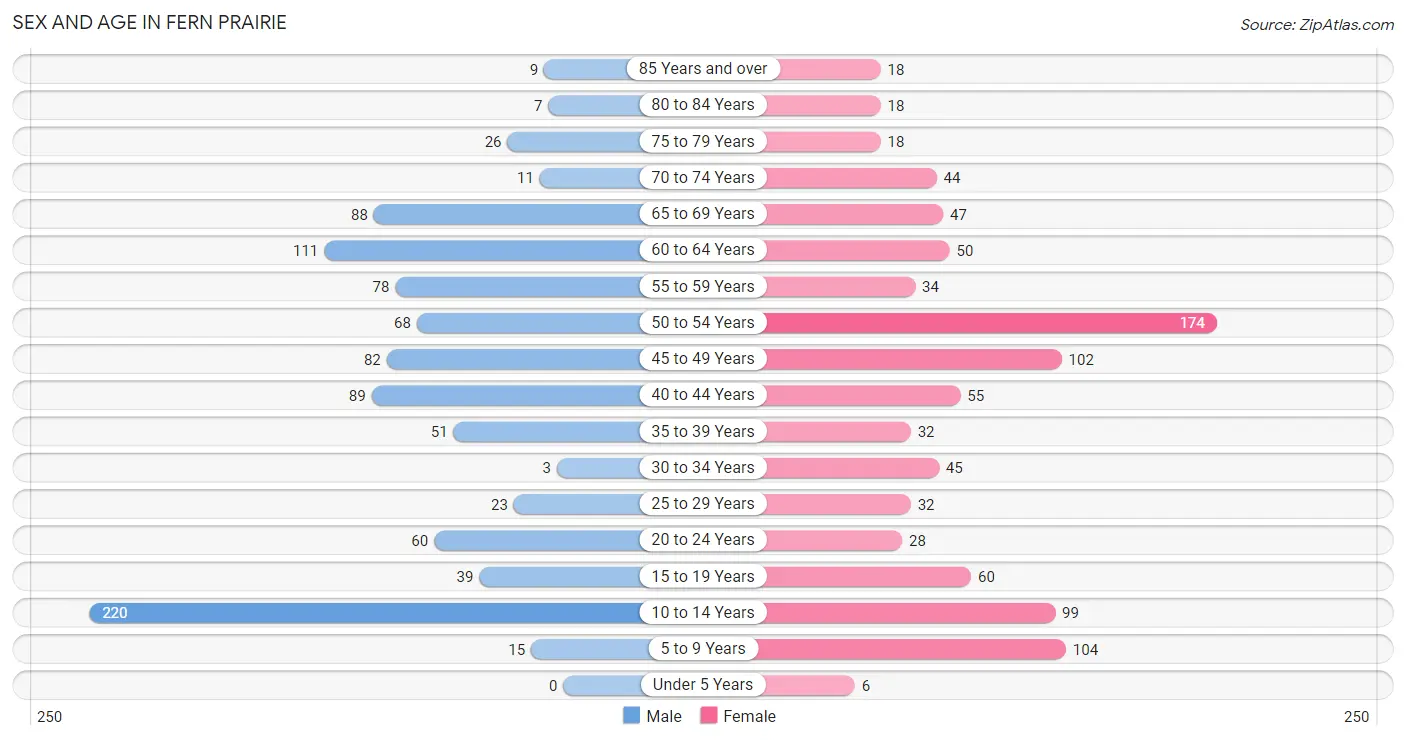
| Age Bracket | Male | Female |
| Under 5 Years | 0 (0.0%) | 6 (0.6%) |
| 5 to 9 Years | 15 (1.5%) | 104 (10.8%) |
| 10 to 14 Years | 220 (22.5%) | 99 (10.2%) |
| 15 to 19 Years | 39 (4.0%) | 60 (6.2%) |
| 20 to 24 Years | 60 (6.1%) | 28 (2.9%) |
| 25 to 29 Years | 23 (2.4%) | 32 (3.3%) |
| 30 to 34 Years | 3 (0.3%) | 45 (4.7%) |
| 35 to 39 Years | 51 (5.2%) | 32 (3.3%) |
| 40 to 44 Years | 89 (9.1%) | 55 (5.7%) |
| 45 to 49 Years | 82 (8.4%) | 102 (10.6%) |
| 50 to 54 Years | 68 (6.9%) | 174 (18.0%) |
| 55 to 59 Years | 78 (8.0%) | 34 (3.5%) |
| 60 to 64 Years | 111 (11.3%) | 50 (5.2%) |
| 65 to 69 Years | 88 (9.0%) | 47 (4.9%) |
| 70 to 74 Years | 11 (1.1%) | 44 (4.5%) |
| 75 to 79 Years | 26 (2.6%) | 18 (1.9%) |
| 80 to 84 Years | 7 (0.7%) | 18 (1.9%) |
| 85 Years and over | 9 (0.9%) | 18 (1.9%) |
| Total | 980 (100.0%) | 966 (100.0%) |
Families and Households in Fern Prairie
Median Family Size in Fern Prairie
The median family size in Fern Prairie is 3.11 persons per family, with single female/mother families (92 | 17.8%) accounting for the largest median family size of 4.12 persons per family. On the other hand, married-couple families (395 | 76.2%) represent the smallest median family size with 2.89 persons per family.
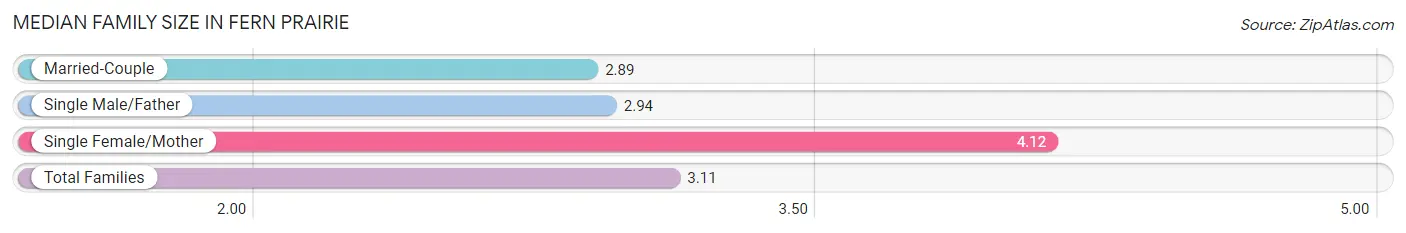
| Family Type | # Families | Family Size |
| Married-Couple | 395 (76.2%) | 2.89 |
| Single Male/Father | 31 (6.0%) | 2.94 |
| Single Female/Mother | 92 (17.8%) | 4.12 |
| Total Families | 518 (100.0%) | 3.11 |
Median Household Size in Fern Prairie
The median household size in Fern Prairie is 2.86 persons per household, with single female/mother households (92 | 13.6%) accounting for the largest median household size of 4.37 persons per household. non-family households (161 | 23.7%) represent the smallest median household size with 1.39 persons per household.
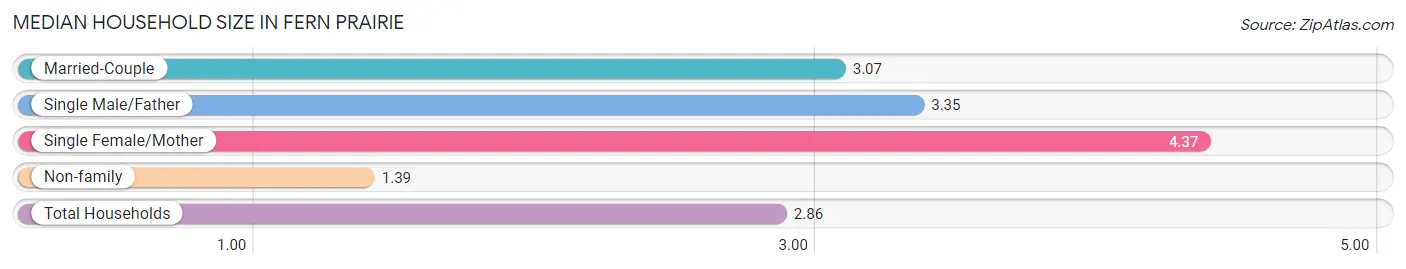
| Household Type | # Households | Household Size |
| Married-Couple | 395 (58.2%) | 3.07 |
| Single Male/Father | 31 (4.6%) | 3.35 |
| Single Female/Mother | 92 (13.6%) | 4.37 |
| Non-family | 161 (23.7%) | 1.39 |
| Total Households | 679 (100.0%) | 2.86 |
Household Size by Marriage Status in Fern Prairie
Out of a total of 679 households in Fern Prairie, 518 (76.3%) are family households, while 161 (23.7%) are nonfamily households. The most numerous type of family households are 2-person households, comprising 217, and the most common type of nonfamily households are 1-person households, comprising 101.
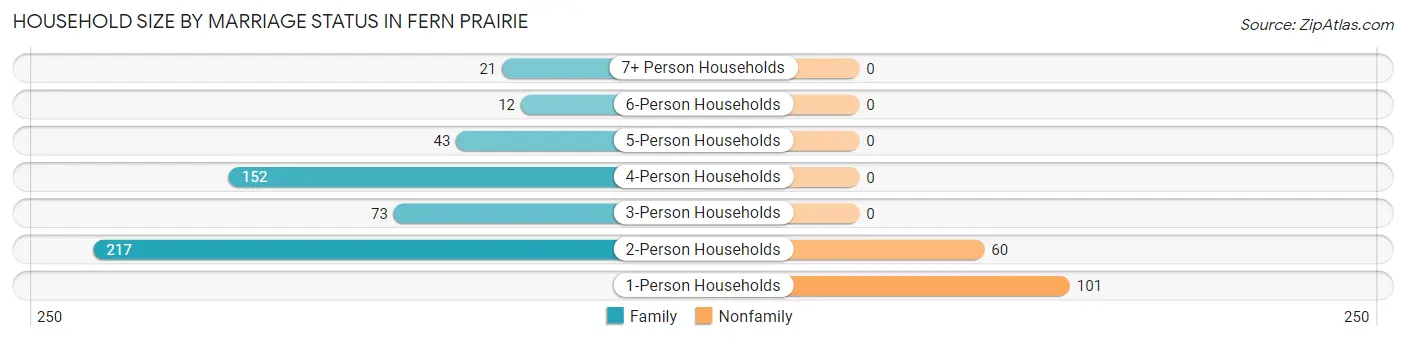
| Household Size | Family Households | Nonfamily Households |
| 1-Person Households | - | 101 (14.9%) |
| 2-Person Households | 217 (32.0%) | 60 (8.8%) |
| 3-Person Households | 73 (10.7%) | 0 (0.0%) |
| 4-Person Households | 152 (22.4%) | 0 (0.0%) |
| 5-Person Households | 43 (6.3%) | 0 (0.0%) |
| 6-Person Households | 12 (1.8%) | 0 (0.0%) |
| 7+ Person Households | 21 (3.1%) | 0 (0.0%) |
| Total | 518 (76.3%) | 161 (23.7%) |
Female Fertility in Fern Prairie
Fertility by Age in Fern Prairie
Average fertility rate in Fern Prairie is 34.0 births per 1,000 women. Women in the age bracket of 20 to 34 years have the highest fertility rate with 124.0 births per 1,000 women. Women in the age bracket of 20 to 34 years acount for 100.0% of all women with births.
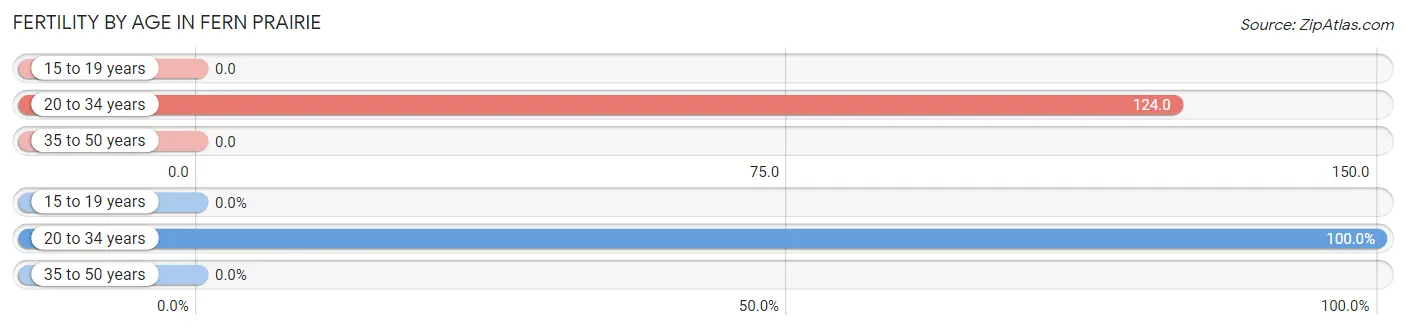
| Age Bracket | Women with Births | Births / 1,000 Women |
| 15 to 19 years | 0 (0.0%) | 0.0 |
| 20 to 34 years | 13 (100.0%) | 124.0 |
| 35 to 50 years | 0 (0.0%) | 0.0 |
| Total | 13 (100.0%) | 34.0 |
Fertility by Age by Marriage Status in Fern Prairie
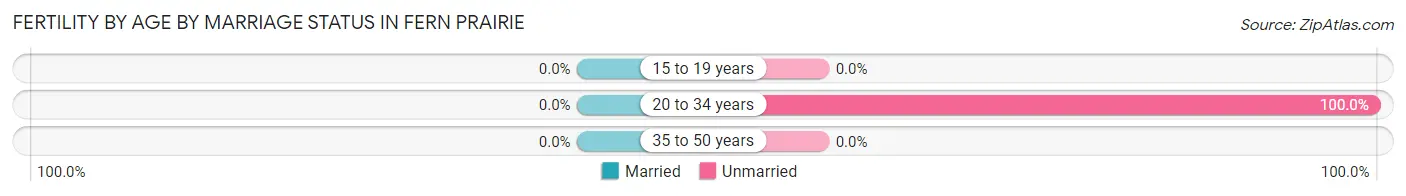
| Age Bracket | Married | Unmarried |
| 15 to 19 years | 0 (0.0%) | 0 (0.0%) |
| 20 to 34 years | 0 (0.0%) | 13 (100.0%) |
| 35 to 50 years | 0 (0.0%) | 0 (0.0%) |
| Total | 0 (0.0%) | 13 (100.0%) |
Fertility by Education in Fern Prairie
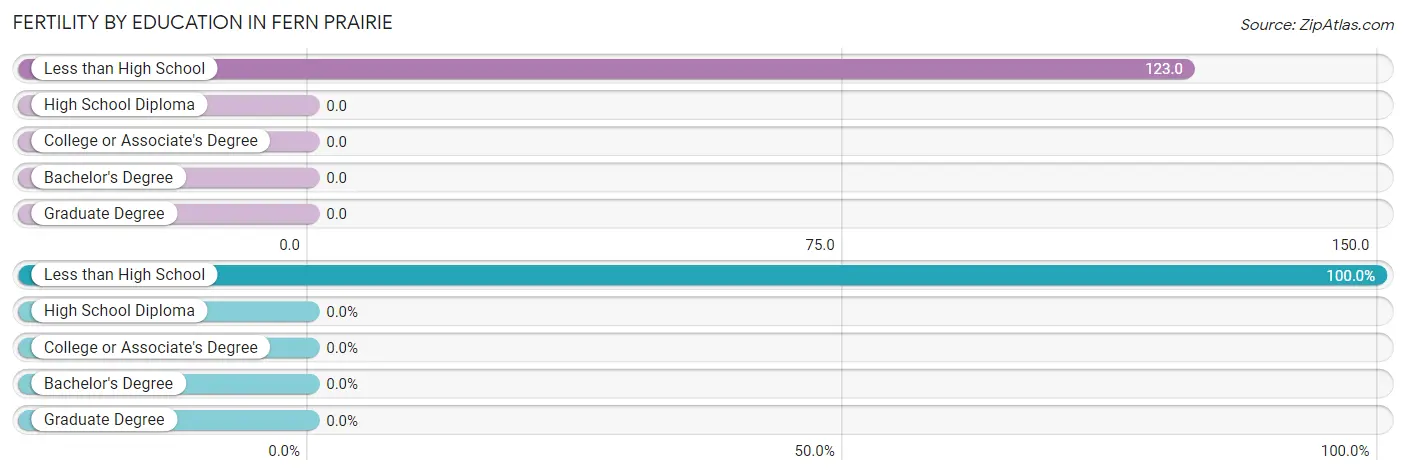
| Educational Attainment | Women with Births | Births / 1,000 Women |
| Less than High School | 13 (100.0%) | 123.0 |
| High School Diploma | 0 (0.0%) | 0.0 |
| College or Associate's Degree | 0 (0.0%) | 0.0 |
| Bachelor's Degree | 0 (0.0%) | 0.0 |
| Graduate Degree | 0 (0.0%) | 0.0 |
| Total | 13 (100.0%) | 34.0 |
Fertility by Education by Marriage Status in Fern Prairie
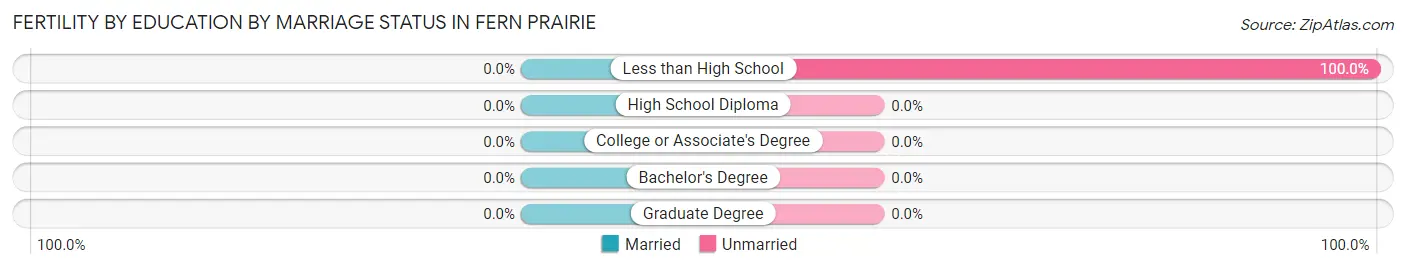
| Educational Attainment | Married | Unmarried |
| Less than High School | 0 (0.0%) | 13 (100.0%) |
| High School Diploma | 0 (0.0%) | 0 (0.0%) |
| College or Associate's Degree | 0 (0.0%) | 0 (0.0%) |
| Bachelor's Degree | 0 (0.0%) | 0 (0.0%) |
| Graduate Degree | 0 (0.0%) | 0 (0.0%) |
| Total | 0 (0.0%) | 13 (100.0%) |
Employment Characteristics in Fern Prairie
Employment by Class of Employer in Fern Prairie
Among the 711 employed individuals in Fern Prairie, private company employees (436 | 61.3%), self-employed (not incorporated) (92 | 12.9%), and local government employees (69 | 9.7%) make up the most common classes of employment.
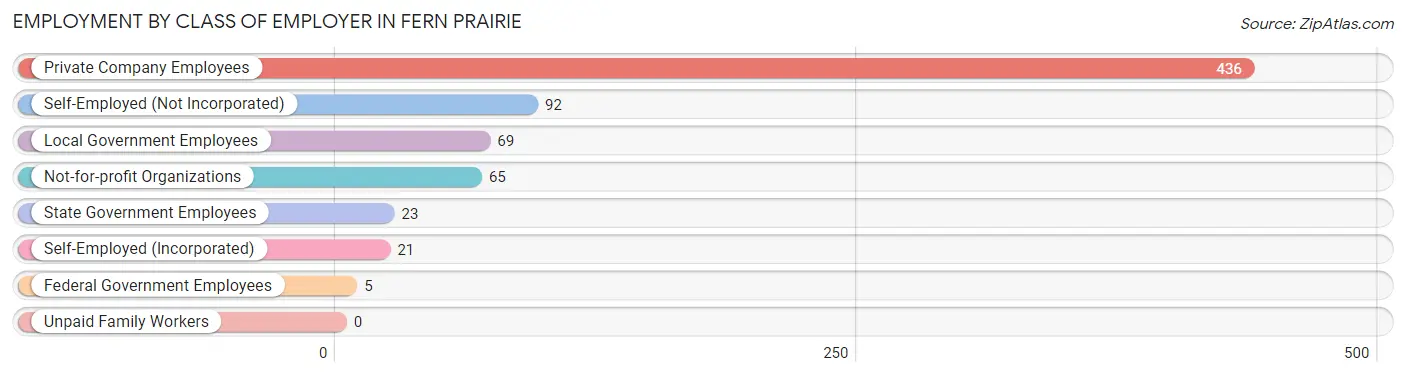
| Employer Class | # Employees | % Employees |
| Private Company Employees | 436 | 61.3% |
| Self-Employed (Incorporated) | 21 | 2.9% |
| Self-Employed (Not Incorporated) | 92 | 12.9% |
| Not-for-profit Organizations | 65 | 9.1% |
| Local Government Employees | 69 | 9.7% |
| State Government Employees | 23 | 3.2% |
| Federal Government Employees | 5 | 0.7% |
| Unpaid Family Workers | 0 | 0.0% |
| Total | 711 | 100.0% |
Employment Status by Age in Fern Prairie
According to the labor force statistics for Fern Prairie, out of the total population over 16 years of age (1,488), 50.4% or 750 individuals are in the labor force, with 4.0% or 30 of them unemployed. The age group with the highest labor force participation rate is 35 to 44 years, with 91.6% or 208 individuals in the labor force. Within the labor force, the 20 to 24 years age range has the highest percentage of unemployed individuals, with 61.2% or 30 of them being unemployed.
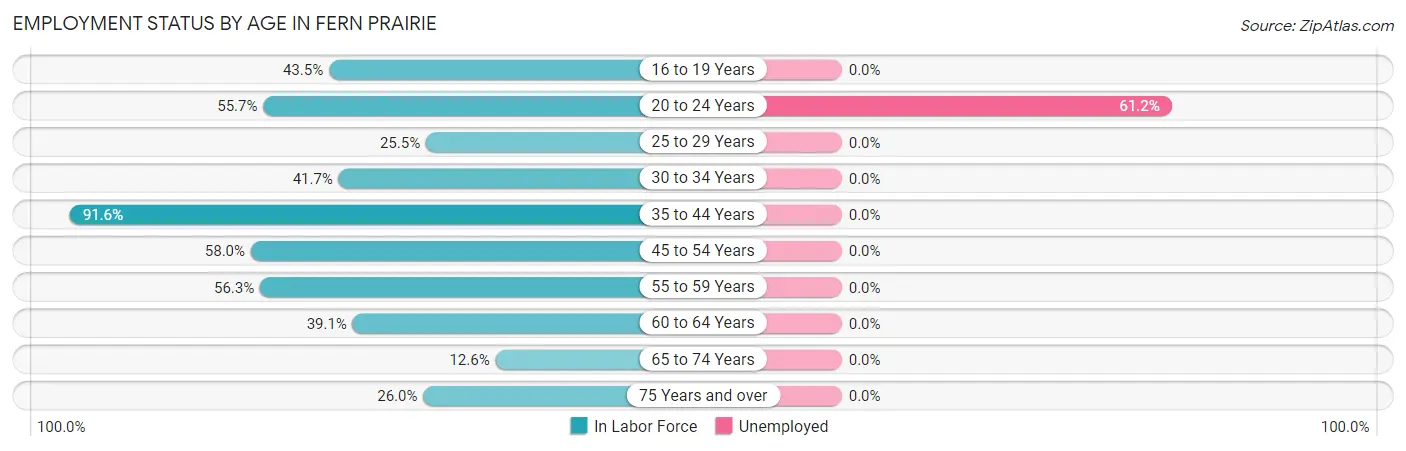
| Age Bracket | In Labor Force | Unemployed |
| 16 to 19 Years | 37 (43.5%) | 0 (0.0%) |
| 20 to 24 Years | 49 (55.7%) | 30 (61.2%) |
| 25 to 29 Years | 14 (25.5%) | 0 (0.0%) |
| 30 to 34 Years | 20 (41.7%) | 0 (0.0%) |
| 35 to 44 Years | 208 (91.6%) | 0 (0.0%) |
| 45 to 54 Years | 247 (58.0%) | 0 (0.0%) |
| 55 to 59 Years | 63 (56.3%) | 0 (0.0%) |
| 60 to 64 Years | 63 (39.1%) | 0 (0.0%) |
| 65 to 74 Years | 24 (12.6%) | 0 (0.0%) |
| 75 Years and over | 25 (26.0%) | 0 (0.0%) |
| Total | 750 (50.4%) | 30 (4.0%) |
Employment Status by Educational Attainment in Fern Prairie
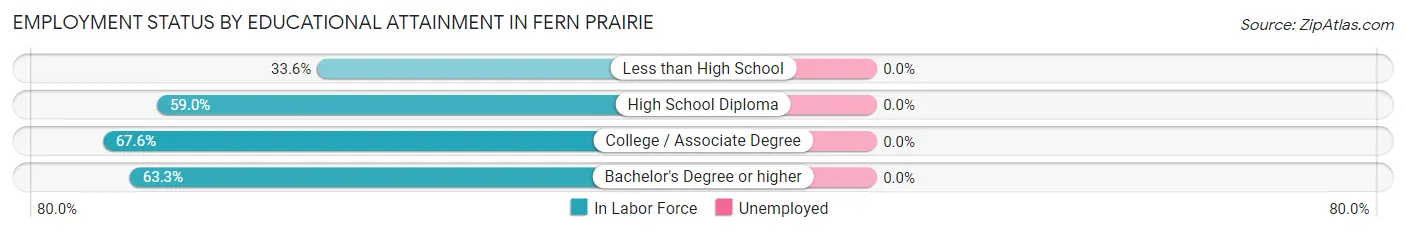
| Educational Attainment | In Labor Force | Unemployed |
| Less than High School | 39 (33.6%) | 0 (0.0%) |
| High School Diploma | 190 (59.0%) | 0 (0.0%) |
| College / Associate Degree | 184 (67.6%) | 0 (0.0%) |
| Bachelor's Degree or higher | 202 (63.3%) | 0 (0.0%) |
| Total | 615 (59.8%) | 0 (0.0%) |
Employment Occupations by Sex in Fern Prairie
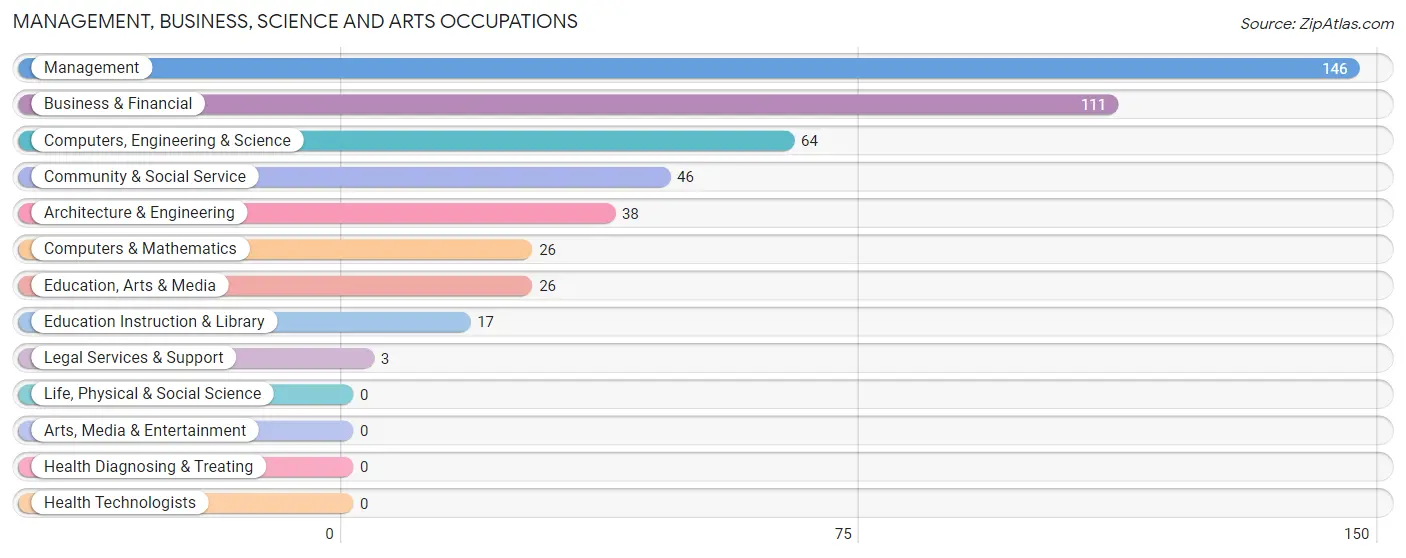
Management, Business, Science and Arts Occupations
The most common Management, Business, Science and Arts occupations in Fern Prairie are Management (146 | 20.3%), Business & Financial (111 | 15.4%), Computers, Engineering & Science (64 | 8.9%), Community & Social Service (46 | 6.4%), and Architecture & Engineering (38 | 5.3%).
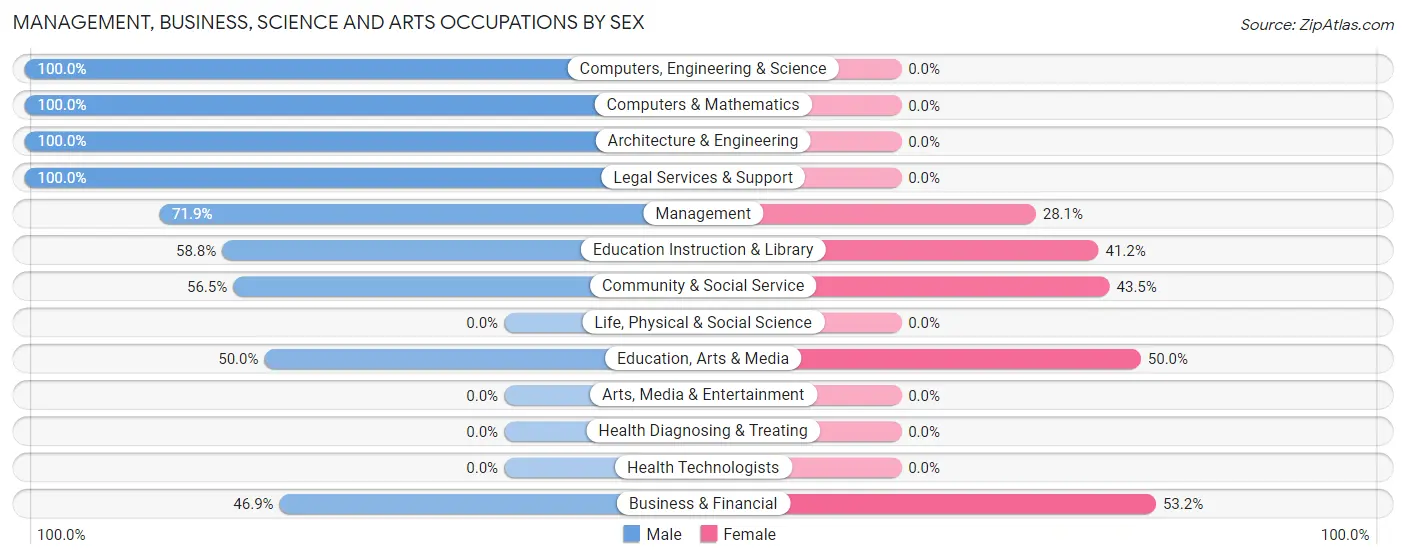
Management, Business, Science and Arts Occupations by Sex
Within the Management, Business, Science and Arts occupations in Fern Prairie, the most male-oriented occupations are Computers, Engineering & Science (100.0%), Computers & Mathematics (100.0%), and Architecture & Engineering (100.0%), while the most female-oriented occupations are Business & Financial (53.1%), Education, Arts & Media (50.0%), and Community & Social Service (43.5%).
| Occupation | Male | Female |
| Management | 105 (71.9%) | 41 (28.1%) |
| Business & Financial | 52 (46.9%) | 59 (53.1%) |
| Computers, Engineering & Science | 64 (100.0%) | 0 (0.0%) |
| Computers & Mathematics | 26 (100.0%) | 0 (0.0%) |
| Architecture & Engineering | 38 (100.0%) | 0 (0.0%) |
| Life, Physical & Social Science | 0 (0.0%) | 0 (0.0%) |
| Community & Social Service | 26 (56.5%) | 20 (43.5%) |
| Education, Arts & Media | 13 (50.0%) | 13 (50.0%) |
| Legal Services & Support | 3 (100.0%) | 0 (0.0%) |
| Education Instruction & Library | 10 (58.8%) | 7 (41.2%) |
| Arts, Media & Entertainment | 0 (0.0%) | 0 (0.0%) |
| Health Diagnosing & Treating | 0 (0.0%) | 0 (0.0%) |
| Health Technologists | 0 (0.0%) | 0 (0.0%) |
| Total (Category) | 247 (67.3%) | 120 (32.7%) |
| Total (Overall) | 423 (58.8%) | 297 (41.2%) |
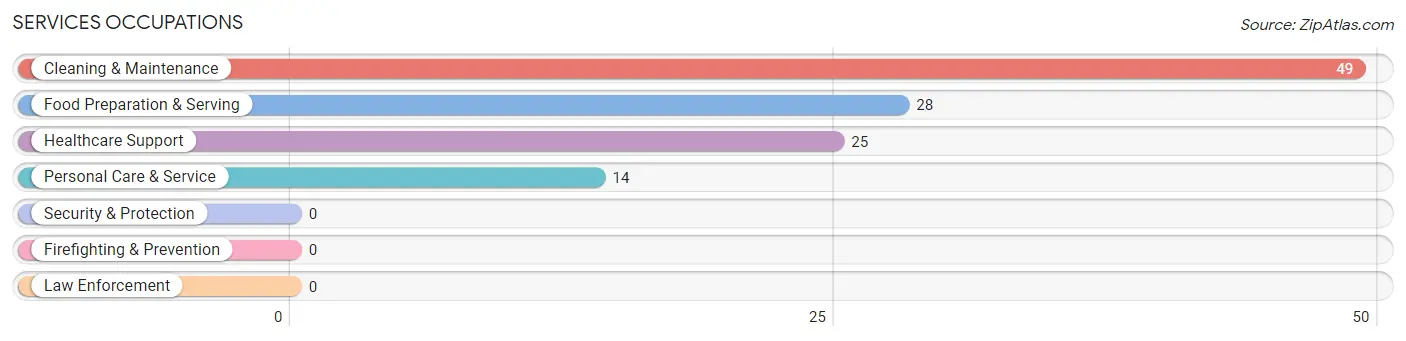
Services Occupations
The most common Services occupations in Fern Prairie are Cleaning & Maintenance (49 | 6.8%), Food Preparation & Serving (28 | 3.9%), Healthcare Support (25 | 3.5%), and Personal Care & Service (14 | 1.9%).
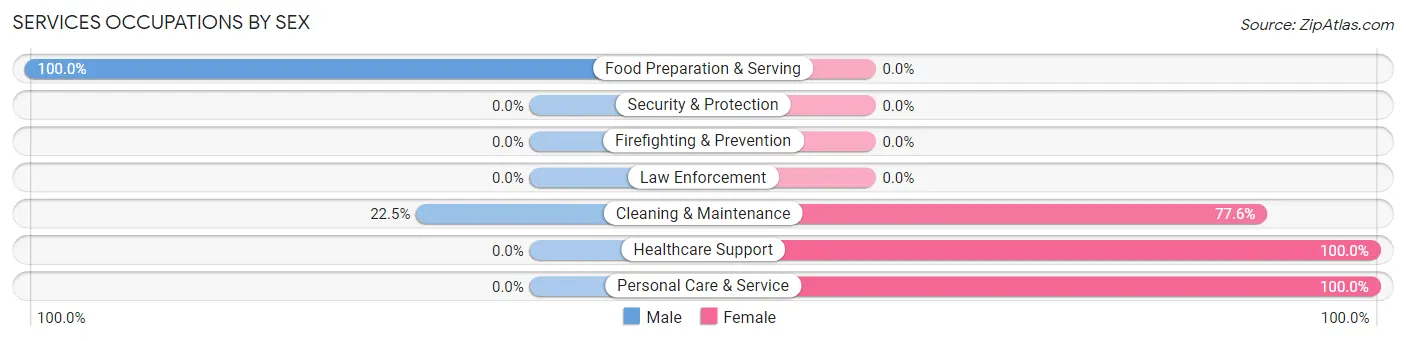
Services Occupations by Sex
Within the Services occupations in Fern Prairie, the most male-oriented occupations are Food Preparation & Serving (100.0%), and Cleaning & Maintenance (22.5%), while the most female-oriented occupations are Healthcare Support (100.0%), Personal Care & Service (100.0%), and Cleaning & Maintenance (77.5%).
| Occupation | Male | Female |
| Healthcare Support | 0 (0.0%) | 25 (100.0%) |
| Security & Protection | 0 (0.0%) | 0 (0.0%) |
| Firefighting & Prevention | 0 (0.0%) | 0 (0.0%) |
| Law Enforcement | 0 (0.0%) | 0 (0.0%) |
| Food Preparation & Serving | 28 (100.0%) | 0 (0.0%) |
| Cleaning & Maintenance | 11 (22.5%) | 38 (77.5%) |
| Personal Care & Service | 0 (0.0%) | 14 (100.0%) |
| Total (Category) | 39 (33.6%) | 77 (66.4%) |
| Total (Overall) | 423 (58.8%) | 297 (41.2%) |
Sales and Office Occupations
The most common Sales and Office occupations in Fern Prairie are Sales & Related (67 | 9.3%), and Office & Administration (53 | 7.4%).
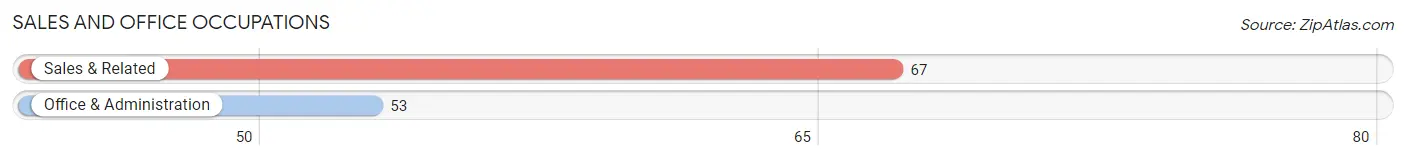
Sales and Office Occupations by Sex
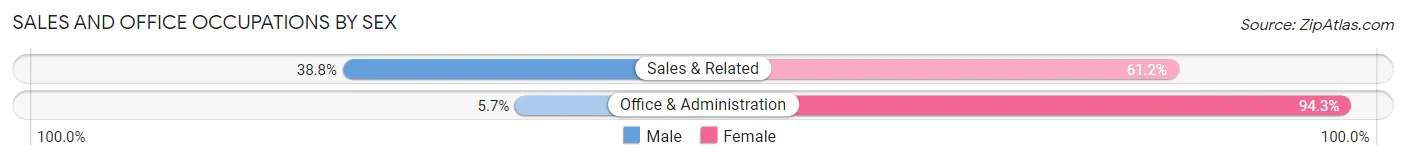
| Occupation | Male | Female |
| Sales & Related | 26 (38.8%) | 41 (61.2%) |
| Office & Administration | 3 (5.7%) | 50 (94.3%) |
| Total (Category) | 29 (24.2%) | 91 (75.8%) |
| Total (Overall) | 423 (58.8%) | 297 (41.2%) |
Natural Resources, Construction and Maintenance Occupations
The most common Natural Resources, Construction and Maintenance occupations in Fern Prairie are , and Construction & Extraction (26 | 3.6%).
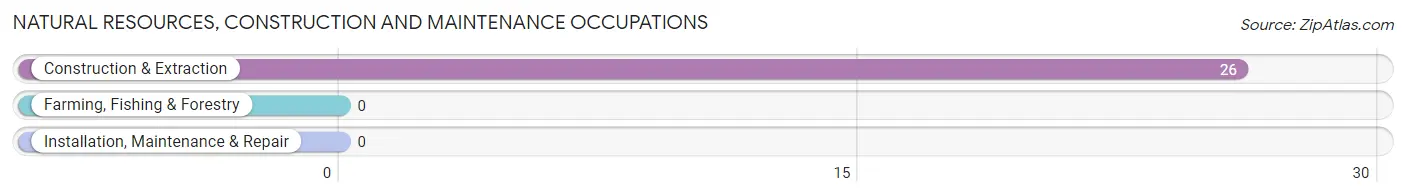
Natural Resources, Construction and Maintenance Occupations by Sex
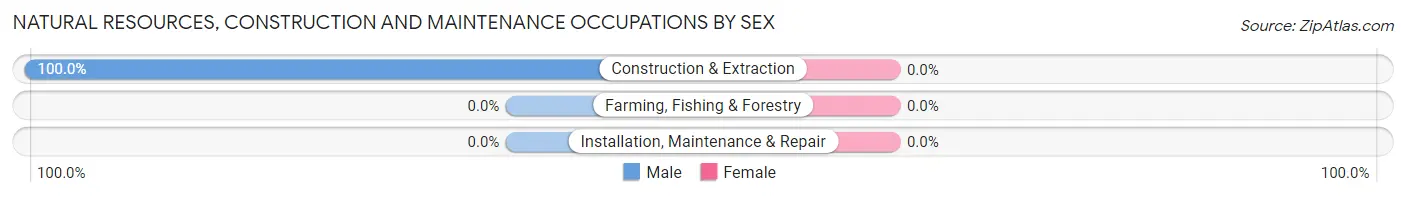
| Occupation | Male | Female |
| Farming, Fishing & Forestry | 0 (0.0%) | 0 (0.0%) |
| Construction & Extraction | 26 (100.0%) | 0 (0.0%) |
| Installation, Maintenance & Repair | 0 (0.0%) | 0 (0.0%) |
| Total (Category) | 26 (100.0%) | 0 (0.0%) |
| Total (Overall) | 423 (58.8%) | 297 (41.2%) |
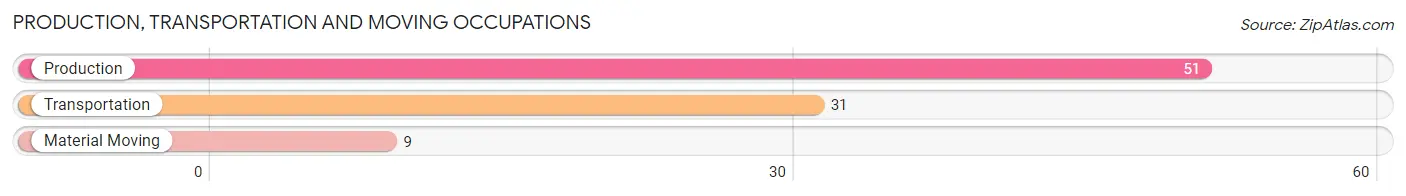
Production, Transportation and Moving Occupations
The most common Production, Transportation and Moving occupations in Fern Prairie are Production (51 | 7.1%), Transportation (31 | 4.3%), and Material Moving (9 | 1.3%).
Production, Transportation and Moving Occupations by Sex
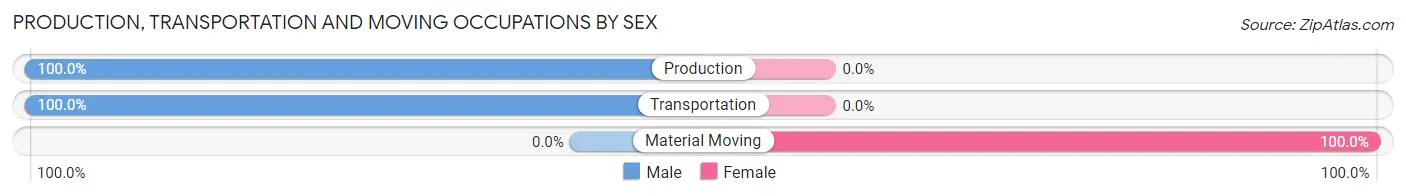
| Occupation | Male | Female |
| Production | 51 (100.0%) | 0 (0.0%) |
| Transportation | 31 (100.0%) | 0 (0.0%) |
| Material Moving | 0 (0.0%) | 9 (100.0%) |
| Total (Category) | 82 (90.1%) | 9 (9.9%) |
| Total (Overall) | 423 (58.8%) | 297 (41.2%) |
Employment Industries by Sex in Fern Prairie
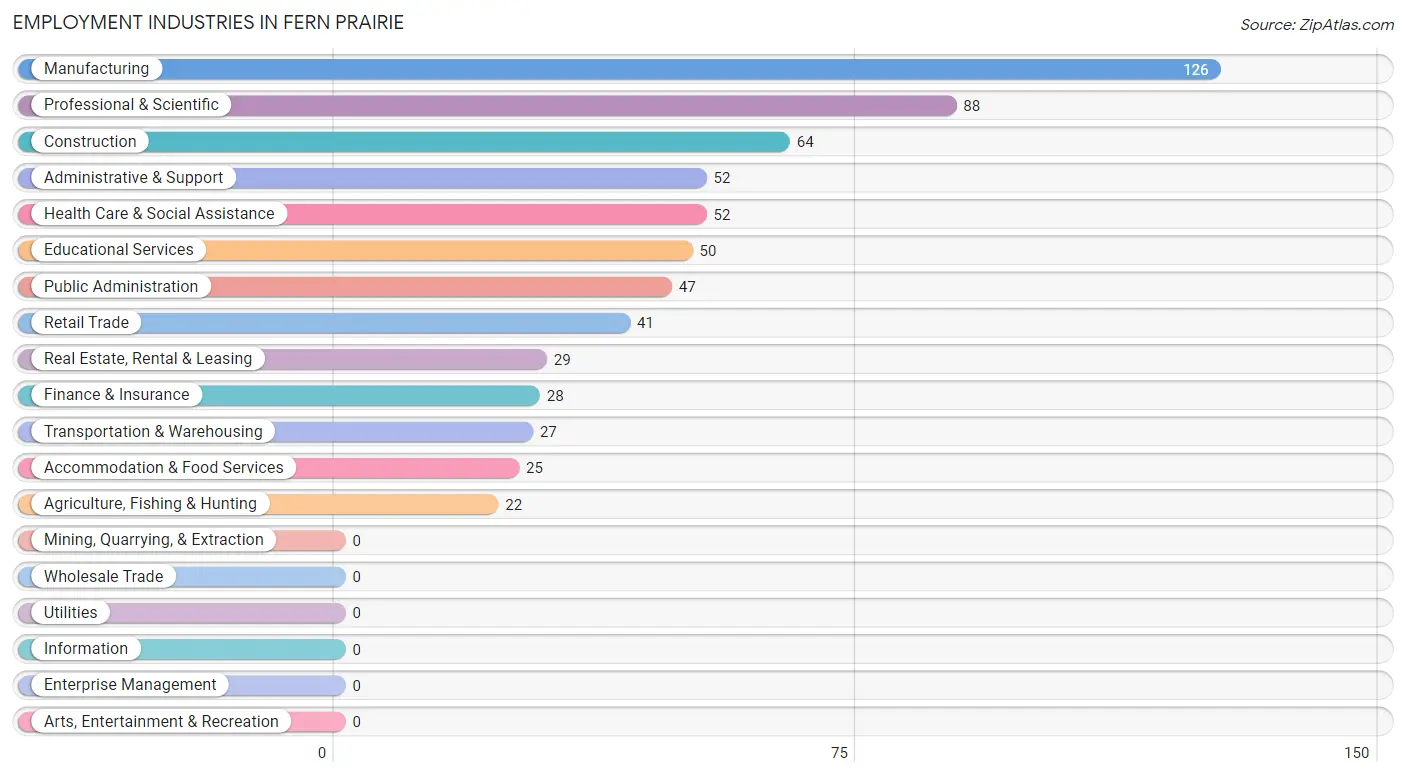
Employment Industries in Fern Prairie
The major employment industries in Fern Prairie include Manufacturing (126 | 17.5%), Professional & Scientific (88 | 12.2%), Construction (64 | 8.9%), Administrative & Support (52 | 7.2%), and Health Care & Social Assistance (52 | 7.2%).
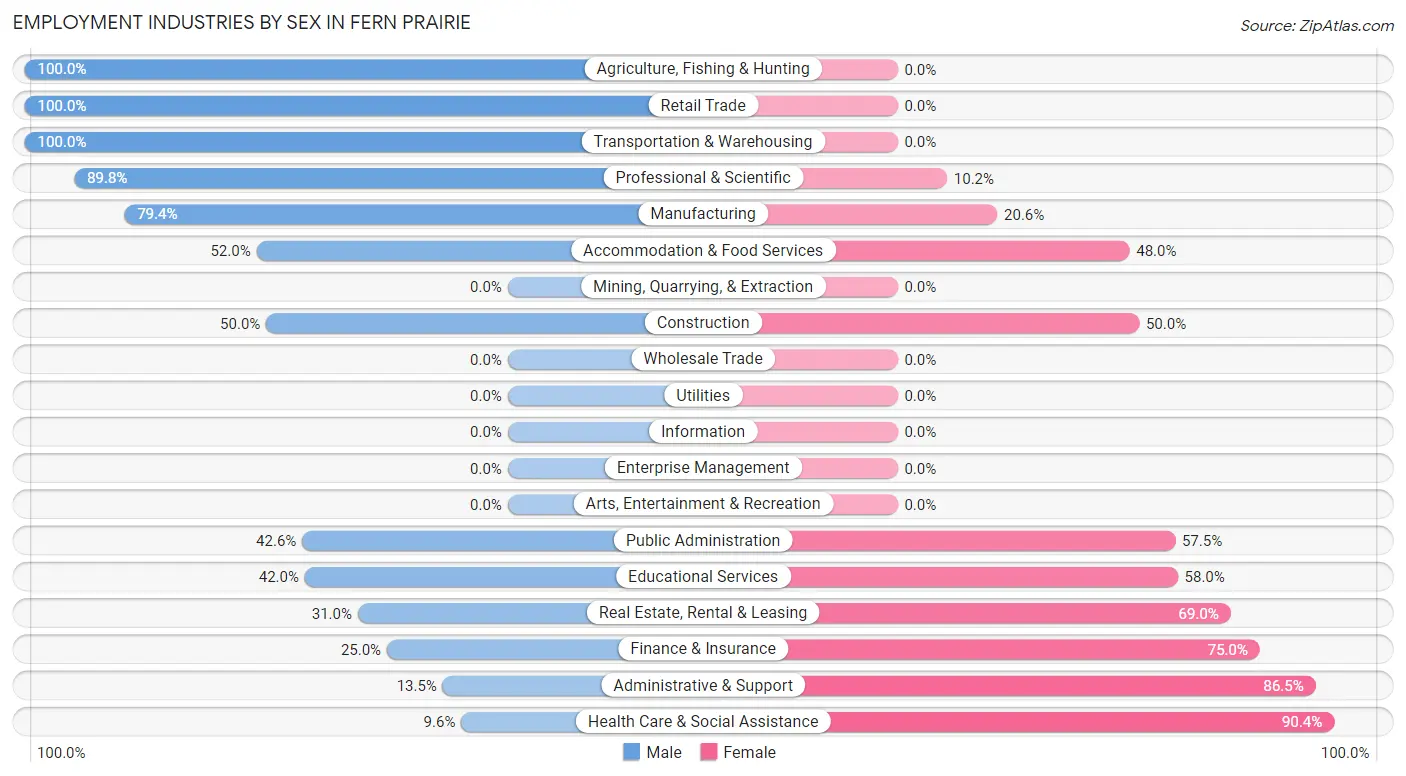
Employment Industries by Sex in Fern Prairie
The Fern Prairie industries that see more men than women are Agriculture, Fishing & Hunting (100.0%), Retail Trade (100.0%), and Transportation & Warehousing (100.0%), whereas the industries that tend to have a higher number of women are Health Care & Social Assistance (90.4%), Administrative & Support (86.5%), and Finance & Insurance (75.0%).
| Industry | Male | Female |
| Agriculture, Fishing & Hunting | 22 (100.0%) | 0 (0.0%) |
| Mining, Quarrying, & Extraction | 0 (0.0%) | 0 (0.0%) |
| Construction | 32 (50.0%) | 32 (50.0%) |
| Manufacturing | 100 (79.4%) | 26 (20.6%) |
| Wholesale Trade | 0 (0.0%) | 0 (0.0%) |
| Retail Trade | 41 (100.0%) | 0 (0.0%) |
| Transportation & Warehousing | 27 (100.0%) | 0 (0.0%) |
| Utilities | 0 (0.0%) | 0 (0.0%) |
| Information | 0 (0.0%) | 0 (0.0%) |
| Finance & Insurance | 7 (25.0%) | 21 (75.0%) |
| Real Estate, Rental & Leasing | 9 (31.0%) | 20 (69.0%) |
| Professional & Scientific | 79 (89.8%) | 9 (10.2%) |
| Enterprise Management | 0 (0.0%) | 0 (0.0%) |
| Administrative & Support | 7 (13.5%) | 45 (86.5%) |
| Educational Services | 21 (42.0%) | 29 (58.0%) |
| Health Care & Social Assistance | 5 (9.6%) | 47 (90.4%) |
| Arts, Entertainment & Recreation | 0 (0.0%) | 0 (0.0%) |
| Accommodation & Food Services | 13 (52.0%) | 12 (48.0%) |
| Public Administration | 20 (42.5%) | 27 (57.5%) |
| Total | 423 (58.8%) | 297 (41.2%) |
Education in Fern Prairie
School Enrollment in Fern Prairie
The most common levels of schooling among the 596 students in Fern Prairie are middle school (290 | 48.7%), elementary school (118 | 19.8%), and high school (101 | 17.0%).
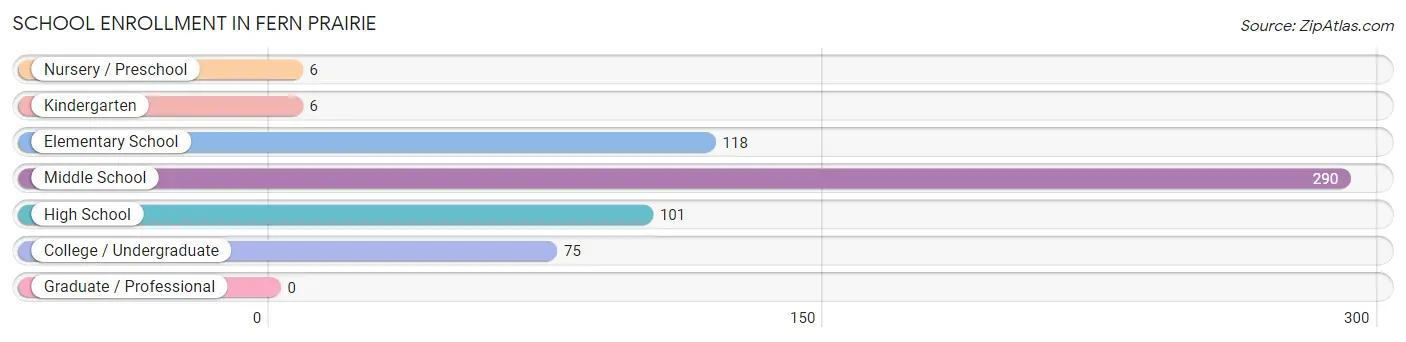
| School Level | # Students | % Students |
| Nursery / Preschool | 6 | 1.0% |
| Kindergarten | 6 | 1.0% |
| Elementary School | 118 | 19.8% |
| Middle School | 290 | 48.7% |
| High School | 101 | 17.0% |
| College / Undergraduate | 75 | 12.6% |
| Graduate / Professional | 0 | 0.0% |
| Total | 596 | 100.0% |
School Enrollment by Age by Funding Source in Fern Prairie
Out of a total of 596 students who are enrolled in schools in Fern Prairie, 32 (5.4%) attend a private institution, while the remaining 564 (94.6%) are enrolled in public schools. The age group of 3 to 4 year olds has the highest likelihood of being enrolled in private schools, with 6 (100.0% in the age bracket) enrolled. Conversely, the age group of 10 to 14 year olds has the lowest likelihood of being enrolled in a private school, with 319 (100.0% in the age bracket) attending a public institution.
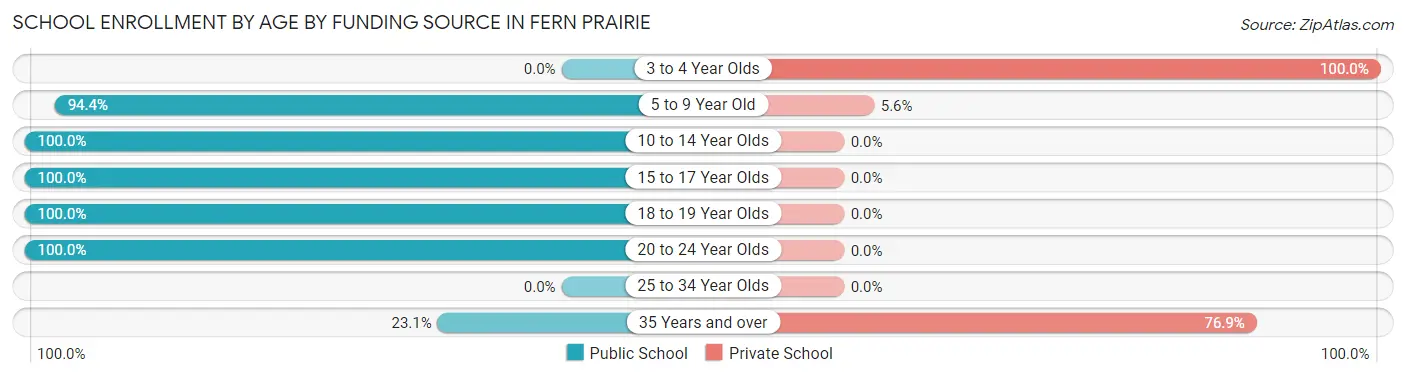
| Age Bracket | Public School | Private School |
| 3 to 4 Year Olds | 0 (0.0%) | 6 (100.0%) |
| 5 to 9 Year Old | 101 (94.4%) | 6 (5.6%) |
| 10 to 14 Year Olds | 319 (100.0%) | 0 (0.0%) |
| 15 to 17 Year Olds | 89 (100.0%) | 0 (0.0%) |
| 18 to 19 Year Olds | 10 (100.0%) | 0 (0.0%) |
| 20 to 24 Year Olds | 39 (100.0%) | 0 (0.0%) |
| 25 to 34 Year Olds | 0 (0.0%) | 0 (0.0%) |
| 35 Years and over | 6 (23.1%) | 20 (76.9%) |
| Total | 564 (94.6%) | 32 (5.4%) |
Educational Attainment by Field of Study in Fern Prairie
Business (140 | 23.8%), psychology (114 | 19.4%), literature & languages (105 | 17.9%), liberal arts & history (104 | 17.7%), and engineering (52 | 8.8%) are the most common fields of study among 588 individuals in Fern Prairie who have obtained a bachelor's degree or higher.
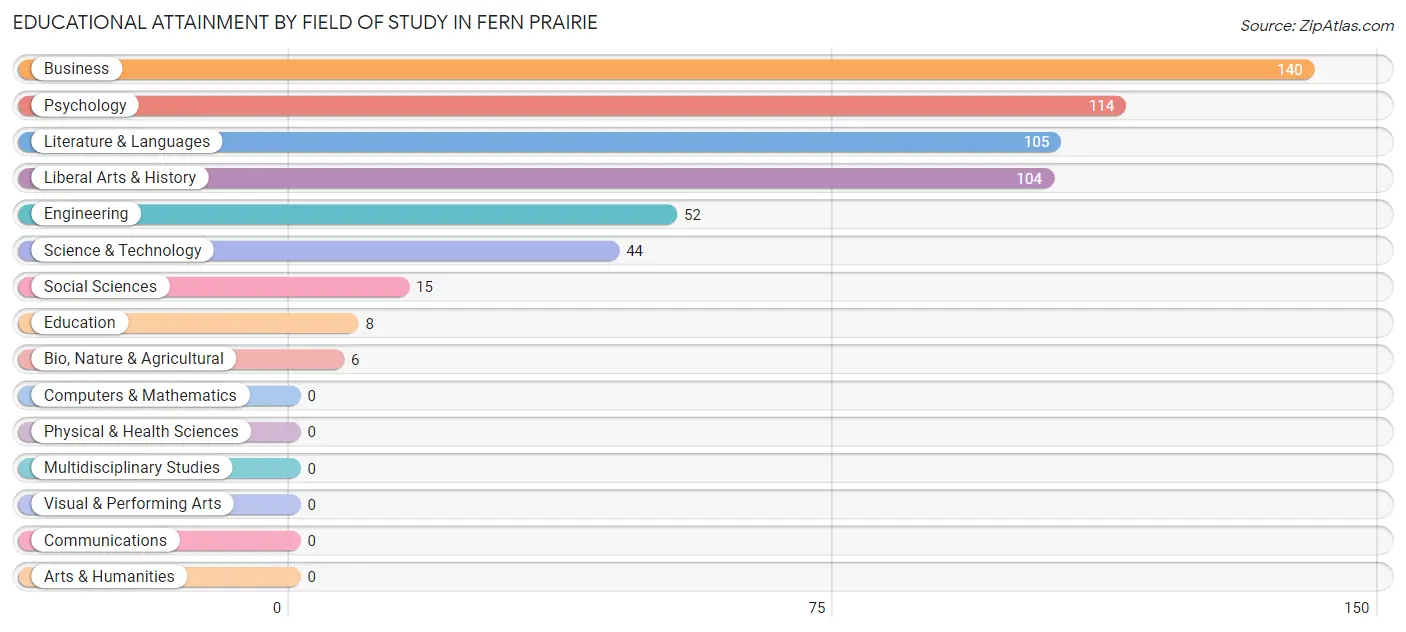
| Field of Study | # Graduates | % Graduates |
| Computers & Mathematics | 0 | 0.0% |
| Bio, Nature & Agricultural | 6 | 1.0% |
| Physical & Health Sciences | 0 | 0.0% |
| Psychology | 114 | 19.4% |
| Social Sciences | 15 | 2.5% |
| Engineering | 52 | 8.8% |
| Multidisciplinary Studies | 0 | 0.0% |
| Science & Technology | 44 | 7.5% |
| Business | 140 | 23.8% |
| Education | 8 | 1.4% |
| Literature & Languages | 105 | 17.9% |
| Liberal Arts & History | 104 | 17.7% |
| Visual & Performing Arts | 0 | 0.0% |
| Communications | 0 | 0.0% |
| Arts & Humanities | 0 | 0.0% |
| Total | 588 | 100.0% |
Transportation & Commute in Fern Prairie
Vehicle Availability by Sex in Fern Prairie
The most prevalent vehicle ownership categories in Fern Prairie are males with 4 vehicles (112, accounting for 26.5%) and females with 4 vehicles (92, making up 38.9%).
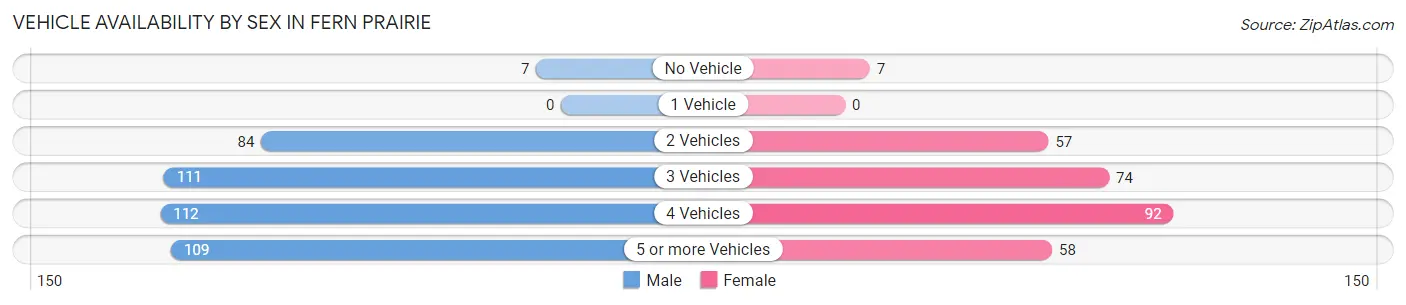
| Vehicles Available | Male | Female |
| No Vehicle | 7 (1.7%) | 7 (2.4%) |
| 1 Vehicle | 0 (0.0%) | 0 (0.0%) |
| 2 Vehicles | 84 (19.9%) | 57 (19.8%) |
| 3 Vehicles | 111 (26.2%) | 74 (25.7%) |
| 4 Vehicles | 112 (26.5%) | 92 (31.9%) |
| 5 or more Vehicles | 109 (25.8%) | 58 (20.1%) |
| Total | 423 (100.0%) | 288 (100.0%) |
Commute Time in Fern Prairie
The most frequently occuring commute durations in Fern Prairie are 30 to 34 minutes (110 commuters, 20.0%), 20 to 24 minutes (90 commuters, 16.4%), and 25 to 29 minutes (80 commuters, 14.6%).
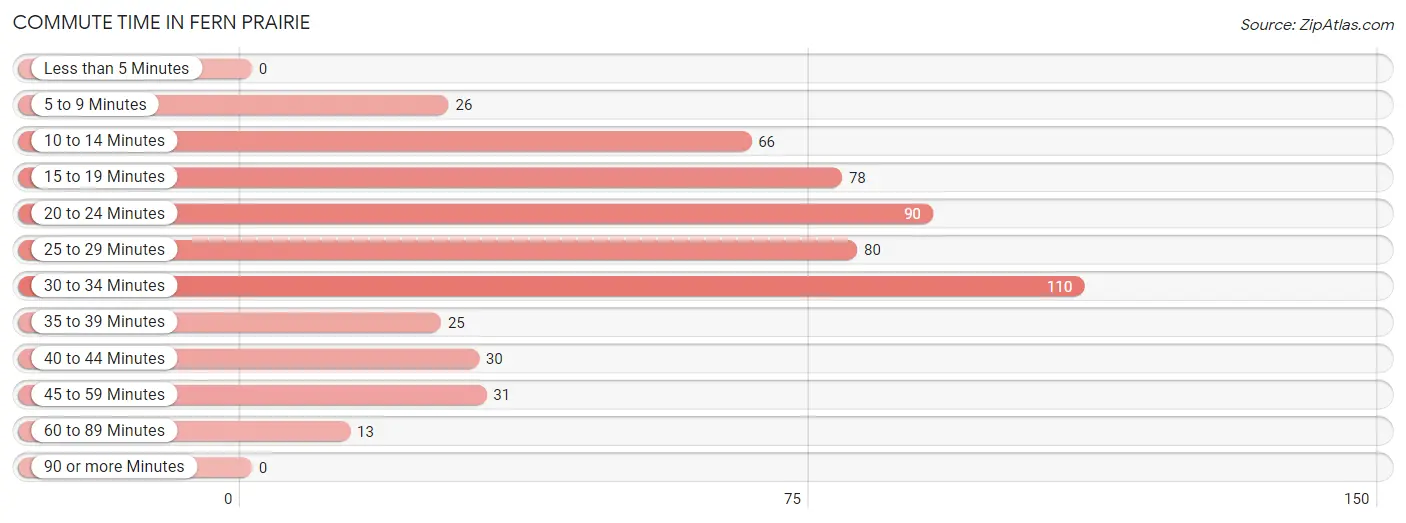
| Commute Time | # Commuters | % Commuters |
| Less than 5 Minutes | 0 | 0.0% |
| 5 to 9 Minutes | 26 | 4.7% |
| 10 to 14 Minutes | 66 | 12.0% |
| 15 to 19 Minutes | 78 | 14.2% |
| 20 to 24 Minutes | 90 | 16.4% |
| 25 to 29 Minutes | 80 | 14.6% |
| 30 to 34 Minutes | 110 | 20.0% |
| 35 to 39 Minutes | 25 | 4.5% |
| 40 to 44 Minutes | 30 | 5.5% |
| 45 to 59 Minutes | 31 | 5.7% |
| 60 to 89 Minutes | 13 | 2.4% |
| 90 or more Minutes | 0 | 0.0% |
Commute Time by Sex in Fern Prairie
The most common commute times in Fern Prairie are 30 to 34 minutes (110 commuters, 30.8%) for males and 25 to 29 minutes (52 commuters, 27.1%) for females.
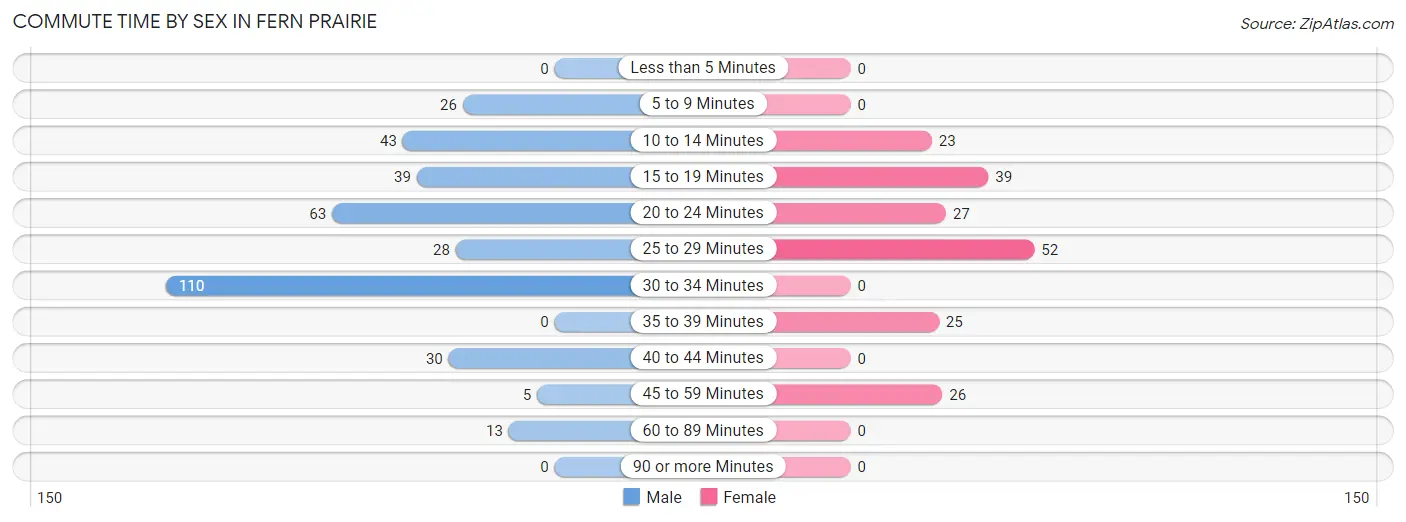
| Commute Time | Male | Female |
| Less than 5 Minutes | 0 (0.0%) | 0 (0.0%) |
| 5 to 9 Minutes | 26 (7.3%) | 0 (0.0%) |
| 10 to 14 Minutes | 43 (12.0%) | 23 (12.0%) |
| 15 to 19 Minutes | 39 (10.9%) | 39 (20.3%) |
| 20 to 24 Minutes | 63 (17.6%) | 27 (14.1%) |
| 25 to 29 Minutes | 28 (7.8%) | 52 (27.1%) |
| 30 to 34 Minutes | 110 (30.8%) | 0 (0.0%) |
| 35 to 39 Minutes | 0 (0.0%) | 25 (13.0%) |
| 40 to 44 Minutes | 30 (8.4%) | 0 (0.0%) |
| 45 to 59 Minutes | 5 (1.4%) | 26 (13.5%) |
| 60 to 89 Minutes | 13 (3.6%) | 0 (0.0%) |
| 90 or more Minutes | 0 (0.0%) | 0 (0.0%) |
Time of Departure to Work by Sex in Fern Prairie
The most frequent times of departure to work in Fern Prairie are 5:30 AM to 5:59 AM (61, 17.1%) for males and 6:30 AM to 6:59 AM (46, 24.0%) for females.
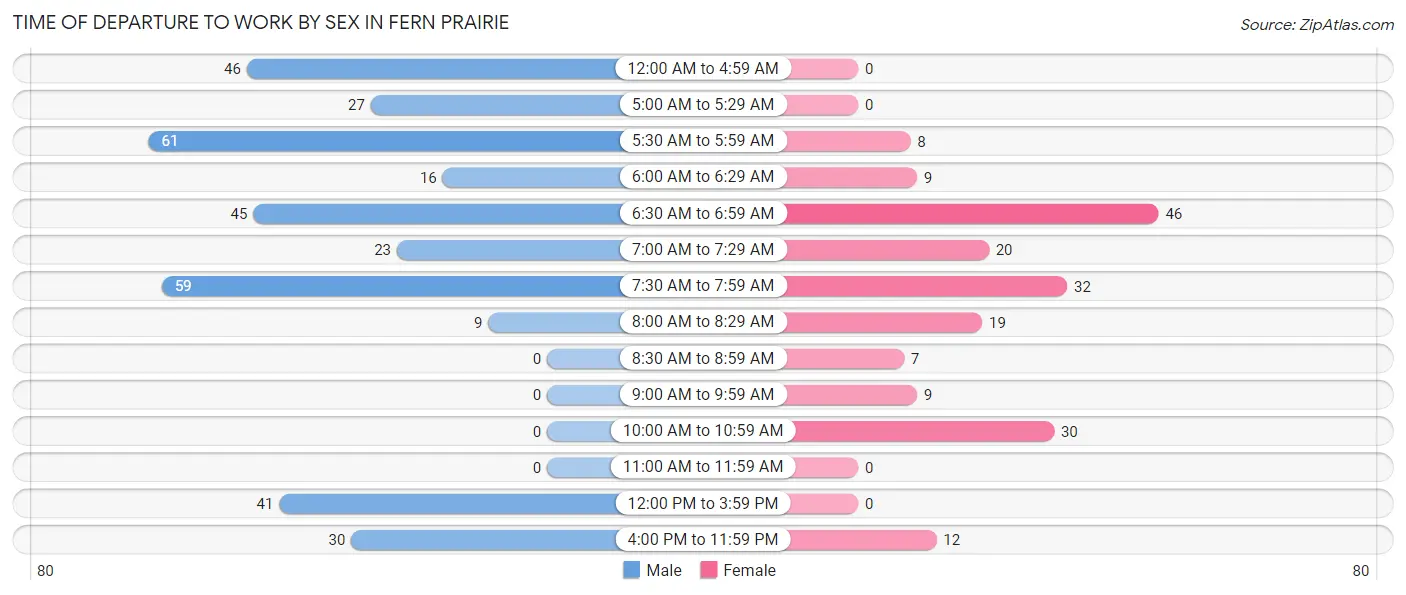
| Time of Departure | Male | Female |
| 12:00 AM to 4:59 AM | 46 (12.9%) | 0 (0.0%) |
| 5:00 AM to 5:29 AM | 27 (7.6%) | 0 (0.0%) |
| 5:30 AM to 5:59 AM | 61 (17.1%) | 8 (4.2%) |
| 6:00 AM to 6:29 AM | 16 (4.5%) | 9 (4.7%) |
| 6:30 AM to 6:59 AM | 45 (12.6%) | 46 (24.0%) |
| 7:00 AM to 7:29 AM | 23 (6.4%) | 20 (10.4%) |
| 7:30 AM to 7:59 AM | 59 (16.5%) | 32 (16.7%) |
| 8:00 AM to 8:29 AM | 9 (2.5%) | 19 (9.9%) |
| 8:30 AM to 8:59 AM | 0 (0.0%) | 7 (3.6%) |
| 9:00 AM to 9:59 AM | 0 (0.0%) | 9 (4.7%) |
| 10:00 AM to 10:59 AM | 0 (0.0%) | 30 (15.6%) |
| 11:00 AM to 11:59 AM | 0 (0.0%) | 0 (0.0%) |
| 12:00 PM to 3:59 PM | 41 (11.5%) | 0 (0.0%) |
| 4:00 PM to 11:59 PM | 30 (8.4%) | 12 (6.2%) |
| Total | 357 (100.0%) | 192 (100.0%) |
Housing Occupancy in Fern Prairie
Occupancy by Ownership in Fern Prairie
Of the total 679 dwellings in Fern Prairie, owner-occupied units account for 584 (86.0%), while renter-occupied units make up 95 (14.0%).
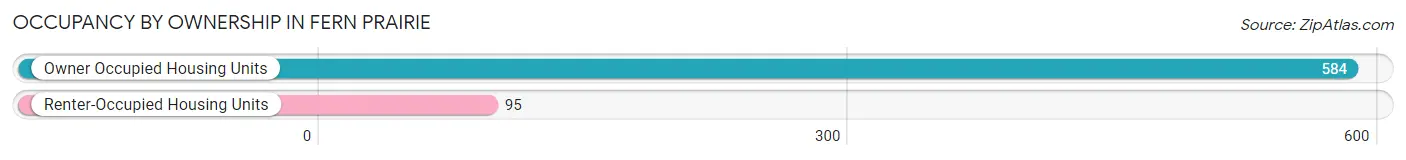
| Occupancy | # Housing Units | % Housing Units |
| Owner Occupied Housing Units | 584 | 86.0% |
| Renter-Occupied Housing Units | 95 | 14.0% |
| Total Occupied Housing Units | 679 | 100.0% |
Occupancy by Household Size in Fern Prairie
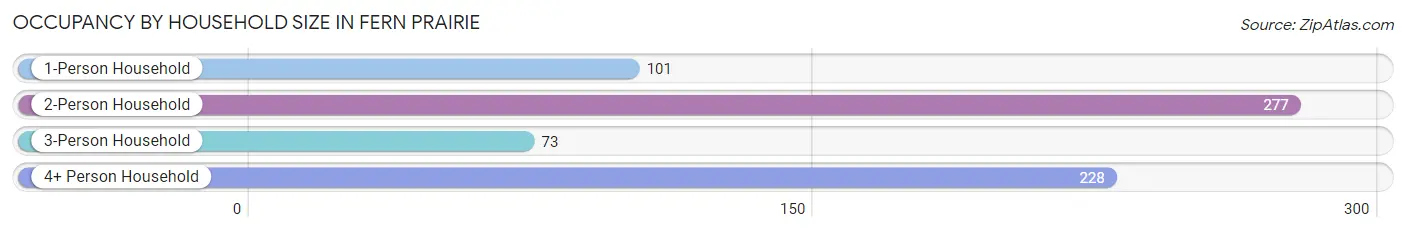
| Household Size | # Housing Units | % Housing Units |
| 1-Person Household | 101 | 14.9% |
| 2-Person Household | 277 | 40.8% |
| 3-Person Household | 73 | 10.7% |
| 4+ Person Household | 228 | 33.6% |
| Total Housing Units | 679 | 100.0% |
Occupancy by Ownership by Household Size in Fern Prairie
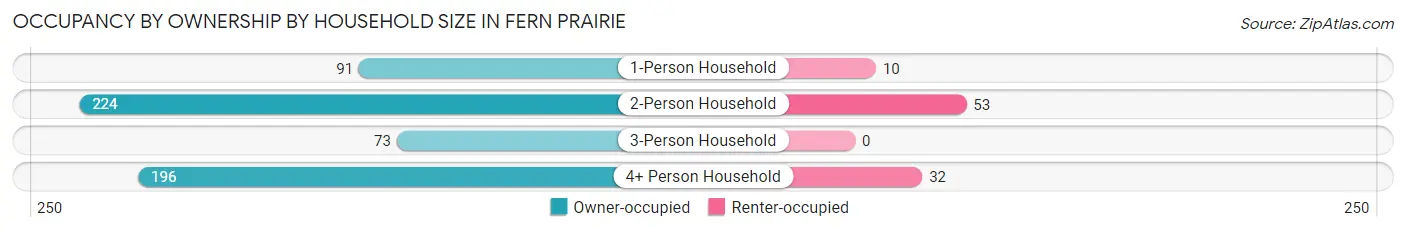
| Household Size | Owner-occupied | Renter-occupied |
| 1-Person Household | 91 (90.1%) | 10 (9.9%) |
| 2-Person Household | 224 (80.9%) | 53 (19.1%) |
| 3-Person Household | 73 (100.0%) | 0 (0.0%) |
| 4+ Person Household | 196 (86.0%) | 32 (14.0%) |
| Total Housing Units | 584 (86.0%) | 95 (14.0%) |
Occupancy by Educational Attainment in Fern Prairie
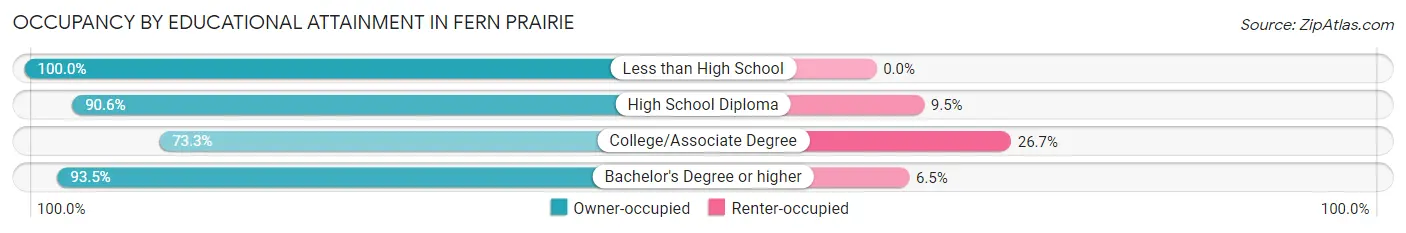
| Household Size | Owner-occupied | Renter-occupied |
| Less than High School | 9 (100.0%) | 0 (0.0%) |
| High School Diploma | 115 (90.5%) | 12 (9.5%) |
| College/Associate Degree | 173 (73.3%) | 63 (26.7%) |
| Bachelor's Degree or higher | 287 (93.5%) | 20 (6.5%) |
Occupancy by Age of Householder in Fern Prairie
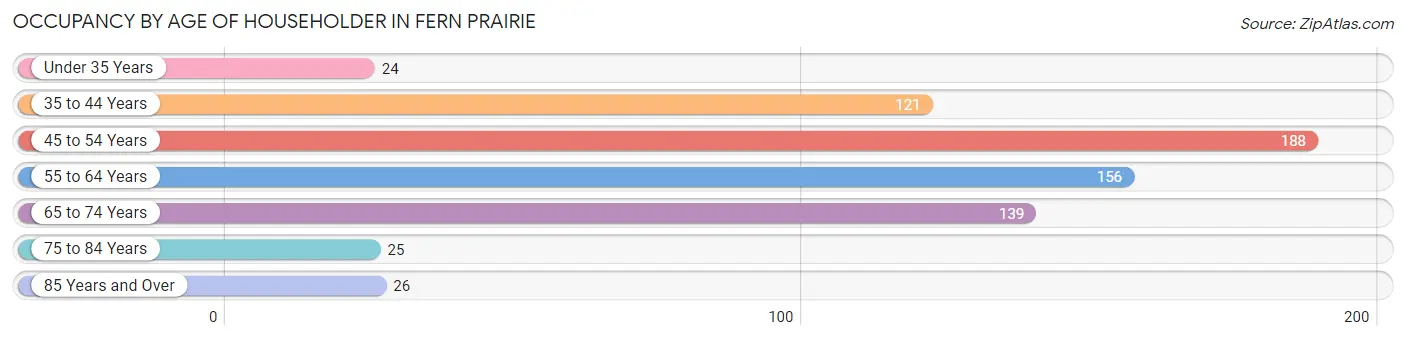
| Age Bracket | # Households | % Households |
| Under 35 Years | 24 | 3.5% |
| 35 to 44 Years | 121 | 17.8% |
| 45 to 54 Years | 188 | 27.7% |
| 55 to 64 Years | 156 | 23.0% |
| 65 to 74 Years | 139 | 20.5% |
| 75 to 84 Years | 25 | 3.7% |
| 85 Years and Over | 26 | 3.8% |
| Total | 679 | 100.0% |
Housing Finances in Fern Prairie
Median Income by Occupancy in Fern Prairie
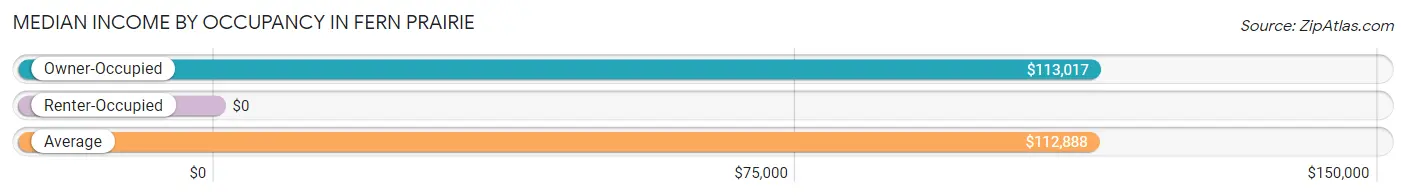
| Occupancy Type | # Households | Median Income |
| Owner-Occupied | 584 (86.0%) | $113,017 |
| Renter-Occupied | 95 (14.0%) | $0 |
| Average | 679 (100.0%) | $112,888 |
Occupancy by Householder Income Bracket in Fern Prairie
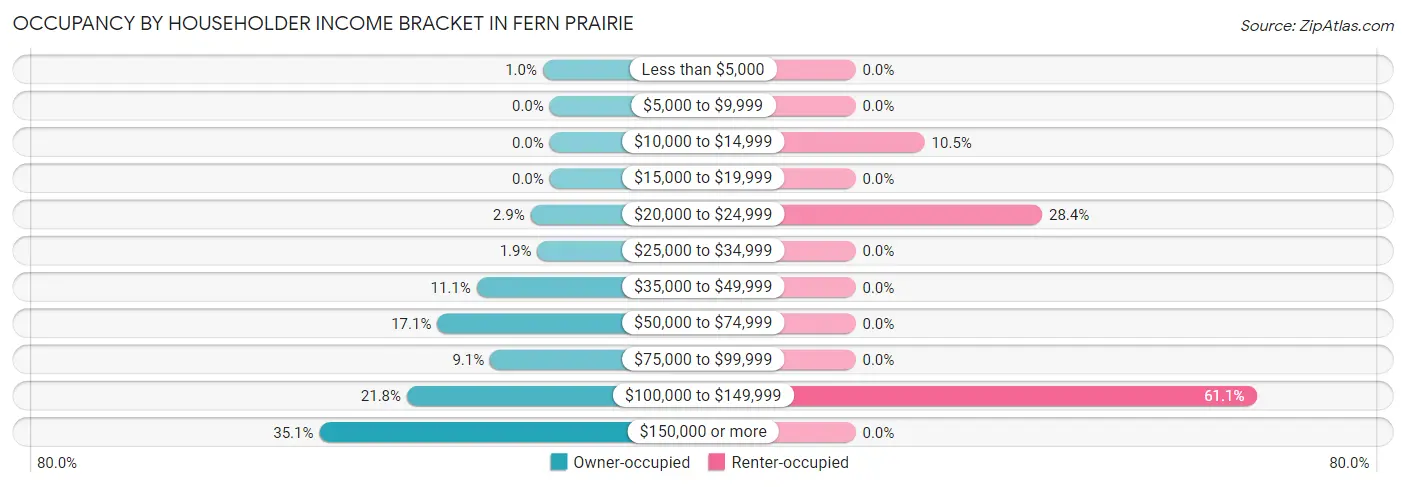
| Income Bracket | Owner-occupied | Renter-occupied |
| Less than $5,000 | 6 (1.0%) | 0 (0.0%) |
| $5,000 to $9,999 | 0 (0.0%) | 0 (0.0%) |
| $10,000 to $14,999 | 0 (0.0%) | 10 (10.5%) |
| $15,000 to $19,999 | 0 (0.0%) | 0 (0.0%) |
| $20,000 to $24,999 | 17 (2.9%) | 27 (28.4%) |
| $25,000 to $34,999 | 11 (1.9%) | 0 (0.0%) |
| $35,000 to $49,999 | 65 (11.1%) | 0 (0.0%) |
| $50,000 to $74,999 | 100 (17.1%) | 0 (0.0%) |
| $75,000 to $99,999 | 53 (9.1%) | 0 (0.0%) |
| $100,000 to $149,999 | 127 (21.7%) | 58 (61.1%) |
| $150,000 or more | 205 (35.1%) | 0 (0.0%) |
| Total | 584 (100.0%) | 95 (100.0%) |
Monthly Housing Cost Tiers in Fern Prairie
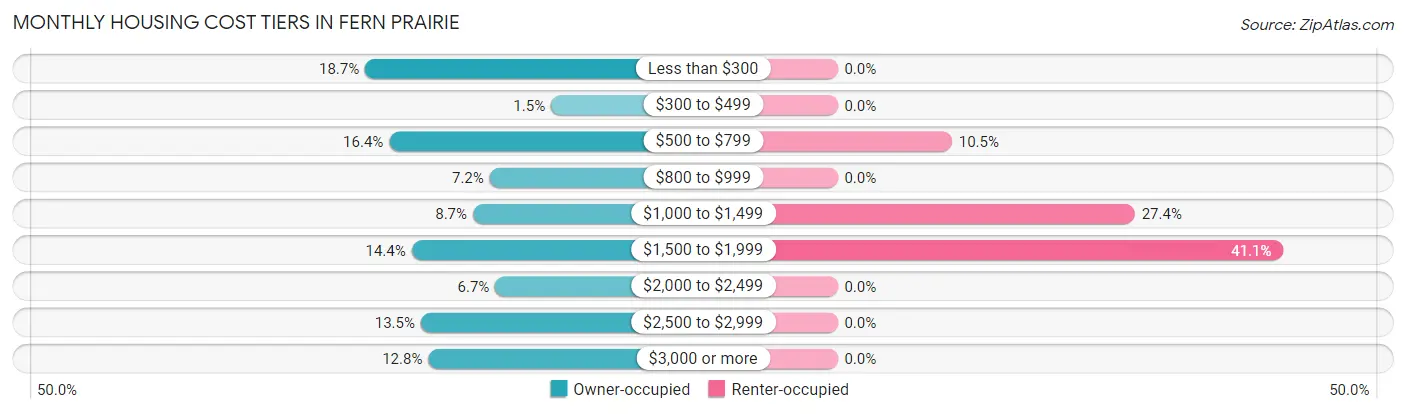
| Monthly Cost | Owner-occupied | Renter-occupied |
| Less than $300 | 109 (18.7%) | 0 (0.0%) |
| $300 to $499 | 9 (1.5%) | 0 (0.0%) |
| $500 to $799 | 96 (16.4%) | 10 (10.5%) |
| $800 to $999 | 42 (7.2%) | 0 (0.0%) |
| $1,000 to $1,499 | 51 (8.7%) | 26 (27.4%) |
| $1,500 to $1,999 | 84 (14.4%) | 39 (41.0%) |
| $2,000 to $2,499 | 39 (6.7%) | 0 (0.0%) |
| $2,500 to $2,999 | 79 (13.5%) | 0 (0.0%) |
| $3,000 or more | 75 (12.8%) | 0 (0.0%) |
| Total | 584 (100.0%) | 95 (100.0%) |
Physical Housing Characteristics in Fern Prairie
Housing Structures in Fern Prairie
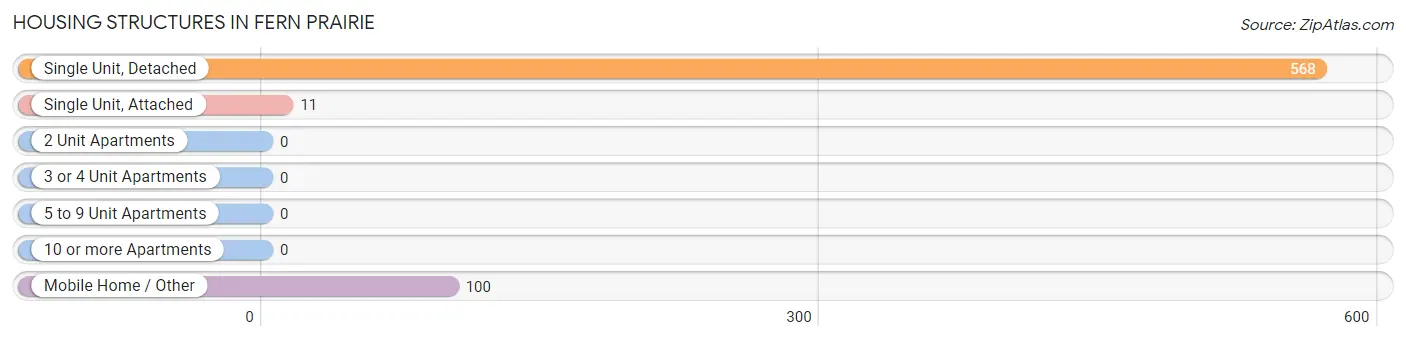
| Structure Type | # Housing Units | % Housing Units |
| Single Unit, Detached | 568 | 83.7% |
| Single Unit, Attached | 11 | 1.6% |
| 2 Unit Apartments | 0 | 0.0% |
| 3 or 4 Unit Apartments | 0 | 0.0% |
| 5 to 9 Unit Apartments | 0 | 0.0% |
| 10 or more Apartments | 0 | 0.0% |
| Mobile Home / Other | 100 | 14.7% |
| Total | 679 | 100.0% |
Housing Structures by Occupancy in Fern Prairie
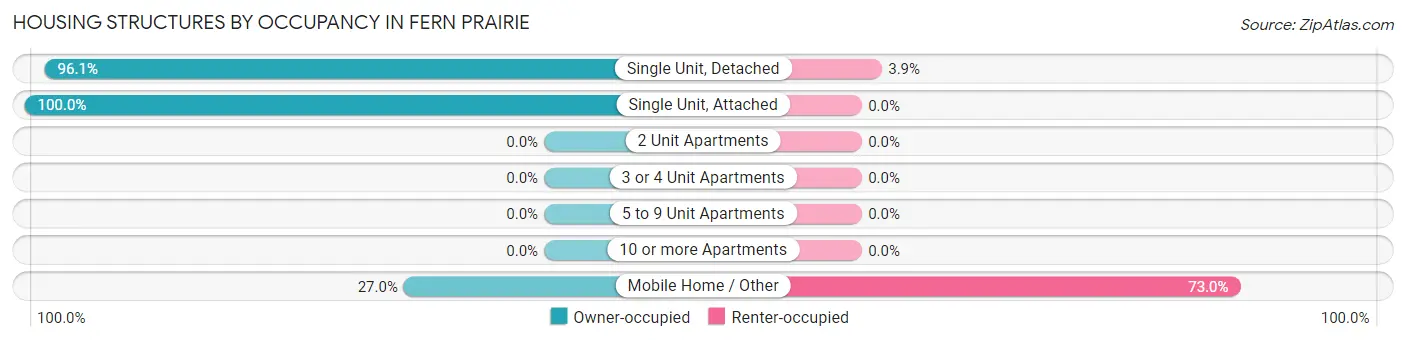
| Structure Type | Owner-occupied | Renter-occupied |
| Single Unit, Detached | 546 (96.1%) | 22 (3.9%) |
| Single Unit, Attached | 11 (100.0%) | 0 (0.0%) |
| 2 Unit Apartments | 0 (0.0%) | 0 (0.0%) |
| 3 or 4 Unit Apartments | 0 (0.0%) | 0 (0.0%) |
| 5 to 9 Unit Apartments | 0 (0.0%) | 0 (0.0%) |
| 10 or more Apartments | 0 (0.0%) | 0 (0.0%) |
| Mobile Home / Other | 27 (27.0%) | 73 (73.0%) |
| Total | 584 (86.0%) | 95 (14.0%) |
Housing Structures by Number of Rooms in Fern Prairie
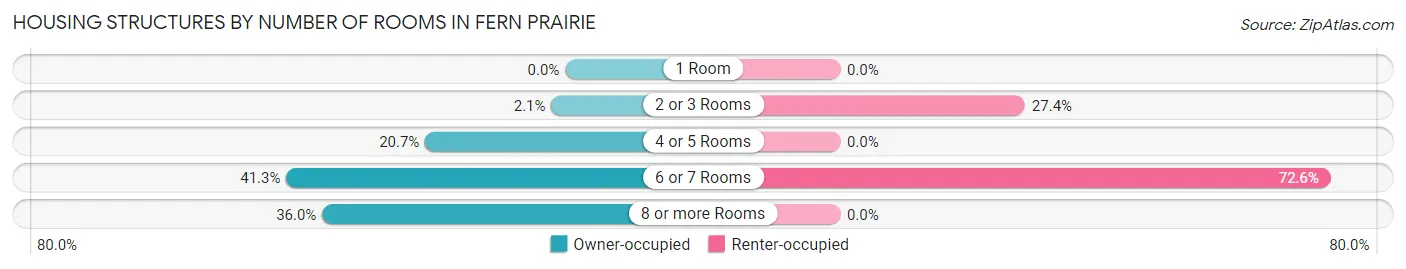
| Number of Rooms | Owner-occupied | Renter-occupied |
| 1 Room | 0 (0.0%) | 0 (0.0%) |
| 2 or 3 Rooms | 12 (2.1%) | 26 (27.4%) |
| 4 or 5 Rooms | 121 (20.7%) | 0 (0.0%) |
| 6 or 7 Rooms | 241 (41.3%) | 69 (72.6%) |
| 8 or more Rooms | 210 (36.0%) | 0 (0.0%) |
| Total | 584 (100.0%) | 95 (100.0%) |
Housing Structure by Heating Type in Fern Prairie
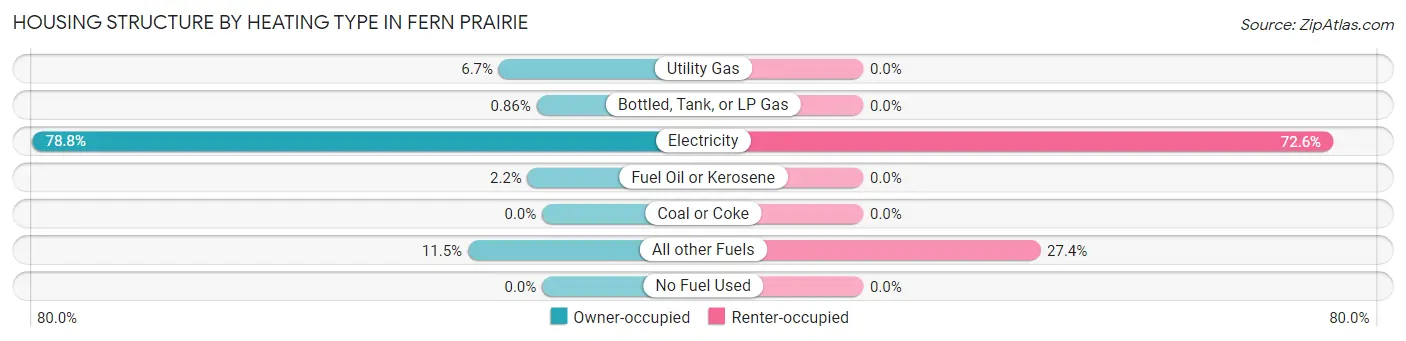
| Heating Type | Owner-occupied | Renter-occupied |
| Utility Gas | 39 (6.7%) | 0 (0.0%) |
| Bottled, Tank, or LP Gas | 5 (0.9%) | 0 (0.0%) |
| Electricity | 460 (78.8%) | 69 (72.6%) |
| Fuel Oil or Kerosene | 13 (2.2%) | 0 (0.0%) |
| Coal or Coke | 0 (0.0%) | 0 (0.0%) |
| All other Fuels | 67 (11.5%) | 26 (27.4%) |
| No Fuel Used | 0 (0.0%) | 0 (0.0%) |
| Total | 584 (100.0%) | 95 (100.0%) |
Household Vehicle Usage in Fern Prairie
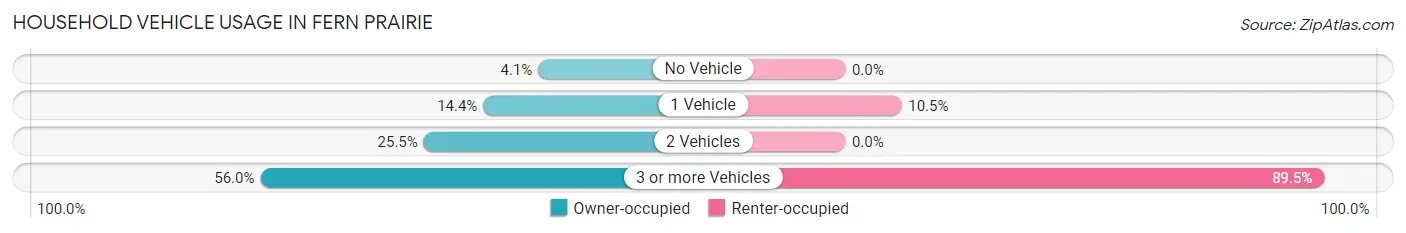
| Vehicles per Household | Owner-occupied | Renter-occupied |
| No Vehicle | 24 (4.1%) | 0 (0.0%) |
| 1 Vehicle | 84 (14.4%) | 10 (10.5%) |
| 2 Vehicles | 149 (25.5%) | 0 (0.0%) |
| 3 or more Vehicles | 327 (56.0%) | 85 (89.5%) |
| Total | 584 (100.0%) | 95 (100.0%) |
Real Estate & Mortgages in Fern Prairie
Real Estate and Mortgage Overview in Fern Prairie
| Characteristic | Without Mortgage | With Mortgage |
| Housing Units | 265 | 319 |
| Median Property Value | $350,000 | $612,300 |
| Median Household Income | $54,531 | $157 |
| Monthly Housing Costs | $623 | $75 |
| Real Estate Taxes | - | - |
Property Value by Mortgage Status in Fern Prairie
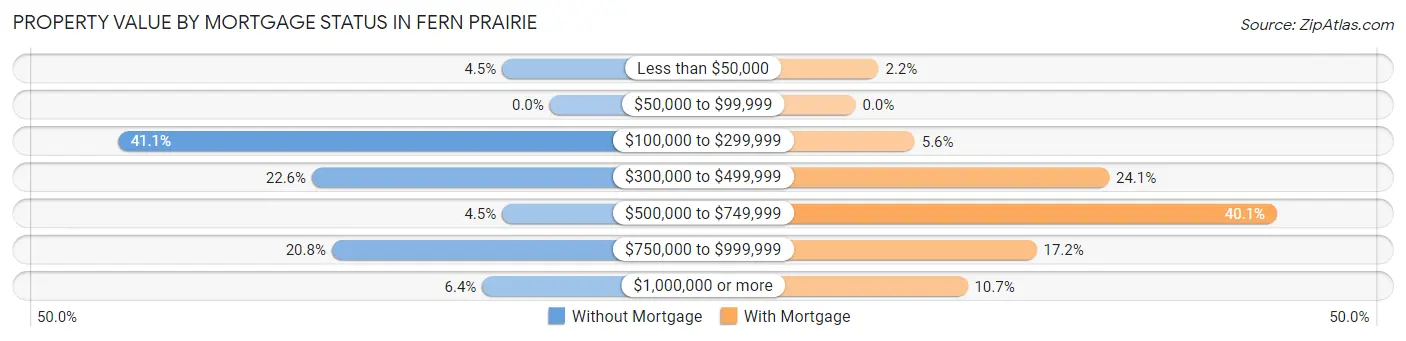
| Property Value | Without Mortgage | With Mortgage |
| Less than $50,000 | 12 (4.5%) | 7 (2.2%) |
| $50,000 to $99,999 | 0 (0.0%) | 0 (0.0%) |
| $100,000 to $299,999 | 109 (41.1%) | 18 (5.6%) |
| $300,000 to $499,999 | 60 (22.6%) | 77 (24.1%) |
| $500,000 to $749,999 | 12 (4.5%) | 128 (40.1%) |
| $750,000 to $999,999 | 55 (20.7%) | 55 (17.2%) |
| $1,000,000 or more | 17 (6.4%) | 34 (10.7%) |
| Total | 265 (100.0%) | 319 (100.0%) |
Household Income by Mortgage Status in Fern Prairie
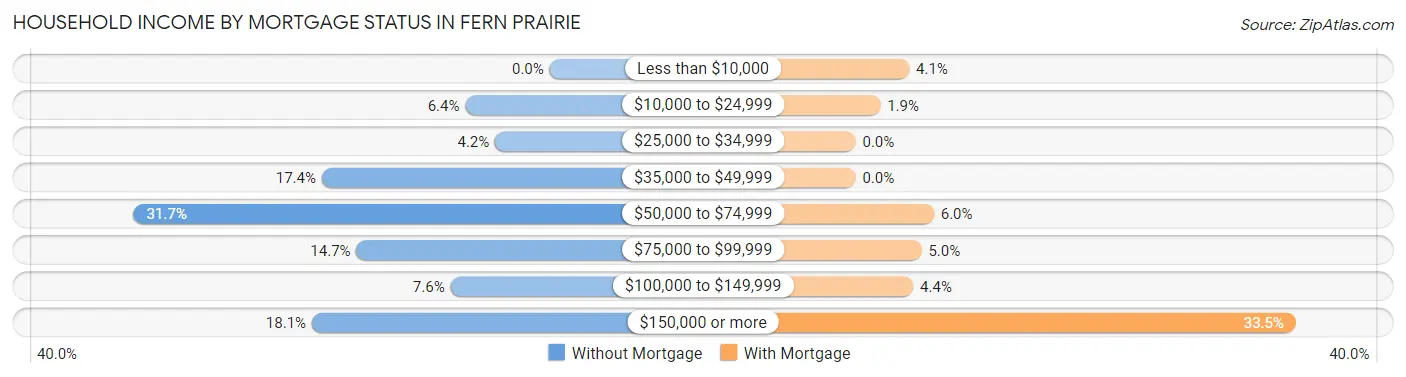
| Household Income | Without Mortgage | With Mortgage |
| Less than $10,000 | 0 (0.0%) | 13 (4.1%) |
| $10,000 to $24,999 | 17 (6.4%) | 6 (1.9%) |
| $25,000 to $34,999 | 11 (4.2%) | 0 (0.0%) |
| $35,000 to $49,999 | 46 (17.4%) | 0 (0.0%) |
| $50,000 to $74,999 | 84 (31.7%) | 19 (6.0%) |
| $75,000 to $99,999 | 39 (14.7%) | 16 (5.0%) |
| $100,000 to $149,999 | 20 (7.5%) | 14 (4.4%) |
| $150,000 or more | 48 (18.1%) | 107 (33.5%) |
| Total | 265 (100.0%) | 319 (100.0%) |
Property Value to Household Income Ratio in Fern Prairie
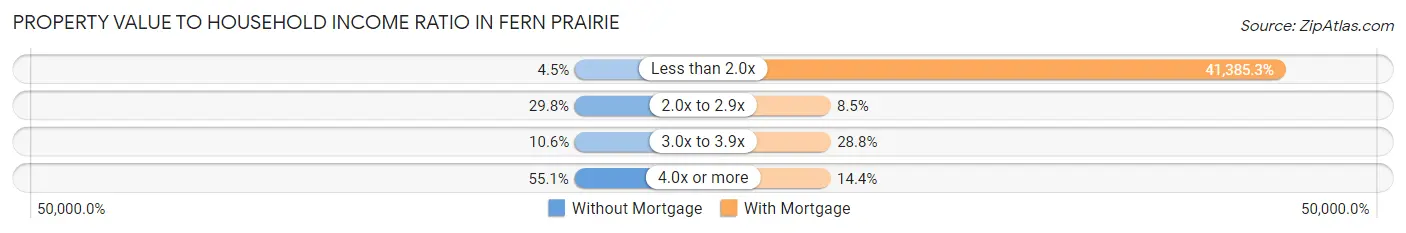
| Value-to-Income Ratio | Without Mortgage | With Mortgage |
| Less than 2.0x | 12 (4.5%) | 132,019 (41,385.3%) |
| 2.0x to 2.9x | 79 (29.8%) | 27 (8.5%) |
| 3.0x to 3.9x | 28 (10.6%) | 92 (28.8%) |
| 4.0x or more | 146 (55.1%) | 46 (14.4%) |
| Total | 265 (100.0%) | 319 (100.0%) |
Real Estate Taxes by Mortgage Status in Fern Prairie
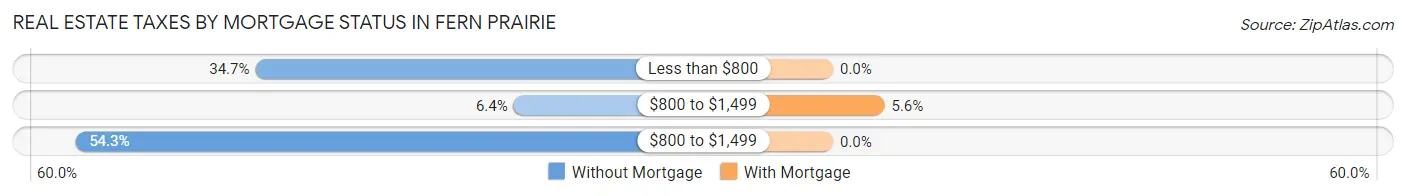
| Property Taxes | Without Mortgage | With Mortgage |
| Less than $800 | 92 (34.7%) | 0 (0.0%) |
| $800 to $1,499 | 17 (6.4%) | 18 (5.6%) |
| $800 to $1,499 | 144 (54.3%) | 0 (0.0%) |
| Total | 265 (100.0%) | 319 (100.0%) |
Health & Disability in Fern Prairie
Health Insurance Coverage by Age in Fern Prairie
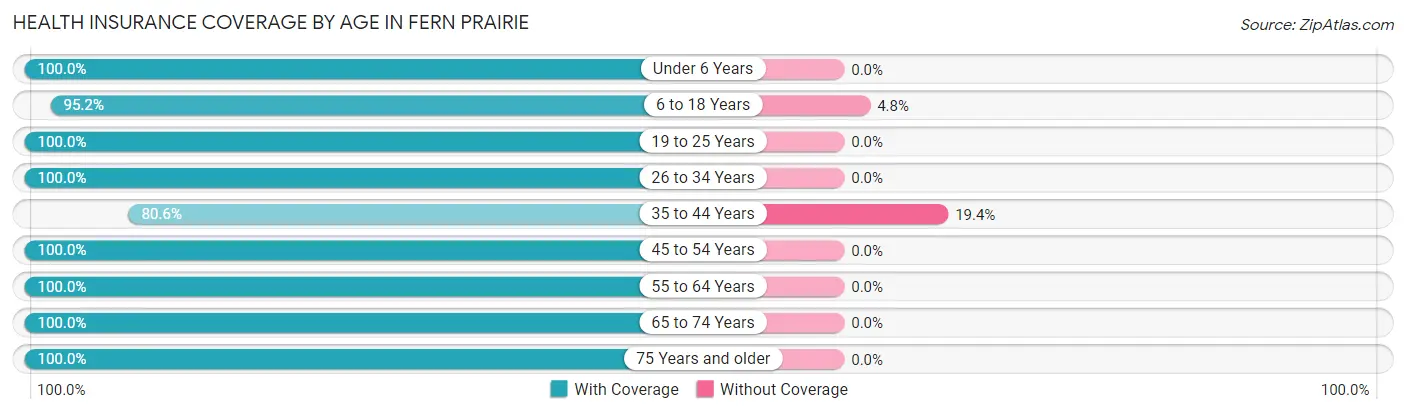
| Age Bracket | With Coverage | Without Coverage |
| Under 6 Years | 6 (100.0%) | 0 (0.0%) |
| 6 to 18 Years | 511 (95.2%) | 26 (4.8%) |
| 19 to 25 Years | 103 (100.0%) | 0 (0.0%) |
| 26 to 34 Years | 88 (100.0%) | 0 (0.0%) |
| 35 to 44 Years | 183 (80.6%) | 44 (19.4%) |
| 45 to 54 Years | 426 (100.0%) | 0 (0.0%) |
| 55 to 64 Years | 273 (100.0%) | 0 (0.0%) |
| 65 to 74 Years | 190 (100.0%) | 0 (0.0%) |
| 75 Years and older | 96 (100.0%) | 0 (0.0%) |
| Total | 1,876 (96.4%) | 70 (3.6%) |
Health Insurance Coverage by Citizenship Status in Fern Prairie
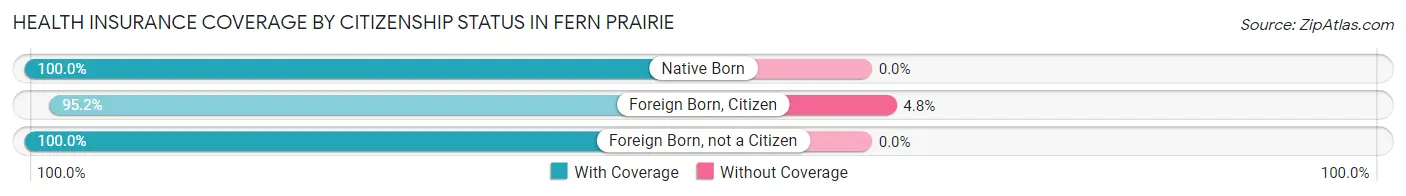
| Citizenship Status | With Coverage | Without Coverage |
| Native Born | 6 (100.0%) | 0 (0.0%) |
| Foreign Born, Citizen | 511 (95.2%) | 26 (4.8%) |
| Foreign Born, not a Citizen | 103 (100.0%) | 0 (0.0%) |
Health Insurance Coverage by Household Income in Fern Prairie
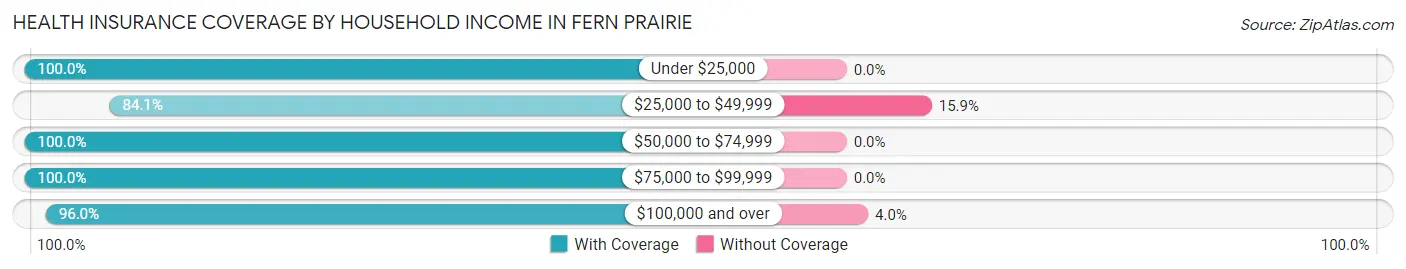
| Household Income | With Coverage | Without Coverage |
| Under $25,000 | 96 (100.0%) | 0 (0.0%) |
| $25,000 to $49,999 | 95 (84.1%) | 18 (15.9%) |
| $50,000 to $74,999 | 320 (100.0%) | 0 (0.0%) |
| $75,000 to $99,999 | 109 (100.0%) | 0 (0.0%) |
| $100,000 and over | 1,250 (96.0%) | 52 (4.0%) |
Public vs Private Health Insurance Coverage by Age in Fern Prairie
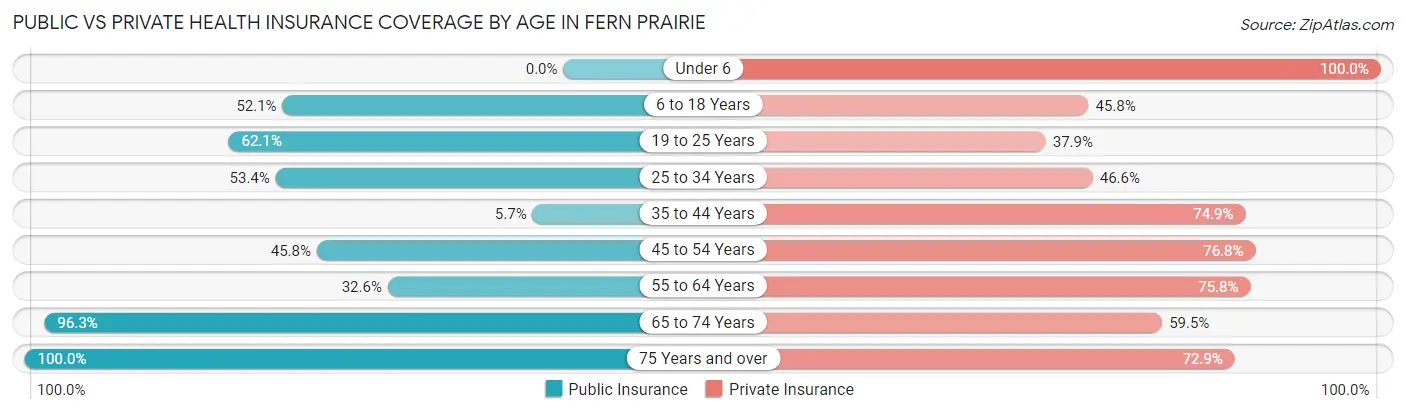
| Age Bracket | Public Insurance | Private Insurance |
| Under 6 | 0 (0.0%) | 6 (100.0%) |
| 6 to 18 Years | 280 (52.1%) | 246 (45.8%) |
| 19 to 25 Years | 64 (62.1%) | 39 (37.9%) |
| 25 to 34 Years | 47 (53.4%) | 41 (46.6%) |
| 35 to 44 Years | 13 (5.7%) | 170 (74.9%) |
| 45 to 54 Years | 195 (45.8%) | 327 (76.8%) |
| 55 to 64 Years | 89 (32.6%) | 207 (75.8%) |
| 65 to 74 Years | 183 (96.3%) | 113 (59.5%) |
| 75 Years and over | 96 (100.0%) | 70 (72.9%) |
| Total | 967 (49.7%) | 1,219 (62.6%) |
Disability Status by Sex by Age in Fern Prairie
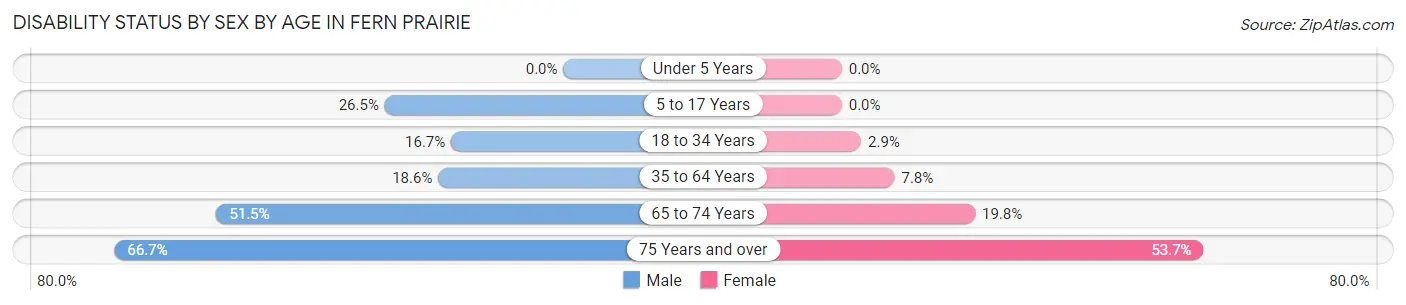
| Age Bracket | Male | Female |
| Under 5 Years | 0 (0.0%) | 0 (0.0%) |
| 5 to 17 Years | 70 (26.5%) | 0 (0.0%) |
| 18 to 34 Years | 16 (16.7%) | 3 (2.9%) |
| 35 to 64 Years | 89 (18.6%) | 35 (7.8%) |
| 65 to 74 Years | 51 (51.5%) | 18 (19.8%) |
| 75 Years and over | 28 (66.7%) | 29 (53.7%) |
Disability Class by Sex by Age in Fern Prairie
Disability Class: Hearing Difficulty
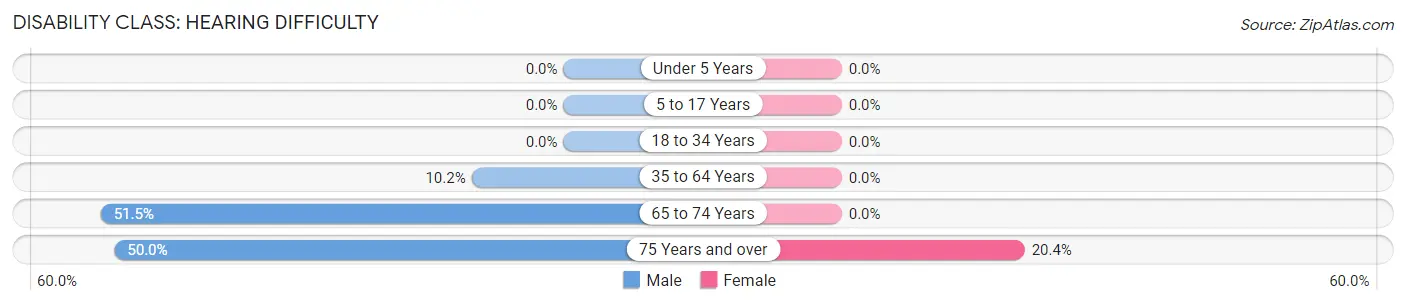
| Age Bracket | Male | Female |
| Under 5 Years | 0 (0.0%) | 0 (0.0%) |
| 5 to 17 Years | 0 (0.0%) | 0 (0.0%) |
| 18 to 34 Years | 0 (0.0%) | 0 (0.0%) |
| 35 to 64 Years | 49 (10.2%) | 0 (0.0%) |
| 65 to 74 Years | 51 (51.5%) | 0 (0.0%) |
| 75 Years and over | 21 (50.0%) | 11 (20.4%) |
Disability Class: Vision Difficulty
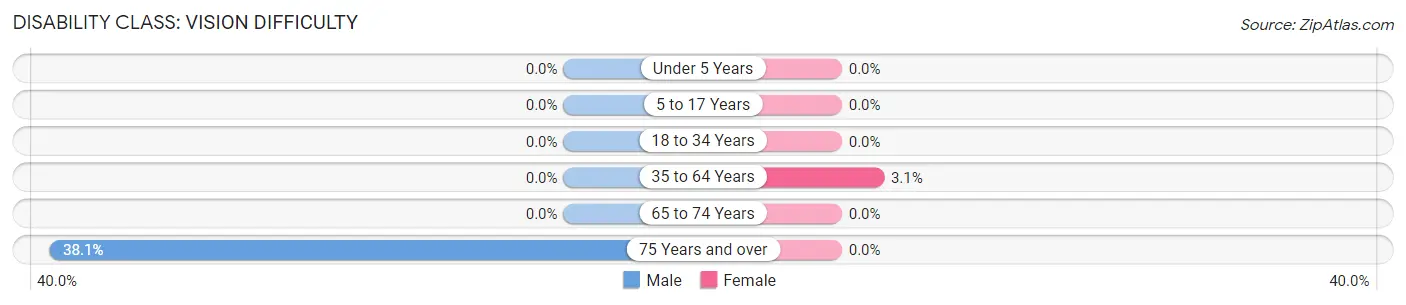
| Age Bracket | Male | Female |
| Under 5 Years | 0 (0.0%) | 0 (0.0%) |
| 5 to 17 Years | 0 (0.0%) | 0 (0.0%) |
| 18 to 34 Years | 0 (0.0%) | 0 (0.0%) |
| 35 to 64 Years | 0 (0.0%) | 14 (3.1%) |
| 65 to 74 Years | 0 (0.0%) | 0 (0.0%) |
| 75 Years and over | 16 (38.1%) | 0 (0.0%) |
Disability Class: Cognitive Difficulty
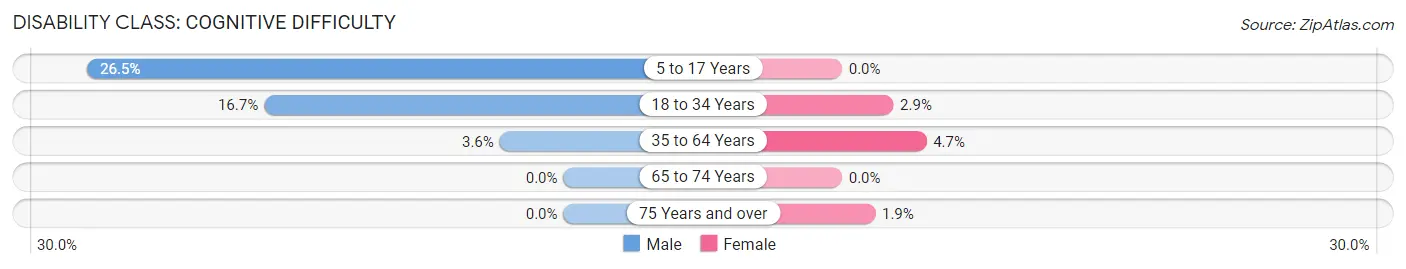
| Age Bracket | Male | Female |
| 5 to 17 Years | 70 (26.5%) | 0 (0.0%) |
| 18 to 34 Years | 16 (16.7%) | 3 (2.9%) |
| 35 to 64 Years | 17 (3.5%) | 21 (4.7%) |
| 65 to 74 Years | 0 (0.0%) | 0 (0.0%) |
| 75 Years and over | 0 (0.0%) | 1 (1.8%) |
Disability Class: Ambulatory Difficulty
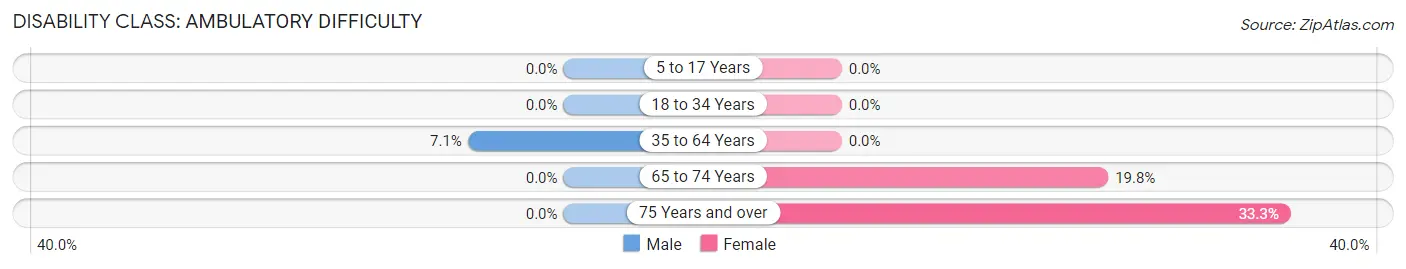
| Age Bracket | Male | Female |
| 5 to 17 Years | 0 (0.0%) | 0 (0.0%) |
| 18 to 34 Years | 0 (0.0%) | 0 (0.0%) |
| 35 to 64 Years | 34 (7.1%) | 0 (0.0%) |
| 65 to 74 Years | 0 (0.0%) | 18 (19.8%) |
| 75 Years and over | 0 (0.0%) | 18 (33.3%) |
Disability Class: Self-Care Difficulty
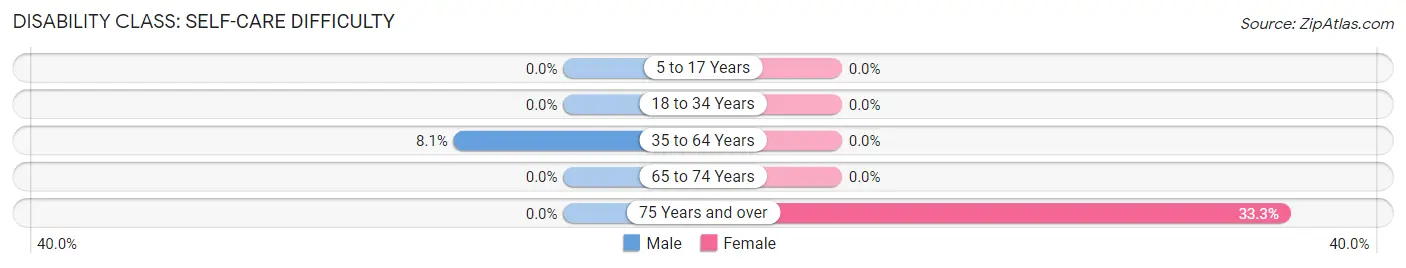
| Age Bracket | Male | Female |
| 5 to 17 Years | 0 (0.0%) | 0 (0.0%) |
| 18 to 34 Years | 0 (0.0%) | 0 (0.0%) |
| 35 to 64 Years | 39 (8.1%) | 0 (0.0%) |
| 65 to 74 Years | 0 (0.0%) | 0 (0.0%) |
| 75 Years and over | 0 (0.0%) | 18 (33.3%) |
Technology Access in Fern Prairie
Computing Device Access in Fern Prairie
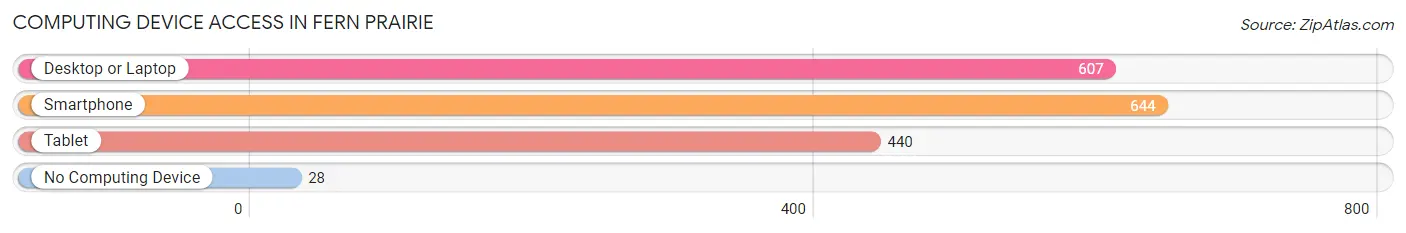
| Device Type | # Households | % Households |
| Desktop or Laptop | 607 | 89.4% |
| Smartphone | 644 | 94.9% |
| Tablet | 440 | 64.8% |
| No Computing Device | 28 | 4.1% |
| Total | 679 | 100.0% |
Internet Access in Fern Prairie
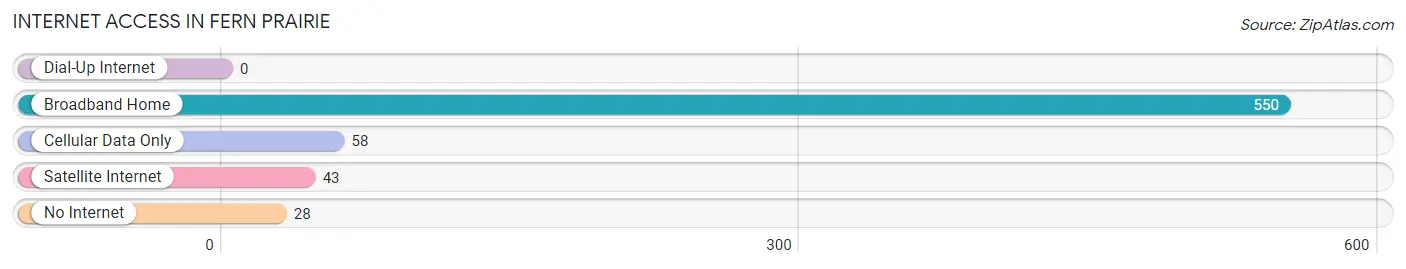
| Internet Type | # Households | % Households |
| Dial-Up Internet | 0 | 0.0% |
| Broadband Home | 550 | 81.0% |
| Cellular Data Only | 58 | 8.5% |
| Satellite Internet | 43 | 6.3% |
| No Internet | 28 | 4.1% |
| Total | 679 | 100.0% |
Fern Prairie Summary
Fern Prairie is a small unincorporated community located in Clark County, Washington, United States. It is situated in the foothills of the Cascade Mountains, approximately 10 miles east of Vancouver. The community is named after the ferns that grow in the area.
History
Fern Prairie was first settled in the late 1800s by homesteaders who were attracted to the area by its fertile soil and abundant natural resources. The first post office was established in 1891 and the community was officially incorporated in 1909. The town was originally known as “Fern Prairie Station” and was a stop on the Northern Pacific Railway.
In the early 1900s, Fern Prairie was a thriving agricultural community. The area was known for its dairy farms, fruit orchards, and vegetable gardens. The town also had a sawmill, a general store, and a blacksmith shop.
In the 1950s, the population of Fern Prairie began to decline as people moved away to larger cities. The town’s economy shifted from agriculture to tourism as people began to visit the area for its natural beauty.
Geography
Fern Prairie is located in the foothills of the Cascade Mountains, approximately 10 miles east of Vancouver. The area is characterized by rolling hills, lush forests, and numerous creeks and streams. The climate is mild and temperate, with warm summers and cool winters.
The town is situated at an elevation of 1,000 feet and is surrounded by the cities of Vancouver, Battle Ground, and Camas. The nearest major highway is Interstate 5, which is located approximately 10 miles to the west.
Economy
Fern Prairie’s economy is largely based on tourism. The area is popular with hikers, campers, and nature lovers. There are several parks and trails in the area, including the popular Salmon Creek Trail.
The town also has several small businesses, including a grocery store, a hardware store, and a few restaurants. The town is also home to a winery and a brewery.
Demographics
As of the 2010 census, the population of Fern Prairie was 1,845. The median age was 44.7 years and the median household income was $60,938. The racial makeup of the town was 94.3% White, 1.2% African American, 0.7% Native American, 0.7% Asian, 0.2% Pacific Islander, and 2.1% from other races.
Conclusion
Fern Prairie is a small unincorporated community located in Clark County, Washington. It is situated in the foothills of the Cascade Mountains and is known for its natural beauty and abundance of outdoor activities. The town’s economy is largely based on tourism and it is home to several small businesses. The population of Fern Prairie is 1,845 and the median household income is $60,938.
Common Questions
What is Per Capita Income in Fern Prairie?
Per Capita income in Fern Prairie is $41,437.
What is the Median Family Income in Fern Prairie?
Median Family Income in Fern Prairie is $118,300.
What is the Median Household income in Fern Prairie?
Median Household Income in Fern Prairie is $112,888.
What is Income or Wage Gap in Fern Prairie?
Income or Wage Gap in Fern Prairie is 36.9%.
Women in Fern Prairie earn 63.1 cents for every dollar earned by a man.
What is Inequality or Gini Index in Fern Prairie?
Inequality or Gini Index in Fern Prairie is 0.36.
What is the Total Population of Fern Prairie?
Total Population of Fern Prairie is 1,946.
What is the Total Male Population of Fern Prairie?
Total Male Population of Fern Prairie is 980.
What is the Total Female Population of Fern Prairie?
Total Female Population of Fern Prairie is 966.
What is the Ratio of Males per 100 Females in Fern Prairie?
There are 101.45 Males per 100 Females in Fern Prairie.
What is the Ratio of Females per 100 Males in Fern Prairie?
There are 98.57 Females per 100 Males in Fern Prairie.
What is the Median Population Age in Fern Prairie?
Median Population Age in Fern Prairie is 46.1 Years.
What is the Average Family Size in Fern Prairie
Average Family Size in Fern Prairie is 3.1 People.
What is the Average Household Size in Fern Prairie
Average Household Size in Fern Prairie is 2.9 People.
How Large is the Labor Force in Fern Prairie?
There are 750 People in the Labor Forcein in Fern Prairie.
What is the Percentage of People in the Labor Force in Fern Prairie?
50.4% of People are in the Labor Force in Fern Prairie.
What is the Unemployment Rate in Fern Prairie?
Unemployment Rate in Fern Prairie is 4.0%.