Bothell, WA Map & Demographics
Bothell Map
Bothell Overview
$61,857
PER CAPITA INCOME
$150,920
AVG FAMILY INCOME
$127,944
AVG HOUSEHOLD INCOME
45.9%
WAGE / INCOME GAP [ % ]
54.1¢/ $1
WAGE / INCOME GAP [ $ ]
0.41
INEQUALITY / GINI INDEX
47,917
TOTAL POPULATION
23,760
MALE POPULATION
24,157
FEMALE POPULATION
98.36
MALES / 100 FEMALES
101.67
FEMALES / 100 MALES
38.0
MEDIAN AGE
3.1
AVG FAMILY SIZE
2.6
AVG HOUSEHOLD SIZE
26,971
LABOR FORCE [ PEOPLE ]
71.5%
PERCENT IN LABOR FORCE
3.9%
UNEMPLOYMENT RATE
Bothell Area Codes
Income in Bothell
Income Overview in Bothell
Per Capita Income in Bothell is $61,857, while median incomes of families and households are $150,920 and $127,944 respectively.
| Characteristic | Number | Measure |
| Per Capita Income | 47,917 | $61,857 |
| Median Family Income | 12,577 | $150,920 |
| Mean Family Income | 12,577 | $183,329 |
| Median Household Income | 18,427 | $127,944 |
| Mean Household Income | 18,427 | $157,198 |
| Income Deficit | 12,577 | $0 |
| Wage / Income Gap (%) | 47,917 | 45.94% |
| Wage / Income Gap ($) | 47,917 | 54.06¢ per $1 |
| Gini / Inequality Index | 47,917 | 0.41 |
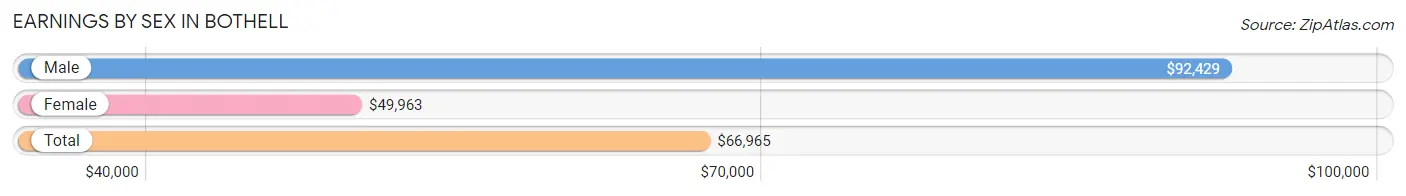
Earnings by Sex in Bothell
Average Earnings in Bothell are $66,965, $92,429 for men and $49,963 for women, a difference of 45.9%.
| Sex | Number | Average Earnings |
| Male | 15,028 (54.5%) | $92,429 |
| Female | 12,537 (45.5%) | $49,963 |
| Total | 27,565 (100.0%) | $66,965 |
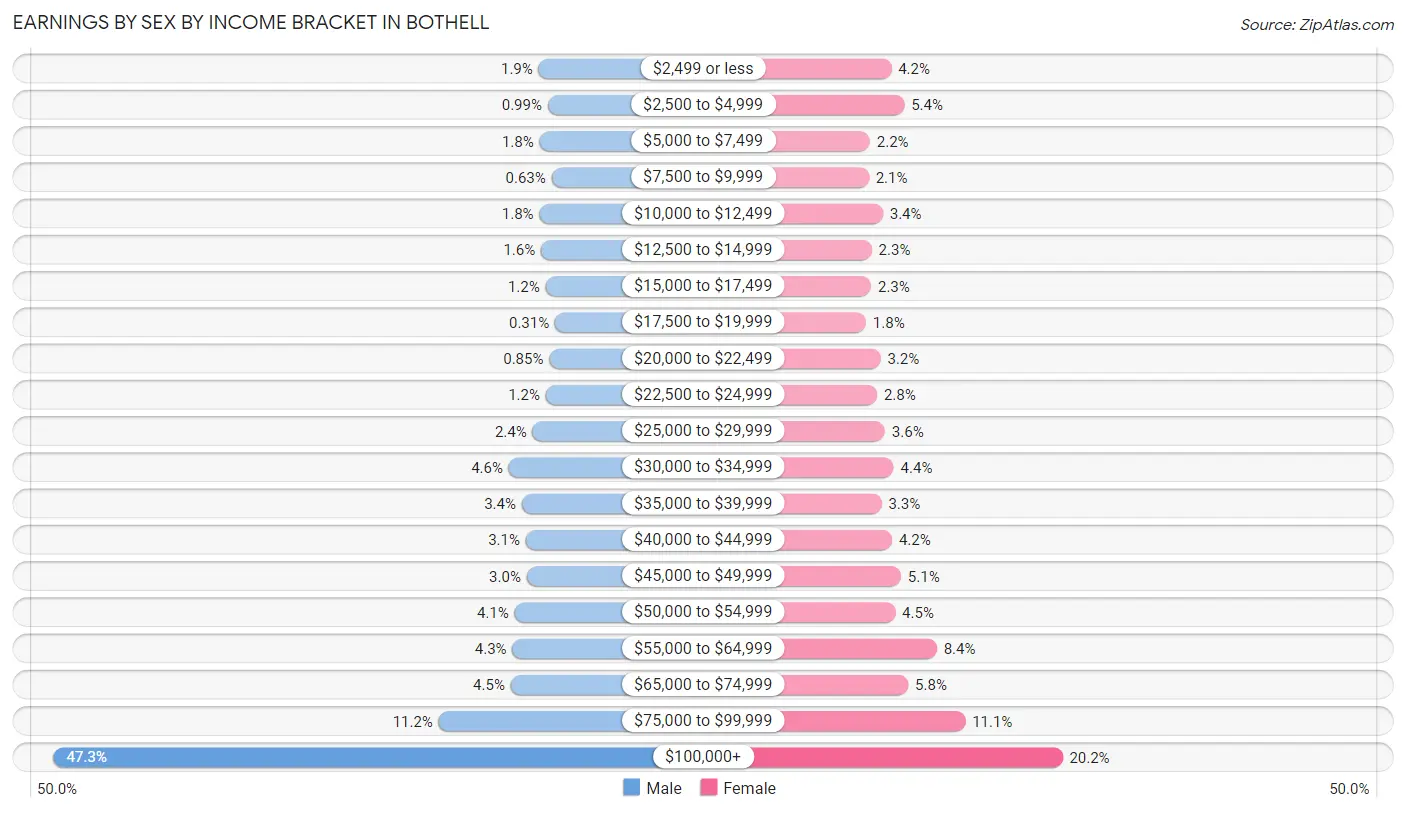
Earnings by Sex by Income Bracket in Bothell
The most common earnings brackets in Bothell are $100,000+ for men (7,106 | 47.3%) and $100,000+ for women (2,532 | 20.2%).
| Income | Male | Female |
| $2,499 or less | 278 (1.8%) | 521 (4.2%) |
| $2,500 to $4,999 | 149 (1.0%) | 675 (5.4%) |
| $5,000 to $7,499 | 265 (1.8%) | 271 (2.2%) |
| $7,500 to $9,999 | 95 (0.6%) | 257 (2.1%) |
| $10,000 to $12,499 | 266 (1.8%) | 422 (3.4%) |
| $12,500 to $14,999 | 244 (1.6%) | 292 (2.3%) |
| $15,000 to $17,499 | 180 (1.2%) | 285 (2.3%) |
| $17,500 to $19,999 | 46 (0.3%) | 225 (1.8%) |
| $20,000 to $22,499 | 127 (0.9%) | 396 (3.2%) |
| $22,500 to $24,999 | 177 (1.2%) | 355 (2.8%) |
| $25,000 to $29,999 | 364 (2.4%) | 448 (3.6%) |
| $30,000 to $34,999 | 697 (4.6%) | 550 (4.4%) |
| $35,000 to $39,999 | 514 (3.4%) | 408 (3.3%) |
| $40,000 to $44,999 | 458 (3.0%) | 530 (4.2%) |
| $45,000 to $49,999 | 445 (3.0%) | 636 (5.1%) |
| $50,000 to $54,999 | 616 (4.1%) | 568 (4.5%) |
| $55,000 to $64,999 | 646 (4.3%) | 1,055 (8.4%) |
| $65,000 to $74,999 | 670 (4.5%) | 721 (5.8%) |
| $75,000 to $99,999 | 1,685 (11.2%) | 1,390 (11.1%) |
| $100,000+ | 7,106 (47.3%) | 2,532 (20.2%) |
| Total | 15,028 (100.0%) | 12,537 (100.0%) |
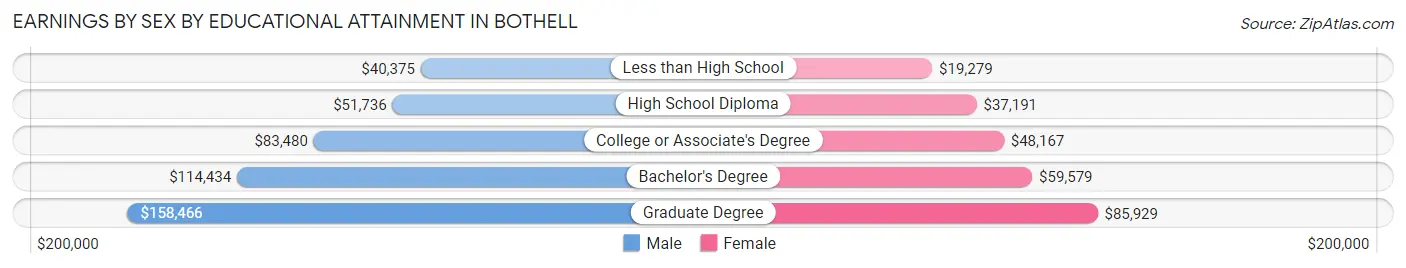
Earnings by Sex by Educational Attainment in Bothell
Average earnings in Bothell are $102,842 for men and $56,167 for women, a difference of 45.4%. Men with an educational attainment of graduate degree enjoy the highest average annual earnings of $158,466, while those with less than high school education earn the least with $40,375. Women with an educational attainment of graduate degree earn the most with the average annual earnings of $85,929, while those with less than high school education have the smallest earnings of $19,279.
| Educational Attainment | Male Income | Female Income |
| Less than High School | $40,375 | $19,279 |
| High School Diploma | $51,736 | $37,191 |
| College or Associate's Degree | $83,480 | $48,167 |
| Bachelor's Degree | $114,434 | $59,579 |
| Graduate Degree | $158,466 | $85,929 |
| Total | $102,842 | $56,167 |
Family Income in Bothell
Family Income Brackets in Bothell
According to the Bothell family income data, there are 4,238 families falling into the $200,000+ income range, which is the most common income bracket and makes up 33.7% of all families. Conversely, the $15,000 to $24,999 income bracket is the least frequent group with only 113 families (0.9%) belonging to this category.
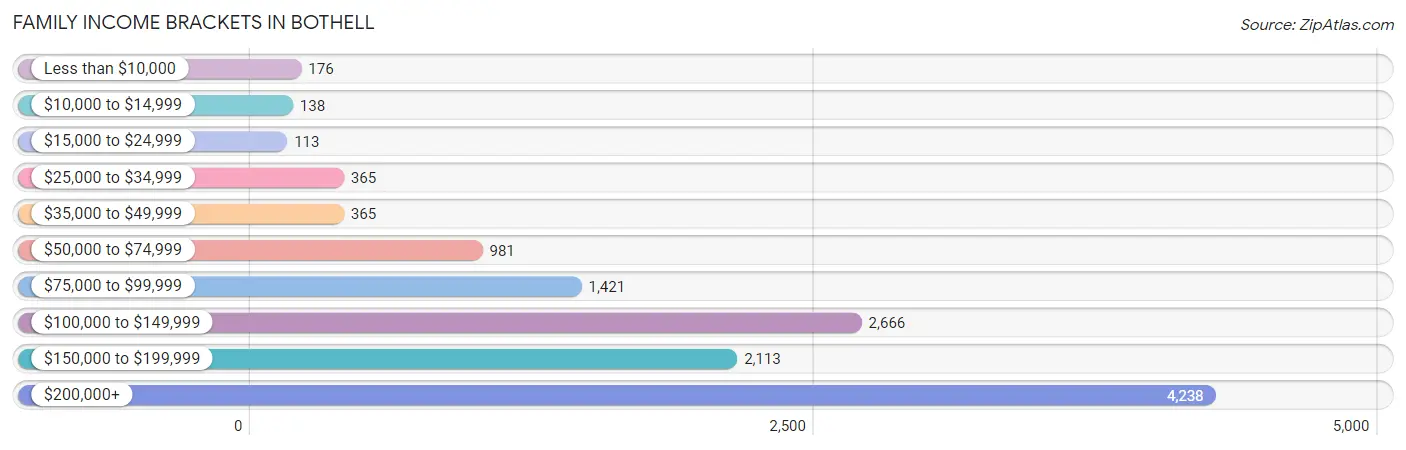
| Income Bracket | # Families | % Families |
| Less than $10,000 | 176 | 1.4% |
| $10,000 to $14,999 | 138 | 1.1% |
| $15,000 to $24,999 | 113 | 0.9% |
| $25,000 to $34,999 | 365 | 2.9% |
| $35,000 to $49,999 | 365 | 2.9% |
| $50,000 to $74,999 | 981 | 7.8% |
| $75,000 to $99,999 | 1,421 | 11.3% |
| $100,000 to $149,999 | 2,666 | 21.2% |
| $150,000 to $199,999 | 2,113 | 16.8% |
| $200,000+ | 4,238 | 33.7% |
Family Income by Famaliy Size in Bothell
6-person families (307 | 2.4%) account for the highest median family income in Bothell with $208,109 per family, while 2-person families (5,159 | 41.0%) have the highest median income of $60,122 per family member.
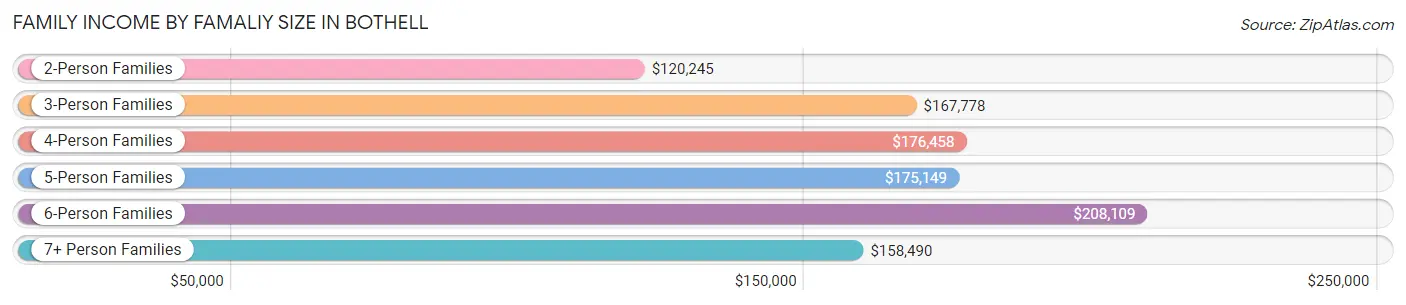
| Income Bracket | # Families | Median Income |
| 2-Person Families | 5,159 (41.0%) | $120,245 |
| 3-Person Families | 3,026 (24.1%) | $167,778 |
| 4-Person Families | 3,161 (25.1%) | $176,458 |
| 5-Person Families | 849 (6.8%) | $175,149 |
| 6-Person Families | 307 (2.4%) | $208,109 |
| 7+ Person Families | 75 (0.6%) | $158,490 |
| Total | 12,577 (100.0%) | $150,920 |
Family Income by Number of Earners in Bothell
The median family income in Bothell is $150,920, with families comprising 3+ earners (1,250) having the highest median family income of $192,459, while families with no earners (1,253) have the lowest median family income of $78,750, accounting for 9.9% and 10.0% of families, respectively.
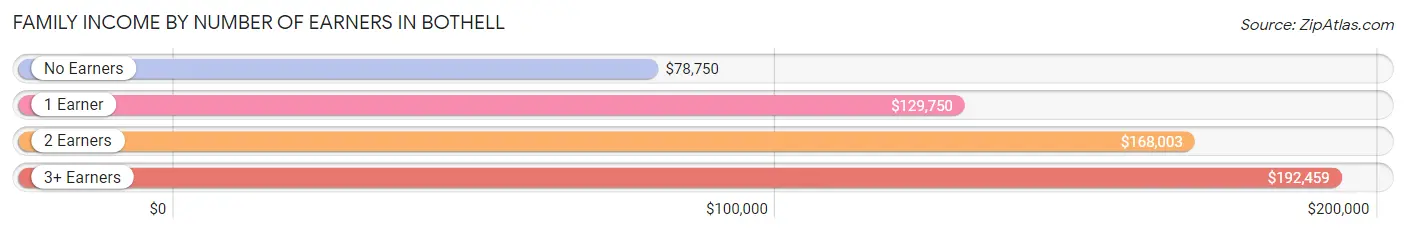
| Number of Earners | # Families | Median Income |
| No Earners | 1,253 (10.0%) | $78,750 |
| 1 Earner | 3,505 (27.9%) | $129,750 |
| 2 Earners | 6,569 (52.2%) | $168,003 |
| 3+ Earners | 1,250 (9.9%) | $192,459 |
| Total | 12,577 (100.0%) | $150,920 |
Household Income in Bothell
Household Income Brackets in Bothell
With 4,828 households falling in the category, the $200,000+ income range is the most frequent in Bothell, accounting for 26.2% of all households. In contrast, only 221 households (1.2%) fall into the $10,000 to $14,999 income bracket, making it the least populous group.
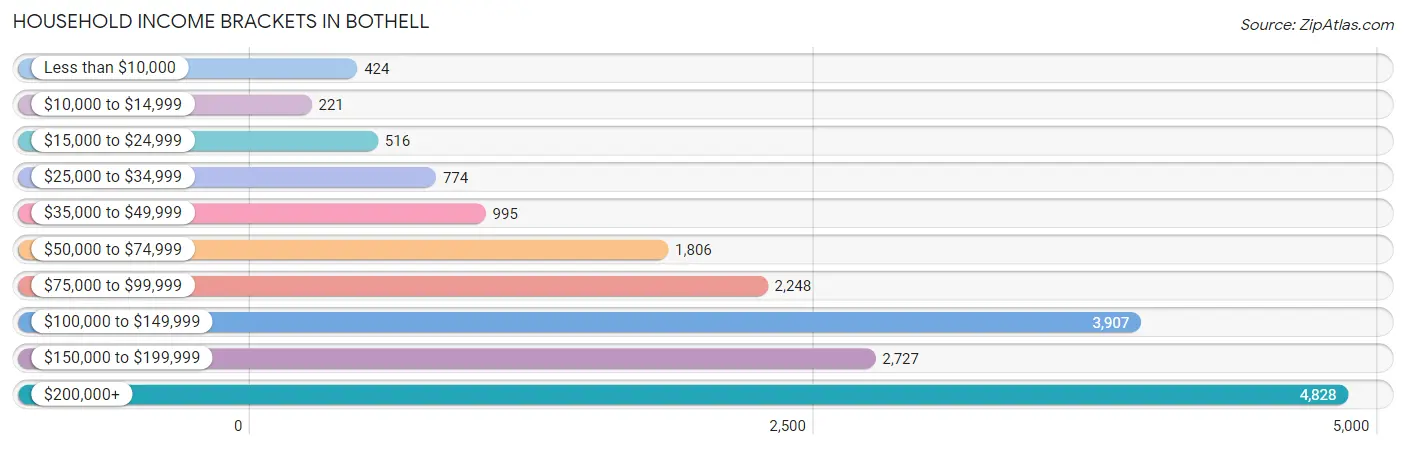
| Income Bracket | # Households | % Households |
| Less than $10,000 | 424 | 2.3% |
| $10,000 to $14,999 | 221 | 1.2% |
| $15,000 to $24,999 | 516 | 2.8% |
| $25,000 to $34,999 | 774 | 4.2% |
| $35,000 to $49,999 | 995 | 5.4% |
| $50,000 to $74,999 | 1,806 | 9.8% |
| $75,000 to $99,999 | 2,248 | 12.2% |
| $100,000 to $149,999 | 3,907 | 21.2% |
| $150,000 to $199,999 | 2,727 | 14.8% |
| $200,000+ | 4,828 | 26.2% |
Household Income by Householder Age in Bothell
The median household income in Bothell is $127,944, with the highest median household income of $151,595 found in the 25 to 44 years age bracket for the primary householder. A total of 7,713 households (41.9%) fall into this category. Meanwhile, the 15 to 24 years age bracket for the primary householder has the lowest median household income of $64,151, with 538 households (2.9%) in this group.
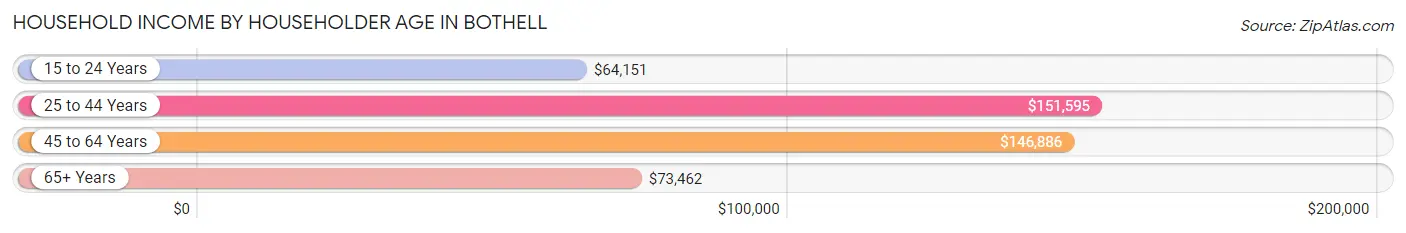
| Income Bracket | # Households | Median Income |
| 15 to 24 Years | 538 (2.9%) | $64,151 |
| 25 to 44 Years | 7,713 (41.9%) | $151,595 |
| 45 to 64 Years | 6,400 (34.7%) | $146,886 |
| 65+ Years | 3,776 (20.5%) | $73,462 |
| Total | 18,427 (100.0%) | $127,944 |
Poverty in Bothell
Income Below Poverty by Sex and Age in Bothell
With 3.9% poverty level for males and 5.8% for females among the residents of Bothell, 18 to 24 year old males and 18 to 24 year old females are the most vulnerable to poverty, with 140 males (11.1%) and 200 females (13.1%) in their respective age groups living below the poverty level.
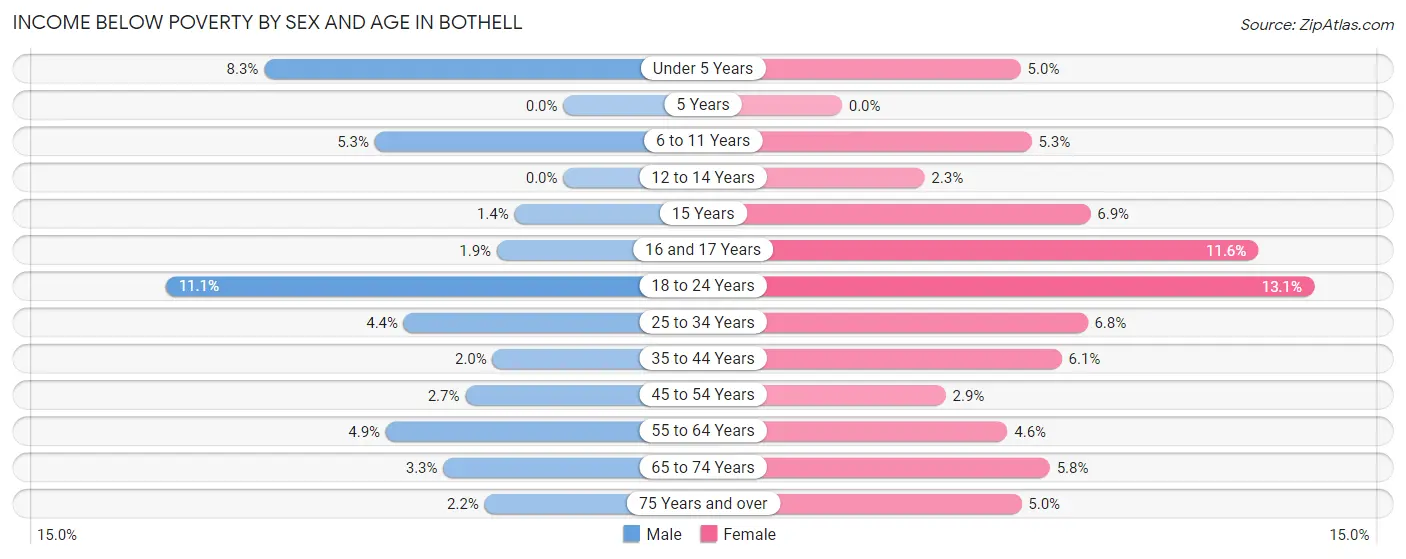
| Age Bracket | Male | Female |
| Under 5 Years | 101 (8.3%) | 66 (5.0%) |
| 5 Years | 0 (0.0%) | 0 (0.0%) |
| 6 to 11 Years | 124 (5.2%) | 121 (5.3%) |
| 12 to 14 Years | 0 (0.0%) | 19 (2.3%) |
| 15 Years | 5 (1.4%) | 18 (6.9%) |
| 16 and 17 Years | 9 (1.8%) | 65 (11.6%) |
| 18 to 24 Years | 140 (11.1%) | 200 (13.1%) |
| 25 to 34 Years | 163 (4.4%) | 226 (6.8%) |
| 35 to 44 Years | 89 (2.0%) | 262 (6.1%) |
| 45 to 54 Years | 94 (2.7%) | 86 (2.9%) |
| 55 to 64 Years | 121 (4.9%) | 125 (4.6%) |
| 65 to 74 Years | 64 (3.3%) | 118 (5.8%) |
| 75 Years and over | 16 (2.2%) | 74 (5.0%) |
| Total | 926 (3.9%) | 1,380 (5.8%) |
Income Above Poverty by Sex and Age in Bothell
According to the poverty statistics in Bothell, males aged 5 years and females aged 5 years are the age groups that are most secure financially, with 100.0% of males and 100.0% of females in these age groups living above the poverty line.
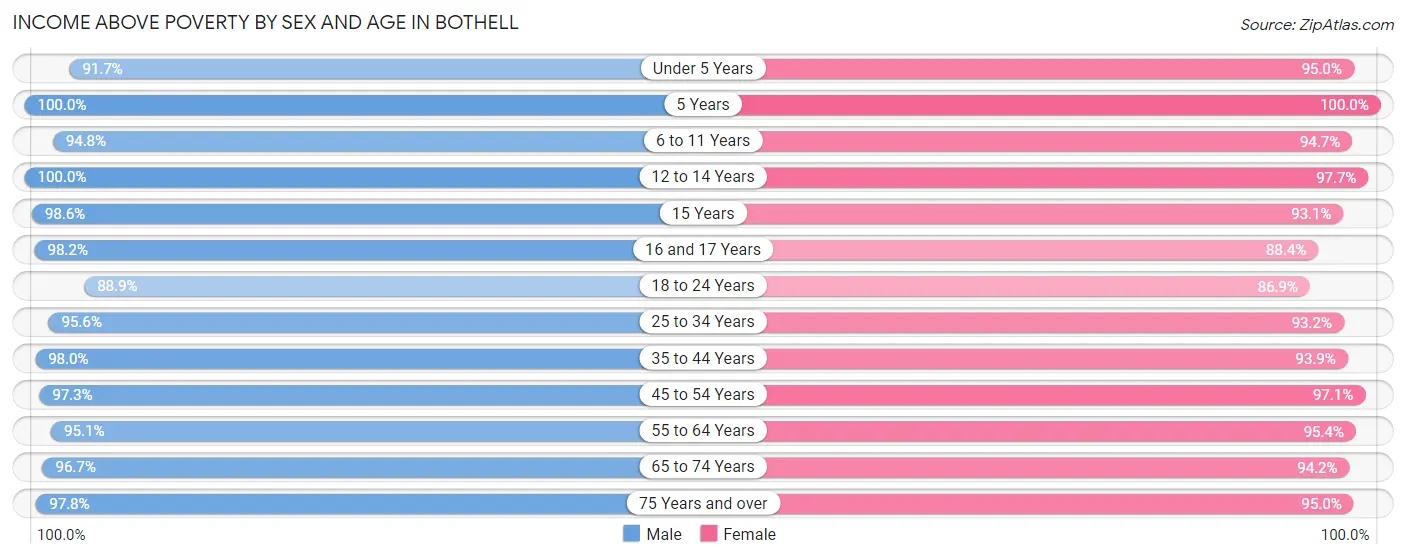
| Age Bracket | Male | Female |
| Under 5 Years | 1,112 (91.7%) | 1,259 (95.0%) |
| 5 Years | 286 (100.0%) | 313 (100.0%) |
| 6 to 11 Years | 2,236 (94.8%) | 2,169 (94.7%) |
| 12 to 14 Years | 913 (100.0%) | 806 (97.7%) |
| 15 Years | 363 (98.6%) | 242 (93.1%) |
| 16 and 17 Years | 478 (98.2%) | 496 (88.4%) |
| 18 to 24 Years | 1,125 (88.9%) | 1,322 (86.9%) |
| 25 to 34 Years | 3,510 (95.6%) | 3,076 (93.2%) |
| 35 to 44 Years | 4,423 (98.0%) | 4,019 (93.9%) |
| 45 to 54 Years | 3,346 (97.3%) | 2,887 (97.1%) |
| 55 to 64 Years | 2,330 (95.1%) | 2,586 (95.4%) |
| 65 to 74 Years | 1,852 (96.7%) | 1,919 (94.2%) |
| 75 Years and over | 715 (97.8%) | 1,407 (95.0%) |
| Total | 22,689 (96.1%) | 22,501 (94.2%) |
Income Below Poverty Among Married-Couple Families in Bothell
The poverty statistics for married-couple families in Bothell show that 1.5% or 159 of the total 10,857 families live below the poverty line. Families with no children have the highest poverty rate of 1.6%, comprising of 84 families. On the other hand, families with 3 or 4 children have the lowest poverty rate of 0.0%, which includes 0 families.
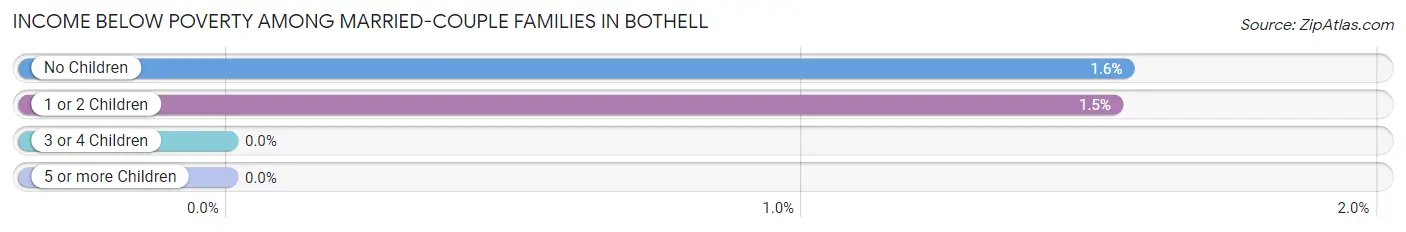
| Children | Above Poverty | Below Poverty |
| No Children | 5,292 (98.4%) | 84 (1.6%) |
| 1 or 2 Children | 4,784 (98.5%) | 75 (1.5%) |
| 3 or 4 Children | 599 (100.0%) | 0 (0.0%) |
| 5 or more Children | 23 (100.0%) | 0 (0.0%) |
| Total | 10,698 (98.5%) | 159 (1.5%) |
Income Below Poverty Among Single-Parent Households in Bothell
According to the poverty data in Bothell, 2.1% or 13 single-father households and 16.1% or 176 single-mother households are living below the poverty line. Among single-father households, those with 1 or 2 children have the highest poverty rate, with 13 households (4.5%) experiencing poverty. Likewise, among single-mother households, those with 3 or 4 children have the highest poverty rate, with 23 households (48.9%) falling below the poverty line.
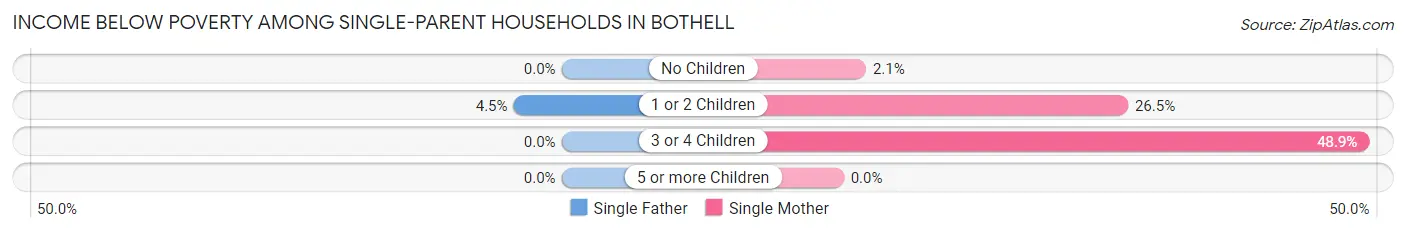
| Children | Single Father | Single Mother |
| No Children | 0 (0.0%) | 10 (2.1%) |
| 1 or 2 Children | 13 (4.5%) | 143 (26.5%) |
| 3 or 4 Children | 0 (0.0%) | 23 (48.9%) |
| 5 or more Children | 0 (0.0%) | 0 (0.0%) |
| Total | 13 (2.1%) | 176 (16.1%) |
Income Below Poverty Among Married-Couple vs Single-Parent Households in Bothell
The poverty data for Bothell shows that 159 of the married-couple family households (1.5%) and 189 of the single-parent households (11.0%) are living below the poverty level. Within the married-couple family households, those with no children have the highest poverty rate, with 84 households (1.6%) falling below the poverty line. Among the single-parent households, those with 3 or 4 children have the highest poverty rate, with 23 household (21.7%) living below poverty.
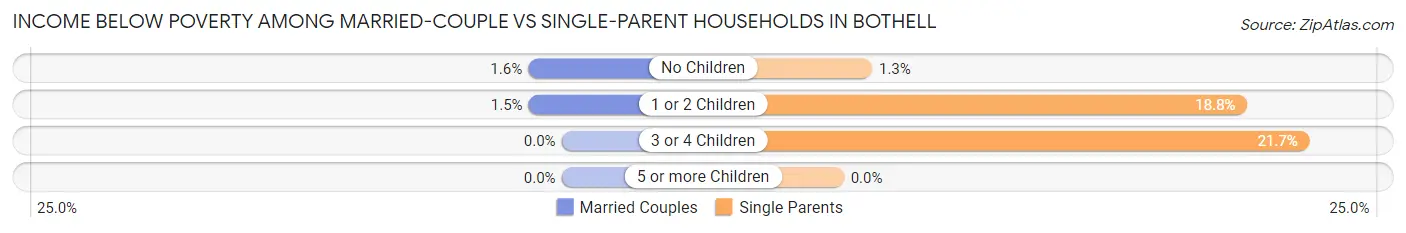
| Children | Married-Couple Families | Single-Parent Households |
| No Children | 84 (1.6%) | 10 (1.3%) |
| 1 or 2 Children | 75 (1.5%) | 156 (18.8%) |
| 3 or 4 Children | 0 (0.0%) | 23 (21.7%) |
| 5 or more Children | 0 (0.0%) | 0 (0.0%) |
| Total | 159 (1.5%) | 189 (11.0%) |
Race in Bothell
The most populous races in Bothell are White / Caucasian (32,343 | 67.5%), Asian (8,926 | 18.6%), and Hispanic or Latino (4,479 | 9.3%).
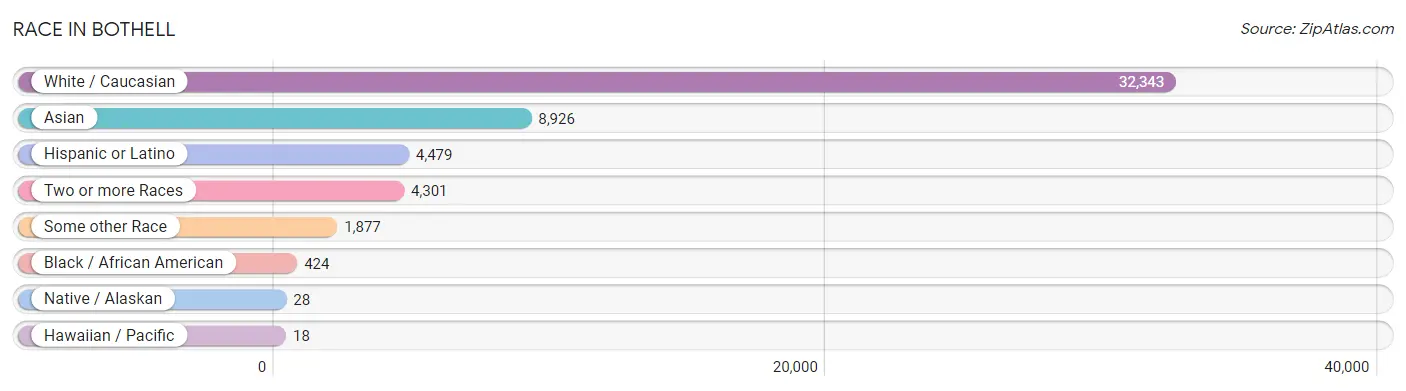
| Race | # Population | % Population |
| Asian | 8,926 | 18.6% |
| Black / African American | 424 | 0.9% |
| Hawaiian / Pacific | 18 | 0.0% |
| Hispanic or Latino | 4,479 | 9.3% |
| Native / Alaskan | 28 | 0.1% |
| White / Caucasian | 32,343 | 67.5% |
| Two or more Races | 4,301 | 9.0% |
| Some other Race | 1,877 | 3.9% |
| Total | 47,917 | 100.0% |
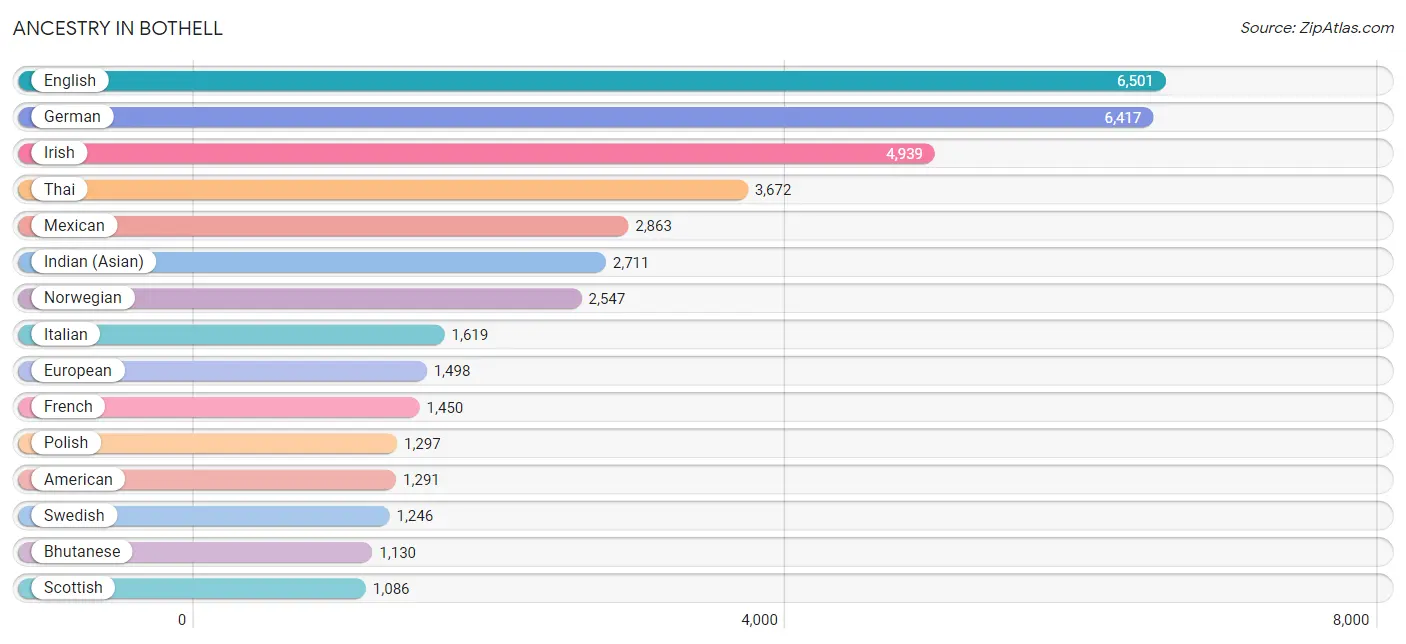
Ancestry in Bothell
The most populous ancestries reported in Bothell are English (6,501 | 13.6%), German (6,417 | 13.4%), Irish (4,939 | 10.3%), Thai (3,672 | 7.7%), and Mexican (2,863 | 6.0%), together accounting for 50.9% of all Bothell residents.
| Ancestry | # Population | % Population |
| Afghan | 11 | 0.0% |
| African | 59 | 0.1% |
| Alaskan Athabascan | 15 | 0.0% |
| Albanian | 12 | 0.0% |
| American | 1,291 | 2.7% |
| Apache | 6 | 0.0% |
| Arab | 712 | 1.5% |
| Argentinean | 48 | 0.1% |
| Armenian | 50 | 0.1% |
| Australian | 58 | 0.1% |
| Austrian | 47 | 0.1% |
| Belgian | 17 | 0.0% |
| Bhutanese | 1,130 | 2.4% |
| Blackfeet | 14 | 0.0% |
| Brazilian | 173 | 0.4% |
| British | 480 | 1.0% |
| Bulgarian | 53 | 0.1% |
| Burmese | 574 | 1.2% |
| Cambodian | 79 | 0.2% |
| Canadian | 305 | 0.6% |
| Celtic | 8 | 0.0% |
| Central American | 281 | 0.6% |
| Central American Indian | 36 | 0.1% |
| Cherokee | 63 | 0.1% |
| Cheyenne | 1 | 0.0% |
| Chilean | 68 | 0.1% |
| Choctaw | 24 | 0.1% |
| Colombian | 133 | 0.3% |
| Costa Rican | 14 | 0.0% |
| Croatian | 35 | 0.1% |
| Crow | 14 | 0.0% |
| Cuban | 275 | 0.6% |
| Czech | 72 | 0.2% |
| Czechoslovakian | 40 | 0.1% |
| Danish | 434 | 0.9% |
| Delaware | 27 | 0.1% |
| Dominican | 11 | 0.0% |
| Dutch | 907 | 1.9% |
| Eastern European | 98 | 0.2% |
| Egyptian | 188 | 0.4% |
| English | 6,501 | 13.6% |
| Estonian | 15 | 0.0% |
| Ethiopian | 2 | 0.0% |
| European | 1,498 | 3.1% |
| Filipino | 119 | 0.3% |
| Finnish | 222 | 0.5% |
| French | 1,450 | 3.0% |
| French American Indian | 10 | 0.0% |
| French Canadian | 246 | 0.5% |
| German | 6,417 | 13.4% |
| Greek | 119 | 0.3% |
| Guamanian / Chamorro | 53 | 0.1% |
| Guatemalan | 8 | 0.0% |
| Honduran | 21 | 0.0% |
| Hungarian | 96 | 0.2% |
| Indian (Asian) | 2,711 | 5.7% |
| Inupiat | 41 | 0.1% |
| Iranian | 508 | 1.1% |
| Iraqi | 62 | 0.1% |
| Irish | 4,939 | 10.3% |
| Iroquois | 27 | 0.1% |
| Israeli | 47 | 0.1% |
| Italian | 1,619 | 3.4% |
| Japanese | 23 | 0.1% |
| Jordanian | 123 | 0.3% |
| Kenyan | 89 | 0.2% |
| Kiowa | 6 | 0.0% |
| Korean | 917 | 1.9% |
| Laotian | 118 | 0.3% |
| Lebanese | 47 | 0.1% |
| Lithuanian | 80 | 0.2% |
| Luxembourger | 13 | 0.0% |
| Malaysian | 73 | 0.2% |
| Mexican | 2,863 | 6.0% |
| Mexican American Indian | 37 | 0.1% |
| Native Hawaiian | 101 | 0.2% |
| Nicaraguan | 52 | 0.1% |
| Nigerian | 2 | 0.0% |
| Northern European | 369 | 0.8% |
| Norwegian | 2,547 | 5.3% |
| Pakistani | 48 | 0.1% |
| Panamanian | 65 | 0.1% |
| Pennsylvania German | 10 | 0.0% |
| Peruvian | 248 | 0.5% |
| Polish | 1,297 | 2.7% |
| Portuguese | 380 | 0.8% |
| Puerto Rican | 109 | 0.2% |
| Romanian | 368 | 0.8% |
| Russian | 677 | 1.4% |
| Salvadoran | 121 | 0.3% |
| Samoan | 18 | 0.0% |
| Scandinavian | 631 | 1.3% |
| Scotch-Irish | 508 | 1.1% |
| Scottish | 1,086 | 2.3% |
| Seminole | 19 | 0.0% |
| Sioux | 1 | 0.0% |
| Slavic | 13 | 0.0% |
| Slovak | 48 | 0.1% |
| Slovene | 31 | 0.1% |
| Somali | 17 | 0.0% |
| South American | 563 | 1.2% |
| Spaniard | 51 | 0.1% |
| Spanish | 50 | 0.1% |
| Sri Lankan | 598 | 1.3% |
| Subsaharan African | 169 | 0.4% |
| Swedish | 1,246 | 2.6% |
| Swiss | 252 | 0.5% |
| Thai | 3,672 | 7.7% |
| Tlingit-Haida | 289 | 0.6% |
| Tongan | 27 | 0.1% |
| Turkish | 66 | 0.1% |
| Ukrainian | 270 | 0.6% |
| Uruguayan | 45 | 0.1% |
| Venezuelan | 21 | 0.0% |
| Vietnamese | 121 | 0.3% |
| Welsh | 574 | 1.2% |
| Yugoslavian | 112 | 0.2% | View All 117 Rows |
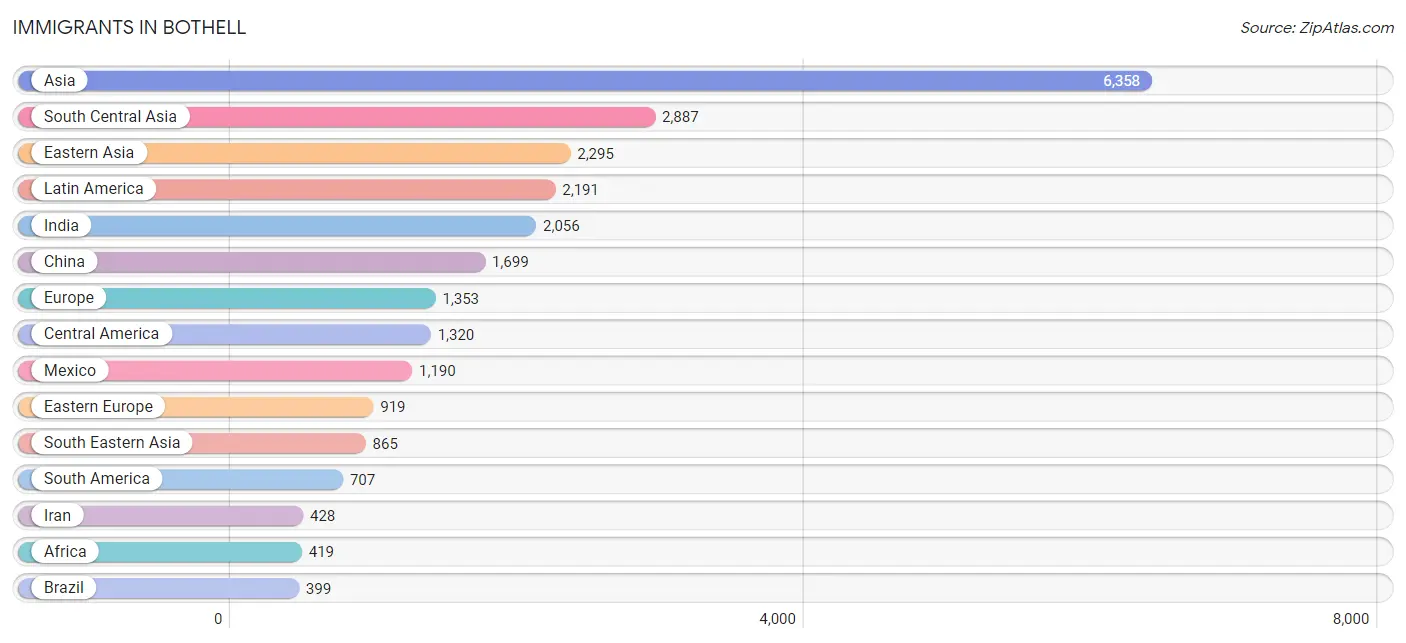
Immigrants in Bothell
The most numerous immigrant groups reported in Bothell came from Asia (6,358 | 13.3%), South Central Asia (2,887 | 6.0%), Eastern Asia (2,295 | 4.8%), Latin America (2,191 | 4.6%), and India (2,056 | 4.3%), together accounting for 33.0% of all Bothell residents.
| Immigration Origin | # Population | % Population |
| Africa | 419 | 0.9% |
| Albania | 12 | 0.0% |
| Armenia | 18 | 0.0% |
| Asia | 6,358 | 13.3% |
| Australia | 39 | 0.1% |
| Bangladesh | 121 | 0.3% |
| Belarus | 45 | 0.1% |
| Belgium | 17 | 0.0% |
| Belize | 11 | 0.0% |
| Brazil | 399 | 0.8% |
| Bulgaria | 14 | 0.0% |
| Cambodia | 22 | 0.1% |
| Canada | 178 | 0.4% |
| Caribbean | 164 | 0.3% |
| Central America | 1,320 | 2.8% |
| Chile | 62 | 0.1% |
| China | 1,699 | 3.5% |
| Colombia | 69 | 0.1% |
| Congo | 19 | 0.0% |
| Costa Rica | 14 | 0.0% |
| Cuba | 164 | 0.3% |
| Czechoslovakia | 10 | 0.0% |
| Eastern Africa | 49 | 0.1% |
| Eastern Asia | 2,295 | 4.8% |
| Eastern Europe | 919 | 1.9% |
| Egypt | 184 | 0.4% |
| El Salvador | 54 | 0.1% |
| England | 81 | 0.2% |
| Ethiopia | 4 | 0.0% |
| Europe | 1,353 | 2.8% |
| France | 10 | 0.0% |
| Germany | 74 | 0.2% |
| Guatemala | 8 | 0.0% |
| Honduras | 9 | 0.0% |
| Hong Kong | 128 | 0.3% |
| India | 2,056 | 4.3% |
| Indonesia | 51 | 0.1% |
| Iran | 428 | 0.9% |
| Iraq | 62 | 0.1% |
| Ireland | 71 | 0.2% |
| Israel | 34 | 0.1% |
| Japan | 235 | 0.5% |
| Jordan | 80 | 0.2% |
| Kenya | 45 | 0.1% |
| Korea | 282 | 0.6% |
| Kuwait | 12 | 0.0% |
| Laos | 6 | 0.0% |
| Latin America | 2,191 | 4.6% |
| Lebanon | 27 | 0.1% |
| Malaysia | 31 | 0.1% |
| Mexico | 1,190 | 2.5% |
| Middle Africa | 19 | 0.0% |
| Moldova | 24 | 0.1% |
| Nepal | 93 | 0.2% |
| Nicaragua | 12 | 0.0% |
| Nigeria | 15 | 0.0% |
| Northern Africa | 207 | 0.4% |
| Northern Europe | 282 | 0.6% |
| Norway | 20 | 0.0% |
| Oceania | 57 | 0.1% |
| Pakistan | 160 | 0.3% |
| Panama | 22 | 0.1% |
| Peru | 168 | 0.4% |
| Philippines | 315 | 0.7% |
| Poland | 4 | 0.0% |
| Romania | 240 | 0.5% |
| Russia | 316 | 0.7% |
| Saudi Arabia | 16 | 0.0% |
| South Africa | 102 | 0.2% |
| South America | 707 | 1.5% |
| South Central Asia | 2,887 | 6.0% |
| South Eastern Asia | 865 | 1.8% |
| Southern Europe | 5 | 0.0% |
| Spain | 5 | 0.0% |
| Sri Lanka | 29 | 0.1% |
| Sweden | 12 | 0.0% |
| Taiwan | 189 | 0.4% |
| Thailand | 69 | 0.1% |
| Turkey | 46 | 0.1% |
| Ukraine | 254 | 0.5% |
| Venezuela | 9 | 0.0% |
| Vietnam | 371 | 0.8% |
| Western Africa | 15 | 0.0% |
| Western Asia | 311 | 0.6% |
| Western Europe | 101 | 0.2% |
| Yemen | 16 | 0.0% | View All 86 Rows |
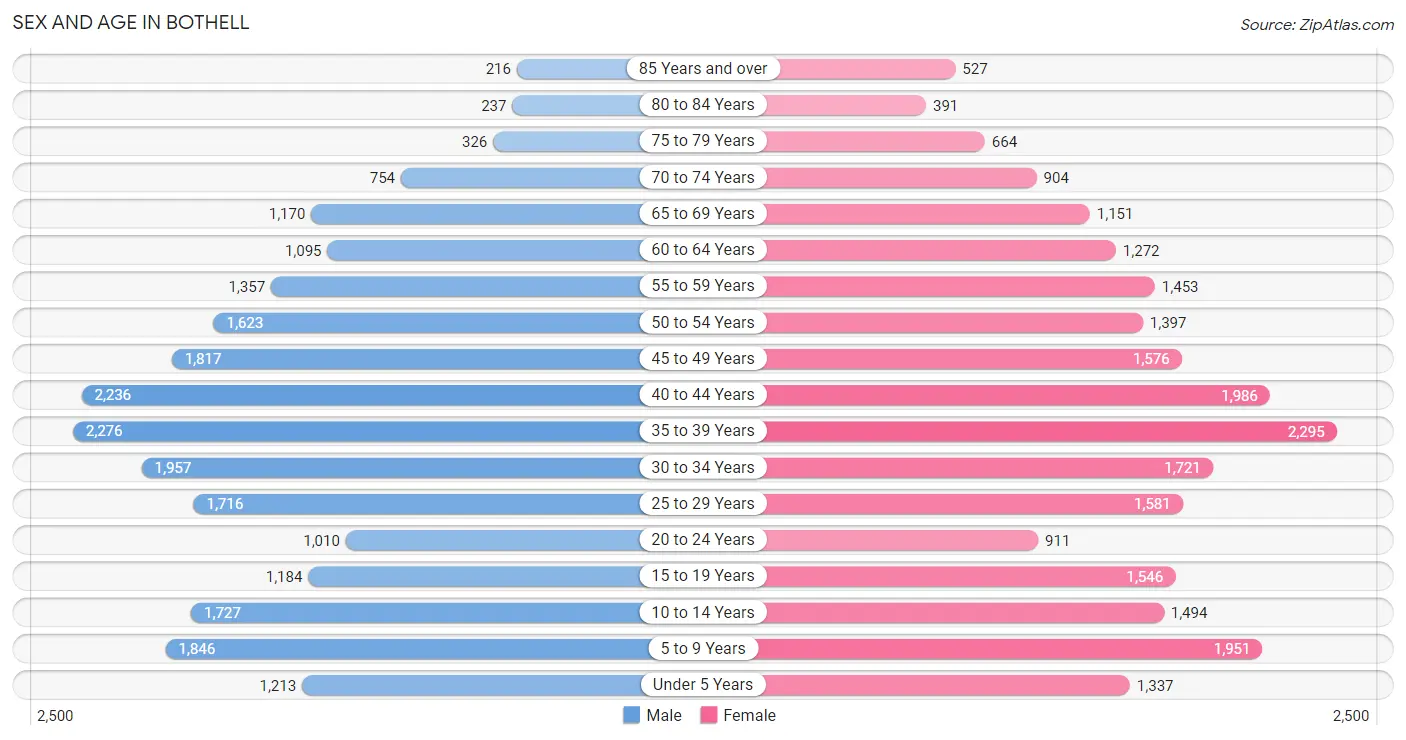
Sex and Age in Bothell
Sex and Age in Bothell
The most populous age groups in Bothell are 35 to 39 Years (2,276 | 9.6%) for men and 35 to 39 Years (2,295 | 9.5%) for women.
| Age Bracket | Male | Female |
| Under 5 Years | 1,213 (5.1%) | 1,337 (5.5%) |
| 5 to 9 Years | 1,846 (7.8%) | 1,951 (8.1%) |
| 10 to 14 Years | 1,727 (7.3%) | 1,494 (6.2%) |
| 15 to 19 Years | 1,184 (5.0%) | 1,546 (6.4%) |
| 20 to 24 Years | 1,010 (4.3%) | 911 (3.8%) |
| 25 to 29 Years | 1,716 (7.2%) | 1,581 (6.5%) |
| 30 to 34 Years | 1,957 (8.2%) | 1,721 (7.1%) |
| 35 to 39 Years | 2,276 (9.6%) | 2,295 (9.5%) |
| 40 to 44 Years | 2,236 (9.4%) | 1,986 (8.2%) |
| 45 to 49 Years | 1,817 (7.6%) | 1,576 (6.5%) |
| 50 to 54 Years | 1,623 (6.8%) | 1,397 (5.8%) |
| 55 to 59 Years | 1,357 (5.7%) | 1,453 (6.0%) |
| 60 to 64 Years | 1,095 (4.6%) | 1,272 (5.3%) |
| 65 to 69 Years | 1,170 (4.9%) | 1,151 (4.8%) |
| 70 to 74 Years | 754 (3.2%) | 904 (3.7%) |
| 75 to 79 Years | 326 (1.4%) | 664 (2.8%) |
| 80 to 84 Years | 237 (1.0%) | 391 (1.6%) |
| 85 Years and over | 216 (0.9%) | 527 (2.2%) |
| Total | 23,760 (100.0%) | 24,157 (100.0%) |
Families and Households in Bothell
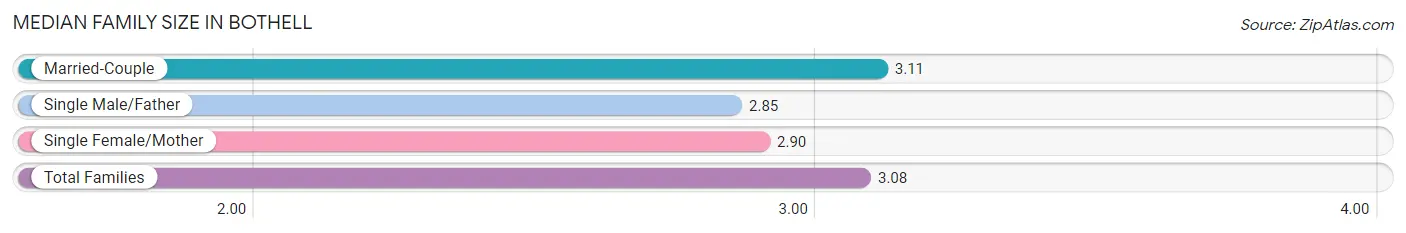
Median Family Size in Bothell
The median family size in Bothell is 3.08 persons per family, with married-couple families (10,857 | 86.3%) accounting for the largest median family size of 3.11 persons per family. On the other hand, single male/father families (624 | 5.0%) represent the smallest median family size with 2.85 persons per family.
| Family Type | # Families | Family Size |
| Married-Couple | 10,857 (86.3%) | 3.11 |
| Single Male/Father | 624 (5.0%) | 2.85 |
| Single Female/Mother | 1,096 (8.7%) | 2.90 |
| Total Families | 12,577 (100.0%) | 3.08 |
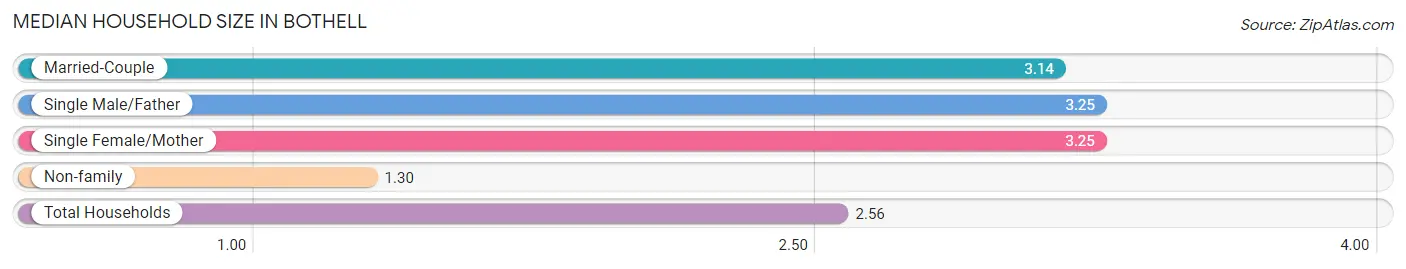
Median Household Size in Bothell
The median household size in Bothell is 2.56 persons per household, with single male/father households (624 | 3.4%) accounting for the largest median household size of 3.25 persons per household. non-family households (5,850 | 31.8%) represent the smallest median household size with 1.30 persons per household.
| Household Type | # Households | Household Size |
| Married-Couple | 10,857 (58.9%) | 3.14 |
| Single Male/Father | 624 (3.4%) | 3.25 |
| Single Female/Mother | 1,096 (5.9%) | 3.25 |
| Non-family | 5,850 (31.8%) | 1.30 |
| Total Households | 18,427 (100.0%) | 2.56 |
Household Size by Marriage Status in Bothell
Out of a total of 18,427 households in Bothell, 12,577 (68.2%) are family households, while 5,850 (31.8%) are nonfamily households. The most numerous type of family households are 2-person households, comprising 4,834, and the most common type of nonfamily households are 1-person households, comprising 4,459.
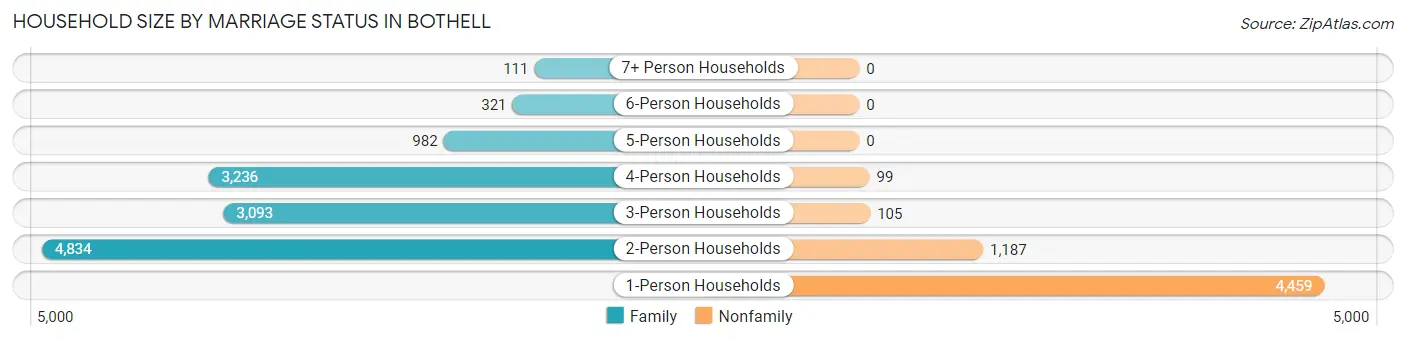
| Household Size | Family Households | Nonfamily Households |
| 1-Person Households | - | 4,459 (24.2%) |
| 2-Person Households | 4,834 (26.2%) | 1,187 (6.4%) |
| 3-Person Households | 3,093 (16.8%) | 105 (0.6%) |
| 4-Person Households | 3,236 (17.6%) | 99 (0.5%) |
| 5-Person Households | 982 (5.3%) | 0 (0.0%) |
| 6-Person Households | 321 (1.7%) | 0 (0.0%) |
| 7+ Person Households | 111 (0.6%) | 0 (0.0%) |
| Total | 12,577 (68.2%) | 5,850 (31.8%) |
Female Fertility in Bothell
Fertility by Age in Bothell
Average fertility rate in Bothell is 44.0 births per 1,000 women. Women in the age bracket of 20 to 34 years have the highest fertility rate with 55.0 births per 1,000 women. Women in the age bracket of 35 to 50 years acount for 55.7% of all women with births.
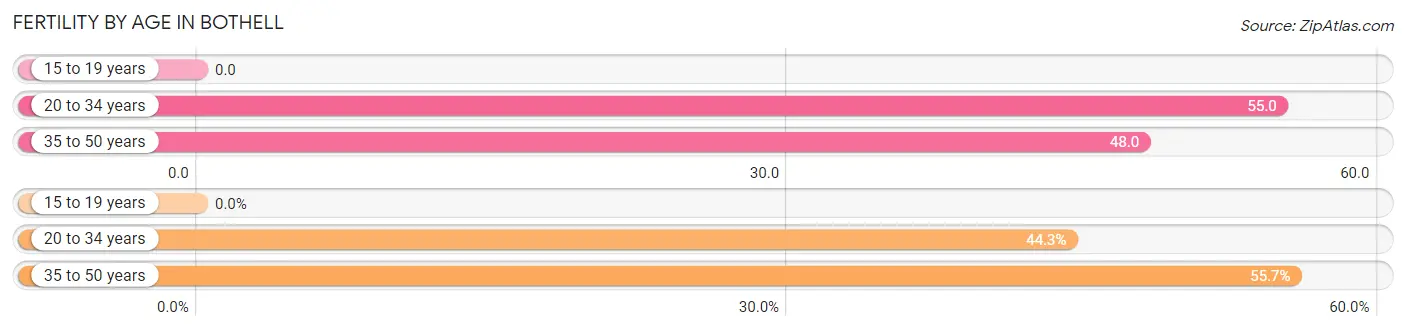
| Age Bracket | Women with Births | Births / 1,000 Women |
| 15 to 19 years | 0 (0.0%) | 0.0 |
| 20 to 34 years | 233 (44.3%) | 55.0 |
| 35 to 50 years | 293 (55.7%) | 48.0 |
| Total | 526 (100.0%) | 44.0 |
Fertility by Age by Marriage Status in Bothell
89.4% of women with births (526) in Bothell are married. The highest percentage of unmarried women with births falls into 20 to 34 years age bracket with 15.9% of them unmarried at the time of birth, while the lowest percentage of unmarried women with births belong to 35 to 50 years age bracket with 6.5% of them unmarried.
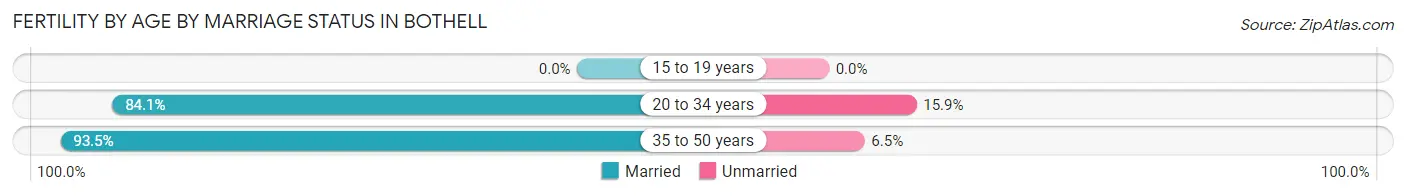
| Age Bracket | Married | Unmarried |
| 15 to 19 years | 0 (0.0%) | 0 (0.0%) |
| 20 to 34 years | 196 (84.1%) | 37 (15.9%) |
| 35 to 50 years | 274 (93.5%) | 19 (6.5%) |
| Total | 470 (89.3%) | 56 (10.6%) |
Fertility by Education in Bothell
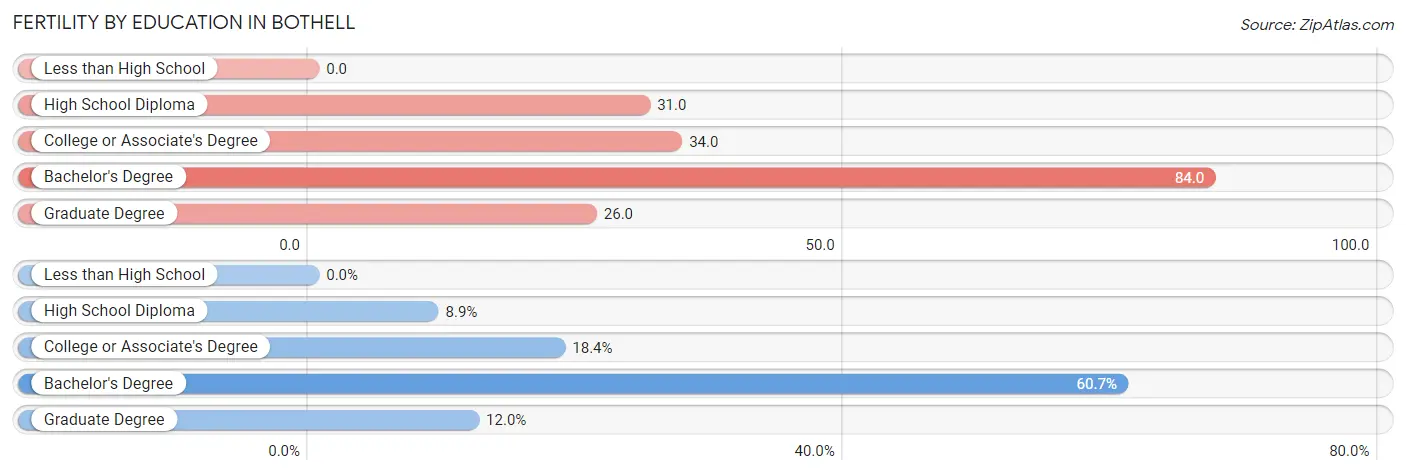
| Educational Attainment | Women with Births | Births / 1,000 Women |
| Less than High School | 0 (0.0%) | 0.0 |
| High School Diploma | 47 (8.9%) | 31.0 |
| College or Associate's Degree | 97 (18.4%) | 34.0 |
| Bachelor's Degree | 319 (60.7%) | 84.0 |
| Graduate Degree | 63 (12.0%) | 26.0 |
| Total | 526 (100.0%) | 44.0 |
Fertility by Education by Marriage Status in Bothell
10.6% of women with births in Bothell are unmarried. Women with the educational attainment of graduate degree are most likely to be married with 100.0% of them married at childbirth, while women with the educational attainment of high school diploma are least likely to be married with 34.0% of them unmarried at childbirth.
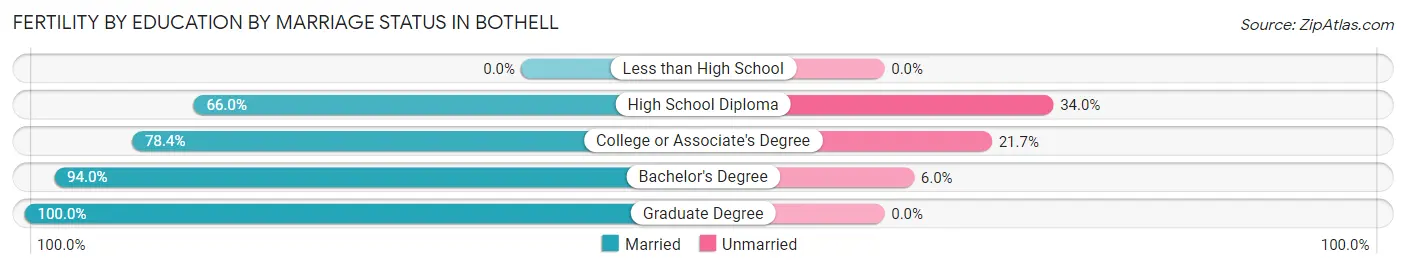
| Educational Attainment | Married | Unmarried |
| Less than High School | 0 (0.0%) | 0 (0.0%) |
| High School Diploma | 31 (66.0%) | 16 (34.0%) |
| College or Associate's Degree | 76 (78.3%) | 21 (21.6%) |
| Bachelor's Degree | 300 (94.0%) | 19 (6.0%) |
| Graduate Degree | 63 (100.0%) | 0 (0.0%) |
| Total | 470 (89.3%) | 56 (10.6%) |
Employment Characteristics in Bothell
Employment by Class of Employer in Bothell
Among the 25,202 employed individuals in Bothell, private company employees (18,624 | 73.9%), not-for-profit organizations (1,706 | 6.8%), and self-employed (not incorporated) (1,468 | 5.8%) make up the most common classes of employment.
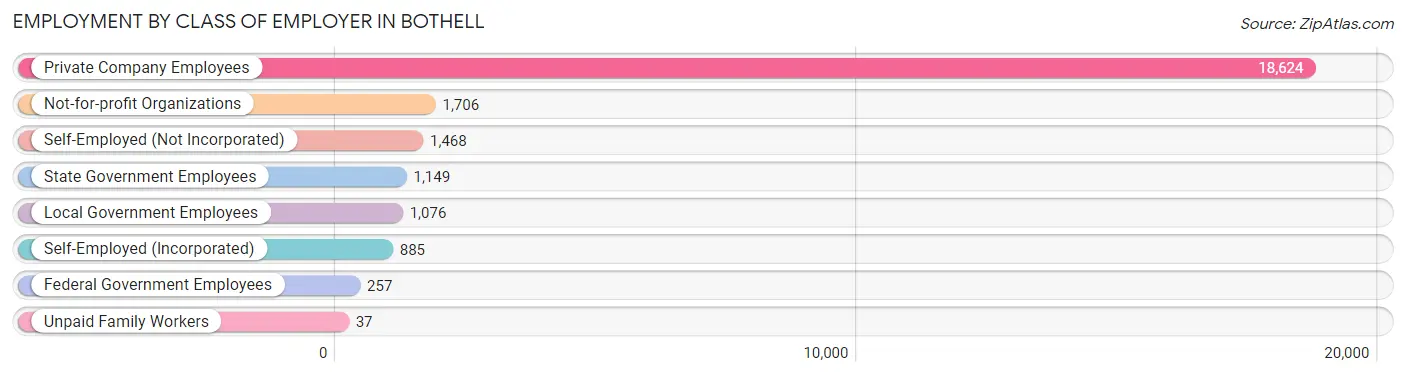
| Employer Class | # Employees | % Employees |
| Private Company Employees | 18,624 | 73.9% |
| Self-Employed (Incorporated) | 885 | 3.5% |
| Self-Employed (Not Incorporated) | 1,468 | 5.8% |
| Not-for-profit Organizations | 1,706 | 6.8% |
| Local Government Employees | 1,076 | 4.3% |
| State Government Employees | 1,149 | 4.6% |
| Federal Government Employees | 257 | 1.0% |
| Unpaid Family Workers | 37 | 0.2% |
| Total | 25,202 | 100.0% |
Employment Status by Age in Bothell
According to the labor force statistics for Bothell, out of the total population over 16 years of age (37,721), 71.5% or 26,971 individuals are in the labor force, with 3.9% or 1,052 of them unemployed. The age group with the highest labor force participation rate is 25 to 29 years, with 88.7% or 2,924 individuals in the labor force. Within the labor force, the 16 to 19 years age range has the highest percentage of unemployed individuals, with 13.7% or 158 of them being unemployed.
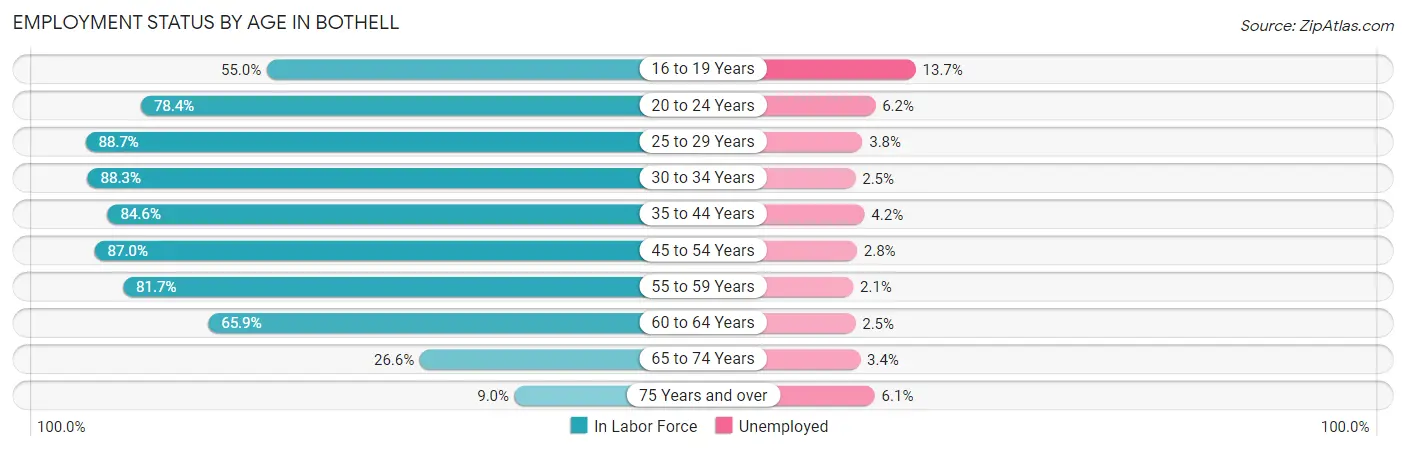
| Age Bracket | In Labor Force | Unemployed |
| 16 to 19 Years | 1,156 (55.0%) | 158 (13.7%) |
| 20 to 24 Years | 1,506 (78.4%) | 93 (6.2%) |
| 25 to 29 Years | 2,924 (88.7%) | 111 (3.8%) |
| 30 to 34 Years | 3,248 (88.3%) | 81 (2.5%) |
| 35 to 44 Years | 7,439 (84.6%) | 312 (4.2%) |
| 45 to 54 Years | 5,579 (87.0%) | 156 (2.8%) |
| 55 to 59 Years | 2,296 (81.7%) | 48 (2.1%) |
| 60 to 64 Years | 1,560 (65.9%) | 39 (2.5%) |
| 65 to 74 Years | 1,058 (26.6%) | 36 (3.4%) |
| 75 Years and over | 212 (9.0%) | 13 (6.1%) |
| Total | 26,971 (71.5%) | 1,052 (3.9%) |
Employment Status by Educational Attainment in Bothell
According to labor force statistics for Bothell, 84.2% of individuals (23,035) out of the total population between 25 and 64 years of age (27,358) are in the labor force, with 3.3% or 760 of them being unemployed. The group with the highest labor force participation rate are those with the educational attainment of bachelor's degree or higher, with 88.4% or 14,339 individuals in the labor force. Within the labor force, individuals with high school diploma education have the highest percentage of unemployment, with 9.9% or 208 of them being unemployed.
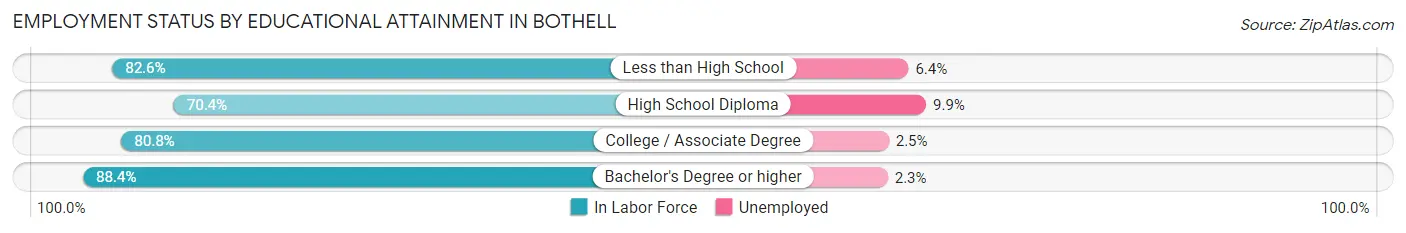
| Educational Attainment | In Labor Force | Unemployed |
| Less than High School | 1,042 (82.6%) | 81 (6.4%) |
| High School Diploma | 2,096 (70.4%) | 295 (9.9%) |
| College / Associate Degree | 5,574 (80.8%) | 172 (2.5%) |
| Bachelor's Degree or higher | 14,339 (88.4%) | 373 (2.3%) |
| Total | 23,035 (84.2%) | 903 (3.3%) |
Employment Occupations by Sex in Bothell
Management, Business, Science and Arts Occupations
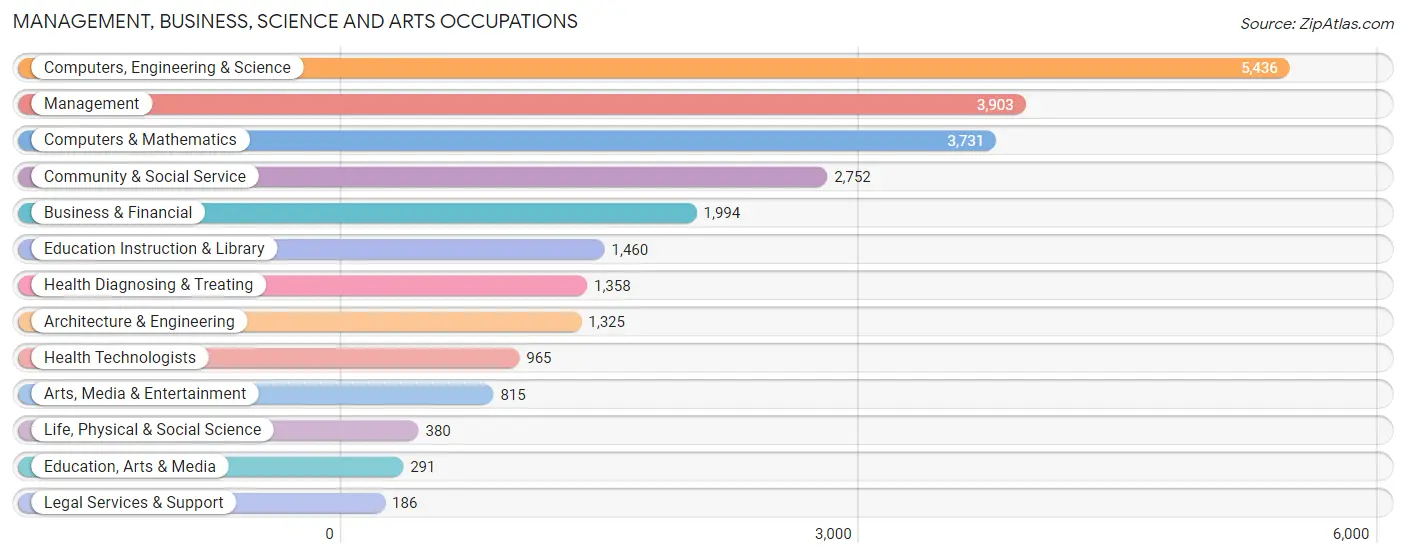
The most common Management, Business, Science and Arts occupations in Bothell are Computers, Engineering & Science (5,436 | 21.0%), Management (3,903 | 15.0%), Computers & Mathematics (3,731 | 14.4%), Community & Social Service (2,752 | 10.6%), and Business & Financial (1,994 | 7.7%).
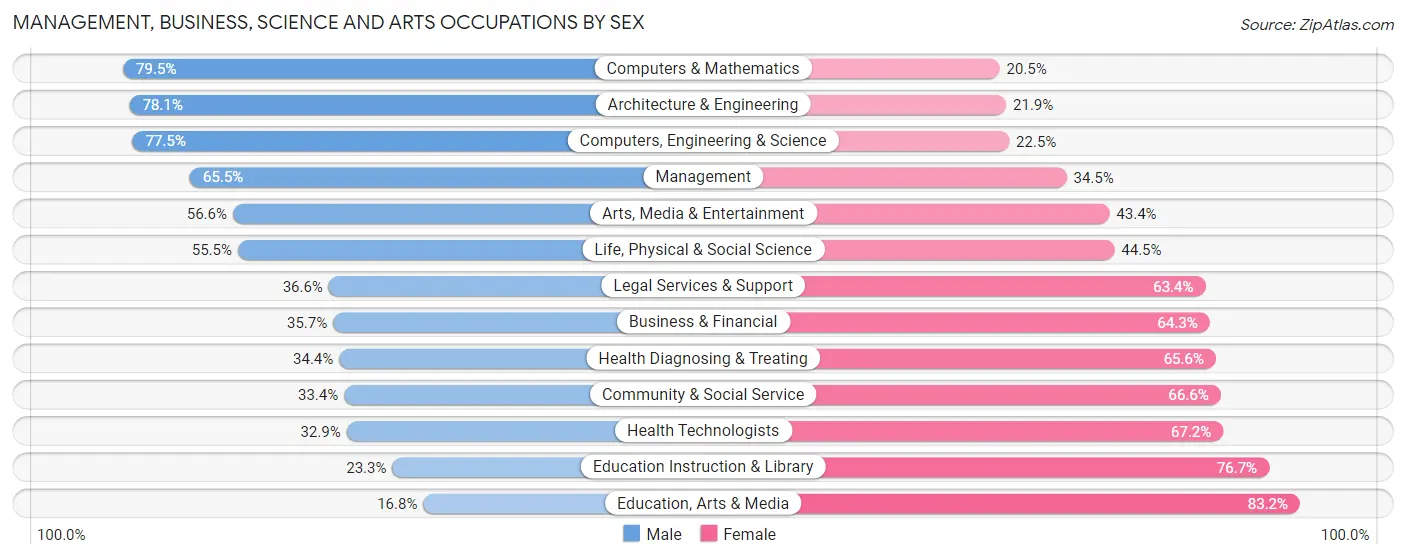
Management, Business, Science and Arts Occupations by Sex
Within the Management, Business, Science and Arts occupations in Bothell, the most male-oriented occupations are Computers & Mathematics (79.5%), Architecture & Engineering (78.1%), and Computers, Engineering & Science (77.5%), while the most female-oriented occupations are Education, Arts & Media (83.2%), Education Instruction & Library (76.7%), and Health Technologists (67.1%).
| Occupation | Male | Female |
| Management | 2,557 (65.5%) | 1,346 (34.5%) |
| Business & Financial | 711 (35.7%) | 1,283 (64.3%) |
| Computers, Engineering & Science | 4,211 (77.5%) | 1,225 (22.5%) |
| Computers & Mathematics | 2,965 (79.5%) | 766 (20.5%) |
| Architecture & Engineering | 1,035 (78.1%) | 290 (21.9%) |
| Life, Physical & Social Science | 211 (55.5%) | 169 (44.5%) |
| Community & Social Service | 918 (33.4%) | 1,834 (66.6%) |
| Education, Arts & Media | 49 (16.8%) | 242 (83.2%) |
| Legal Services & Support | 68 (36.6%) | 118 (63.4%) |
| Education Instruction & Library | 340 (23.3%) | 1,120 (76.7%) |
| Arts, Media & Entertainment | 461 (56.6%) | 354 (43.4%) |
| Health Diagnosing & Treating | 467 (34.4%) | 891 (65.6%) |
| Health Technologists | 317 (32.9%) | 648 (67.1%) |
| Total (Category) | 8,864 (57.4%) | 6,579 (42.6%) |
| Total (Overall) | 14,348 (55.3%) | 11,586 (44.7%) |
Services Occupations
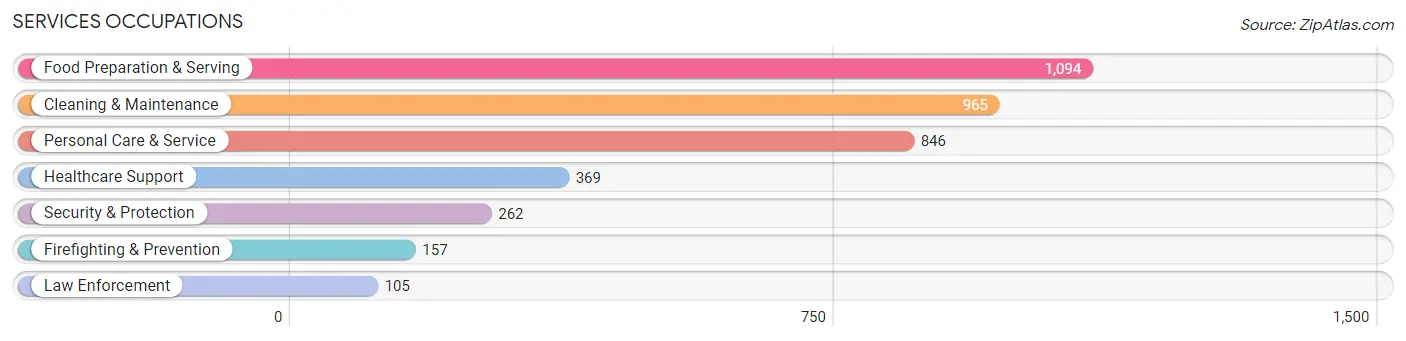
The most common Services occupations in Bothell are Food Preparation & Serving (1,094 | 4.2%), Cleaning & Maintenance (965 | 3.7%), Personal Care & Service (846 | 3.3%), Healthcare Support (369 | 1.4%), and Security & Protection (262 | 1.0%).
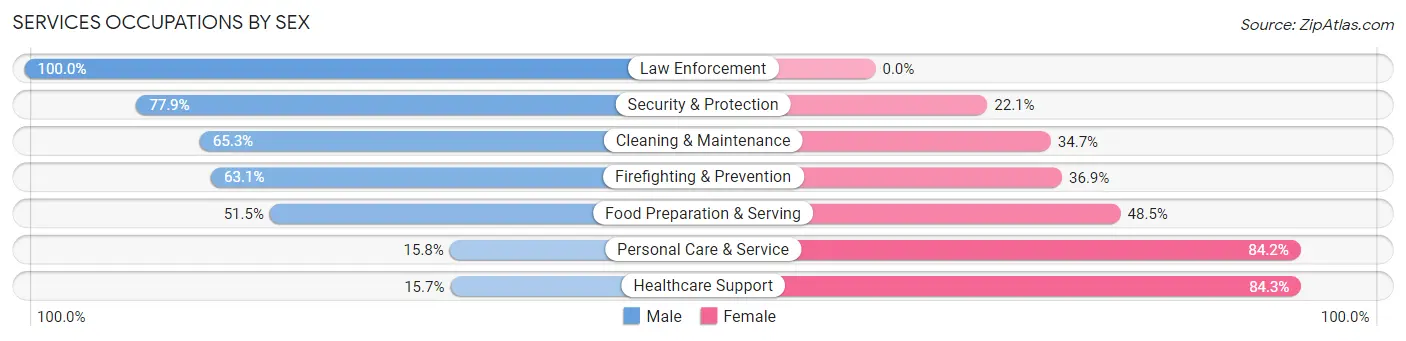
Services Occupations by Sex
Within the Services occupations in Bothell, the most male-oriented occupations are Law Enforcement (100.0%), Security & Protection (77.9%), and Cleaning & Maintenance (65.3%), while the most female-oriented occupations are Healthcare Support (84.3%), Personal Care & Service (84.2%), and Food Preparation & Serving (48.5%).
| Occupation | Male | Female |
| Healthcare Support | 58 (15.7%) | 311 (84.3%) |
| Security & Protection | 204 (77.9%) | 58 (22.1%) |
| Firefighting & Prevention | 99 (63.1%) | 58 (36.9%) |
| Law Enforcement | 105 (100.0%) | 0 (0.0%) |
| Food Preparation & Serving | 563 (51.5%) | 531 (48.5%) |
| Cleaning & Maintenance | 630 (65.3%) | 335 (34.7%) |
| Personal Care & Service | 134 (15.8%) | 712 (84.2%) |
| Total (Category) | 1,589 (44.9%) | 1,947 (55.1%) |
| Total (Overall) | 14,348 (55.3%) | 11,586 (44.7%) |
Sales and Office Occupations
The most common Sales and Office occupations in Bothell are Office & Administration (2,229 | 8.6%), and Sales & Related (1,997 | 7.7%).
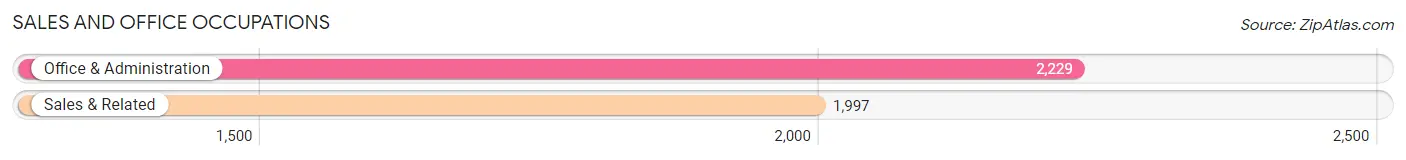
Sales and Office Occupations by Sex
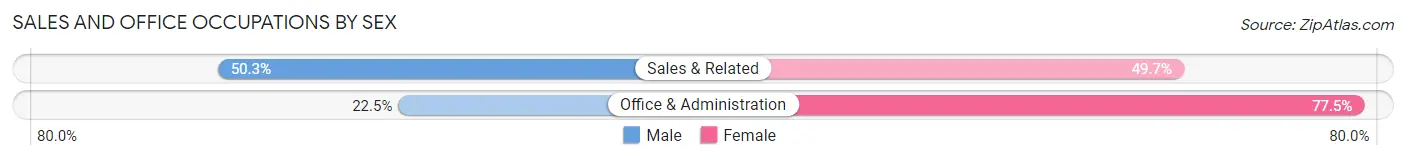
| Occupation | Male | Female |
| Sales & Related | 1,004 (50.3%) | 993 (49.7%) |
| Office & Administration | 502 (22.5%) | 1,727 (77.5%) |
| Total (Category) | 1,506 (35.6%) | 2,720 (64.4%) |
| Total (Overall) | 14,348 (55.3%) | 11,586 (44.7%) |
Natural Resources, Construction and Maintenance Occupations
The most common Natural Resources, Construction and Maintenance occupations in Bothell are Construction & Extraction (1,017 | 3.9%), Installation, Maintenance & Repair (318 | 1.2%), and Farming, Fishing & Forestry (60 | 0.2%).
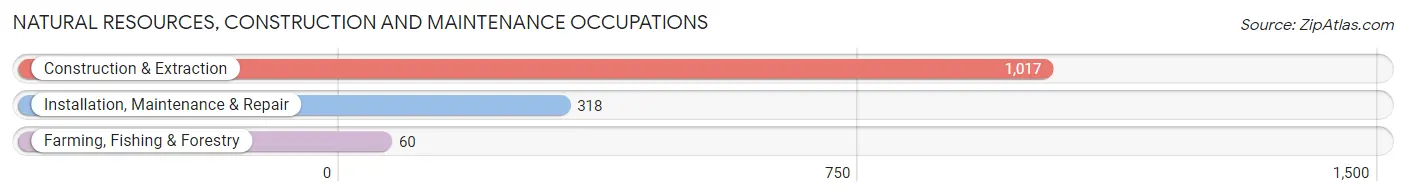
Natural Resources, Construction and Maintenance Occupations by Sex
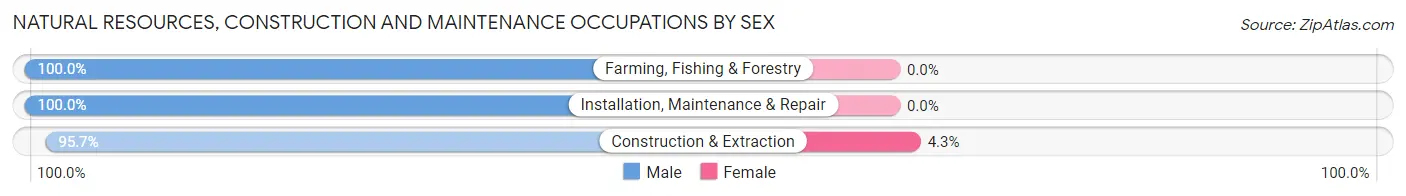
| Occupation | Male | Female |
| Farming, Fishing & Forestry | 60 (100.0%) | 0 (0.0%) |
| Construction & Extraction | 973 (95.7%) | 44 (4.3%) |
| Installation, Maintenance & Repair | 318 (100.0%) | 0 (0.0%) |
| Total (Category) | 1,351 (96.9%) | 44 (3.2%) |
| Total (Overall) | 14,348 (55.3%) | 11,586 (44.7%) |
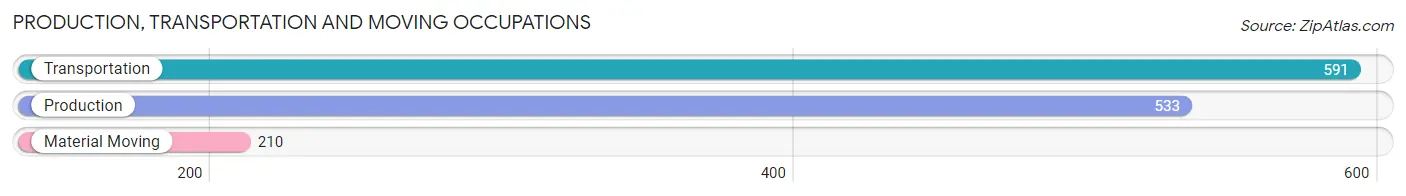
Production, Transportation and Moving Occupations
The most common Production, Transportation and Moving occupations in Bothell are Transportation (591 | 2.3%), Production (533 | 2.1%), and Material Moving (210 | 0.8%).
Production, Transportation and Moving Occupations by Sex
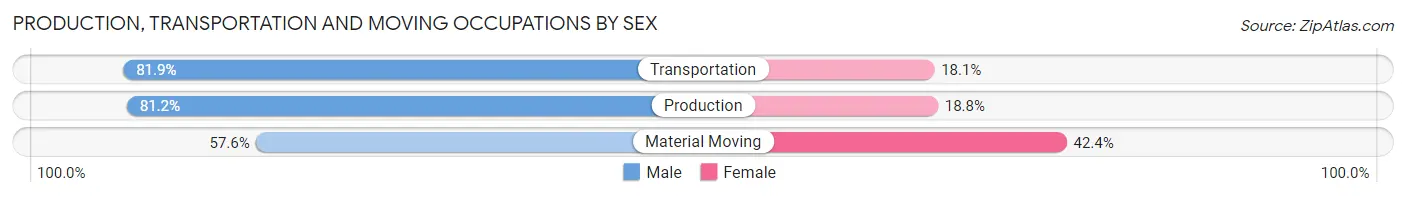
| Occupation | Male | Female |
| Production | 433 (81.2%) | 100 (18.8%) |
| Transportation | 484 (81.9%) | 107 (18.1%) |
| Material Moving | 121 (57.6%) | 89 (42.4%) |
| Total (Category) | 1,038 (77.8%) | 296 (22.2%) |
| Total (Overall) | 14,348 (55.3%) | 11,586 (44.7%) |
Employment Industries by Sex in Bothell
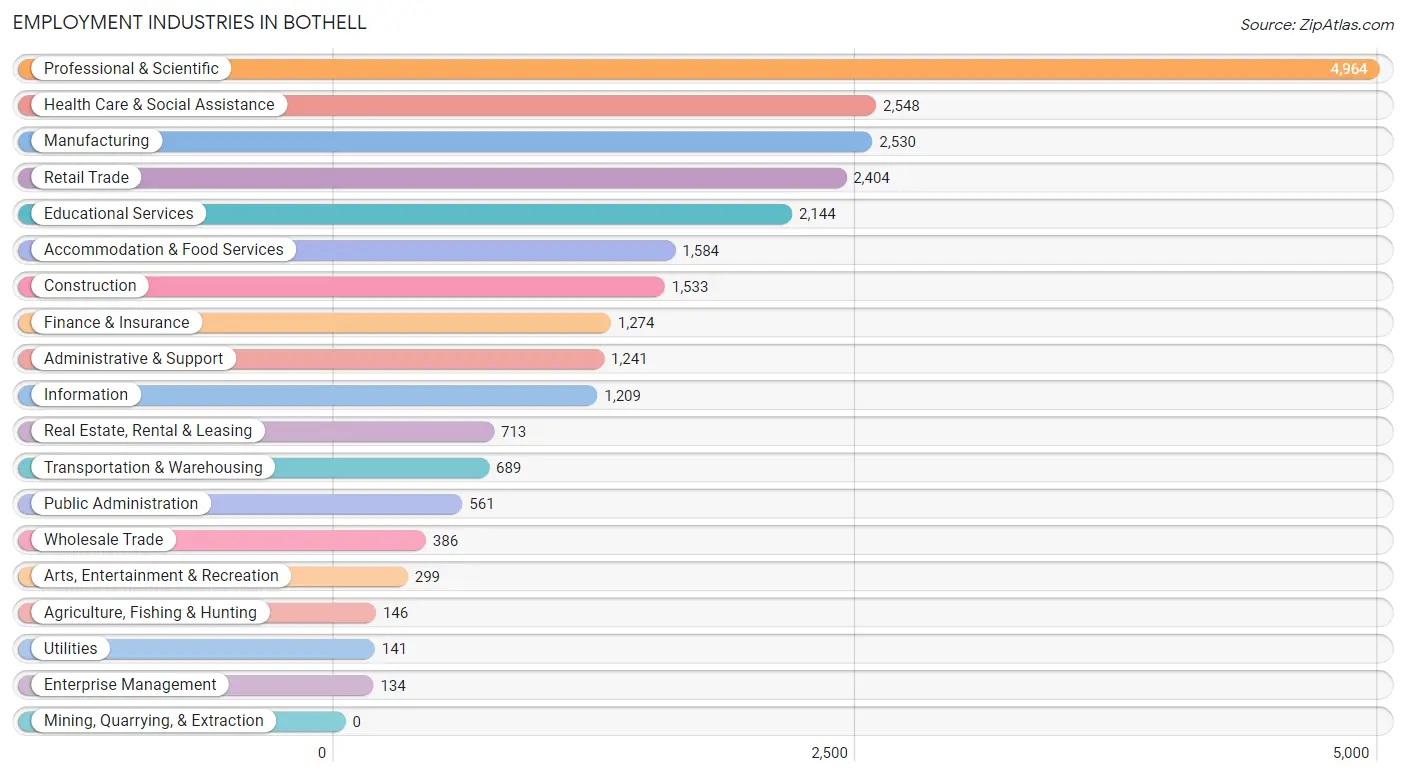
Employment Industries in Bothell
The major employment industries in Bothell include Professional & Scientific (4,964 | 19.1%), Health Care & Social Assistance (2,548 | 9.8%), Manufacturing (2,530 | 9.8%), Retail Trade (2,404 | 9.3%), and Educational Services (2,144 | 8.3%).
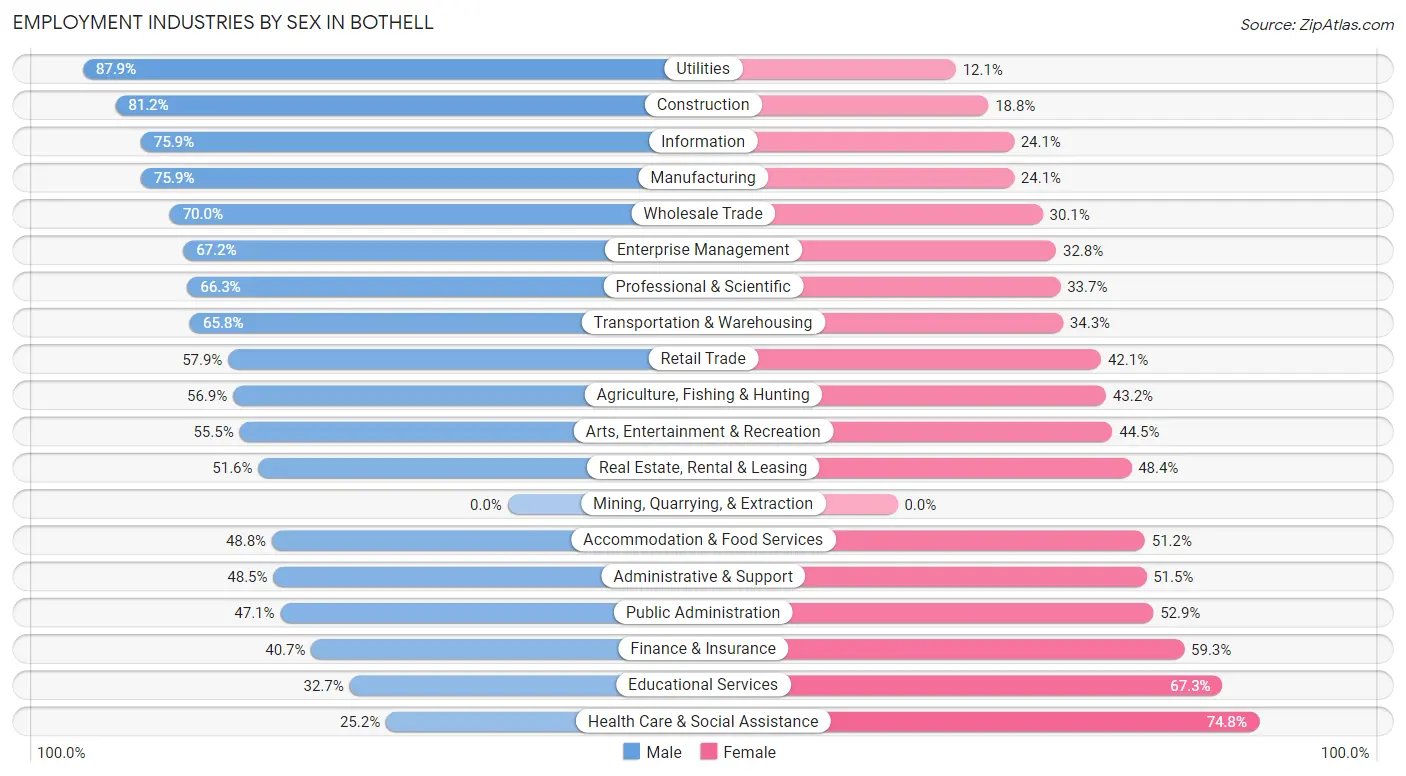
Employment Industries by Sex in Bothell
The Bothell industries that see more men than women are Utilities (87.9%), Construction (81.2%), and Information (75.9%), whereas the industries that tend to have a higher number of women are Health Care & Social Assistance (74.8%), Educational Services (67.3%), and Finance & Insurance (59.3%).
| Industry | Male | Female |
| Agriculture, Fishing & Hunting | 83 (56.9%) | 63 (43.1%) |
| Mining, Quarrying, & Extraction | 0 (0.0%) | 0 (0.0%) |
| Construction | 1,245 (81.2%) | 288 (18.8%) |
| Manufacturing | 1,920 (75.9%) | 610 (24.1%) |
| Wholesale Trade | 270 (70.0%) | 116 (30.0%) |
| Retail Trade | 1,391 (57.9%) | 1,013 (42.1%) |
| Transportation & Warehousing | 453 (65.7%) | 236 (34.3%) |
| Utilities | 124 (87.9%) | 17 (12.1%) |
| Information | 918 (75.9%) | 291 (24.1%) |
| Finance & Insurance | 518 (40.7%) | 756 (59.3%) |
| Real Estate, Rental & Leasing | 368 (51.6%) | 345 (48.4%) |
| Professional & Scientific | 3,291 (66.3%) | 1,673 (33.7%) |
| Enterprise Management | 90 (67.2%) | 44 (32.8%) |
| Administrative & Support | 602 (48.5%) | 639 (51.5%) |
| Educational Services | 702 (32.7%) | 1,442 (67.3%) |
| Health Care & Social Assistance | 642 (25.2%) | 1,906 (74.8%) |
| Arts, Entertainment & Recreation | 166 (55.5%) | 133 (44.5%) |
| Accommodation & Food Services | 773 (48.8%) | 811 (51.2%) |
| Public Administration | 264 (47.1%) | 297 (52.9%) |
| Total | 14,348 (55.3%) | 11,586 (44.7%) |
Education in Bothell
School Enrollment in Bothell
The most common levels of schooling among the 11,953 students in Bothell are elementary school (3,050 | 25.5%), middle school (2,266 | 19.0%), and high school (2,101 | 17.6%).
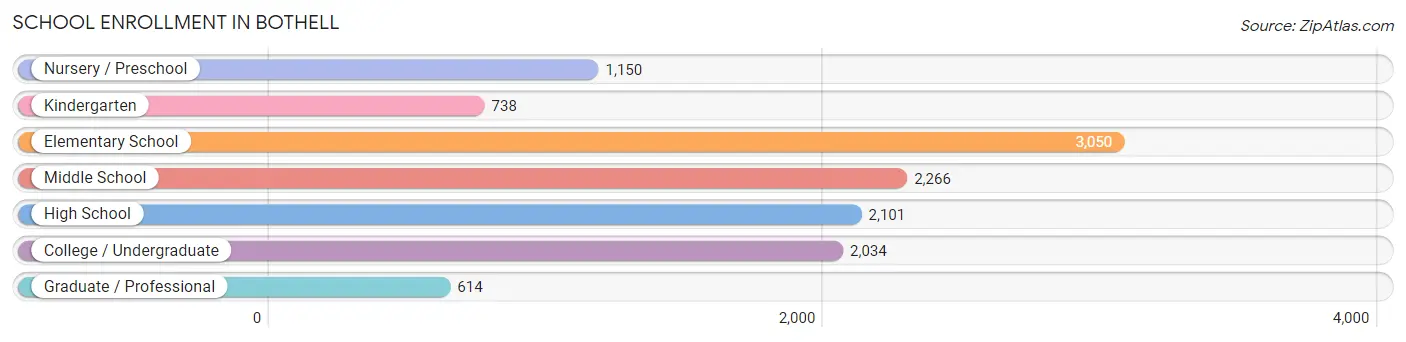
| School Level | # Students | % Students |
| Nursery / Preschool | 1,150 | 9.6% |
| Kindergarten | 738 | 6.2% |
| Elementary School | 3,050 | 25.5% |
| Middle School | 2,266 | 19.0% |
| High School | 2,101 | 17.6% |
| College / Undergraduate | 2,034 | 17.0% |
| Graduate / Professional | 614 | 5.1% |
| Total | 11,953 | 100.0% |
School Enrollment by Age by Funding Source in Bothell
Out of a total of 11,953 students who are enrolled in schools in Bothell, 2,415 (20.2%) attend a private institution, while the remaining 9,538 (79.8%) are enrolled in public schools. The age group of 3 to 4 year olds has the highest likelihood of being enrolled in private schools, with 535 (69.6% in the age bracket) enrolled. Conversely, the age group of 15 to 17 year olds has the lowest likelihood of being enrolled in a private school, with 1,386 (92.8% in the age bracket) attending a public institution.
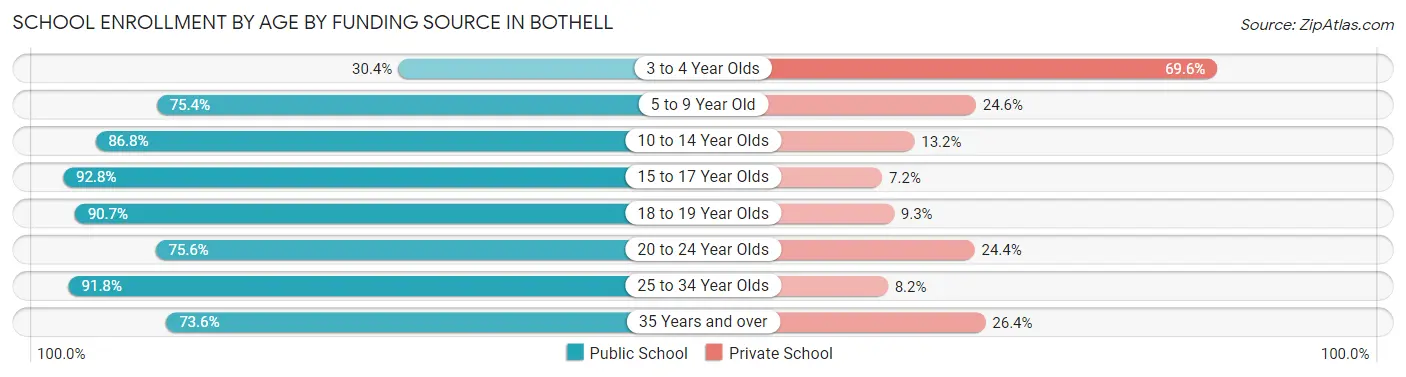
| Age Bracket | Public School | Private School |
| 3 to 4 Year Olds | 234 (30.4%) | 535 (69.6%) |
| 5 to 9 Year Old | 2,694 (75.4%) | 880 (24.6%) |
| 10 to 14 Year Olds | 2,718 (86.8%) | 412 (13.2%) |
| 15 to 17 Year Olds | 1,386 (92.8%) | 107 (7.2%) |
| 18 to 19 Year Olds | 874 (90.7%) | 90 (9.3%) |
| 20 to 24 Year Olds | 552 (75.6%) | 178 (24.4%) |
| 25 to 34 Year Olds | 627 (91.8%) | 56 (8.2%) |
| 35 Years and over | 449 (73.6%) | 161 (26.4%) |
| Total | 9,538 (79.8%) | 2,415 (20.2%) |
Educational Attainment by Field of Study in Bothell
Business (3,415 | 16.6%), engineering (3,163 | 15.4%), computers & mathematics (2,282 | 11.1%), science & technology (1,482 | 7.2%), and social sciences (1,463 | 7.1%) are the most common fields of study among 20,568 individuals in Bothell who have obtained a bachelor's degree or higher.
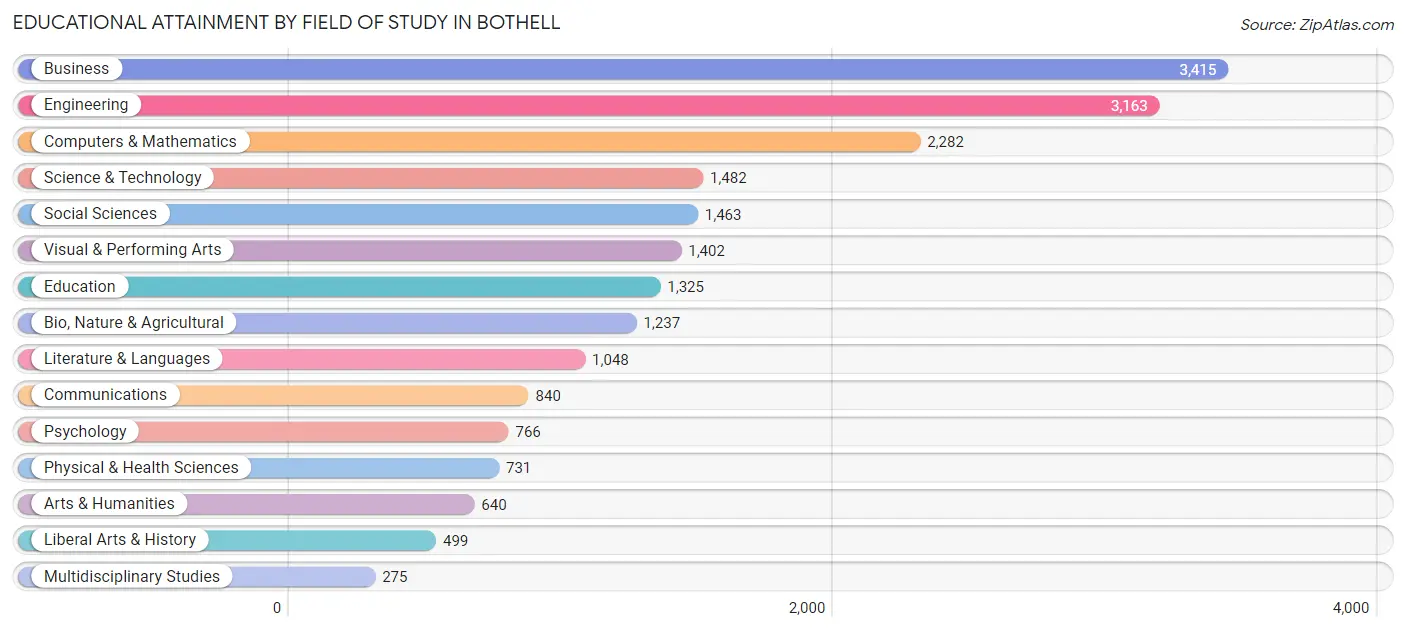
| Field of Study | # Graduates | % Graduates |
| Computers & Mathematics | 2,282 | 11.1% |
| Bio, Nature & Agricultural | 1,237 | 6.0% |
| Physical & Health Sciences | 731 | 3.5% |
| Psychology | 766 | 3.7% |
| Social Sciences | 1,463 | 7.1% |
| Engineering | 3,163 | 15.4% |
| Multidisciplinary Studies | 275 | 1.3% |
| Science & Technology | 1,482 | 7.2% |
| Business | 3,415 | 16.6% |
| Education | 1,325 | 6.4% |
| Literature & Languages | 1,048 | 5.1% |
| Liberal Arts & History | 499 | 2.4% |
| Visual & Performing Arts | 1,402 | 6.8% |
| Communications | 840 | 4.1% |
| Arts & Humanities | 640 | 3.1% |
| Total | 20,568 | 100.0% |
Transportation & Commute in Bothell
Vehicle Availability by Sex in Bothell
The most prevalent vehicle ownership categories in Bothell are males with 2 vehicles (6,576, accounting for 47.3%) and females with 2 vehicles (5,228, making up 58.9%).
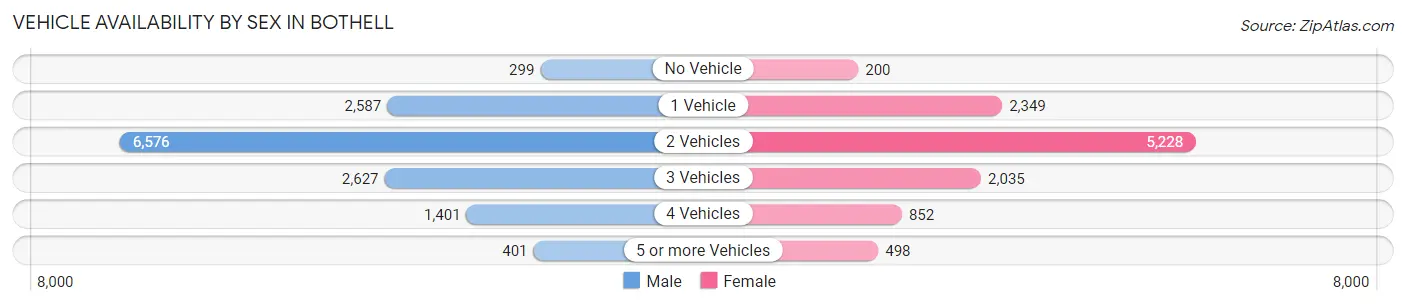
| Vehicles Available | Male | Female |
| No Vehicle | 299 (2.1%) | 200 (1.8%) |
| 1 Vehicle | 2,587 (18.6%) | 2,349 (21.0%) |
| 2 Vehicles | 6,576 (47.3%) | 5,228 (46.8%) |
| 3 Vehicles | 2,627 (18.9%) | 2,035 (18.2%) |
| 4 Vehicles | 1,401 (10.1%) | 852 (7.6%) |
| 5 or more Vehicles | 401 (2.9%) | 498 (4.5%) |
| Total | 13,891 (100.0%) | 11,162 (100.0%) |
Commute Time in Bothell
The most frequently occuring commute durations in Bothell are 30 to 34 minutes (3,336 commuters, 18.0%), 20 to 24 minutes (2,505 commuters, 13.5%), and 15 to 19 minutes (2,242 commuters, 12.1%).
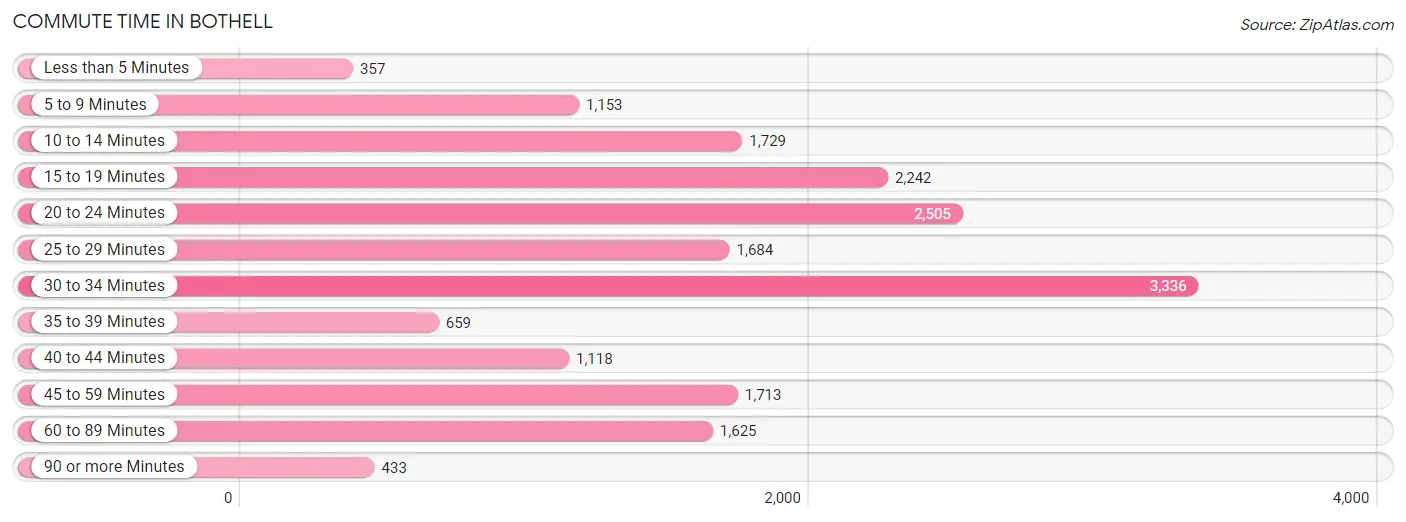
| Commute Time | # Commuters | % Commuters |
| Less than 5 Minutes | 357 | 1.9% |
| 5 to 9 Minutes | 1,153 | 6.2% |
| 10 to 14 Minutes | 1,729 | 9.3% |
| 15 to 19 Minutes | 2,242 | 12.1% |
| 20 to 24 Minutes | 2,505 | 13.5% |
| 25 to 29 Minutes | 1,684 | 9.1% |
| 30 to 34 Minutes | 3,336 | 18.0% |
| 35 to 39 Minutes | 659 | 3.5% |
| 40 to 44 Minutes | 1,118 | 6.0% |
| 45 to 59 Minutes | 1,713 | 9.2% |
| 60 to 89 Minutes | 1,625 | 8.8% |
| 90 or more Minutes | 433 | 2.3% |
Commute Time by Sex in Bothell
The most common commute times in Bothell are 30 to 34 minutes (1,857 commuters, 17.8%) for males and 30 to 34 minutes (1,479 commuters, 18.2%) for females.
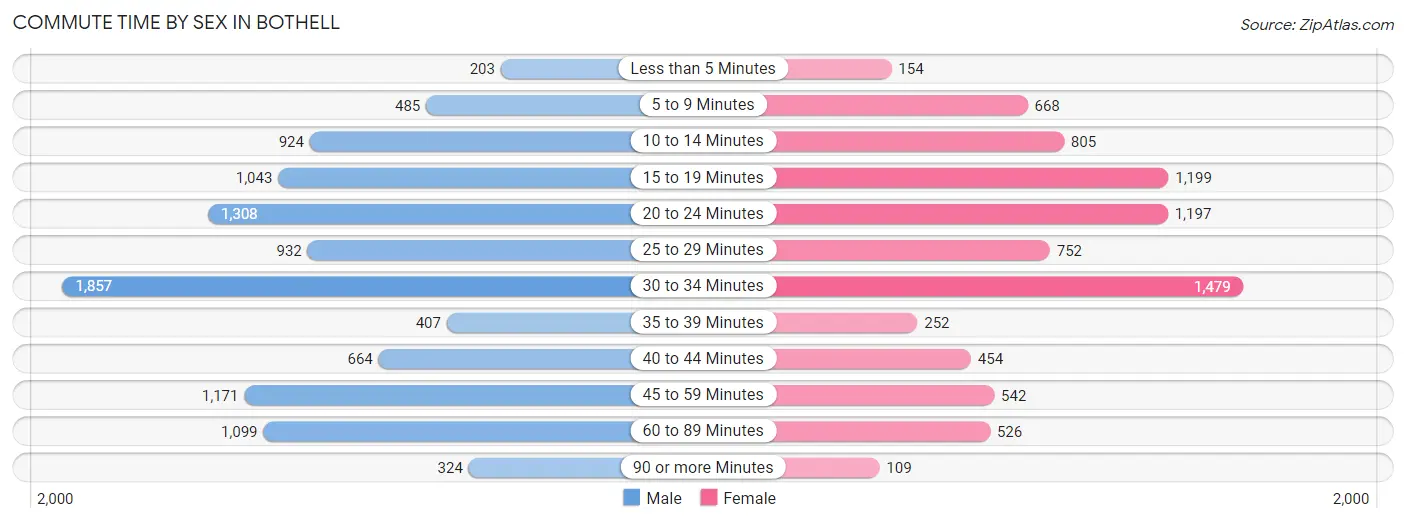
| Commute Time | Male | Female |
| Less than 5 Minutes | 203 (1.9%) | 154 (1.9%) |
| 5 to 9 Minutes | 485 (4.7%) | 668 (8.2%) |
| 10 to 14 Minutes | 924 (8.9%) | 805 (9.9%) |
| 15 to 19 Minutes | 1,043 (10.0%) | 1,199 (14.7%) |
| 20 to 24 Minutes | 1,308 (12.6%) | 1,197 (14.7%) |
| 25 to 29 Minutes | 932 (8.9%) | 752 (9.2%) |
| 30 to 34 Minutes | 1,857 (17.8%) | 1,479 (18.2%) |
| 35 to 39 Minutes | 407 (3.9%) | 252 (3.1%) |
| 40 to 44 Minutes | 664 (6.4%) | 454 (5.6%) |
| 45 to 59 Minutes | 1,171 (11.2%) | 542 (6.7%) |
| 60 to 89 Minutes | 1,099 (10.5%) | 526 (6.5%) |
| 90 or more Minutes | 324 (3.1%) | 109 (1.3%) |
Time of Departure to Work by Sex in Bothell
The most frequent times of departure to work in Bothell are 8:00 AM to 8:29 AM (1,570, 15.1%) for males and 7:00 AM to 7:29 AM (1,208, 14.8%) for females.
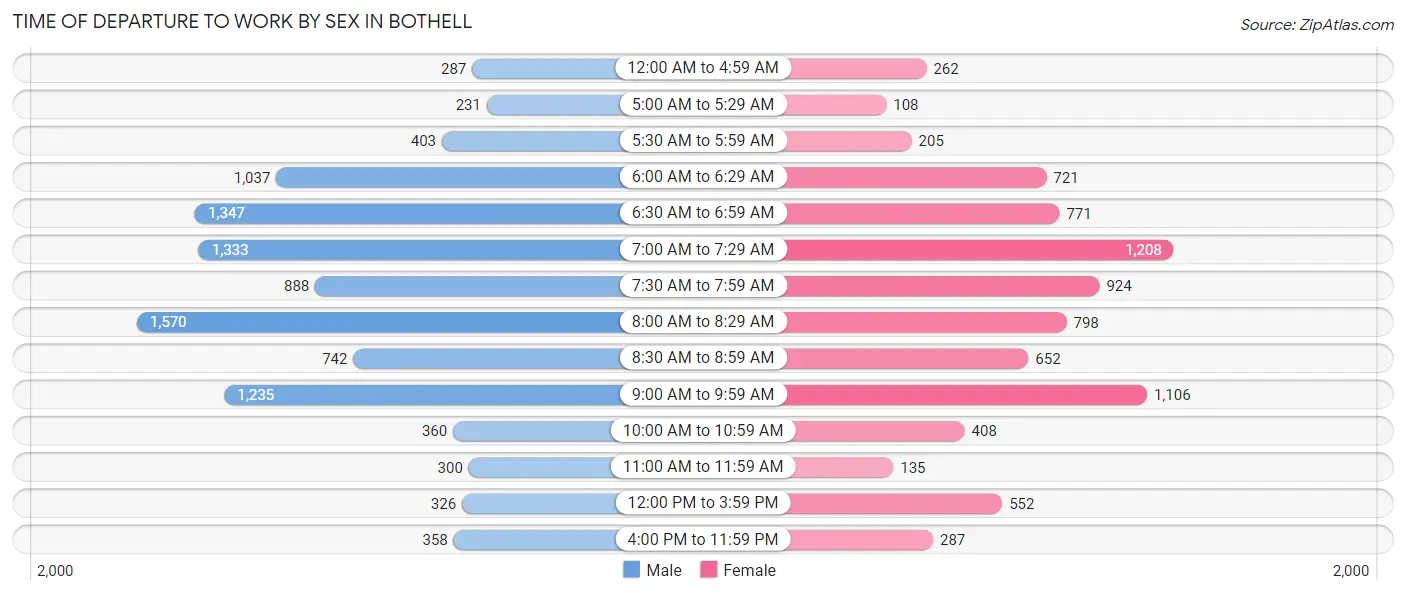
| Time of Departure | Male | Female |
| 12:00 AM to 4:59 AM | 287 (2.8%) | 262 (3.2%) |
| 5:00 AM to 5:29 AM | 231 (2.2%) | 108 (1.3%) |
| 5:30 AM to 5:59 AM | 403 (3.9%) | 205 (2.5%) |
| 6:00 AM to 6:29 AM | 1,037 (10.0%) | 721 (8.9%) |
| 6:30 AM to 6:59 AM | 1,347 (12.9%) | 771 (9.5%) |
| 7:00 AM to 7:29 AM | 1,333 (12.8%) | 1,208 (14.8%) |
| 7:30 AM to 7:59 AM | 888 (8.5%) | 924 (11.4%) |
| 8:00 AM to 8:29 AM | 1,570 (15.1%) | 798 (9.8%) |
| 8:30 AM to 8:59 AM | 742 (7.1%) | 652 (8.0%) |
| 9:00 AM to 9:59 AM | 1,235 (11.9%) | 1,106 (13.6%) |
| 10:00 AM to 10:59 AM | 360 (3.5%) | 408 (5.0%) |
| 11:00 AM to 11:59 AM | 300 (2.9%) | 135 (1.7%) |
| 12:00 PM to 3:59 PM | 326 (3.1%) | 552 (6.8%) |
| 4:00 PM to 11:59 PM | 358 (3.4%) | 287 (3.5%) |
| Total | 10,417 (100.0%) | 8,137 (100.0%) |
Housing Occupancy in Bothell
Occupancy by Ownership in Bothell
Of the total 18,427 dwellings in Bothell, owner-occupied units account for 11,791 (64.0%), while renter-occupied units make up 6,636 (36.0%).
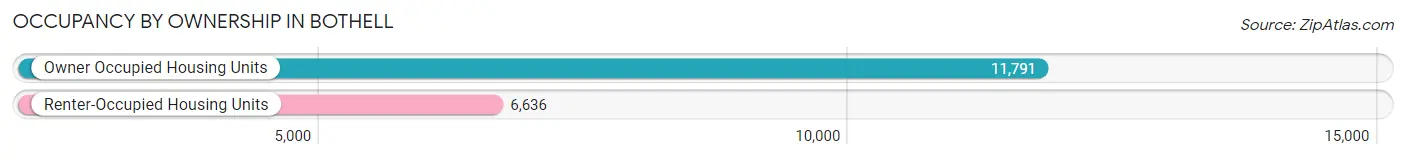
| Occupancy | # Housing Units | % Housing Units |
| Owner Occupied Housing Units | 11,791 | 64.0% |
| Renter-Occupied Housing Units | 6,636 | 36.0% |
| Total Occupied Housing Units | 18,427 | 100.0% |
Occupancy by Household Size in Bothell
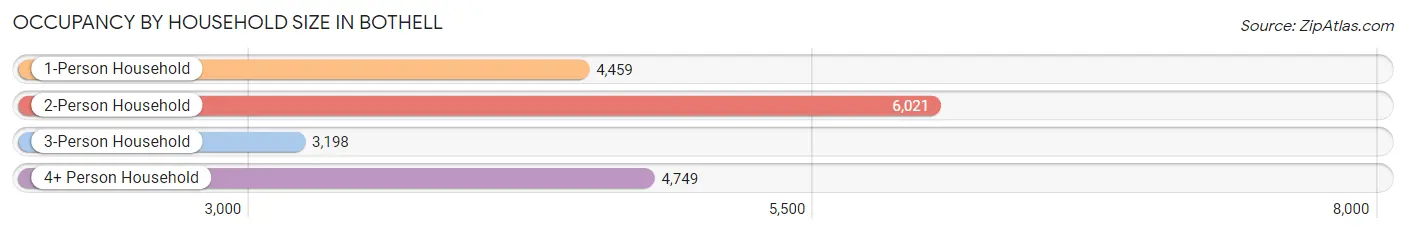
| Household Size | # Housing Units | % Housing Units |
| 1-Person Household | 4,459 | 24.2% |
| 2-Person Household | 6,021 | 32.7% |
| 3-Person Household | 3,198 | 17.3% |
| 4+ Person Household | 4,749 | 25.8% |
| Total Housing Units | 18,427 | 100.0% |
Occupancy by Ownership by Household Size in Bothell
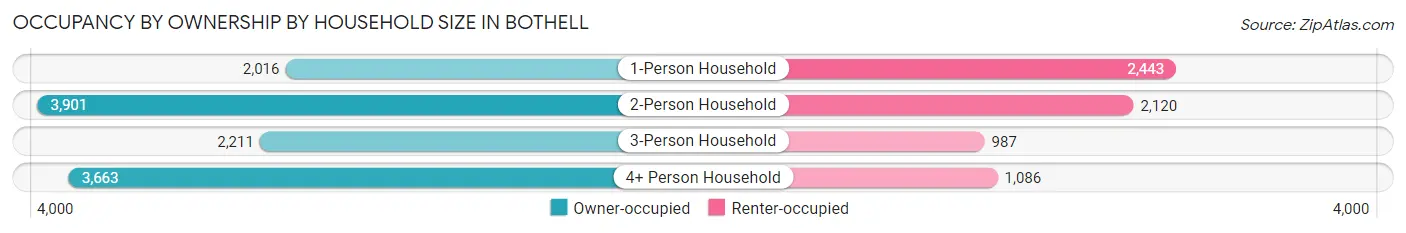
| Household Size | Owner-occupied | Renter-occupied |
| 1-Person Household | 2,016 (45.2%) | 2,443 (54.8%) |
| 2-Person Household | 3,901 (64.8%) | 2,120 (35.2%) |
| 3-Person Household | 2,211 (69.1%) | 987 (30.9%) |
| 4+ Person Household | 3,663 (77.1%) | 1,086 (22.9%) |
| Total Housing Units | 11,791 (64.0%) | 6,636 (36.0%) |
Occupancy by Educational Attainment in Bothell
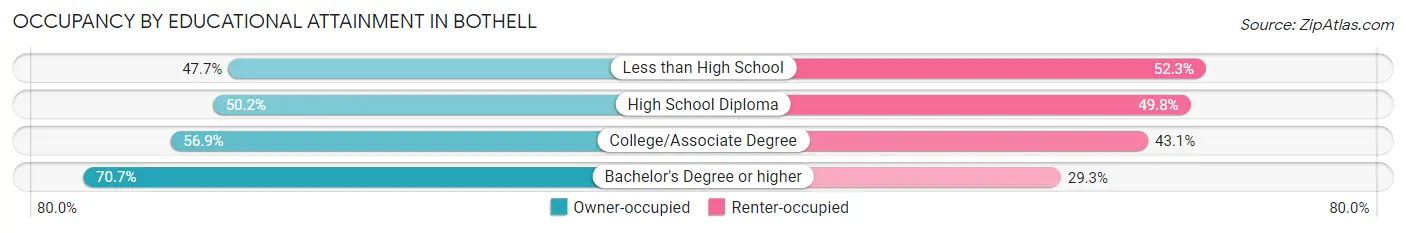
| Household Size | Owner-occupied | Renter-occupied |
| Less than High School | 302 (47.7%) | 331 (52.3%) |
| High School Diploma | 943 (50.2%) | 937 (49.8%) |
| College/Associate Degree | 2,907 (56.9%) | 2,205 (43.1%) |
| Bachelor's Degree or higher | 7,639 (70.7%) | 3,163 (29.3%) |
Occupancy by Age of Householder in Bothell
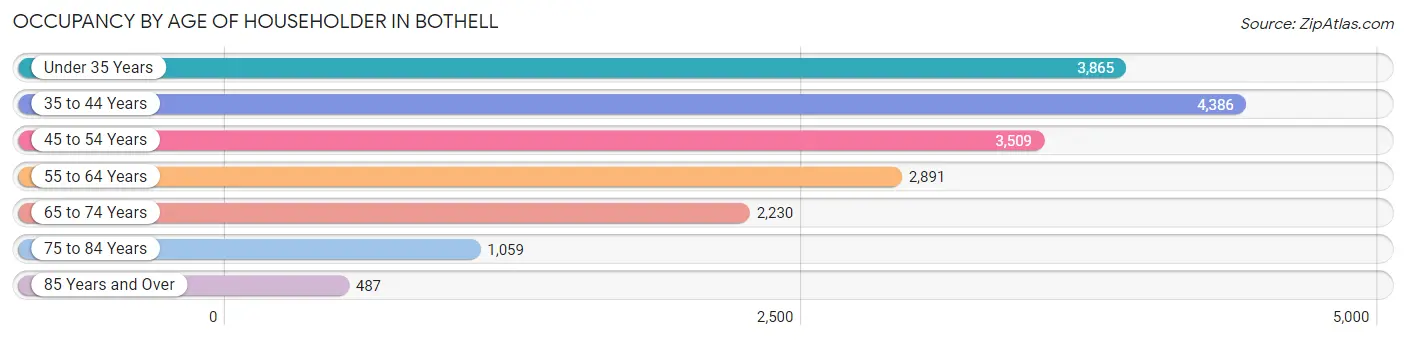
| Age Bracket | # Households | % Households |
| Under 35 Years | 3,865 | 21.0% |
| 35 to 44 Years | 4,386 | 23.8% |
| 45 to 54 Years | 3,509 | 19.0% |
| 55 to 64 Years | 2,891 | 15.7% |
| 65 to 74 Years | 2,230 | 12.1% |
| 75 to 84 Years | 1,059 | 5.8% |
| 85 Years and Over | 487 | 2.6% |
| Total | 18,427 | 100.0% |
Housing Finances in Bothell
Median Income by Occupancy in Bothell
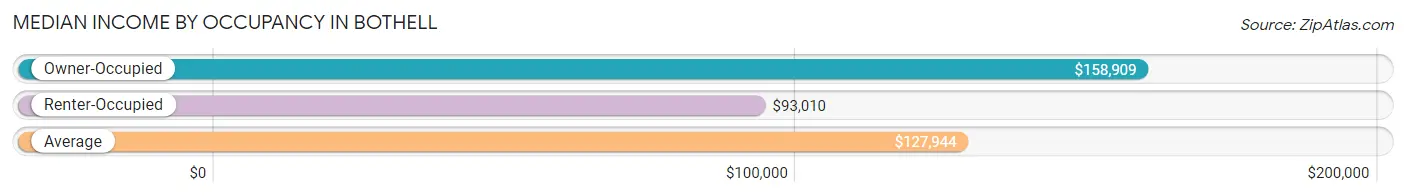
| Occupancy Type | # Households | Median Income |
| Owner-Occupied | 11,791 (64.0%) | $158,909 |
| Renter-Occupied | 6,636 (36.0%) | $93,010 |
| Average | 18,427 (100.0%) | $127,944 |
Occupancy by Householder Income Bracket in Bothell
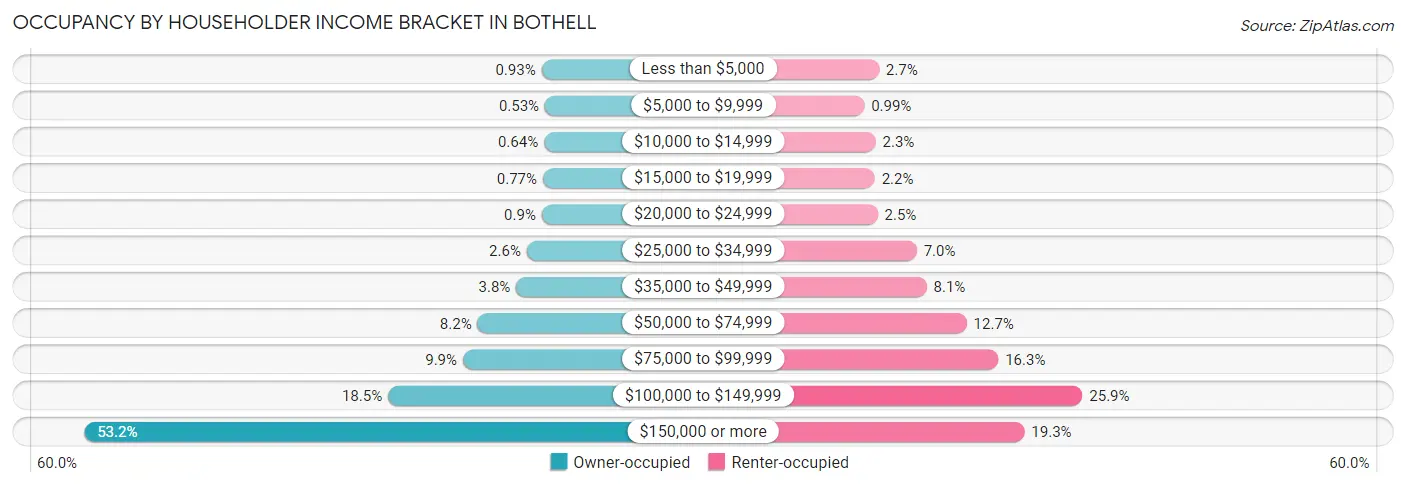
| Income Bracket | Owner-occupied | Renter-occupied |
| Less than $5,000 | 110 (0.9%) | 177 (2.7%) |
| $5,000 to $9,999 | 62 (0.5%) | 66 (1.0%) |
| $10,000 to $14,999 | 76 (0.6%) | 152 (2.3%) |
| $15,000 to $19,999 | 91 (0.8%) | 145 (2.2%) |
| $20,000 to $24,999 | 106 (0.9%) | 167 (2.5%) |
| $25,000 to $34,999 | 308 (2.6%) | 464 (7.0%) |
| $35,000 to $49,999 | 451 (3.8%) | 539 (8.1%) |
| $50,000 to $74,999 | 971 (8.2%) | 843 (12.7%) |
| $75,000 to $99,999 | 1,168 (9.9%) | 1,082 (16.3%) |
| $100,000 to $149,999 | 2,178 (18.5%) | 1,720 (25.9%) |
| $150,000 or more | 6,270 (53.2%) | 1,281 (19.3%) |
| Total | 11,791 (100.0%) | 6,636 (100.0%) |
Monthly Housing Cost Tiers in Bothell
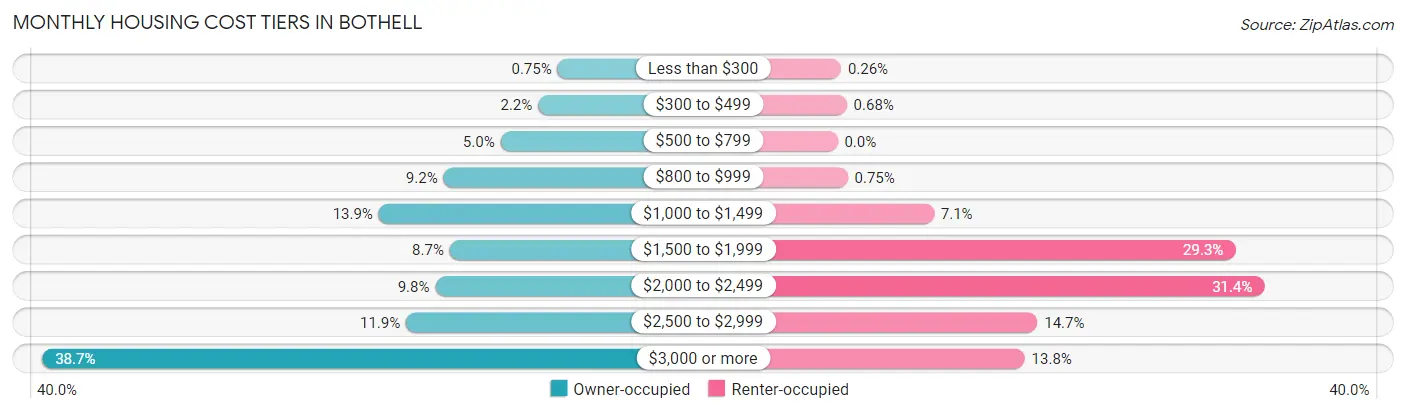
| Monthly Cost | Owner-occupied | Renter-occupied |
| Less than $300 | 88 (0.7%) | 17 (0.3%) |
| $300 to $499 | 257 (2.2%) | 45 (0.7%) |
| $500 to $799 | 584 (5.0%) | 0 (0.0%) |
| $800 to $999 | 1,079 (9.1%) | 50 (0.7%) |
| $1,000 to $1,499 | 1,641 (13.9%) | 471 (7.1%) |
| $1,500 to $1,999 | 1,025 (8.7%) | 1,944 (29.3%) |
| $2,000 to $2,499 | 1,150 (9.8%) | 2,086 (31.4%) |
| $2,500 to $2,999 | 1,404 (11.9%) | 977 (14.7%) |
| $3,000 or more | 4,563 (38.7%) | 915 (13.8%) |
| Total | 11,791 (100.0%) | 6,636 (100.0%) |
Physical Housing Characteristics in Bothell
Housing Structures in Bothell
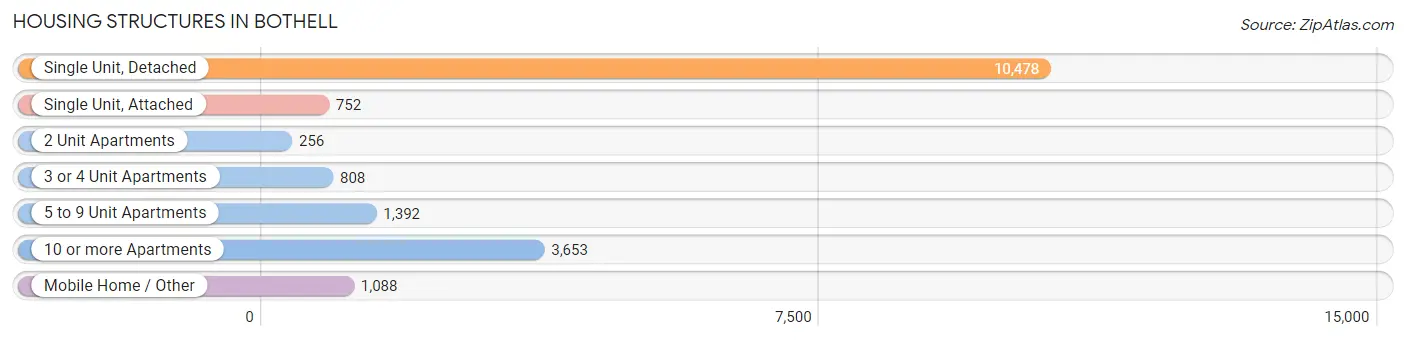
| Structure Type | # Housing Units | % Housing Units |
| Single Unit, Detached | 10,478 | 56.9% |
| Single Unit, Attached | 752 | 4.1% |
| 2 Unit Apartments | 256 | 1.4% |
| 3 or 4 Unit Apartments | 808 | 4.4% |
| 5 to 9 Unit Apartments | 1,392 | 7.5% |
| 10 or more Apartments | 3,653 | 19.8% |
| Mobile Home / Other | 1,088 | 5.9% |
| Total | 18,427 | 100.0% |
Housing Structures by Occupancy in Bothell
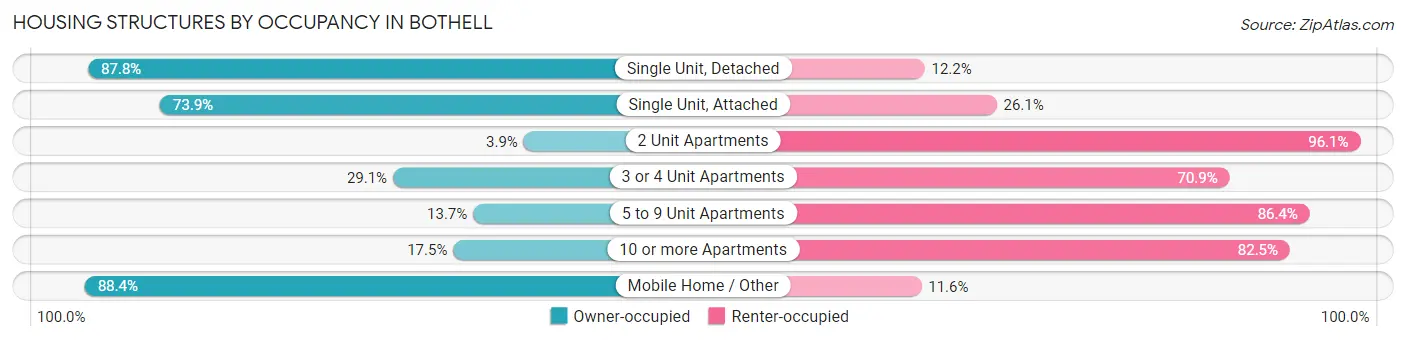
| Structure Type | Owner-occupied | Renter-occupied |
| Single Unit, Detached | 9,200 (87.8%) | 1,278 (12.2%) |
| Single Unit, Attached | 556 (73.9%) | 196 (26.1%) |
| 2 Unit Apartments | 10 (3.9%) | 246 (96.1%) |
| 3 or 4 Unit Apartments | 235 (29.1%) | 573 (70.9%) |
| 5 to 9 Unit Apartments | 190 (13.7%) | 1,202 (86.4%) |
| 10 or more Apartments | 638 (17.5%) | 3,015 (82.5%) |
| Mobile Home / Other | 962 (88.4%) | 126 (11.6%) |
| Total | 11,791 (64.0%) | 6,636 (36.0%) |
Housing Structures by Number of Rooms in Bothell
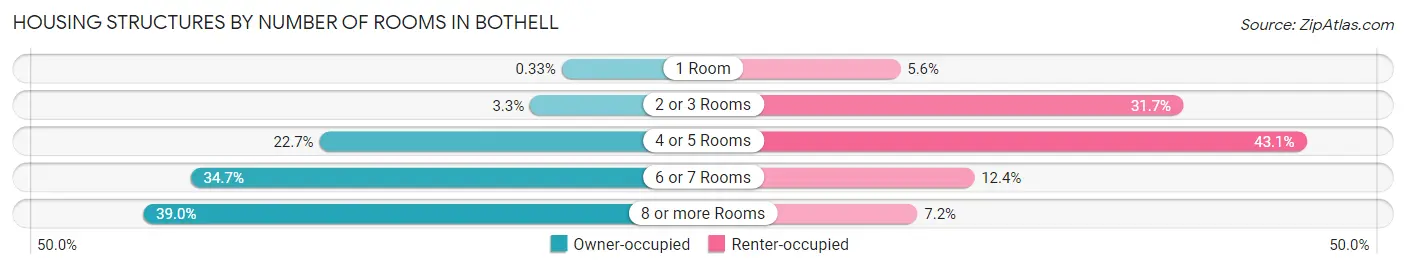
| Number of Rooms | Owner-occupied | Renter-occupied |
| 1 Room | 39 (0.3%) | 370 (5.6%) |
| 2 or 3 Rooms | 383 (3.3%) | 2,105 (31.7%) |
| 4 or 5 Rooms | 2,680 (22.7%) | 2,862 (43.1%) |
| 6 or 7 Rooms | 4,086 (34.6%) | 824 (12.4%) |
| 8 or more Rooms | 4,603 (39.0%) | 475 (7.2%) |
| Total | 11,791 (100.0%) | 6,636 (100.0%) |
Housing Structure by Heating Type in Bothell
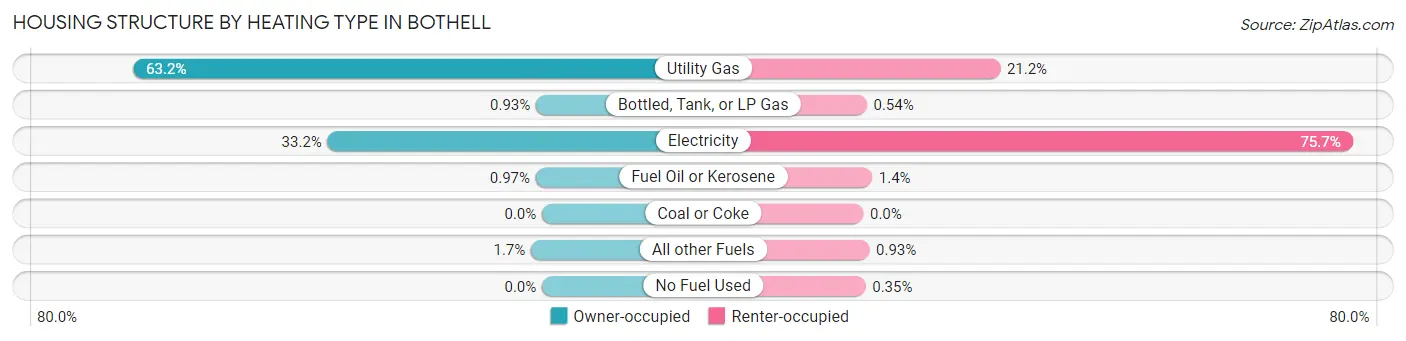
| Heating Type | Owner-occupied | Renter-occupied |
| Utility Gas | 7,457 (63.2%) | 1,404 (21.2%) |
| Bottled, Tank, or LP Gas | 110 (0.9%) | 36 (0.5%) |
| Electricity | 3,909 (33.2%) | 5,021 (75.7%) |
| Fuel Oil or Kerosene | 114 (1.0%) | 90 (1.4%) |
| Coal or Coke | 0 (0.0%) | 0 (0.0%) |
| All other Fuels | 201 (1.7%) | 62 (0.9%) |
| No Fuel Used | 0 (0.0%) | 23 (0.4%) |
| Total | 11,791 (100.0%) | 6,636 (100.0%) |
Household Vehicle Usage in Bothell
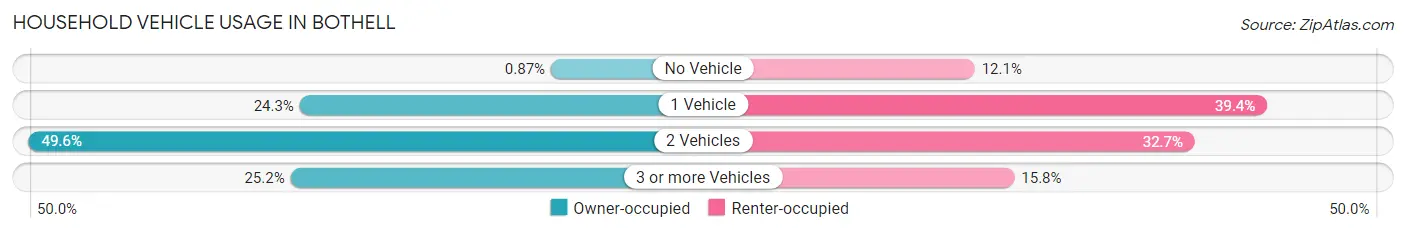
| Vehicles per Household | Owner-occupied | Renter-occupied |
| No Vehicle | 103 (0.9%) | 804 (12.1%) |
| 1 Vehicle | 2,867 (24.3%) | 2,615 (39.4%) |
| 2 Vehicles | 5,852 (49.6%) | 2,167 (32.7%) |
| 3 or more Vehicles | 2,969 (25.2%) | 1,050 (15.8%) |
| Total | 11,791 (100.0%) | 6,636 (100.0%) |
Real Estate & Mortgages in Bothell
Real Estate and Mortgage Overview in Bothell
| Characteristic | Without Mortgage | With Mortgage |
| Housing Units | 3,220 | 8,571 |
| Median Property Value | $690,300 | $835,200 |
| Median Household Income | $95,370 | $5,341 |
| Monthly Housing Costs | $954 | $4,563 |
| Real Estate Taxes | $5,855 | $209 |
Property Value by Mortgage Status in Bothell
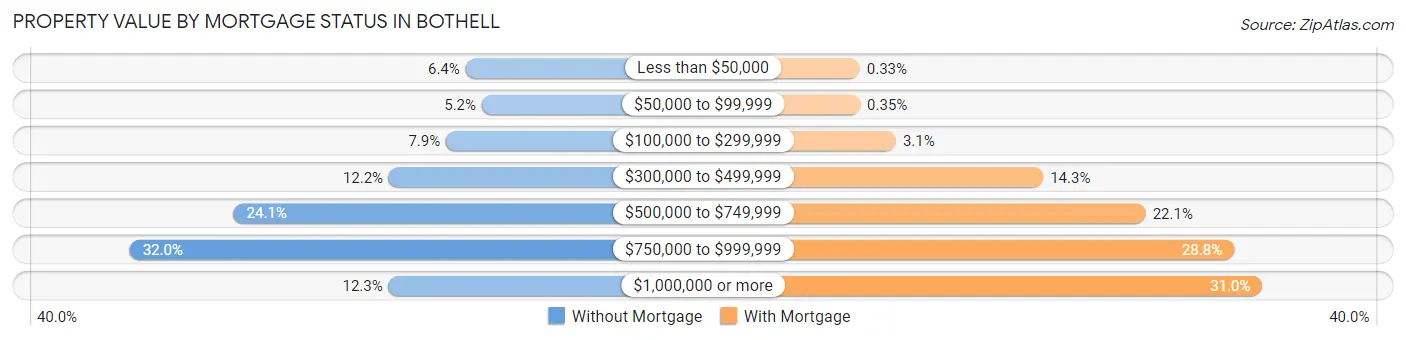
| Property Value | Without Mortgage | With Mortgage |
| Less than $50,000 | 206 (6.4%) | 28 (0.3%) |
| $50,000 to $99,999 | 166 (5.2%) | 30 (0.4%) |
| $100,000 to $299,999 | 254 (7.9%) | 264 (3.1%) |
| $300,000 to $499,999 | 394 (12.2%) | 1,226 (14.3%) |
| $500,000 to $749,999 | 775 (24.1%) | 1,895 (22.1%) |
| $750,000 to $999,999 | 1,030 (32.0%) | 2,472 (28.8%) |
| $1,000,000 or more | 395 (12.3%) | 2,656 (31.0%) |
| Total | 3,220 (100.0%) | 8,571 (100.0%) |
Household Income by Mortgage Status in Bothell
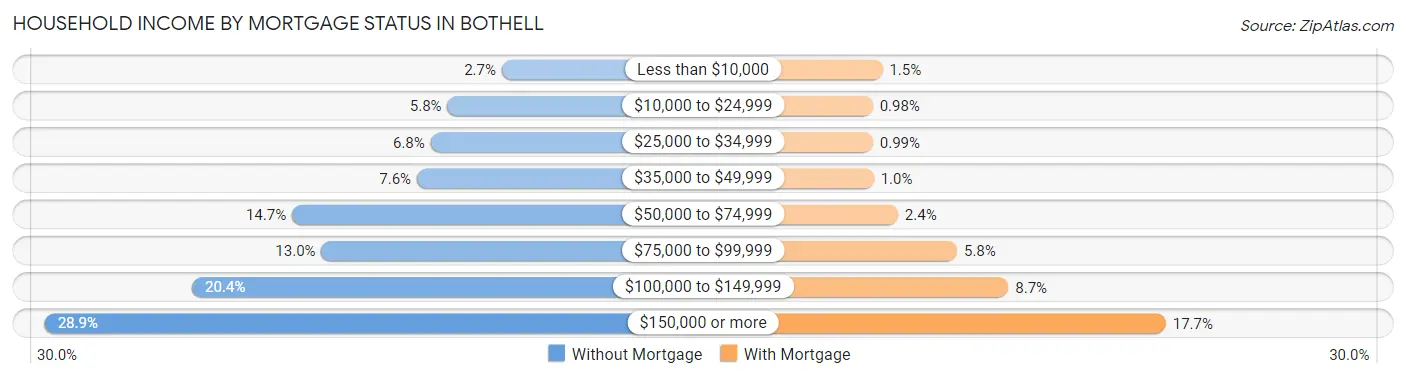
| Household Income | Without Mortgage | With Mortgage |
| Less than $10,000 | 88 (2.7%) | 132 (1.5%) |
| $10,000 to $24,999 | 188 (5.8%) | 84 (1.0%) |
| $25,000 to $34,999 | 219 (6.8%) | 85 (1.0%) |
| $35,000 to $49,999 | 244 (7.6%) | 89 (1.0%) |
| $50,000 to $74,999 | 474 (14.7%) | 207 (2.4%) |
| $75,000 to $99,999 | 420 (13.0%) | 497 (5.8%) |
| $100,000 to $149,999 | 658 (20.4%) | 748 (8.7%) |
| $150,000 or more | 929 (28.8%) | 1,520 (17.7%) |
| Total | 3,220 (100.0%) | 8,571 (100.0%) |
Property Value to Household Income Ratio in Bothell
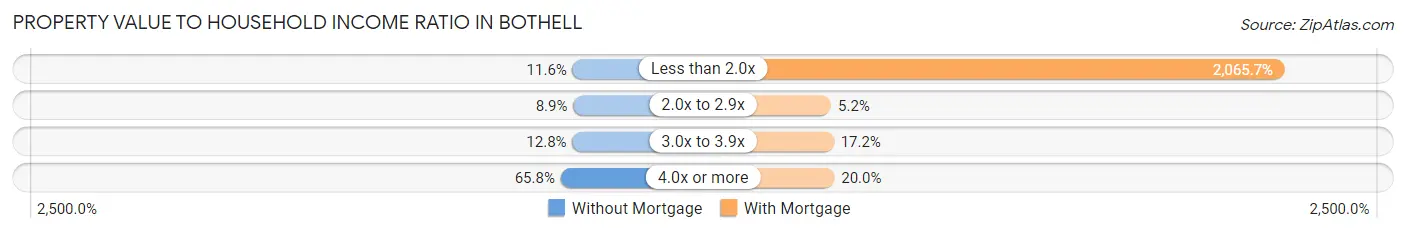
| Value-to-Income Ratio | Without Mortgage | With Mortgage |
| Less than 2.0x | 372 (11.6%) | 177,050 (2,065.7%) |
| 2.0x to 2.9x | 286 (8.9%) | 445 (5.2%) |
| 3.0x to 3.9x | 412 (12.8%) | 1,470 (17.2%) |
| 4.0x or more | 2,119 (65.8%) | 1,711 (20.0%) |
| Total | 3,220 (100.0%) | 8,571 (100.0%) |
Real Estate Taxes by Mortgage Status in Bothell
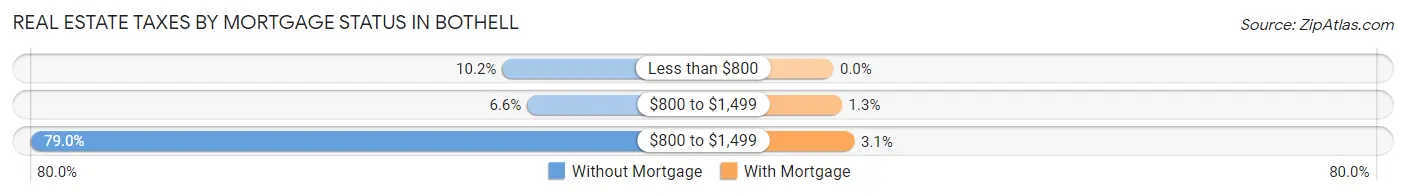
| Property Taxes | Without Mortgage | With Mortgage |
| Less than $800 | 329 (10.2%) | 0 (0.0%) |
| $800 to $1,499 | 212 (6.6%) | 108 (1.3%) |
| $800 to $1,499 | 2,545 (79.0%) | 263 (3.1%) |
| Total | 3,220 (100.0%) | 8,571 (100.0%) |
Health & Disability in Bothell
Health Insurance Coverage by Age in Bothell
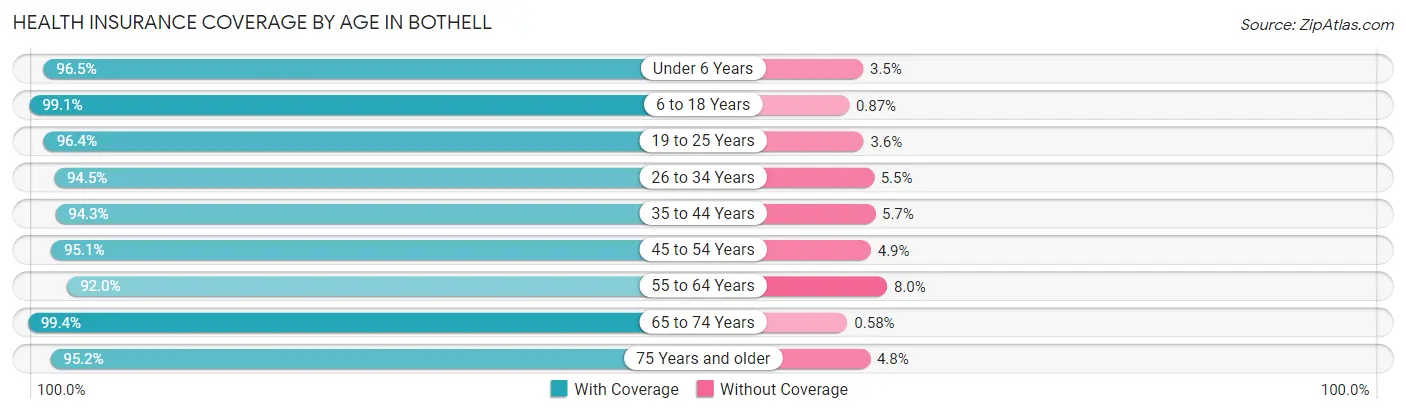
| Age Bracket | With Coverage | Without Coverage |
| Under 6 Years | 3,039 (96.5%) | 110 (3.5%) |
| 6 to 18 Years | 8,525 (99.1%) | 75 (0.9%) |
| 19 to 25 Years | 2,909 (96.4%) | 108 (3.6%) |
| 26 to 34 Years | 6,075 (94.5%) | 352 (5.5%) |
| 35 to 44 Years | 8,289 (94.3%) | 504 (5.7%) |
| 45 to 54 Years | 6,096 (95.1%) | 317 (4.9%) |
| 55 to 64 Years | 4,751 (92.0%) | 411 (8.0%) |
| 65 to 74 Years | 3,930 (99.4%) | 23 (0.6%) |
| 75 Years and older | 2,106 (95.2%) | 106 (4.8%) |
| Total | 45,720 (95.8%) | 2,006 (4.2%) |
Health Insurance Coverage by Citizenship Status in Bothell
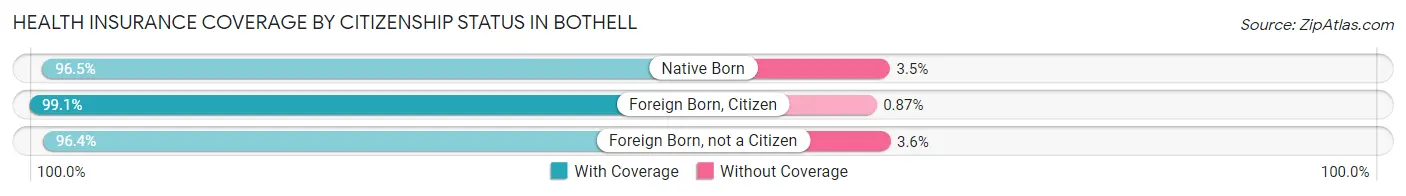
| Citizenship Status | With Coverage | Without Coverage |
| Native Born | 3,039 (96.5%) | 110 (3.5%) |
| Foreign Born, Citizen | 8,525 (99.1%) | 75 (0.9%) |
| Foreign Born, not a Citizen | 2,909 (96.4%) | 108 (3.6%) |
Health Insurance Coverage by Household Income in Bothell
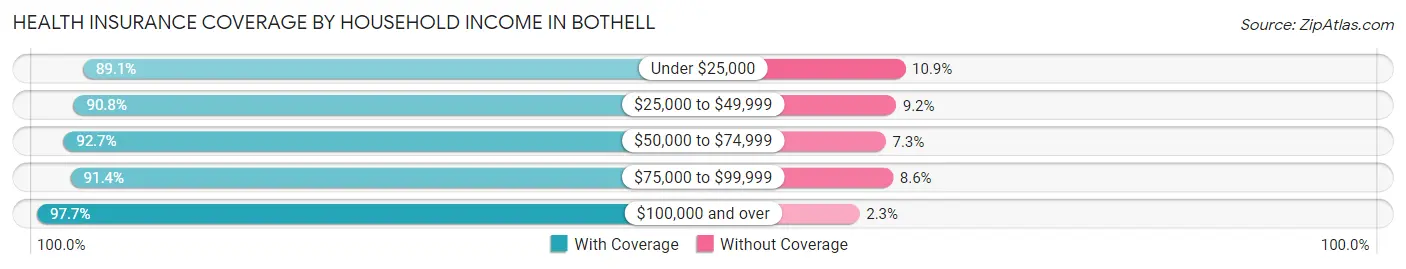
| Household Income | With Coverage | Without Coverage |
| Under $25,000 | 1,629 (89.1%) | 200 (10.9%) |
| $25,000 to $49,999 | 2,760 (90.8%) | 279 (9.2%) |
| $50,000 to $74,999 | 3,550 (92.7%) | 278 (7.3%) |
| $75,000 to $99,999 | 4,649 (91.4%) | 439 (8.6%) |
| $100,000 and over | 32,690 (97.7%) | 783 (2.3%) |
Public vs Private Health Insurance Coverage by Age in Bothell
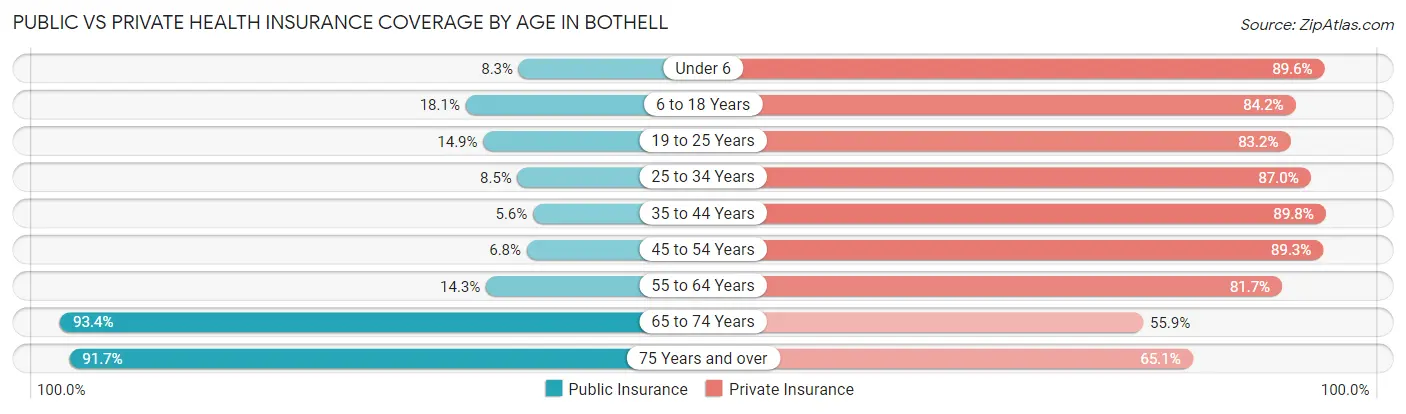
| Age Bracket | Public Insurance | Private Insurance |
| Under 6 | 260 (8.3%) | 2,821 (89.6%) |
| 6 to 18 Years | 1,558 (18.1%) | 7,240 (84.2%) |
| 19 to 25 Years | 448 (14.8%) | 2,511 (83.2%) |
| 25 to 34 Years | 545 (8.5%) | 5,591 (87.0%) |
| 35 to 44 Years | 493 (5.6%) | 7,896 (89.8%) |
| 45 to 54 Years | 434 (6.8%) | 5,729 (89.3%) |
| 55 to 64 Years | 740 (14.3%) | 4,217 (81.7%) |
| 65 to 74 Years | 3,693 (93.4%) | 2,210 (55.9%) |
| 75 Years and over | 2,028 (91.7%) | 1,440 (65.1%) |
| Total | 10,199 (21.4%) | 39,655 (83.1%) |
Disability Status by Sex by Age in Bothell
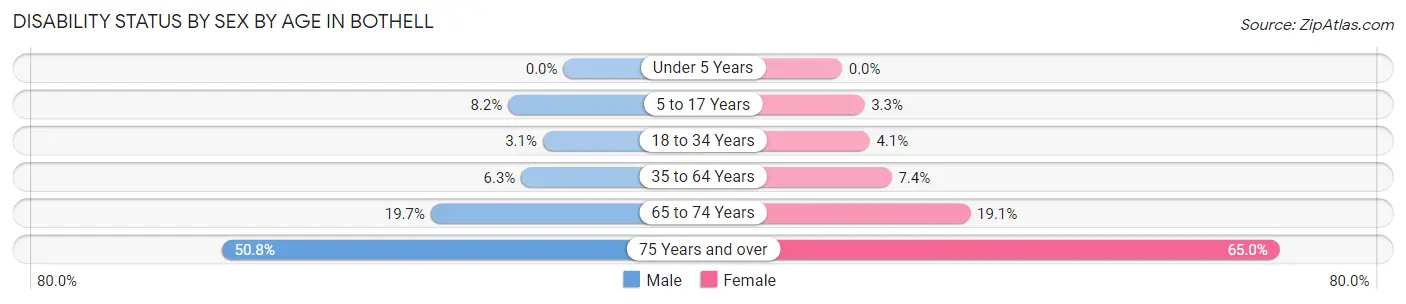
| Age Bracket | Male | Female |
| Under 5 Years | 0 (0.0%) | 0 (0.0%) |
| 5 to 17 Years | 363 (8.2%) | 142 (3.3%) |
| 18 to 34 Years | 153 (3.0%) | 203 (4.1%) |
| 35 to 64 Years | 651 (6.3%) | 734 (7.4%) |
| 65 to 74 Years | 377 (19.7%) | 388 (19.1%) |
| 75 Years and over | 371 (50.7%) | 963 (65.0%) |
Disability Class by Sex by Age in Bothell
Disability Class: Hearing Difficulty
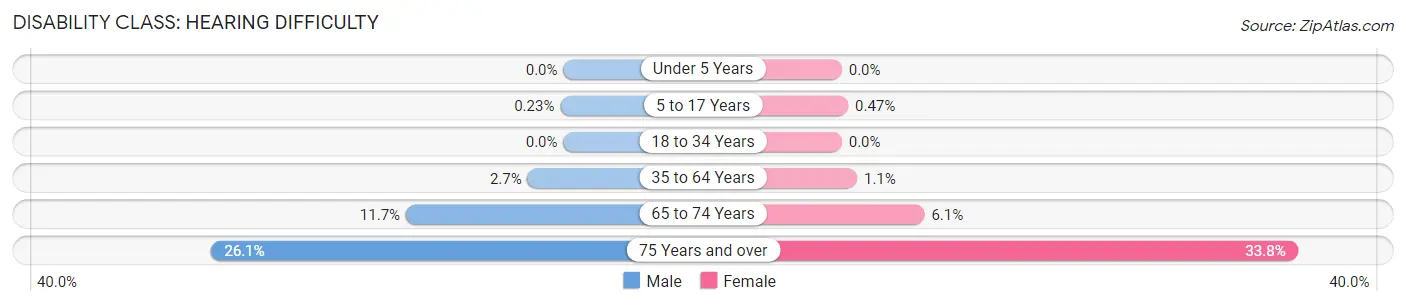
| Age Bracket | Male | Female |
| Under 5 Years | 0 (0.0%) | 0 (0.0%) |
| 5 to 17 Years | 10 (0.2%) | 20 (0.5%) |
| 18 to 34 Years | 0 (0.0%) | 0 (0.0%) |
| 35 to 64 Years | 277 (2.7%) | 113 (1.1%) |
| 65 to 74 Years | 224 (11.7%) | 125 (6.1%) |
| 75 Years and over | 191 (26.1%) | 501 (33.8%) |
Disability Class: Vision Difficulty
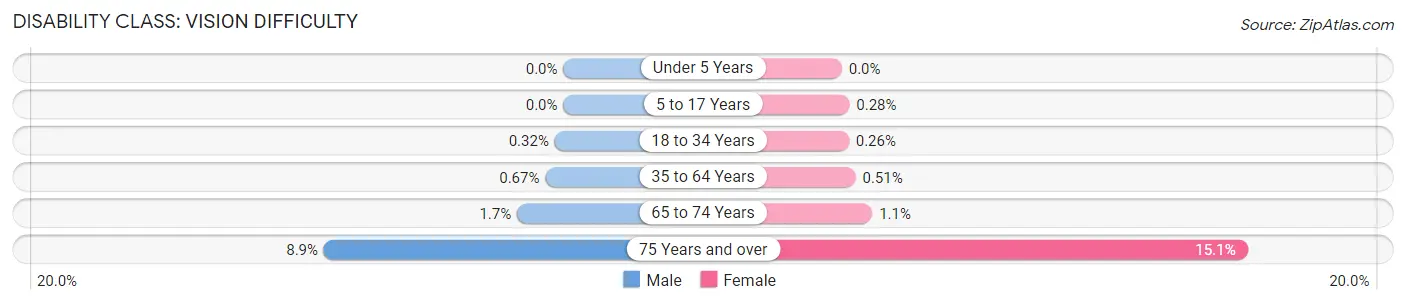
| Age Bracket | Male | Female |
| Under 5 Years | 0 (0.0%) | 0 (0.0%) |
| 5 to 17 Years | 0 (0.0%) | 12 (0.3%) |
| 18 to 34 Years | 16 (0.3%) | 13 (0.3%) |
| 35 to 64 Years | 70 (0.7%) | 51 (0.5%) |
| 65 to 74 Years | 33 (1.7%) | 23 (1.1%) |
| 75 Years and over | 65 (8.9%) | 223 (15.1%) |
Disability Class: Cognitive Difficulty
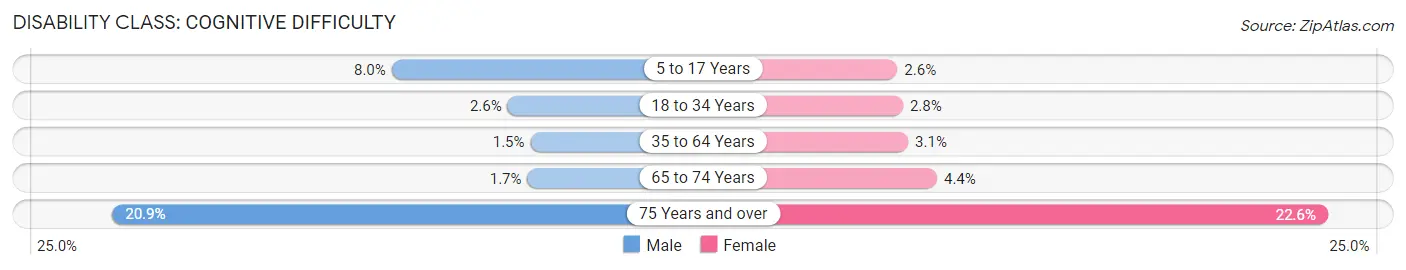
| Age Bracket | Male | Female |
| 5 to 17 Years | 353 (8.0%) | 110 (2.6%) |
| 18 to 34 Years | 130 (2.6%) | 140 (2.8%) |
| 35 to 64 Years | 159 (1.5%) | 307 (3.1%) |
| 65 to 74 Years | 32 (1.7%) | 90 (4.4%) |
| 75 Years and over | 153 (20.9%) | 334 (22.6%) |
Disability Class: Ambulatory Difficulty
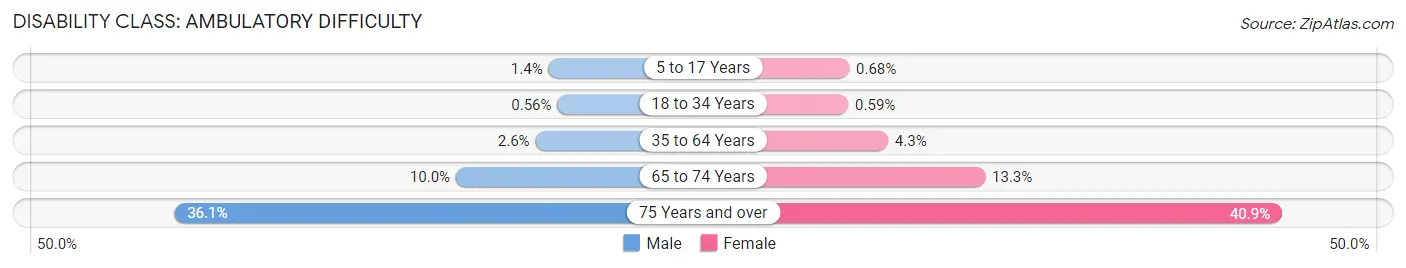
| Age Bracket | Male | Female |
| 5 to 17 Years | 61 (1.4%) | 29 (0.7%) |
| 18 to 34 Years | 28 (0.6%) | 29 (0.6%) |
| 35 to 64 Years | 269 (2.6%) | 427 (4.3%) |
| 65 to 74 Years | 191 (10.0%) | 271 (13.3%) |
| 75 Years and over | 264 (36.1%) | 605 (40.8%) |
Disability Class: Self-Care Difficulty
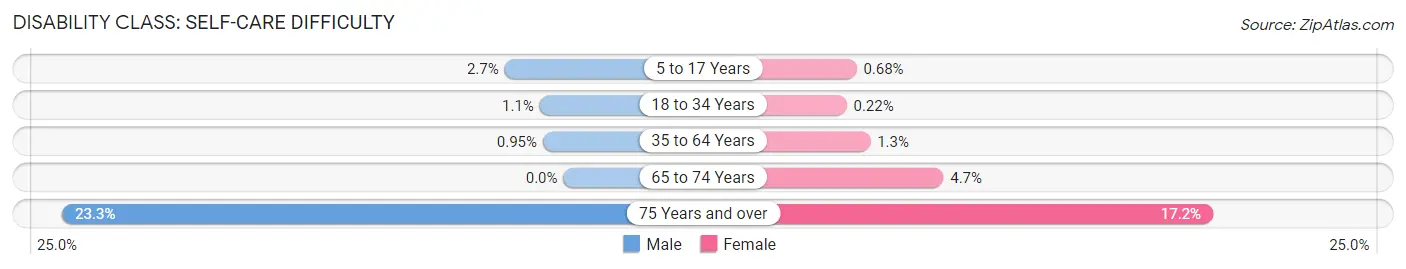
| Age Bracket | Male | Female |
| 5 to 17 Years | 121 (2.7%) | 29 (0.7%) |
| 18 to 34 Years | 55 (1.1%) | 11 (0.2%) |
| 35 to 64 Years | 99 (0.9%) | 132 (1.3%) |
| 65 to 74 Years | 0 (0.0%) | 96 (4.7%) |
| 75 Years and over | 170 (23.3%) | 255 (17.2%) |
Technology Access in Bothell
Computing Device Access in Bothell
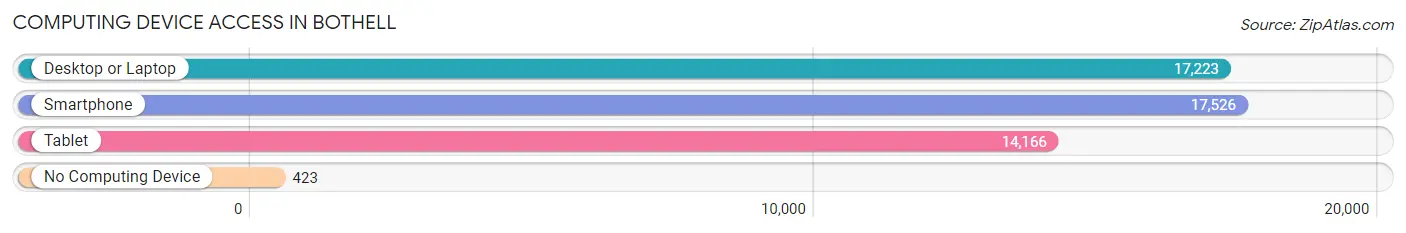
| Device Type | # Households | % Households |
| Desktop or Laptop | 17,223 | 93.5% |
| Smartphone | 17,526 | 95.1% |
| Tablet | 14,166 | 76.9% |
| No Computing Device | 423 | 2.3% |
| Total | 18,427 | 100.0% |
Internet Access in Bothell
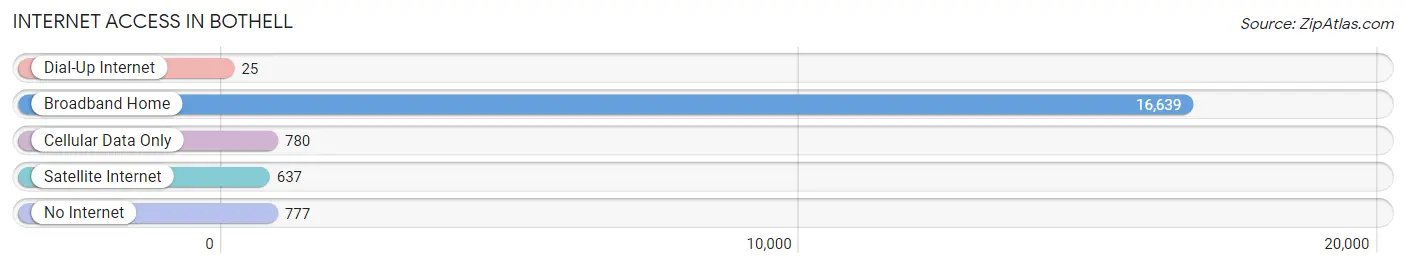
| Internet Type | # Households | % Households |
| Dial-Up Internet | 25 | 0.1% |
| Broadband Home | 16,639 | 90.3% |
| Cellular Data Only | 780 | 4.2% |
| Satellite Internet | 637 | 3.5% |
| No Internet | 777 | 4.2% |
| Total | 18,427 | 100.0% |
Bothell Summary
Bothell, Washington is a city located in King and Snohomish counties in the state of Washington. It is located about 20 miles northeast of Seattle and is part of the Seattle metropolitan area. The city has a population of approximately 45,000 people and is home to the University of Washington Bothell.
History
The area that is now Bothell was first settled in the late 1800s by settlers from the East Coast. The first settlers were mostly farmers and loggers who were attracted to the area by its abundant natural resources. The first post office in the area was established in 1888 and the town was officially incorporated in 1909.
The city was named after the first postmaster, David Bothell, who was a prominent local businessman. The city grew rapidly in the early 20th century, and by the 1950s it had become a major center for logging and manufacturing.
Geography
Bothell is located in the Puget Sound region of Washington, about 20 miles northeast of Seattle. The city is situated on the Sammamish River and is surrounded by the Cascade Mountains to the east and the Olympic Mountains to the west. The city has a total area of 8.7 square miles, of which 8.3 square miles is land and 0.4 square miles is water.
The climate in Bothell is mild and temperate, with warm summers and cool winters. The average annual temperature is around 50 degrees Fahrenheit. The city receives an average of 37 inches of precipitation per year, with most of it falling in the winter months.
Economy
Bothell’s economy is largely based on technology and manufacturing. The city is home to several major companies, including Microsoft, Boeing, and Amazon. The city also has a thriving retail sector, with several shopping centers and malls.
The city is also home to the University of Washington Bothell, which is a major employer in the area. The university offers a variety of degree programs and is a major research institution.
Demographics
As of the 2010 census, the population of Bothell was 45,078. The racial makeup of the city was 73.3% White, 8.2% Asian, 6.2% African American, 0.7% Native American, 0.2% Pacific Islander, and 8.4% from other races. The median household income was $76,837, and the median family income was $90,945.
The city is home to a diverse population, with people from all walks of life. The city is also home to a large number of immigrants, with over 20% of the population being foreign-born.
Conclusion
Bothell, Washington is a vibrant city located in the Puget Sound region of Washington. The city has a rich history and a diverse population. The economy is largely based on technology and manufacturing, and the city is home to several major companies. The city is also home to the University of Washington Bothell, which is a major employer in the area.
Common Questions
What is Per Capita Income in Bothell?
Per Capita income in Bothell is $61,857.
What is the Median Family Income in Bothell?
Median Family Income in Bothell is $150,920.
What is the Median Household income in Bothell?
Median Household Income in Bothell is $127,944.
What is Income or Wage Gap in Bothell?
Income or Wage Gap in Bothell is 45.9%.
Women in Bothell earn 54.1 cents for every dollar earned by a man.
What is Inequality or Gini Index in Bothell?
Inequality or Gini Index in Bothell is 0.41.
What is the Total Population of Bothell?
Total Population of Bothell is 47,917.
What is the Total Male Population of Bothell?
Total Male Population of Bothell is 23,760.
What is the Total Female Population of Bothell?
Total Female Population of Bothell is 24,157.
What is the Ratio of Males per 100 Females in Bothell?
There are 98.36 Males per 100 Females in Bothell.
What is the Ratio of Females per 100 Males in Bothell?
There are 101.67 Females per 100 Males in Bothell.
What is the Median Population Age in Bothell?
Median Population Age in Bothell is 38.0 Years.
What is the Average Family Size in Bothell
Average Family Size in Bothell is 3.1 People.
What is the Average Household Size in Bothell
Average Household Size in Bothell is 2.6 People.
How Large is the Labor Force in Bothell?
There are 26,971 People in the Labor Forcein in Bothell.
What is the Percentage of People in the Labor Force in Bothell?
71.5% of People are in the Labor Force in Bothell.
What is the Unemployment Rate in Bothell?
Unemployment Rate in Bothell is 3.9%.