Lake Holm, WA Map & Demographics
Lake Holm Map
Lake Holm Overview
$61,341
PER CAPITA INCOME
$165,543
AVG FAMILY INCOME
$119,568
AVG HOUSEHOLD INCOME
43.8%
WAGE / INCOME GAP [ % ]
56.2¢/ $1
WAGE / INCOME GAP [ $ ]
0.35
INEQUALITY / GINI INDEX
3,653
TOTAL POPULATION
1,881
MALE POPULATION
1,772
FEMALE POPULATION
106.15
MALES / 100 FEMALES
94.21
FEMALES / 100 MALES
49.7
MEDIAN AGE
3.0
AVG FAMILY SIZE
2.5
AVG HOUSEHOLD SIZE
2,151
LABOR FORCE [ PEOPLE ]
65.3%
PERCENT IN LABOR FORCE
0.9%
UNEMPLOYMENT RATE
Income in Lake Holm
Income Overview in Lake Holm
Per Capita Income in Lake Holm is $61,341, while median incomes of families and households are $165,543 and $119,568 respectively.
| Characteristic | Number | Measure |
| Per Capita Income | 3,653 | $61,341 |
| Median Family Income | 1,072 | $165,543 |
| Mean Family Income | 1,072 | $175,634 |
| Median Household Income | 1,434 | $119,568 |
| Mean Household Income | 1,434 | $152,997 |
| Income Deficit | 1,072 | $0 |
| Wage / Income Gap (%) | 3,653 | 43.82% |
| Wage / Income Gap ($) | 3,653 | 56.18¢ per $1 |
| Gini / Inequality Index | 3,653 | 0.35 |
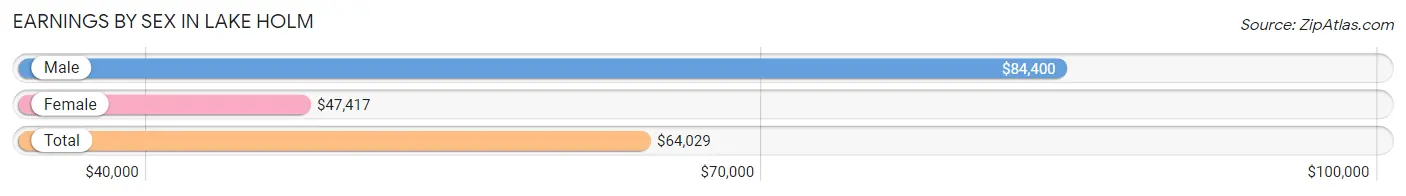
Earnings by Sex in Lake Holm
Average Earnings in Lake Holm are $64,029, $84,400 for men and $47,417 for women, a difference of 43.8%.
| Sex | Number | Average Earnings |
| Male | 1,276 (56.4%) | $84,400 |
| Female | 985 (43.6%) | $47,417 |
| Total | 2,261 (100.0%) | $64,029 |
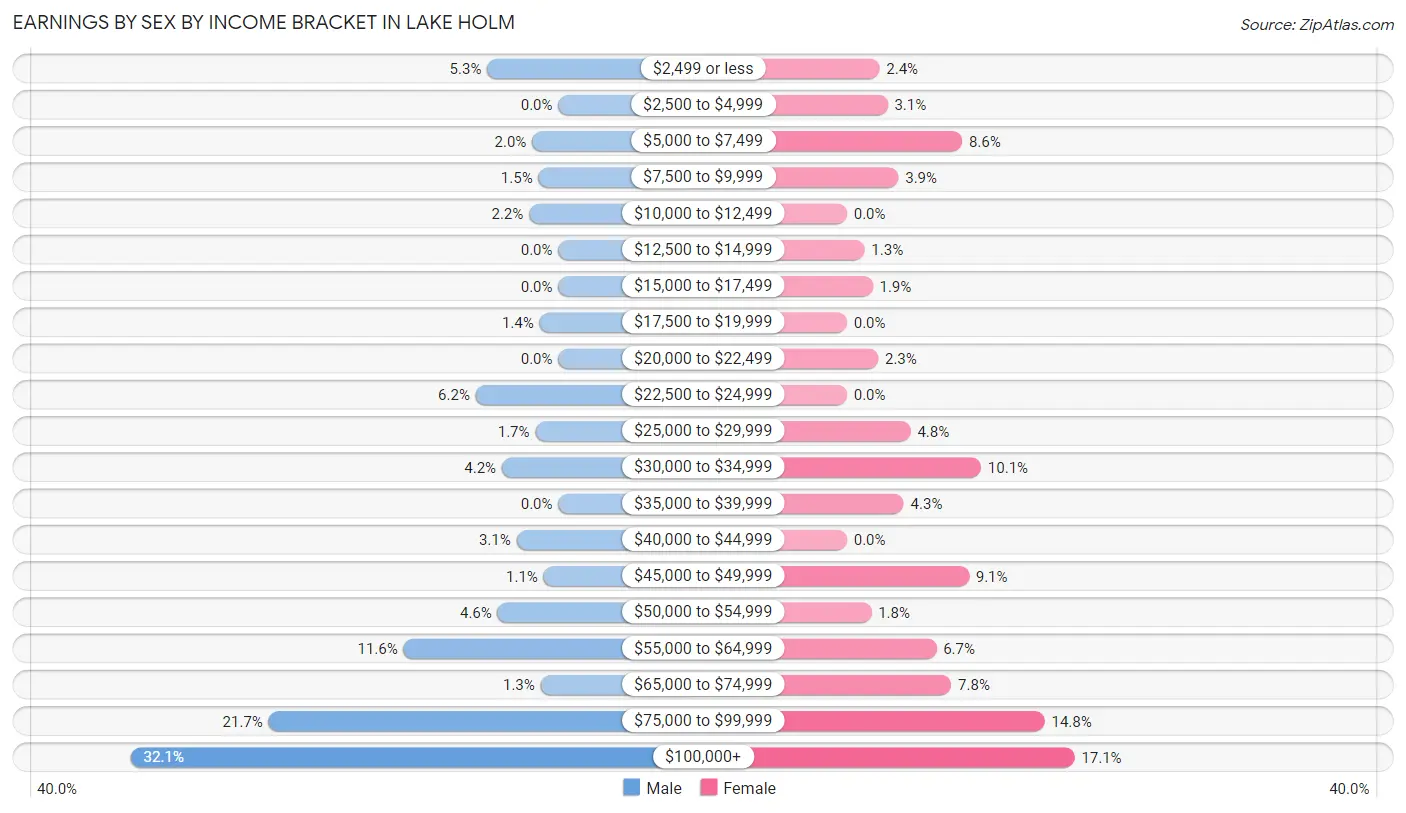
Earnings by Sex by Income Bracket in Lake Holm
The most common earnings brackets in Lake Holm are $100,000+ for men (409 | 32.1%) and $100,000+ for women (168 | 17.1%).
| Income | Male | Female |
| $2,499 or less | 68 (5.3%) | 24 (2.4%) |
| $2,500 to $4,999 | 0 (0.0%) | 30 (3.0%) |
| $5,000 to $7,499 | 25 (2.0%) | 85 (8.6%) |
| $7,500 to $9,999 | 19 (1.5%) | 38 (3.9%) |
| $10,000 to $12,499 | 28 (2.2%) | 0 (0.0%) |
| $12,500 to $14,999 | 0 (0.0%) | 13 (1.3%) |
| $15,000 to $17,499 | 0 (0.0%) | 19 (1.9%) |
| $17,500 to $19,999 | 18 (1.4%) | 0 (0.0%) |
| $20,000 to $22,499 | 0 (0.0%) | 23 (2.3%) |
| $22,500 to $24,999 | 79 (6.2%) | 0 (0.0%) |
| $25,000 to $29,999 | 22 (1.7%) | 47 (4.8%) |
| $30,000 to $34,999 | 54 (4.2%) | 99 (10.1%) |
| $35,000 to $39,999 | 0 (0.0%) | 42 (4.3%) |
| $40,000 to $44,999 | 40 (3.1%) | 0 (0.0%) |
| $45,000 to $49,999 | 14 (1.1%) | 90 (9.1%) |
| $50,000 to $54,999 | 58 (4.5%) | 18 (1.8%) |
| $55,000 to $64,999 | 148 (11.6%) | 66 (6.7%) |
| $65,000 to $74,999 | 17 (1.3%) | 77 (7.8%) |
| $75,000 to $99,999 | 277 (21.7%) | 146 (14.8%) |
| $100,000+ | 409 (32.1%) | 168 (17.1%) |
| Total | 1,276 (100.0%) | 985 (100.0%) |
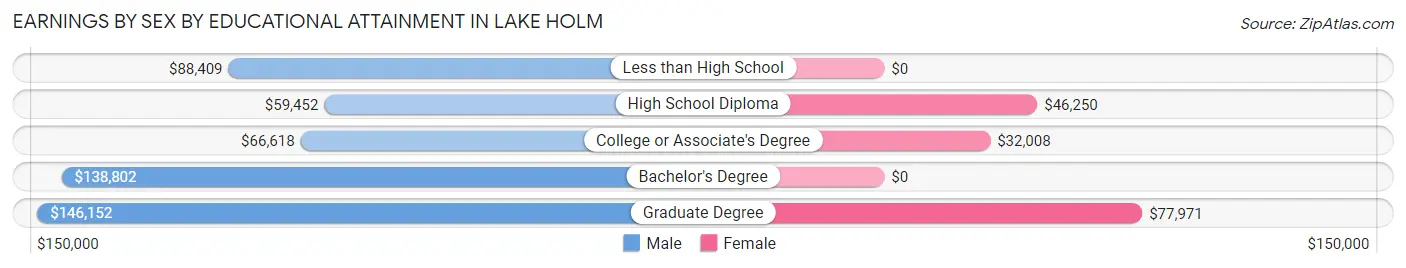
Earnings by Sex by Educational Attainment in Lake Holm
Average earnings in Lake Holm are $90,026 for men and $59,495 for women, a difference of 33.9%. Men with an educational attainment of graduate degree enjoy the highest average annual earnings of $146,152, while those with high school diploma education earn the least with $59,452. Women with an educational attainment of graduate degree earn the most with the average annual earnings of $77,971, while those with college or associate's degree education have the smallest earnings of $32,008.
| Educational Attainment | Male Income | Female Income |
| Less than High School | $88,409 | $0 |
| High School Diploma | $59,452 | $46,250 |
| College or Associate's Degree | $66,618 | $32,008 |
| Bachelor's Degree | $138,802 | $0 |
| Graduate Degree | $146,152 | $77,971 |
| Total | $90,026 | $59,495 |
Family Income in Lake Holm
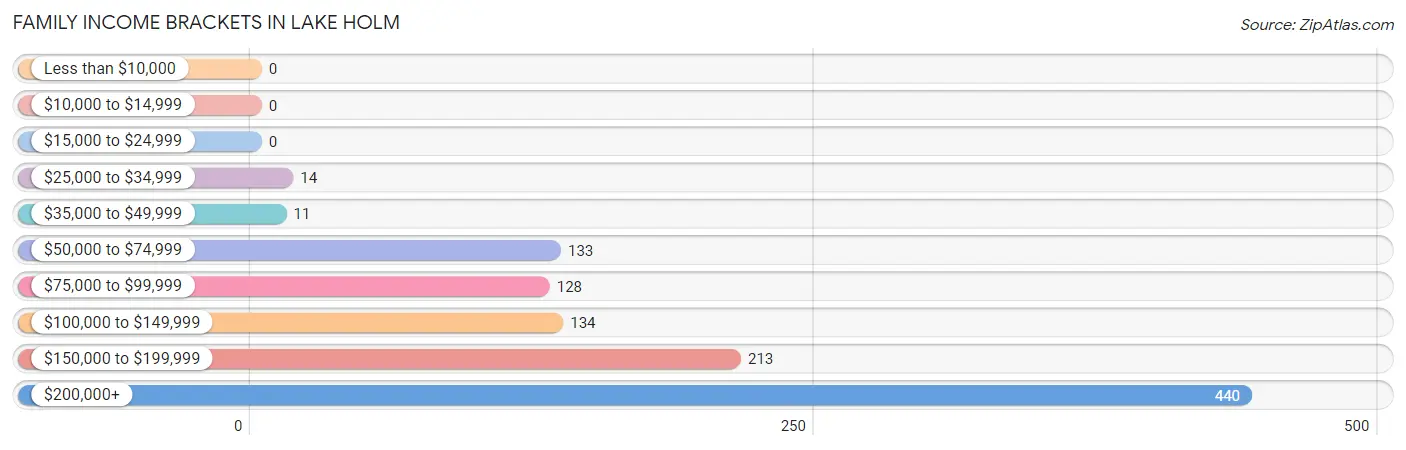
Family Income Brackets in Lake Holm
According to the Lake Holm family income data, there are 440 families falling into the $200,000+ income range, which is the most common income bracket and makes up 41.0% of all families.
| Income Bracket | # Families | % Families |
| Less than $10,000 | 0 | 0.0% |
| $10,000 to $14,999 | 0 | 0.0% |
| $15,000 to $24,999 | 0 | 0.0% |
| $25,000 to $34,999 | 14 | 1.3% |
| $35,000 to $49,999 | 11 | 1.0% |
| $50,000 to $74,999 | 133 | 12.4% |
| $75,000 to $99,999 | 128 | 11.9% |
| $100,000 to $149,999 | 134 | 12.5% |
| $150,000 to $199,999 | 213 | 19.9% |
| $200,000+ | 440 | 41.0% |
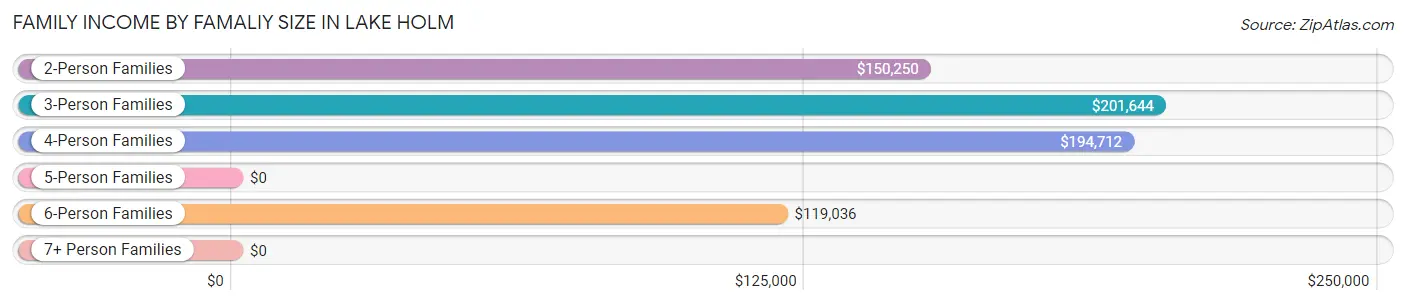
Family Income by Famaliy Size in Lake Holm
3-person families (244 | 22.8%) account for the highest median family income in Lake Holm with $201,644 per family, while 2-person families (582 | 54.3%) have the highest median income of $75,125 per family member.
| Income Bracket | # Families | Median Income |
| 2-Person Families | 582 (54.3%) | $150,250 |
| 3-Person Families | 244 (22.8%) | $201,644 |
| 4-Person Families | 105 (9.8%) | $194,712 |
| 5-Person Families | 55 (5.1%) | $0 |
| 6-Person Families | 86 (8.0%) | $119,036 |
| 7+ Person Families | 0 (0.0%) | $0 |
| Total | 1,072 (100.0%) | $165,543 |
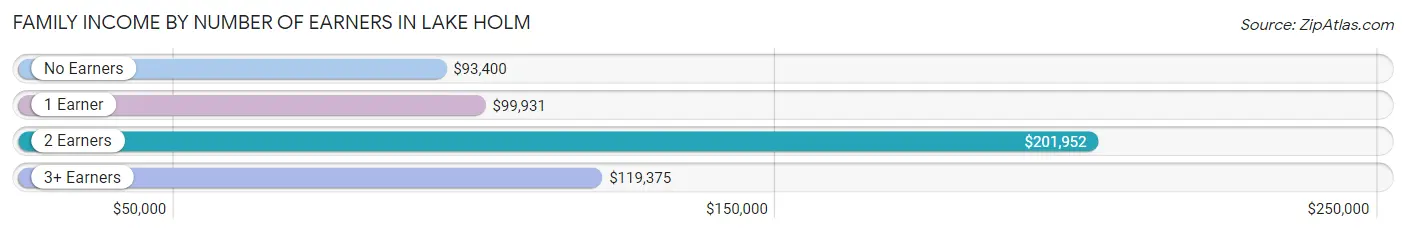
Family Income by Number of Earners in Lake Holm
The median family income in Lake Holm is $165,543, with families comprising 2 earners (486) having the highest median family income of $201,952, while families with no earners (158) have the lowest median family income of $93,400, accounting for 45.3% and 14.7% of families, respectively.
| Number of Earners | # Families | Median Income |
| No Earners | 158 (14.7%) | $93,400 |
| 1 Earner | 285 (26.6%) | $99,931 |
| 2 Earners | 486 (45.3%) | $201,952 |
| 3+ Earners | 143 (13.3%) | $119,375 |
| Total | 1,072 (100.0%) | $165,543 |
Household Income in Lake Holm
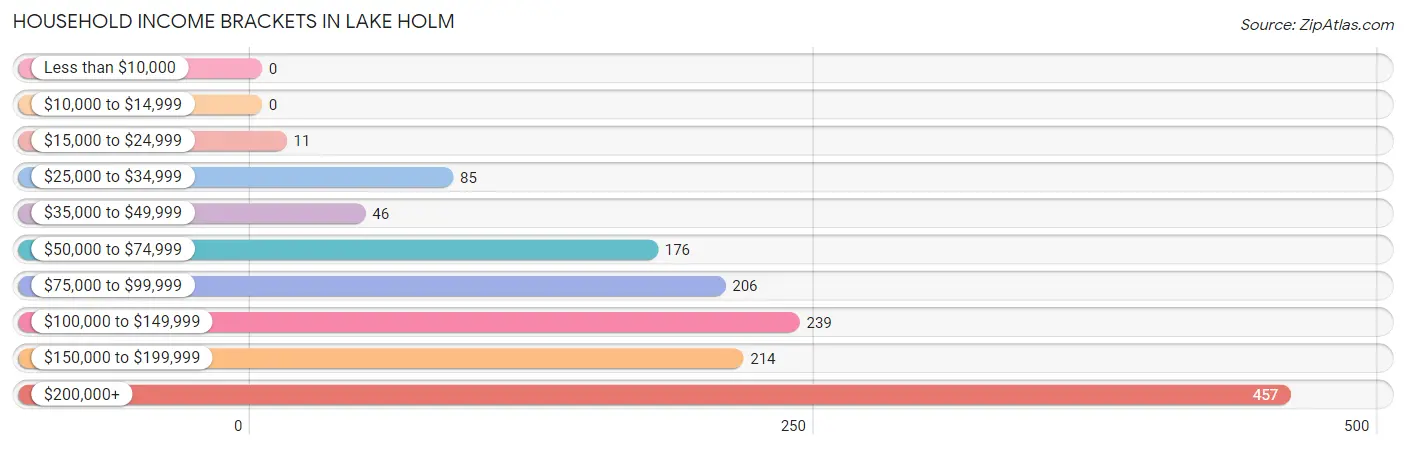
Household Income Brackets in Lake Holm
With 457 households falling in the category, the $200,000+ income range is the most frequent in Lake Holm, accounting for 31.9% of all households.
| Income Bracket | # Households | % Households |
| Less than $10,000 | 0 | 0.0% |
| $10,000 to $14,999 | 0 | 0.0% |
| $15,000 to $24,999 | 11 | 0.8% |
| $25,000 to $34,999 | 85 | 5.9% |
| $35,000 to $49,999 | 46 | 3.2% |
| $50,000 to $74,999 | 176 | 12.3% |
| $75,000 to $99,999 | 206 | 14.4% |
| $100,000 to $149,999 | 239 | 16.7% |
| $150,000 to $199,999 | 214 | 14.9% |
| $200,000+ | 457 | 31.9% |
Household Income by Householder Age in Lake Holm
The median household income in Lake Holm is $119,568, with the highest median household income of $155,909 found in the 25 to 44 years age bracket for the primary householder. A total of 330 households (23.0%) fall into this category. Meanwhile, the 15 to 24 years age bracket for the primary householder has the lowest median household income of $0, with 33 households (2.3%) in this group.
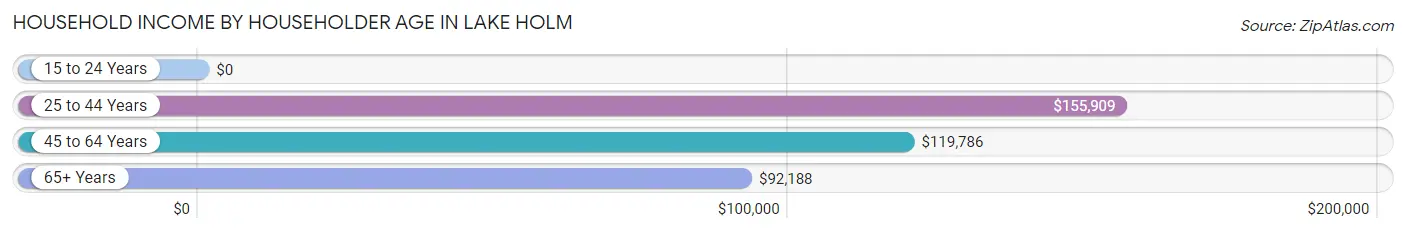
| Income Bracket | # Households | Median Income |
| 15 to 24 Years | 33 (2.3%) | $0 |
| 25 to 44 Years | 330 (23.0%) | $155,909 |
| 45 to 64 Years | 692 (48.3%) | $119,786 |
| 65+ Years | 379 (26.4%) | $92,188 |
| Total | 1,434 (100.0%) | $119,568 |
Poverty in Lake Holm
Income Below Poverty by Sex and Age in Lake Holm
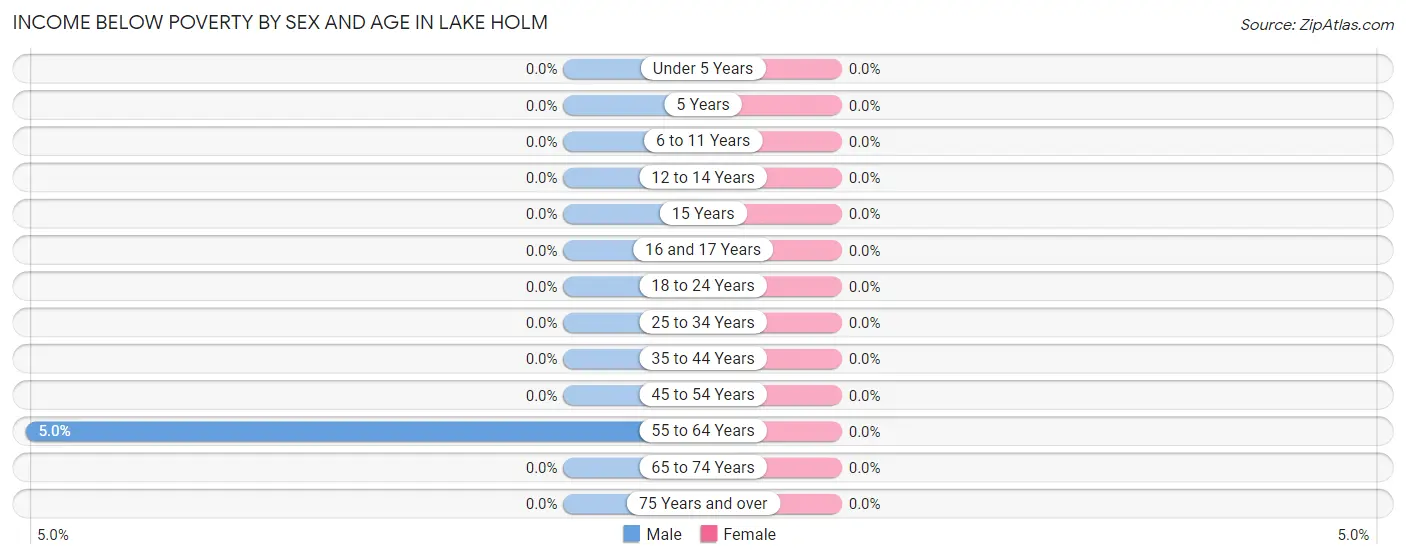
| Age Bracket | Male | Female |
| Under 5 Years | 0 (0.0%) | 0 (0.0%) |
| 5 Years | 0 (0.0%) | 0 (0.0%) |
| 6 to 11 Years | 0 (0.0%) | 0 (0.0%) |
| 12 to 14 Years | 0 (0.0%) | 0 (0.0%) |
| 15 Years | 0 (0.0%) | 0 (0.0%) |
| 16 and 17 Years | 0 (0.0%) | 0 (0.0%) |
| 18 to 24 Years | 0 (0.0%) | 0 (0.0%) |
| 25 to 34 Years | 0 (0.0%) | 0 (0.0%) |
| 35 to 44 Years | 0 (0.0%) | 0 (0.0%) |
| 45 to 54 Years | 0 (0.0%) | 0 (0.0%) |
| 55 to 64 Years | 17 (5.0%) | 0 (0.0%) |
| 65 to 74 Years | 0 (0.0%) | 0 (0.0%) |
| 75 Years and over | 0 (0.0%) | 0 (0.0%) |
| Total | 17 (0.9%) | 0 (0.0%) |
Income Above Poverty by Sex and Age in Lake Holm
According to the poverty statistics in Lake Holm, males aged under 5 years and females aged under 5 years are the age groups that are most secure financially, with 100.0% of males and 100.0% of females in these age groups living above the poverty line.
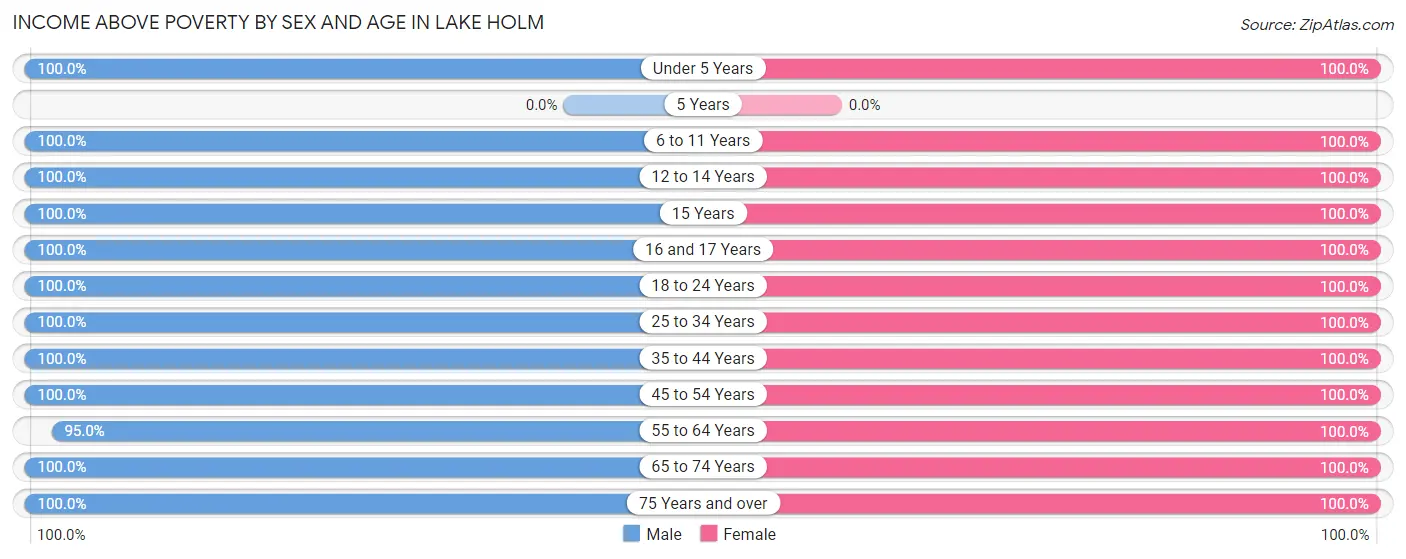
| Age Bracket | Male | Female |
| Under 5 Years | 13 (100.0%) | 148 (100.0%) |
| 5 Years | 0 (0.0%) | 0 (0.0%) |
| 6 to 11 Years | 16 (100.0%) | 29 (100.0%) |
| 12 to 14 Years | 37 (100.0%) | 39 (100.0%) |
| 15 Years | 31 (100.0%) | 46 (100.0%) |
| 16 and 17 Years | 138 (100.0%) | 35 (100.0%) |
| 18 to 24 Years | 160 (100.0%) | 147 (100.0%) |
| 25 to 34 Years | 104 (100.0%) | 124 (100.0%) |
| 35 to 44 Years | 295 (100.0%) | 230 (100.0%) |
| 45 to 54 Years | 317 (100.0%) | 312 (100.0%) |
| 55 to 64 Years | 324 (95.0%) | 313 (100.0%) |
| 65 to 74 Years | 260 (100.0%) | 195 (100.0%) |
| 75 Years and over | 169 (100.0%) | 154 (100.0%) |
| Total | 1,864 (99.1%) | 1,772 (100.0%) |
Income Below Poverty Among Married-Couple Families in Lake Holm
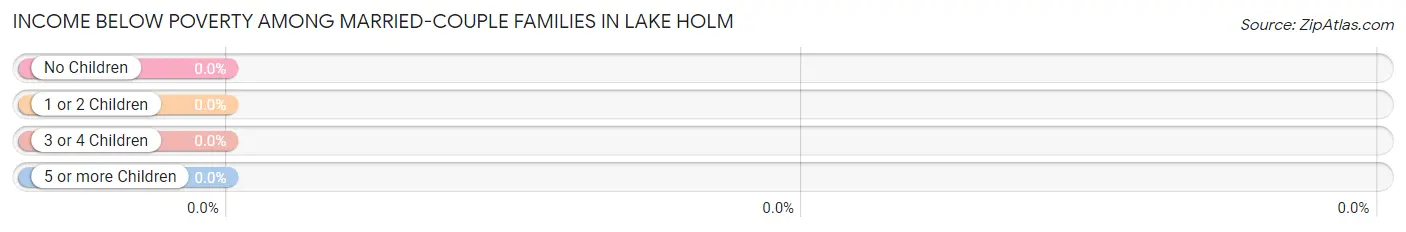
| Children | Above Poverty | Below Poverty |
| No Children | 697 (100.0%) | 0 (0.0%) |
| 1 or 2 Children | 375 (100.0%) | 0 (0.0%) |
| 3 or 4 Children | 0 (0.0%) | 0 (0.0%) |
| 5 or more Children | 0 (0.0%) | 0 (0.0%) |
| Total | 1,072 (100.0%) | 0 (0.0%) |
Income Below Poverty Among Single-Parent Households in Lake Holm
| Children | Single Father | Single Mother |
| No Children | 0 (0.0%) | 0 (0.0%) |
| 1 or 2 Children | 0 (0.0%) | 0 (0.0%) |
| 3 or 4 Children | 0 (0.0%) | 0 (0.0%) |
| 5 or more Children | 0 (0.0%) | 0 (0.0%) |
| Total | 0 (0.0%) | 0 (0.0%) |
Income Below Poverty Among Married-Couple vs Single-Parent Households in Lake Holm
| Children | Married-Couple Families | Single-Parent Households |
| No Children | 0 (0.0%) | 0 (0.0%) |
| 1 or 2 Children | 0 (0.0%) | 0 (0.0%) |
| 3 or 4 Children | 0 (0.0%) | 0 (0.0%) |
| 5 or more Children | 0 (0.0%) | 0 (0.0%) |
| Total | 0 (0.0%) | 0 (0.0%) |
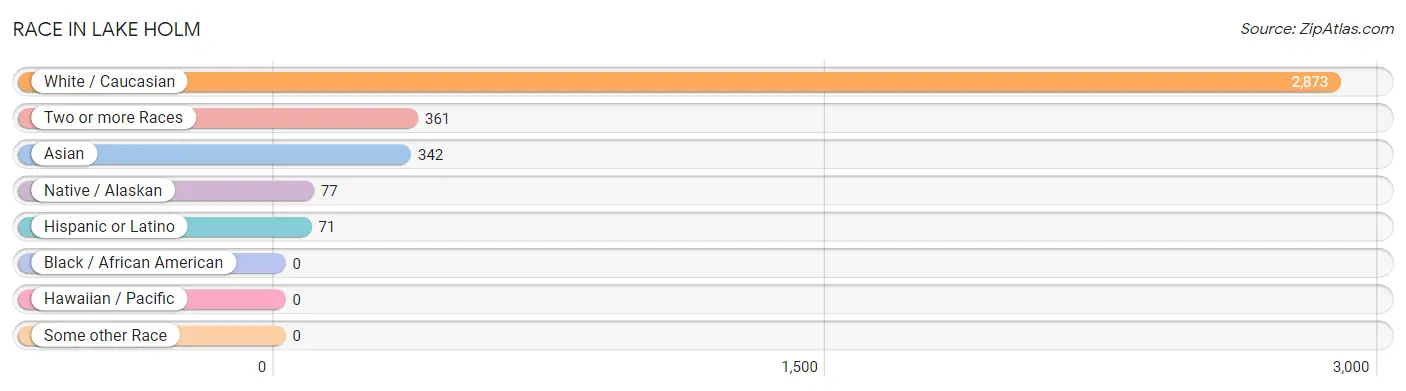
Race in Lake Holm
The most populous races in Lake Holm are White / Caucasian (2,873 | 78.6%), Two or more Races (361 | 9.9%), and Asian (342 | 9.4%).
| Race | # Population | % Population |
| Asian | 342 | 9.4% |
| Black / African American | 0 | 0.0% |
| Hawaiian / Pacific | 0 | 0.0% |
| Hispanic or Latino | 71 | 1.9% |
| Native / Alaskan | 77 | 2.1% |
| White / Caucasian | 2,873 | 78.6% |
| Two or more Races | 361 | 9.9% |
| Some other Race | 0 | 0.0% |
| Total | 3,653 | 100.0% |
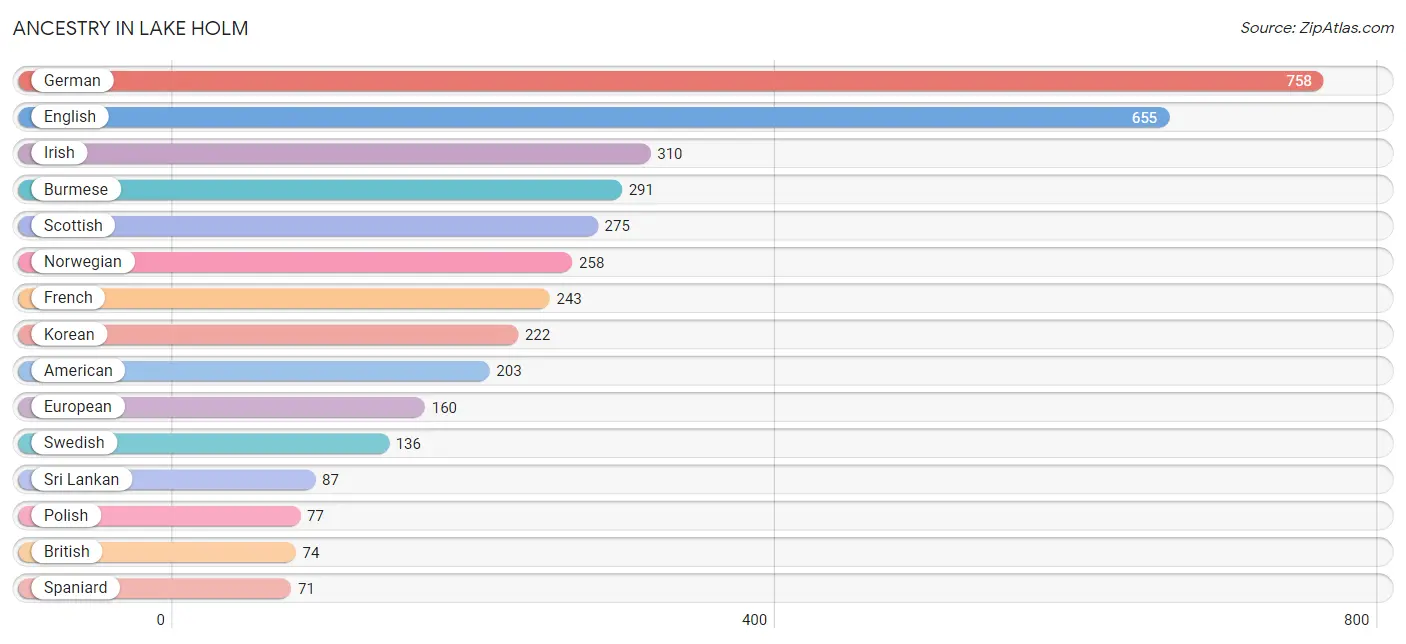
Ancestry in Lake Holm
The most populous ancestries reported in Lake Holm are German (758 | 20.7%), English (655 | 17.9%), Irish (310 | 8.5%), Burmese (291 | 8.0%), and Scottish (275 | 7.5%), together accounting for 62.7% of all Lake Holm residents.
| Ancestry | # Population | % Population |
| American | 203 | 5.6% |
| British | 74 | 2.0% |
| Burmese | 291 | 8.0% |
| Choctaw | 55 | 1.5% |
| Czech | 22 | 0.6% |
| Dutch | 30 | 0.8% |
| English | 655 | 17.9% |
| European | 160 | 4.4% |
| Finnish | 26 | 0.7% |
| French | 243 | 6.7% |
| French Canadian | 33 | 0.9% |
| German | 758 | 20.7% |
| Irish | 310 | 8.5% |
| Italian | 27 | 0.7% |
| Korean | 222 | 6.1% |
| Northern European | 50 | 1.4% |
| Norwegian | 258 | 7.1% |
| Polish | 77 | 2.1% |
| Portuguese | 17 | 0.5% |
| Pueblo | 3 | 0.1% |
| Puget Sound Salish | 60 | 1.6% |
| Russian | 17 | 0.5% |
| Scotch-Irish | 15 | 0.4% |
| Scottish | 275 | 7.5% |
| Spaniard | 71 | 1.9% |
| Sri Lankan | 87 | 2.4% |
| Swedish | 136 | 3.7% |
| Swiss | 66 | 1.8% |
| Thai | 19 | 0.5% |
| Ukrainian | 27 | 0.7% |
| Welsh | 44 | 1.2% | View All 31 Rows |
Immigrants in Lake Holm
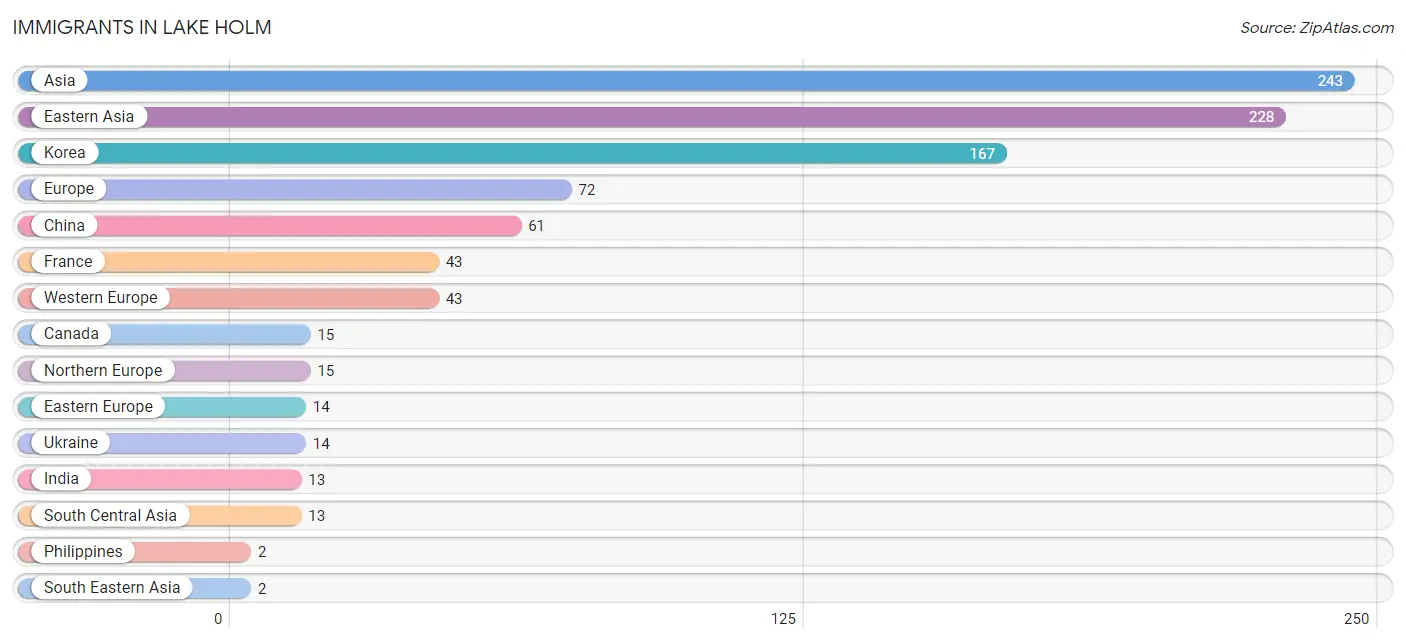
The most numerous immigrant groups reported in Lake Holm came from Asia (243 | 6.7%), Eastern Asia (228 | 6.2%), Korea (167 | 4.6%), Europe (72 | 2.0%), and China (61 | 1.7%), together accounting for 21.1% of all Lake Holm residents.
| Immigration Origin | # Population | % Population |
| Asia | 243 | 6.7% |
| Canada | 15 | 0.4% |
| China | 61 | 1.7% |
| Eastern Asia | 228 | 6.2% |
| Eastern Europe | 14 | 0.4% |
| Europe | 72 | 2.0% |
| France | 43 | 1.2% |
| India | 13 | 0.4% |
| Korea | 167 | 4.6% |
| Northern Europe | 15 | 0.4% |
| Philippines | 2 | 0.1% |
| South Central Asia | 13 | 0.4% |
| South Eastern Asia | 2 | 0.1% |
| Ukraine | 14 | 0.4% |
| Western Europe | 43 | 1.2% | View All 15 Rows |
Sex and Age in Lake Holm
Sex and Age in Lake Holm
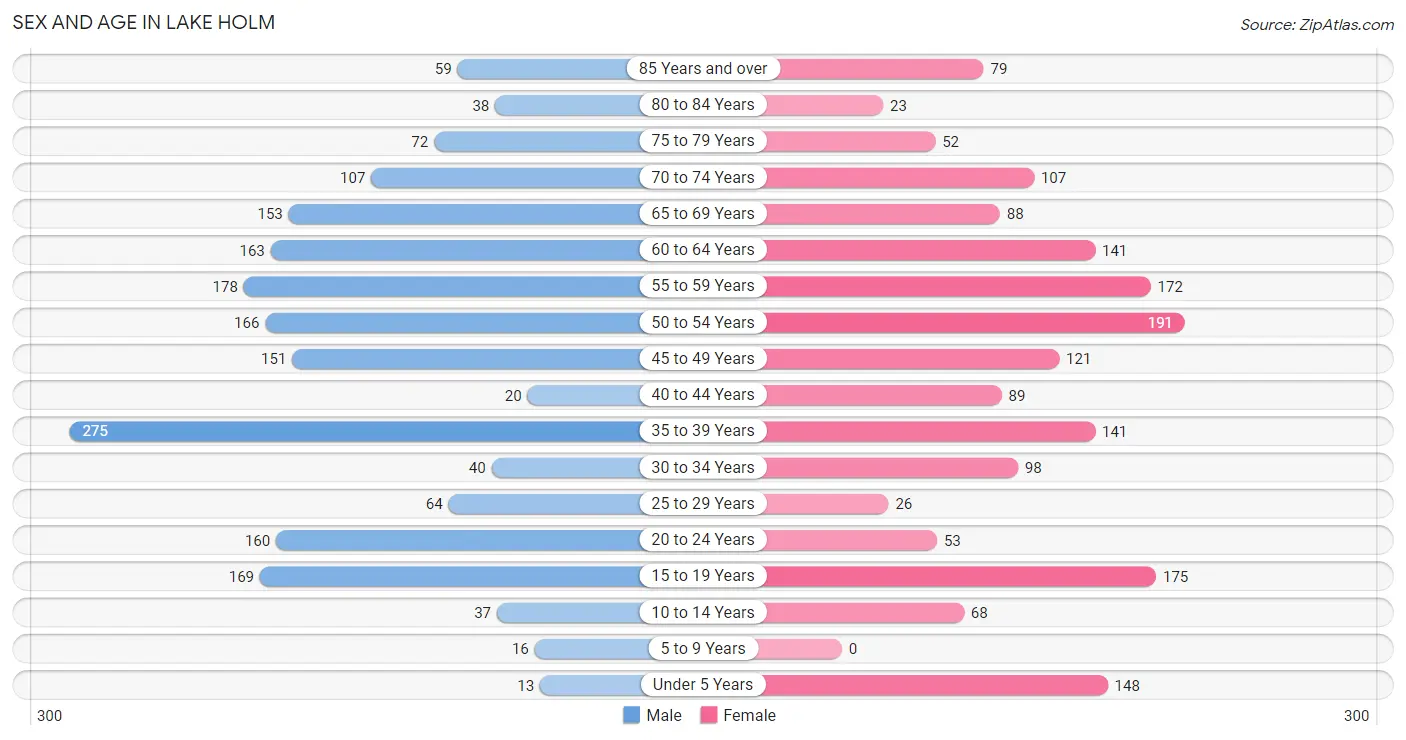
The most populous age groups in Lake Holm are 35 to 39 Years (275 | 14.6%) for men and 50 to 54 Years (191 | 10.8%) for women.
| Age Bracket | Male | Female |
| Under 5 Years | 13 (0.7%) | 148 (8.4%) |
| 5 to 9 Years | 16 (0.9%) | 0 (0.0%) |
| 10 to 14 Years | 37 (2.0%) | 68 (3.8%) |
| 15 to 19 Years | 169 (9.0%) | 175 (9.9%) |
| 20 to 24 Years | 160 (8.5%) | 53 (3.0%) |
| 25 to 29 Years | 64 (3.4%) | 26 (1.5%) |
| 30 to 34 Years | 40 (2.1%) | 98 (5.5%) |
| 35 to 39 Years | 275 (14.6%) | 141 (8.0%) |
| 40 to 44 Years | 20 (1.1%) | 89 (5.0%) |
| 45 to 49 Years | 151 (8.0%) | 121 (6.8%) |
| 50 to 54 Years | 166 (8.8%) | 191 (10.8%) |
| 55 to 59 Years | 178 (9.5%) | 172 (9.7%) |
| 60 to 64 Years | 163 (8.7%) | 141 (8.0%) |
| 65 to 69 Years | 153 (8.1%) | 88 (5.0%) |
| 70 to 74 Years | 107 (5.7%) | 107 (6.0%) |
| 75 to 79 Years | 72 (3.8%) | 52 (2.9%) |
| 80 to 84 Years | 38 (2.0%) | 23 (1.3%) |
| 85 Years and over | 59 (3.1%) | 79 (4.5%) |
| Total | 1,881 (100.0%) | 1,772 (100.0%) |
Families and Households in Lake Holm
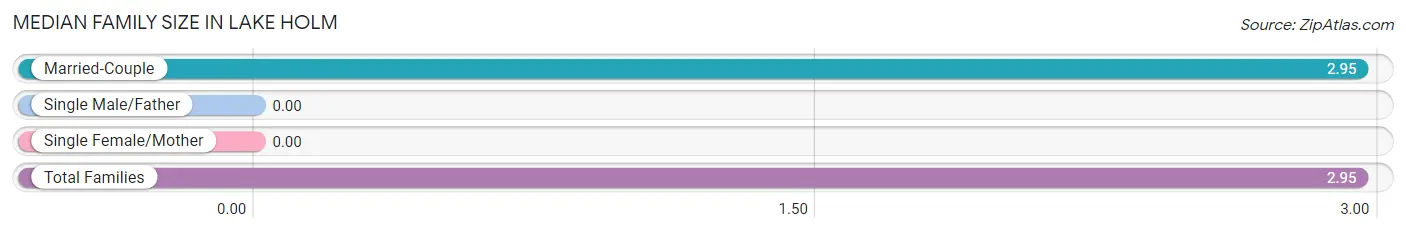
Median Family Size in Lake Holm
| Family Type | # Families | Family Size |
| Married-Couple | 1,072 (100.0%) | 2.95 |
| Single Male/Father | 0 (0.0%) | - |
| Single Female/Mother | 0 (0.0%) | - |
| Total Families | 1,072 (100.0%) | 2.95 |
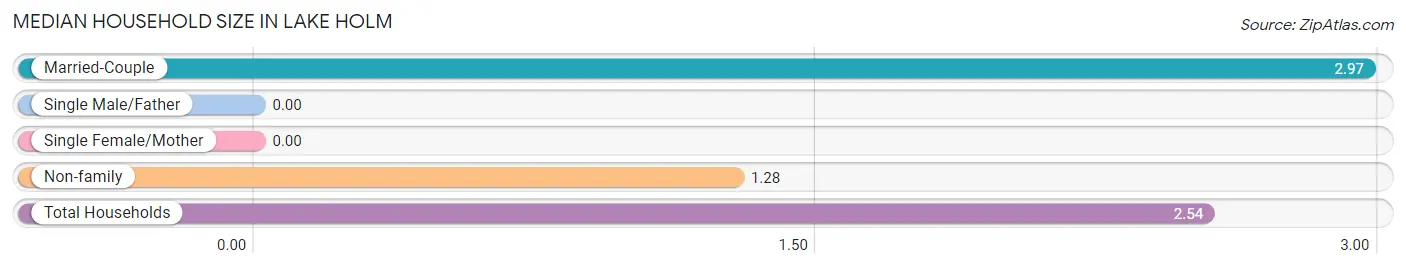
Median Household Size in Lake Holm
| Household Type | # Households | Household Size |
| Married-Couple | 1,072 (74.8%) | 2.97 |
| Single Male/Father | 0 (0.0%) | - |
| Single Female/Mother | 0 (0.0%) | - |
| Non-family | 362 (25.2%) | 1.28 |
| Total Households | 1,434 (100.0%) | 2.54 |
Household Size by Marriage Status in Lake Holm
Out of a total of 1,434 households in Lake Holm, 1,072 (74.8%) are family households, while 362 (25.2%) are nonfamily households. The most numerous type of family households are 2-person households, comprising 582, and the most common type of nonfamily households are 1-person households, comprising 263.
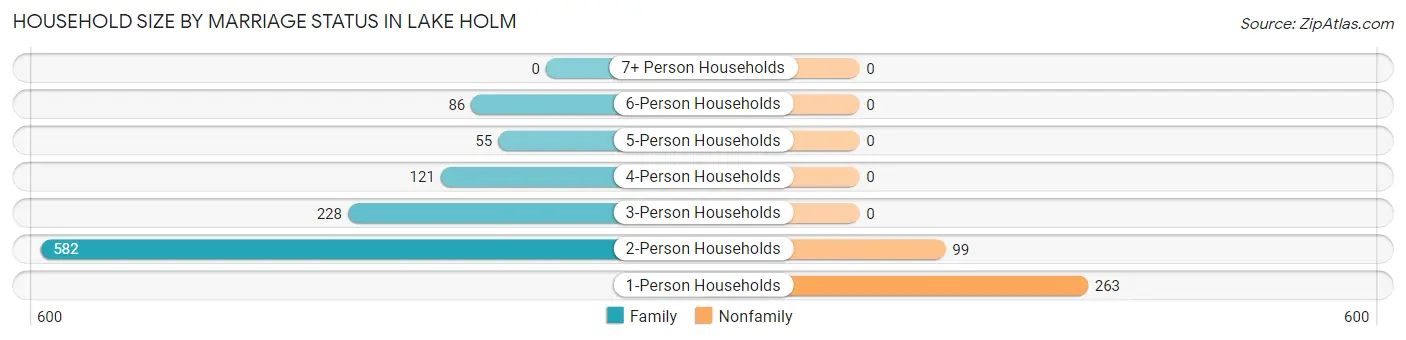
| Household Size | Family Households | Nonfamily Households |
| 1-Person Households | - | 263 (18.3%) |
| 2-Person Households | 582 (40.6%) | 99 (6.9%) |
| 3-Person Households | 228 (15.9%) | 0 (0.0%) |
| 4-Person Households | 121 (8.4%) | 0 (0.0%) |
| 5-Person Households | 55 (3.8%) | 0 (0.0%) |
| 6-Person Households | 86 (6.0%) | 0 (0.0%) |
| 7+ Person Households | 0 (0.0%) | 0 (0.0%) |
| Total | 1,072 (74.8%) | 362 (25.2%) |
Female Fertility in Lake Holm
Fertility by Age in Lake Holm
Average fertility rate in Lake Holm is 27.0 births per 1,000 women. Women in the age bracket of 20 to 34 years have the highest fertility rate with 107.0 births per 1,000 women. Women in the age bracket of 20 to 34 years acount for 100.0% of all women with births.
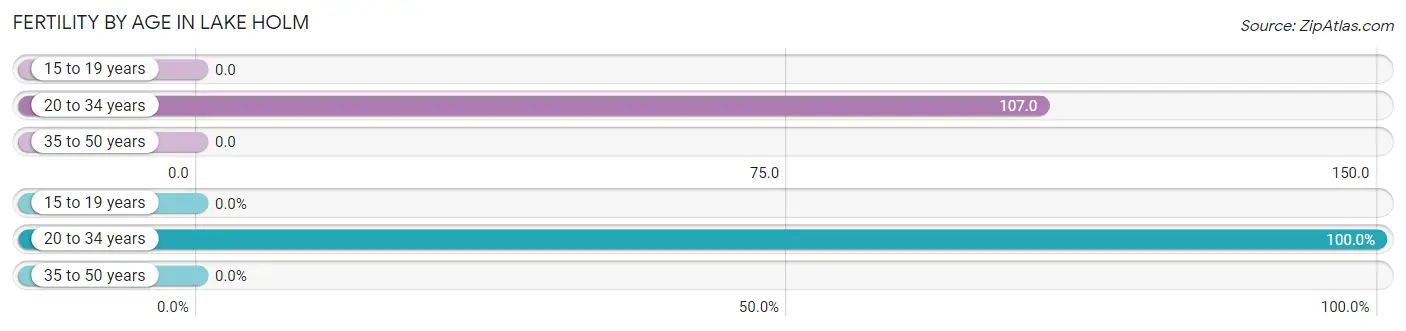
| Age Bracket | Women with Births | Births / 1,000 Women |
| 15 to 19 years | 0 (0.0%) | 0.0 |
| 20 to 34 years | 19 (100.0%) | 107.0 |
| 35 to 50 years | 0 (0.0%) | 0.0 |
| Total | 19 (100.0%) | 27.0 |
Fertility by Age by Marriage Status in Lake Holm
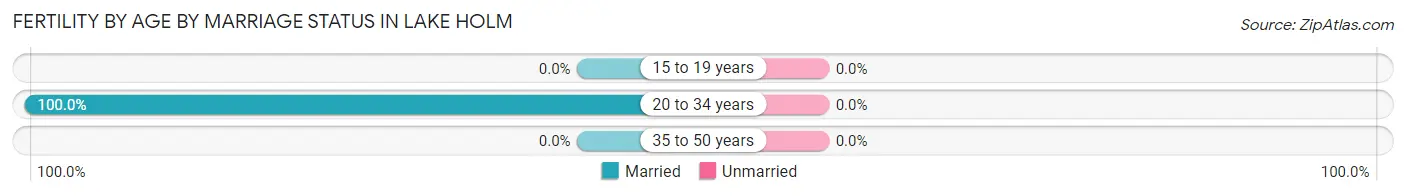
| Age Bracket | Married | Unmarried |
| 15 to 19 years | 0 (0.0%) | 0 (0.0%) |
| 20 to 34 years | 19 (100.0%) | 0 (0.0%) |
| 35 to 50 years | 0 (0.0%) | 0 (0.0%) |
| Total | 19 (100.0%) | 0 (0.0%) |
Fertility by Education in Lake Holm
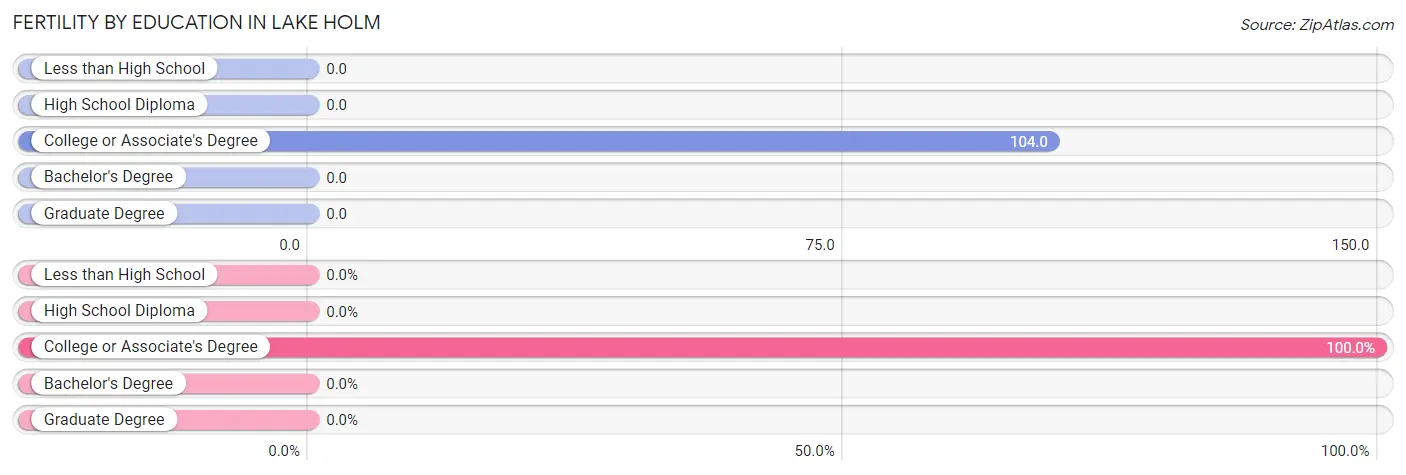
| Educational Attainment | Women with Births | Births / 1,000 Women |
| Less than High School | 0 (0.0%) | 0.0 |
| High School Diploma | 0 (0.0%) | 0.0 |
| College or Associate's Degree | 19 (100.0%) | 104.0 |
| Bachelor's Degree | 0 (0.0%) | 0.0 |
| Graduate Degree | 0 (0.0%) | 0.0 |
| Total | 19 (100.0%) | 27.0 |
Fertility by Education by Marriage Status in Lake Holm
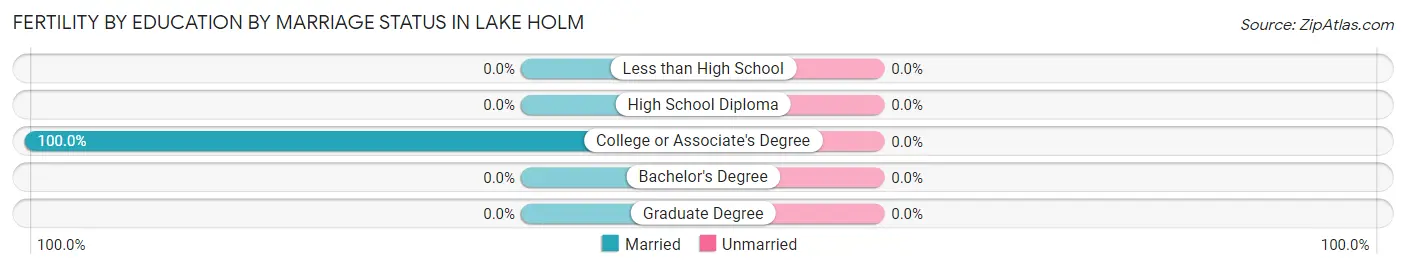
| Educational Attainment | Married | Unmarried |
| Less than High School | 0 (0.0%) | 0 (0.0%) |
| High School Diploma | 0 (0.0%) | 0 (0.0%) |
| College or Associate's Degree | 19 (100.0%) | 0 (0.0%) |
| Bachelor's Degree | 0 (0.0%) | 0 (0.0%) |
| Graduate Degree | 0 (0.0%) | 0 (0.0%) |
| Total | 19 (100.0%) | 0 (0.0%) |
Employment Characteristics in Lake Holm
Employment by Class of Employer in Lake Holm
Among the 2,017 employed individuals in Lake Holm, private company employees (1,389 | 68.9%), local government employees (172 | 8.5%), and not-for-profit organizations (157 | 7.8%) make up the most common classes of employment.
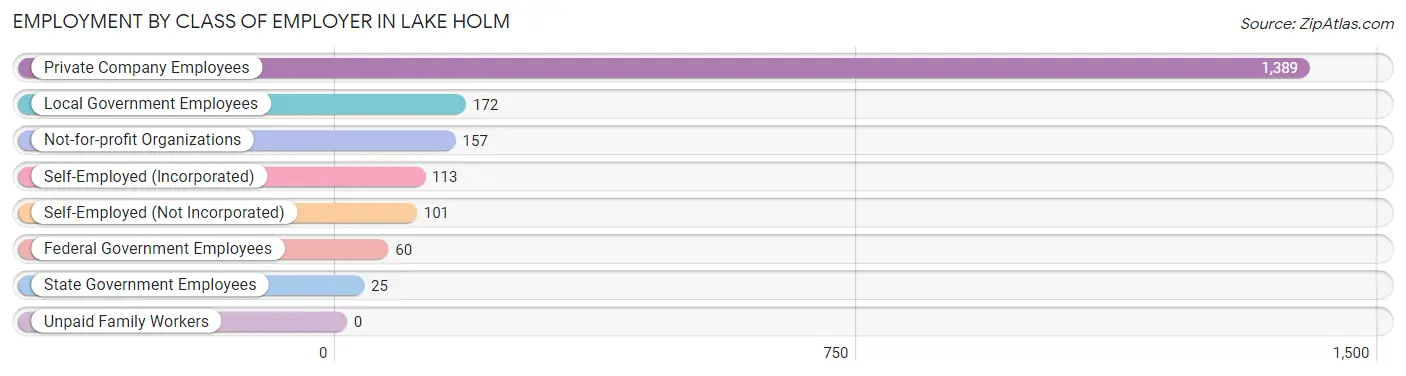
| Employer Class | # Employees | % Employees |
| Private Company Employees | 1,389 | 68.9% |
| Self-Employed (Incorporated) | 113 | 5.6% |
| Self-Employed (Not Incorporated) | 101 | 5.0% |
| Not-for-profit Organizations | 157 | 7.8% |
| Local Government Employees | 172 | 8.5% |
| State Government Employees | 25 | 1.2% |
| Federal Government Employees | 60 | 3.0% |
| Unpaid Family Workers | 0 | 0.0% |
| Total | 2,017 | 100.0% |
Employment Status by Age in Lake Holm
According to the labor force statistics for Lake Holm, out of the total population over 16 years of age (3,294), 65.3% or 2,151 individuals are in the labor force, with 0.9% or 19 of them unemployed. The age group with the highest labor force participation rate is 20 to 24 years, with 100.0% or 213 individuals in the labor force. Within the labor force, the 30 to 34 years age range has the highest percentage of unemployed individuals, with 14.5% or 20 of them being unemployed.
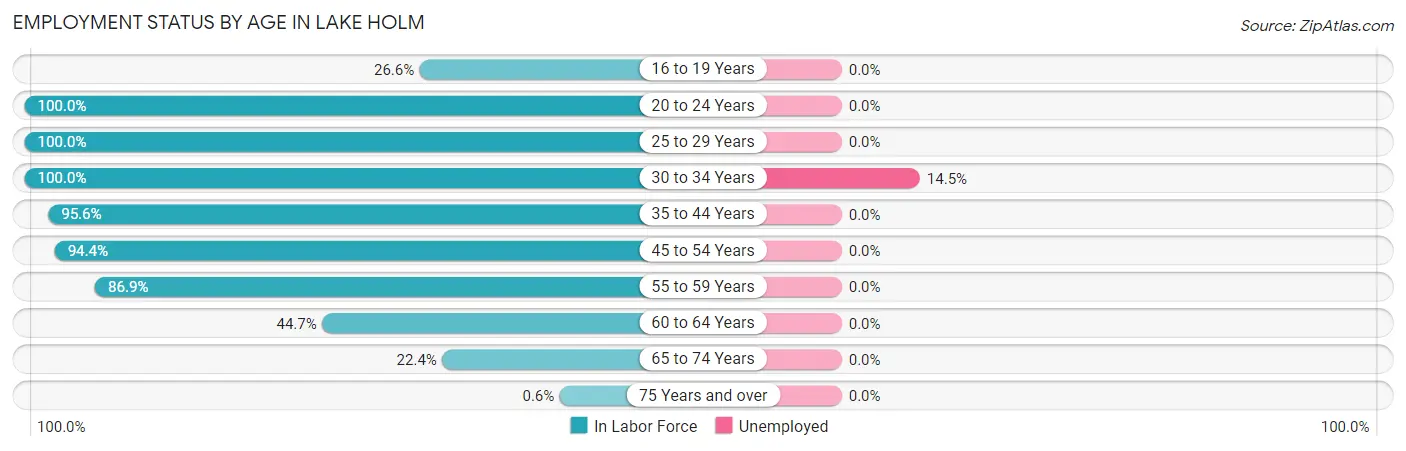
| Age Bracket | In Labor Force | Unemployed |
| 16 to 19 Years | 71 (26.6%) | 0 (0.0%) |
| 20 to 24 Years | 213 (100.0%) | 0 (0.0%) |
| 25 to 29 Years | 90 (100.0%) | 0 (0.0%) |
| 30 to 34 Years | 138 (100.0%) | 20 (14.5%) |
| 35 to 44 Years | 502 (95.6%) | 0 (0.0%) |
| 45 to 54 Years | 594 (94.4%) | 0 (0.0%) |
| 55 to 59 Years | 304 (86.9%) | 0 (0.0%) |
| 60 to 64 Years | 136 (44.7%) | 0 (0.0%) |
| 65 to 74 Years | 102 (22.4%) | 0 (0.0%) |
| 75 Years and over | 2 (0.6%) | 0 (0.0%) |
| Total | 2,151 (65.3%) | 19 (0.9%) |
Employment Status by Educational Attainment in Lake Holm
According to labor force statistics for Lake Holm, 86.6% of individuals (1,763) out of the total population between 25 and 64 years of age (2,036) are in the labor force, with 1.1% or 19 of them being unemployed. The group with the highest labor force participation rate are those with the educational attainment of bachelor's degree or higher, with 94.0% or 908 individuals in the labor force. Within the labor force, individuals with high school diploma education have the highest percentage of unemployment, with 6.3% or 20 of them being unemployed.
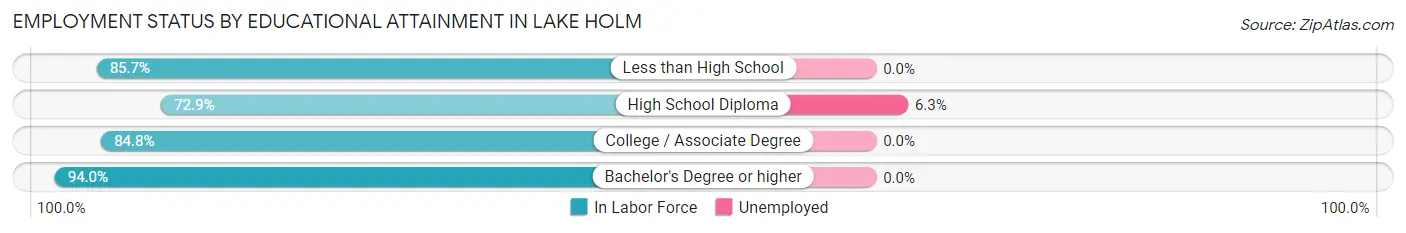
| Educational Attainment | In Labor Force | Unemployed |
| Less than High School | 90 (85.7%) | 0 (0.0%) |
| High School Diploma | 320 (72.9%) | 28 (6.3%) |
| College / Associate Degree | 446 (84.8%) | 0 (0.0%) |
| Bachelor's Degree or higher | 908 (94.0%) | 0 (0.0%) |
| Total | 1,763 (86.6%) | 22 (1.1%) |
Employment Occupations by Sex in Lake Holm
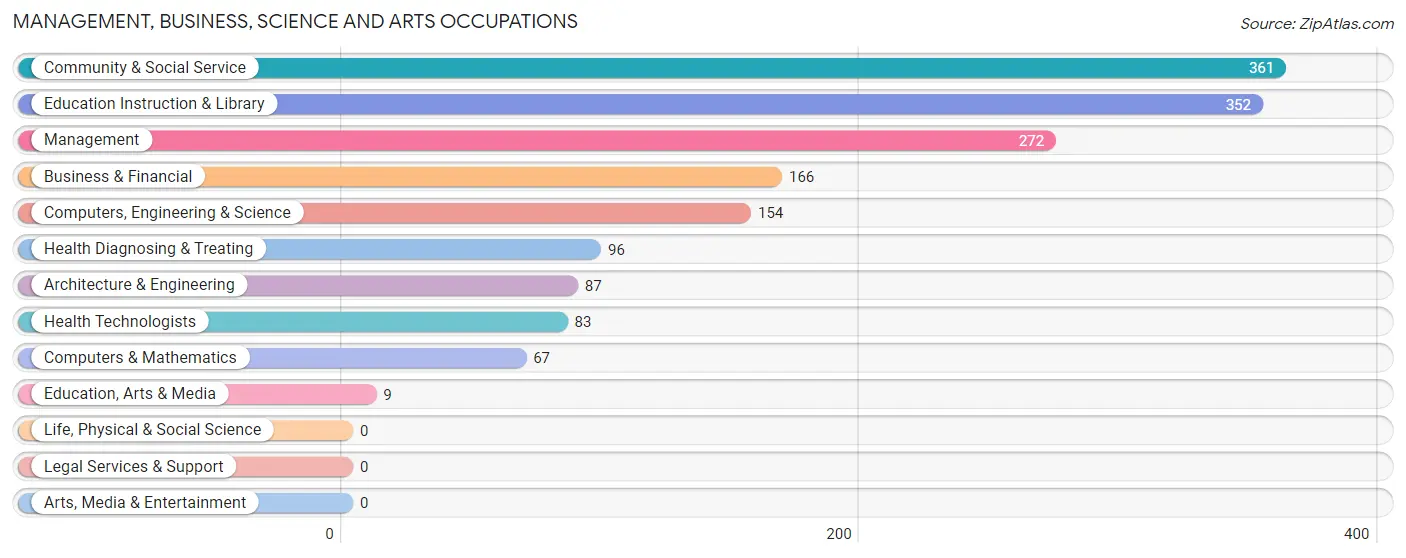
Management, Business, Science and Arts Occupations
The most common Management, Business, Science and Arts occupations in Lake Holm are Community & Social Service (361 | 16.9%), Education Instruction & Library (352 | 16.5%), Management (272 | 12.8%), Business & Financial (166 | 7.8%), and Computers, Engineering & Science (154 | 7.2%).
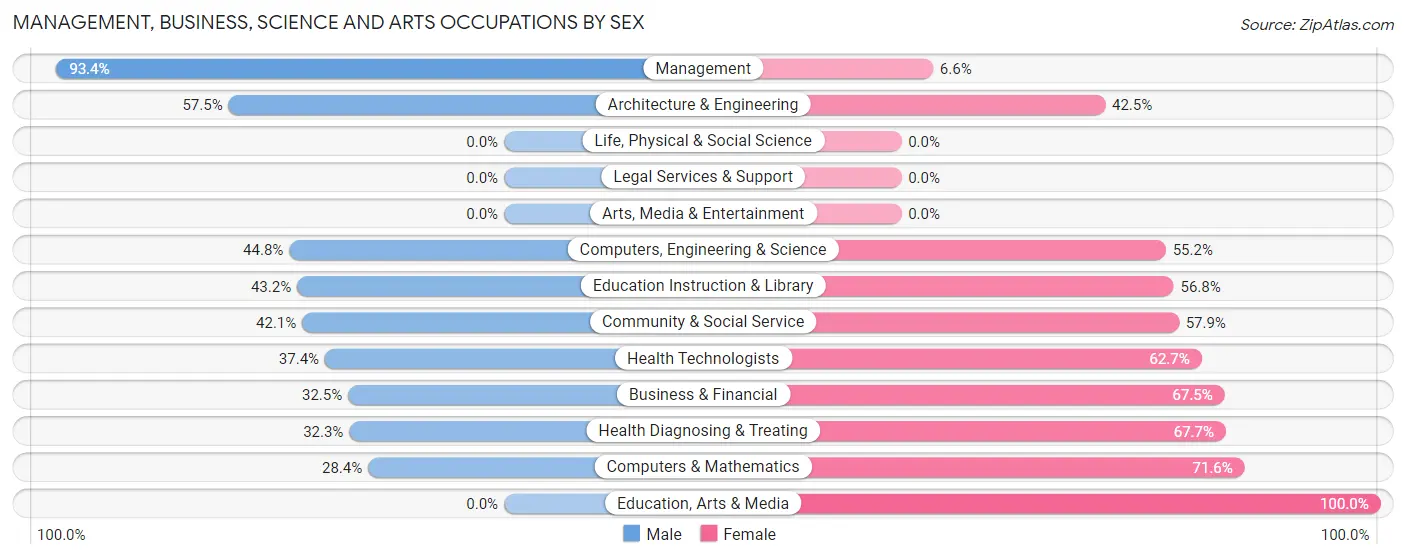
Management, Business, Science and Arts Occupations by Sex
Within the Management, Business, Science and Arts occupations in Lake Holm, the most male-oriented occupations are Management (93.4%), Architecture & Engineering (57.5%), and Computers, Engineering & Science (44.8%), while the most female-oriented occupations are Education, Arts & Media (100.0%), Computers & Mathematics (71.6%), and Health Diagnosing & Treating (67.7%).
| Occupation | Male | Female |
| Management | 254 (93.4%) | 18 (6.6%) |
| Business & Financial | 54 (32.5%) | 112 (67.5%) |
| Computers, Engineering & Science | 69 (44.8%) | 85 (55.2%) |
| Computers & Mathematics | 19 (28.4%) | 48 (71.6%) |
| Architecture & Engineering | 50 (57.5%) | 37 (42.5%) |
| Life, Physical & Social Science | 0 (0.0%) | 0 (0.0%) |
| Community & Social Service | 152 (42.1%) | 209 (57.9%) |
| Education, Arts & Media | 0 (0.0%) | 9 (100.0%) |
| Legal Services & Support | 0 (0.0%) | 0 (0.0%) |
| Education Instruction & Library | 152 (43.2%) | 200 (56.8%) |
| Arts, Media & Entertainment | 0 (0.0%) | 0 (0.0%) |
| Health Diagnosing & Treating | 31 (32.3%) | 65 (67.7%) |
| Health Technologists | 31 (37.3%) | 52 (62.6%) |
| Total (Category) | 560 (53.4%) | 489 (46.6%) |
| Total (Overall) | 1,208 (56.7%) | 924 (43.3%) |
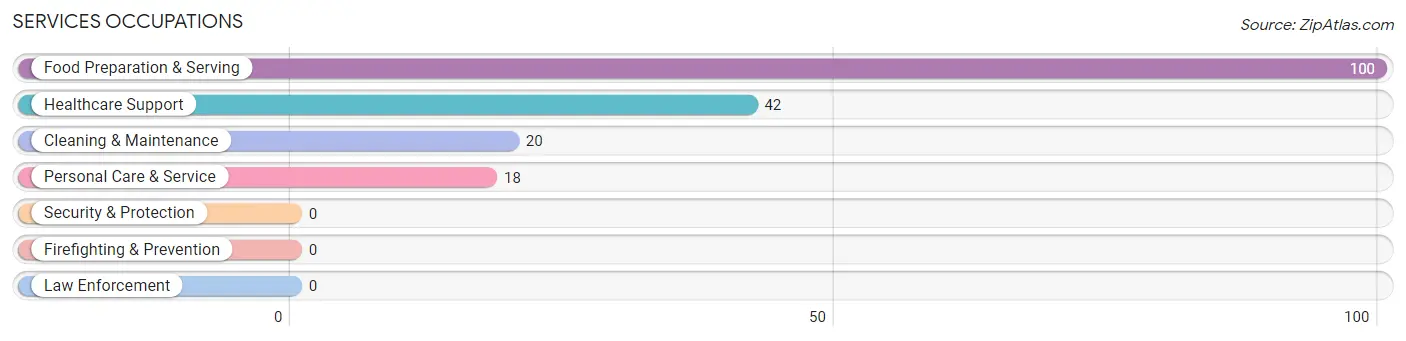
Services Occupations
The most common Services occupations in Lake Holm are Food Preparation & Serving (100 | 4.7%), Healthcare Support (42 | 2.0%), Cleaning & Maintenance (20 | 0.9%), and Personal Care & Service (18 | 0.8%).
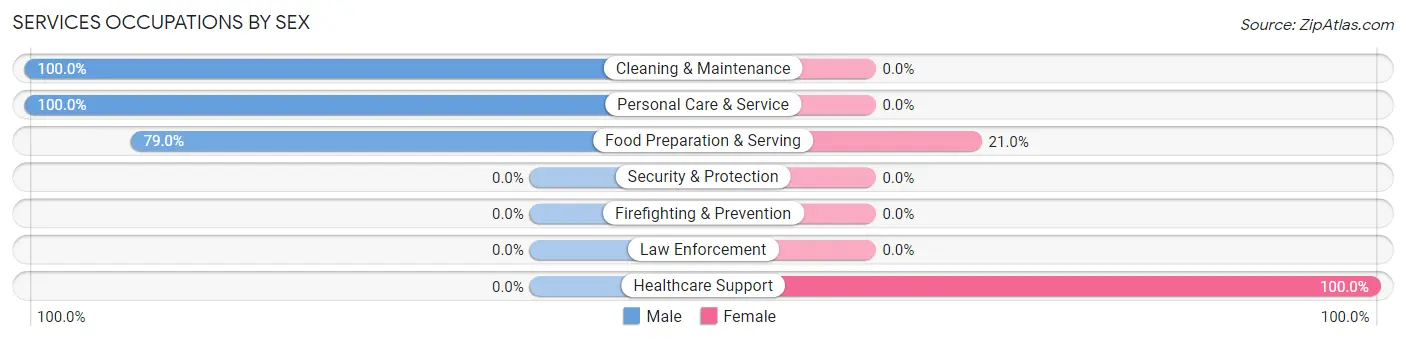
Services Occupations by Sex
Within the Services occupations in Lake Holm, the most male-oriented occupations are Cleaning & Maintenance (100.0%), Personal Care & Service (100.0%), and Food Preparation & Serving (79.0%), while the most female-oriented occupations are Healthcare Support (100.0%), and Food Preparation & Serving (21.0%).
| Occupation | Male | Female |
| Healthcare Support | 0 (0.0%) | 42 (100.0%) |
| Security & Protection | 0 (0.0%) | 0 (0.0%) |
| Firefighting & Prevention | 0 (0.0%) | 0 (0.0%) |
| Law Enforcement | 0 (0.0%) | 0 (0.0%) |
| Food Preparation & Serving | 79 (79.0%) | 21 (21.0%) |
| Cleaning & Maintenance | 20 (100.0%) | 0 (0.0%) |
| Personal Care & Service | 18 (100.0%) | 0 (0.0%) |
| Total (Category) | 117 (65.0%) | 63 (35.0%) |
| Total (Overall) | 1,208 (56.7%) | 924 (43.3%) |
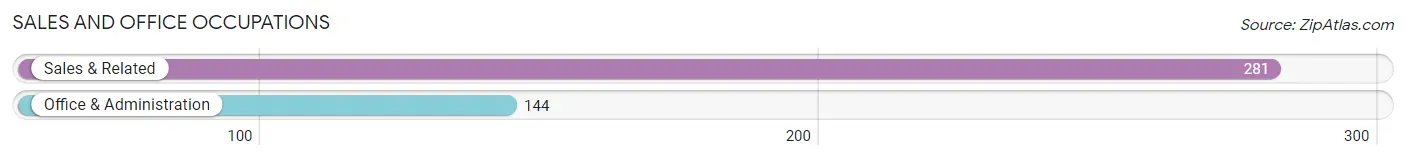
Sales and Office Occupations
The most common Sales and Office occupations in Lake Holm are Sales & Related (281 | 13.2%), and Office & Administration (144 | 6.8%).
Sales and Office Occupations by Sex
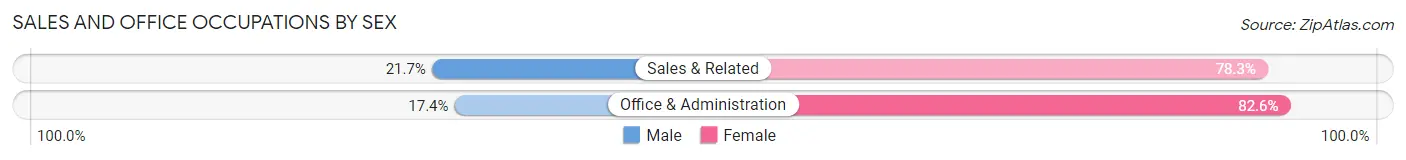
| Occupation | Male | Female |
| Sales & Related | 61 (21.7%) | 220 (78.3%) |
| Office & Administration | 25 (17.4%) | 119 (82.6%) |
| Total (Category) | 86 (20.2%) | 339 (79.8%) |
| Total (Overall) | 1,208 (56.7%) | 924 (43.3%) |
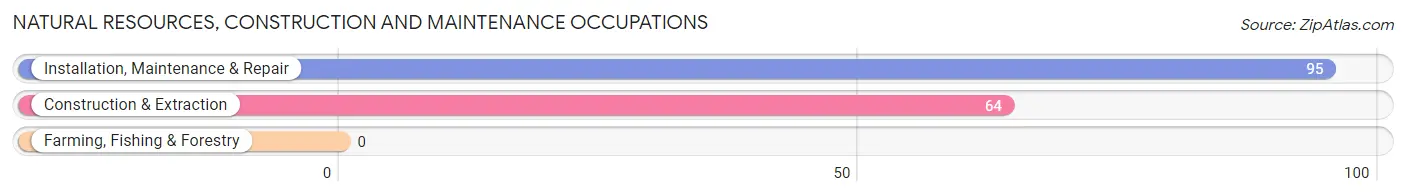
Natural Resources, Construction and Maintenance Occupations
The most common Natural Resources, Construction and Maintenance occupations in Lake Holm are Installation, Maintenance & Repair (95 | 4.5%), and Construction & Extraction (64 | 3.0%).
Natural Resources, Construction and Maintenance Occupations by Sex
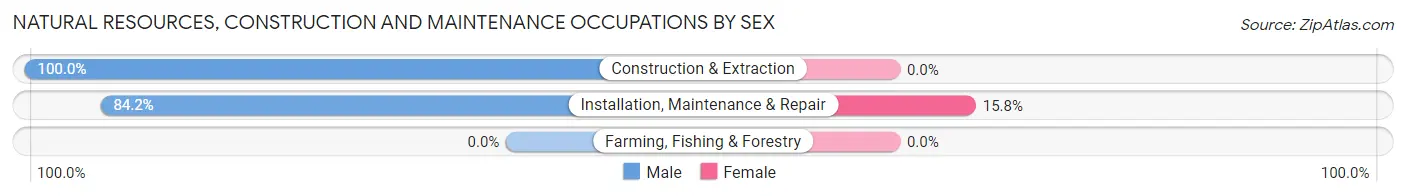
| Occupation | Male | Female |
| Farming, Fishing & Forestry | 0 (0.0%) | 0 (0.0%) |
| Construction & Extraction | 64 (100.0%) | 0 (0.0%) |
| Installation, Maintenance & Repair | 80 (84.2%) | 15 (15.8%) |
| Total (Category) | 144 (90.6%) | 15 (9.4%) |
| Total (Overall) | 1,208 (56.7%) | 924 (43.3%) |
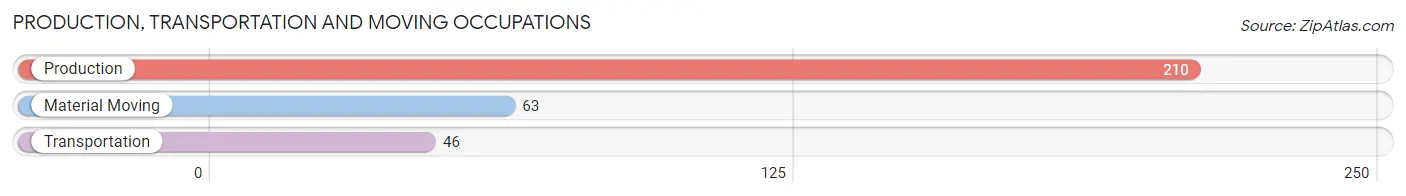
Production, Transportation and Moving Occupations
The most common Production, Transportation and Moving occupations in Lake Holm are Production (210 | 9.9%), Material Moving (63 | 2.9%), and Transportation (46 | 2.2%).
Production, Transportation and Moving Occupations by Sex
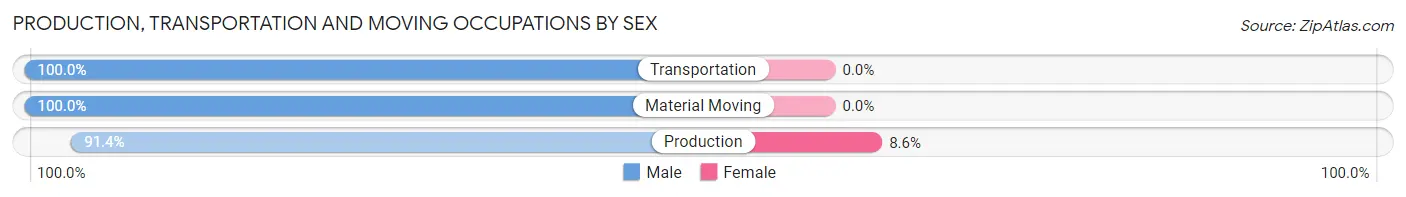
| Occupation | Male | Female |
| Production | 192 (91.4%) | 18 (8.6%) |
| Transportation | 46 (100.0%) | 0 (0.0%) |
| Material Moving | 63 (100.0%) | 0 (0.0%) |
| Total (Category) | 301 (94.4%) | 18 (5.6%) |
| Total (Overall) | 1,208 (56.7%) | 924 (43.3%) |
Employment Industries by Sex in Lake Holm
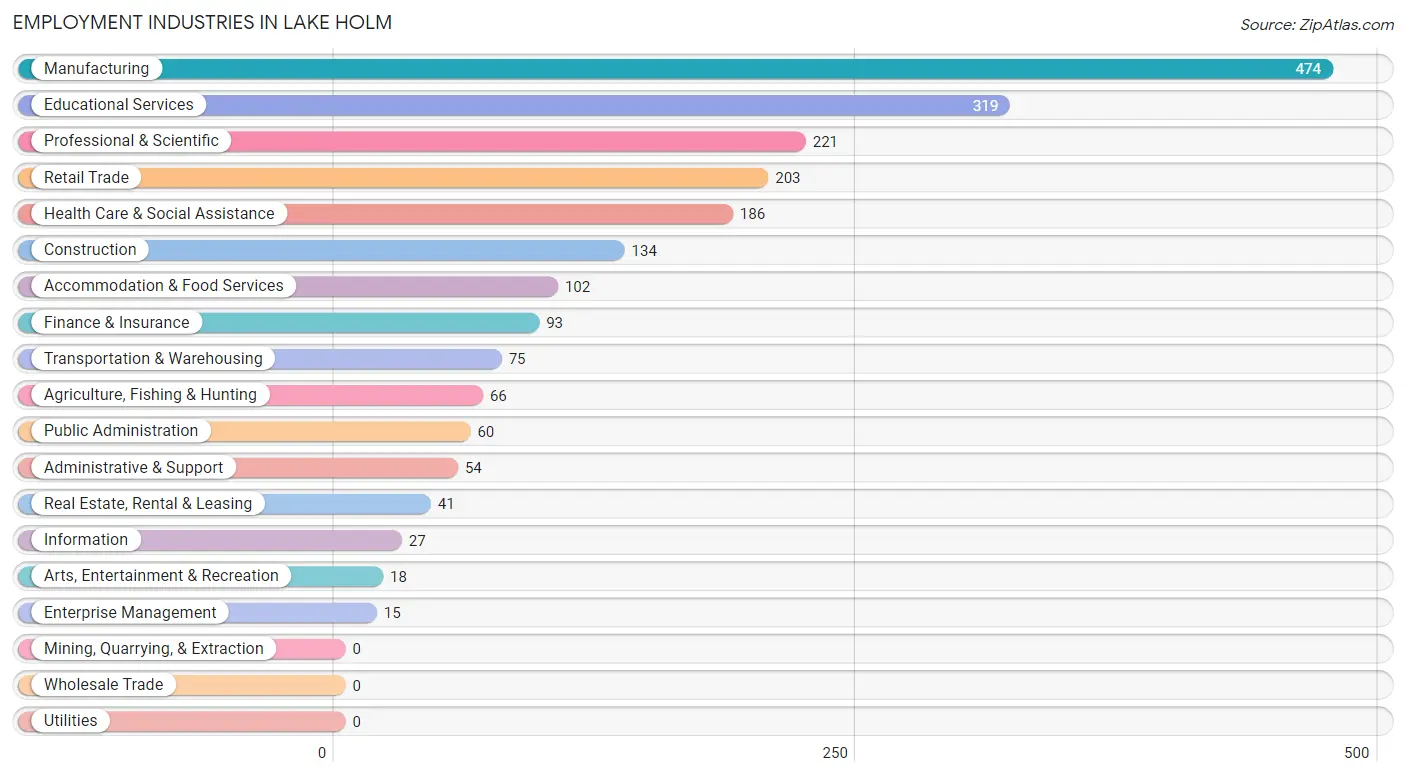
Employment Industries in Lake Holm
The major employment industries in Lake Holm include Manufacturing (474 | 22.2%), Educational Services (319 | 15.0%), Professional & Scientific (221 | 10.4%), Retail Trade (203 | 9.5%), and Health Care & Social Assistance (186 | 8.7%).
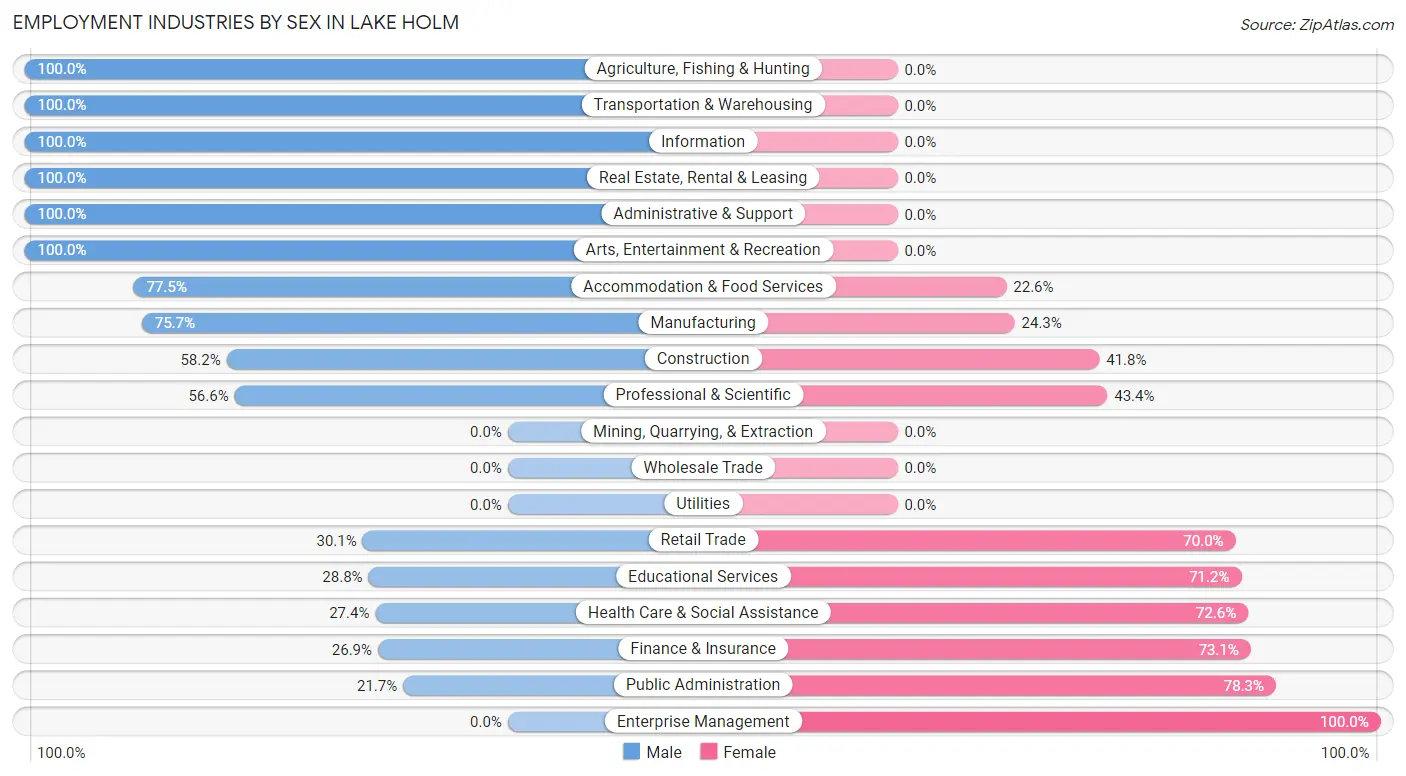
Employment Industries by Sex in Lake Holm
The Lake Holm industries that see more men than women are Agriculture, Fishing & Hunting (100.0%), Transportation & Warehousing (100.0%), and Information (100.0%), whereas the industries that tend to have a higher number of women are Enterprise Management (100.0%), Public Administration (78.3%), and Finance & Insurance (73.1%).
| Industry | Male | Female |
| Agriculture, Fishing & Hunting | 66 (100.0%) | 0 (0.0%) |
| Mining, Quarrying, & Extraction | 0 (0.0%) | 0 (0.0%) |
| Construction | 78 (58.2%) | 56 (41.8%) |
| Manufacturing | 359 (75.7%) | 115 (24.3%) |
| Wholesale Trade | 0 (0.0%) | 0 (0.0%) |
| Retail Trade | 61 (30.0%) | 142 (70.0%) |
| Transportation & Warehousing | 75 (100.0%) | 0 (0.0%) |
| Utilities | 0 (0.0%) | 0 (0.0%) |
| Information | 27 (100.0%) | 0 (0.0%) |
| Finance & Insurance | 25 (26.9%) | 68 (73.1%) |
| Real Estate, Rental & Leasing | 41 (100.0%) | 0 (0.0%) |
| Professional & Scientific | 125 (56.6%) | 96 (43.4%) |
| Enterprise Management | 0 (0.0%) | 15 (100.0%) |
| Administrative & Support | 54 (100.0%) | 0 (0.0%) |
| Educational Services | 92 (28.8%) | 227 (71.2%) |
| Health Care & Social Assistance | 51 (27.4%) | 135 (72.6%) |
| Arts, Entertainment & Recreation | 18 (100.0%) | 0 (0.0%) |
| Accommodation & Food Services | 79 (77.4%) | 23 (22.6%) |
| Public Administration | 13 (21.7%) | 47 (78.3%) |
| Total | 1,208 (56.7%) | 924 (43.3%) |
Education in Lake Holm
School Enrollment in Lake Holm
The most common levels of schooling among the 514 students in Lake Holm are high school (254 | 49.4%), college / undergraduate (98 | 19.1%), and middle school (73 | 14.2%).
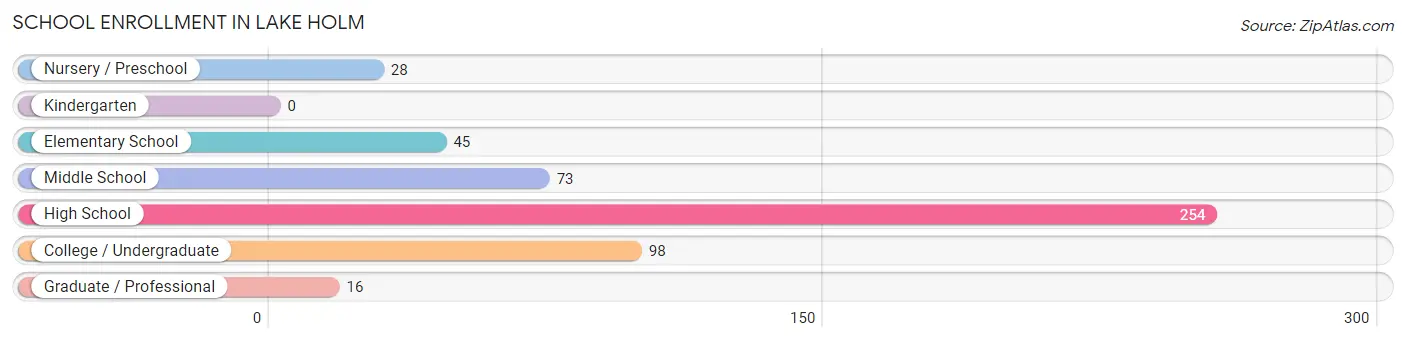
| School Level | # Students | % Students |
| Nursery / Preschool | 28 | 5.4% |
| Kindergarten | 0 | 0.0% |
| Elementary School | 45 | 8.7% |
| Middle School | 73 | 14.2% |
| High School | 254 | 49.4% |
| College / Undergraduate | 98 | 19.1% |
| Graduate / Professional | 16 | 3.1% |
| Total | 514 | 100.0% |
School Enrollment by Age by Funding Source in Lake Holm
Out of a total of 514 students who are enrolled in schools in Lake Holm, 157 (30.5%) attend a private institution, while the remaining 357 (69.5%) are enrolled in public schools. The age group of 3 to 4 year olds has the highest likelihood of being enrolled in private schools, with 28 (100.0% in the age bracket) enrolled. Conversely, the age group of 15 to 17 year olds has the lowest likelihood of being enrolled in a private school, with 228 (100.0% in the age bracket) attending a public institution.
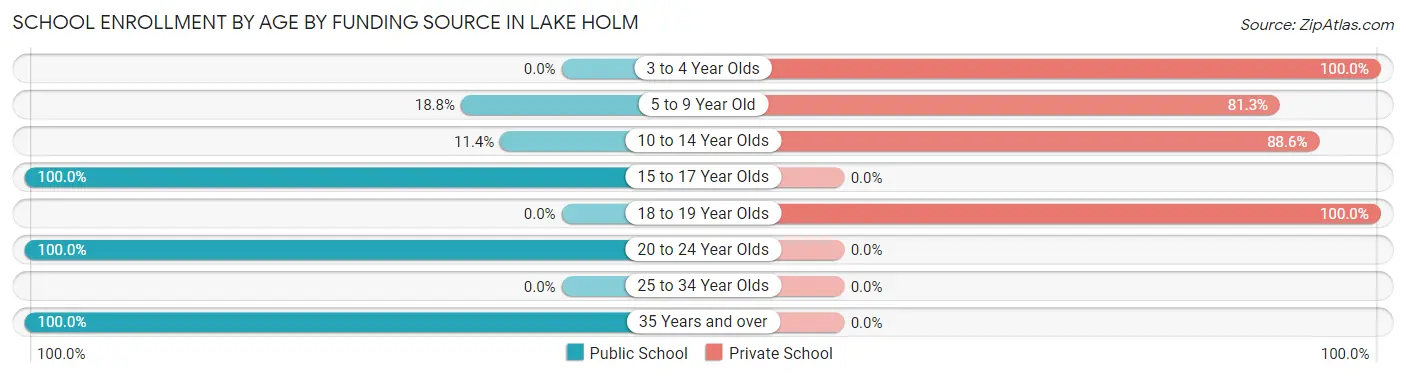
| Age Bracket | Public School | Private School |
| 3 to 4 Year Olds | 0 (0.0%) | 28 (100.0%) |
| 5 to 9 Year Old | 3 (18.8%) | 13 (81.2%) |
| 10 to 14 Year Olds | 12 (11.4%) | 93 (88.6%) |
| 15 to 17 Year Olds | 228 (100.0%) | 0 (0.0%) |
| 18 to 19 Year Olds | 0 (0.0%) | 23 (100.0%) |
| 20 to 24 Year Olds | 79 (100.0%) | 0 (0.0%) |
| 25 to 34 Year Olds | 0 (0.0%) | 0 (0.0%) |
| 35 Years and over | 35 (100.0%) | 0 (0.0%) |
| Total | 357 (69.5%) | 157 (30.5%) |
Educational Attainment by Field of Study in Lake Holm
Engineering (234 | 19.9%), business (232 | 19.7%), social sciences (134 | 11.4%), education (129 | 10.9%), and literature & languages (91 | 7.7%) are the most common fields of study among 1,179 individuals in Lake Holm who have obtained a bachelor's degree or higher.
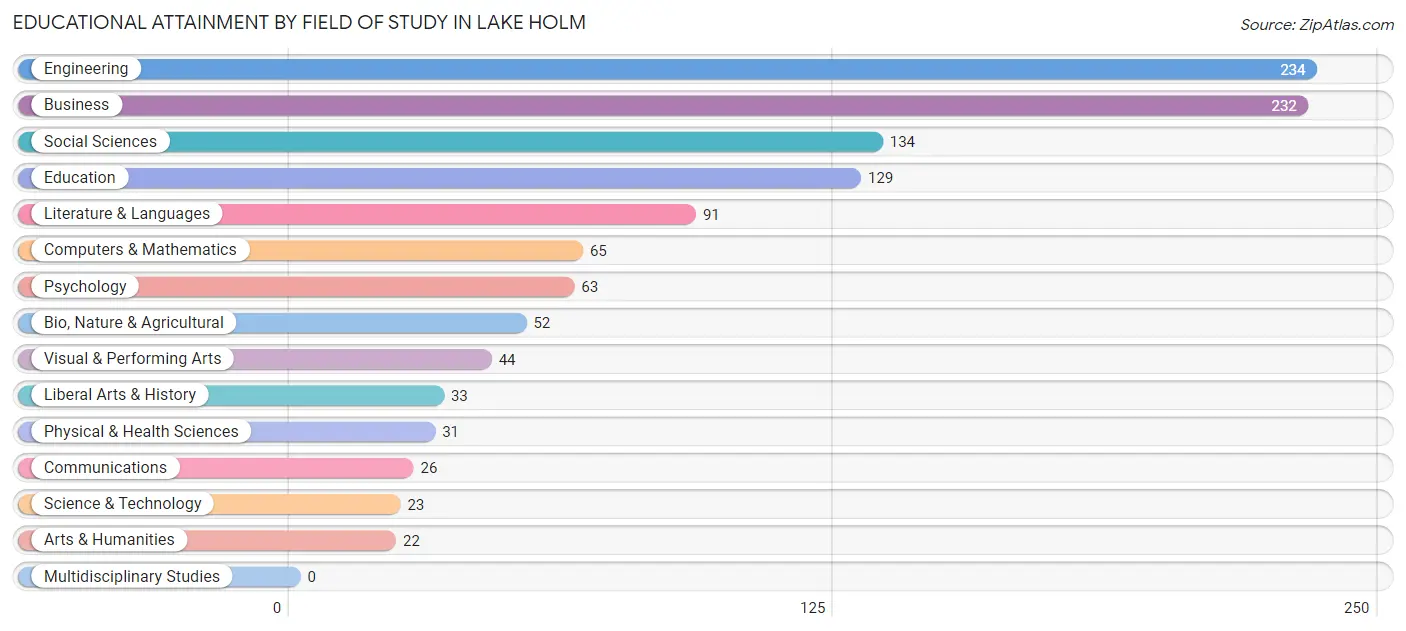
| Field of Study | # Graduates | % Graduates |
| Computers & Mathematics | 65 | 5.5% |
| Bio, Nature & Agricultural | 52 | 4.4% |
| Physical & Health Sciences | 31 | 2.6% |
| Psychology | 63 | 5.3% |
| Social Sciences | 134 | 11.4% |
| Engineering | 234 | 19.9% |
| Multidisciplinary Studies | 0 | 0.0% |
| Science & Technology | 23 | 1.9% |
| Business | 232 | 19.7% |
| Education | 129 | 10.9% |
| Literature & Languages | 91 | 7.7% |
| Liberal Arts & History | 33 | 2.8% |
| Visual & Performing Arts | 44 | 3.7% |
| Communications | 26 | 2.2% |
| Arts & Humanities | 22 | 1.9% |
| Total | 1,179 | 100.0% |
Transportation & Commute in Lake Holm
Vehicle Availability by Sex in Lake Holm
The most prevalent vehicle ownership categories in Lake Holm are males with 3 vehicles (417, accounting for 37.2%) and females with 3 vehicles (358, making up 46.8%).
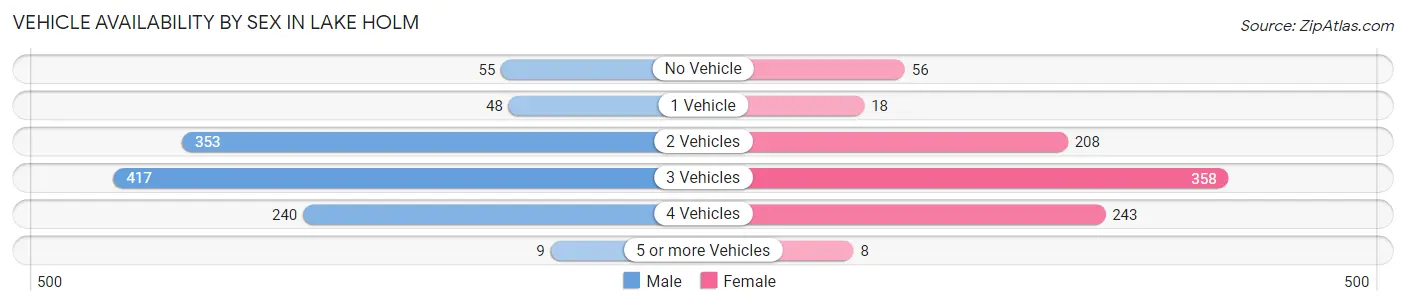
| Vehicles Available | Male | Female |
| No Vehicle | 55 (4.9%) | 56 (6.3%) |
| 1 Vehicle | 48 (4.3%) | 18 (2.0%) |
| 2 Vehicles | 353 (31.5%) | 208 (23.3%) |
| 3 Vehicles | 417 (37.2%) | 358 (40.2%) |
| 4 Vehicles | 240 (21.4%) | 243 (27.3%) |
| 5 or more Vehicles | 9 (0.8%) | 8 (0.9%) |
| Total | 1,122 (100.0%) | 891 (100.0%) |
Commute Time in Lake Holm
The most frequently occuring commute durations in Lake Holm are 20 to 24 minutes (364 commuters, 23.3%), 60 to 89 minutes (270 commuters, 17.3%), and 45 to 59 minutes (224 commuters, 14.3%).
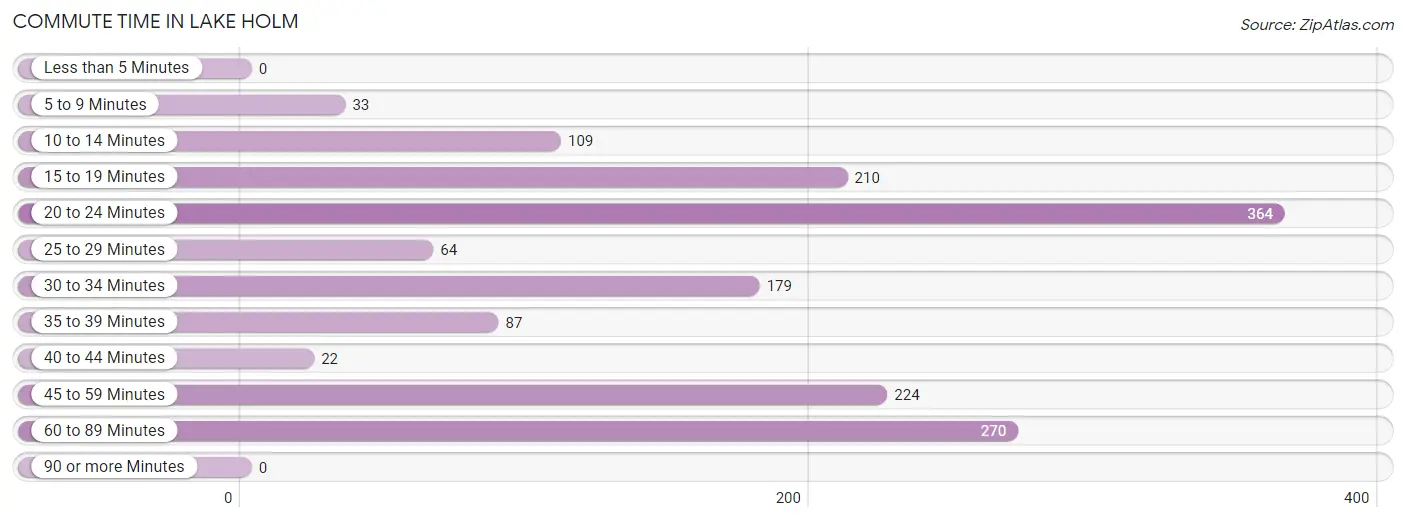
| Commute Time | # Commuters | % Commuters |
| Less than 5 Minutes | 0 | 0.0% |
| 5 to 9 Minutes | 33 | 2.1% |
| 10 to 14 Minutes | 109 | 7.0% |
| 15 to 19 Minutes | 210 | 13.4% |
| 20 to 24 Minutes | 364 | 23.3% |
| 25 to 29 Minutes | 64 | 4.1% |
| 30 to 34 Minutes | 179 | 11.5% |
| 35 to 39 Minutes | 87 | 5.6% |
| 40 to 44 Minutes | 22 | 1.4% |
| 45 to 59 Minutes | 224 | 14.3% |
| 60 to 89 Minutes | 270 | 17.3% |
| 90 or more Minutes | 0 | 0.0% |
Commute Time by Sex in Lake Holm
The most common commute times in Lake Holm are 20 to 24 minutes (244 commuters, 28.2%) for males and 20 to 24 minutes (120 commuters, 17.2%) for females.
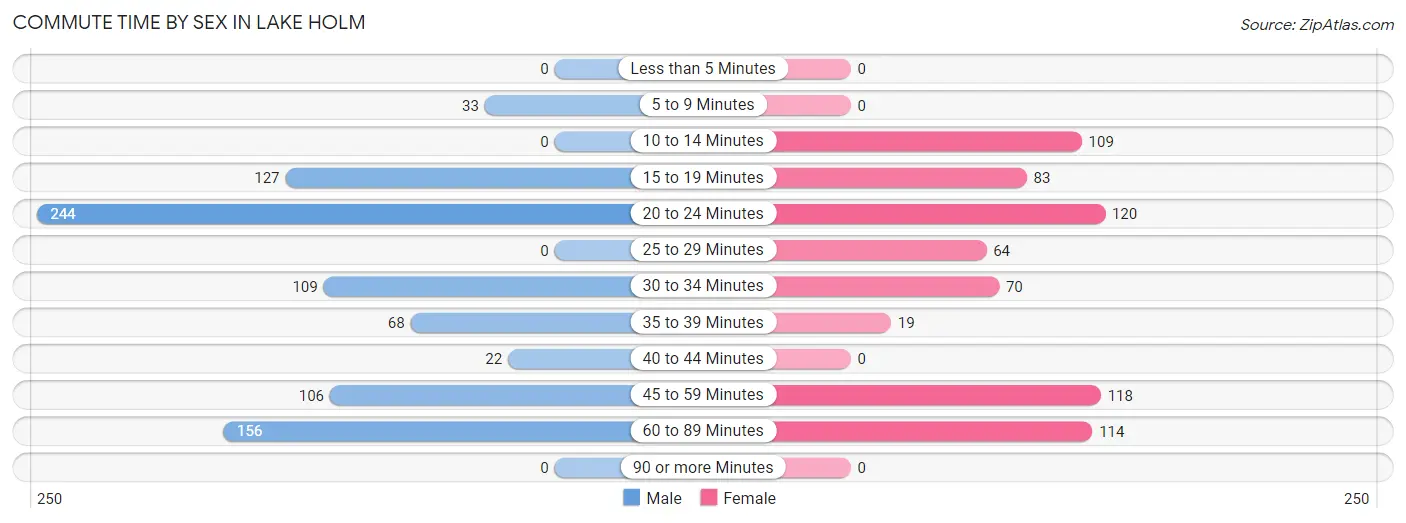
| Commute Time | Male | Female |
| Less than 5 Minutes | 0 (0.0%) | 0 (0.0%) |
| 5 to 9 Minutes | 33 (3.8%) | 0 (0.0%) |
| 10 to 14 Minutes | 0 (0.0%) | 109 (15.6%) |
| 15 to 19 Minutes | 127 (14.7%) | 83 (11.9%) |
| 20 to 24 Minutes | 244 (28.2%) | 120 (17.2%) |
| 25 to 29 Minutes | 0 (0.0%) | 64 (9.2%) |
| 30 to 34 Minutes | 109 (12.6%) | 70 (10.0%) |
| 35 to 39 Minutes | 68 (7.9%) | 19 (2.7%) |
| 40 to 44 Minutes | 22 (2.5%) | 0 (0.0%) |
| 45 to 59 Minutes | 106 (12.2%) | 118 (16.9%) |
| 60 to 89 Minutes | 156 (18.0%) | 114 (16.4%) |
| 90 or more Minutes | 0 (0.0%) | 0 (0.0%) |
Time of Departure to Work by Sex in Lake Holm
The most frequent times of departure to work in Lake Holm are 6:30 AM to 6:59 AM (155, 17.9%) for males and 6:30 AM to 6:59 AM (144, 20.7%) for females.
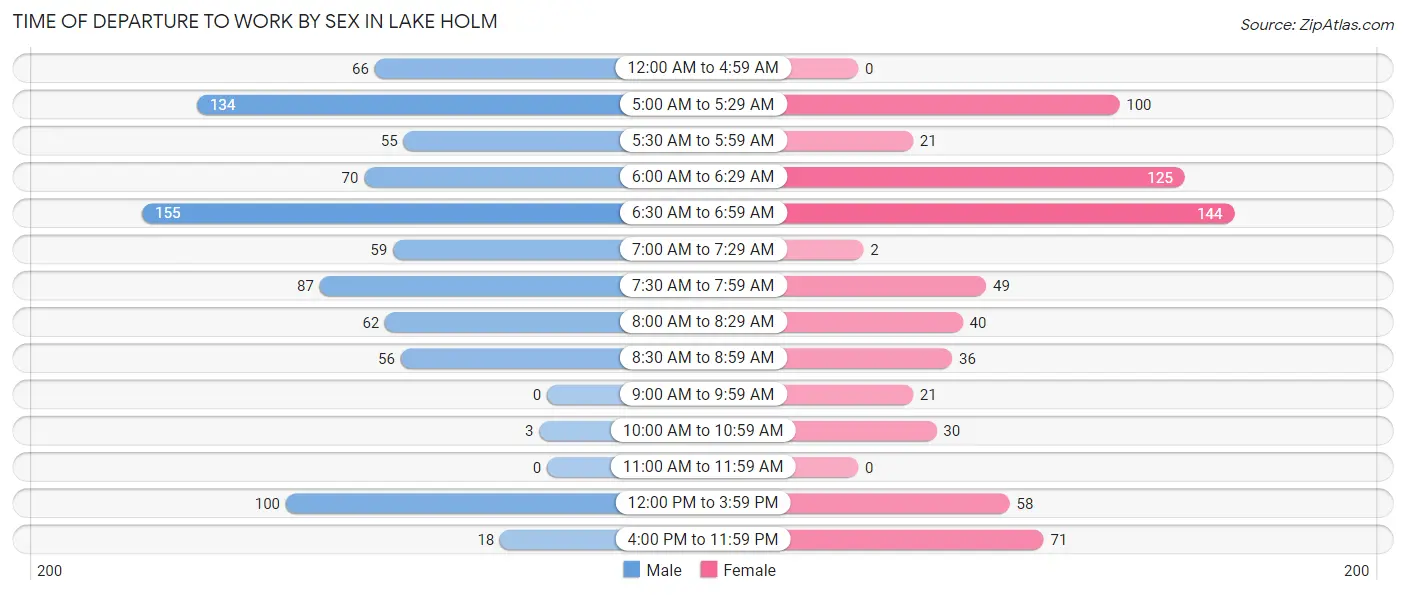
| Time of Departure | Male | Female |
| 12:00 AM to 4:59 AM | 66 (7.6%) | 0 (0.0%) |
| 5:00 AM to 5:29 AM | 134 (15.5%) | 100 (14.3%) |
| 5:30 AM to 5:59 AM | 55 (6.4%) | 21 (3.0%) |
| 6:00 AM to 6:29 AM | 70 (8.1%) | 125 (17.9%) |
| 6:30 AM to 6:59 AM | 155 (17.9%) | 144 (20.7%) |
| 7:00 AM to 7:29 AM | 59 (6.8%) | 2 (0.3%) |
| 7:30 AM to 7:59 AM | 87 (10.1%) | 49 (7.0%) |
| 8:00 AM to 8:29 AM | 62 (7.2%) | 40 (5.7%) |
| 8:30 AM to 8:59 AM | 56 (6.5%) | 36 (5.2%) |
| 9:00 AM to 9:59 AM | 0 (0.0%) | 21 (3.0%) |
| 10:00 AM to 10:59 AM | 3 (0.4%) | 30 (4.3%) |
| 11:00 AM to 11:59 AM | 0 (0.0%) | 0 (0.0%) |
| 12:00 PM to 3:59 PM | 100 (11.6%) | 58 (8.3%) |
| 4:00 PM to 11:59 PM | 18 (2.1%) | 71 (10.2%) |
| Total | 865 (100.0%) | 697 (100.0%) |
Housing Occupancy in Lake Holm
Occupancy by Ownership in Lake Holm
Of the total 1,434 dwellings in Lake Holm, owner-occupied units account for 1,312 (91.5%), while renter-occupied units make up 122 (8.5%).
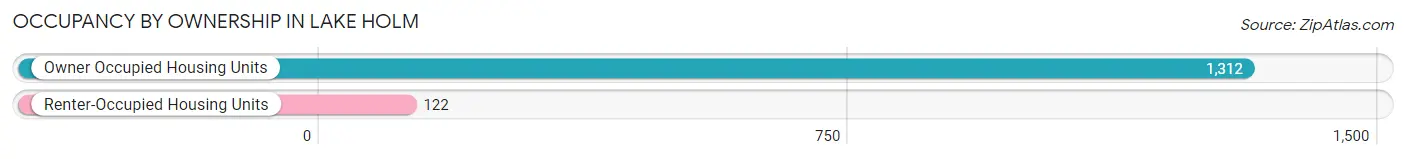
| Occupancy | # Housing Units | % Housing Units |
| Owner Occupied Housing Units | 1,312 | 91.5% |
| Renter-Occupied Housing Units | 122 | 8.5% |
| Total Occupied Housing Units | 1,434 | 100.0% |
Occupancy by Household Size in Lake Holm
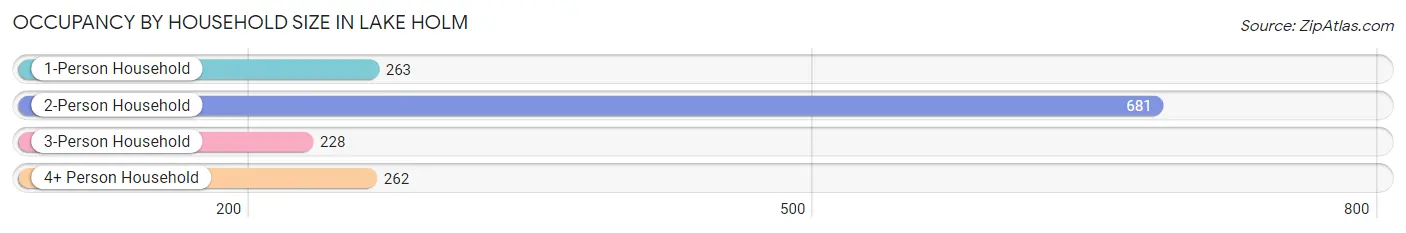
| Household Size | # Housing Units | % Housing Units |
| 1-Person Household | 263 | 18.3% |
| 2-Person Household | 681 | 47.5% |
| 3-Person Household | 228 | 15.9% |
| 4+ Person Household | 262 | 18.3% |
| Total Housing Units | 1,434 | 100.0% |
Occupancy by Ownership by Household Size in Lake Holm
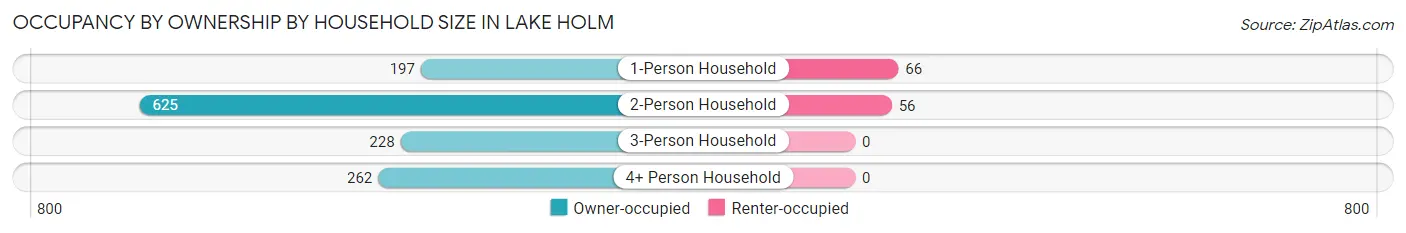
| Household Size | Owner-occupied | Renter-occupied |
| 1-Person Household | 197 (74.9%) | 66 (25.1%) |
| 2-Person Household | 625 (91.8%) | 56 (8.2%) |
| 3-Person Household | 228 (100.0%) | 0 (0.0%) |
| 4+ Person Household | 262 (100.0%) | 0 (0.0%) |
| Total Housing Units | 1,312 (91.5%) | 122 (8.5%) |
Occupancy by Educational Attainment in Lake Holm
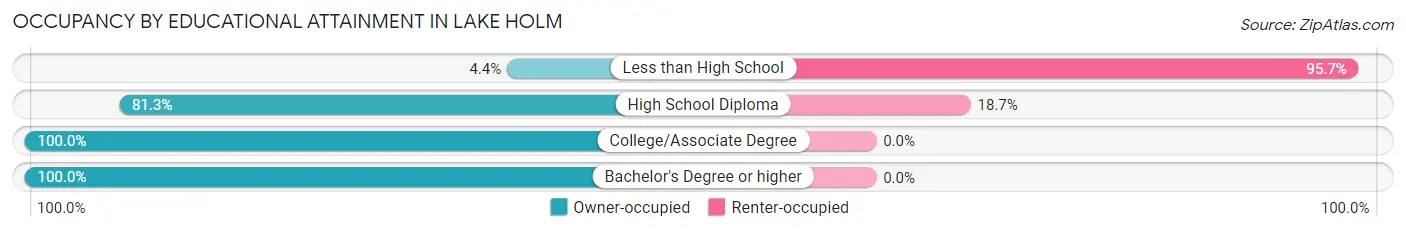
| Household Size | Owner-occupied | Renter-occupied |
| Less than High School | 3 (4.3%) | 66 (95.7%) |
| High School Diploma | 243 (81.3%) | 56 (18.7%) |
| College/Associate Degree | 500 (100.0%) | 0 (0.0%) |
| Bachelor's Degree or higher | 566 (100.0%) | 0 (0.0%) |
Occupancy by Age of Householder in Lake Holm
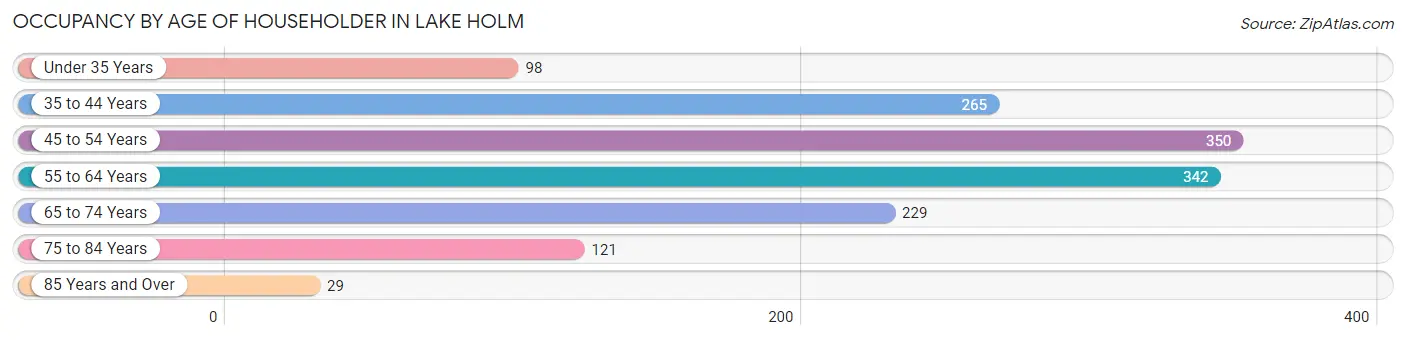
| Age Bracket | # Households | % Households |
| Under 35 Years | 98 | 6.8% |
| 35 to 44 Years | 265 | 18.5% |
| 45 to 54 Years | 350 | 24.4% |
| 55 to 64 Years | 342 | 23.8% |
| 65 to 74 Years | 229 | 16.0% |
| 75 to 84 Years | 121 | 8.4% |
| 85 Years and Over | 29 | 2.0% |
| Total | 1,434 | 100.0% |
Housing Finances in Lake Holm
Median Income by Occupancy in Lake Holm
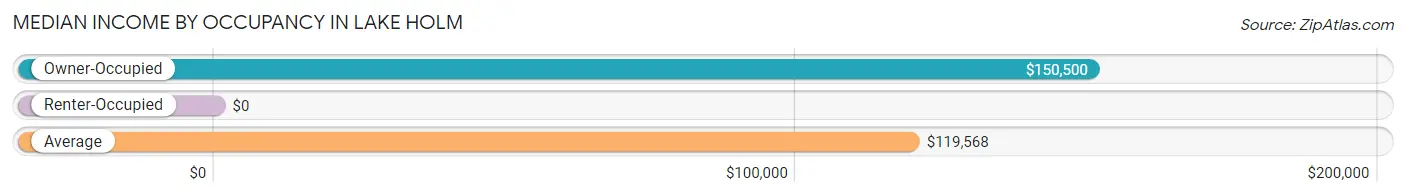
| Occupancy Type | # Households | Median Income |
| Owner-Occupied | 1,312 (91.5%) | $150,500 |
| Renter-Occupied | 122 (8.5%) | $0 |
| Average | 1,434 (100.0%) | $119,568 |
Occupancy by Householder Income Bracket in Lake Holm
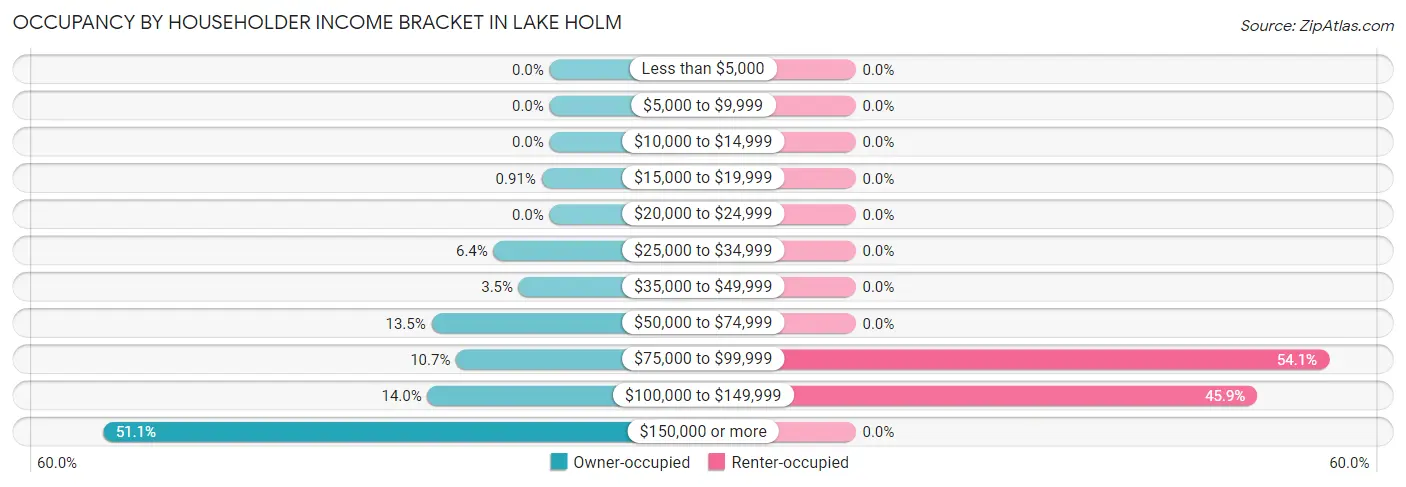
| Income Bracket | Owner-occupied | Renter-occupied |
| Less than $5,000 | 0 (0.0%) | 0 (0.0%) |
| $5,000 to $9,999 | 0 (0.0%) | 0 (0.0%) |
| $10,000 to $14,999 | 0 (0.0%) | 0 (0.0%) |
| $15,000 to $19,999 | 12 (0.9%) | 0 (0.0%) |
| $20,000 to $24,999 | 0 (0.0%) | 0 (0.0%) |
| $25,000 to $34,999 | 84 (6.4%) | 0 (0.0%) |
| $35,000 to $49,999 | 46 (3.5%) | 0 (0.0%) |
| $50,000 to $74,999 | 177 (13.5%) | 0 (0.0%) |
| $75,000 to $99,999 | 140 (10.7%) | 66 (54.1%) |
| $100,000 to $149,999 | 183 (14.0%) | 56 (45.9%) |
| $150,000 or more | 670 (51.1%) | 0 (0.0%) |
| Total | 1,312 (100.0%) | 122 (100.0%) |
Monthly Housing Cost Tiers in Lake Holm
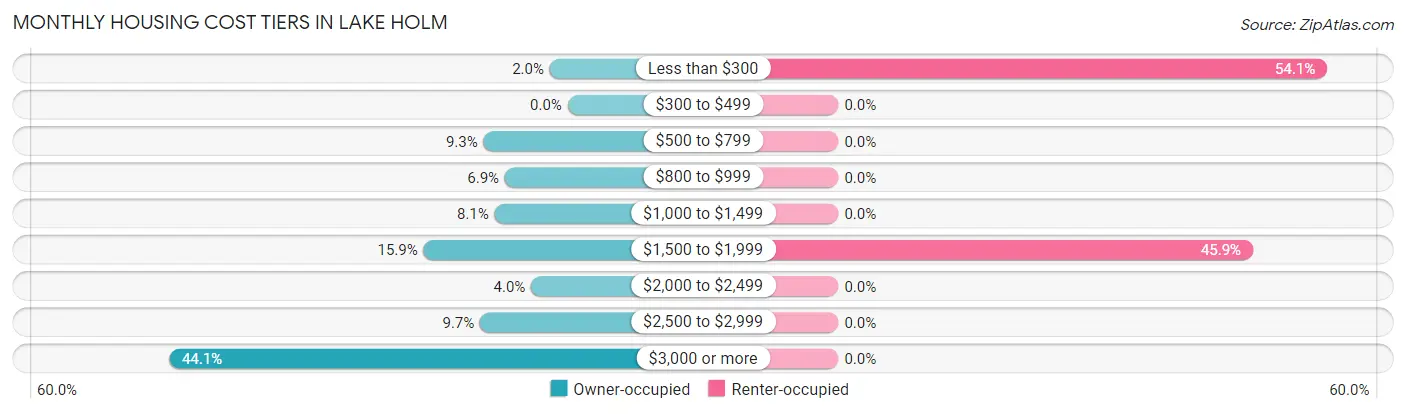
| Monthly Cost | Owner-occupied | Renter-occupied |
| Less than $300 | 26 (2.0%) | 66 (54.1%) |
| $300 to $499 | 0 (0.0%) | 0 (0.0%) |
| $500 to $799 | 122 (9.3%) | 0 (0.0%) |
| $800 to $999 | 91 (6.9%) | 0 (0.0%) |
| $1,000 to $1,499 | 106 (8.1%) | 0 (0.0%) |
| $1,500 to $1,999 | 209 (15.9%) | 56 (45.9%) |
| $2,000 to $2,499 | 53 (4.0%) | 0 (0.0%) |
| $2,500 to $2,999 | 127 (9.7%) | 0 (0.0%) |
| $3,000 or more | 578 (44.1%) | 0 (0.0%) |
| Total | 1,312 (100.0%) | 122 (100.0%) |
Physical Housing Characteristics in Lake Holm
Housing Structures in Lake Holm
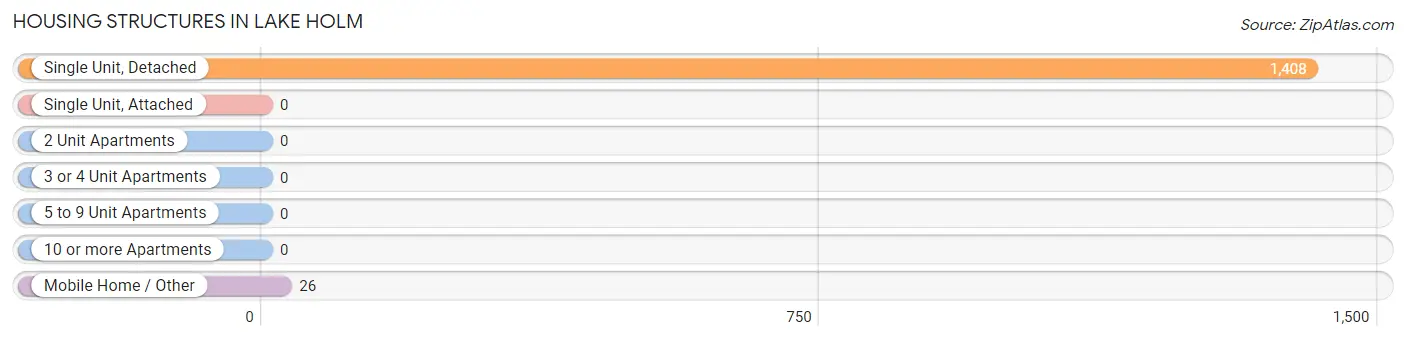
| Structure Type | # Housing Units | % Housing Units |
| Single Unit, Detached | 1,408 | 98.2% |
| Single Unit, Attached | 0 | 0.0% |
| 2 Unit Apartments | 0 | 0.0% |
| 3 or 4 Unit Apartments | 0 | 0.0% |
| 5 to 9 Unit Apartments | 0 | 0.0% |
| 10 or more Apartments | 0 | 0.0% |
| Mobile Home / Other | 26 | 1.8% |
| Total | 1,434 | 100.0% |
Housing Structures by Occupancy in Lake Holm
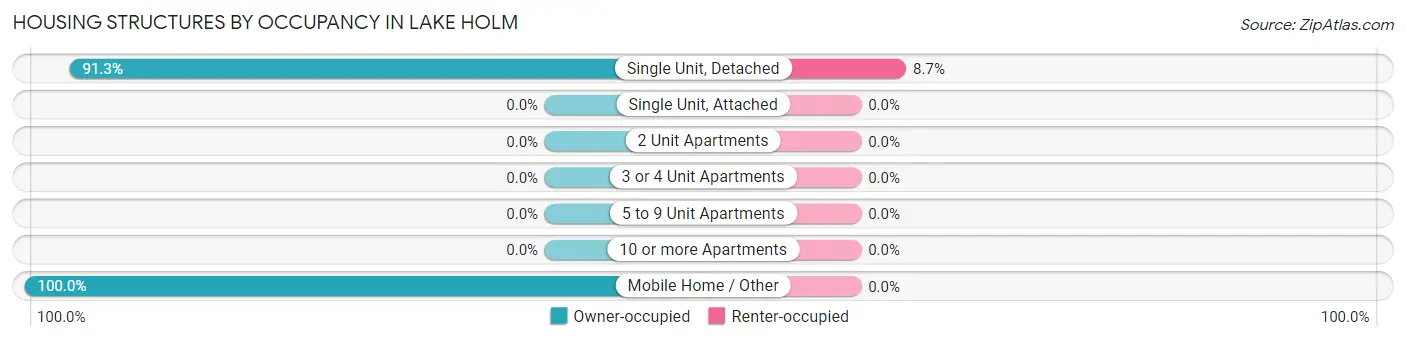
| Structure Type | Owner-occupied | Renter-occupied |
| Single Unit, Detached | 1,286 (91.3%) | 122 (8.7%) |
| Single Unit, Attached | 0 (0.0%) | 0 (0.0%) |
| 2 Unit Apartments | 0 (0.0%) | 0 (0.0%) |
| 3 or 4 Unit Apartments | 0 (0.0%) | 0 (0.0%) |
| 5 to 9 Unit Apartments | 0 (0.0%) | 0 (0.0%) |
| 10 or more Apartments | 0 (0.0%) | 0 (0.0%) |
| Mobile Home / Other | 26 (100.0%) | 0 (0.0%) |
| Total | 1,312 (91.5%) | 122 (8.5%) |
Housing Structures by Number of Rooms in Lake Holm
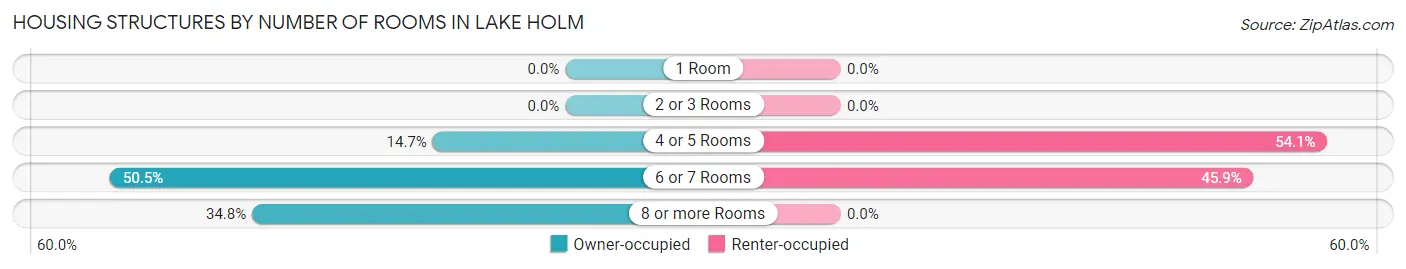
| Number of Rooms | Owner-occupied | Renter-occupied |
| 1 Room | 0 (0.0%) | 0 (0.0%) |
| 2 or 3 Rooms | 0 (0.0%) | 0 (0.0%) |
| 4 or 5 Rooms | 193 (14.7%) | 66 (54.1%) |
| 6 or 7 Rooms | 663 (50.5%) | 56 (45.9%) |
| 8 or more Rooms | 456 (34.8%) | 0 (0.0%) |
| Total | 1,312 (100.0%) | 122 (100.0%) |
Housing Structure by Heating Type in Lake Holm
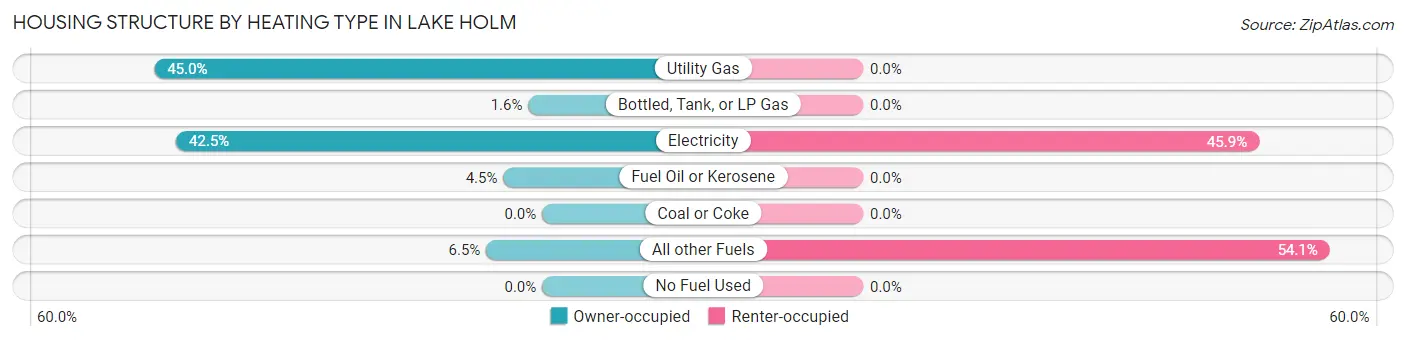
| Heating Type | Owner-occupied | Renter-occupied |
| Utility Gas | 590 (45.0%) | 0 (0.0%) |
| Bottled, Tank, or LP Gas | 21 (1.6%) | 0 (0.0%) |
| Electricity | 557 (42.4%) | 56 (45.9%) |
| Fuel Oil or Kerosene | 59 (4.5%) | 0 (0.0%) |
| Coal or Coke | 0 (0.0%) | 0 (0.0%) |
| All other Fuels | 85 (6.5%) | 66 (54.1%) |
| No Fuel Used | 0 (0.0%) | 0 (0.0%) |
| Total | 1,312 (100.0%) | 122 (100.0%) |
Household Vehicle Usage in Lake Holm
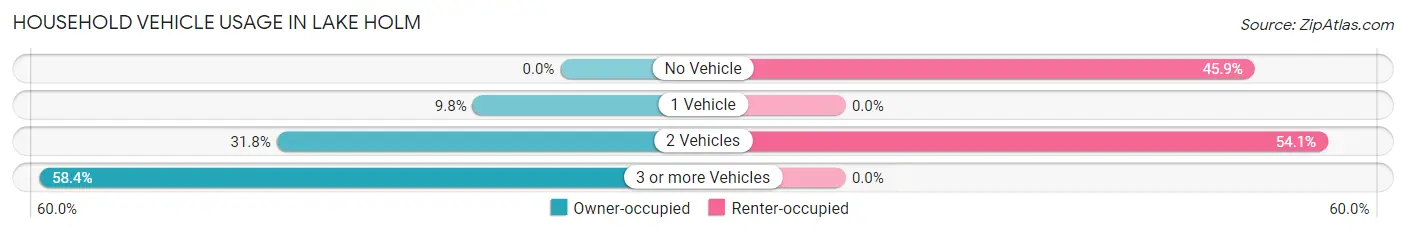
| Vehicles per Household | Owner-occupied | Renter-occupied |
| No Vehicle | 0 (0.0%) | 56 (45.9%) |
| 1 Vehicle | 129 (9.8%) | 0 (0.0%) |
| 2 Vehicles | 417 (31.8%) | 66 (54.1%) |
| 3 or more Vehicles | 766 (58.4%) | 0 (0.0%) |
| Total | 1,312 (100.0%) | 122 (100.0%) |
Real Estate & Mortgages in Lake Holm
Real Estate and Mortgage Overview in Lake Holm
| Characteristic | Without Mortgage | With Mortgage |
| Housing Units | 383 | 929 |
| Median Property Value | $651,700 | $681,300 |
| Median Household Income | $93,850 | $516 |
| Monthly Housing Costs | $932 | $578 |
| Real Estate Taxes | $6,796 | $38 |
Property Value by Mortgage Status in Lake Holm
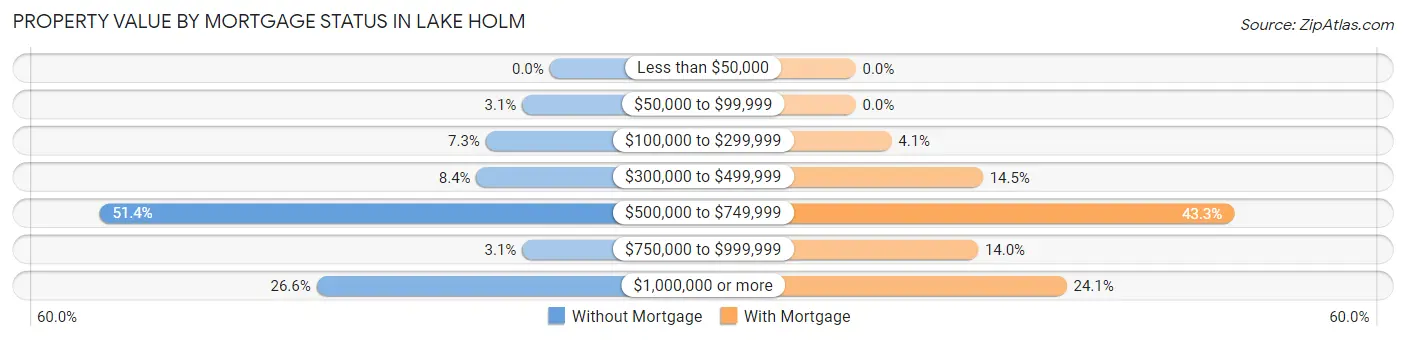
| Property Value | Without Mortgage | With Mortgage |
| Less than $50,000 | 0 (0.0%) | 0 (0.0%) |
| $50,000 to $99,999 | 12 (3.1%) | 0 (0.0%) |
| $100,000 to $299,999 | 28 (7.3%) | 38 (4.1%) |
| $300,000 to $499,999 | 32 (8.4%) | 135 (14.5%) |
| $500,000 to $749,999 | 197 (51.4%) | 402 (43.3%) |
| $750,000 to $999,999 | 12 (3.1%) | 130 (14.0%) |
| $1,000,000 or more | 102 (26.6%) | 224 (24.1%) |
| Total | 383 (100.0%) | 929 (100.0%) |
Household Income by Mortgage Status in Lake Holm
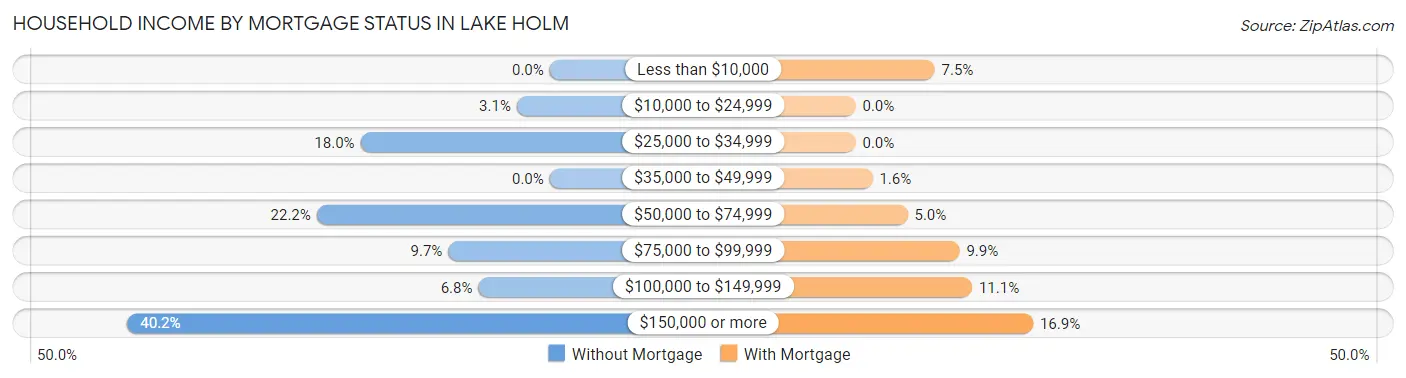
| Household Income | Without Mortgage | With Mortgage |
| Less than $10,000 | 0 (0.0%) | 70 (7.5%) |
| $10,000 to $24,999 | 12 (3.1%) | 0 (0.0%) |
| $25,000 to $34,999 | 69 (18.0%) | 0 (0.0%) |
| $35,000 to $49,999 | 0 (0.0%) | 15 (1.6%) |
| $50,000 to $74,999 | 85 (22.2%) | 46 (5.0%) |
| $75,000 to $99,999 | 37 (9.7%) | 92 (9.9%) |
| $100,000 to $149,999 | 26 (6.8%) | 103 (11.1%) |
| $150,000 or more | 154 (40.2%) | 157 (16.9%) |
| Total | 383 (100.0%) | 929 (100.0%) |
Property Value to Household Income Ratio in Lake Holm
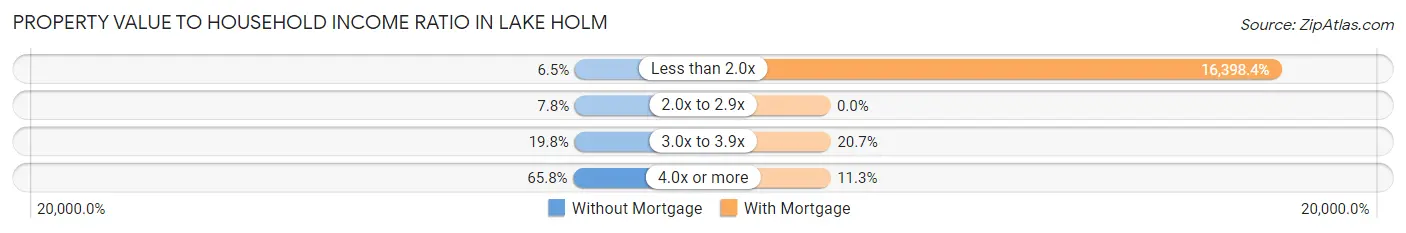
| Value-to-Income Ratio | Without Mortgage | With Mortgage |
| Less than 2.0x | 25 (6.5%) | 152,341 (16,398.4%) |
| 2.0x to 2.9x | 30 (7.8%) | 0 (0.0%) |
| 3.0x to 3.9x | 76 (19.8%) | 192 (20.7%) |
| 4.0x or more | 252 (65.8%) | 105 (11.3%) |
| Total | 383 (100.0%) | 929 (100.0%) |
Real Estate Taxes by Mortgage Status in Lake Holm
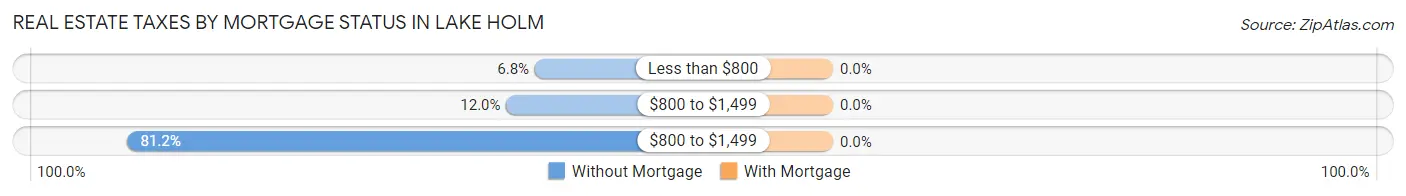
| Property Taxes | Without Mortgage | With Mortgage |
| Less than $800 | 26 (6.8%) | 0 (0.0%) |
| $800 to $1,499 | 46 (12.0%) | 0 (0.0%) |
| $800 to $1,499 | 311 (81.2%) | 0 (0.0%) |
| Total | 383 (100.0%) | 929 (100.0%) |
Health & Disability in Lake Holm
Health Insurance Coverage by Age in Lake Holm
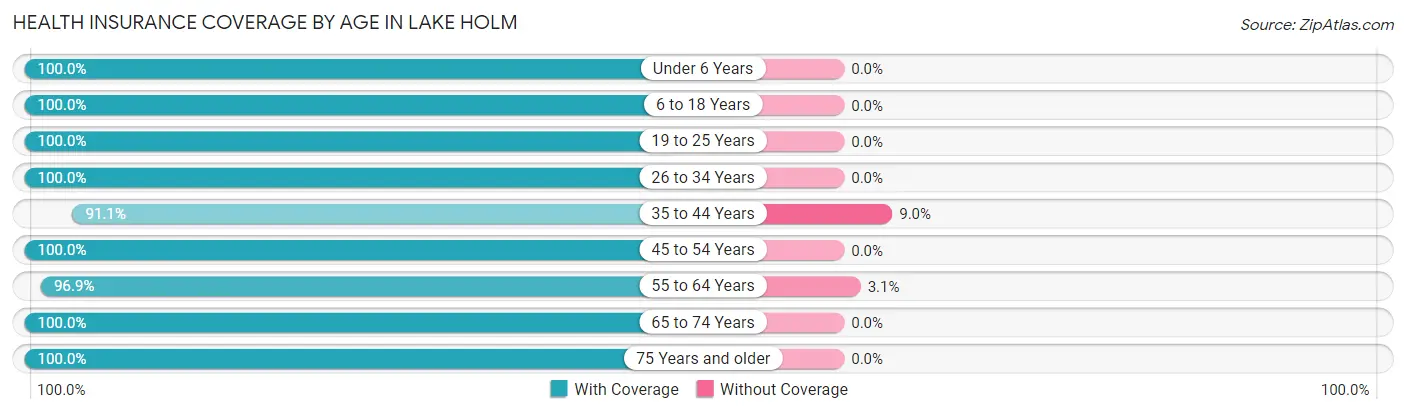
| Age Bracket | With Coverage | Without Coverage |
| Under 6 Years | 161 (100.0%) | 0 (0.0%) |
| 6 to 18 Years | 465 (100.0%) | 0 (0.0%) |
| 19 to 25 Years | 232 (100.0%) | 0 (0.0%) |
| 26 to 34 Years | 209 (100.0%) | 0 (0.0%) |
| 35 to 44 Years | 478 (91.0%) | 47 (8.9%) |
| 45 to 54 Years | 629 (100.0%) | 0 (0.0%) |
| 55 to 64 Years | 634 (96.9%) | 20 (3.1%) |
| 65 to 74 Years | 455 (100.0%) | 0 (0.0%) |
| 75 Years and older | 323 (100.0%) | 0 (0.0%) |
| Total | 3,586 (98.2%) | 67 (1.8%) |
Health Insurance Coverage by Citizenship Status in Lake Holm
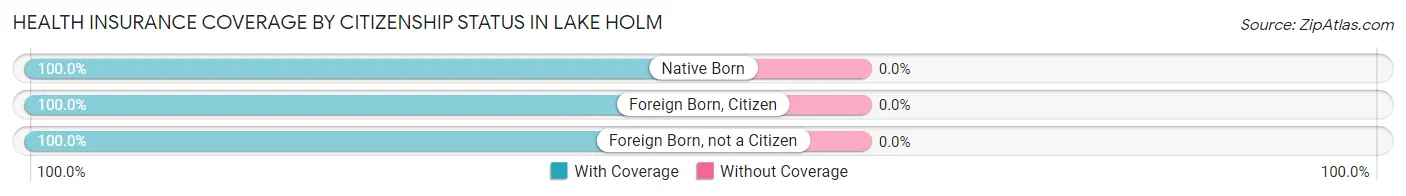
| Citizenship Status | With Coverage | Without Coverage |
| Native Born | 161 (100.0%) | 0 (0.0%) |
| Foreign Born, Citizen | 465 (100.0%) | 0 (0.0%) |
| Foreign Born, not a Citizen | 232 (100.0%) | 0 (0.0%) |
Health Insurance Coverage by Household Income in Lake Holm
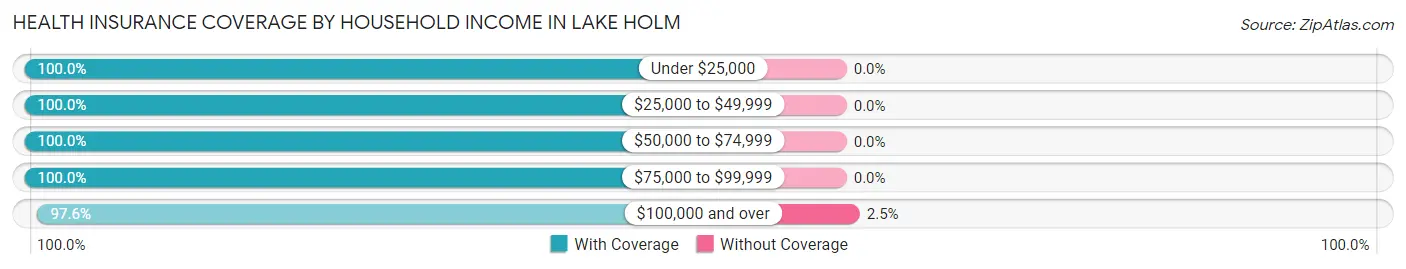
| Household Income | With Coverage | Without Coverage |
| Under $25,000 | 12 (100.0%) | 0 (0.0%) |
| $25,000 to $49,999 | 157 (100.0%) | 0 (0.0%) |
| $50,000 to $74,999 | 376 (100.0%) | 0 (0.0%) |
| $75,000 to $99,999 | 362 (100.0%) | 0 (0.0%) |
| $100,000 and over | 2,671 (97.6%) | 67 (2.5%) |
Public vs Private Health Insurance Coverage by Age in Lake Holm
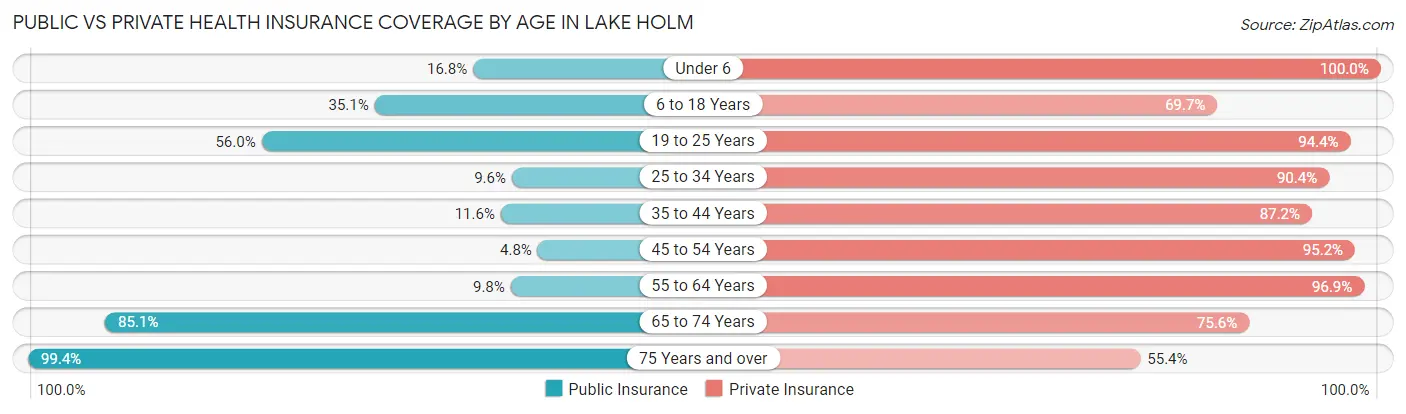
| Age Bracket | Public Insurance | Private Insurance |
| Under 6 | 27 (16.8%) | 161 (100.0%) |
| 6 to 18 Years | 163 (35.0%) | 324 (69.7%) |
| 19 to 25 Years | 130 (56.0%) | 219 (94.4%) |
| 25 to 34 Years | 20 (9.6%) | 189 (90.4%) |
| 35 to 44 Years | 61 (11.6%) | 458 (87.2%) |
| 45 to 54 Years | 30 (4.8%) | 599 (95.2%) |
| 55 to 64 Years | 64 (9.8%) | 634 (96.9%) |
| 65 to 74 Years | 387 (85.1%) | 344 (75.6%) |
| 75 Years and over | 321 (99.4%) | 179 (55.4%) |
| Total | 1,203 (32.9%) | 3,107 (85.1%) |
Disability Status by Sex by Age in Lake Holm
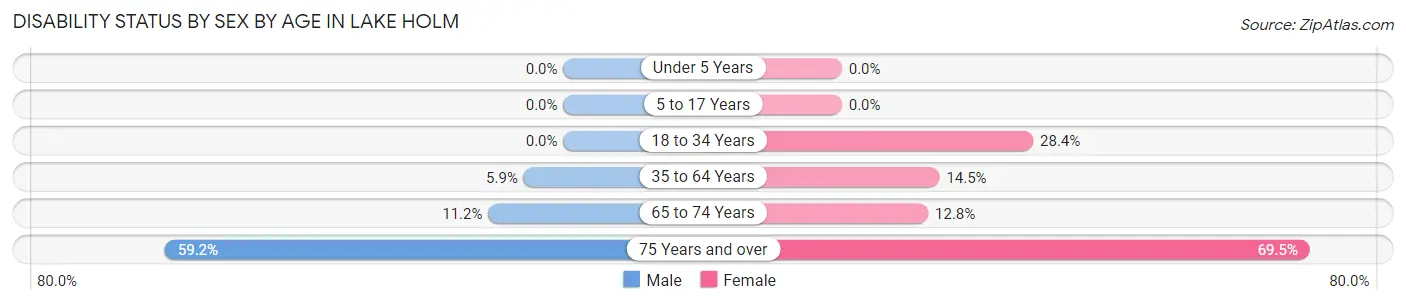
| Age Bracket | Male | Female |
| Under 5 Years | 0 (0.0%) | 0 (0.0%) |
| 5 to 17 Years | 0 (0.0%) | 0 (0.0%) |
| 18 to 34 Years | 0 (0.0%) | 77 (28.4%) |
| 35 to 64 Years | 56 (5.9%) | 124 (14.5%) |
| 65 to 74 Years | 29 (11.2%) | 25 (12.8%) |
| 75 Years and over | 100 (59.2%) | 107 (69.5%) |
Disability Class by Sex by Age in Lake Holm
Disability Class: Hearing Difficulty
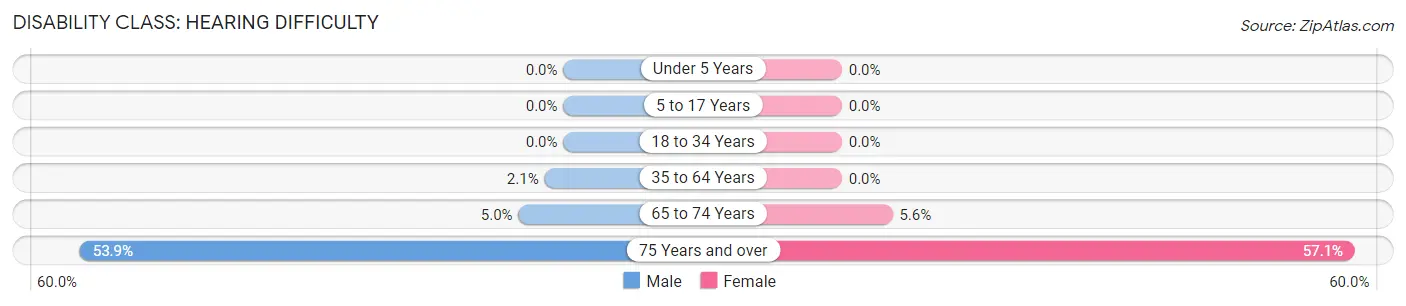
| Age Bracket | Male | Female |
| Under 5 Years | 0 (0.0%) | 0 (0.0%) |
| 5 to 17 Years | 0 (0.0%) | 0 (0.0%) |
| 18 to 34 Years | 0 (0.0%) | 0 (0.0%) |
| 35 to 64 Years | 20 (2.1%) | 0 (0.0%) |
| 65 to 74 Years | 13 (5.0%) | 11 (5.6%) |
| 75 Years and over | 91 (53.8%) | 88 (57.1%) |
Disability Class: Vision Difficulty
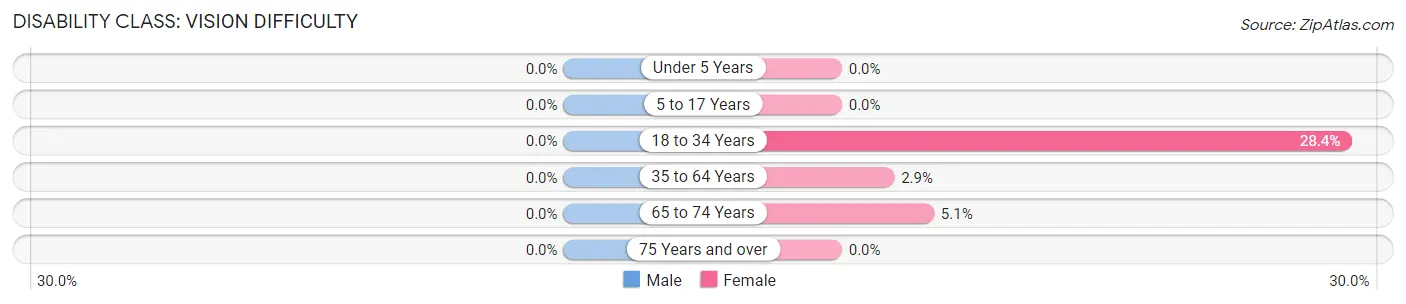
| Age Bracket | Male | Female |
| Under 5 Years | 0 (0.0%) | 0 (0.0%) |
| 5 to 17 Years | 0 (0.0%) | 0 (0.0%) |
| 18 to 34 Years | 0 (0.0%) | 77 (28.4%) |
| 35 to 64 Years | 0 (0.0%) | 25 (2.9%) |
| 65 to 74 Years | 0 (0.0%) | 10 (5.1%) |
| 75 Years and over | 0 (0.0%) | 0 (0.0%) |
Disability Class: Cognitive Difficulty
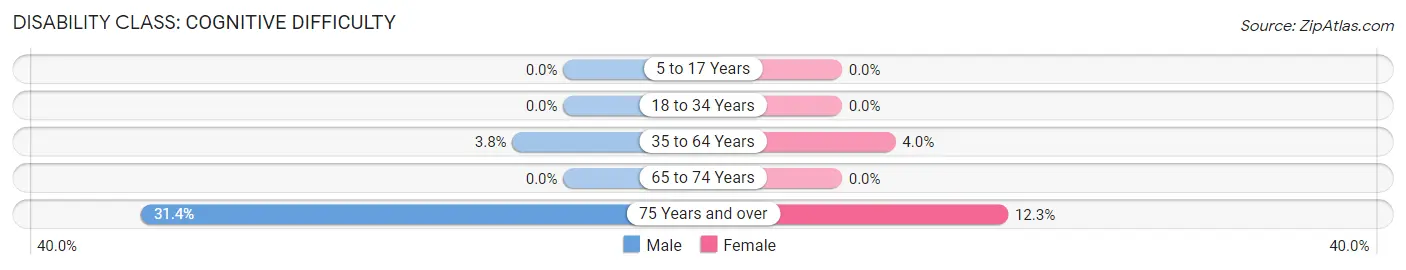
| Age Bracket | Male | Female |
| 5 to 17 Years | 0 (0.0%) | 0 (0.0%) |
| 18 to 34 Years | 0 (0.0%) | 0 (0.0%) |
| 35 to 64 Years | 36 (3.8%) | 34 (4.0%) |
| 65 to 74 Years | 0 (0.0%) | 0 (0.0%) |
| 75 Years and over | 53 (31.4%) | 19 (12.3%) |
Disability Class: Ambulatory Difficulty
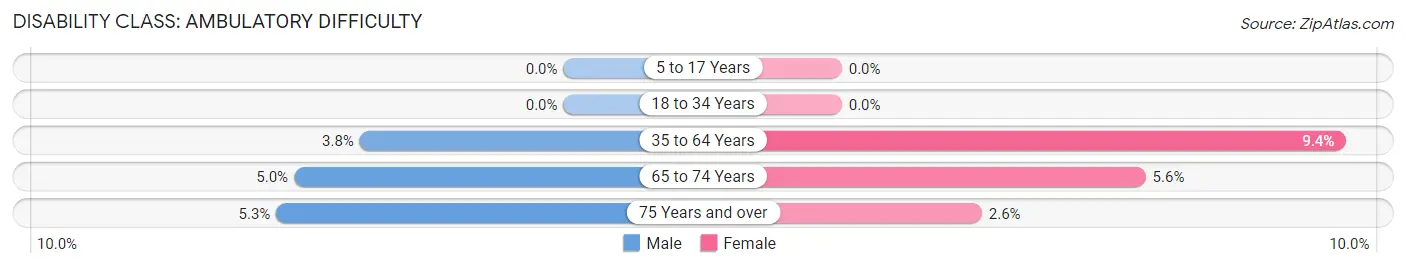
| Age Bracket | Male | Female |
| 5 to 17 Years | 0 (0.0%) | 0 (0.0%) |
| 18 to 34 Years | 0 (0.0%) | 0 (0.0%) |
| 35 to 64 Years | 36 (3.8%) | 80 (9.4%) |
| 65 to 74 Years | 13 (5.0%) | 11 (5.6%) |
| 75 Years and over | 9 (5.3%) | 4 (2.6%) |
Disability Class: Self-Care Difficulty
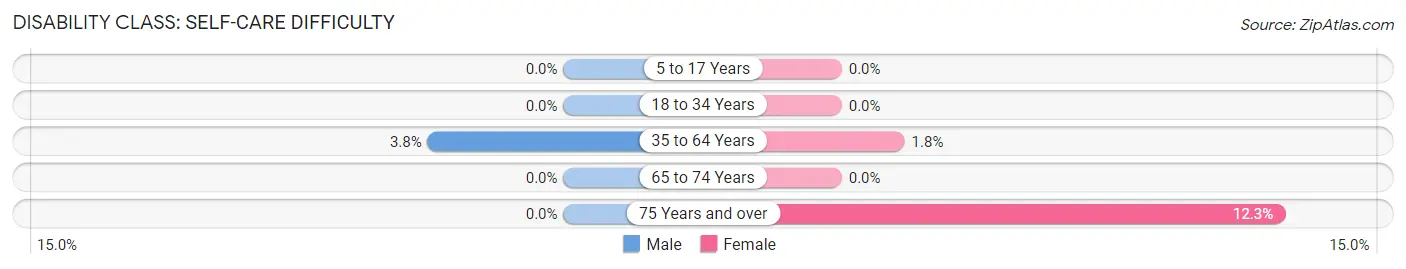
| Age Bracket | Male | Female |
| 5 to 17 Years | 0 (0.0%) | 0 (0.0%) |
| 18 to 34 Years | 0 (0.0%) | 0 (0.0%) |
| 35 to 64 Years | 36 (3.8%) | 15 (1.8%) |
| 65 to 74 Years | 0 (0.0%) | 0 (0.0%) |
| 75 Years and over | 0 (0.0%) | 19 (12.3%) |
Technology Access in Lake Holm
Computing Device Access in Lake Holm
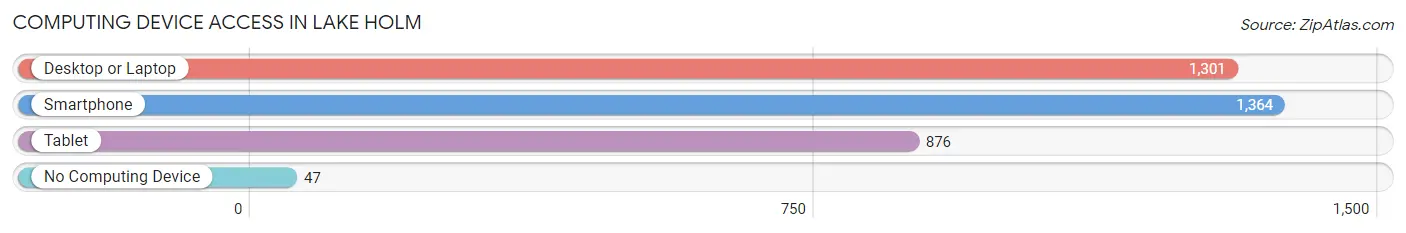
| Device Type | # Households | % Households |
| Desktop or Laptop | 1,301 | 90.7% |
| Smartphone | 1,364 | 95.1% |
| Tablet | 876 | 61.1% |
| No Computing Device | 47 | 3.3% |
| Total | 1,434 | 100.0% |
Internet Access in Lake Holm
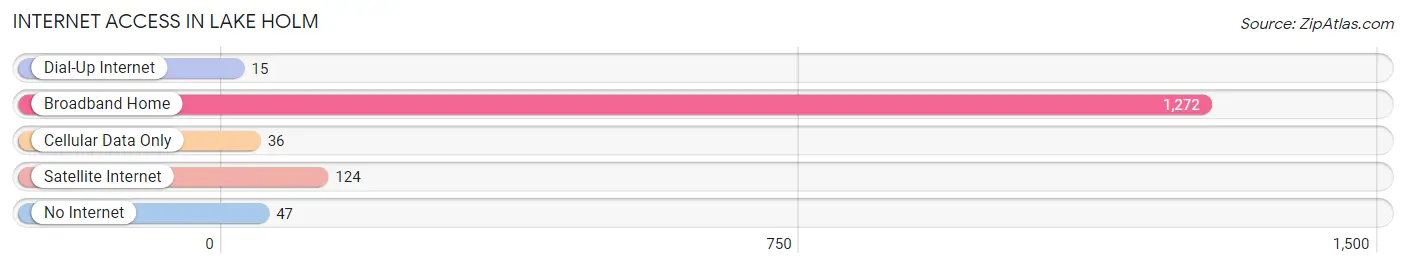
| Internet Type | # Households | % Households |
| Dial-Up Internet | 15 | 1.1% |
| Broadband Home | 1,272 | 88.7% |
| Cellular Data Only | 36 | 2.5% |
| Satellite Internet | 124 | 8.6% |
| No Internet | 47 | 3.3% |
| Total | 1,434 | 100.0% |
Lake Holm Summary
History
Lake Holm is a small unincorporated community located in King County, Washington. It is situated on the south shore of Lake Holm, a small lake located in the Green River Valley. The area was first settled in the late 1800s by homesteaders who were attracted to the area by its fertile soil and abundant wildlife. The first post office was established in 1891 and the community was officially incorporated in 1909.
The area was originally known as Holm’s Landing, named after the first postmaster, John Holm. The name was changed to Lake Holm in the early 1900s when the lake was created by damming the Green River. The lake was created to provide irrigation for the surrounding farms and to provide a recreational area for the local residents.
The area was primarily agricultural until the 1950s when the population began to grow due to the influx of people from Seattle and other nearby cities. The population continued to grow throughout the 1960s and 1970s as more people moved to the area to take advantage of the rural lifestyle and the proximity to Seattle.
Geography
Lake Holm is located in King County, Washington, approximately 25 miles south of Seattle. It is situated on the south shore of Lake Holm, a small lake located in the Green River Valley. The lake is fed by the Green River and is surrounded by rolling hills and farmland. The area is known for its lush green landscape and abundant wildlife.
The climate in Lake Holm is mild and temperate. Summers are warm and dry, while winters are cool and wet. The average annual temperature is around 50 degrees Fahrenheit. The area receives an average of 35 inches of precipitation per year, most of which falls in the winter months.
Economy
The economy of Lake Holm is primarily based on agriculture and tourism. The area is known for its fertile soil and abundant wildlife, which makes it an ideal location for farming. The area is also home to several wineries and breweries, as well as a number of small businesses.
Tourism is also an important part of the local economy. The area is known for its rural charm and proximity to Seattle, which makes it a popular destination for outdoor enthusiasts. The area is also home to several parks and recreational areas, including Lake Holm Park, which offers swimming, fishing, and boating.
Demographics
As of the 2010 census, the population of Lake Holm was 1,845. The population is primarily white (90.2%), with a small percentage of African American (2.2%), Asian (2.1%), and Hispanic (2.1%) residents. The median household income is $63,917, and the median age is 44.
The area is served by the Tahoma School District, which includes three elementary schools, one middle school, and one high school. The area is also home to several churches, including the Lake Holm United Methodist Church and the Lake Holm Community Church.
Conclusion
Lake Holm is a small unincorporated community located in King County, Washington. It is situated on the south shore of Lake Holm, a small lake located in the Green River Valley. The area was first settled in the late 1800s by homesteaders and was officially incorporated in 1909. The economy of Lake Holm is primarily based on agriculture and tourism, and the population is primarily white. The area is served by the Tahoma School District and is home to several churches. Lake Holm is known for its rural charm and proximity to Seattle, which makes it a popular destination for outdoor enthusiasts.
Common Questions
What is Per Capita Income in Lake Holm?
Per Capita income in Lake Holm is $61,341.
What is the Median Family Income in Lake Holm?
Median Family Income in Lake Holm is $165,543.
What is the Median Household income in Lake Holm?
Median Household Income in Lake Holm is $119,568.
What is Income or Wage Gap in Lake Holm?
Income or Wage Gap in Lake Holm is 43.8%.
Women in Lake Holm earn 56.2 cents for every dollar earned by a man.
What is Inequality or Gini Index in Lake Holm?
Inequality or Gini Index in Lake Holm is 0.35.
What is the Total Population of Lake Holm?
Total Population of Lake Holm is 3,653.
What is the Total Male Population of Lake Holm?
Total Male Population of Lake Holm is 1,881.
What is the Total Female Population of Lake Holm?
Total Female Population of Lake Holm is 1,772.
What is the Ratio of Males per 100 Females in Lake Holm?
There are 106.15 Males per 100 Females in Lake Holm.
What is the Ratio of Females per 100 Males in Lake Holm?
There are 94.21 Females per 100 Males in Lake Holm.
What is the Median Population Age in Lake Holm?
Median Population Age in Lake Holm is 49.7 Years.
What is the Average Family Size in Lake Holm
Average Family Size in Lake Holm is 3.0 People.
What is the Average Household Size in Lake Holm
Average Household Size in Lake Holm is 2.5 People.
How Large is the Labor Force in Lake Holm?
There are 2,151 People in the Labor Forcein in Lake Holm.
What is the Percentage of People in the Labor Force in Lake Holm?
65.3% of People are in the Labor Force in Lake Holm.
What is the Unemployment Rate in Lake Holm?
Unemployment Rate in Lake Holm is 0.9%.