Zip Codes with the Highest Percentage of Population Employed in Architecture & Engineering in Bremerton, WA
RELATED REPORTS & OPTIONS
Architecture & Engineering
Bremerton
Compare Zip Codes
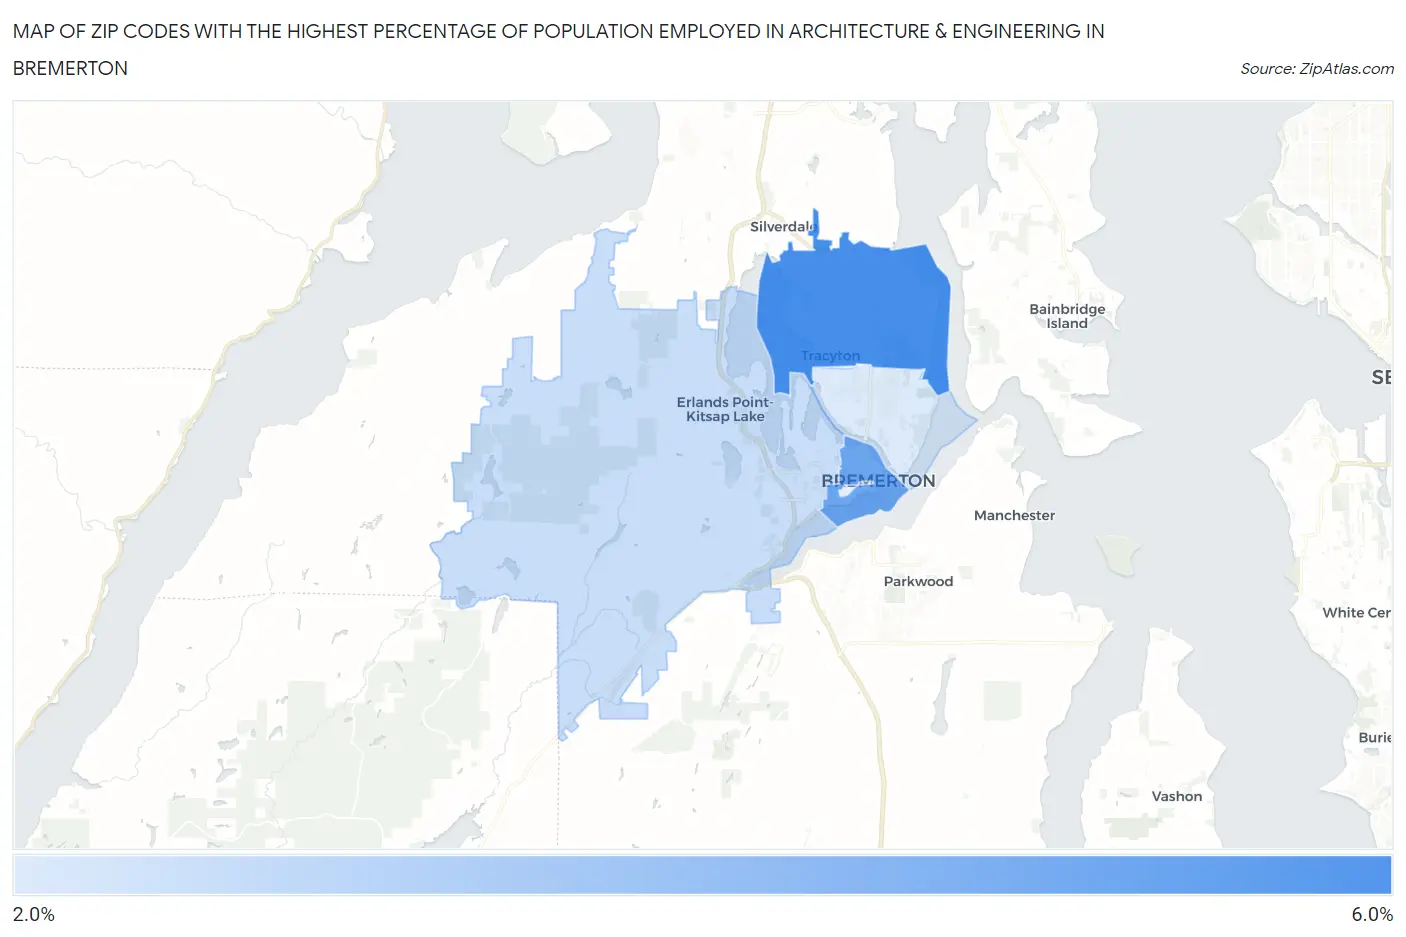
Map of Zip Codes with the Highest Percentage of Population Employed in Architecture & Engineering in Bremerton
2.9%
5.5%
Zip Codes with the Highest Percentage of Population Employed in Architecture & Engineering in Bremerton, WA
| Zip Code | % Employed | vs State | vs National | |
| 1. | 98311 | 5.5% | 2.8%(+2.69)#31 | 2.1%(+3.34)#1,334 |
| 2. | 98337 | 4.9% | 2.8%(+2.07)#46 | 2.1%(+2.71)#1,779 |
| 3. | 98312 | 3.3% | 2.8%(+0.494)#124 | 2.1%(+1.14)#4,243 |
| 4. | 98310 | 2.9% | 2.8%(+0.129)#151 | 2.1%(+0.770)#5,357 |
1
Common Questions
What are the Top 3 Zip Codes with the Highest Percentage of Population Employed in Architecture & Engineering in Bremerton, WA?
Top 3 Zip Codes with the Highest Percentage of Population Employed in Architecture & Engineering in Bremerton, WA are:
What zip code has the Highest Percentage of Population Employed in Architecture & Engineering in Bremerton, WA?
98311 has the Highest Percentage of Population Employed in Architecture & Engineering in Bremerton, WA with 5.5%.
What is the Percentage of Population Employed in Architecture & Engineering in Bremerton, WA?
Percentage of Population Employed in Architecture & Engineering in Bremerton is 3.2%.
What is the Percentage of Population Employed in Architecture & Engineering in Washington?
Percentage of Population Employed in Architecture & Engineering in Washington is 2.8%.
What is the Percentage of Population Employed in Architecture & Engineering in the United States?
Percentage of Population Employed in Architecture & Engineering in the United States is 2.1%.